![]()
![]()
![]()
Now that the working arrangements are clear and the landing site users have given the green light to go ahead, you can start on the next stage of your planning process: collecting information using participatory tools based on PRA. Landing site users generally enjoy these exercises, as they get a new perspective on their workplace.
This is the first of three units that deal with data collection. It concentrates on identifying the stakeholders at the landing site, and understanding how they are organized and how the area is laid out.
Exercises
You will learn how to do the following:
take a census of the landing site using a participatory approach;
create institutional diagrams (sometimes referred to as Venn diagrams); and
draft a variety of maps.
|
Key terms An institutional diagram is a practical tool that helps you to identify the organizations, leaders and other individuals or groups that influence the landing site. It also clarifies the interests of these individuals or groups and the possibilities for collaboration. This information will be extremely useful in the design and implementation of a landing site development plan. A stakeholder refers to a person, a group of people, or an organization that has the ability to directly or indirectly affect the success of a project and that has an interest in the project’s outcome. Stakeholders include landing site users as well as members of government or other agencies. A participatory landing site census is a tool that helps you to count the number of people using a landing site, the distribution of landing site users among user groups and the number and type of fishing and processing units. It uses a participatory approach involving landing site users and representatives. Participatory mapping is a way to guide landing site users to draw maps reflecting available resources, land use planning and social structure. The aim is to encourage landing site users to think systematically about their problems and possible solutions, and to help external facilitators to understand those problems and to analyse options for addressing them. |
A participatory landing site census gives you an idea of the number of people using the landing site, the distribution of landing site users among user groups and the number of fishing and fish processing units. These data will be important for the next units because it will give you an idea of the scale of the various problems and thus help you to propose appropriate solutions.
Who should participate
This exercise requires you to collect information away from the landing site. With the help of the working group, you will be gathering information where landing site users live: in villages, neighbourhoods or other residential areas. Ask the working group to fix appointments with the head of the village, or in the case of a large town, the head of the neighbourhood. That person should be familiar with all the families in the area and their occupations.
Steps to take
1. Agree on a time and place for your appointments.
2. For each appointment ask your contact person the following questions:
How many households are there in your area?
What is their nationality or area of origin?
How many active fishers are there per category (equipment owners, gear owners, crew members)?
How many non-active fishers are there per category (boat owners, net menders)?
How many people own fishing units? What type are they? Are they motorized?
How many women are active in fishing or fishing-related activities (processing, selling)?
How many service providers are there? What service do they offer (carpenters, mechanics, credits, sale of gear and equipment, etc.)?
Reminder: Some people may consider themselves as belonging to more than one category, e.g. selling and processing fish, as well as giving loans for fishing; be careful not to double-count.
3. An easy way to note the information is to use tables similar to the ones presented in the example below (Tables 1 and 2). Modify these tables to suit your needs. Finish with one area before continuing the exercise with another. At the end, you can summarize the data from different areas in one comprehensive table.
Note
Use the principle of triangulation to analyse the outcome of your census. Compare the data you have collected with other sources, such as statistics collected by the fisheries department, the health clinic or city council.
You may find differences between your sources. This may have several explanations. You may have conducted your survey in the fishing season while official sources did theirs in the non-fishing season when there were fewer fishers and boats. It is up to you and the working group to evaluate the results and find explanations for the variations. This process is likely to give you more insight into the landing site and its activities.
TABLE 1
Format used in participatory census of fishers,
Benin
|
Category |
Units per nationality |
Active fishers |
Non-active fishers |
Fishing units per gear type | |||||||||||
| Benin | Ghana | Togo | gear owners | crew members | boat owners | menders | purse seine | hook and line | gillnet | other | |||||
| with engine | without engine | with engine | without engine | with engine | without engine | with engine | without engine | ||||||||
|
Number |
|
|
|
|
|
|
|
| ... |
|
|
|
| || |
|
| 32 | 20 | 13 | 30 | 173 | 16 | 13 | 17 | 0 | 5 | 7 | 11 | 6 | 2 | 7 | |
|
Total | 65 | 203 | 29 | 17 | 12 | 17 | 9 | ||||||||
Source: Gbaguidi & Verstralen 1998
TABLE 2
Format used in participatory census of fish
mongers, Benin
|
Self-employed |
Assistants |
||||||
|
Fresh fish |
Smoked fish |
Dried fish |
Total |
Fresh fish |
Smoked fish |
Dried fish |
Total |
|
|
|
|
118 |
|
|
|
108 |
|
42 |
23 |
53 |
|
22 |
38 |
48 |
|
Source: Gbaguidi & Verstralen 1998
Creating institutional diagrams help you identify the different stakeholders at a landing site. It also helps you understand their tasks and responsibilities, the importance of those roles and the relations they have among each other. This exercise encourages landing site users to assess the role of different stakeholders, including themselves, in landing site development.
Used in combination with the landing site census, an institutional diagram will give you insight into which landing site user groups are well-organized and represented, who are the leaders in the community, and so on. This will be vital when you make your landing site development plan in Units 5-7, because it will give you an idea of which groups or leaders are most suited to working with certain landing site users.
Who should participate
It is useful to include a broad range of landing site users in order to capture as many views as possible. You may want to divide them into small groups (five to eight people) so that everyone has a chance to contribute. Smaller groups also make it easier for you and the working group to manage the discussion. At the end of the exercise, the groups can present their findings to each other.
Steps to take
1. You can either divide landing site users into groups based on occupation, gender or age, or you can opt for mixed groups. Discuss with your working group which arrangement would generate the most information. For example, if you think women and/or young people would not actively participate in the company of elder men, separate them.
2. Explain to each of the groups the concept of an institutional diagram, how to prepare one and its purpose. Make sure someone from each group takes notes. Each group also needs to have its own facilitator, preferably someone from the working group.
3. Ask participants to identify and list all categories of stakeholders, including landing site users and members of local organizations, private sector service suppliers, government agencies and NGOs. Try to estimate the number of people involved. Write the categories in large letters on cards (or ask the landing site users to do so).
4. Clarify the roles and activities of the stakeholders and the resource base available to each one. Be aware that disagreement about who is a stakeholder may arise. This often reflects the use of different criteria. A fish processor located away from the landing site may not be considered a stakeholder, even though some fishers may depend on that person. You will probably need to include some users operating beyond the geographical border of the landing site.
5. Ask participants to discuss the role and importance of different categories of stakeholders in landing site development. Have the landing site users explain what "important" and "development" mean to them and ask them about their criteria. You are trying to determine which stakeholders have made a difference, or brought about change. As a variation on this exercise, you may also ask who has power or influence on the landing site. Have the landing site users discuss what "power" and "influence" mean to them, and what it is about these individuals that makes them so influential.
6. In order to visualize the results of the previous point, place paper circles of different sizes on a table or on the floor. (You should cut them out beforehand.) Ask landing site users to place the cards with the most important stakeholders on the largest circles, less important or powerful ones on the medium-sized circles, and the least important on the smallest circles.
7. As a next step, ask which stakeholders work together; and ask in what way, how frequently and how closely. For those that work together, place the circles in such a way that they overlap. You may draw thicker or thinner lines between circles to suggest the level of collaboration.
8. Repeat the above steps as you discuss other stakeholders. Discuss as many categories as possible, and in each case ask participants to place them in relation to one other. There will probably be considerable discussion and repositioning as the task continues.
9. By the end of the session each group should have a diagram of institutional relationships at the landing site (see Figure 1). Have the groups present their diagrams to the other participants. Facilitate a discussion on similarities and differences.
10. Use glue or a stapler to preserve the diagrams for future reference. Thank the landing site users for their time and input. Explain how this information will be used for the next steps of the planning process.
|
FIGURE 1
|
Figure 1 shows an example from Wendo Tcham, Guinea-Bissau. Wendo Tcham is a small inland fishing village in the eastern part of the country. The diagram shows the organizations within the village, as well as links with government organizations and traders outside the village.
Note
It may be useful to use the principle of triangulation to check your results. Talk to leaders of some of the identified groups, or to anyone else who knows the community, such as nurses, doctors and teachers. Show them the results of the diagram. Ask if there are any groups missing or whether they would like to add anything about the interactions between the groups.
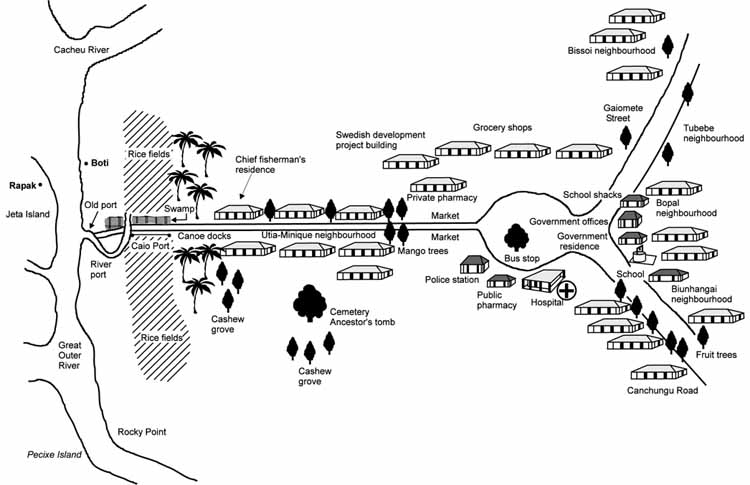
Now that you have determined the number and type of stakeholders, you need to find out where exactly their activities take place. You also need to determine the location of fisheries infrastructure, facilities, services and resources. This is the first step to understanding related problems and opportunities. Participatory mapping will help you collect this type of information and identify the dimension and scope of certain issues. This exercise explains how to draft a general landing site map. The next one shows you how to produce more detailed maps.
|
FIGURE 2
|
Who should participate
Representatives from the major groups of landing site users should draft these maps. You and the working group will facilitate this exercise.
Steps to take
1. Review available data and observations. Agree with the working group on what types of information you want to include in the map. It could include houses, places of worship, shops, storage facilities, fishing gear repair areas, fish smoking areas, fish markets, fuel distributors, ice plants, banks or savings and credit associations.
2. If you do not have a detailed map of the site, use a larger-scale map to delineate the boundaries, walking along the perimeter of the landing site with the landing site users so you can agree on the boundaries.
3. Divide the landing site users into small groups of between five and eight people. Introduce the concept of maps, mapping and its purpose to each group. The groups can be composed of representatives from different user groups, or each user group can do their own map. Figure 2 shows an example of a general landing site map.
4. It is important to realize that maps can illustrate both a true spatial representation of the landing site as well as the one perceived by landing site users. While formal maps may accurately chart a landing site’s geography, maps drawn by landing site users are meant to emphasize parts of the landing site they perceive as most important or most accessible. In this regard, distances between more accessible and popular locations may appear shorter on landing site users’ maps than on official maps.
5. Based on this exercise you may decide to organize additional sessions for landing site users to prepare more detailed or activity-specific maps (see the next exercise.) Maps can be drawn on the ground, on the floor or on paper; just make sure you preserve them!
Note
To triangulate, check your map against official maps. You will find different types of information on each and the scales will be different, but that does not matter. The objective is to discover additional information or insights, which you may then confirm with landing site user groups, officials, extension workers or others working at the landing site. Remember, you are trying to paint the clearest possible picture of the landing site and its users.
FIGURE 3
Fishing grounds map, Caió, Guinea-Bissau
Source: SFLP, June 2001
Once you have completed your general landing site map, you may realize that you need more information on certain parts. A detailed landing site map can be a useful tool. You may do this exercise as a follow-up to the general landing site map, or return to it after you have done some of the exercises in the other units. The maps suggested below include:
fishing grounds maps;
boat anchorage and navigation maps;
fish processing and marketing maps; and
service provision maps.
Use your imagination to determine which issue or activity you want to focus on in your map. When looking for solutions to problems, encourage landing site users to consider the support of outside agencies and community leaders, in addition to what they themselves can do.
Who should participate
The landing site users themselves should draw these detailed maps because they are closely involved in that aspect of the landing site. As before, you and your working group will facilitate this exercise.
Map 1: Fishing grounds
These maps indicate all fishing grounds exploited by fishers operating either full-time or part-time from the landing site. For example, if cast-net fishers fish within the anchorage, this should be included as a fishing ground. And if some landing site users glean shellfish from intertidal basins, these areas should be included as well. Fishers (both women and men) are in the best position to draw these maps. Make sure different types of fishing are represented in your group(s).
1. Ask the fishers to list the different types of fishing practices and the different species they fish.
2. Have the fishers draw a map of the different fishing grounds, identifying the location for each type of fishing. Figure 3 gives an example. If different vessels or gears exploit the same fishing ground, the map should reflect this.
3. If different types of fishing are practised during different times of the year, this should be indicated on the map(s). Alternatively, a map can be drawn for each season.
4. Initiate a discussion on problems and conflicts. Who normally solves these problems and how? Which issues are not yet resolved? How might they be resolved in future? What would need to happen?
Map 2: Boat anchorage and navigation
Such maps identify boat anchorage, approach channels, breakwaters and local dangers to navigation.
1. This type of mapping requires input from fishers, skippers and boat owners of different types of fishing units.
2. Ask them to list the types of fishing units at the landing site.
3. For each type, ask them to draw a map identifying its anchoring locations.
4. Then ask them to identify approach channels, breakwaters, local dangers to navigation and any other relevant feature.
5. Initiate a discussion on problems and conflicts. Who normally solves these problems? Who is responsible for different aspects of the conflicts? If no one currently hold the responsibility for a particular issue, ask the landing site users to agree on who would be the most likely person of them to take it on. Does that person have the relevant resources and skills? How this could be done?
Map 3: Fish processing and marketing
1. These maps give you details about the fish processing and marketing network for fish and fish products. They may represent a much larger area than other maps. Such a network may start at the landing site, move to a processing site and market away from the landing site, and then expand to regional markets and markets overseas. You will have to decide how large a network to include in your exercise.
2. The best people to draw a map like this are buyers, processors, sellers and/or transporters. Often these stakeholders are women. Make sure you cover both small- and large-scale enterprises.
3. Ask them to list the different categories of landing site users involved in buying, processing, selling and transporting fish. You may wish to differentiate between fish processors and fresh fish traders, large-scale fish traders and small-scale fish traders, fish buyers based at the landing and those coming from outside, etc.
4. Ask them to map activities of each category and the resources involved.
5. You may want to ask them to indicate the type of transportation used, the estimated distance, the travel time and the cost of transport to and from markets.
6. Indicate any seasonal differences in activities.
7. Initiate a discussion on what functions well. Where do problems or conflicts arise, what causes them, who solves them and how? If a user group does not have the support of management, lead a discussion on what could be done to resolve the problem. What would need to be done and who might be able to do it?
Map 4: Services
1. This map indicates the services and inputs available at the landing site. This could include fuel, credits and loans, fishing inputs, mechanics and boat builders’ services, cold stores, or even drivers of trucks that transport fish to markets. Depending on your focus, you may also include extension services and information, freshwater provision, toilets, restaurants and so on; include whatever is most useful to your landing site.
2. You will need a wide variety of landing site users for this exercise. If the group becomes very large, divide it into smaller groups according to economic activity. The groups can report back to each other at the end of the mapping exercise.
3. Ask them to make a list of all the services they use at the landing site. Ask them what exactly that service encompasses. Then ask them to map those activities and the resources used. Also ask them for other relevant information, such as costs, periods of shortage, or services that they feel are missing.
4. Indicate any seasonal differences in needs for services.
5. Initiate a discussion on what functions well. Where do problems or gaps occur? What causes them and how can they be solved? If no solution currently exists, lead a discussion on what could be done to fill the gaps, who might be able to do that, and what encouragement they could provide.
You and the working group now have an overview of the stakeholders, the layout of the landing site and its activities. You probably have a good idea of the main problems too. In Unit 3, you will go from this general picture into the specific parts of the landing site. You will obtain more precise information on the strengths and challenges facing the landing site.
Now that you have taken an inventory of stakeholders (both user groups and organizations) and have a spatial overview of the landing site area, you are no doubt developing an idea of the main problems. In this unit, you will follow activities from start to finish; understanding how different factors affect the smooth functioning of the landing site. These factors include chains of activities involving infrastructure, equipment, services, inputs, outputs, stakeholders and their interests, which together make up the backbone of a landing site and without which fishing and its related activities could not continue.
Exercises
These exercises will help you to create three types of diagnostic tools, collectively referred to as fisheries production chains. This is a way of charting the sequence of activities required to catch and market fish, from preparing to fish to fishing itself, to conserving and marketing. In a matrix form, you draw up various aspects of these activities and of the problems encountered. They will add details to your research and help you to refine your understanding of the landing site and interaction among stakeholders, human activities, the physical environment, available services and resulting outputs.
You will learn to prepare three types of fisheries production chains:
the fishing chain, which follows fishing units from the land to the water and back to land;
the fish marketing chain, which follows the landed fish through the various stages from quay-side to the consumer; and
the people chain, which follows people around the landing site while they conduct non-fishing related activities such as eating, washing, cleaning, and so on.
The purpose of this exercise is to conduct an investigation that will add detail to your understanding of the sequence of activities at the landing site. You will follow fishing units from land to water, and back to land again. Along the way you will:
make an inventory of everything that is required to enable fishing to take place (landing site users, other stakeholders, infrastructure, equipment, inputs, resulting outputs); and
identify problems and conflicts, as well as potential solutions and opportunities.
|
Key terms Fisheries production chains are produced by systematically following various activities related to fishing from beginning to end, from the preparation of fishing boats to the marketing of fish. An inventory is obtained by walking with landing site users as they go about their activities and along the way observing, asking questions, listening, discussing, identifying different zones and technologies, identifying problems, solutions and opportunities. All this is recorded and organized into a matrix. A fishing chain focuses on the chain of activities constituting fishing, including the preparation of fishing boats, repairs and maintenance of equipment, replacement of equipment, crew recruitment, mobilisation of capital (fuel, bait, ice, food and drinking-water); embarkation; fish capture; on-board fish conservation; debarkation; fish landing and selling to fish processors; income distribution and equipment storage. A fish marketing chain focuses on the activities that occur from the time that the fish has been landed and sold to fish processors, right up to its sale to consumers. It constitutes fish handling, conservation and marketing, buying fish upon landing, lending money, buying ice and ice boxes; cleaning fish; transporting fish; conserving fish through smoking, drying, salting or deep freezing; fish storage; and marketing fresh and conserved fish to consumers in local, regional or international markets. The people chain focuses on the support system available with regard to personal care of people working or visiting the landing site. Facilities may include transport; shelter; food and drinking-water; sanitation, waste disposal, communication facilities and security. |
The results of your investigation will be reported in the form of a matrix (see Table 3).
Who should participate
You and your team will "walk the chain", that is, accompany each activity in the fishing sequence - from preparing to fish to landing the catch to cleaning the boats. You will observe and interview landing site users and other relevant stakeholders encountered along the way. You could ask representatives from key groups to temporarily join the working group for this activity.
Make sure you consider all major stakeholders involved in each of the activities constituting this chain. They may include owners of fishing equipment; skippers and crew members; suppliers of fishing gear, fuel, ice and drinking-water; formal and informal providers of financial services; boat constructors; carpenters involved in the construction of insulated containers; mechanics; net menders; operators of slipways, hauling devises and storage facilities. Field staff from the Fisheries Department, NGOs or other agencies playing a part in these particular activities should also be included.
Some of the stakeholders relevant to the activity may not be present while the activity is taking place. Make a note of them and make sure to contact them for a short interview.
Steps to take
1. List the major types of fishing units operating from the landing site. If possible, prepare a chain for each. In order to save time, you may want to split up into groups or even pairs.
2. Physically follow one type of fishing unit as it goes through a full cycle of activity - as it is serviced and supplied in preparation for a new fishing trip and when it arrives back to port, unloads fish, anchors and gets hauled out for repairs. Review the definition of fishing chain in the "Key terms" box earlier in this unit to and make sure you have addressed all the activities.
3. Based on your observations and interview, list the major activities constituting the chain. Note that this chain is unique to a particular fishing unit and a particular season.
4. Once you have checked to make sure no major activities are missing, use your findings to prepare a matrix for the fishing chain. You may use the example of Table 3. Using your list as a guide, fill in the activities in the top row.
5. Now note the categories of information required for each step of the process and fill them in along the left column. These could include:
stakeholders involved;
infrastructure and major equipment used;
inputs required;
resulting outputs;
problems noted; and
potential solutions and opportunities.
6. You may be able to fill in most of the matrix just using your notes and your memory. Still, it is likely to be incomplete, or you may need clarifications.
7. Take the incomplete matrix and physically walk the chain again, interviewing stakeholders along the way. Fill in the gaps while you are doing this, and ask for clarifications.
8. In the course of completing the matrix you may have identified problems affecting the whole chain and not just one or two activities. Although it may not be clear where to place them in your matrix, you should not forget about them! Instead, list them on a separate sheet of paper.
Note
This exercise can be useful in gaining more information about particular issues important to the fishers’ livelihoods. It could be an issue that arose during the exercises in previous units, or one in which your organization has a particular expertise. Examples include environmental or resource management, safety at sea, or the relationships between fishing and other income-earning activities.
TABLE 3
Example of a fishing chain
|
Activities |
Preparation of fishing units |
Loading |
Embarkation |
Fishing |
Fish conservation on board |
|
Actors |
Fishing unit owner(s) |
Landing site authorities |
Fishing unit owner(s) |
Fishing unit owner(s) |
Fishing unit owner(s) |
|
Infrastructure, services and natural resources |
Fuel supply |
Concrete wharf |
Natural rock ridge |
Fisheries resources |
Ice supply |
|
Inputs |
Fuel, Ice, Bait, Crew |
Time/labour |
Skills/experience |
Fishing equipment and
materials |
Insulated containers |
|
Outputs |
Fishing unit ready to go out |
Easy loading |
Wave force broken |
Whole fish for sale |
Good quality fish for sale |
|
Problems |
High working capital requirements |
Abrasion of canoes against concrete wharf |
Rock is not high enough in case of strong winds |
Declining fish stocks |
Cost of container and ice |
|
... continued |
Debarkation |
Unloading |
Sale of fresh fish |
Repair and maintenance |
Storage of equipment |
|
Actors |
Fishing unit owner(s) |
Landing site authorities |
Owners of fishing equipment |
Owners of canoes, engines and
nets |
Owners of canoes, engines and nets |
|
Infrastructure, services and natural resources |
Natural rock ridge |
Concrete wharf |
Sheds |
Canoe repairs services |
Storage sheds |
|
Inputs |
Experience |
Cleaning of work platform |
Baskets |
Money |
Money to pay rent |
|
Outputs |
Wave force broken |
Easy unloading |
Income out of fishing |
Technically and economically sound fishing equipment and
material |
Equipment protected against theft and bad weather conditions |
|
Problems |
Rock is not high enough in case of strong winds |
Abrasion of canoes against concrete wharf |
Fishers lack market information |
Spare parts are difficult to find |
Not enough storage rooms for all |
TABLE 4
Example of a fish marketing chain
| Activities | Cleaning fish | Retailing fresh fish locally | Transport and marketing of fresh fish | Smoking fish | Selling smoked fish locally | Packaging/storage of smoked fish | Transport and marketing of smoked fish |
| Actors | Fish traders | Fresh fish traders | Fresh fish traders | Suppliers of fresh fish | Fish smokers | Fish smokers | Transporters/traders |
| Infra-structure & services | Sheltered shed | Sales area | Road | Sheltered smoking area | Sales area | Storage sheds | Road |
| Inputs | Whole fresh fish | Leaned fresh fish | Insulated van | Cleaned fresh fish | Smoked fish | Storage baskets | Truck/vehicle |
| Outputs | Cleaned fish | Income out of fresh fish | Fresh fish transported for sale to fisheries industries (export) | Smoke | Income out of fish smoking | Fish ready for transportation | Fish transported for sale at inland or regional markets |
| Problems | Fresh water not available during dry season | Fresh fish sales interspersed with unloading of canoes | High requirements in terms of investment and working capital | Firewood supply | Flies | Insect infestation | High requirements in terms of investment and working capital |
Also be aware of minor fishing activities and consider doing a fishing chain for them, too. In many West African countries, women, children and the elderly engage in seasonal, small-scale fishing, for subsistence or income-generation (e.g. fishing for shrimp in shallow waters). These groups can be especially vulnerable to a variety of problems, yet receive little support in solving them. Often these activities play a very important role in their economic well-being and that of their families.
Be sensitive to gender issues. Do not assume that it is always the men who do the fishing and own or run equipment and infrastructure. In many West African countries, women have an important role in financing fishing activities. They may be owners and decision-makers, even if they do not fish themselves.
Be aware that fisheries activities differ by season. You may want to do more than one matrix for each type of fishing unit - one for each season.
This exercise helps you to draw a detailed picture of the support mechanisms available to the chain involving fish handling, conservation and marketing. You will follow the fish from the water’s edge to the consumer. The aim of this chain is:
to make an inventory of everything that is required to enable fish processing and marketing to take place (landing site users and other stakeholders, infrastructure, equipment, inputs, outputs); and
to identify problems and conflicts as well as potential solutions and opportunities.
As before, the results of your investigation will be reported in the form of a matrix or "process chain" (see Table 4).
Who should participate
You and your team will walk the chain, following each of the activities along the route of fish handling, conservation and marketing. You can either casually interview stakeholders encountered along the way or make an appointment to meet at an agreed time. Major stakeholders may include local fish traders; fish traders from outside; artisanal fish processors; (semi-) industrial fish processors; suppliers of ice and firewood; and operators of cold stores.
The activities you will cover in this chain includes buying fish upon landing; cleaning fish; transporting fish; conserving fish through smoking, drying, salting or deep freezing; fish storage; transportation from the landing site to markets; and marketing fresh and conserved fish in local, regional or international markets. At each step you will examine the stakeholders, infrastructure, equipment, inputs, outputs, problems and opportunities.
Steps to take
1. List the major categories of fish landed at the landing site. Do the same for the types of markets: subsistence, local, national or international. You will need to prepare a series of chains, one for each category of fish or type of marketing. As before, divide the working group into small groups or pairs, each following a category of fish.
2. Follow the physical path of one major category of fish through all the stages of handling, conservation, transport and marketing. Based on your observations and interviews, list the major activities constituting this chain. Use the descriptions in this unit, including the key terms box to make sure you have not forgotten any activities.
3. Once you are sure no major activities are missing, use your findings to prepare a fish marketing chain, putting each activity in a separate section along the top row. See Table 4 as an example.
4. In the left-hand column, note the categories of information required for each step along the process matrix:
stakeholders involved;
infrastructure and major equipment involved;
inputs required;
resulting outputs;
problems noted; and
potential solutions and opportunities.
5. From your notes and your memory, fill in as much as you can of the matrix. Then, take the incomplete matrix, and physically walk the chain again, interviewing stakeholders along the way or meeting up with them separately for an interview. Fill in the gaps and get clarifications where needed.
6. As in the fishing chain matrix, note any overriding problems that do not fit into a certain category, so you do not forget them.
Note
Issues that may require your attention in this chain include the environment, health and hygiene hazards (for both fishmongers and consumers), and gender-related issues such as childcare, literacy and innumeracy. Fish marketing is also a seasonal activity. For some it may be a casual activity that they undertake only when they have enough money to do so. Identify which of these groups your organization will want to target. Note how the other chains impact on it.
This chain adds detail to your understanding of the facilities and services available to people working at or visiting the landing site in terms of general human needs. The chain can include transport to and from the landing site; availability of food and drinking-water; sanitation and toilet facilities; shelter from sun or rain; waste disposal; safety and security; information and communication facilities, and general landing site management. Your inventory will consider landing site users, infrastructure and major equipment used, inputs required, resulting outputs, problems and conflicts, and opportunities and potential solutions.
Who should participate
You and the working group will make the chain walks. You can interview landing site users and other stakeholders encountered along the way. Service providers you may encounter include petty traders and sellers of prepared food; telephone operators; drivers of taxis, mini-buses, bicycles or other modes of transportation; suppliers of fresh drinking-water; suppliers of toilet and bathing facilities; shelters or meeting places; security guards; individuals collecting and processing waste; port authorities or other management bodies; extension workers; providers of first aid and other safety and health standards; and possibly any nearby schools and clinics. If possible, include some of the key stakeholders in your groups when carrying out this exercise.
Steps to take
1. Identify major categories of people using the landing site, for example owners of fishing equipment; crewmembers; fish processors; fish traders; and service providers such as carpenters, mechanics and shopkeepers. Divide your team into small groups to follow one category each.
2. Follow the physical path of one category at a time, for instance, a crewmember arriving from a fishing trip. Discover the infrastructure he uses for his own support: piers, pathways, freshwater to drink and to wash, sanitary facilities, food and transport, as well as where he buys twine to mend his nets, where he mends his nets or relaxes, where he deposits his savings or where he makes a phone call.
3. Follow the path of other landing site users who come to the landing site from a landward direction, such as fish processors, fish traders, moneylenders, customers, children and officials. Discover what infrastructure they use. Be gender- and age-sensitive in selecting the categories of people you will follow.
4. Based on your observations and interviews, list the major elements of people’s support systems. Use your findings to prepare support chains for at least three people, noting the principal activities along the top row. See Table 5 for an example.
5. In the left-hand column, note the categories of information required for each step along the process matrix:
stakeholders involved;
infrastructure and major equipment involved;
inputs required;
resulting outputs;
problems noted; and
potential solutions and opportunities.
6. Fill in the matrix as much as possible. Take the incomplete matrix and physically walk the chain again, filling in gaps or making clarifications along the way by observing and talking to people. Complete the matrix, noting separately any important issues that do not fit into any one particular category.
TABLE 5
Example of a people chain
| Activities | Path from the sea to storage sheds and sales areas | Waste disposal | Landing site authorities | Washing and drinking water facilities (f/m) | Sanitary facilities | Child care/Nursery | Communication facilities | Health/first aid | Transport from the landing site |
| Actors | Landing site authorities | Landing site authorities | Police | Landing site authorities | Landing site authorities | Fish traders and processors | Landing site authority | Landing site authority | Landing site authorities |
| Infrastructure and services | Sandy beach | City trash containers | Offices for police, customs, fisheries department and security brigade | None | Two latrines for the whole landing site | Sheltered shed | Telephone (at police post) | First aid kit at police office | Foot path to the landing site |
| Inputs | Time/labour | Carrying waste to containers Pickup/disposal of container contents | Time/labour | None | None | Teacher Daily fee | Communication equipment Electricity Operators | First aid materials Skilled people | Money for public transport Time/labour |
| Outputs | Fishing equipment carried by hand to storage lockers | Disposal of waste materials | Landing site management and administration | Landing site users do not refresh themselves during the day | Dirty latrines that no one likes to use | Children are safe | Emergency/official phone connections VHF connection with nearby boats | Limited first aid in case of accidents | People and goods move between landing site and town |
| Problems | Impossible to use wheeled carts for heavy loads | Limited trash container capacity | Misunderstanding between government officers and local landing site management committee | No freshwater available for landing site users | Lack of latrines | Difficulty to find teachers | Radio contact with nearby landing sites and most boats is impossible | No health post | Drainage is a problem |
Note
People support chains may not directly involve fishing activities but still be extremely important in terms of people’s livelihoods, their income, their safety and their health. Remember that the chains may differ markedly by season. For instance, downpours during the rainy season impede transportation and make accessibility to a landing site or to markets extremely difficult.
Now that you have gathered so much information from these fishing chains, it is time to summarize the main points: the areas with the greatest problems, the strengths, the gaps, etc. Note this information on the maps you made earlier by putting a red circle around an area where there are problems. Also note which stakeholders seem to be key in either creating the problems or offering possible solutions.
Present the results of your findings to the landing site users or their representatives in a feedback meeting. This is a chance to keep them updated on the outcomes of the exercises. If you involved key stakeholders or representatives in the exercise, ask them to present the results. Exhibit the matrices and explain what the information means and how you obtained it. Summarize your findings by pointing out the main issues, where things seem to be going well and where there appear to be bottlenecks. Ask for feedback, such as whether important activities are missing, mistakes were made or different opinions exist on a certain topic. Adjust your matrix accordingly. Explain the next steps to the landing site users and when they will occur. Thank them for their continued input and support.
The next unit examines the effects of time on the landing site and its activities.
In the previous units, you collected a wealth of information that provided you with a sort of "snapshot" - still pictures of the landing site at a certain point in time or along a fisheries production chain. This unit introduces the element of time, so that you get a moving "video" of the changes and dynamics that affect the landing site and its users. It is the last unit related to collecting information.
The two exercises in this unit will help you discover: What were the main events that have influenced the landing site and its users? What are the results of these changes on the landing site activities in general and on the livelihoods of different stakeholder groups? Did these events affect some more than others? What elements have helped stakeholders deal with the change or variation? What made it difficult for them to adapt? What are the implications for the future, both immediate and longer term?
Exercises
You will examine changes and variations that affect the landing site by creating:
a historical time line; and
seasonal calendars.
|
Key terms A historical time line refers to a list of key events in the history of a landing site that helps identify past, current and future trends, events, problems and achievements over time. A seasonal calendar refers to a matrix attempting to establish regular cycles or patterns of activities at a landing site over a 12-month period. |
A historical time line helps you to understand which events and trends landing site users consider important in the history of their landing site, as well as those that may affect them now and into the future. It should go back as many generations as possible, depending on what landing site users can recall and how much relevance they have on issues under consideration by you and the working group. You also need to understand how they reacted to these events because their heritage of experience and knowledge influences present attitudes and behaviour. This exercise can uncover opportunities or barriers to proposed activities in the planning process.
Who should participate
Collect information about the past from elders, long-time residents, and leaders of church groups, self-help groups, political units or local administration. Include both women and men and people from different age groups. (This exercise suggests starting with elder people and then repeating it with other age groups.) If any of the above groups are large in number, break them up into smaller groups and compare responses later on.
Steps to take
1. Before starting, have on hand large sheets of paper and pens, or a black board to write down what is being discussed. Ask one of the group members to do this. Another option is to write each event on a separate card. The advantage of using cards is that they can be moved and reordered as group members remember other events and new cards are added. The cards are particularly useful for organizing "crowded" parts of a time line.
2. Organize one or more groups of three to five participants, preferably elder people who have operated at the landing site for many years and are interested in sharing their knowledge and experience with you. Groups are preferred to individual interviews with key informants because they encourage dialogue, which may spur people to remember past events.
3. Explain why you are interested in knowing about important events or developments in the past. Rather than defining what is important to them, ask elders to identify events that shaped and influenced individual and community activities at the landing site. Consider opening the discussion with questions such as:
When did the first settlers come to this area?
What kind of people were the founding residents?
What is the first important event in your community that you can remember?
Has there been significant migration into or out of your community?
What projects or (local) organizations have impacted the landing site, and how? Who initiated them?
Has the role of government changed over time in terms of in landing site development?
Have there been serious flooding, epidemics, famines, or other disasters?
What are some of the best things your community has done? Who were the important leaders?
What have been the happiest times? What were more difficult periods? Why were they so good or bad?
4. If you have difficulty establishing dates for particular events, try to relate them to known events such as the First World War, Second World War, independence, national elections, etc.
5. Once the events are agreed upon, discuss the following:
What were the effects of the events on different user groups and the community or landing site as a whole?
What did people do to cope with the event or adjust to the change?
Can the impact of the event or change still be seen at the landing site today;
Have particular events or problems increased or decreased? Why? What does this lead to? How is it likely to continue?
6. Write the results on a large piece of paper. Discuss with the group what these things could mean for the implementation of projects resulting from the landing site development planning process.
Tables 6 and 7 show time lines developed by landing site users in Mateba, Cameroon and Boulbinet fishing port, Guinea.
Note
Repeat the same exercise with groups of middle-aged and young people. Change the tense of the questions from the past to the present and future. Summarize the results. Ask the groups to present their results to each other in a feedback meeting using the large sheets of paper, and generate a discussion.
TABLE 6
A historical time line, Mateba village,
Cameroon
|
Date |
Events at Mateba, Cameroon |
|
1900 |
Arrival of first settler, Mr Ekweyong, from Nigeria. |
|
1914 |
Arrival of second settler, Mr Essien, a retired British soldier, from Nigeria. |
|
1961 |
Catholic mission takes over school built by the Germans. National Independence. |
|
1965 |
First big fire destroys the wooden houses of Mateba. |
|
1972 |
First Apostolic Church built. |
|
1974 |
Government takes over primary school from the Catholic mission. |
|
1974-75 |
A road and public transport is introduced. |
|
1975 |
End of barter trade. |
|
1976 |
Building of the present market and introduction of modern trade. |
|
1977 |
Road comes into Mateba. |
|
1978-79 |
First engine boat, first motor saw for firewood. |
|
1981 |
Rubber plantation established (to replace banana plantation). |
|
1982 |
Full Gospel Church established. |
|
1986 |
Second big fire destroying most of the houses: as a result corrugated
iron sheets are |
|
1988 |
Establishment of fishery post. |
|
1989 |
Big (legal) raid by Cameroonian authorities to control taxes and immigration. |
|
1993 |
Big (legal) raid by Cameroonian authorities to control gasoline and outboard
engines. |
|
1994 |
Mass exodus because of the Nigerian/Cameroonian border problem. |
Source: Demunck & DETMAC Associates, 1994
TABLE 7
The story told by time, Boulbinet port in
Conakry, Guinea
|
Date |
Events at Boulbinet port, Conakry |
|
< 1840 |
Boulbinet was called "Kaloum" or "Paris kondé bunyi". |
|
1840 |
Arrival of first occupant, Bakary Bolobinet, a Baga (ethnic group). |
|
1914-18 |
Islanders of Kassa, Fotoba, and room are the first to use the landing
site for different |
|
1930 |
Arrival of the Senegalese (Wolofs) with their big artisanal canoes (boti). |
|
1935-37 |
Firewood unloaded by people from Kaback island. |
|
1936 |
Construction of a large storage building for fish, which was sold at 8-10 FCFA per kg. |
|
1937 |
The first Port Chiefs named, according to the type of fishery. |
|
1939-45 |
Commandant Bardeay (Mayor of Conakry) supplied fishermen with fishing
supplies, |
|
1941 |
Arrival of Madame Ponty, French army officer at Boulbinet, with her small
boat |
|
1945 |
The administrators and the population supplied with fish thank the Mayor
for his |
| |
(national independence) |
|
< 1977 |
Beautiful "Peronne Beach" was right next to the fishing port. |
|
1977 |
"Peronne Beach" destroyed in order to build the "palace" for the Organization
of |
|
1982 |
Demolition of the big fish storage and sales depot in order to build
a fuel station and a |
|
1982 |
Existence of a Canadian fisheries project (which dealt with outboard
motor repair, for |
|
1989 |
Partial occupation of the landing site by women fish merchants, fish
smokers, and |
Source: Seny Camara et al., 1992
Another time-related tool is the seasonal calendar. It identifies patterns and cycles of activity that occur at the landing site on a regular basis and helps determine whether a normal year has common periods of excessive problems or opportunities. This is a detailed and comprehensive task, but not necessarily complicated. A seasonal calendar compares landing site activities, month-by-month, taking into account major occupational groups and differences based on age and gender. It helps present large quantities of diverse information in a common time frame.
Who should participate
Landing site users groups should collect this information. Make sure to include data about all major categories of landing site users, including men and women, old and young, insiders and outsiders. You can make different types of calendars according to type of seasonality you want to discuss (see examples below).
Steps to take
1. Organize one or more small groups (four to eight members) with one or two of the working group members guiding each group discussion. The number and composition of groups depends on the topics that you want to discuss. For example, the impact of the phases of the moon on fish capture can best be discussed with fishermen, while seasonality in fish processing and trade is probably best explained by fish processors and traders.
2. Explain the purpose of the exercise. Introduce topics you think are relevant but also encourage landing site users to add their own.
3. Display a single-page chart with a common time scale on the horizontal axis so that people can scan up and down to see the conditions for a specific month or time period. Set up a sequence of months across the bottom of the page (see examples below). While most will start with January, there may be reasons to start with the start of the fishing season or some other event.
4. Stimulate discussion by asking some of the following questions:
Weather: When is the dry season? What is the driest month? When is the wet season? What is the wettest month?
Fishing: What is the fishing season for different types of gear and/or fish? When do migrant fishers arrive? When do they leave? Why?
Other income-generating activities: How else can you earn money? How else do you provide for your family? When are the slowest and busiest times for landing site users? Why?
Religious, social and other important activities: When do important festivals occur? How do they impact on fishing and other activities?
Sickness and health: When are diseases common? When do children tend to fall sick? What causes the sickness?
Income, expenditure and debt: When do you earn the most/least? When do you spend the most/least? How do you deal with periods of low income? Who or what can you rely on for support in these periods?
5. Write the answers to these questions on the chart so that everyone can see. In order not to clutter the chart you may want to collect information on each topic on a separate calendar and integrate them later. Let people add details or bring up new aspects as the discussion evolves.
6. Make a summary of the results. Identify:
the seasons, with problems and opportunities for each;
the availability of time and labour according to different user groups;
variations in cash flow per user group;
times of vulnerability in terms of diseases and food shortage; and
the potential capacity for new activities.
7. Based on the above, look at the implications for possible future project activities:
when would stakeholders have time and enough income to work on possible project activities?
When is the most convenient time for certain activities (e.g. attending a training course when little fishing is going on, or during the fishing season so experiments can be done)?
8. Have the groups present the results of these discussions to each other. See Tables 8 and 9 for some examples of seasonal calendars.
TABLE 8
Seasonal calendar of women’s group,
Caió, Guinea-Bissau
|
Women’s activities (Caiò) |
Dry season |
Rainy season |
||||||||||
| |
N |
D |
J |
F |
M |
A |
M |
J |
J |
A |
S |
O |
|
Smoking fish |
|
|
x |
x |
x |
x |
x |
x |
x |
|
|
|
|
Transplanting rice |
|
|
|
|
|
|
|
|
|
|
x |
|
|
Monda |
|
|
|
|
|
|
|
|
|
|
x |
|
|
Vigiar (bicia) |
x |
|
|
|
|
|
|
|
|
|
|
|
|
Collection of keibur/suta |
|
x |
|
|
|
|
|
|
|
|
|
|
|
Transportation of products |
|
|
x |
|
|
|
|
|
|
|
|
|
|
Cutting wood (chebue) |
|
|
x |
x |
x |
x |
x |
|
|
|
|
|
|
Kapoti mpampam |
|
|
|
|
|
|
|
x |
x |
|
|
|
|
Harvesting of cashew nuts |
|
|
|
|
x |
x |
x |
x |
|
|
|
|
|
Umpimi fishing |
x |
x |
x |
x |
x |
x |
x |
x |
x |
x |
x |
x |
|
Collecting molluscs |
x |
x |
x |
x |
x |
x |
x |
x |
x |
x |
x |
x |
|
Sale of fish |
|
|
x |
x |
x |
x |
x |
x |
x |
x |
|
|
|
Commercializing other products |
x |
x |
x |
x |
x |
x |
x |
x |
x |
x |
x |
x |
|
Earnings |
Dry season |
Rainy season |
||||||||||
|
High |
|
|
|
|
|
|
|
|
|
|
|
|
| |
|
|
|
|
|
|
|
|
|
|
|
|
|
Middle |
|
|
|
|
|
|
|
|
|
|
|
|
| |
|
|
|
|
|
|
|
|
|
|
|
|
|
Low |
|
|
|
|
|
|
|
|
|
|
|
|
| |
|
|
|
|
|
|
|
|
|
|
|
|
|
Spending |
Dry season |
Rainy season |
||||||||||
|
High |
|
|
|
|
|
|
|
|
|
|
|
|
| |
|
|
|
|
|
|
|
|
|
|
|
|
|
Middle |
|
|
|
|
|
|
|
|
|
|
|
|
| |
|
|
|
|
|
|
|
|
|
|
|
|
|
Low |
|
|
|
|
|
|
|
|
|
|
|
|
| |
|
|
|
|
|
|
|
|
|
|
|
|
Source: SFLP, May 2001
TABLE 9
Seasonal calendars for crayfish production and
malaria/cholera occurrence
|
Catches |
CRAY FISH CATCH |
|||||||||||
|
High |
|
|
|
|
|
|
|
|
|
|
|
|
| |
|
|
|
|
|
|
|
|
|
|
|
|
| |
|
|
|
|
|
|
|
|
|
|
|
|
|
Low |
|
|
|
|
|
|
|
|
|
|
|
|
|
Month |
J |
F |
M |
A |
M |
J |
J |
A |
S |
O |
N |
D |
|
season |
Big dry |
Small dry |
Big rainy |
Small rainy |
|
|||||||
|
Occurrence |
Disease occurance (malaria and cholera) |
|||||||||||
|
High |
|
|
|
|
|
|
|
|
|
|
|
|
| |
|
|
|
|
|
|
|
|
|
|
|
|
| |
|
|
|
|
|
|
|
|
|
|
|
|
|
Low |
|
|
|
|
|
|
|
|
|
|
|
|
|
Month |
J |
F |
M |
A |
M |
J |
J |
A |
S |
O |
N |
D |
|
season |
Big dry |
Small dry |
Big rainy |
Small rainy |
||||||||
Source: Demunch & DETMAC Associates, 1994
Bring together the outcomes of the historical timelines and seasonal calendars in a summary. Highlight the main points. Present the results to the user groups in a feedback meeting.
This is the last unit to deal with collecting information. In the next two units, you will synthesize and analyse the information you have collected.
![]()
![]()
![]()
)