

Required citation:
FAO. 2025. World Food and Agriculture – Statistical Yearbook 2025. Rome. https://doi.org/10.4060/cd4313en
The designations employed and the presentation of material in this information product do not imply the expression of any opinion whatsoever on the part of the Food and Agriculture Organization of the United Nations (FAO) concerning the legal or development status of any country, territory, city or area or of its authorities, or concerning the delimitation of its frontiers or boundaries. Dashed lines on maps represent approximate border lines for which there may not yet be full agreement. The mention of specific companies or products of manufacturers, whether or not these have been patented, does not imply that these have been endorsed or recommended by FAO in preference to others of a similar nature that are not mentioned.
ISBN 978-92-5-140174-3
© FAO, 2025

Some rights reserved. This work is made available under the Creative Commons Attribution- 4.0 International licence (CC BY 4.0: https://creativecommons.org/licenses/by/4.0/legalcode.en).
Under the terms of this licence, this work may be copied, redistributed and adapted, provided that the work is appropriately cited. In any use of this work, there should be no suggestion that FAO endorses any specific organization, products or services. The use of the FAO logo is not permitted. If a translation or adaptation of this work is created, it must include the following disclaimer along with the required citation: “This translation [or adaptation] was not created by the Food and Agriculture Organization of the United Nations (FAO). FAO is not responsible for the content or accuracy of this translation [or adaptation]. The original [Language] edition shall be the authoritative edition.”
Any dispute arising under this licence that cannot be settled amicably shall be referred to arbitration in accordance with the Arbitration Rules of the United Nations Commission on International Trade Law (UNCITRAL). The parties shall be bound by any arbitration award rendered as a result of such arbitration as the final adjudication of such a dispute.
Third-party materials. This Creative Commons licence CC BY 4.0 does not apply to non-FAO copyright materials included in this publication. Users wishing to reuse material from this work that is attributed to a third party, such as tables, figures or images, are responsible for determining whether permission is needed for that reuse and for obtaining permission from the copyright holder. The risk of claims resulting from infringement of any third-party-owned component in the work rests solely with the user.
FAO photographs. FAO photographs that may appear in this work are not subject to the above-mentioned Creative Commons licence. Queries for the use of any FAO photographs should be submitted to: photo-library@fao.org.
Sales, rights and licensing. FAO information products are available on the FAO website (www.fao.org/publications) and print copies can be purchased through the distributors listed there. For general enquiries about FAO publications please contact: publications@fao.org. Queries regarding rights and licensing of publications should be submitted to: copyright@fao.org.
Timely, accurate and high-quality data and statistics are the cornerstone of solid policy design, where decisions are based on hard evidence, and monitoring and evaluation rely on strong statistical systems. This has become all the more critical as governments around the world commit to major sectoral and national development plans, as well as regional and global development agendas.
Statistical work has been at the core of the activities and mandate of the Food and Agriculture Organization of the United Nations (FAO) since the Organization was founded in 1945, supporting its Members in eliminating hunger, improving nutrition, eradicating rural poverty, and promoting inclusive and efficient agrifood systems. This year marks the eightieth anniversary of FAO, representing 80 years of statistical activity. Over this period, FAO has positioned itself as a leading provider of internationally comparable data on food, nutrition and agriculture, which are gathered from national statistical offices and from FAO’s network of partner agencies and harmonized to paint a global picture. The most important FAO statistics are summarized in this Statistical Yearbook.
The Statistical Yearbook is a primary tool and indispensable reference for policymakers, researchers and analysts, as well as for any person interested in the past, present and future paths of food and agriculture. Drawing on the wealth of information that FAO statisticians produce across the Organization, this publication offers a synthesis of the major factors at play in the global food and agriculture landscape. Statistics are presented in four thematic chapters that cover the economic importance of agricultural activities; inputs, outputs and factors of production; implications for food security and nutrition; and agriculture’s impacts on the environment. The digital version of the yearbook presents the data in an interactive way, which facilitates the visualization of figures and tables and their reuse.
As we celebrate eight decades of statistical achievements, special attention is given to the centennial of the first World Programme for the Census of Agriculture guidelines, as countries prepare their next agricultural census. Improved data on forestry products trade, with the addition of processed wood and paper products, are also featured. Finally, the prevalence of minimum dietary diversity, a new indicator for monitoring progress towards Target 2.2 of the Sustainable Development Goals – End all forms of malnutrition – is showcased.
This Statistical Yearbook is only one of a series of tools and statistical publications that FAO provides to users. The freely accessible FAOSTAT data platform contains the largest statistical database on food and agriculture in the world, with approximately 20 000 indicators covering more than 245 countries and territories, and around 2 million views each year. The Statistical Yearbook is accompanied by the shorter Statistical Pocketbook, which provides a quick and easy reference to the main facts and trends in food and agriculture.
In addition to compiling and disseminating data, FAO also works towards strengthening the statistical capacity of countries so they can produce more and better data; it sets standards and methodologies, and leverages innovations such as big data and other new data collection and processing technologies. FAO is committed to ensuring free access to current, reliable, timely and trusted data, necessary to chart a course towards more sustainable and equitable agrifood systems and a world free of hunger.
José Rosero Moncayo
Chief Statistician
Director, Statistics Division
This Statistical Yearbook was prepared by the Statistics Division (ESS) of the Food and Agriculture Organization of the United Nations (FAO) in collaboration with the Communications (OCC), Fisheries and Aquaculture (NFI), Forestry (NFO), Land and Water (NSL) and Markets and Trade (EST) divisions. Olivier Lavagne d’Ortigue led the work under the direction of José Rosero Moncayo (FAO Chief Statistician and ESS Director). We would like to thank the following for their contributions and input: Valérie Bizier, Veronica Boero, Rachele Brivio, Carlo Cafiero, Jairo Castano, Nancy Chin, Piero Conforti, Valentina Conti, Sophie Ditlecadet, Birkan Durak, Adrienne Egger, Carola Fabi, Tomasz Filipczuk, Laura Galeotti, Neli Georgieva, Leman Yonca Gürbüzer, Adeeba Ishaq, Anne Kepple, Clara Aida Khalil, Amy Knauff, Irina Kovrova, Arvydas Lebedys, Eun Jeong Lee, Livia Lombardi, Patricia Mejias Moreno, Sara Montanaro, Griffiths Obli-Laryea, Michelle Piccoli, Nidal Ramadan, Vikas Rawal, Aydan Selek, Simona Sorrenti, Kimberly Sullivan, Francesco Tubiello, Monica Umena, Stefania Vannuccini, Sara Viviani, Michele Vollaro, Sven Walter and Nathan Wanner.
The Statistical Yearbook 2025 is divided into four thematic chapters:
• Chapter 1 (Economic dimensions of agriculture) provides an overview of agriculture, forestry and fishing from an economic standpoint.
• Chapter 2 (Production, trade and prices of commodities) presents the outputs of the sector in terms of the production and trade of the different commodities and the evolution of prices.
• Chapter 3 (Food security and nutrition) looks at how some of these outputs are consumed by narrowing the focus on food security and nutrition.
• Chapter 4 (Sustainability and environmental aspects of agriculture) deals with the impacts of the whole sector on the environment.
Each chapter draws on the latest available data to describe through text and charts the trends since the early 2000s. As data on each topic are produced according to different schedules and with different methods and sources, the latest year available can change between sections.
The country classification adopted in this publication is based on the United Nations M49 classification (https://unstats.un.org/unsd/methodology/m49/). The official Food and Agriculture Organization of the United Nations (FAO) names can be found at https://www.fao.org/nocs/en.
Regional and subregional aggregates are based on the country groupings defined in the United Nations M49 classification. A small subset of indicators used in Chapter 3 is based on the aggregation rules defined in The State of Food Security and Nutrition in the World 2025 – Addressing high food price inflation for food security and nutrition report, which can be found at https://doi.org/10.4060/cd6008en.
Two types of aggregations are used: sum and weighted mean. A sufficiency condition is imposed when computing the aggregation: the aggregation is computed only when enough countries have reported data. The current threshold is set at 50 percent of the variable and the weighting variable, if present.
The cut-off date for the data is 28 October 2025.
• When country data have not been reported for the reference year, an asterisk (*) on the year label indicates that the value for the most recent year available is shown. For example, 2021–2023* means that the most recent value for the period from 2021 to 2023 is shown.
• One billion is 1 000 million.
• One trillion is 1 000 billion.
• In tables:
• a blank means that data are not available or that aggregates cannot be calculated because of missing data for the years shown;
• 0 or 0.0 means zero or a number that is small enough to round down to zero at the displayed number of decimal places;
• <2.5 means a proportion less than 2.5 percent; and
• <0.1 means less than 100 000 people.
• On maps, [a–b] denotes the interval of numbers between a and b, including a and b, while ]a–b] denotes the interval of numbers between a and b, excluding a and including b.
1. Value added of agriculture, forestry and fishing by region
2. Share of agriculture, forestry and fishing value added in total GDP by region (USD 2015 prices)
3. World agricultural land by use
5. World agricultural land by use and main countries (2023)
6. Cropland area per capita by region
7. Area equipped for irrigation by region
8. Share of area equipped for irrigation in cropland area by region
9. Share of water withdrawal by agriculture in total withdrawal, top countries (2022)
10. Employment in agriculture, forestry and fishing by region
11. Share of agriculture, forestry and fishing employment in total employment by region
12. Share of women in agriculture, forestry and fishing employment, top countries (2023)
13. Employment in agrifood systems by region
14. Share of agrifood systems employment in total employment by region
18. Pesticide use per cropland area by region
19. Inorganic fertilizer use by region
20. Inorganic fertilizer use by nutrient and region
21. Inorganic fertilizer use per cropland area by nutrient and region
22. World production of primary crops by commodity group
23. World production of primary crops, main commodities
24. World production of main primary crops by main producers (2023)
25. World production of vegetable oils, main commodities
26. World production of main vegetable oils by main producers (2022)
27. World production of raw sugar, main producers
28. World production of meat, main items
29. World production of main meat items, main producers (2023)
30. World production of bovine milk
31. World production of hen eggs
32. World capture fisheries and aquaculture production by species group
33. World capture fisheries and aquaculture production by production source
34. World capture fisheries and aquaculture production by main producers (2023)
35. World production of roundwood by type
36. World production of roundwood by type, main producers (2023)
37. World production of selected forest products
38. Value of world food exports by group
40. Food imports and exports by main groups and region (2023)
41. World exports of cereals by main commodities
42. Main traded cereals, top importers and exporters (quantities, 2023)
43. Value of world forest product exports by main commodities
B1. Value of world forest product exports by category
44. FAO Food Price Index, world (2014–2016=100)
45. FAO food commodity price indices, world (2014–2016=100)
46. FAO FISH PRICE INDEX, WORLD (2014–2016=100)
47. ANNUAL Changes in prices received by farmers, top and bottom countries (2024)
48. Inflation in food consumer prices by region
49. Prevalence of undernourishment by region
50. Number of people undernourished by region
51. Food insecurity levels based on the Food Insecurity Experience Scale by region
52. Food insecurity levels by region and sex (2024)
53. Cost of a healthy diet by region
54. Proportion of the population unable to afford a healthy diet by region
55. Number of people unable to afford a healthy diet by region
56. Average dietary energy supply by region
57. Cereal import dependency ratio, top countries (2021–2023)
58. Dietary energy supply by region and commodity group
59. Average protein supply by region and origin
60. Average dietary supply adequacy by region
61. Prevalence of stunting in children under 5 years by region
62. Prevalence of obesity in the adult population by region
63. Prevalence of obesity in the adult population, top countries (2022)
B2. Percentage of children aged 6 to 23 months achieving minimum dietary diversity by region
B3. Percentage of women aged 15 to 49 years achieving minimum dietary diversity by region
64. Share of land area by type and region
65. Share of forest area in total land area, top countries (2023)
66. World primary crops harvested area by commodity group
67. World area under organic agriculture, main countries (2023)
68. Share of area under organic agriculture in total agriculture area, top countries (2023)
B4. Countries with the largest number of agricultural holdings
69. Water stress, top countries (2022)
70. Cropland nitrogen balance by component and region
71. World greenhouse gas emissions from agrifood systems
72. World farm-gate greenhouse gas emissions by activity
73. World emissions intensity of agricultural commodities (2023)
74. Mean annual temperature change on land by region
1. Value added of agriculture, forestry and fishing (USD million, 2015 prices)
2. Share of agriculture, forestry and fishing value added in total GDP (USD 2015 prices) (percent)
3. Agricultural land by use (thousand ha)
4. Cropland area per capita (ha per capita)
5. Area equipped for irrigation (thousand ha)
6. Share of area equipped for irrigation in cropland area (percent)
7. Share of water withdrawal by agriculture in total withdrawal (percent)
8. Employment in agriculture, forestry and fishing (thousand people)
9. Share of agriculture, forestry and fishing employment in total employment (percent)
10. Share of women in agriculture, forestry and fishing employment (percent)
11. Employment in agrifood systems (thousand people)
12. Share of agrifood systems employment in total employment (percent)
16. Pesticide use per cropland area (kg per ha)
17. Inorganic fertilizer use by nutrient (thousand tonnes)
18. Inorganic fertilizer use per cropland area by nutrient (kg per ha)
19. Production of primary crops by group, 2023 (thousand tonnes)
20. Production value of primary crops by group, 2023 (USD million, 2014–2016 prices)
21. Production of primary crops main commodities, 2023 (thousand tonnes)
22. Production of vegetable oils main commodities (thousand tonnes)
23. Production of raw sugar (thousand tonnes)
24. Production of meat (thousand tonnes)
25. Production of bovine milk (thousand tonnes)
26. Production of hen eggs (thousand tonnes)
27. Capture fisheries and aquaculture production, 2023 (thousand tonnes)
28. Capture fisheries and aquaculture production by source (thousand tonnes)
29. Production of roundwood by type (thousand m3)
30. Production of selected forest products, 2023
31. Food exports, 2023 (USD million)
32. Food net trade (USD million)
33. Food imports, 2023 (USD million)
34. Cereals exports (thousand tonnes)
35. Cereals imports and exports by main commodities, 2023 (thousand tonnes)
36. Forest products exports, 2023 (USD million)
37. FAO food price indices (2014–2016=100)
38. ANNUAL Changes in prices received by farmers (percent)
39. Inflation in food consumer prices (percent)
40. Prevalence of undernourishment (percent)
41. People undernourished (million)
42. Food insecurity levels (percent)
43. Food insecurity levels by sex (percent)
44. Cost of a healthy diet (PPP dollars)
45. Proportion of the population unable to afford a healthy diet (percent)
46. People unable to afford a healthy diet (million)
47. Average dietary energy supply (kcal per capita per day)
48. Cereal import dependency ratio (percent)
49. Dietary energy supply by commodity group, 2023 (kcal per capita per day)
50. Average protein supply by origin (g per capita per day)
51. Average dietary supply adequacy (percent)
52. Prevalence of stunting in children under 5 years (percent)
53. Prevalence of obesity in the adult population (percent)
54. Land area by type (thousand ha)
55. Share of forest area in total land area (percent)
56. Primary crops harvested area by commodity group, 2023 (thousand ha)
57. Area under organic agriculture (thousand ha)
58. Share of area under organic agriculture in total agricultural area (percent)
60. Cropland nitrogen balance (kg per ha)
61. Greenhouse gas emissions from agrifood systems, 2023 (million tonnes CO2eq)
62. Farm-gate greenhouse gas emissions by activity, 2023 (million tonnes CO2eq)
63. Emissions intensity of agricultural commodities, 2023 (kg CO2eq per kg)
64. Mean annual temperature change on land (degree Celsius)
1. Value added of agriculture, forestry and fishing by region (2023)
2. Share of agriculture, forestry and fishing value added in total GDP (2023, USD 2015 prices)
3. Employment in agriculture, forestry and fishing (2023)
4. Share of agriculture, forestry and fishing employment in total employment (2023)
8. Inorganic fertilizer use (2023)
9. Production of cereals (2023)
10. Production of sugar cane (2023)
11. Production of maize (2023)
12. Production of wheat (2023)
14. Production of oil palm fruit (2023)
15. Production of potatoes (2023)
16. Production of chicken meat (2023)
17. Production of PIG meat (2023)
18. Production of cattle meat (2023)
19. Production of bovine milk (2023)
20. capture fisheries and aquaculture production (2023)
21. Aquaculture production (2023)
22. Importers and exporters of forest products (2023)
23. Importers and exporters of food (2023)
24. Inflation in food consumer prices (2023 average)
25. Prevalence of undernourishment (2022–2024 average)
26. Number of undernourished people (2022–2024 average)
27. Cost of a healthy diet (2024)
28. Proportion of the population unable to afford a healthy diet (2024)
29. Prevalence of stunting in children under 5 years (2024)
30. Prevalence of obesity in the adult population (2022)
31. Share of forest area in land area (2023)
32. Total renewable water resources per capita (2022)
34. Greenhouse gas emissions from agrifood systems (2023)
2. Focus on minimum dietary diversity
3. Focus on the 2030 round of the World Programme for the Census of Agriculture
The global value added generated by agriculture, forestry and fishinga grew by 96 percent in real terms between 2000 and 2023, reaching USD 4.0 trillion in 2023 (see FIGURE 1). This represents an increase of USD 1.9 trillion compared with 2000. In Africa, the value added went up 169 percent over the period, increasing from USD 170 billion to USD 457 billion. Given its size, Asia was the main contributor to global agriculture, forestry and fishing value added with 66 percent of the world total in 2023: the continent’s value added more than doubled from USD 1.2 trillion in 2000 to USD 2.6 trillion in 2023. In the Americas and Oceania, the increase reached 60 percent and 53 percent, respectively, in the 2000–2023 period, while Europe increased its agricultural value added by just 18 percent. In the context of the COVID-19 pandemic, the global value added of agriculture increased in 2020 by 2.2 percent and went up 4.2 percent in 2021 due to the rebound in activity. The increase in 2023 was 2.6 percent, below the average annual growth rate of the 2000–2023 period. The countries with the largest agriculture, forestry and fishing sector in terms of value added in 2023 are China, India and the United States of America (see TABLE 1).

The global contribution of agriculture to gross domestic product (GDP) declined marginally between 2000 and 2019. This is an expected consequence of the growth of total GDP. Due to the COVID-19 pandemic and the various restrictions put in place to contain it in 2020, the value added of the industry and services sectors declined while that of agriculture kept increasing, resulting in an artificial jump of the share of agriculture in the total in 2020 (see FIGURE 2). After 2020, the share of value added from agriculture, forestry and fishing resumed its long-term declining trend, falling from 4.4 percent in 2020 to 4.3 percent in 2023. It had dropped between 2000 and 2019 in all regions except Africa and the Americas, then increased between 2019 and 2020. All regions except the Americas and Europe had a share of agriculture in GDP in 2023 that was higher than in 2019, and in the case of Africa, also higher than in 2000 (14.4 percent in 2000 compared with 15.5 percent in 2023). This increase, which rarely occurs, is due to a higher contribution of agriculture to GDP, largely related to the COVID-19 pandemic, in several countries: Algeria, Angola, Benin, Chad, the Comoros, the Congo, Eritrea, Gabon, Guinea, Libya, Mali, Morocco, the Niger, Nigeria and South Africa. These countries accounted for 48 percent of the total value added from agriculture, forestry and fishing in Africa in 2023 (see TABLE 2). Despite its relatively small economic size, the sector plays a crucial role in the agro-industry value chain and in the use of natural resources. As such, agriculture affects the quality of the environment and food security beyond what its contribution to GDP indicates.

In 2023, the global agricultural land area was 4.80 billion hectares (ha), down 2 percent, or 0.07 billion ha, compared with 2000 (see FIGURE 3 and TABLE 3). Between 2000 and 2023, roughly two-thirds of agricultural land was used for permanent meadows and pastures (3.23 billion ha in 2023, down 4 percent, or 0.15 billion ha from 2000). One-third of the total agricultural land was cropland (1.57 billion ha in 2023, up 5 percent, or 0.08 billion ha, from 2000).

The regional breakdown of the global cropland area varied marginally between 2000 and 2023 (see FIGURE 4). Asia had the largest share of the global cropland area in 2023 (37 percent), followed by the Americas (23 percent), Africa (20 percent), Europe (18 percent) and Oceania (2 percent). Nonetheless, there were differences in cropland expansion in the different regions during this period – Oceania and Africa both had rapid growth in cropland area (31–33 percent), while Asia had more moderate growth (2 percent). The cropland area of the Americas remained stable and that of Europe declined between 2000 and 2023 by 6 percent. As a result, the cropland area of Africa surpassed that of Europe in 2016.

Approximately 30 percent of global cropland and permanent meadows and pastures can be found in three countries (see FIGURE 5), which are not necessarily the ones with the largest total land area.b In 2023, 12 percent of global permanent meadows and pastures belonged to China, 10 percent to Australia, and 8 percent to the United States of America. For the same year, the largest contributors to global cropland were India (11 percent), the United States of America (10 percent) and China (8 percent).

Cropland area per capita decreased in all regions between 2000 and 2023 as population increased faster than the cropland area (see FIGURE 6). The world average declined by 20 percent, reaching 0.19 ha per capita in 2023; the decrease was the largest in Africa (−26 percent, to 0.21 ha per capita), followed by the Americas and Asia (−20 percent, to 0.35 ha per capita and 0.12 ha per capita, respectively). The decline was smaller in Oceania (−10 percent, to 0.74 ha per capita) and Europe (−8 percent, to 0.38 ha per capita). Against this backdrop, the increase in agricultural production over the same period (described in Chapter 2) indicates higher efficiency in feeding the population with limited land resources. The countries with the highest cropland area per capita are Kazakhstan, Australia and Canada (see TABLE 4), due to the presence of vast areas of land available over sparsely populated areas. Other reasons for high values of cropland area per capita include the intense use of agricultural inputs and dependencies on agricultural imports or food aid.

The development of irrigation is one aspect of agricultural intensification that has allowed total production to grow much faster than the cultivated area.
The global land area equipped for irrigation reached 355 million ha in 2023 (see FIGURE 7), an increase of 23 percent from the 289 million ha of 2000 and more than twice the land area equipped for irrigation in the 1960s.1 The vast majority is located in Asia (71 percent in 2023), where irrigation was a key component of the green revolution;2 the Americas account for 16 percent and Europe for 8 percent of the world total. As shown in TABLE 5, India (76 million ha) and China (75 million ha) have the largest equipped area for irrigation, far ahead of the United States of America (25 million ha). China and India also have the largest net gains in equipped area between 2000 and 2023 (+21 million ha for China and +15 million ha for India). All the regions saw increases in the area equipped for irrigation, with Africa growing the fastest (+36 percent), followed by Asia (+26 percent), Oceania (+24 percent), the Americas (+16 percent) and Europe (+4 percent).

The share of the area equipped for irrigation in cropland area increased to 22.6 percent in 2023, up 3.2 percentage points compared with 2000 (see FIGURE 8). It increased in all regions except Oceania, with the largest gains located in Asia, as described previously. The higher levels in Asia compared with the rest of the world are partly attributable to the prevalence of irrigation-intensive rice cultivation in the region. As seen in TABLE 3 and 6, Turkmenistan, Egypt and Uzbekistan stand out as countries with both a sizeable cropland area and very high shares of equipped area for irrigation (100 percent, 98.9 percent and 97.1 percent in 2023, respectively); most of their land area is desert with an arid climate. Countries with low shares of equipped area for irrigation are more dependent on rainfed agriculture, which tends to be overall more extensive than irrigated agriculture and is affected by changing rain patterns. On the other hand, irrigated agriculture competes with other uses of the water resources available in countries.

The share of agricultural water withdrawals in total withdrawals is an indication of the relative weight of agricultural water uses compared with industrial and municipal ones. As seen in FIGURE 9, the countries with the highest shares are located mostly in Africa and Asia, with the share of Somalia above 99 percent. One trait shared by most of these countries is the income level: of the top 20 countries, the World Bank classifies seven as low-income, nine as lower-middle-income, three as upper-middle-income, and one as high-income.3 In 2022, the share of agricultural water withdrawals in total withdrawals was greater than 90 percent in 28 countries (see TABLE 7).

The number of people working in agriculture worldwide, including forestry and fishing, went down 11 percent between 2000 and 2023, reaching 916 million in 2023, or 118 million less than in 2000 (see FIGURE 10). Employment in agriculture had declined between 2000 and 2019 (to 873 million). The COVID-19 pandemic reversed this long-term decline, as people went back to rural areas and entered agricultural work, especially in Africa and Asia,4 resulting in an increase of 4 million workers between 2019 and 2020. The increase continued between 2021 and 2023, with 13 million people joining the agricultural workforce each year on average. While employment in agriculture increased overall in Africa, Asia and Oceania between 2019 and 2023, it decreased in the Americas and Europe.

Between 2000 and 2023, agricultural employment has declined from 786 million people to 608 million in Asia: this means that nearly one out of every four agricultural workers has left the sector for another job outside agriculture in the region. During the same period, the biggest drop was observed in Europe, as agricultural employment there decreased by 48 percent, or 16 million people, from 33 million. Also between 2000 and 2023, in Africa, even if the share of employment in agriculture declined (see FIGURE 11), agricultural employment increased to 246 million people in 2023. India and China had the largest number of people working in agriculture in 2023 (246 million people and 167 million people, respectively); together they accounted for 68 percent of agricultural employment in Asia and 45 percent of global agricultural employment in 2023 – even though 20 million people joined the agricultural sector between 2000 and 2023 in India and 177 million left it in China (see TABLE 8).

The share of employment in agriculture, forestry and fishing in total employment declined globally by 13.7 percentage points between 2000 and 2023, to 26.1 percent (see FIGURE 11). Yet, agriculture remains the second largest source of employment worldwide after the services sector.5 A decline in the share of the agricultural sector is usually linked to growing income levels, which explains part of the drop in the share of employment in agriculture across all regions and nearly all countries (see TABLE 9). The COVID-19 pandemic broke this overall declining trend in 2020: while employment dropped in the industry and services sectors due to the pandemic-related restrictions, it increased in agriculture as mentioned previously, resulting in an increase of the share of agricultural employment in all regions except Europe between 2019 and 2020, followed by a decline until 2023. The lowest share of employment in agriculture was observed in Europe in 2023, where only 5.0 percent of the employed population had a job in agriculture. The highest share was observed in Africa with 45.5 percent of the total employed population.
FIGURE 12 shows the 20 countries with the highest shares of women in agricultural employment. While on average women represented 39.7 percent of all agricultural workers in 2023, this share is above 50 percent in 29 countries (see TABLE 10), nearly half of them in Africa. Women and men working in agriculture might have different employment statuses. Generally, the women employed in agriculture are more likely to be engaged as contributing family workers whereas men are more likely to be engaged on their own account as workers generating an income.6 In addition, women often spend more time than men on activities such as food processing and food preparation for the household; child and elder care; water and fuel collection; and other unpaid household duties.7

Agrifood systems encompass all the activities and sectors linked to food and non-food agricultural commodities from production to disposal. Employment in agrifood systems therefore includes employment in agriculture, forestry and fishing (shown in FIGURE 10); food processing and services; and the manufacture of agricultural goods. In 2022, 1.34 billion people worldwide worked in agrifood systems, just 3 percent less than in 2000 (1.37 billion). Employment in agrifood systems declined between 2000 and 2020 (to 1.30 billion); increased by 28 million in 2021; and increased by just 7 million in 2022. Asia accounted for the majority of the agrifood systems workforce (64 percent in 2022), followed by Africa (24 percent), the Americas (8 percent), Europe (4 percent) and Oceania (0.4 percent). Employment in agrifood systems decreased in Asia by 146 million people and in Europe by 25 million people. Conversely, it increased in Africa by 118 million people, in the Americas by 13 million people and in Oceania by 1 million people. The share of agricultural employment in agrifood systems employment varied significantly between the regions: in 2022, it reached 70–73 percent in Africa and Asia compared with 44 percent in Oceania, 41 percent in the Americas and 31 percent in Europe.
Agrifood systems employment represented 39.1 percent of global employment in 2022, down from 52.2 percent in 2000; most of the decline occurred between 2000 and 2015, and the share of agrifood systems employment in total employment has remained stable since 2018. The share declined in all the regions between 2000 and 2022. Throughout the period, Africa had the highest share, with a drop from 70.0 percent in 2000 to 62.8 percent in 2022. The fastest decline occurred in Asia (from 60.4 percent in 2000 to 41.2 percent in 2022), confirming the significant structural change in the labour force of the region. Europe saw a reduction from 23.0 percent in 2000 to 14.2 percent in 2022. The smallest declines were recorded in the Americas (from 26.2 percent to 22.2 percent) and Oceania (from 25.9 percent to 22.5 percent), highlighting the relative stability of agrifood systems employment in these regions.
Capital in the agricultural sector includes machinery, equipment, tools and farm buildings, and is essential in the production of all agricultural outputs. The gross fixed capital formation (GFCF) is an indication of the amounts that are reinvested in new fixed assets that are part of capital.
High-income countries tend to devote a higher share of their agricultural value added to reinvestments in the sector than countries with lower levels of income (see FIGURE 15 and TABLE 15). Latvia (111 percent) and Denmark (75 percent) had the highest shares of GFCF in value added in 2023. The leaders of the Americas, Asia, Oceania and Africa had much lower shares: 39 percent for the United States of America, 37 percent for the Syrian Arab Republic, 33 percent for New Zealand and 27 percent for South Africa.


Government spending on agriculture is a measure of the public financial support to the sector and complements investments made by the private sector. Asia and Africa had the highest percentage of central government spending on agriculture in 2023.8 FIGURE 16 and TABLE 16 reflect this, as most of the countries with the highest shares are in these two regions, with Bhutan (8.9 percent), the United Republic of Tanzania (8.4 percent) and Belarus (7.6 percent) being the top three countries. In the case of Africa, signatories to the Malabo Declaration of 2014 committed to allocate at least 10 percent of government expenditures to agriculture.9

Global pesticide use increased between 2000 and 2023 by 71 percent, to 3.7 million tonnes (see FIGURE 17). Most of this increase took place between 2000 and 2016, which was followed by relative stability until 2020 and then strong growth between 2020 and 2021. The highest contributions came from the Americas, followed by Asia, Europe, Africa and Oceania. The share of the Americas, the largest contributor, increased from 41 percent to 49 percent of global pesticide consumption, while that of Asia and Europe decreased by 5 and 9 percentage points to 28 percent and 12 percent, respectively. Africa and Oceania applied small amounts of pesticides over time, but had the highest growth in pesticide applications (+187 percent and +396 percent, respectively). As shown in TABLE 17, Brazil was the largest pesticide user in 2023 with 0.8 million tonnes, or 21 percent of the world total, far ahead of the United States of America (0.43 million tonnes) and Indonesia (0.29 million tonnes).

Global pesticide use per cropland area went up 37 percent in the 2000s, from 1.5 kg/ha in 2000 to 2.0 kg/ha in 2010; growth then slowed down to just 19 percent between 2010 and 2023 (see FIGURE 18), with some important regional differences. Pesticide application rates in 2023 were highest in Oceania (5.6 kg/ha) and the Americas (5.0 kg/ha) by a wide margin, followed by Asia, Europe and Africa. Asia and Europe were the only regions where pesticide use per cropland area decreased or remained stable between the early 2010s and 2023. Among the top pesticide users in 2023 mentioned previously, Brazil had the largest use per cropland area (12.6 kg/ha), close to five times the value for the United States of America (2.8 kg/ha) and nearly twice the value for Indonesia (6.7 kg/ha) (see TABLE 18).

Total agricultural use of inorganic fertilizers, expressed as the sum of the three nutrients nitrogen (N), phosphorus (expressed as P2O5) and potassium (expressed as K2O), was 190 million tonnes in 2023, up 1 percent compared with 2022. As shown in FIGURE 19, the breakdown was 112 million tonnes of nitrogen (58 percent of the total), 41 million tonnes of phosphorus (21 percent) and 38 million tonnes of potassium (20 percent). Overall fertilizer use in 2023 was 55 million tonnes (41 percent) higher than in 2000 (38 percent higher for nitrogen, 26 percent higher for phosphorus and 73 percent higher for potassium).

Asia represented 56 percent of world total agricultural use of inorganic fertilizers in 2023, followed by the Americas (27 percent), Europe (11 percent), Africa (4 percent) and Oceania (2 percent). This ranking of the regions is the same for all nutrients. The main users of inorganic fertilizers are, in descending order, China, India, the United States of America and Brazil (see TABLE 19), China being the largest user of each nutrient.
Fertilizer use increased in all regions except Europe between 2000 and 2023 (see FIGURE 20). The total for the three nutrients went up 48 percent in Asia, or 35 million tonnes – the largest increase in absolute terms. The fastest increase took place in Africa, with a growth of 82 percent, equivalent to just 3.2 million tonnes, due to the low starting level. In the Americas, fertilizer use increased by 53 percent, or 18 million tonnes, compared with 25 percent (or 1.1 million tonnes) in Oceania. It decreased by 9 percent in Europe (or 1.9 million tonnes); the decline started in 2021 and accelerated in 2022.It decreased by 10 percent in Europe (or 2.1 million tonnes); the decline started in 2021 and accelerated in 2022.

The mix of nutrients varies across the regions. Nitrogen was the dominant nutrient in 2023, accounting for 67 percent of fertilizer use in Europe, 64–65 percent in Africa and Oceania, 61 percent in Asia and half of the total in the Americas. In 2023, the use of phosphorus accounted for 22–23 percent of the total in all the regions except Oceania, where its share was 36 percent, and Europe (15 percent). The share of potassium in fertilizer use was the highest in the Americas with 29 percent, followed by Europe (18 percent), Asia (17 percent), Africa (13 percent) and Oceania (10 percent). The use of phosphorus declined significantly in Oceania between 2000 and 2023 by 39 percent, while in Europe the use of phosphorus and potassium declined over the same period by 24 percent and 22 percent, respectively.
World agricultural use of inorganic fertilizers per cropland area rose by 35 percent between 2000 and 2023 to 116 kg of nutrients per hectare – expressed as the sum of nitrogen, phosphorus and potassium (see FIGURE 21). This corresponds to an increase of 30 kg/ha compared with 2000. Of the total amount, 68 kg/ha correspond to nitrogen (up 32 percent), 26 kg/ha to phosphorus (up 22 percent) and 23 kg/ha to potassium (up 68 percent).

Fertilizer use per cropland area in 2023 was the highest in Asia, at 186 kg/ha, followed by the Americas (128 kg/ha), Oceania (83 kg/ha), Europe (65 kg/ha) and Africa (23 kg/ha), as shown on FIGURE 21 and TABLE 18. With a growth rate of 55 percent between 2000 and 2023, the Americas was the region with the fastest increase in fertilizer use per cropland area, ahead of Asia (+45 percent), Africa (+39 percent) and Oceania (+13 percent). Europe is the only region showing stability.
The global production of primary crops increased by 61 percent between 2000 and 2023 to 9.9 billion tonnes, which is 2.7 percent higher than in 2022 (see FIGURE 22 and TABLE 19). This represents 3.7 billion tonnes more than in 2000. With slightly less than one-third of the total, cereals were the main group of crops produced in 2023, followed by sugar crops (23 percent), vegetables (12 percent) and oil crops (12 percent). Fruit accounted for 10 percent of the total production, and roots and tubers for 9 percent. The increase in production is mainly attributable to a combination of factors outlined in Chapter 1 (increased use of irrigation, pesticides and fertilizers and, to a lesser extent, a larger cultivated area); other factors such as better farming practices10, 11 and the use of high-yield crops12 also play a role.

The value of primary crop production increased at a slightly higher pace in real terms than the quantities produced (52 percent), from USD 2.0 trillion in 2000 to USD 3.0 trillion in 2023. Similarly to the quantities produced, cereals accounted for the largest share in the total production value in 2023 (29 percent). Vegetables and fruit represented 19 percent and 17 percent, respectively, of the total value in 2023, which is significantly higher than the shares in quantities. The shares of oil crops and roots and tubers in the total value were similar to the shares in quantities. Sugar crops represented 3 percent of the total value: such a discrepancy with the share of the quantities produced is mainly due to differences in price compared with fruit and vegetables.
While a multitude of crops are cultivated and harvested around the world, just four individual crops accounted for half the global production of primary crops in 2023: sugar cane (20 percent of the total, with 2.0 billion tonnes), maize (13 percent, with 1.2 billion tonnes), wheat (8 percent, with 0.8 billion tonnes) and rice (8 percent, with 0.8 billion tonnes) – see FIGURE 23. Oil palm fruit and potatoes each accounted for an additional 4 percent (0.4 billion tonnes) of world crop production.

Sugar cane accounted for 21 percent of the global crop production on average over the 2000–2023 period. While maize, wheat and rice each represented 10 percent of the total in 2000, maize production grew 3.1–3.3 times faster than the production of wheat or rice during the 2000–2023 period, surpassing rice in 2001 to become the second-most-produced crop worldwide. As seen in TABLE 21, the Americas was the leading region in the production of sugar cane and maize (50 percent of the world total) in 2023, while Asia led in the production of rice (90 percent), oil palm fruit (87 percent), potatoes (53 percent) and wheat (44 percent).
FIGURE 24 shows that for each main crop commodity, the top three producers, combined, account for a significant share in the world total: 42–46 percent for wheat and potatoes; 59–68 percent for rice, maize and sugar cane; and 86 percent for oil palm fruit in 2023. For each crop, the top producer also has a sizeable share in the global output: in 2023, Brazil accounted for 39 percent of world sugar cane production; the United States of America grew 31 percent of the global production for maize; China (which ranked in the top three producers for five of the six main crop commodities) produced 24–26 percent of the world output of potatoes and rice and 17 percent of the world output of wheat; and 59 percent of oil palm fruit production originated in Indonesia. Such a concentration can have a large impact on prices when harvests are affected – either positively or negatively – in the main producing countries that export part of their production.

Most primary crops can be consumed unprocessed, but oil crops and sugar crops require processing to produce commodities used both as food and fuel. Therefore, they have an impact on nutrition and health, but also on energy and the environment.
The global production of vegetable oils went up 130 percent between 2000 and 2022 to 212 million tonnes in 2022 (see FIGURE 25 and TABLE 22). This is 120 million tonnes more than in 2000, but 3 million tonnes less than the peak observed in 2021. Palm oil registered the largest increase, both absolute and relative, as its production went up 57 million tonnes, or 255 percent; it overtook soybean oil as the main vegetable oil produced in 2006. The use of palm oil for biodiesel explains most of this spectacular growth.13 The other main vegetable oils produced in 2022 were rapeseed oil, accounting for 27 million tonnes (13 percent of global vegetable oil production), and sunflower oil, accounting for 20 million tonnes (10 percent).

As with primary crops, the production of the main vegetable oils is heavily concentrated in a handful of countries (see FIGURE 26). The concentration is highest with palm oil, as 83 percent of global production came from two countries in 2022: Indonesia (59 percent) and Malaysia (23 percent). This mirrors the shares of the top producers of oil palm fruit shown in FIGURE 24. In 2022, the top three producers accounted for 65 percent of the production of soybean oil, 60 percent of the production of sunflower oil and 41 percent of the production of rapeseed oil. China was the main producer of soybean oil, with a share of 29 percent in 2022, and the United States of America was a distant second with a share of 21 percent. The difference between the first and second producer was similar for sunflower oil, as the Russian Federation produced 30 percent of the global oil output in 2022, compared with 23 percent for Ukraine. The output of the top three producers of rapeseed oil in 2022 was roughly the same (around 14 percent of the world total), with Germany slightly ahead of Canada.

The global production of raw sugar reached a record-high 188 million tonnes in 2022, up 42 percent, or 55 million tonnes, compared with 2000 (see FIGURE 27 and TABLE 23). Production went up 7 percent in 2022, largely due to increases by the three largest producers. Sugar cane, the main sugar crop, grows in tropical regions, so the main producing countries are located there. Brazil was the top sugar producer in 2022, accounting for 21 percent of the global total; production went up 12 percent between 2021 and 2022. India remained the second-largest producer (20 percent of the total), with a 9 percent increase in production between 2021 and 2022. Thailand registered a spectacular 76 percent increase in production in 2022, to 13 million tonnes (7 percent of the total). The other main producers each accounted for 3 to 5 percent of the total production in 2022, with the Russian Federation relying only on sugar beet for sugar production.

World meat production reached 370 million tonnes in 2023, up 60 percent, or 138 million tonnes compared with 2000 (see FIGURE 28). Although many species are raised for their meat, only three accounted for nearly 90 percent of the global production between 2000 and 2023: chicken, pig and cattle (not taking into account the different breeds for each). With 34.2 percent of the global production in 2023, chicken meat showed the largest growth in absolute and relative terms since 2000 (+116 percent, or 68 million tonnes) and was the most produced type of meat in 2023. Pig meat represented 33.7 percent of the total in 2023, compared with 38 percent in 2000. African swine fever started affecting Asian countries in late 2018 and continued in 2019 and 2020. It resulted in an 11 million tonne decrease in world pig meat production between 2018 and 2019, with China being hardest hit, and kept constraining production in 2020. The rebound in pig meat production recorded in 2021 (to 121 million tonnes) continued in 2022 (to 123 million tonnes) and 2023 (to 125 million tonnes). The share of cattle meat dropped from 24 percent in 2000 to 19 percent in 2023.

The market concentration of meat production is not as high as that of primary crops and vegetable oils, even though in 2023 the top three producers accounted for 61 percent of world pig meat production, 44 percent of world cattle production and 40 percent of world chicken production (see FIGURE 29 and TABLE 24). China, the United States of America and Brazil are the three largest producers for each main meat type: in particular, China accounted for 47 percent of world pig meat in 2023, and the United States of America produced 18 percent of world cattle meat and 16 percent of world chicken meat. The difference between the two countries is that meat production in China is mostly for the domestic market, whereas a significant share of US meat production (especially in the case of chicken) is exported.14

The global production of bovine milk (cattle and buffalo milk), which accounted for 96 percent of the global milk production in 2023, reached 933 million tonnes in 2023, an increase of 378 million tonnes, or 68 percent, compared with 2000 (see FIGURE 30). Asia was the largest milk-producing region in 2023 with a 46 percent share of the total, ahead of Europe (24 percent), the Americas (21 percent), Africa (5 percent) and Oceania (3 percent). Milk production in Asia went up 170 percent between 2000 and 2023 from 160 million tonnes to 432 million tonnes, mostly due to the increase in production in India (of 155 million tonnes), which was the largest producer with a 25 percent share of the global total in 2023. With an 11 percent share, the United States of America was the second largest producer; the other main producers (Pakistan, China, Brazil, the Russian Federation, Germany and France) each accounted for 3 to 7 percent of the global production. The combined share of the top three milk producers was 43 percent of the total; the share has been steadily increasing since 2000 (see TABLE 25).

In 2023, world hen egg production reached 91 million tonnes, a 77 percent increase from 2000 that translates into an additional 40 million tonnes over the period (see FIGURE 31). Production has been constrained since 2021 as outbreaks of highly pathogenic avian influenza (HPAI) in several countries reduced the number of egg-laying chickens. Asia was by far the main producing region, accounting for 64 percent of the global production in 2023, followed by the Americas (20 percent), Europe (12 percent), Africa (4 percent) and Oceania (0.4 percent). Production growth rates over the 2000–2023 period were around 70 percent for Oceania and the Americas, and nearly 100 percent for Asia and Africa, compared with 15 percent in Europe (see TABLE 26); as a result, its share in the world total dropped from 18 percent to 12 percent. With 34 percent of the total, China ranked as the largest hen-egg-producing country; the other main producers (India, the United States of America, Indonesia, Brazil, Mexico, Japan and the Russian Federation) combined barely surpassed it. Together, the top three producers accounted for nearly half the global hen egg production in 2023.

Excluding algae, world fisheries and aquaculture production grew by 50 percent between 2000 and 2023, reaching 189 million tonnes in 2023 and setting a new record following years of steady growth since 2020. This represents an overall expansion of 63 million tonnes compared with 2000. Global fisheries and aquaculture production (excluding algae) went up 2.1 percent between 2022 and 2023, compared with 1.4 percent between 2021 and 2022 and 3.0 percent between 2020 and 2021.
Thousands of species are harvested every year, with the quantities and specific species varying from country to country. Finfish (freshwater, diadromous and marine fish) had a share of 75 percent of the total in 2023, a slight decline compared with 79 percent in 2000. With 36 percent of the total, marine fish were the main group of species produced in 2023, followed by freshwater fish (34 percent), molluscs (14 percent) and crustaceans (11 percent) – see TABLE 27. Thanks to the expansion of aquaculture production, freshwater fish experienced major growth (+164 percent) between 2000 and 2023, going from about 25 million tonnes in 2000 (19 percent of the total) to 65 million tonnes in 2023 (34 percent of the total). Crustaceans (+154 percent) and diadromous fish (+112 percent). also experienced major increases.
The significant expansion of fisheries and aquaculture production came with many transformations, including an increasing dependence on aquaculture. In the last three decades, aquaculture has been the main driver of the increase in fisheries and aquaculture production, with an average growth of 5 percent per year between 2000 and 2023, reaching a record 98.5 million tonnes in 2023 and surpassing capture production in 2022. At the global level, after several decades of sustained growth, capture fisheries production has been rather stable at around 90 million tonnes since the early 1990s, with some interannual fluctuations in the range of 3 to 6 million tonnes. These fluctuations have been mainly due to variations in catches of anchoveta in South America, particularly affected by climatic change variability, but they also depend on the productivity of ecosystems, fishing intensity management, and fish stock status. In 2023, capture fisheries production reached 90.4 million tonnes (down from its 2018 peak of 96.4 million tonnes) representing 48 percent of total fisheries and aquaculture production, while aquaculture accounted for 52 percent of the global total. The share of aquaculture in total production in 2023 varied significantly across continents, going from 65 percent in Asia to 24 percent in the Americas, 20 percent in Europe, 18 percent in Africa and 13 percent in Oceania.


As seen in TABLE 28, Asia played a major role in the overall growth of fisheries and aquaculture production and represented 72 percent of total production in 2023 compared with 57 percent in 2000. In 2023, the Americas had a share of 11 percent, followed by Europe (9 percent), Africa (7 percent) and Oceania (1 percent). China is by far the main producer for both capture fisheries and aquaculture, with a 37 percent share of the total production in 2023, compared with 30 percent in 2000. In 2023, other major producers for both capture fisheries and aquaculture were India and Indonesia; these three countries together represented 53 percent of total fisheries and aquaculture production. The overall share of the top three producers was 73 percent of aquaculture and 31 percent of capture fisheries in 2023. Despite this concentration of production, aquaculture has experienced growth across the world, with the unequal rates reflecting differences in local policy, management objectives, site opportunities and environmental factors.
In addition, 39.0 million tonnes of algae were produced in 2023, the bulk of which (97 percent) originated from culture-based practices. If algae are included, overall fisheries and aquaculture production reached 228 million tonnes in 2023, with aquaculture representing 60 percent of the total.
Global production of roundwood rose from 3.5 billion m3 in 2000 to 3.9 billion m3 in 2023, which represents a 12.0 percent increase over the 2000–2023 period and a 2.3 percent decrease compared with 2022 (see FIGURE 35). In 2023, wood fuel was the main product, with a 50 percent share (2 billion m3) of the total, followed by coniferous industrial roundwood with 28 percent (1.1 billion m3), and non-coniferous industrial roundwood with 22 percent (0.9 billion m3). The rebound has remained robust after the decline in coniferous industrial roundwood production in 2009, which resulted in the lowest total roundwood production since 2000. As seen in TABLE 29, Asia and the Americas are the two main producing regions, each accounting for 28–29 percent of the total roundwood production. Africa and Europe each contribute 19–21 percent, while Oceania produces the remaining 2 percent.

The total share of the combined three main producers of roundwood commodities in 2023 was roughly 30 percent for wood fuel, 40 percent for non-coniferous industrial roundwood, and 50 percent for coniferous industrial roundwood (see FIGURE 36).

Many lower- and middle-income countries rely on wood for energy purposes (especially cooking). The largest producers are all in these income groups and have large populations with a high reliance on wood for energy: in 2023, India ranked first with 298 million m3 (15 percent of total production), followed by China with 148 million m3 and Brazil with 132 million m3 (respectively 8 percent and 7 percent of global production). TABLE 29 shows that five African countries are included in the top ten: these are, in descending order, Ethiopia, the Democratic Republic of the Congo, Nigeria, Ghana and Uganda.
The main industrial roundwood producers are all countries with a large forest area and a well-established logging industry. In the case of coniferous industrial roundwood, the top producers in 2023 were the United States of America, with a production of 274 million m3 (26 percent of the total production), followed by the Russian Federation with 142 million m3 (13 percent) and Canada with 105 million m3 (10 percent). China led the production of non-coniferous industrial roundwood in 2023, with 141 million m3 (17 percent of the global production), followed by Brazil (138 million m3, or 16 percent) and Indonesia (74 million m3, or 9 percent).
Most of the main wood products saw their production decline in 2023 (see FIGURE 37 and TABLE 30). The production of paper and paperboard was down by 3 percent compared with 2022, and by 4 percent from its 2021 peak to 419 million tonnes. Recovered paper production also fell by 3 percent, with a production of 232 million tonnes in 2023. The pandemic contributed to changes in paper demand and production. Many activities such as education and news consumption were curtailed or moved online, reducing the demand for graphic papers; however, the increase in online shopping and shipping contributed to an increase in the demand and production of other paper and paperboard. In total, between 2000 and 2023, paper and paperboard increased by 24 percent and recovered paper by 62 percent. Wood pulp production decreased by 2 percent to 193 million tonnes in 2022 compared with 2021 (but went up 13 percent compared with 2000). The production of wood charcoal reached 59 million tonnes in 2022, up 60 percent from the 2000 level. Wood pellets, briquettes and other agglomerates, for which data collection started in 2012, show steady growth with a production of 51 million tonnes in 2023, an increase of 140 percent since the 21 million tonnes produced in 2012. World production of sawnwood made a strong recovery from its low point in 2009 and, after the 2021 rebound, decreased for two years in a row to 445 million m3 in 2023, up 13 percent compared with 2000. The production of wood-based panels, which had grown steadily between 2009 and 2019 and peaked in 2021, dropped by 3 percent in 2022 but went up 1.4 percent in 2023. The 381 million m3 produced in 2023 represent a 114 percent increase from the 2000 production.

The monetary value of global food exports remained stable between 2022 and 2023 but multiplied by 4.7 in nominal terms between 2000 and 2023, from USD 380 billion in 2000 to USD 1.8 trillion in 2023, with significant increases in all food commodity groups, especially fats and oils (see FIGURE 38). Fruit and vegetables accounted for 19 percent of the total value of food exports in 2023, followed by cereals and preparations (15 percent). Meat and aquatic animal foods each had a share of 10 percent. As seen in TABLE 31, the United States of America was the largest food exporter in 2023 with 8 percent of the total, followed by Brazil (7 percent) and the Kingdom of the Netherlands (6 percent).

In terms of food net trade, defined as the nominal value of exports minus that of imports, two regions stand out: the Americas as the largest net exporter, with a USD 148 billion surplus in 2023, and Asia as the largest net importer, with a USD 281 billion deficit in 2023 (see FIGURE 39). Oceania remained a net exporter of food during the 2000–2023 period and Africa a net importer. Europe was a net importer of food during most of the period but became a net exporter in 2013 and briefly overtook Oceania in 2020 and 2021; notably, its food net trade fell by 33 percent between 2021 and 2022 and remained relatively stable between 2022 and 2023. As seen in TABLE 32, the largest net exporting countries in 2023 are Brazil (+USD 115 billion), the Kingdom of the Netherlands (+USD 29 billion) and Australia (+USD 27 billion). As shown in TABLE 31, Brazil derives a large share of its food exports from soybeans (included in the “Other food” category); the Kingdom of the Netherlands from fruit and vegetables; and Australia from cereals. The largest net importing countries are China (−USD 161 billion), the United States of America (−USD 56 billion) and Japan (−USD 55 billion). TABLE 33 shows that fruit and vegetables account for the largest share of China’s and the United States of America’s food imports, while meat is Japan’s main food import.

Trade flows vary considerably between regions and commodity groups (see FIGURE 40). The largest individual flows are observed for Europe; in 2023, it imported USD 158 billion worth of fruit and vegetables and exported USD 124 billion worth of cereals and USD 121 billion worth of fruit and vegetables. Asia was the top importing region for cereals and preparations, fats and oils, and sugar and honey. For aquatic animal foods, beverages, dairy and eggs, fruit and vegetables, and meat and meat preparations, the main importer was Europe. For all commodity groups but two, Europe was the main exporter; Asia led for fats and oils, and the Americas led for sugar and honey. Cereals and preparations is the commodity group with the largest net trade deficit (USD 63 billion, for Asia) and the largest surplus (USD 36 billion, for Europe). In 2023, Asia was a net importer of all commodity groups except aquatic animal foods (even though the surplus for this group was marginal), and Africa was a net importer of all commodity groups except aquatic animal foods and fruit and vegetables. Oceania was a net exporter of all commodity groups in 2023. The Americas and Europe were net exporters of most groups, but each had significant net imports in one category: the Americas had a deficit of USD 18 billion for beverages and Europe had one of USD 37 billion for fruit and vegetables.

Looking at the quantities instead of the values traded gives a vastly different picture. In that case, cereals are by a wide margin the most traded commodity group, with exports reaching 505 million tonnes in 2023 (see FIGURE 41 and TABLE 34). This is 244 million tonnes, or 94 percent, more than in 2000. In 2023, wheat was the most exported cereal (39.4 percent), ahead of maize (39.2 percent). Together with rice (10 percent), these three crops accounted for 89 percent of all cereal exports in 2023, with the exports of maize and rice growing much faster (+140 percent and +124 percent, respectively) than those of wheat (+70 percent) since 2000.

For each of the main traded cereals, exports tend to originate from a few countries, while imports are more dispersed (see FIGURE 42).15 In 2023, the top three exporters accounted for significant shares of the total exports: 65 percent for maize, 64 percent for rice and 43 percent for wheat. In comparison, the top three importers accounted for 18 percent of the total imports for wheat and rice, and 34 percent for maize. The main producers tend to also feature among the main exporters. China stands out as an exception, as a major producing country focusing on domestic demand since its exports are fairly small compared with its production (see TABLE 21 and TABLE 34); it is also the largest importer of maize and wheat, and the third largest importer of rice.

After two years of growth (+26 percent in 2021 and +5 percent in 2022), the nominal value of global forest products exports fell by 12 percent in 2023 to USD 483 billion. This represents an increase of USD 256 billion, or 113 percent, compared with 2000 (see FIGURE 43 and TABLE 36). With 28 percent of the total value, secondary processed wood products was the most traded commodity in 2023, and its share increased from 22 percent in 2000. Paper and paperboard accounted for 21 percent of the total value, compared with 31 percent in 2000. Secondary processed paper products represented 18 percent of the value of forestry exports in 2023, up from 14 percent in 2000. Wood pulp, wood-based panels and sawnwood each represented 8–9 percent of the total in 2023; their shares have remained rather stable since 2000.

The recent addition to FAOSTAT of trade data on secondary processed wood and paper products significantly improves the coverage of the information provided by the Food and Agriculture Organization of the United Nations (FAO). Since 2000, these products have accounted for an increasing share of forestry products trade.
Secondary processed wood products include wooden furniture, builder’s joinery and carpentry of wood, and other manufactured wood products. Their exports went up 170 percent between 2000 and 2023, to USD 133 billion. Wooden furniture accounted for most of the value of the exports of this group of products. The main secondary processed paper products are packaging cartons and boxes, household and sanitary paper, and other articles of paper and paperboard. The export value of secondary processed paper products increased by 166 percent between 2000 and 2023, to USD 87 billion. Primary wood and paper products exports grew at a slower rate, by 81 percent during the same period, to USD 263 billion. As a result, their share in the total exports of forestry products fell from 64 percent in 2000 to 55 percent in 2023.

The Food and Agriculture Organization of the United Nations (FAO) Food Price Index measures the monthly change in international prices of a basket of food commodities. The index consists of the average of five commodity group price indices (cereals, dairy, meat, oils and sugar), weighted with the average export shares of each of the groups for the 2014–2016 period. Since January 2000, it went up 77.3 points to 130.1 points in August 2025 (see FIGURE 44 and TABLE 37). The FAO Food Price Index spiked in 2007/2008 during the food security crisis that saw the price of cereals reach record levels, especially rice and wheat. Food prices soared again in late 2010 and early 2011 (especially sugar and dairy). Overall, the period of sustained high prices lasted much longer than in the previous commodity price booms and busts with the return to the pre-surge price levels five years later in January 2016. The FAO Food Price Index declined during the early phase of the pandemic, reflecting uncertainties faced by commodity markets. However, it surged between May 2020 and March 2022 to 160.2 points, its highest value ever, due to a combination of factors including the effects of the COVID-19 pandemic on the supply chains; the rebound in activity and demand experienced in 2021; and the disruption to exports of cereals and vegetable oils from the Russian Federation and Ukraine. The FAO Food Price Index then declined sharply between June 2022 and July 2022 – to a level close to that of February 2022 – and then more slowly, to 117.4 points in February 2024. Since then, it has gradually climbed back up to the level of early 2023.

An important factor to note is that the overall trend of the FAO Food Price Index can mask a wide discrepancy of movements across sectors, as shown in FIGURE 45. The market fundamentals of supply and demand, as well as exchange rate dynamics, drive the evolution of international prices. The indices for meat and dairy show the largest increases since the beginning of 2022. The indices for cereals and oils peaked in the first half of 2022, as the war in Ukraine reduced the exports from the Russian Federation and Ukraine, both key exporters of wheat and sunflower oil. The resumption of Ukrainian exports and better production prospects contributed to the drop in the indices. While this drop continued until August 2025 for cereals, between February 2024 and August 2025 the oils index progressively returned to the level of July 2022. The index for sugar remained on a high plateau between April and November 2023, fell sharply in December 2023, and was on an overall declining trend until August 2025, with a short-lived increase in September and October 2024.

The FAO Fish Price Index measures the monthly changes in international prices of a basket of fisheries and aquaculture commodities. The index consists of the average of five commodity group price indices (whitefish, salmon, tuna, other pelagic fish and shrimps) weighted by the average export shares of each of the groups for the 2014–2016 period. Since January 2000, it went up from 65.5 to 109.8 points in August 2025. However, it did not grow gradually over time but showed several periods of expansion and contraction (see FIGURE 46). Being an average, the index masks wide differences among species and across the aquaculture and capture fisheries sector, in addition to the dynamics of supply and demand and exchange rates. Over the first eight months of 2025, the subindex associated with salmon prices experienced a strong decrease compared with the same period in 2024, while all the other subindices were up.

At the country level, changes in domestic prices received by agricultural producers varied between −6 percent (in Botswana) and +32 percent (in Malaysia) in 2024 compared with 2023 (see FIGURE 47 and TABLE 38). The largest increases took place in Europe and Asia. Many factors can affect producer prices, including favourable or poor harvests compared with the previous year, production costs, market structure, subsidy schemes and external factors – as is the case, for instance, of economic sanctions against the Islamic Republic of Iran in 2018. The characteristics of the food supply chain (including the transformation of goods and the incorporation of services along the chain) play a key role in shaping the transmission of price shocks between producers and consumers. They can explain different rates of change in producer prices compared with consumer prices.

Food consumer price inflation fell sharply in all regions following the historically high levels reached in December 2022–January 2023, returning during the second half of 2024 to values similar to or lower than those observed in 2021. Food inflation then started to rise again, slowly in the case of the world average (it rose more rapidly in the case of Europe but remained stable in the other regions until June 2025) – see FIGURE 48. The world average fluctuated around 2.8 percent between January 2018 and July 2021, peaking at 4.0 percent at the beginning of the COVID-19 pandemic in April 2020. It then increased steeply from 1.7 percent in April 2021 to 13.1 percent in February 2023 due to higher demand (as the global economy bounced back from the pandemic) combined with persisting supply chain disruptions exacerbated by the war in Ukraine. Some of these tensions have eased and demand has slowed down as central banks around the world raised their interest rates, leading the world average to fall to 3.0 percent in September 2024. However, it started to slowly rise again, reaching 4.2 percent in June 2025. The food inflation rate in Europe experienced the largest increase among all regions, from nearly zero in early 2021 to 17.6 percent in March 2023; it then fell to 1.4 percent in June 2024 but increased again, to 4.9 percent in June 2025. The trajectories observed in Oceania, the Americas and Africa are similar, as food inflation in these regions accelerated in 2022 to reach record-high levels of around 12–15 percent between November 2022 and March 2023. It decreased until mid- to late 2024 and then stabilized. The trend in Asia is different, as food inflation rose to 7.9 percent in May 2022, fell to 4.3 percent in May 2023, and then alternated between short periods of increase and decrease, falling to 2.7 percent in June 2025.

After a decades-long decline and five years of relative stability since 2014, updated global estimates of the prevalence of undernourishment (PoU) – Sustainable Development Goal (SDG) Indicator 2.1.1 – showed signs of a decrease in recent years after increasing sharply in 2020 and more slowly in 2021 (see FIGURE 49 and TABLE 40). Hunger affected 8.2 percent of the world population in 2024, which is far above the pre-COVID-19 pandemic level of 7.5 percent estimated for 2019. The PoU is highest in Africa and increased marginally in 2024 to 20.2 percent. From 2023 to 2024, the PoU declined significantly in Asia (to 6.7 percent, driven by improvements in Southern and South-eastern Asia) and marginally in Latin America and the Caribbean (to 5.1 percent) and Oceania (to 7.6 percent), following steep increases from 2019 to 2021. This points to encouraging progress, although the PoU in Asia remained the second highest among all regions.

Between 638 million and 720 million people in the world faced hunger in 2024. Considering the point estimate (almost 673 million) this indicates a decrease of 15 million people compared with 2023 and 22 million people compared with 2022, but an increase of 53 million people compared to 2019 (see FIGURE 50). While its PoU is the second highest, Asia is home to 48 percent of the world’s undernourished people due to its large population base, and two of the three countries with the largest number of undernourished people are in Asia (see TABLE 41). Nevertheless, the number of people facing hunger in Asia declined by 24 million since 2023 and 52 million since 2022. In Africa, nearly 307 million people were undernourished in 2024 (46 percent of the global total), an increase of 10 million people since 2023 and 34 million from 2022. By contrast, the undernourished population in Latin America and the Caribbean decreased by 2 million between 2022 and 2023, and by 1.5 million between 2023 and 2024, to 33.6 million. The number of people facing hunger in Oceania increased by 0.1 million people between 2022 and 2023, and remained stable in 2024, at 3.5 million.

In 2024, 10.1 percent of the world population (828.0 million people) was affected by severe food insecurity based on the Food Insecurity Experience Scale (FIES) (see FIGURE 51). The levels and trends are broadly consistent with those of the PoU, confirming that these two indicators complement each other as they both measure the extent of severe food deprivation. The prevalence of moderate or severe food insecurity (SDG Indicator 2.1.2) goes beyond hunger; it provides information on people who do not have regular access to nutritious and sufficient food, even if they may not necessarily be suffering from hunger. In 2024, an estimated 28.0 percent of the world population, or 2.28 billion people, has experienced food insecurity at moderate or severe levels.

Similar to the PoU, moderate or severe food insecurity experienced a steep increase between 2019 and 2020 (greater than that of the previous five years combined) and has declined very gradually since 2021.16 As seen in FIGURE 51, moderate or severe food insecurity is much higher in Africa than in any other part of the world, affecting 58.9 percent of the population in 2024. This is followed by Oceania (26.3 percent), Latin America and the Caribbean (25.2 percent), Asia (23.3 percent) and Northern America and Europe (8.1 percent).
FIES data collected by FAO since 2014 in more than 140 countries at the individual (rather than household) level provide a unique opportunity to produce gender-disaggregated estimates for the prevalence of food insecurity in the adult population. In Asia, Latin America and the Caribbean, Northern America and Europe, and in the world as a whole, the prevalence of severe food insecurity and of moderate or severe food insecurity is slightly higher in adult women than in adult men – the differences being statistically significant (FIGURE 52).

The largest differences are found in Latin America and the Caribbean (1.3 percentage points for severe food insecurity and 5.3 percentage points for moderate or severe food insecurity). This gender gap, which had widened considerably in the world and most regions in the wake of the COVID-19 pandemic (and most notably in 2021), narrowed in 2022 and 2023 but widened again in 2024.
As the FIES data collected starting in 2022 were georeferenced, the prevalence of food insecurity in the adult population can also be disaggregated by Degree of Urbanization (DEGURBA) between rural, peri-urban and urban areas. At the global level, food security improves as the degree of urbanization increases: in 2024, moderate or severe food insecurity affected 32.0 percent of adults living in rural areas compared with 28.6 percent in peri-urban areas and 23.9 percent in urban areas.17
The cost of a healthy diet links food security aspects with nutrition outcomes. It is an estimate of the average minimum cost of acquiring a healthy diet in a country. Such a diet is defined as being composed of a variety of foods and food groups; adequate in essential nutrients and bioactive compounds important for health; balanced across macronutrients; and moderate in dietary components that are detrimental to health if consumed in excess.
The global average cost of a healthy diet steadily increased between 2017 (when estimates started to be calculated) and 2024, from 3.14 purchasing power parity (PPP) dollars per person per day to 4.46 PPP dollars. In 2024, the cost of a healthy diet was highest in Latin America and the Caribbean (5.16 PPP dollars), followed by Asia (4.43 PPP dollars), Africa (4.41 PPP dollars), Northern America and Europe (4.02 PPP dollars) and Oceania (3.86 PPP dollars) (FIGURE 53). It increased by 38–45 percent in all regions between 2017 and 2024, with the largest yearly increases observed between 2021 and 2022, when inflation rose to record levels in all regions, and between 2022 and 2023, when inflation started to recede.

The decrease in the proportion of the world population unable to afford a healthy diet, which started in 2021, continued in 2024 even though food prices in general and the cost of a healthy diet increased. In 2024, 31.9 percent of the global population could not afford a healthy diet, compared to 36.9 percent in 2020 and 38.4 percent in 2017. In 2024, unaffordability was the highest in Africa (66.6 percent), and much lower in Asia (28.1 percent), Latin America and the Caribbean (27.4 percent), Oceania (19.6 percent) and Northern America and Europe (5.0 percent). The recent trends differed significantly between regions: unaffordability increased in Africa between 2022 and 2024 by 1.8 percentage points; decreased significantly in Asia (by 3.4 percentage points); and decreased marginally in Latin America and the Caribbean, Northern America and Europe, and Oceania (by 0.3–0.5 percentage point).

The number of people unable to afford a healthy diet in the world fell from 2.93 billion in 2017 to 2.60 billion in 2024 (FIGURE 55). While the COVID-19 pandemic offset most of the progress made between 2017 and 2019 the economic recovery from the pandemic put healthy diets within reach of 165 million more people in 2021, and 142 million people between 2021 and 2024. More than half of the people unable to afford a healthy diet in 2024 (52 percent) lived in Asia, even though the region recorded the largest absolute decrease since 2017 (–477 million people). In contrast, the number of people unable to afford a healthy diet increased in Africa to 1.01 billion in 2024 (39 percent of the total compared with 29 percent in 2017). Latin America and the Caribbean saw a marginal decrease from 2017, to 182 million in 2024 (7 percent of the total). The largest relative decrease between 2017 and 2024 was observed in Northern America and Europe (–30 percent), to 56 million people, while the largest relative increase took place in Oceania (+38 percent, to 9 million).

The world average dietary energy supply (DES), a measure of food availability expressed in calories per capita per day, has been increasing steadily to 3 016 kcal per person per day in 2023, up 7 percent compared with 2010 (see FIGURE 56). This is the first time it is above the threshold of 3 000 kcal per person per day. In 2023, the DES was the highest in Europe and the Americas at 3 490 kcal per person per day and 3 438 kcal per person per day, respectively. Oceania had the third-largest DES in 2023 (3 137 kcal per person per day). The fastest increase took place in Asia, where the DES went up 11 percent since 2010 to 2 991 kcal per person per day. The DES in Africa was the lowest among all regions throughout the 2010–2023 period and remained mostly flat, with an increase of just 0.3 percent between 2010 and 2023 to 2 556 kcal per person per day. The discrepancies between countries and within regions can be significant: the United States of America had the highest DES in 2023 (3 947 kcal per person per day), 2.2 times that of Yemen (1 811 kcal per person per day), which had the lowest DES in the world, and twice that of Haiti (1 959 kcal per person per day), which had the lowest DES in the Americas.

Given the importance of cereals as staple foods worldwide (see FIGURE 58) and the discrepancy between consumption and production in many countries, a measure of food security is the cereal imports dependency ratio, defined as the net trade of cereals (imports minus exports) divided by the total cereal supply in a country (the country’s own production plus the imports minus the exports). Among the most cereal import-dependent countries in the period from 2021 to 2023 are small island developing states18 and countries in the Near East, where the natural conditions are not favourable to cereal production (see FIGURE 57 and TABLE 48).


The composition of the dietary energy supply, detailed in food balance sheets, varies greatly between the regions, with some evolutions between 2010 and 2023 (see FIGURE 58 and TABLE 49). Cereals were the most important contributor to the dietary energy supply in all regions (even though their share decreased for the world as a whole and for most regions), with shares in 2023 ranging from 23 percent in Oceania to 48 percent in Asia. Oilcrops, fats and oils was the second major food group in all the regions except Africa, and their share in the total dietary energy supply increased in all regions except Oceania. Regional specificities include the high share of roots, tubers and pulses in Africa (20 percent versus 8 percent for the world), of sugar in the Americas (13 percent versus 8 percent for the world), and of oilcrops, fats and oils in Oceania, the Americas and Europe (20 percent versus 15 percent for the world). Between 2010 and 2023, the most visible changes in the composition of the food supply took place in Asia (where the share of cereals dropped by 5 percentage points while that of oilcrops, fats and oils, fruit and vegetables, and dairy and eggs increased by 1–2 percentage points).
The average protein supply increased in the world and most regions between 2010 and 2023 (see FIGURE 59 and TABLE 50). The growth in Asia (16 percent) was much faster than the world average growth of 9 percent; the Americas and Europe grew by 6 percent and 4 percent, respectively, while declines were observed in Africa (−1 percent) and Oceania (−4 percent). As a consequence of the increased share of meat, fish and seafood, and dairy and eggs in diets shown in FIGURE 58, the share of protein from animal origin went up across all regions except Africa (where it declined marginally) and Oceania (where it decreased by 4 percentage points). In 2023, the share of protein from animal origin was highest in the Americas (62 percent) and lowest in Africa (23 percent). Significant disparities also prevailed between regions in terms of levels and composition. Protein supply was highest in Europe in 2023, with 113 g per person per day compared with 65 g per person per day for Africa; the primary reason for this is the difference in the availability of protein from animal-sourced foods. In 2023, plants were the main source of protein in Africa (77 percent) and Asia (63 percent) but accounted for 38–39 percent in the Americas, Europe and Oceania.

The average dietary supply adequacy has been increasing steadily since the early 2000s in every region, with Northern America and Europe being the highest and Africa being the lowest (see FIGURE 60). In recent years, the average dietary supply adequacy in Africa remained unchanged in line with the trend of the dietary energy supply in the region (see FIGURE 56).

Dietary supply adequacy divides a country’s average supply of calories for food consumption by the average dietary energy requirement estimated for its population, to measure the adequacy of food supply in terms of calories. Analysed together with the prevalence of undernourishment, it helps identify the cause of undernourishment as mainly due to insufficient food supply or to particularly bad distribution.
The prevalence of stunting among children under five years of age (as well as the number of stunted children) decreased worldwide from 33.1 percent in 2000 to 26.4 percent in 2012 and 23.2 percent in 2024 (see FIGURE 61). All regions except Oceania excluding Australia and New Zealand show the same declining trend, with a deceleration after 2012 and even a small increase after 2021. The largest drop took place in Asia, from 37 percent in 2000 to 28.4 percent in 2012 and 23.3 percent in 2024. However, this global progress may have disguised a worse situation in some parts of the world. As seen in TABLE 52, the prevalence of child stunting was greater than or equal to 30 percent in 26 countries in 2024 (the majority in sub-Saharan Africa), which is “very high” according to the World Health Organization.

Obesity among adults of 18 years and above increased rapidly in every region of the world between 2000 and 2022 (see FIGURE 62). In 2022, 15.8 percent of the adult population in the world was obese, an increase from 8.7 percent in 2000. Latin America and the Caribbean and Oceania had the highest prevalence of adult obesity in 2022 (both at around 30 percent), followed by Northern America and Europe. The prevalence of adult obesity in Africa was slightly above the world average. Although Asia was the only region below the world average, the prevalence of adult obesity nearly tripled between 2000 and 2022. Overall, the world is not on track to meet the 2030 global target to halt the rise in obesity.

The 20 countries with the highest prevalence of obesity among adults in 2022 were mostly in the Pacific Islands, the Caribbean, and the Near East and North Africa. In Tonga (71.7 percent), Nauru (69.9 percent), Tuvalu (64.2 percent) and Samoa (62.4 percent), 60 percent or more of the adult population is obese. While the prevalence of adult obesity in the United States of America is the thirteenth-largest in the world (42.0 percent), the country is home to the largest number of obese adults due to its large population, accounting for one-eighth of the global total.19 For many countries shown in FIGURE 63, multiple forms of malnutrition coexist: in the Marshall Islands, for example, the prevalence of child stunting was 30.0 percent in 2024 (see TABLE 52), while the prevalence of adult obesity was 45.9 percent in 2022 (see TABLE 53).

The United Nations Statistical Commission officially endorsed in March 2025 a new indicator for monitoring progress towards Target 2.2 of the Sustainable Development Goals (SDGs): the prevalence of minimum dietary diversity (MDD). This adds a measure of the quality of diets to the SDG indicator framework and supports national and regional strategies for enhancing nutrition and health outcomes through diet-related interventions. Minimum dietary diversity captures the diversity of diets of children aged 6 to 23 months (MDD-C, under the custodianship of the United Nations Children’s Fund) and women aged 15 to 49 years (MDD-W, under the custodianship of the Food and Agriculture Organization of the United Nations) – through a simple count of the number of food groups consumed the previous day against a predefined list.
Globally, 65 percent of women aged 15 to 49 years and 34 percent of children aged 6 to 23 months achieved minimum dietary diversity, with stark differences between regions. Less than half of women in Africa (48 percent) achieved MDD-W, compared with 66 percent in Asia, and 79 percent in Latin America and the Caribbean and in Europe; less than 25 percent of children in Africa, and one-third of children in Oceania excluding Australia and New Zealand achieved MDD-C, compared with 62 percent in Latin America and the Caribbean. In other words, one-third of women and two-thirds of children aged 6 to 23 months in the world consumed diets that were not sufficiently diverse, putting them at risk of inadequate intake of essential vitamins and minerals required for good nutrition and health.


FIGURE 64 shows that the global shares of the three different types of land (agricultural, forest and other) in total land area remained relatively stable from 2000 to 2023 with slight reductions in agricultural land and forest land shares that translated into declines of 74 million ha for agricultural land and 114 million ha for forest land. Europe has the largest share of forest land (46 percent in 2023), closely followed by the Americas (41 percent), while the other regions are all around 20–22 percent. More than half of all land (53 percent) in Asia is agricultural land, compared with 44 percent in Oceania, 39 percent in Africa, 30 percent in the Americas and 21 percent in Europe. The conversion of land from one use to another also varied between the regions. Oceania had agricultural land converted to other land. Both Africa and the Americas converted forest land to agricultural land or other land. Europe, Asia and Oceania experienced forest land expansion coupled with agricultural land reduction from 2000 to 2023 (see TABLE 54).

Countries with the highest share of forest area in land area are located in all regions of the world, but mostly in tropical regions; they also tend to be low- and middle-income countries (see FIGURE 65). In 2023, forest covered 94 percent of the land area in Suriname, 92 percent in the Federated States of Micronesia and 91 percent in Gabon. The biggest increases in the share of forest area between 2000 and 2023 took place in Viet Nam (+10 percentage points), Cuba (+9 percentage points) and Fiji (+8 percentage points), while the largest decreases in the share of forest area over the same period happened in Paraguay and Nicaragua (−19 percentage points each), and Cambodia (−18 percentage points), as featured in TABLE 55. In absolute terms, the top country for afforestation was China, with an additional 49 million ha of forest between 2000 and 2023; deforestation was highest in Brazil, as 58 million ha of forest were lost there between 2000 and 2023 (see TABLE 54).

The global harvested area of primary crops went up 26 percent between 2000 and 2023 to 1.49 billion ha (see FIGURE 66). Cereals accounted for more than half the world’s harvested area during the period, even though their share declined to 50 percent in 2023 (see TABLE 56). Oil crops covered 24 percent of the global harvested area and experienced the fastest growth in both absolute terms (+127 million ha) and relative terms (+57 percent). The other main crop groups each account for less than 5 percent of the global harvested area. The overall harvested area went up 1 percent between 2022 and 2023.

One visible aspect of the efforts to make the agricultural sector more sustainable is the rise of organic agriculture, the main feature of which is its avoidance of synthetic fertilizers and pesticides.20 In 2023, the agriculture area under certified organic status or in conversion to organic was 99 million ha. Australia accounted for 54 percent of the total, followed by India (5 percent), Argentina and Uruguay (4 percent each). The eight countries with the largest organic agriculture area made up 78 percent of the global area under organic agriculture (see FIGURE 67 and TABLE 57).

Considering the share of agriculture area under certified organic or in conversion to organic in the agricultural land area allows for comparison of the importance that countries give to this aspect of sustainable agriculture. FIGURE 68 shows countries with a sizeable agriculture area; the countries with the highest share of area under organic agriculture in total agriculture area in 2023 were Austria (27 percent), Uruguay (25 percent) and Italy (19 percent). Fifteen of the top 20 countries are in Europe, highlighting that the region has emphasized the importance of organic agriculture. In other regions, the balance between conventional versus organic farming is still tilted towards the conventional (see TABLE 58).

The Food and Agriculture Organization of the United Nations (FAO) is the leading agency in charge of promoting the decennial World Programme for the Census of Agriculture (WCA) around the globe. The WCA 2030, the round currently under preparation, will mark the centennial of the first WCA guidelines launched for the 1930 census round. Updated guidelines will provide the basis for the implementation of agricultural censuses in Member Nations between 2026 and 2035, and the structural data collected will be made available on the FAOSTAT data platform.
One of the main structural variables collected through a census of agriculture is the number of agricultural holdings (farms). Asian countries tend to have the largest number of agricultural holdings due to the size of their population and agricultural land, and the importance of the agricultural sector in their economies. Six of the top eight countries for this metric were in Asia in the 2010 and 2020 rounds: China (209.5 million), India (146.5 million), Indonesia (26.1 million in the 2010 round), the Russian Federation (23.8 million), Bangladesh (15.9 million), Ethiopia (10.8 million in the 2000 round), Viet Nam (9.2 million) and Pakistan (8.3 million in the 2010 round). The number of holdings continued its upward trend in China, India, the Russian Federation and Bangladesh between the 2010 and the 2020 rounds.

Water stress, defined as the share of freshwater withdrawal in available freshwater resources, after taking into account environmental water requirements, affects predominantly Western and Central Asia as well as Northern Africa (see FIGURE 69 and TABLE 59). The countries experiencing the most acute water stress levels in 2022 (Kuwait, the United Arab Emirates and Saudi Arabia) are all located in the Arabian Peninsula and are withdrawing each year 9 to almost 40 times their renewable freshwater resources available. As a result, non-renewable water resources are used and are diminishing rapidly. The national water stress level can hide some differences within a country. Water stress disaggregation by river basins shows that the basins affected by severe water stress are located not only in Northern Africa and the Near East but also in Northern America, Central and Southern Asia, and on the west coast of Latin America.21

The cropland nutrient balance represents the difference between the quantities of mineral and organic nutrients (nitrogen, phosphorus and potassium) added and withdrawn from the cropland by the production of crops and livestock. An excess of nutrients can lead to environmental risks (for example via additional outputs, such as volatilization, leaching and runoff), while insufficient levels of nutrients constrain yields. FIGURE 70 and TABLE 60 show that the global average cropland nitrogen balance went up 7 percent to 52 kg/ha between 2000 and 2022, although it was on an overall declining trend during the 2010s. With 90 kg/ha in 2022, Asia had the highest cropland nitrogen balance, far ahead of the Americas (48 kg/ha), Europe (31 kg/ha), Oceania and Africa (11 kg/ha each). Oceania had the largest growth of the cropland nitrogen balance between 2000 and 2022 (+171 percent), driven by increased fertilizer inputs and stable outputs, while Europe is the only region where the cropland nitrogen budget declined (by 25 percent). Asia had the largest total nitrogen inputs in 2022 (165 kg/ha); the Americas had the largest inputs from biological fixation, as well as the largest outputs from crop removal, while Africa had the smallest total nitrogen inputs (38 kg/ha).

Agrifood systems are affected by climate change but also contribute significantly to greenhouse gas (GHG) emissions. Total emissions from agrifood systems in 2023 amounted to 16.5 billion tonnes of carbon dioxide equivalent (Gt CO2eq) of GHG released into the atmosphere, an increase of 7 percent, or 1.1 Gt CO2eq compared with 2000 (FIGURE 71 and TABLE 61). This growth is due to an increase in pre- and post- agricultural production emissions and farm-gate emissions that was larger than the decrease in land-use change emissions. Activities within the farm gate accounted for 8.1 Gt CO2eq, or 49 percent of the total emissions in 2023, followed by pre- and post- agricultural production (5.2 Gt CO2eq, or 32 percent) and land-use change (3.2 Gt CO2eq, or 19 percent). Asia was the top emitter, with 7.1 Gt CO2eq (43 percent of the total) in 2023, followed by the Americas (4.8 Gt CO2eq, or 29 percent), Africa (2.4 Gt CO2eq, or 14 percent), Europe (1.9 Gt CO2eq, or 11 percent) and Oceania (0.4 Gt CO2eq, or 2 percent). CO2 represented 49 percent of the total emissions, or 8.0 Gt CO2eq. Next were methane (CH4), with 5.6 Gt CO2eq (34 percent); nitrous oxide (N2O), with 2.4 Gt CO2eq (14 percent); and fluorinated gases (F-gases), with 0.5 Gt CO2eq (3 percent).

World agricultural emissions within the farm gate (those related to the production of crops and livestock) grew by 21 percent between 2000 and 2023 to 8.1 Gt CO2eq (see FIGURE 72 and TABLE 62). Around 53 percent of farm-gate emissions derive from livestock-related activities, and the emissions from enteric fermentation generated in the digestive system of ruminant livestock were alone responsible for 2.9 Gt CO2eq, or 36 percent of agricultural emissions within the farm gate. Animal and synthetic sources of soil fertilization contributed to slightly less than one-fifth of agricultural emissions within the farm gate. The share of on-farm energy use in farm-gate emissions steadily increased from 10 percent in 2000 to 13 percent in 2023, while the share of drained organic decreased from 13 percent in 2000 to 11 percent in 2023. Methane released from the cultivation of rice paddies accounted for 9–10 percent of farm-gate emissions.

Calculating emissionsc intensities allows for comparison of the GHG performance of a range of commodities, as they represent a simplified indication of the efficiency of production for each commodity, by country and over time. As seen in FIGURE 73, the most CO2-intensive commodities on average in 2023 were cattle meat (30.4 kg CO2eq/kg) and sheep meat (22.2 kg CO2eq/kg). The emissions intensities of pig and chicken meat were much lower (1.6 kg CO2eq/kg and 0.5 kg CO2eq/kg, respectively). The global emissions intensity for cow milk was 0.9 kg CO2eq/kg, compared with 5.8 CO2eq/kg for sheep milk. The emissions intensity of rice was 0.9 kg CO2eq/kg, nearly 15 times higher than that of cereals excluding rice (0.1 kg CO2eq/kg). As seen in TABLE 63, the intensities change significantly across regions, reflecting large differences in associated efficiencies of production. For instance, the emissions intensity of cattle meat is nearly twice the world average in Africa (58.5 kg CO2eq/kg) and about half the world average in Europe (17.3 kg CO2eq/kg).

Worldwide, winters and summers alike are becoming increasingly hotter than the 1951–1980 average (see FIGURE 74). With 2.12 °C more than the world reference measured over land, 2024 was the warmest year at the global level, followed by 2023 (1.78 °C) and 2016 (1.69 °C). The nine warmest years on record since 1961 (and in fact since the beginning of observations in 1880) are all within the nine-year period of 2015–2024. Europe is the region where the temperature change was the highest in 2024 and for most of the 2000–2024 period, with 2.43 °C (nearly the same as in 2023), closely followed by the Americas (2.37 °C), Asia (2.06 °C), Africa (1.75 °C) and Oceania (1.41 °C). The average temperature change in the 2010s was 1.26 °C, compared with 0.97 °C in the 2000s. As seen in TABLE 64, in 2024, 147 countries – more than three-quarters of the countries in the world – saw mean annual warming above 1.5 °C, of which 85 had warming above 2.0 °C, and 18 had warming of or above 3.0 °C. The largest mean annual temperature change was recorded in Ukraine (3.58 °C), Belarus (3.55 °C), and Bosnia and Herzegovina (3.44 °C).

Statistics are at the core of the work of the Food and Agriculture Organization of the United Nations (FAO), its mandate and its strategic goals. Article I of its constitution states that “The Organization shall collect, analyse, interpret and disseminate information relating to nutrition, food and agriculture. […] the term ‘agriculture’ and its derivatives includes forestry, fisheries and aquaculture.”
FAO has a decentralized statistical system, with several technical units carrying out statistical activities. The Statistics Division (ESS) produces a vast array of data on agriculture (covering the socioeconomic, environmental, production, trade, food security and nutrition aspects), which form the majority of FAO statistics. Other technical divisions oversee data on fisheries and aquaculture, forestry, international commodity prices, and water. ESS develops and advocates for the implementation of methodologies and standards for data collection, validation, processing and analysis of food and agriculture statistics. In these statistical domains, ESS also plays a vital role in the compilation, processing and dissemination of internationally comparable data, and provides essential capacity-building support to Members. In addition, ESS disseminates documents, working papers and statistical publications that cover agriculture and food security statistics (including prices, production, trade and agri-environmental statistical data). ESS is involved in managing a number of large-scale projects aimed at improving statistical methodologies and establishing best practices for collecting, collating, processing, disseminating and using data relevant to food security, agriculture and rural areas. Finally, ESS leads the Organization’s work to monitor the Sustainable Development Goal (SDG) indicators under FAO custodianship.
The Director of ESS also plays the role of FAO Chief Statistician. As such, ESS supports the specific functions of the Chief Statistician: ensuring strong governance of FAO’s data and statistical system; fostering consistency of FAO’s data and statistical programme within the Strategic Framework; ensuring statistical excellence through the implementation of statistical standards and quality assurance mechanisms; and positioning FAO’s presence in data and statistical discussions at the global level.
The prevalence of obesity in the adult population is the percentage of adults age 18 and over whose body mass index (BMI) is more than 30 kg/m². The BMI is a simple index of weight-for-height, or the weight in kilograms divided by the square of the height in metres.
Originator: World Health Organization (WHO), Global Health Observatory Data Repository/World Health Statistics
Owner: WHO
The prevalence of unaffordability (PUA) estimates the percentage of individuals in a population whose disposable income, net of the amount needed to acquire all basic non-food goods and services, is lower than the minimum cost of a healthy diet. National estimates are obtained by contrasting the country-specific income distributions against a threshold (r). The threshold r is obtained by summing the cost of a healthy diet in a country and the basic cost of non-food needs for the income group to which the country belongs. Specifically, the cost of non-food needs is calculated by multiplying World Bank international poverty lines by a share of total expenditure to be reserved for non-food basic goods and services that is specific to each income group. Along with the PUA, the number of people unable to afford a healthy diet (NUA) is computed by multiplying the PUA by the reference population size.
Originator: FAO, Statistics Division and World Bank
Owner: FAO and World Bank
Land used for cultivation of crops and animal husbandry. It is the total of areas under “Cropland” and “Permanent meadows and pastures”.
Originator: FAO, Statistics Division
Owner: FAO
Annual quantity of self-supplied water withdrawn for irrigation, livestock and aquaculture purposes, including water specifically withdrawn by water supply companies to operate irrigation systems. It can include water from freshwater resources, as well as water from over-abstraction of renewable groundwater or withdrawal from fossil groundwater, direct use of agricultural drainage water, direct use of (treated) wastewater and desalinated water. Water for the dairy and meat industries and industrial processing of harvested agricultural products is included under industrial water withdrawal.
Originator: FAO, Land and Water Division (AQUASTAT)
Owner: FAO
Sum of areas under “Agriculture area certified organic” and “Agriculture area in conversion to organic”. Agriculture area certified organic is the land area exclusively dedicated to organic agriculture and managed by applying organic agriculture methods. It refers to the land area fully converted to organic agriculture. It is the portion of land area (including arable lands, pastures or wild areas) managed (cultivated) or wild harvested in accordance with specific organic standards or technical regulations, which has been inspected and approved by a certification body. Agriculture area in conversion to organic is the land area that is going through the organic conversion process, usually a two-year period of conversion to organic land.
Originator: FAO, Statistics Division
Owner: FAO
Agriculture, forestry and fishing (AFF) refers to the broad agricultural sector that includes crop growing and animal production, forestry and logging, and fishing and aquaculture. These subsectors correspond to Section A of the International Standard Industrial Classification (ISIC) Revision 4 and are covered in its Divisions 1, 2 and 3. To distinguish the agricultural sector (crop and livestock in Division 1 of ISIC), the broad agricultural sector is abbreviated as AFF.
Originator: United Nations Statistics Division (UNSD)
Owner: UN
This is the total value added in AFF. The value added is the net output of a sector after adding up the value of all outputs and subtracting intermediate inputs. It is calculated without making deductions for depreciation of fabricated assets or depletion and degradation of natural resources. ISIC Revision 3 or Revision 4 determines the origin of value added. Agriculture here refers to the broad agricultural sector (AFF).
Originator: World Bank
Owner: World Bank
Animal oils and fats include animal fats that are obtained by dressing the carcasses of slaughtered animals (slaughter fats), or at a later stage in the butchering process when meat is being prepared for final consumption (butcher fats).
Originator: FAO, Statistics Division
Owner: FAO
Aquaculture production is defined as the farming of aquatic organisms. Farming implies some form of intervention in the rearing process to enhance production, such as regular stocking, feeding and protection from predators. Farming also implies individual or corporate ownership of the stock being cultivated. For statistical purposes, aquatic organisms that are harvested by an individual or corporate body that has owned them throughout their rearing period contribute to aquaculture, while aquatic organisms that are exploitable by the public as a common property resource, with or without appropriate licences, are the harvest of fisheries. In the case of capture-based aquaculture, only the incremental growth (or weight gain) in captivity could and should be reported as the production from aquaculture. Data included here cover aquaculture production of fish, molluscs, crustaceans and miscellaneous aquatic animals, but exclude the production of marine mammals, crocodiles, corals, pearls, sponges and algae. Total fisheries and aquaculture production is the sum of aquaculture and capture fisheries production. Data are expressed in live weight equivalent.
Originator: FAO, Fisheries and Aquaculture Division
Owner: FAO
Foods for human consumption originating from animals grown in, or harvested from, water. They include foods from all types of aquatic animals, with the exception of aquatic mammals and reptiles.
Originator: FAO, Fisheries and Aquaculture Division
Owner: FAO
Arable land is the total of areas under temporary crops, temporary meadows and pastures, and land with temporary fallow. Arable land does not include land that is potentially cultivable but is not normally cultivated.
Originator: FAO, Statistics Division
Owner: FAO
Area harvested refers to the area from which a crop is gathered. It excludes, therefore, the area from which, although sown or planted, there was no harvest due to damage, failure or the like. It is usually net of temporary crops and sometimes gross of permanent crops. The net area differs from the gross area insofar as the latter includes uncultivated patches, footpaths, ditches, headlands, shoulders, shelterbelts and the like. If the crop under consideration is harvested more than once during the year as a consequence of successive cropping (i.e. the same crop is sown or planted more than once in the same field during the year), the area is counted as many times as harvested.
Originator: FAO, Statistics Division
Owner: FAO
Hunting, collecting and gathering activities directed at removing or collecting live wild aquatic organisms are capture fisheries production. The capture production statistics here indicate the nominal catches of aquatic organisms killed, caught, trapped or collected for all commercial, industrial, recreational and subsistence purposes or other utilizations in live weight equivalent. Data included here cover capture production of fish, molluscs, crustaceans and miscellaneous aquatic animals but exclude production of marine mammals, crocodiles, corals, pearls, sponges and algae. Total fisheries and aquaculture production is the sum of aquaculture and capture fisheries production.
Originator: FAO, Fisheries and Aquaculture Division
Owner: FAO
The cereal import dependency ratio provides a measure of the dependence of a country or region on cereal imports. The higher the value of the indicator, the higher the dependence. Specifically, the cereal imports dependency ratio tells how much of the available domestic food supply of cereals has been imported and how much comes from the country’s own production. It is computed as (cereal imports − cereal exports) / (cereal production + cereal imports − cereal exports) × 100. Given this formula, the indicator assumes only values less than or equal to 100. Negative values indicate that the country is a net exporter of cereals. The indicator is calculated in three-year averages to reduce the impact of possible errors in estimated production and trade, due to the difficulties in properly accounting for stock variations in major foods.
Originator: FAO, Statistics Division
Owner: FAO
Wheat, rice paddy, barley, maize, popcorn, rye, oats, millets, sorghum, buckwheat, quinoa, fonio, triticale, canary seed, mixed grain and cereals nes are all considered cereals.
Originator: FAO, Statistics Division
Owner: FAO
Cereals, flours and cereal grains that are either rolled, flaked, pearled, sliced or kibbled are cereals and preparations.
Originator: FAO, Statistics Division
Owner: FAO
The food consumer price index (CPI) measures the price change between the current and reference periods of the average basket of food items purchased by households. The food CPI is rescaled to a unique base year of 2010 by FAO for all countries with sufficient time coverage. FAO uses the geometric mean of the monthly indices of the year 2010 as the rescaling factor.
Originator: International Monetary Fund (IMF), UNSD, Organisation for Economic Co-operation and Development (OECD) and national statistics websites
Owner: IMF, UNSD and FAO
The cost of a healthy diet is the cost of purchasing the least expensive locally available foods to meet the energy requirements and food-based dietary guidelines for a representative person within energy balance at 2 330 kcal/day. It is calculated using retail food price data from the International Comparison Program (ICP), coordinated by the World Bank. The cost of a healthy diet is converted to international dollars using purchasing power parity (PPP) conversion factors for private consumption
Originator: FAO, Statistics Division and World Bank
Owner: FAO and World Bank
Cropland is the land used for cultivation of crops. The total of areas under “Arable land” and “Permanent crops”.
Originator: FAO, Statistics Division
Owner: FAO
Difference between the cropland nitrogen input and output flows. Inputs are comprised of synthetic fertilizers, manure applied to soils, atmospheric deposition and biological fixation; outputs are comprised of crop removal from harvest.
Originator: FAO, Statistics Division
Owner: FAO
Crop statistics include permanent and temporary crops and cover the following categories: crops primary, fibre crops primary, cereals, coarse grain, citrus fruit, fruit, oil crops (oil and cake equivalent), pulses, roots and tubers, treenuts and vegetables.
Originator: FAO, Statistics Division
Owner: FAO
Butter, buttermilk, cheese, cream, ghee, milk, whey and yoghurt are all dairy products.
Originator: FAO, Statistics Division
Owner: FAO
The food available for human consumption, expressed in kilocalories per person per day, is the dietary energy supply. At the country level, it is calculated as the food remaining for human use after taking out all non-food utilization, including exports, industrial use, animal feed, seed, wastage and changes in stocks.
Originator: FAO, Statistics Division
Owner: FAO
The dietary energy supply adequacy average expresses the dietary energy supply (DES) as a percentage of the average dietary energy requirement (ADER). Each country or region’s average supply of calories for food consumption is normalized by the average dietary energy requirement estimated for its population to provide an index of adequacy of the food supply in terms of calories.
Originator: FAO, Statistics Division
Owner: FAO
The figures for the dietary energy supply average are based on the latest available data from national food balance sheets and represent the amount of food available for human consumption.
Originator: FAO, Statistics Division
Owner: FAO
Egg production by type of poultry should refer to the total production of eggs in the shell by all types of hens in both the traditional sector (individually owned small flocks) and the modern sector (large-scale, intensive commercial poultry farms). Total production includes eggs for hatching but excludes farm waste.
Originator: FAO, Statistics Division
Owner: FAO
Greenhouse gas (GHG) emissions from agrifood systems are generated within the farm gate by crop and livestock production activities; from land-use change dynamics, linked for instance to deforestation and peatland degradation to make room for agriculture; and in pre- and post-production processes, such as food manufacturing, household consumption and disposal of food waste. Emissions, relevant to each process, consist of nitrous oxide (N2O); methane (CH4); carbon dioxide (CO2); and fluorinated gases (F-gases).
Originator: FAO, Statistics Division
Owner: FAO
Emissions from land management and transformation processes. FAOSTAT data include processes on agricultural land and forest land – corresponding to IPCC land-use categories “cropland”, “forest land” and “grassland”. Emissions from forests consist of CO2 emissions/removals from net carbon stock changes in above- and below-ground biomass related to net forest conversion (deforestation). While CO2 emissions from fires are implicitly included in the carbon stock change computations, non-CO2 emissions from forest fires are reported separately, for “fires in humid tropical forests” and “other forest fires”. In addition to CO2 from deforestation, emissions on agricultural land include CO2 and N2O emissions from the drainage of organic soils. Land-use change emissions in FAOSTAT also include CO2 and CH4 emissions from fires in organic soils.
Originator: FAO, Statistics Division
Owner: FAO
Pre- and post-production emissions cover activities outside the farm gate, either as input into agricultural production activities (fertilizer manufacturing and pesticide manufacturing) or as post-farm gate processes (food processing, food packaging, food transport, food retail, food household consumption, agrifood systems waste disposal). Emissions include CO2 from fossil-fuels based energy used across the above processes, CH4 and N2O from the treatment of waste streams, and F-gases from cold chains linked to refrigeration of food items.
Originator: FAO, Statistics Division
Owner: FAO
Greenhouse gas emissions within the farm gate per unit weight of product, expressed in kg CO2eq/kg of product. The indicator is computed for six types of meat (buffalo, cattle [beef], chicken, goat, pig and sheep), four types of milk (camel, cow, goat and sheep), hen eggs, rice, and other cereals (combining the intensities of barley, maize, millet, oats, rye, sorghum and wheat).
Originator: FAO, Statistics Division
Owner: FAO
Shares in total emissions of agrifood systems and their components (farm gate, land-use change, pre- and post-production) and of all the sectors covered in the database, computed with respect to emissions in CO2 equivalent and by single gas (CO2, CH4, N2O and F-gases).
Originator: FAO, Statistics Division
Owner: FAO
Farm-gate emissions cover all agricultural processes within farms related to crop and livestock production (enteric fermentation, manure management, rice cultivation, synthetic fertilizers, manure applied to soils, manure left on pastures, crop residues, drained organic soils, burning of crop residues, savanna fires), including energy use and drained organic soils within the farm. Non-CO2 gases, namely CH4 and N2O, are produced by crop and livestock production and management activities whereas CO2 emissions are produced from the drainage of organic soils and on-farm use of fossil-fuel based energy (including electricity and heat generated off farms). Emissions are computed following Tier 1 Intergovernmental Panel on Climate Change (IPCC) 2006 Guidelines for National GHG Inventories.
Originator: FAO, Statistics Division
Owner: FAO
Employment comprises all persons of working age who, during a specified brief period, such as one week or one day, were in one of the following two categories: a) paid employment (whether at work, or having a job but not at work), or b) self-employment (whether at work, or with an enterprise but not at work). The working-age population is the population above the legal working age, but for statistical purposes it comprises all persons above a specified minimum age threshold for which an inquiry on economic activity is made. To promote international comparability, the working-age population is often defined as all persons aged 15 and older, but this may vary from country to country based on national laws and practices (some countries also use an upper age limit). The classification by economic activity refers to the main activity of the establishment in which a person worked during the reference period. The branch of economic activity of a person does not depend on the specific duties or functions of the person’s job, but rather on the characteristics of the economic unit in which the person worked. Data presented by a branch of economic activity are based on ISIC.
Originator: International Labour Organization (ILO)
Owner: ILO
Export values are reported as FOB (free on board: the value of the goods plus the value of the services performed to deliver the goods to the border of the exporting country).
Originator: FAO, Statistics Division
Owner: FAO
The use of fertilizers refers to agricultural use of inorganic (mineral or chemical) fertilizers for the three main plant nutrients: nitrogen (N), phosphorus (expressed as P2O5) and potassium (expressed as K2O). It includes both straight fertilizers (those containing only one of the three primary plant nutrients) and compound fertilizers (those containing more than one of the three primary plant nutrients; they may be NP, NK, PK or NPK). Agricultural use refers to the use for crops, livestock, forestry, fisheries and aquaculture, excluding use for animal feed.
Originator: FAO, Statistics Division
Owner: FAO
The FAO Fish Price Index measures the monthly changes in international prices of a basket of fisheries and aquaculture commodities. The index consists of the average of five commodity group price indices (whitefish, salmon, tuna, other pelagic fish and shrimps) weighted by the average export shares of each of the groups for the 2014–2016 period.
Originator: FAO, Fisheries and Aquaculture Division
Owner: FAO
Food is comprised of the commodities in the Standard International Trade Classification (SITC) sections 0 (food and live animals), 1 (beverages and tobacco), and 4 (animal and vegetable oils and fats) and SITC division 22 (oil seeds, oil nuts and oil kernels).
Originator: FAO, Statistics Division
Owner: FAO
The FAO Food Price Index is a measure of the monthly change in international prices of a basket of food commodities. It consists of the average of five commodity group price indices (meat, dairy, cereals, vegetable oils and sugar), weighted with the average export shares of each of the groups for 2014–16.
Originator: FAO, Statistics Division
Owner: FAO
Land spanning more than 0.5 ha with trees higher than 5 metres and a canopy cover of more than 10 percent, or trees able to reach these thresholds in situ. Excludes land that is predominantly under agricultural or urban land use. Explanatory notes:
• Forest land is determined both by the presence of trees and by the absence of other predominant land uses. The trees should be able to reach a minimum height of 5 metres in situ.
• Includes areas with young trees that have not yet reached but that are expected to reach a canopy cover of 10 percent and tree height of 5 metres. It also includes areas that are temporarily unstocked owing to clear-cutting as part of a forest management practice or natural disasters, and that are expected to be regenerated within five years. Local conditions may, in exceptional cases, justify the use of a longer time frame.
• Includes forest roads, firebreaks and other small open areas.
• May include forest land in national parks, nature reserves and other protected areas, such as those of specific environmental, scientific, historical, cultural or spiritual interest.
• Includes windbreaks, shelter belts and corridors of trees with an area of more than 0.5 ha and width of more than 20 metres.
• Includes abandoned shifting cultivation land with a regeneration of trees that have, or are expected to reach, a canopy cover of 10 percent and tree height of 5 metres.
• Includes areas with mangroves in tidal zones, regardless of whether this area is classified as land area or not.
• Includes areas with bamboo and palms provided that land use, height and canopy cover criteria are met.
• Some agroforestry systems such as the taungya system, where crops are grown only during the first years of the forest rotation, should be classified as forest.
• Excludes tree stands in agricultural production systems, such as fruit-tree plantations (permanent crops), oil palm plantations, rubber and Christmas trees (permanent crops) and agroforestry systems when crops are grown under tree cover.
Originator: FAO, Statistics Division
Owner: FAO
Products of domestic origin or manufacture shipped out of the country are forest product exports. They include exports from free economic zones and re-exports. They exclude “in-transit” shipments. They are reported in cubic metres of solid volume or metric tonnes, and values are normally recorded as FOB.
Originator: FAO, Forestry Division
Owner: FAO
Products imported for domestic consumption or processing shipped into a country are forest product imports. They include imports into free economic zones or for re-export. They exclude “in-transit” shipments. They are reported in cubic metres of solid volume or metric tonnes, and values normally include cost, insurance and freight (CIF).
Originator: FAO, Forestry Division
Owner: FAO
Forest product production includes the production of products that may immediately be consumed in the production of another product (e.g. wood pulp, which may immediately be converted into paper as part of a continuous process). This includes production from all sources within the country including public, private and informal sources. It excludes the production of veneer sheets that are used for plywood production within the same country. It is reported in cubic metres of solid volume in the case of roundwood, sawnwood and wood-based panels and metric tonnes in the case of charcoal, pulp and paper products.
Originator: FAO, Forestry Division
Owner: FAO
Vegetables, as classified in this group, are mainly annual plants cultivated as field and garden crops in the open and under glass and are used almost exclusively for food. Vegetables grown principally for animal feed or seed should be excluded. Certain plants, normally classified as cereals and pulses, belong to this group when harvested green, such as green maize and green peas. Chillies and green peppers are included in this grouping when they are harvested for consumption as vegetables and not processed into spices. Trade data for fresh vegetables also include chilled vegetables, meaning the temperature of the products has been reduced to around 0 ˚C without the products being frozen. Fruit crops consist of fruits and berries that, with few exceptions, are characterized by their sweet taste. Nearly all are permanent crops, mainly from trees, bushes and shrubs, as well as vines and palms. Fruit crops are consumed directly as food or are processed into dried fruit, fruit juice, canned fruit, frozen fruit, jam, alcoholic beverages and other products.
Originator: FAO, Statistics Division
Owner: FAO
The government expenditure on agriculture refers to core areas of government functions relevant to agriculture, forestry and fishing (AFF) based on the Classification of Functions of Government as outlined in the Government Finance Statistics Manual of the International Monetary Fund (IMF) (2014). Statistics on expenditure in AFF are used to compile the Agriculture Orientation Index.
Originator: FAO, Statistics Division
Owner: FAO and IMF
The gross fixed capital formation is the total value of a producer’s acquisitions, less disposals, of fixed assets during the accounting period plus certain additions to the value of non-produced assets (such as subsoil assets or major improvements in the quantity, quality or productivity of land) realized by the productive activity of institutional units.
Originator: UNSD, OECD and national statistics’ websites
Owner: UNSD, OECD and FAO
Import values are reported as CIF (cost insurance and freight: the value of the goods, plus the value of the services performed to deliver goods to the border of the exporting country, plus the value of the services performed to deliver the goods from the border of the exporting country to the border of the importing country).
Originator: FAO, Statistics Division
Owner: FAO
All roundwood except wood fuel is industrial roundwood. In production statistics, it is an aggregate comprising sawlogs and veneer logs; pulpwood, round and split; and other industrial roundwood. It is reported in cubic metres solid volume underbark (i.e. excluding bark).
Originator: FAO, Forestry Division
Owner: FAO
The inflation rate of an index for any month refers to the percentage change in the index value for the month as compared with the index value of the corresponding month of the previous year. Global and regional food consumer price inflation measures food inflation for a group of countries at different geographical scales: Africa, Europe, Oceania, Latin America and the Caribbean, Northern America, and Asia. Global and regional inflation are calculated using household consumption expenditure weights.
Originator: FAO, Statistics Division
Owner: FAO
Country area excluding area under inland waters and coastal waters.
Originator: FAO, Statistics Division
Owner: FAO
Land area equipped with irrigation infrastructure and equipment, in working order, to provide water to crops. The equipment does not have to be used during the reference year. The area equipped for irrigation covers areas equipped for fully controlled irrigation by any of the methods of surface, sprinkler or localized irrigation. It also includes areas under partially controlled irrigation methods of spate irrigation (controlling floodwater to water crops), equipped wetlands and inland valley bottoms and equipped flood recession. It excludes manual watering of plants using buckets, watering cans or other devices.
Originator: FAO, Statistics Division
Owner: FAO
Livestock primary production includes products from live and slaughtered animals. Products from slaughtered animals include meat, offals, raw fats, fresh hides and skins. Products from live animals include milk, eggs, honey, beeswax and fibres of animal origin.
Originator: FAO, Statistics Division
Owner: FAO
Meat is defined as the flesh of animals (excluding aquatic animals) used for food. In production data, meat is normally reported inclusive of bone and exclusive of meat that is unfit for human consumption. As reported by individual countries, meat production data may refer either to commercial production (meat entering marketing channels), inspected production (from animals slaughtered under sanitary inspection), or total production (the total of the above-mentioned categories plus slaughter for personal consumption). All FAO annual production data refer to total production.
Originator: FAO, Statistics Division
Owner: FAO
Whole fresh milk production from buffaloes, camels, cows, goats and sheep.
Originator: FAO, Statistics Division
Owner: FAO
Value in USD of exports (including re-exports for aquatic animals) minus imports.
Originator: FAO, Statistics Division and FAO, Fisheries and Aquaculture Division
Owner: FAO
Oil-bearing crops or oil crops include both annual (usually called oilseeds) and perennial plants whose seeds, fruits or mesocarp, and nuts are valued mainly for the edible or industrial oils that are extracted from them. Oil crops exclude dessert and table nuts, although they are rich in oil, as well as annual oilseed plants that are either harvested green or are used for grazing and for green manure. Some oil crops are also fibre crops in that both the seeds and the fibres are harvested from the same plant (for example coconuts, kapok fruit, seed cotton, linseed and hempseed).
Originator: FAO, Statistics Division
Owner: FAO
The paper and paperboard category is an aggregate category. In the production and trade statistics, it represents the sum of graphic papers, sanitary and household papers, packaging materials, and other paper and paperboard. It excludes manufactured paper products such as boxes, cartons, books and magazines.
Originator: FAO, Forestry Division
Owner: FAO
Land cultivated with long-term crops that do not have to be replanted for several years (such as cocoa and coffee), land under trees and shrubs producing flowers (such as roses and jasmine), and nurseries (except those for forest trees, which should be classified under “Forestry”) are all considered land under permanent crops. Permanent meadows and pastures are excluded from land under permanent crops.
Originator: FAO, Statistics Division
Owner: FAO
Land used permanently (five years or more) to grow herbaceous forage crops through cultivation or naturally (wild prairie or grazing land) is considered land under permanent meadows and pastures. Permanent meadows and pastures on which trees and shrubs are grown should be recorded under this heading only if the growing of forage crops is the most important use of the area. Measures may be taken to keep or increase productivity of the land (e.g. use of fertilizers, mowing or systematic grazing by domestic animals.) This class includes:
• grazing in wooded areas (agroforestry areas, for example)
• grazing in shrubby zones (heath, maquis, garigue) and
• grassland in the plain or low mountain areas used for grazing: land crossed during transhumance where the animals spend a part of the year (approximately 100 days) without returning to the holding in the evening: mountain and subalpine meadows and similar; and steppes and dry meadows used for pasture.
Originator: FAO, Statistics Division
Owner: FAO
Pesticides include insecticides, fungicides, herbicides, disinfectants and any substance or mixture of substances intended for preventing, destroying or controlling any pest, including:
• vectors of human or animal disease;
• unwanted species of plants or animals causing harm during or otherwise interfering with the production, processing, storage, transport or marketing of food, agricultural commodities, wood and wood products or animal feedstuffs; or
• substances which may be administered to animals for the control of insects, arachnids or other pests in or on their bodies.
The term includes substances intended for use as a plant growth regulator, defoliant, desiccant or agent for thinning fruit or preventing the premature fall of fruit, and substances applied to crops either before or after harvest to protect the commodity from deterioration during storage and transport. Pesticide use data refers to quantities of pesticides applied to crops and seeds in the agricultural sector. Figures are expressed in metric tonnes of active ingredients. However, due to some country reporting practices, the data may be reported by use in formulated product; sales; distribution; or imports for use in the agricultural sector.
Originator: FAO, Statistics Division
Owner: FAO
The prevalence of moderate or severe food insecurity is an estimate of the percentage of people in the population who live in households classified as moderately or severely food insecure. The assessment is conducted using data collected with the Food Insecurity Experience Scale (FIES) or a compatible experience-based food security measurement questionnaire (such as the Household Food Security Survey Module, or HFSSM). The probability of being food insecure is estimated using the one-parameter logistic Item Response Theory model (the Rasch model) and thresholds for classification are made comparable across countries by calibrating the metrics obtained in each country against the FIES global reference scale, maintained by FAO. The threshold to classify “moderate or severe” food insecurity corresponds to the severity associated with the item “having to eat less” on the global FIES scale. In simpler terms, a household is classified as moderately or severely food insecure when at least one adult in the household was reported to have been exposed, at times during the year, to low-quality diets and might have been forced to also reduce the quantity of food they would normally eat because of a lack of money or other resources. It is an indicator of a lack of access to food.
Originator: FAO, Statistics Division
Owner: FAO
The prevalence of severe food insecurity is an estimate of the percentage of people in the population who live in households classified as severely food insecure. The assessment is conducted using data collected with the FIES or a compatible experience-based food security measurement questionnaire (such as the HFSSM). The probability of being food insecure is estimated using the one-parameter logistic Item Response Theory model (the Rasch model) and thresholds for classification are made comparable across countries by calibrating the metrics obtained in each country against the FIES global reference scale, maintained by FAO. The threshold to classify “severe” food insecurity corresponds to the severity associated with the item “having not eaten for an entire day” on the global FIES scale. In simpler terms, a household is classified as severely food insecure when at least one adult in the household was reported to have been exposed, at times during the year, to several of the most severe experiences described in the FIES questions, such as having been forced to reduce the quantity of the food, having skipped meals, having gone hungry, or having to go for a whole day without eating because of a lack of money or other resources. It is an indicator of lack of access to food.
Originator: FAO, Statistics Division
Owner: FAO
Expresses the probability that a randomly selected individual from the population consumes an insufficient quantity of calories to cover their energy requirement for an active and healthy life. The indicator is computed by comparing a probability distribution of habitual daily dietary energy consumption with a threshold level called the minimum dietary energy requirement. Both are based on the notion of an average individual in the reference population.
Originator: FAO, Statistics Division
Owner: FAO
Producer prices are prices received by farmers for primary crops, live animals and livestock primary products as collected at the point of initial sale (prices paid at the farm-gate).
Originator: FAO, Statistics Division
Owner: FAO
Figures relate to the total domestic production inside or outside the agricultural sector, i.e. they include non-commercial production and production from kitchen gardens. Unless otherwise indicated, production is reported at the farm level for crop and livestock products (i.e. in the case of crops, excluding harvesting losses) and in terms of live weight for aquatic animal products (i.e. the actual ex-water weight at time of catch). All data shown relate to total meat production from both commercial and farm slaughter. Data are expressed in terms of dressed carcass weight, excluding offal and slaughter fats. Production of beef and buffalo meat includes veal; mutton and goat meat includes meat from lambs and kids; and pig meat includes bacon and ham in fresh equivalent. Poultry meat includes meat from all domestic birds and refers, wherever possible, to ready-to-cook weight.
Originator: FAO, Statistics Division
Owner: FAO
Production and crops refer to the actual harvested production from the field or orchard and gardens, excluding harvesting and threshing losses and any part of a crop not harvested for any reason. Production, therefore, includes the quantities of the commodity sold in the market (marketed production) and the quantities consumed or used by the producers (auto-consumption). When the production data available refers to a production period falling into two successive calendar years and it is not possible to allocate the relative production to each of them, it is common to refer production data to the year in which the bulk of the production falls. Crop production data are recorded in tonnes (t). In many countries, crop production data are obtained as a function of the estimated yield and the total area. If such a compilation method of production statistics is enforced by the country, it must be ensured that the total area does not refer to sown or planted areas, which would then give the biological production, but to the actual harvested area during the year.
Originator: FAO, Statistics Division
Owner: FAO
National average protein supply (expressed in grams per capita per day) includes the following groups: meat, offals, animal fats and products, milk and products, eggs, aquatic animal products and other.
Originator: FAO, Statistics Division
Owner: FAO
National average protein supply is expressed in grams per capita per day.
Originator: FAO, Statistics Division
Owner: FAO
Waste and scraps of paper or paperboard that have been collected for reuse or trade include paper and paperboard that have been used for their original purposes and residues from paper and paperboard production.
Originator: FAO, Forestry Division
Owner: FAO
All roundwood felled or otherwise harvested and removed is comprised of all wood obtained from removals, i.e. the quantities removed from forests and from trees outside the forest, including wood recovered from natural, felling and logging losses during the period, calendar year or forest year. It includes all wood removed with or without bark, including wood removed in its round form, or split, roughly squared or in other form (e.g. branches, roots, stumps and burls, where these are harvested) and wood that is roughly shaped or pointed. It is an aggregate comprising wood fuel, including wood for charcoal and industrial roundwood (wood in the rough). It is reported in cubic metres solid volume underbark (i.e. excluding bark).
Originator: FAO, Forestry Division
Owner: FAO
Roots and tubers are plants yielding starchy roots, tubers, rhizomes, corms and stems. The denomination “roots and tubers” excludes crops that are cultivated mainly for feed (mangolds, swedes) or for processing into sugar (sugar beets), and those classified as “roots, bulb and tuberous vegetables” (onions, garlic and beets).
Originator: FAO, Statistics Division
Owner: FAO
Wood that has been produced from domestic or imported roundwood, either by sawing lengthways or by a profile-chipping process, and that exceeds 6 mm in thickness is sawnwood.
Originator: FAO, Forestry Division
Owner: FAO
Starchy roots include cassava and products, potatoes and products, sweet potatoes and other roots.
Originator: FAO, Statistics Division
Owner: FAO
Height-for-age less than −2 standard deviations of the World Health Organization (WHO) Child Growth Standards median, among children aged 0–59 months.
Originator: United Nations Children’s Fund (UNICEF)
Owner: UNICEF/WHO/The World Bank: Joint child malnutrition estimates
Sugar crops include sugar beet, sugar cane, sugar crops nes.
Originator: FAO, Statistics Division
Owner: FAO
The number of people undernourished is obtained by multiplying estimates of the proportion of undernourished for each country by estimates of the total population. Undernourishment refers to the condition of people whose dietary energy consumption is continuously below a minimum dietary energy requirement for maintaining a healthy life and carrying out light physical activity.
Originator: FAO, Statistics Division
Owner: FAO
Vegetable oils are the oil equivalent of oil crops, which include seeds, nuts, oil palm fruit, olives and soybeans.
Originator: FAO, Statistics Division
Owner: FAO
Water stress is the ratio between total freshwater withdrawn by all major sectors and total renewable freshwater resources, after taking into account environmental water requirements.
Originator: FAO, Land and Water Division (AQUASTAT)
Owner: FAO
Wood carbonized by partial combustion or by heat from external sources is wood charcoal. It includes charcoal used as a fuel or for other uses, e.g. as a reduction agent in metallurgy or as an absorption or filtration medium.
Originator: FAO, Forestry Division
Owner: FAO
Roundwood that will be used as fuel for purposes such as cooking, heating or power production is wood fuel. This includes wood harvested from main stems, branches and other parts of trees (where these are harvested for fuel) and wood that will be used for the production of charcoal (e.g. in pit kilns and portable ovens), wood pellets, briquettes and other agglomerates. It also includes wood chips to be used for fuel that are made directly (i.e. in the forest) from roundwood. It excludes wood charcoal, pellets, briquettes and other agglomerates. It is reported in cubic metres solid volume underbark (i.e. excluding bark).
Originator: FAO, Forestry Division
Owner: FAO
Wood pellets are made from wood agglomerates produced from co-products (such as cutter shavings, sawdust or chips) of the mechanical wood processing industry, furniture-making industry or other wood transformation activities. They are produced either directly by compression or by the addition of a binder in a proportion not exceeding 3 percent by weight. Such pellets are cylindrical, with a diameter not exceeding 25 mm and a length not exceeding 100 mm. They are assumed to have 8 percent moisture content.
Originator: FAO, Forestry Division
Owner: FAO
Wood pulp is fibrous material prepared from pulpwood, wood chips, particles or residues by a mechanical or chemical process for further manufacture into paper, paperboard, fibreboard or other cellulose products. It is an aggregate comprising mechanical wood pulp, semi-chemical wood pulp, chemical wood pulp and dissolving wood pulp. It is reported in metric tonnes air-dry weight (i.e. with 10 percent moisture content).
Originator: FAO, Forestry Division
Owner: FAO
This product category is an aggregate comprising veneer sheets, plywood, particle board and fibreboard. It is reported in cubic metres solid volume.
Originator: FAO, Forestry Division
Owner: FAO
1 FAO. 2025. FAOSTAT: Land Use. [Accessed on 28 October 2025]. https://www.fao.org/faostat/en/#data/RL. Licence: CC-BY-4.0.
2 FAO. 1999. The FAO Field Programme and agricultural development in Asia and the Pacific. RAP Publication 1998/28. Bangkok, FAO. https://openknowledge.fao.org/handle/20.500.14283/ac621e
3 World Bank. 2025. World Bank Country and Lending Groups. In: The World Bank. [Cited 28 October 2025]. https://datahelpdesk.worldbank.org/knowledgebase/articles/906519-world-bank-country-and-lending-groups
4 Amankwah, A. & Gourlay, S. 2022. Impact of COVID-19 Crisis on Agriculture: Evidence from Five Sub-Saharan African Countries. Washington, DC, World Bank Group. http://documents.worldbank.org/curated/en/304561611294945287/Impact-of-COVID-19-Crisis-on-Agriculture-Evidence-from-Five-Sub-Saharan-African-Countries
5 ILO (International Labour Organization). 2025. ILOSTAT: Employment by sex and economic activity -- ILO modelled estimates. [Accessed on 28 October 2025]. https://rshiny.ilo.org/dataexplorer47/?lang=en&id=EMP_2EMP_SEX_ECO_NB_A. Licence: CC-BY-4.0.
6 ILO. 2025. ILOSTAT: Employment by sex and economic activity -- ILO modelled estimates. [Accessed on 28 October 2025]. https://rshiny.ilo.org/dataexplorer47/?lang=en&id=EMP_2EMP_SEX_ECO_NB_A. Licence: CC-BY-4.0.
7 UN (United Nations). 2020. Time-use statistics. In: United Nations. [Cited 28 October 2025]. https://unstats.un.org/unsd/gender/timeuse/
8 FAO. 2025. FAOSTAT: Government Expenditure. [Accessed on 28 October 2025] https://www.fao.org/faostat/en/#data/IG. Licence: CC-BY-4.0
9 African Union. 2014. Malabo Declaration on Accelerated Agricultural Growth and Transformation for Shared Prosperity and Improved Livelihoods. Addis Ababa, African Union Commission. https://www.au.int/web/sites/default/files/documents/31247-doc-malabo_declaration_2014_11_26.pdf
10 FAO. n.d. Climate-Smart Agriculture In: FAO. [Cited 28 October 2025]. https://www.fao.org/climate-smart-agriculture/en/
11 FAO. n.d. Agro-informatics. In: FAO. [Cited 28 October 2025]. https://www.fao.org/agroinformatics/en
12 FAO. n.d. Biotechnology. In: FAO. [Cited 28 October 2025]. https://www.fao.org/biotechnology/en/
13 OECD (Organisation for Economic Co-operation and Development) & FAO. 2025. OECD-FAO Agricultural Outlook 2025–2034. Paris. OECD Publishing and Rome. FAO. https://doi.org/10.1787/601276cd-en
14 FAO. 2024. FAOSTAT: Trade: Crops and livestock products. [Accessed on 28 October 2025]. https://www.fao.org/faostat/en/#data/TCL. Licence: CC-BY-4.0.
15 OECD & FAO. 2025. OECD-FAO Agricultural Outlook 2025-2034. Paris, OECD Publishing & Rome, FAO. https://doi.org/10.1787/601276cd-en
16 FAO, IFAD (International Fund for Agricultural Development), UNICEF (United Nations Children’s Fund), WFP (World Food Programme) & WHO (World Health Organization). 2025. The State of Food Security and Nutrition in the World 2025 – Addressing high food price inflation for food security and nutrition. Rome. https://doi.org/10.4060/cd6008en
17 FAO, IFAD, UNICEF, WFP & WHO. 2025. The State of Food Security and Nutrition in the World 2025 – Addressing high food price inflation for food security and nutrition. Rome. https://doi.org/10.4060/cd6008en
18 UN. n.d. Small Island Developing States. In: United Nations. [Cited 28 October 2025]. https://sustainabledevelopment.un.org/topics/sids/list
19 FAO. 2025. FAOSTAT: Suite of Food Security Indicators. [Accessed on 28 October 2025]. https://www.fao.org/faostat/en/#data/FS. Licence: CC-BY-4.0.
20 FAO. 1998. Evaluating the potential contribution of organic agriculture to sustainability goals – FAO’s technical contribution to IFOAM’s Scientific Conference – Mar del Plata, Argentina, 16–19 November 1998. https://openknowledge.fao.org/handle/20.500.14283/ac116e
21 FAO & UN-Water. 2021. Progress on the level of water stress: Global status and acceleration needs for SDG indicator 6.4.2, 2021. Rome, FAO and UN-Water. https://doi.org/10.4060/cb6241en


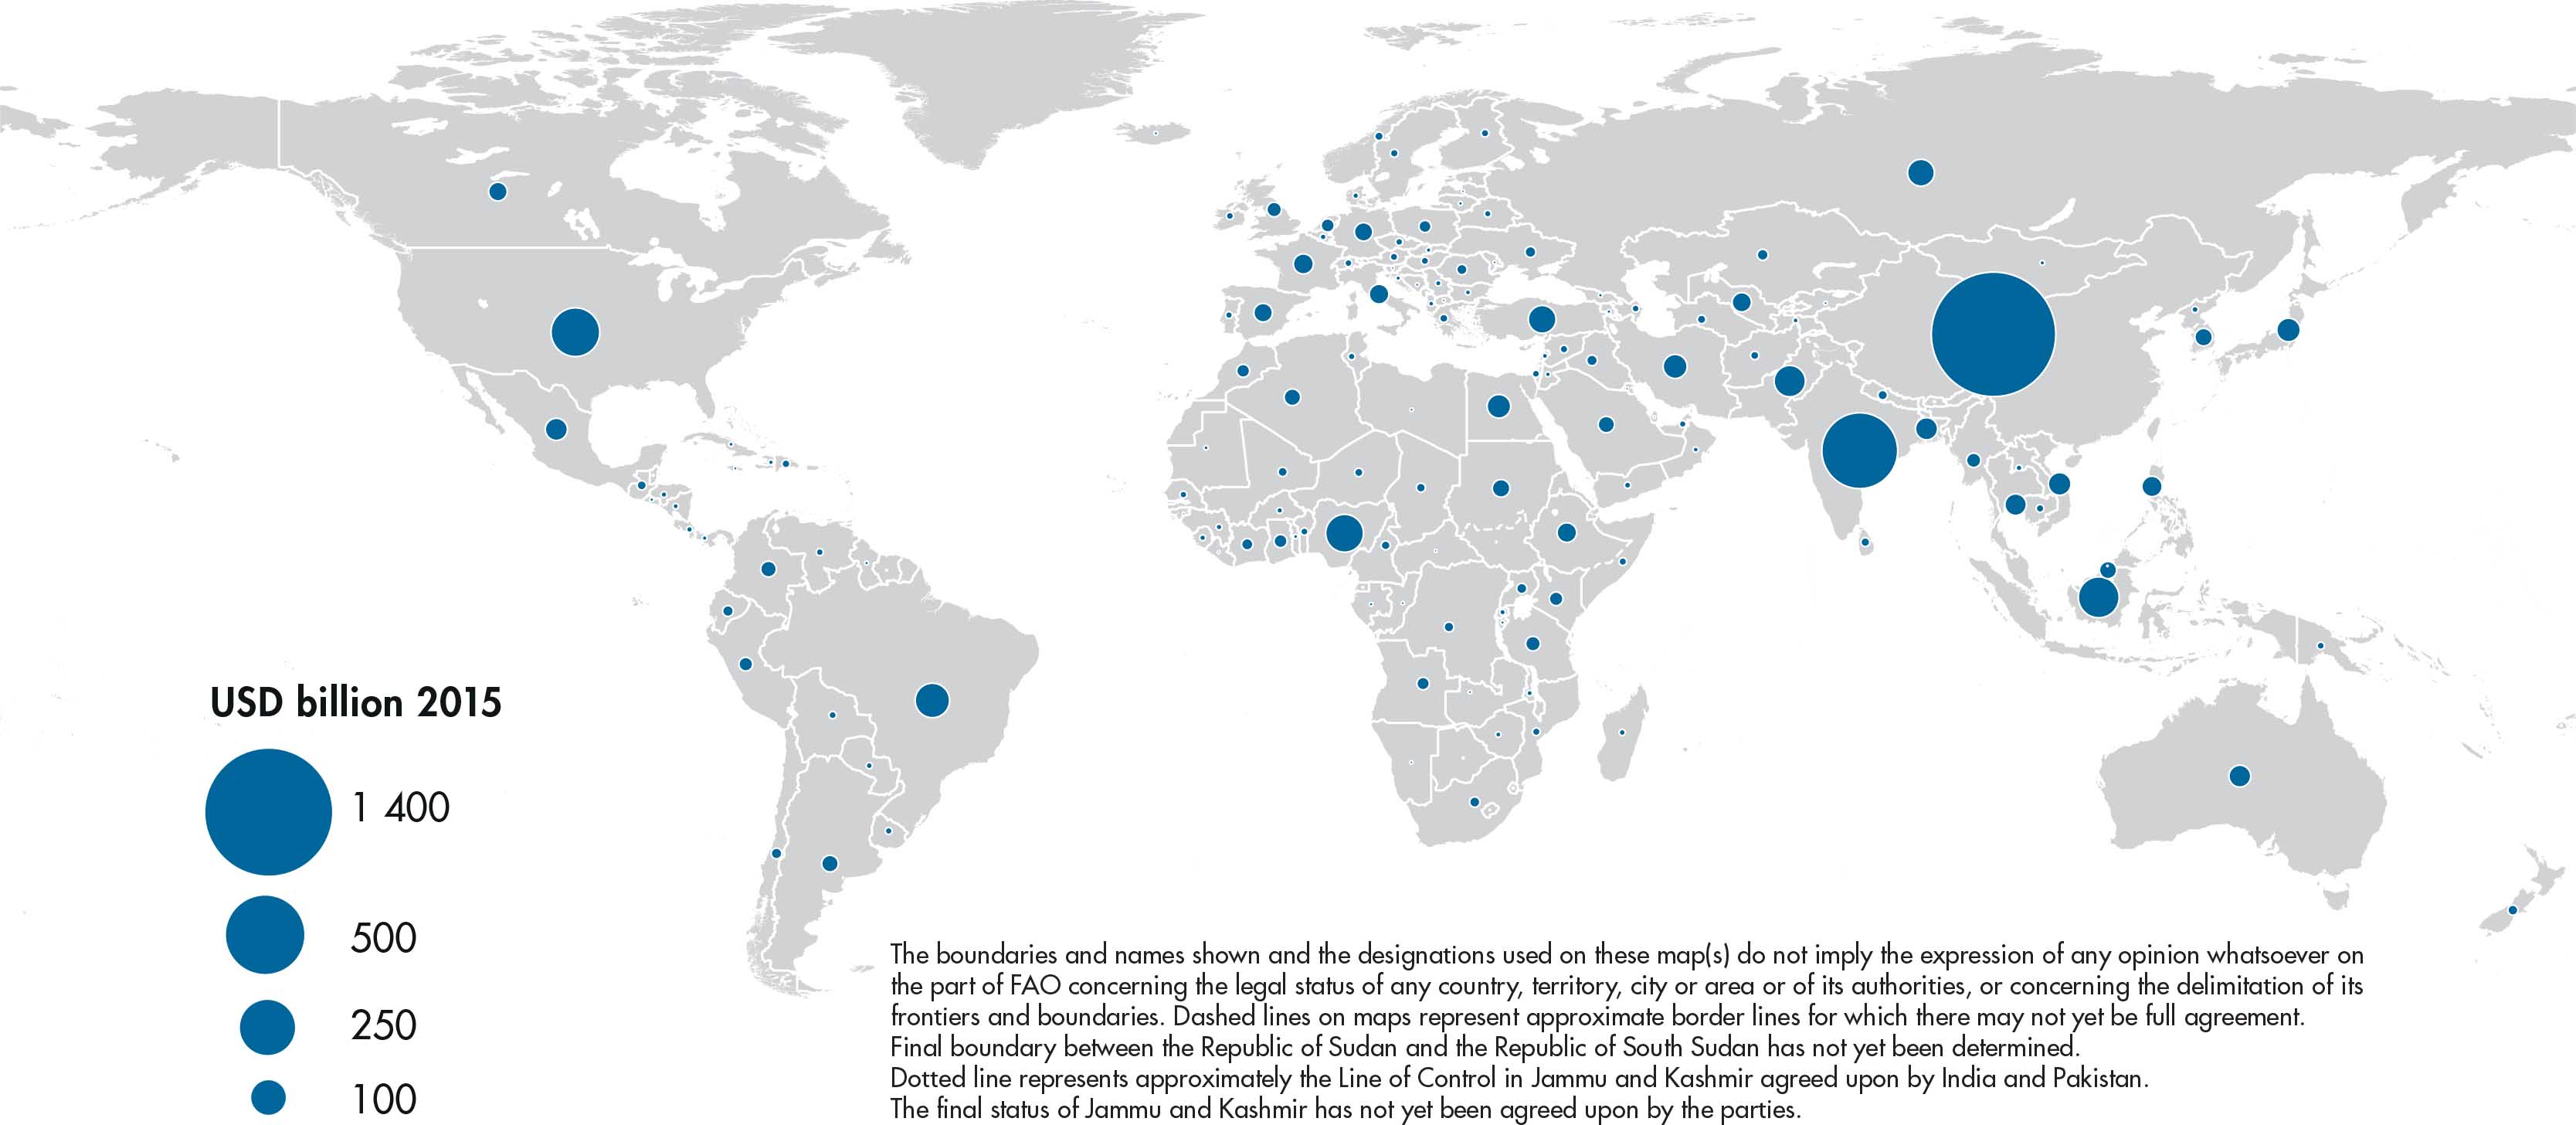
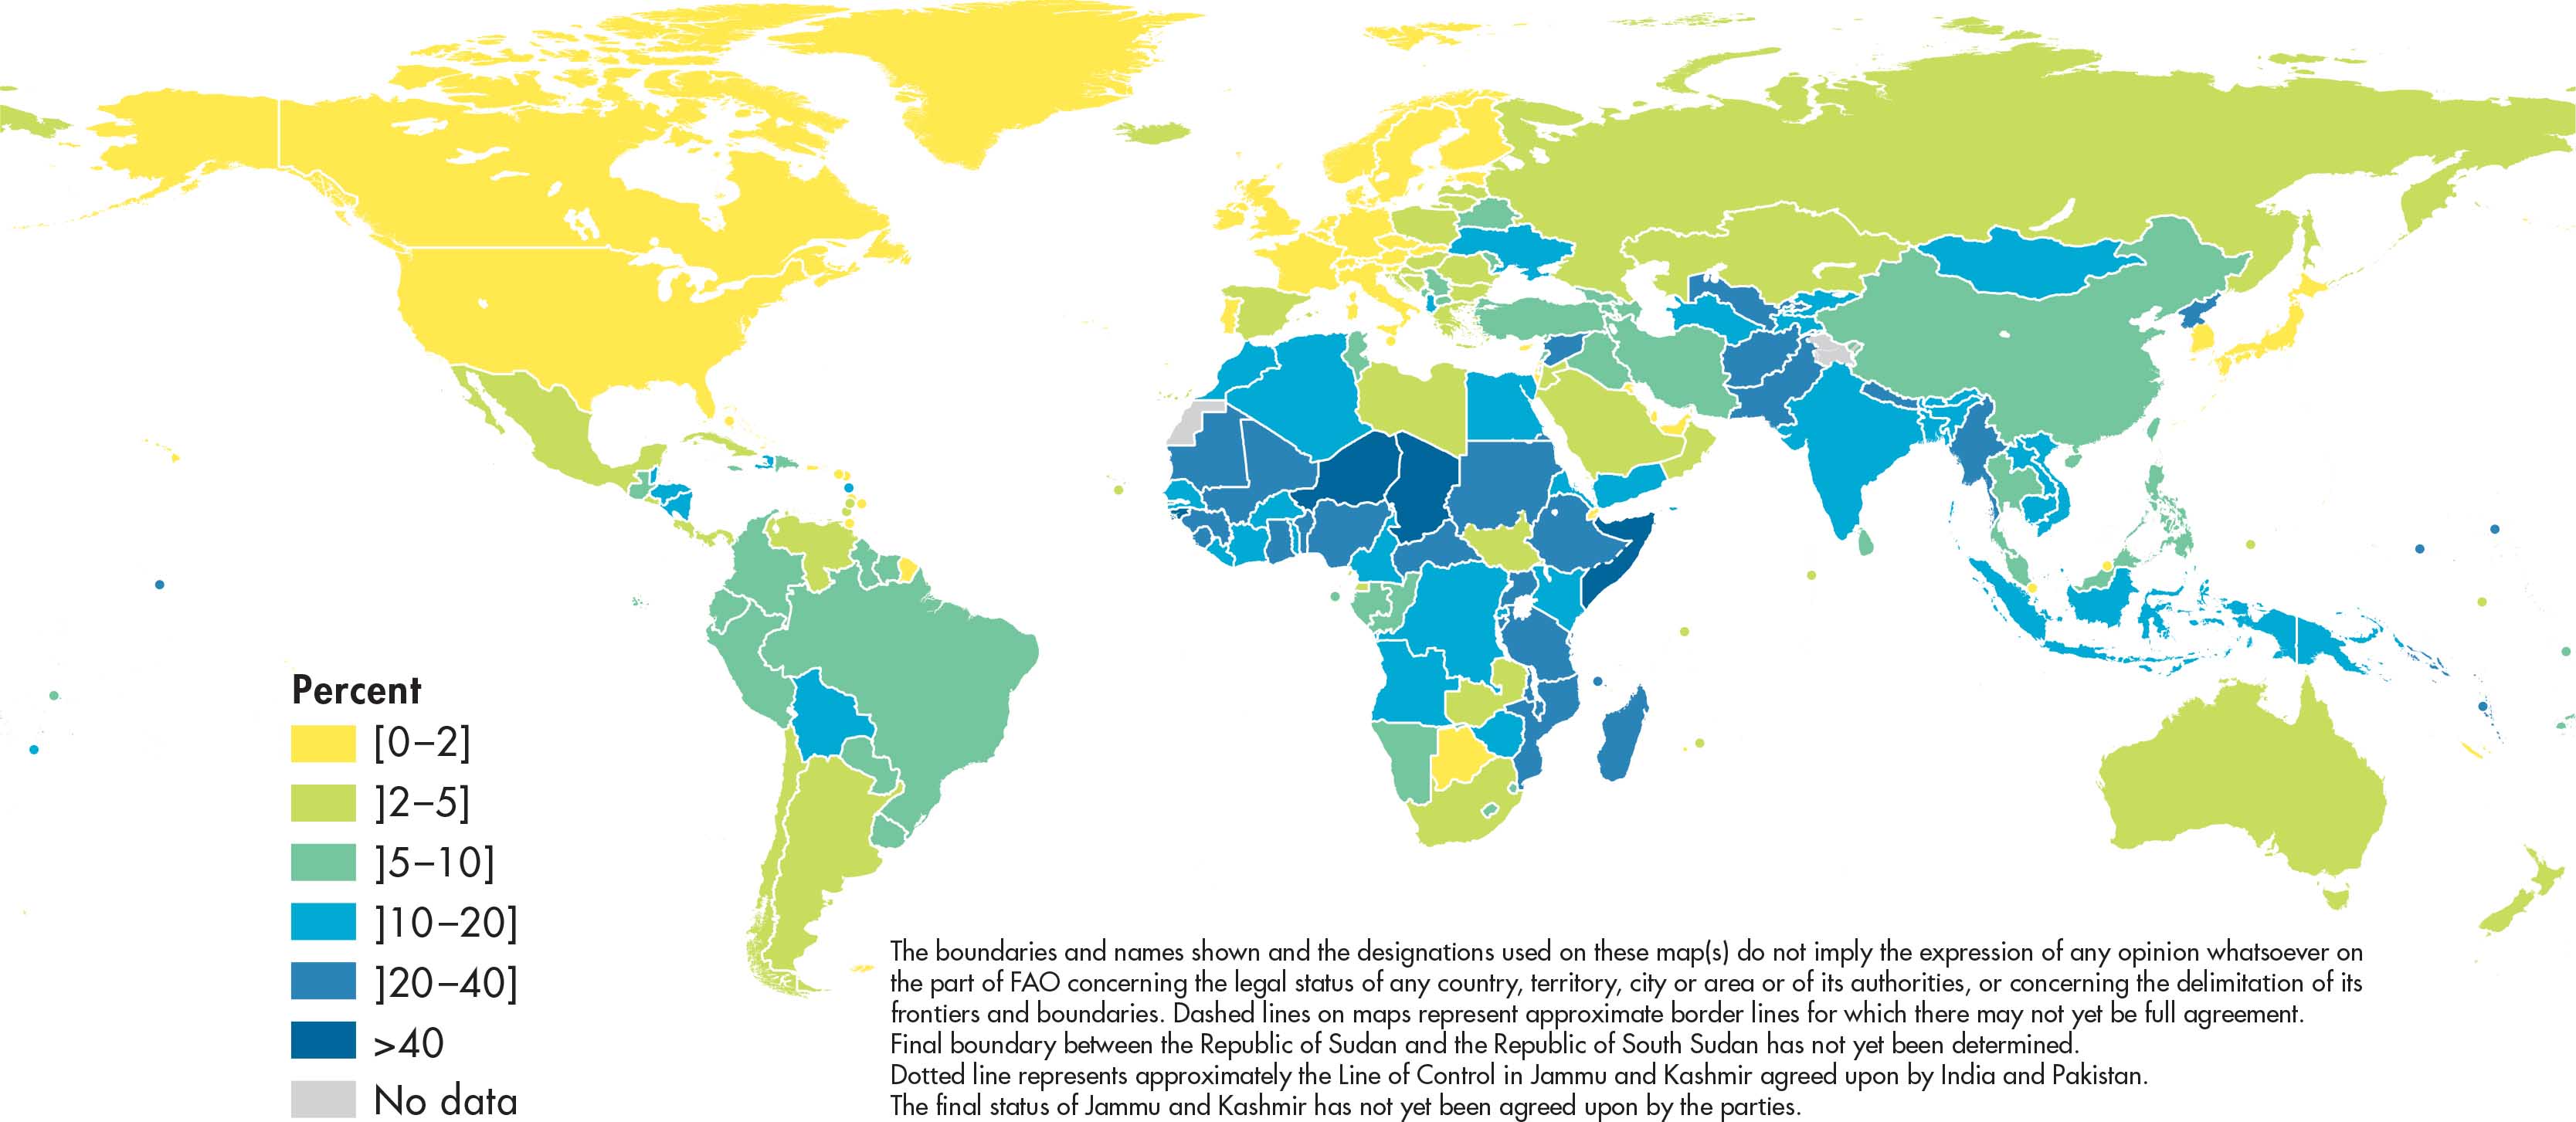
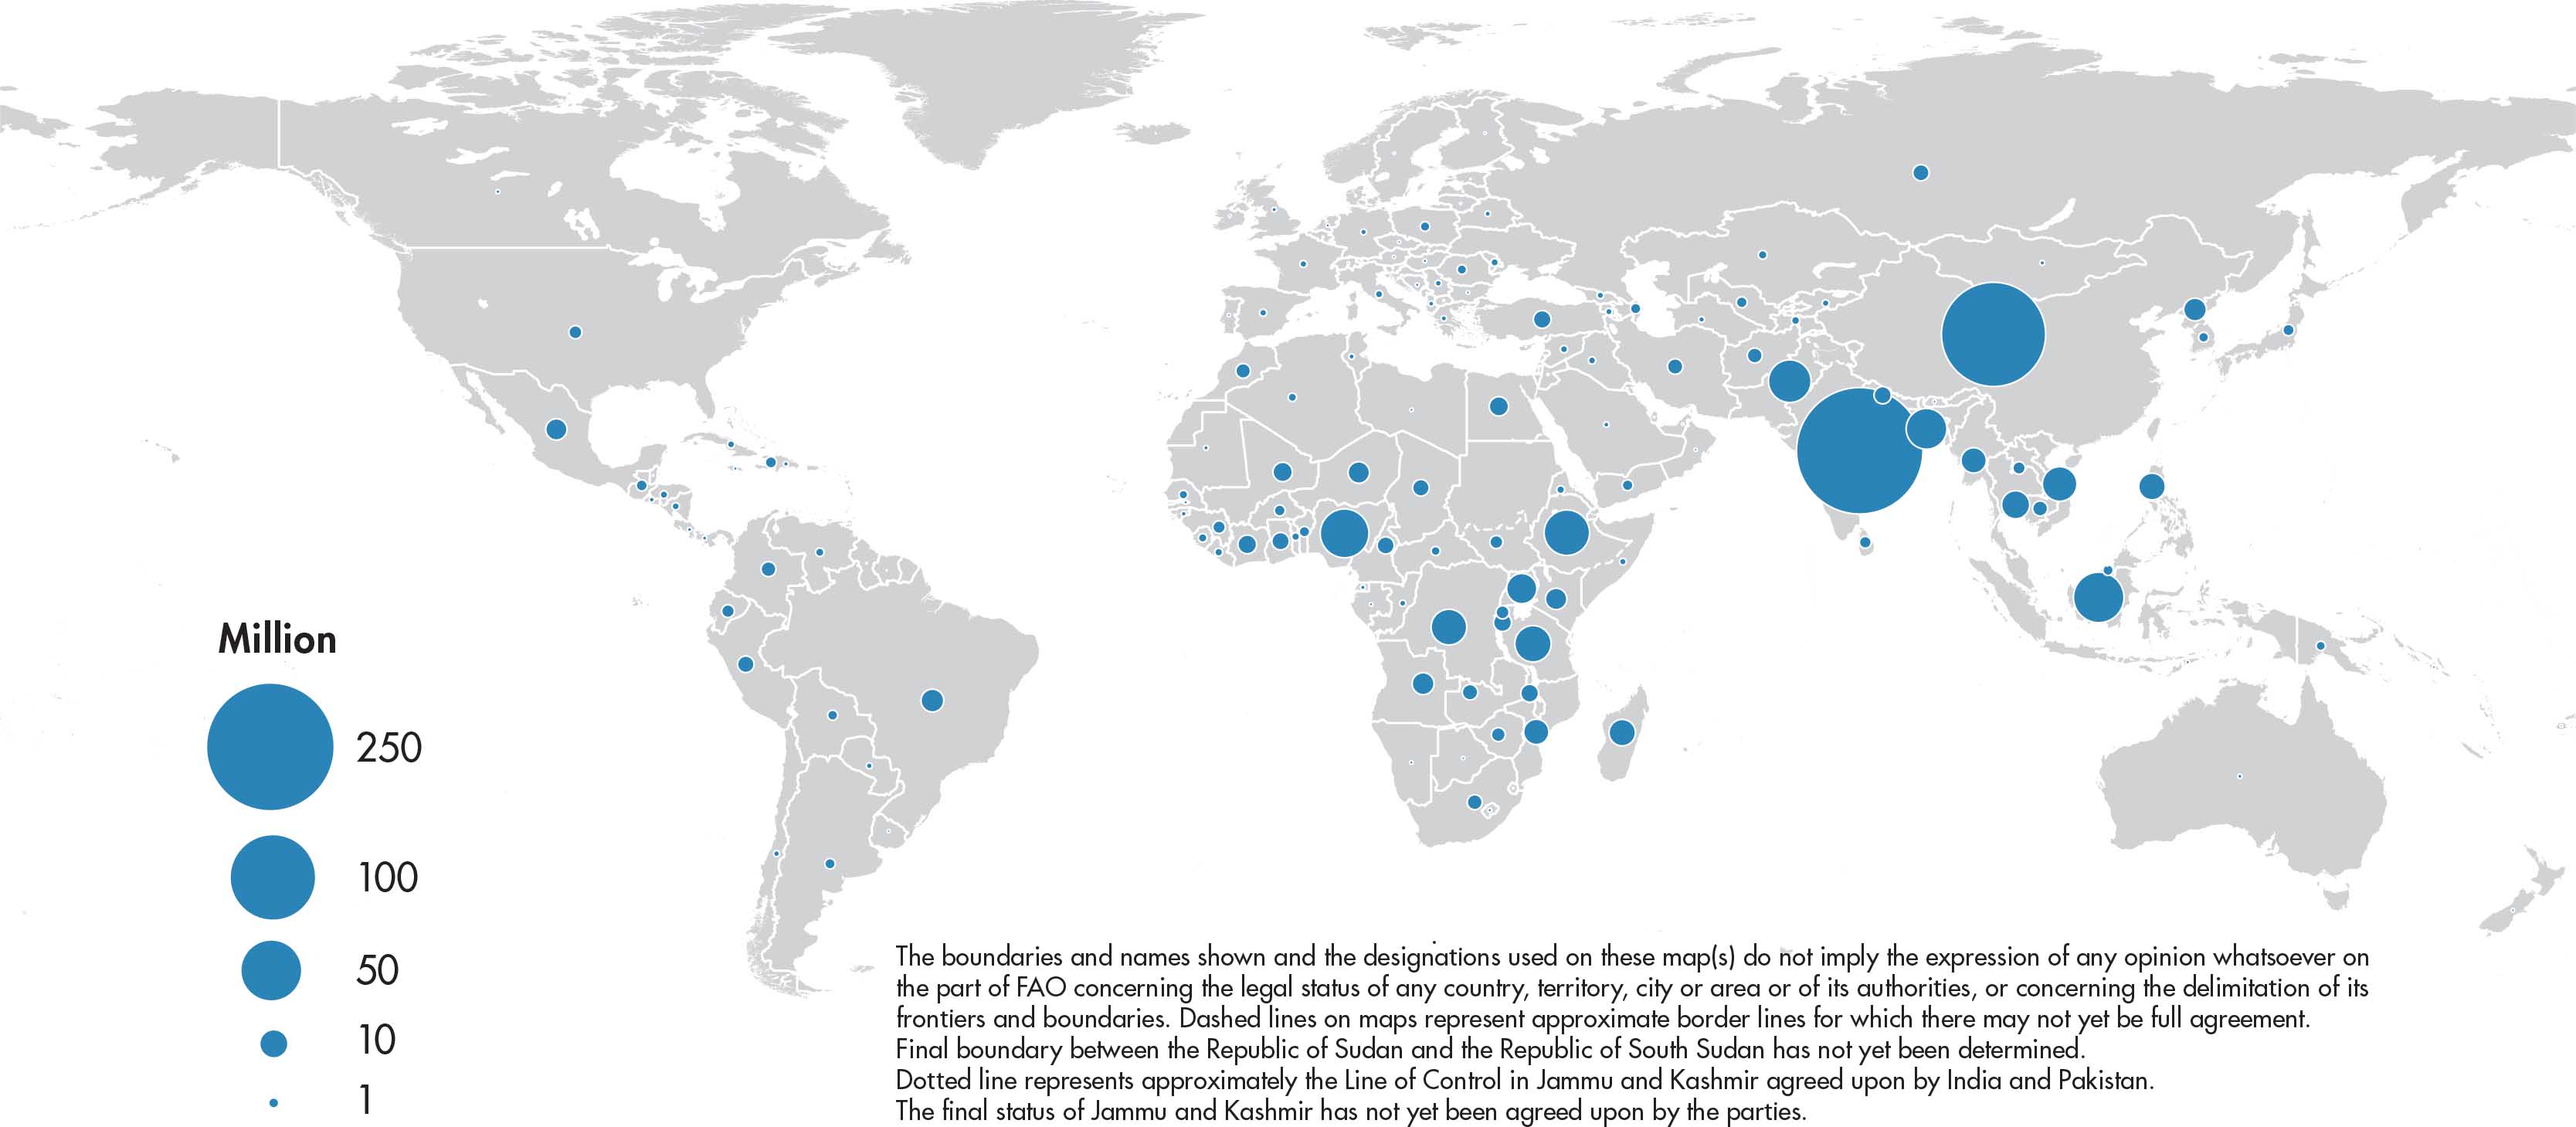
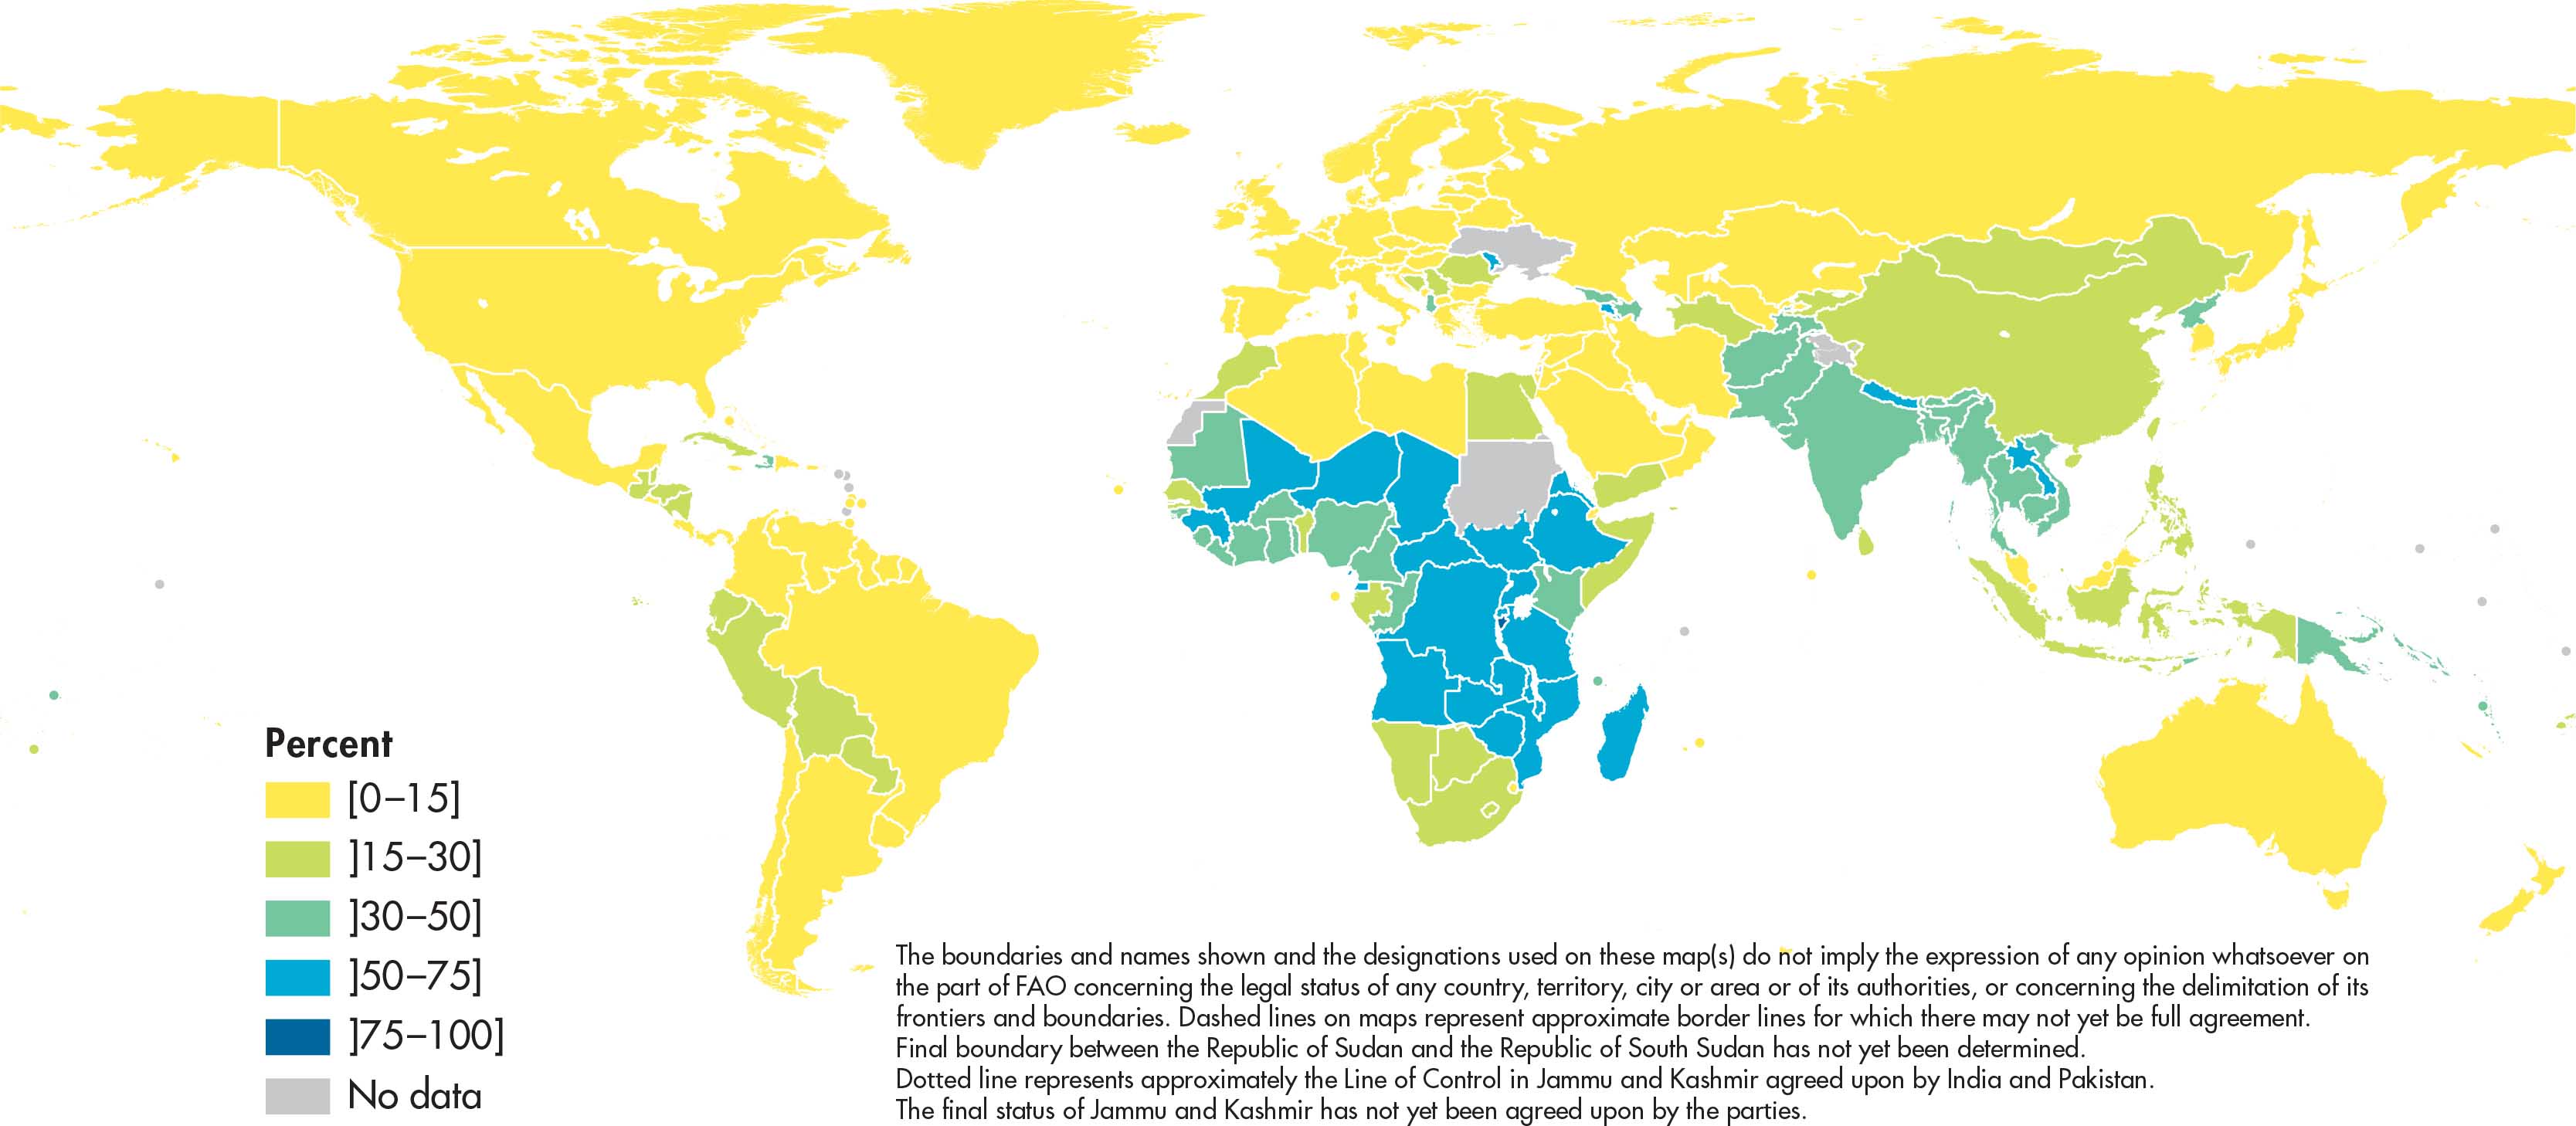
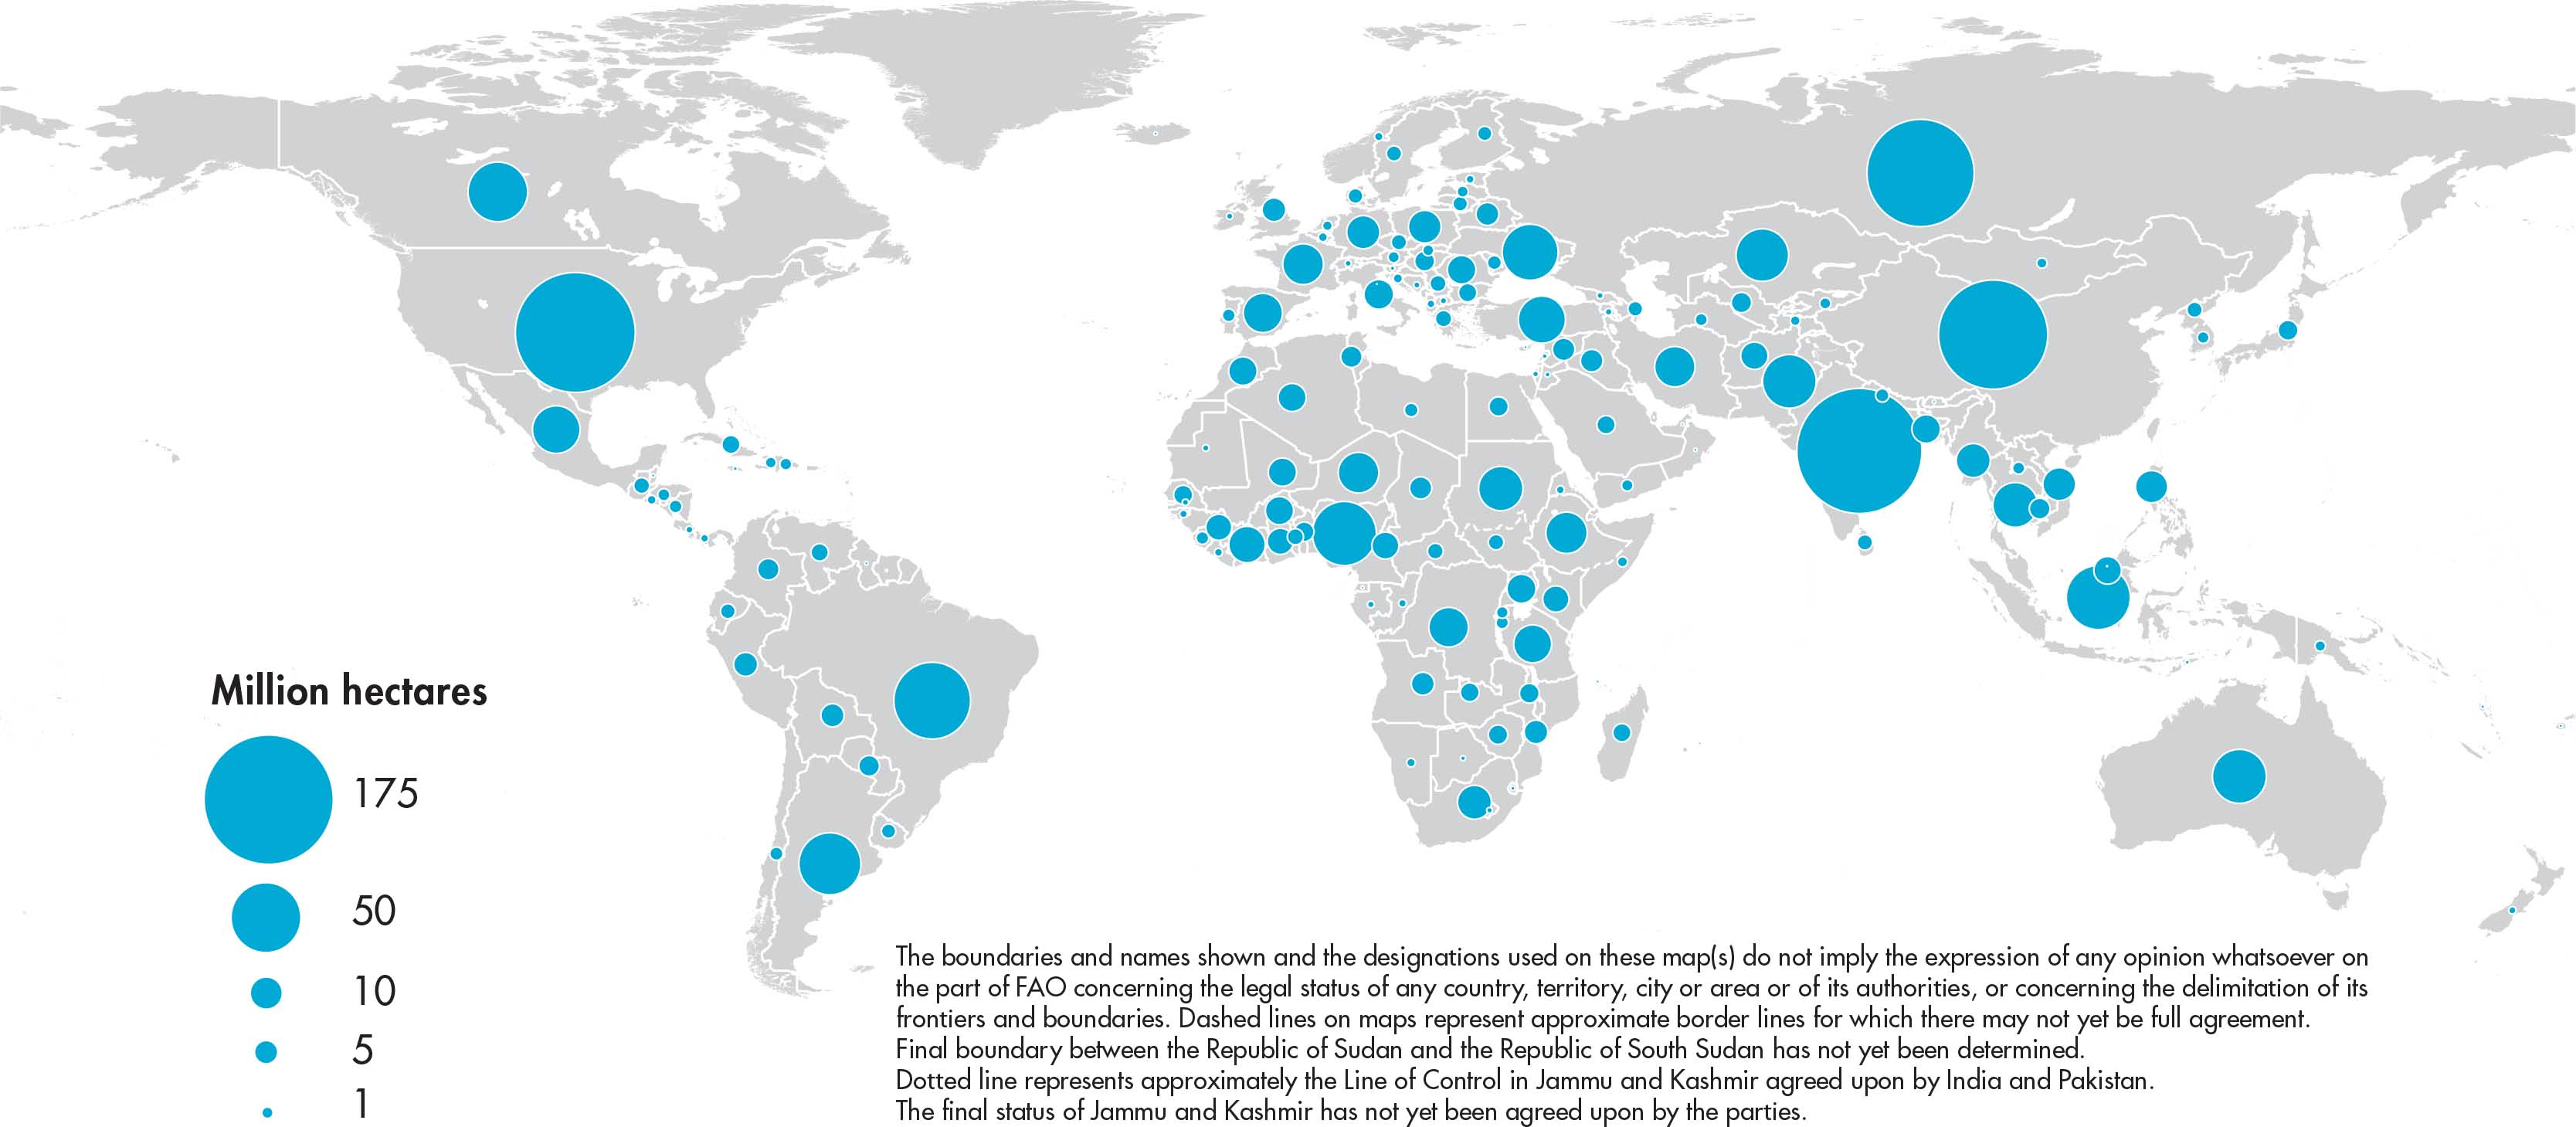
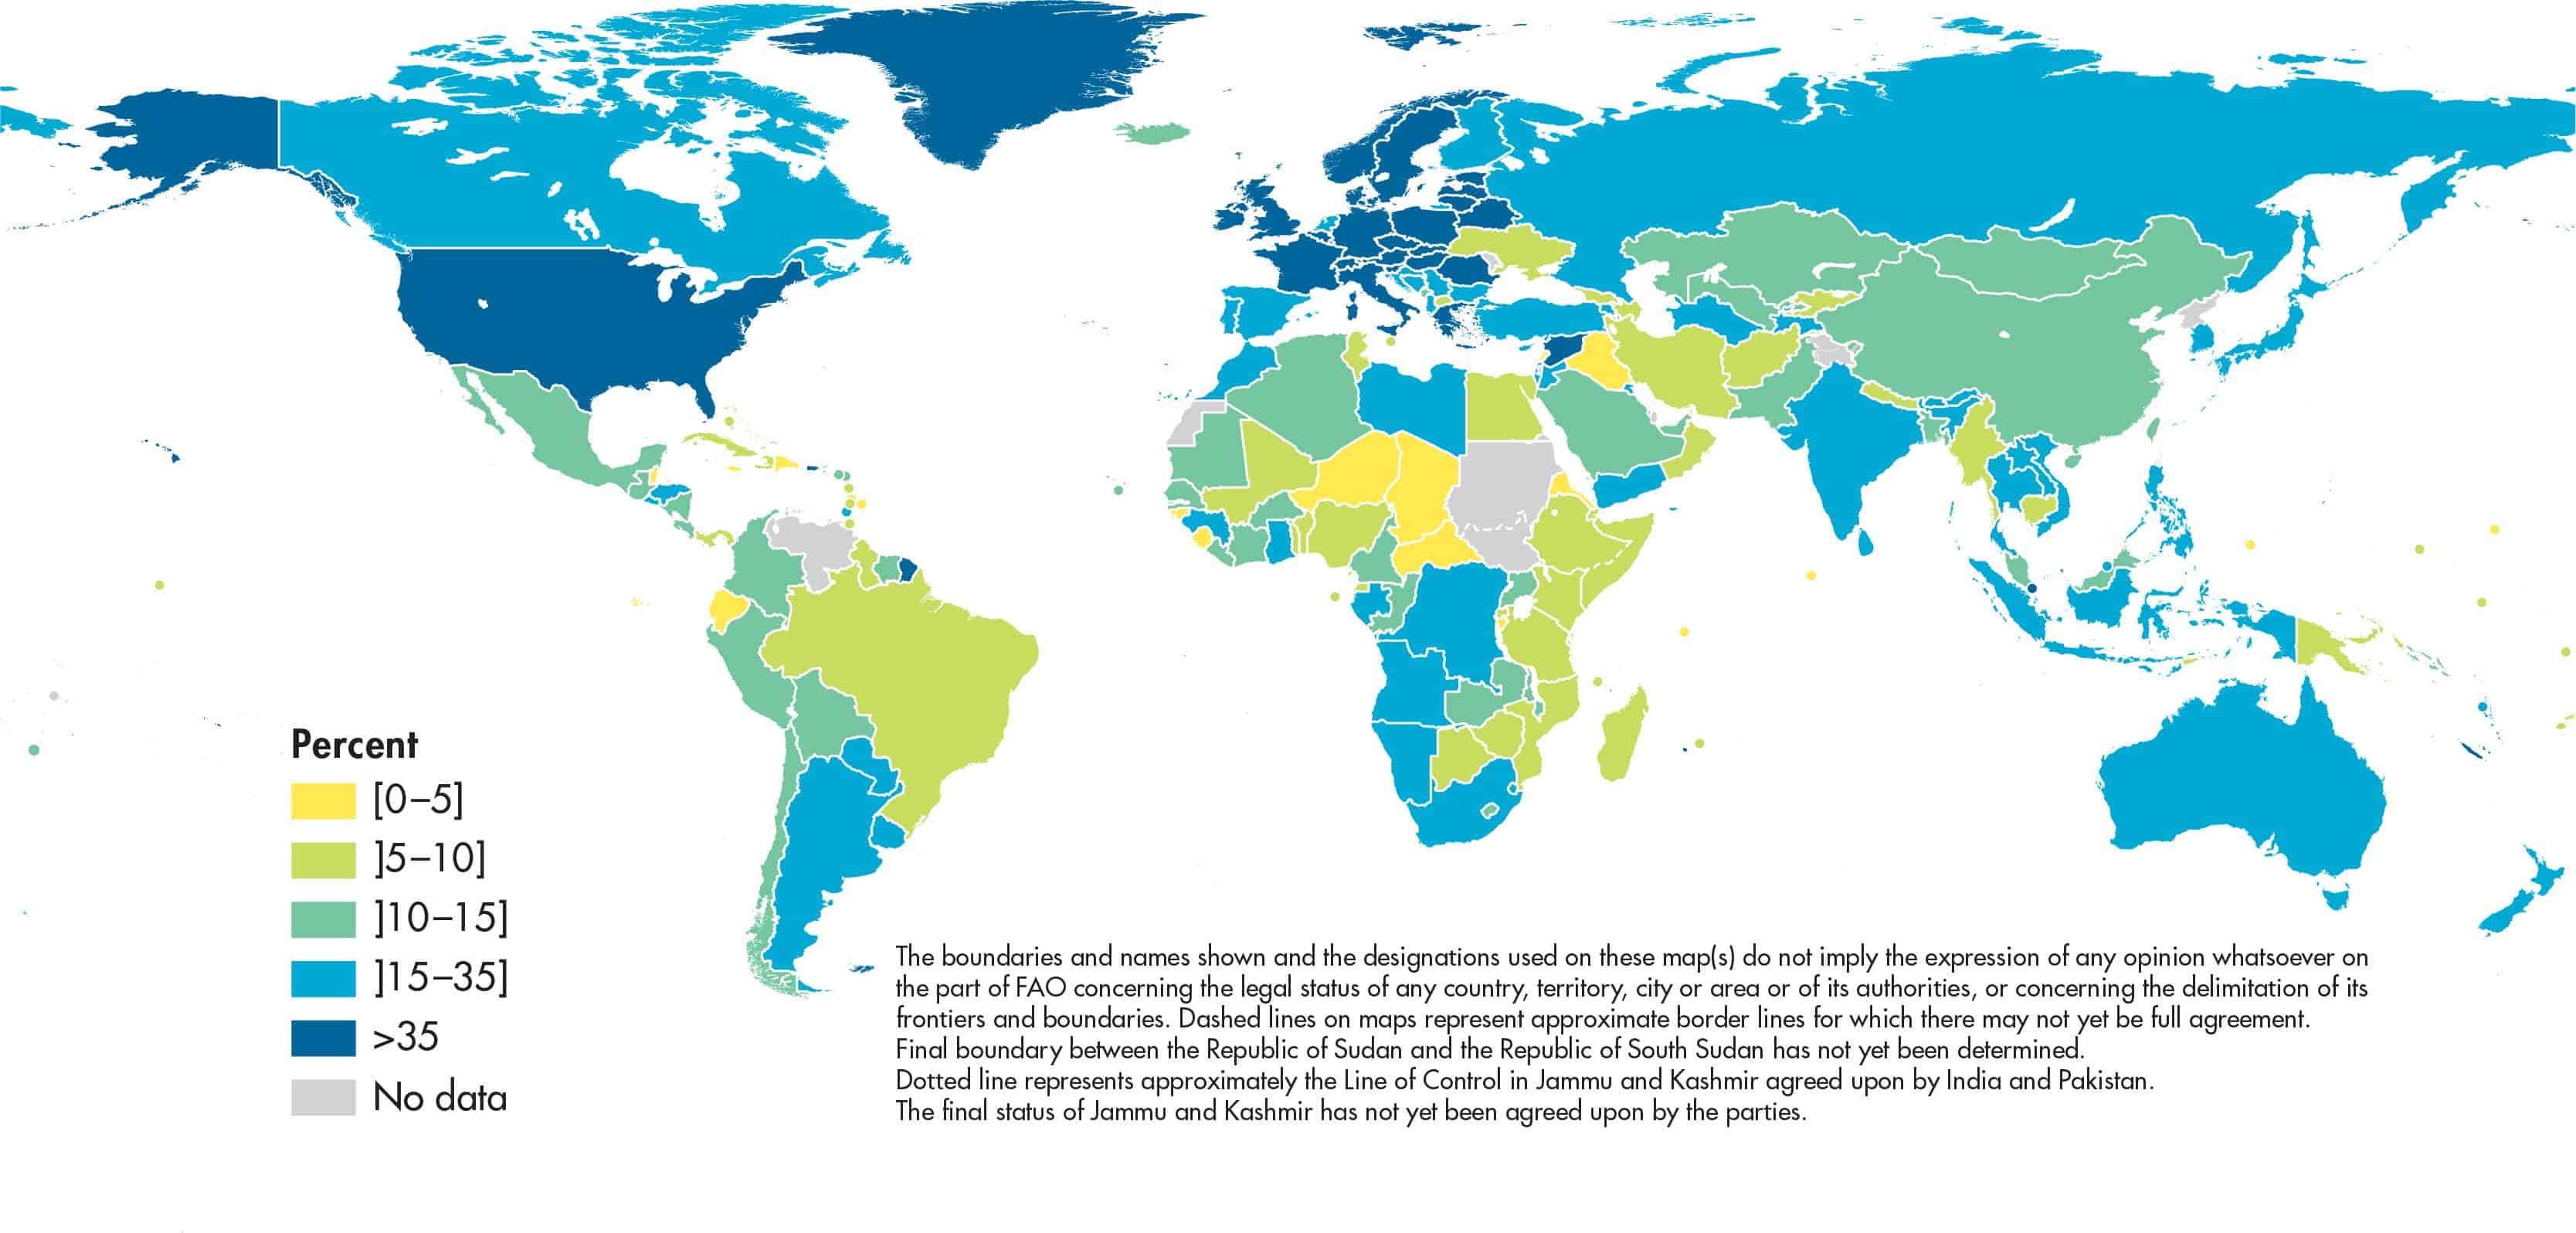

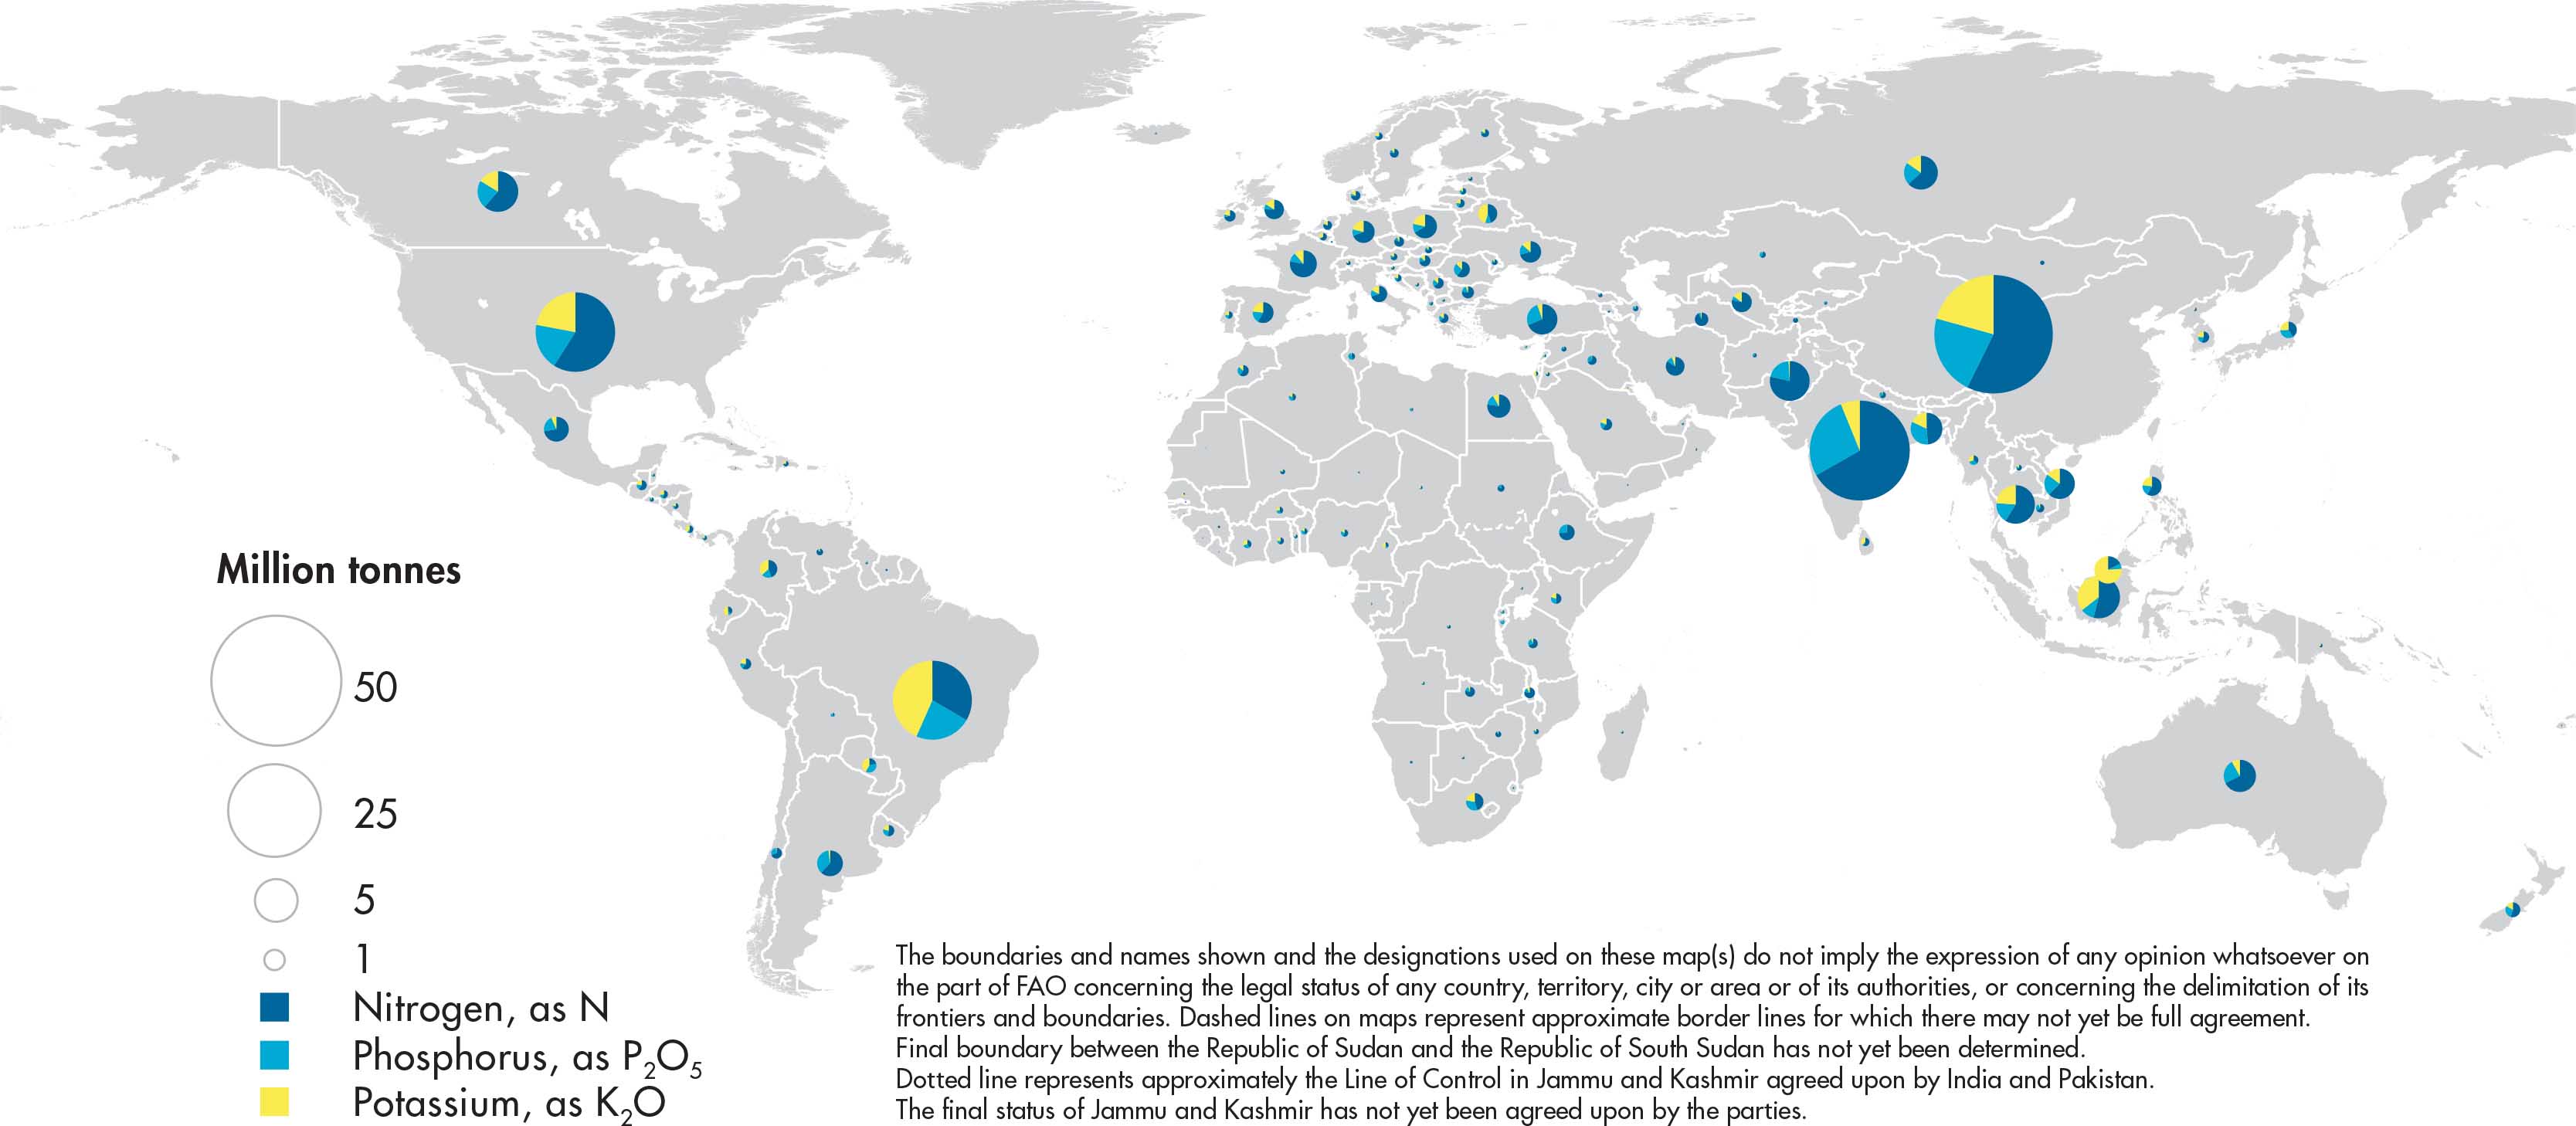
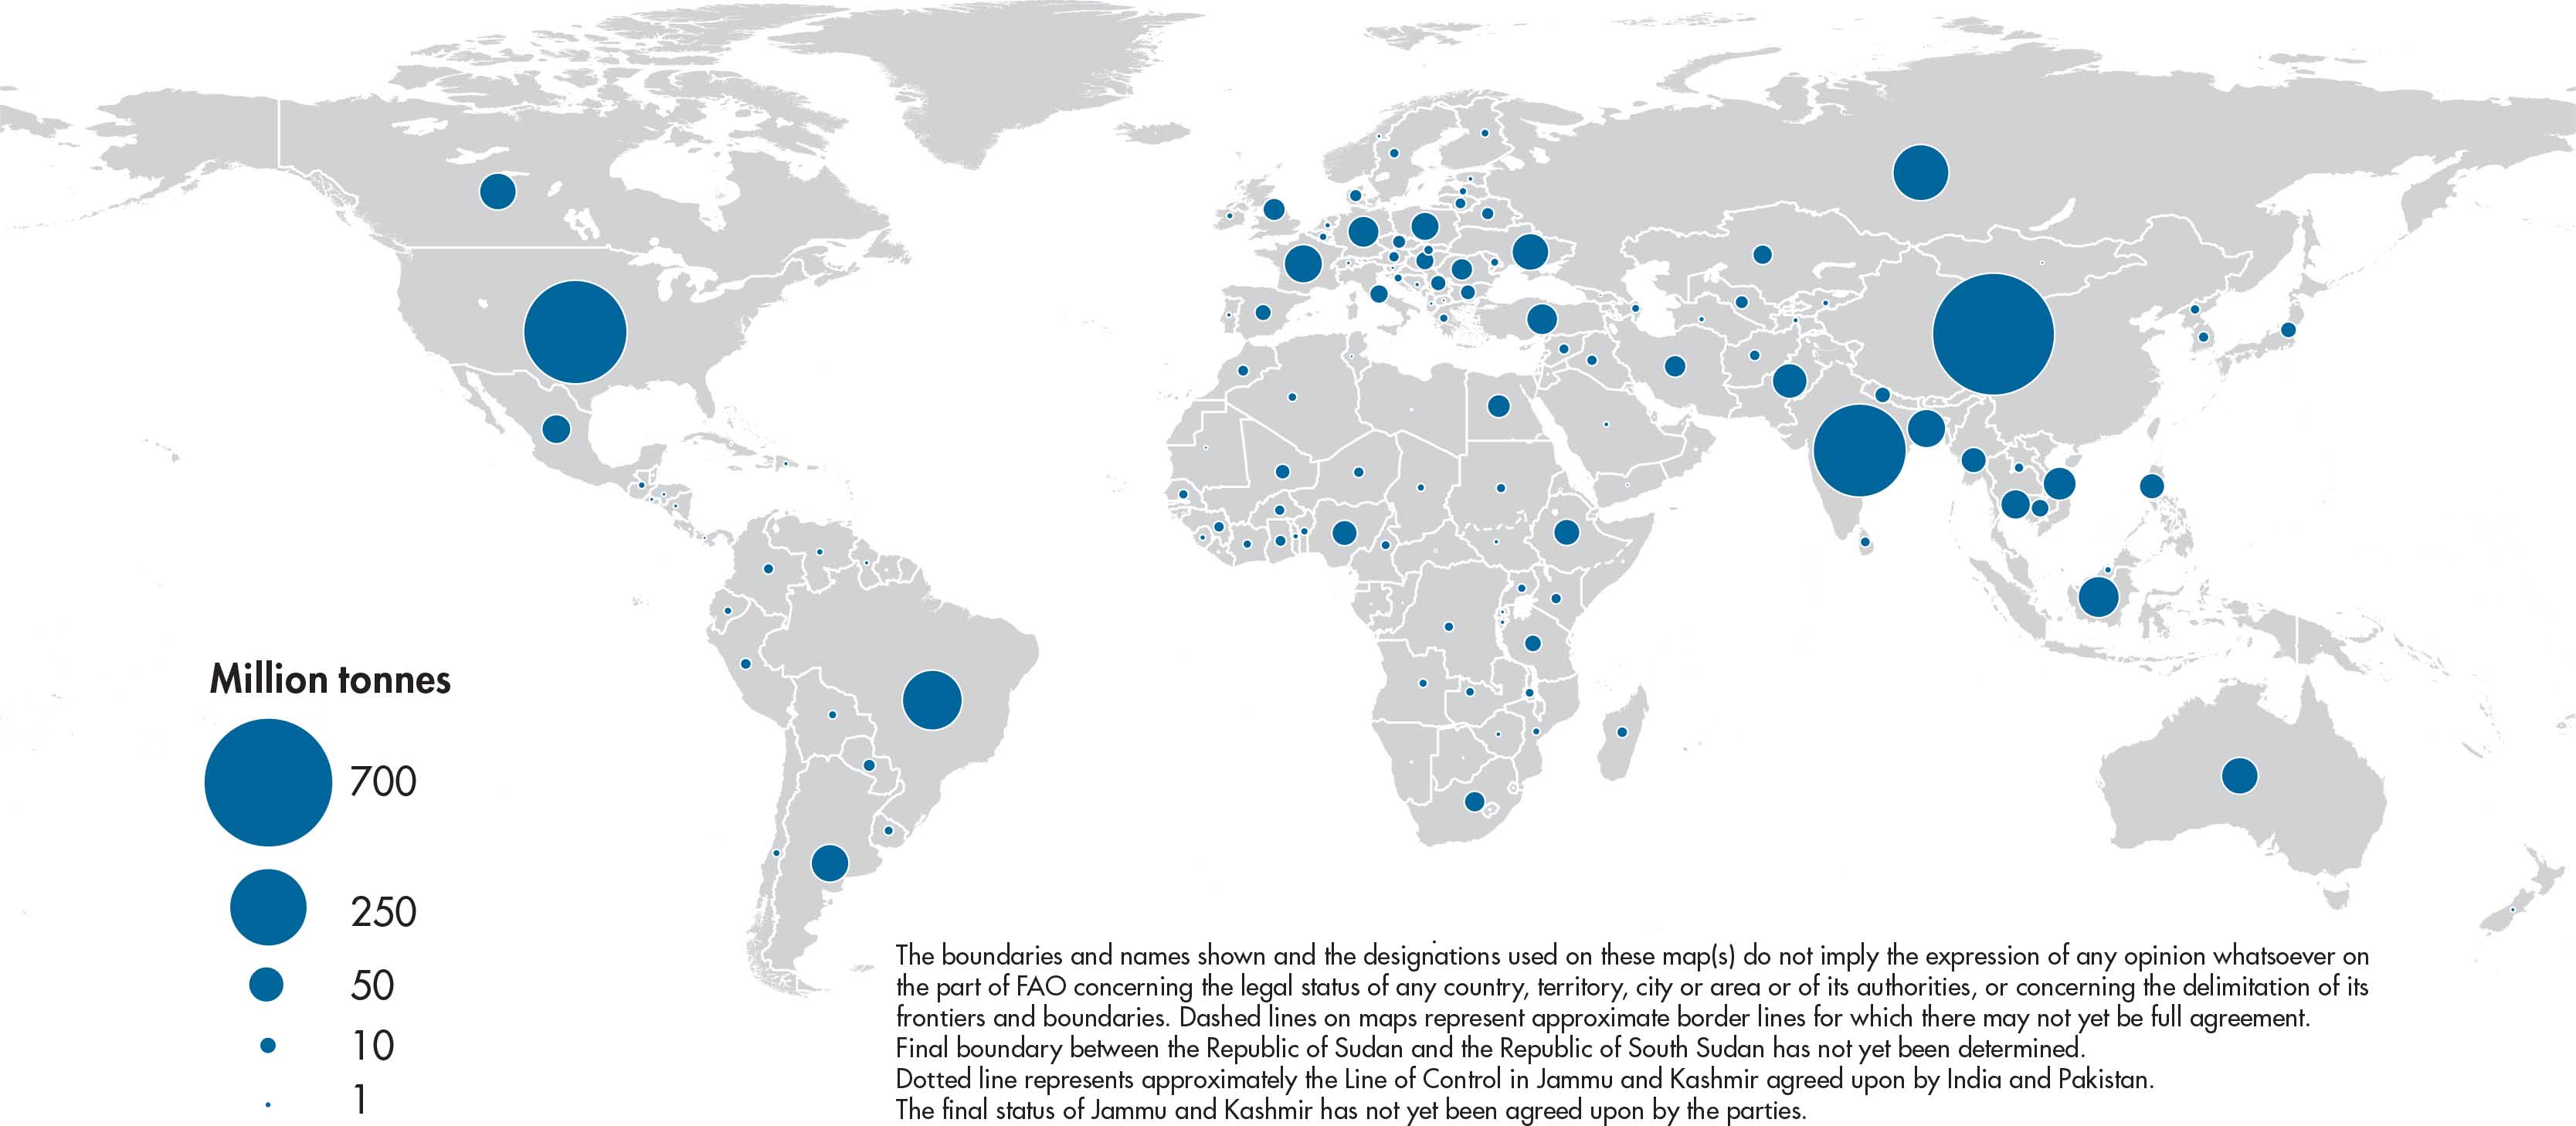
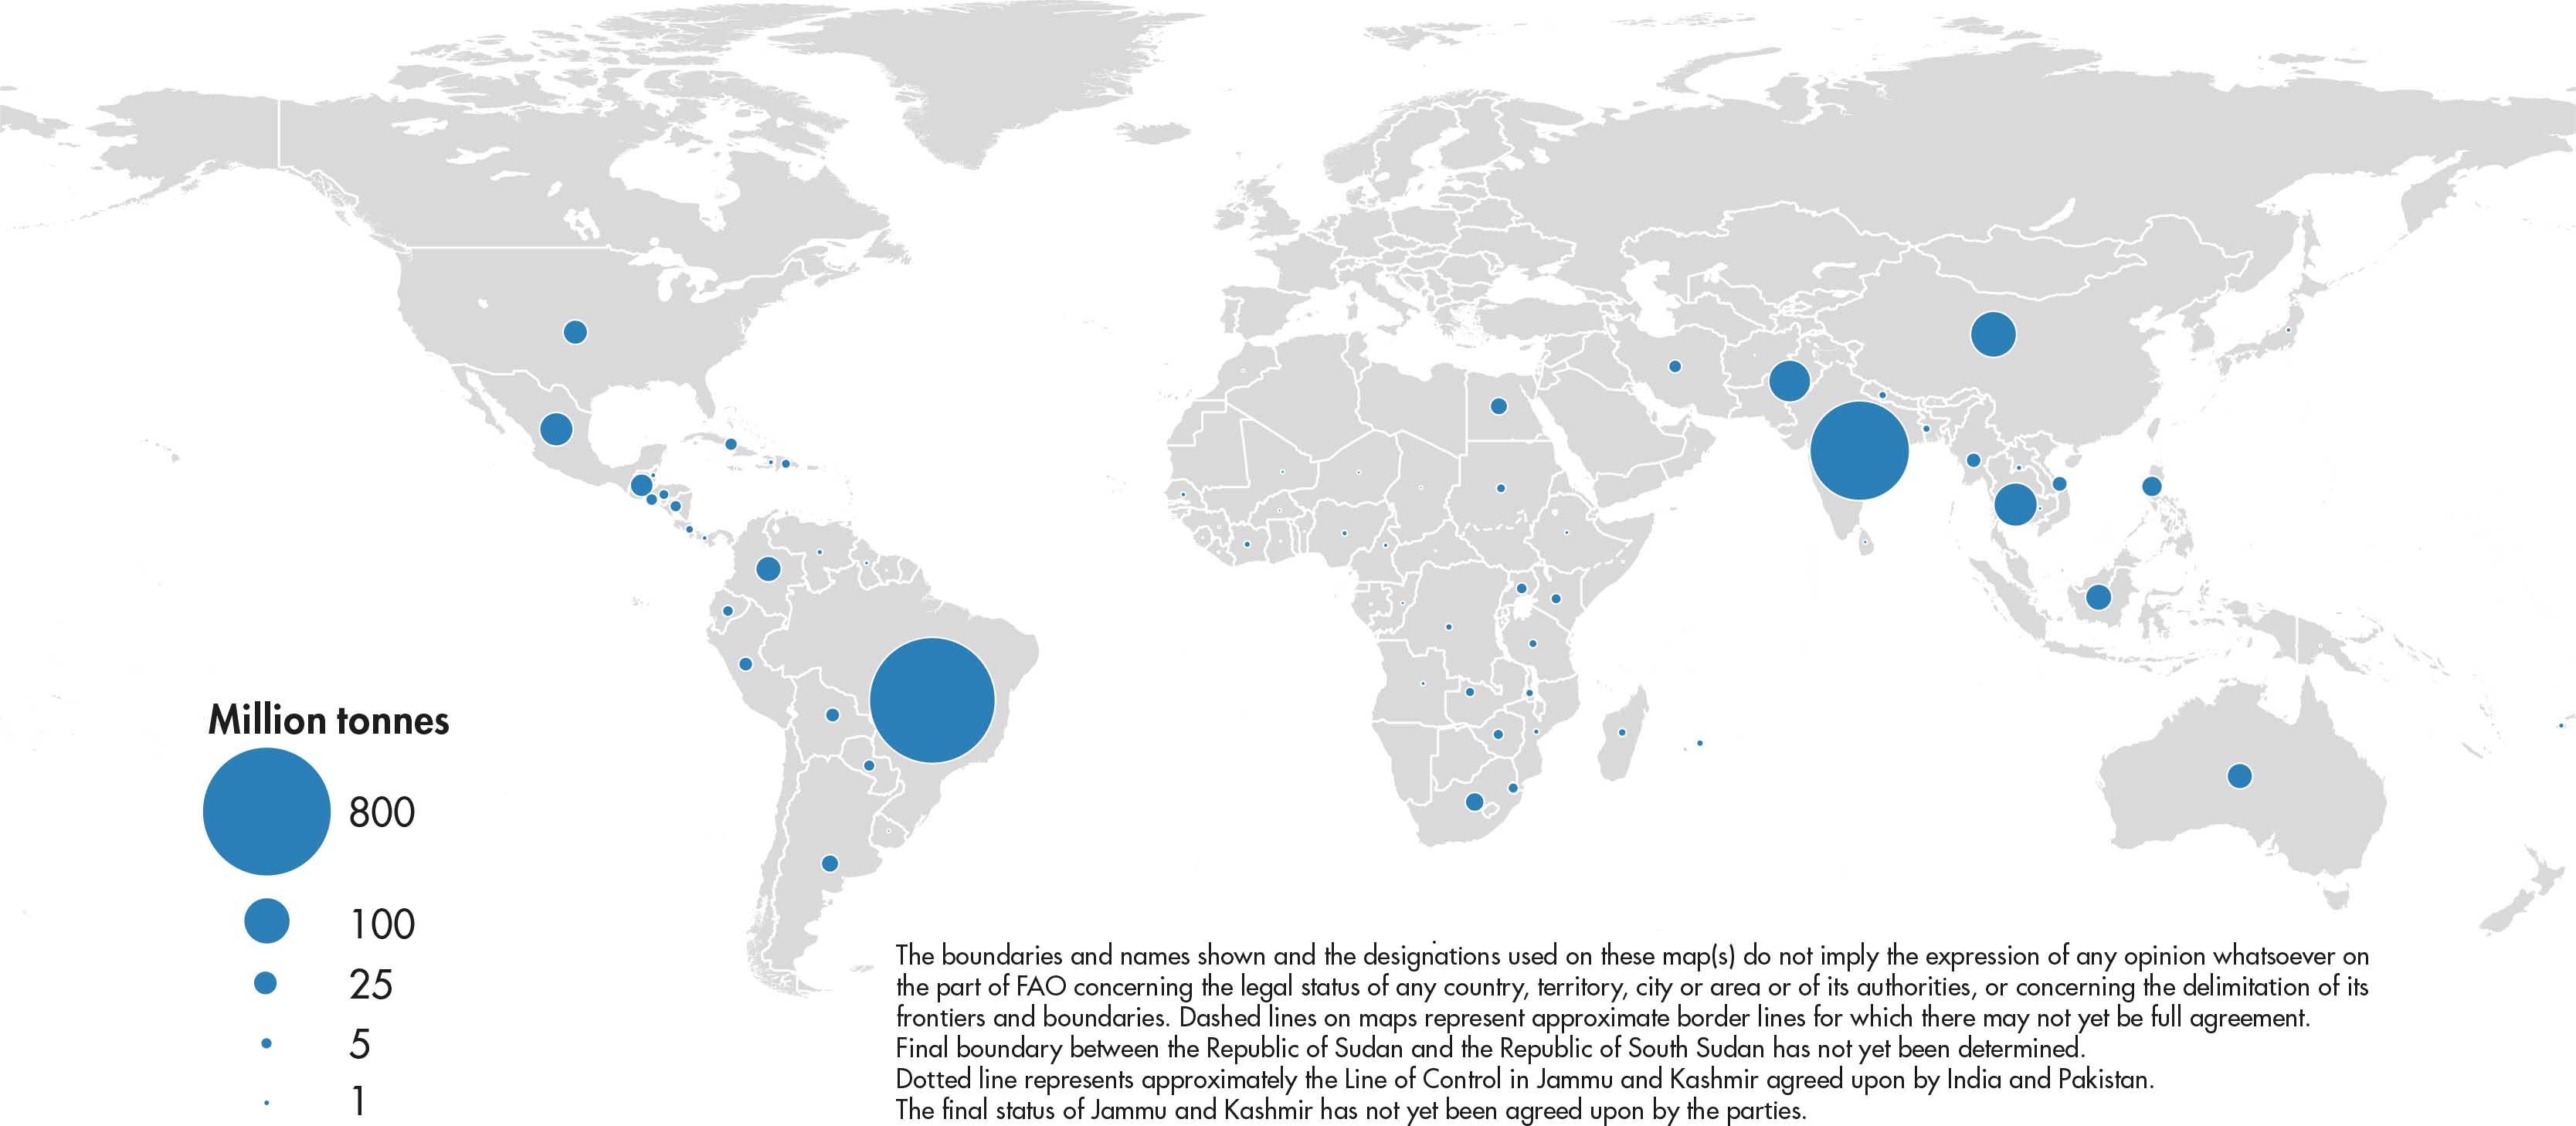
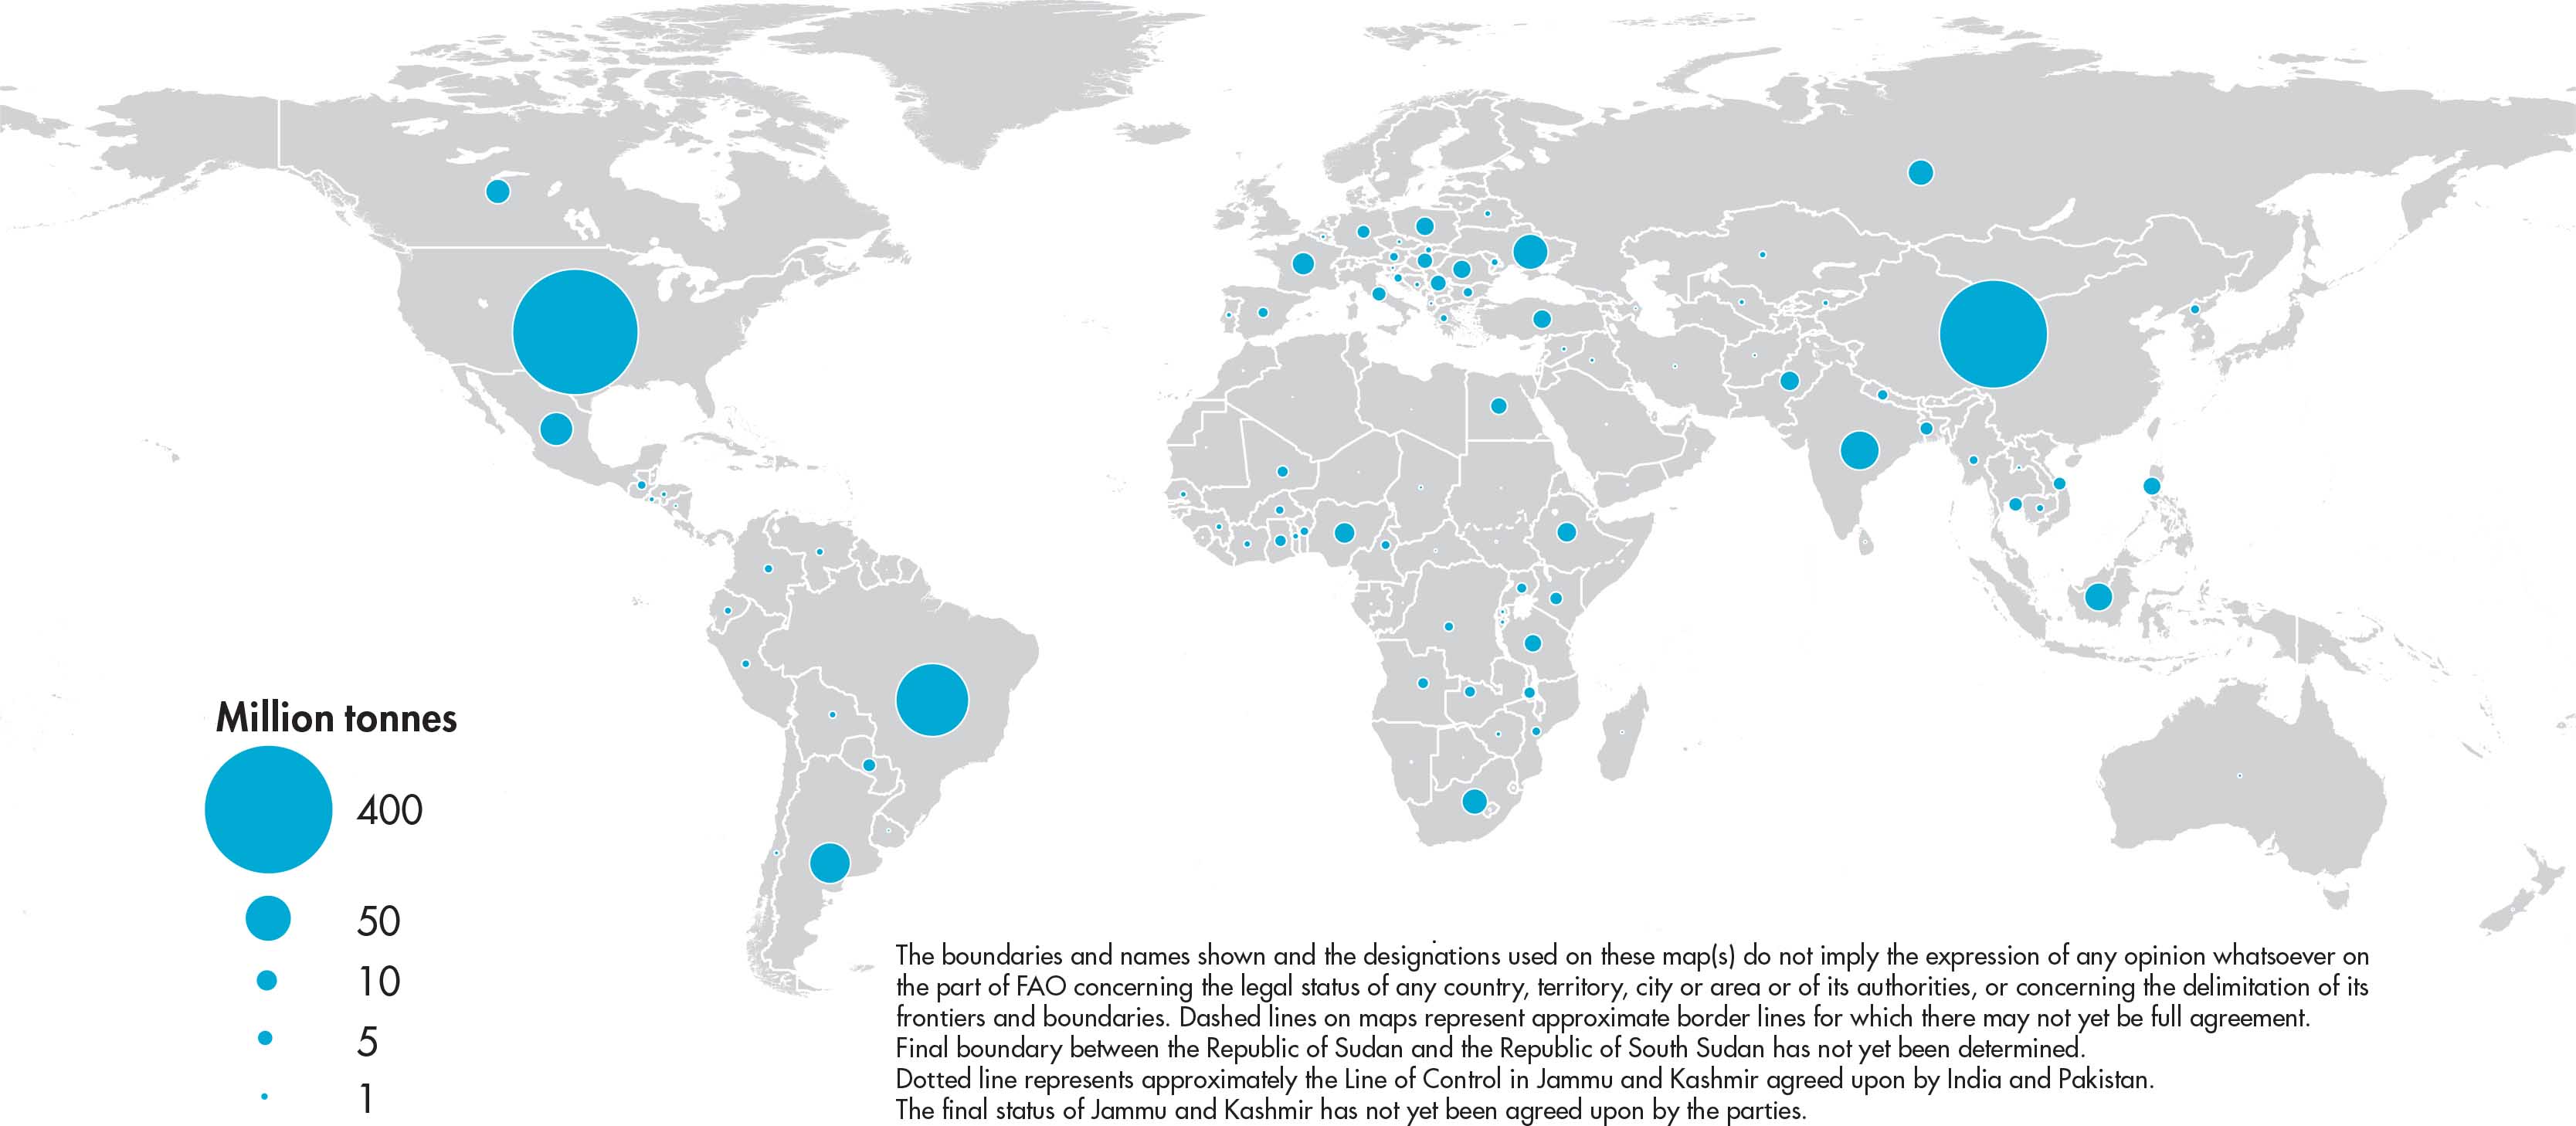
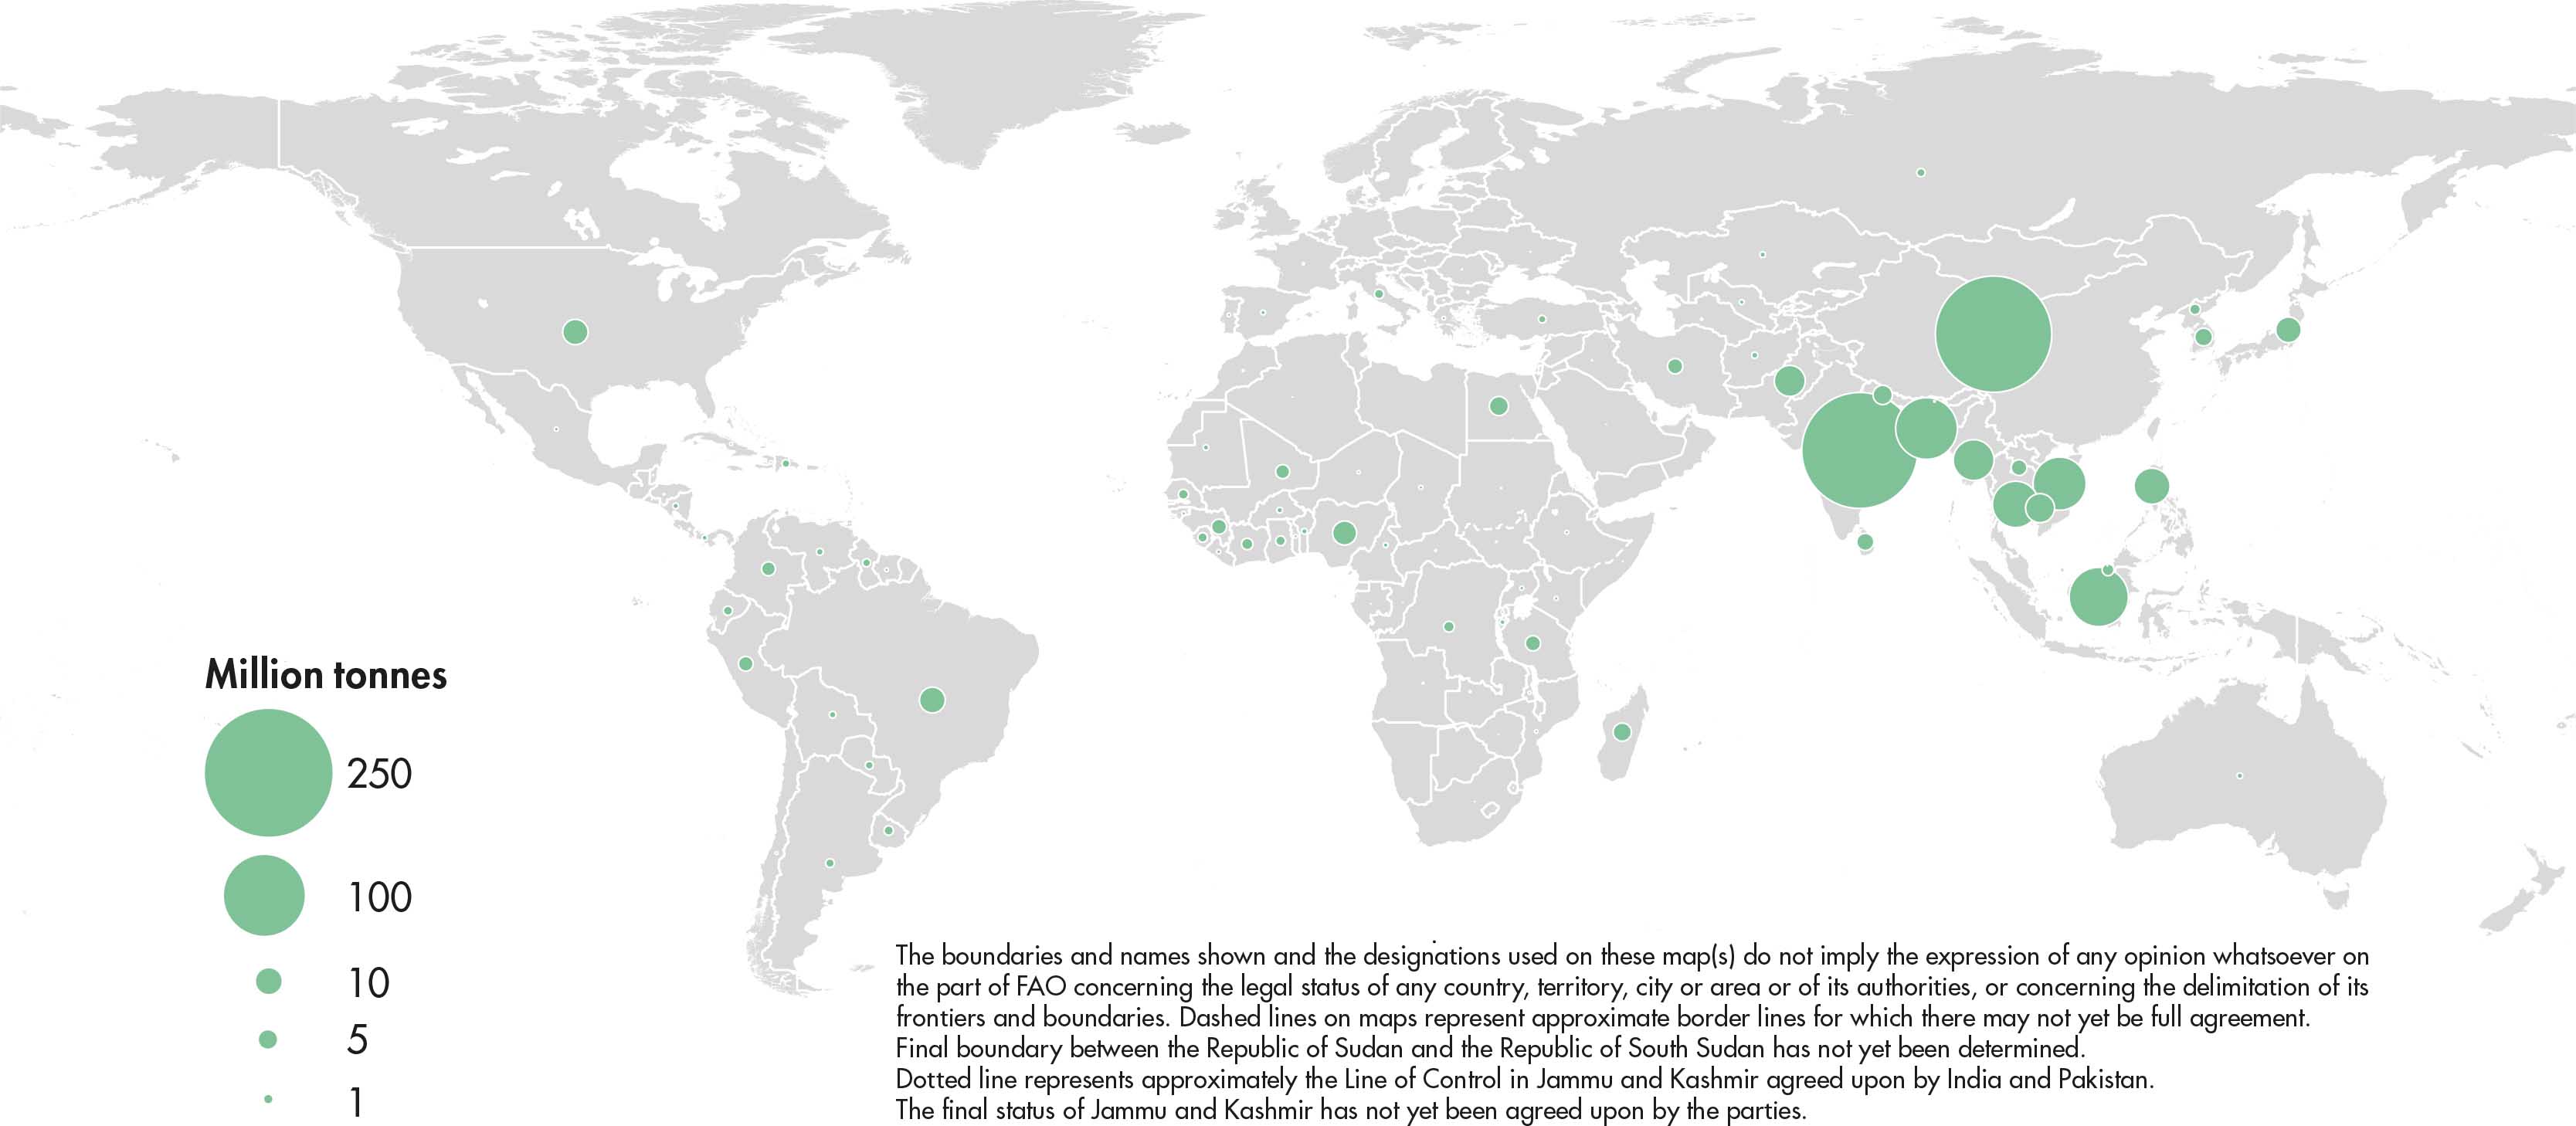
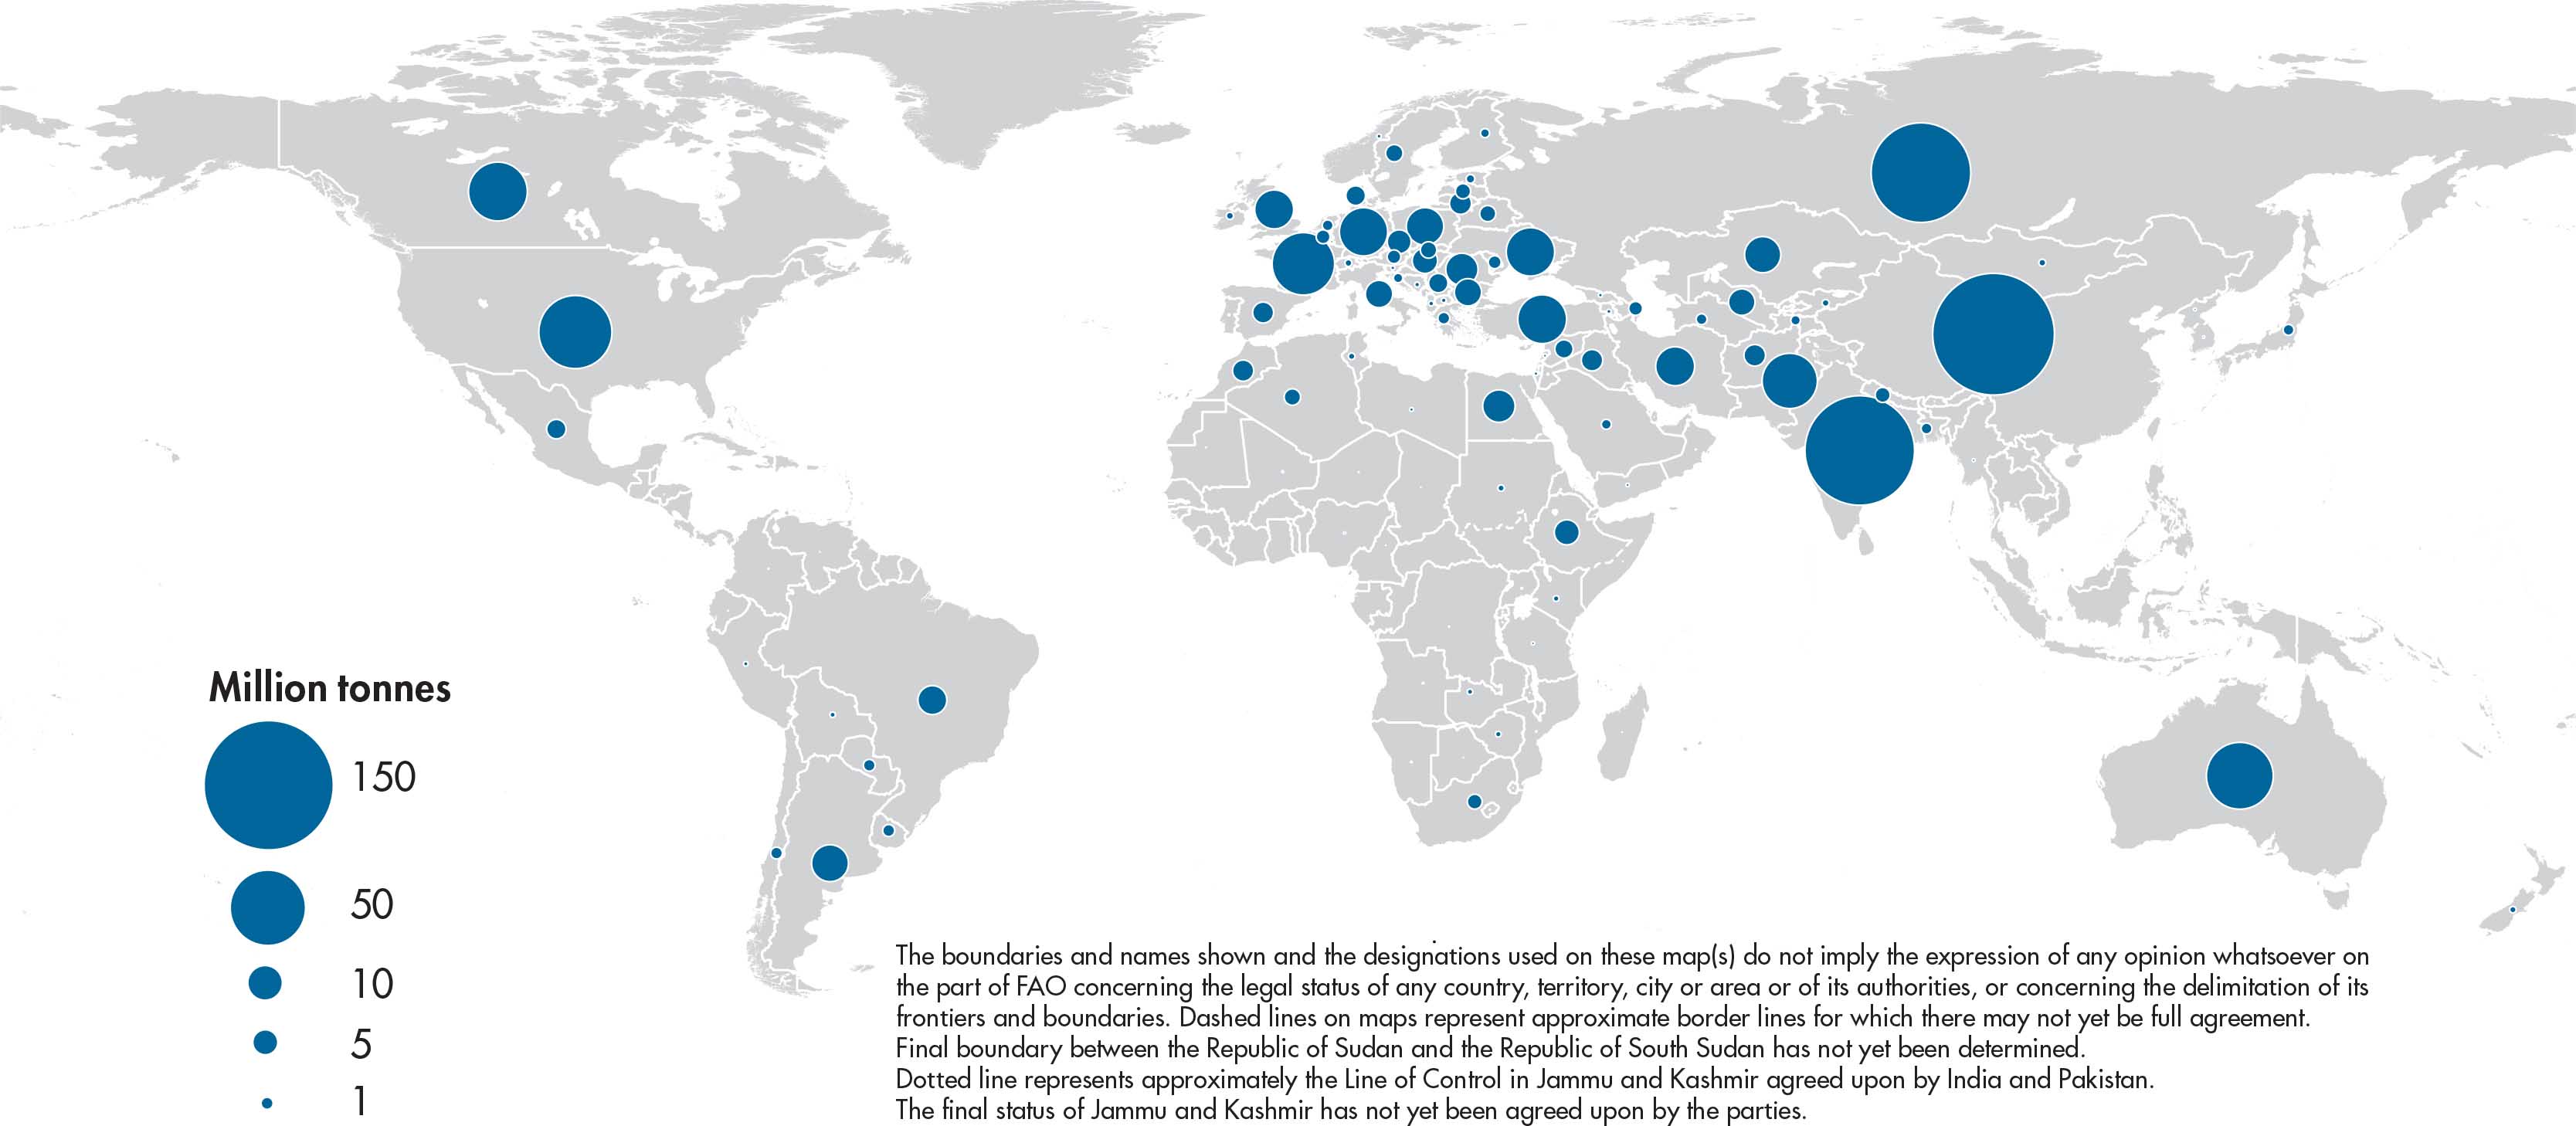
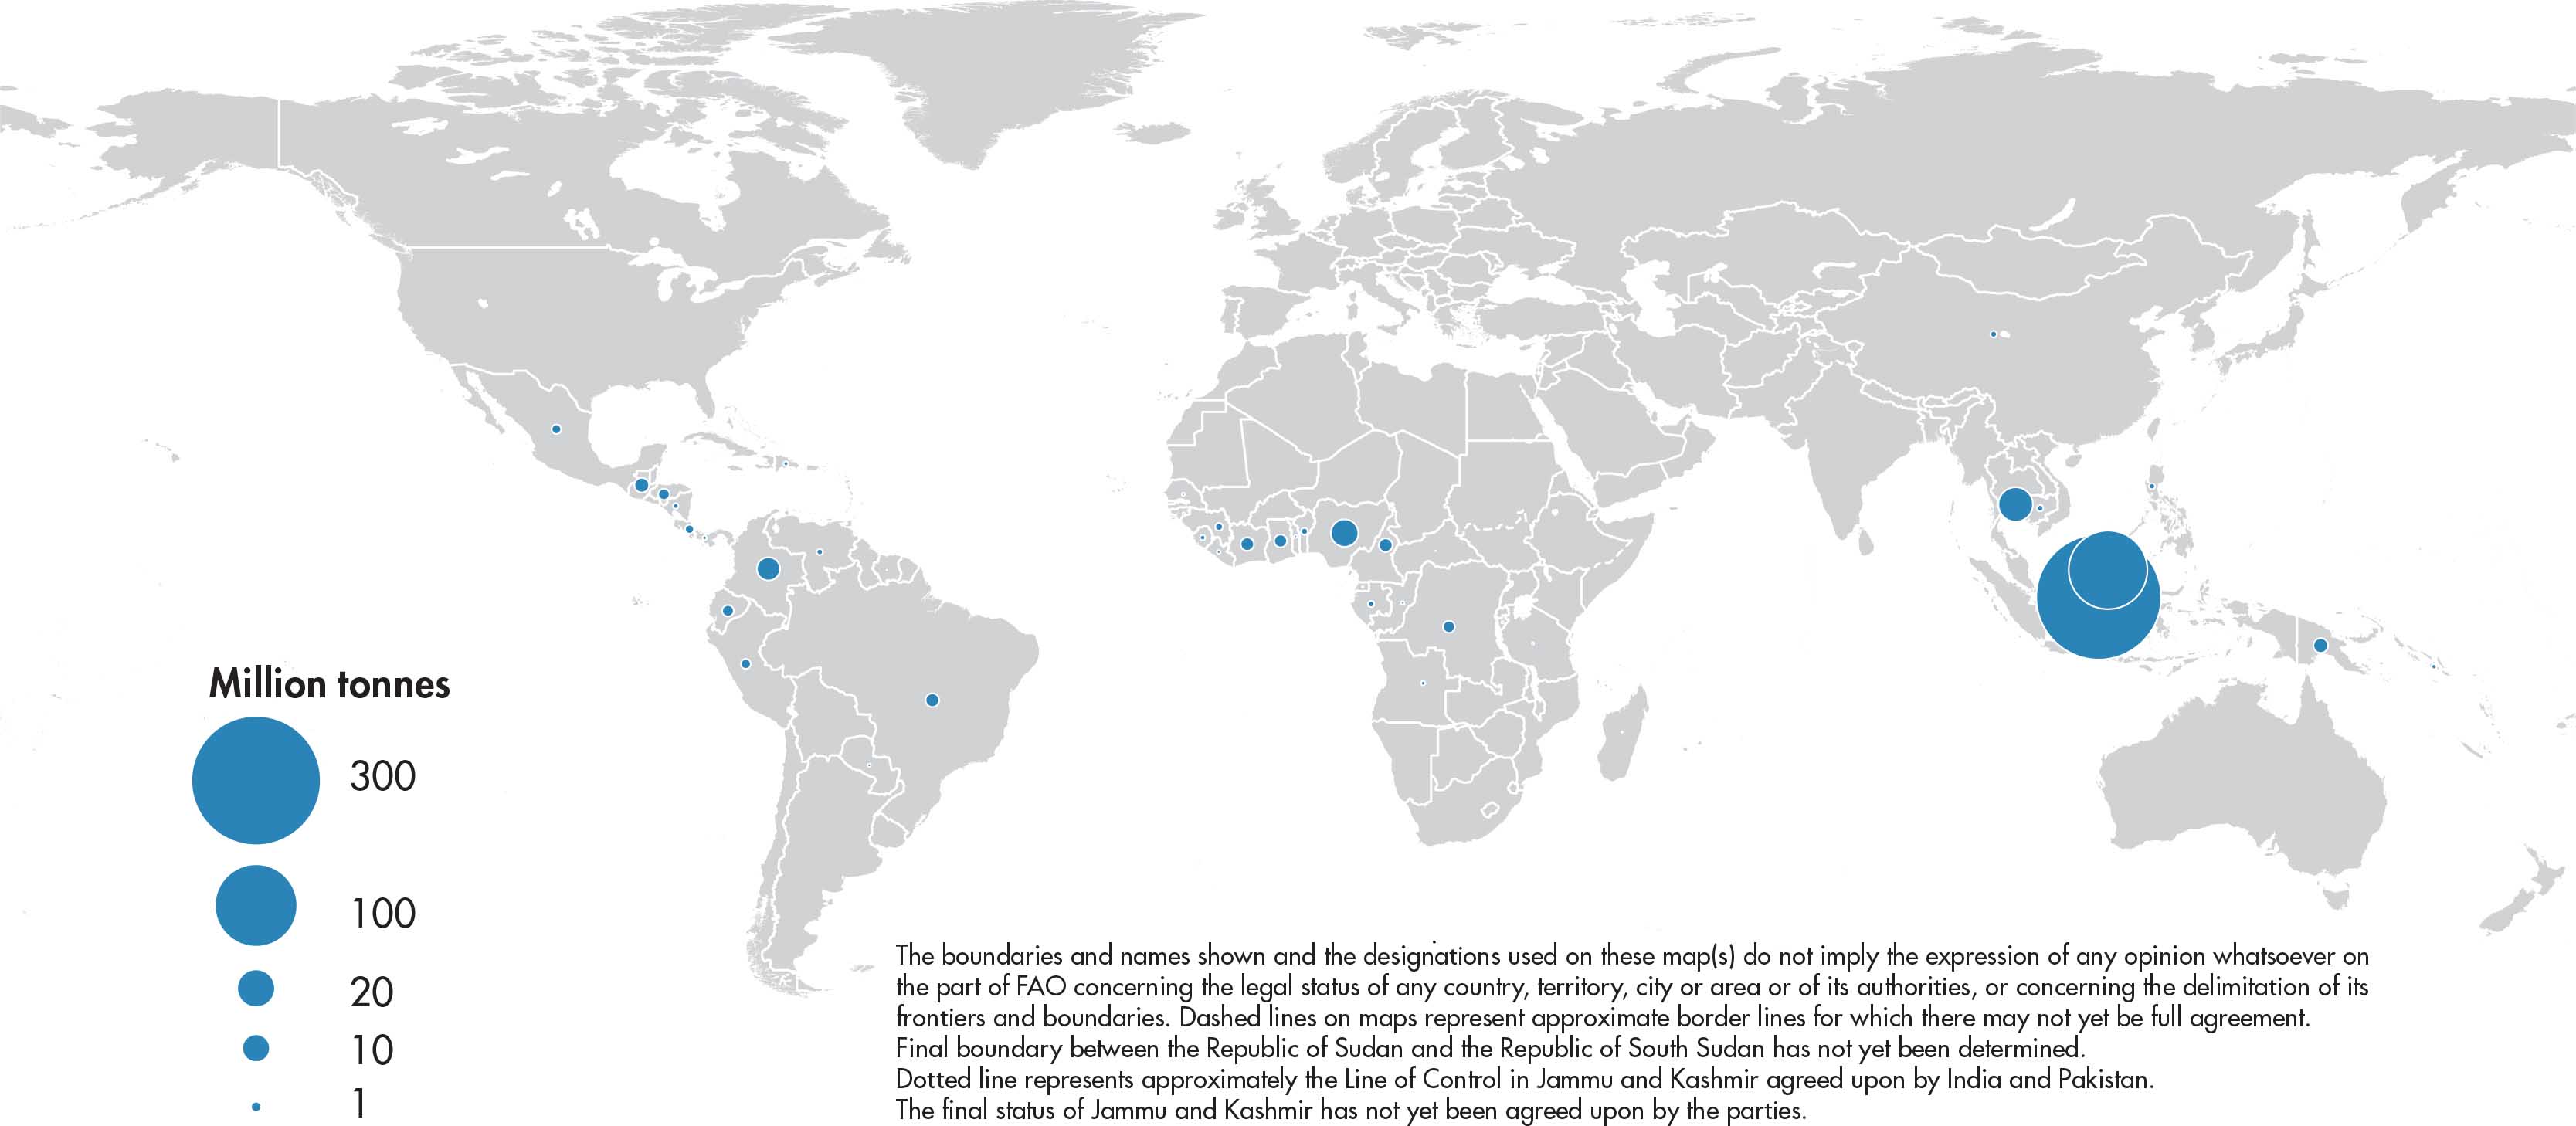
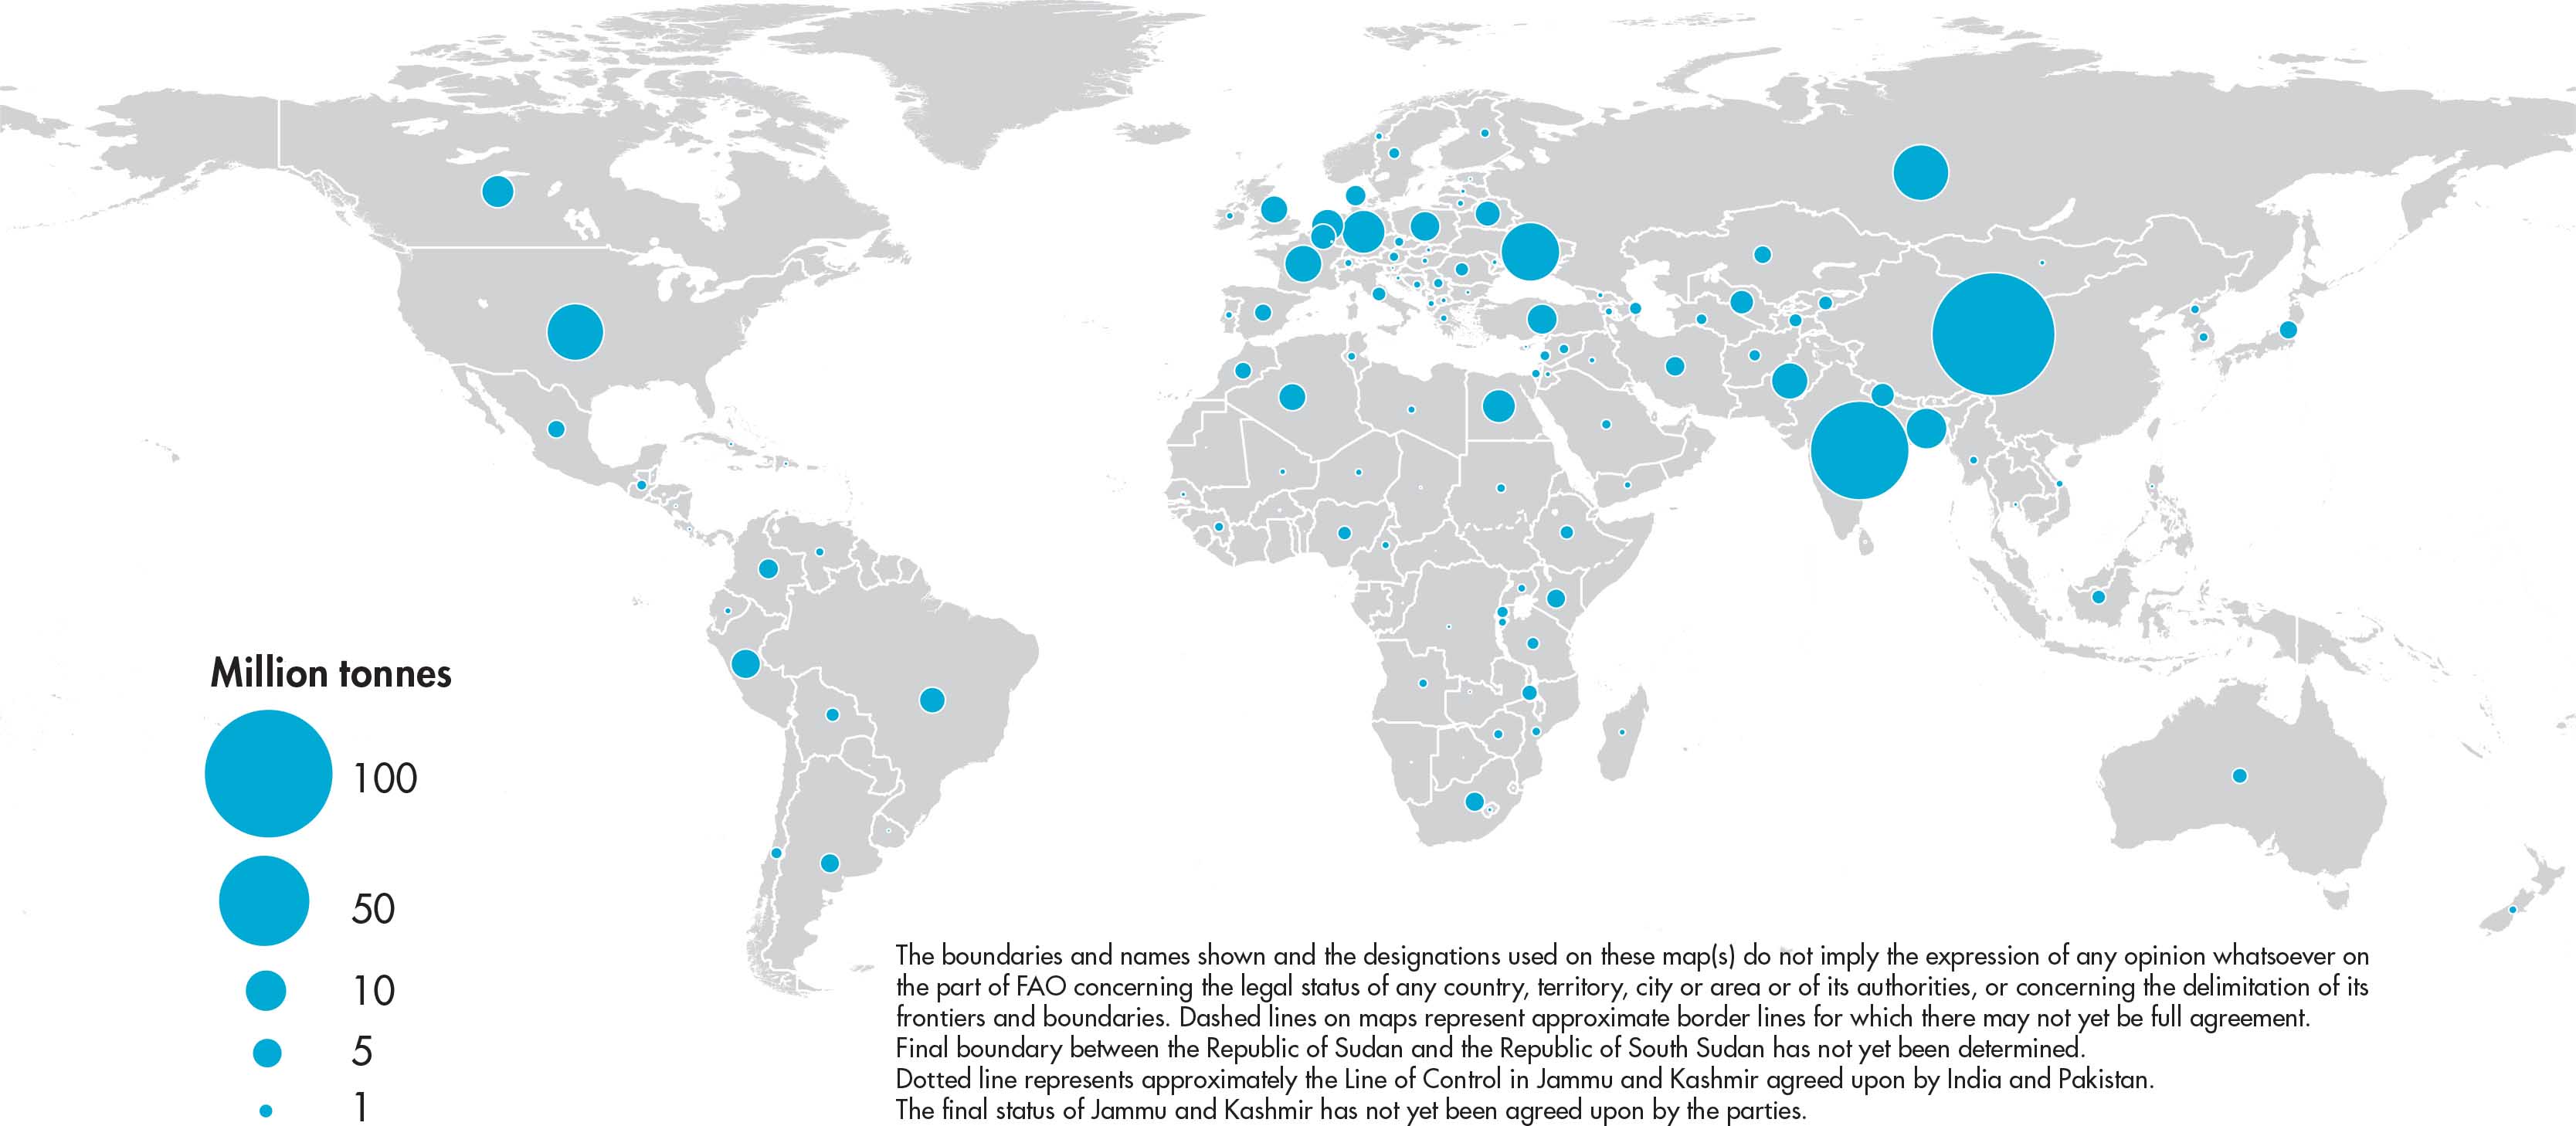
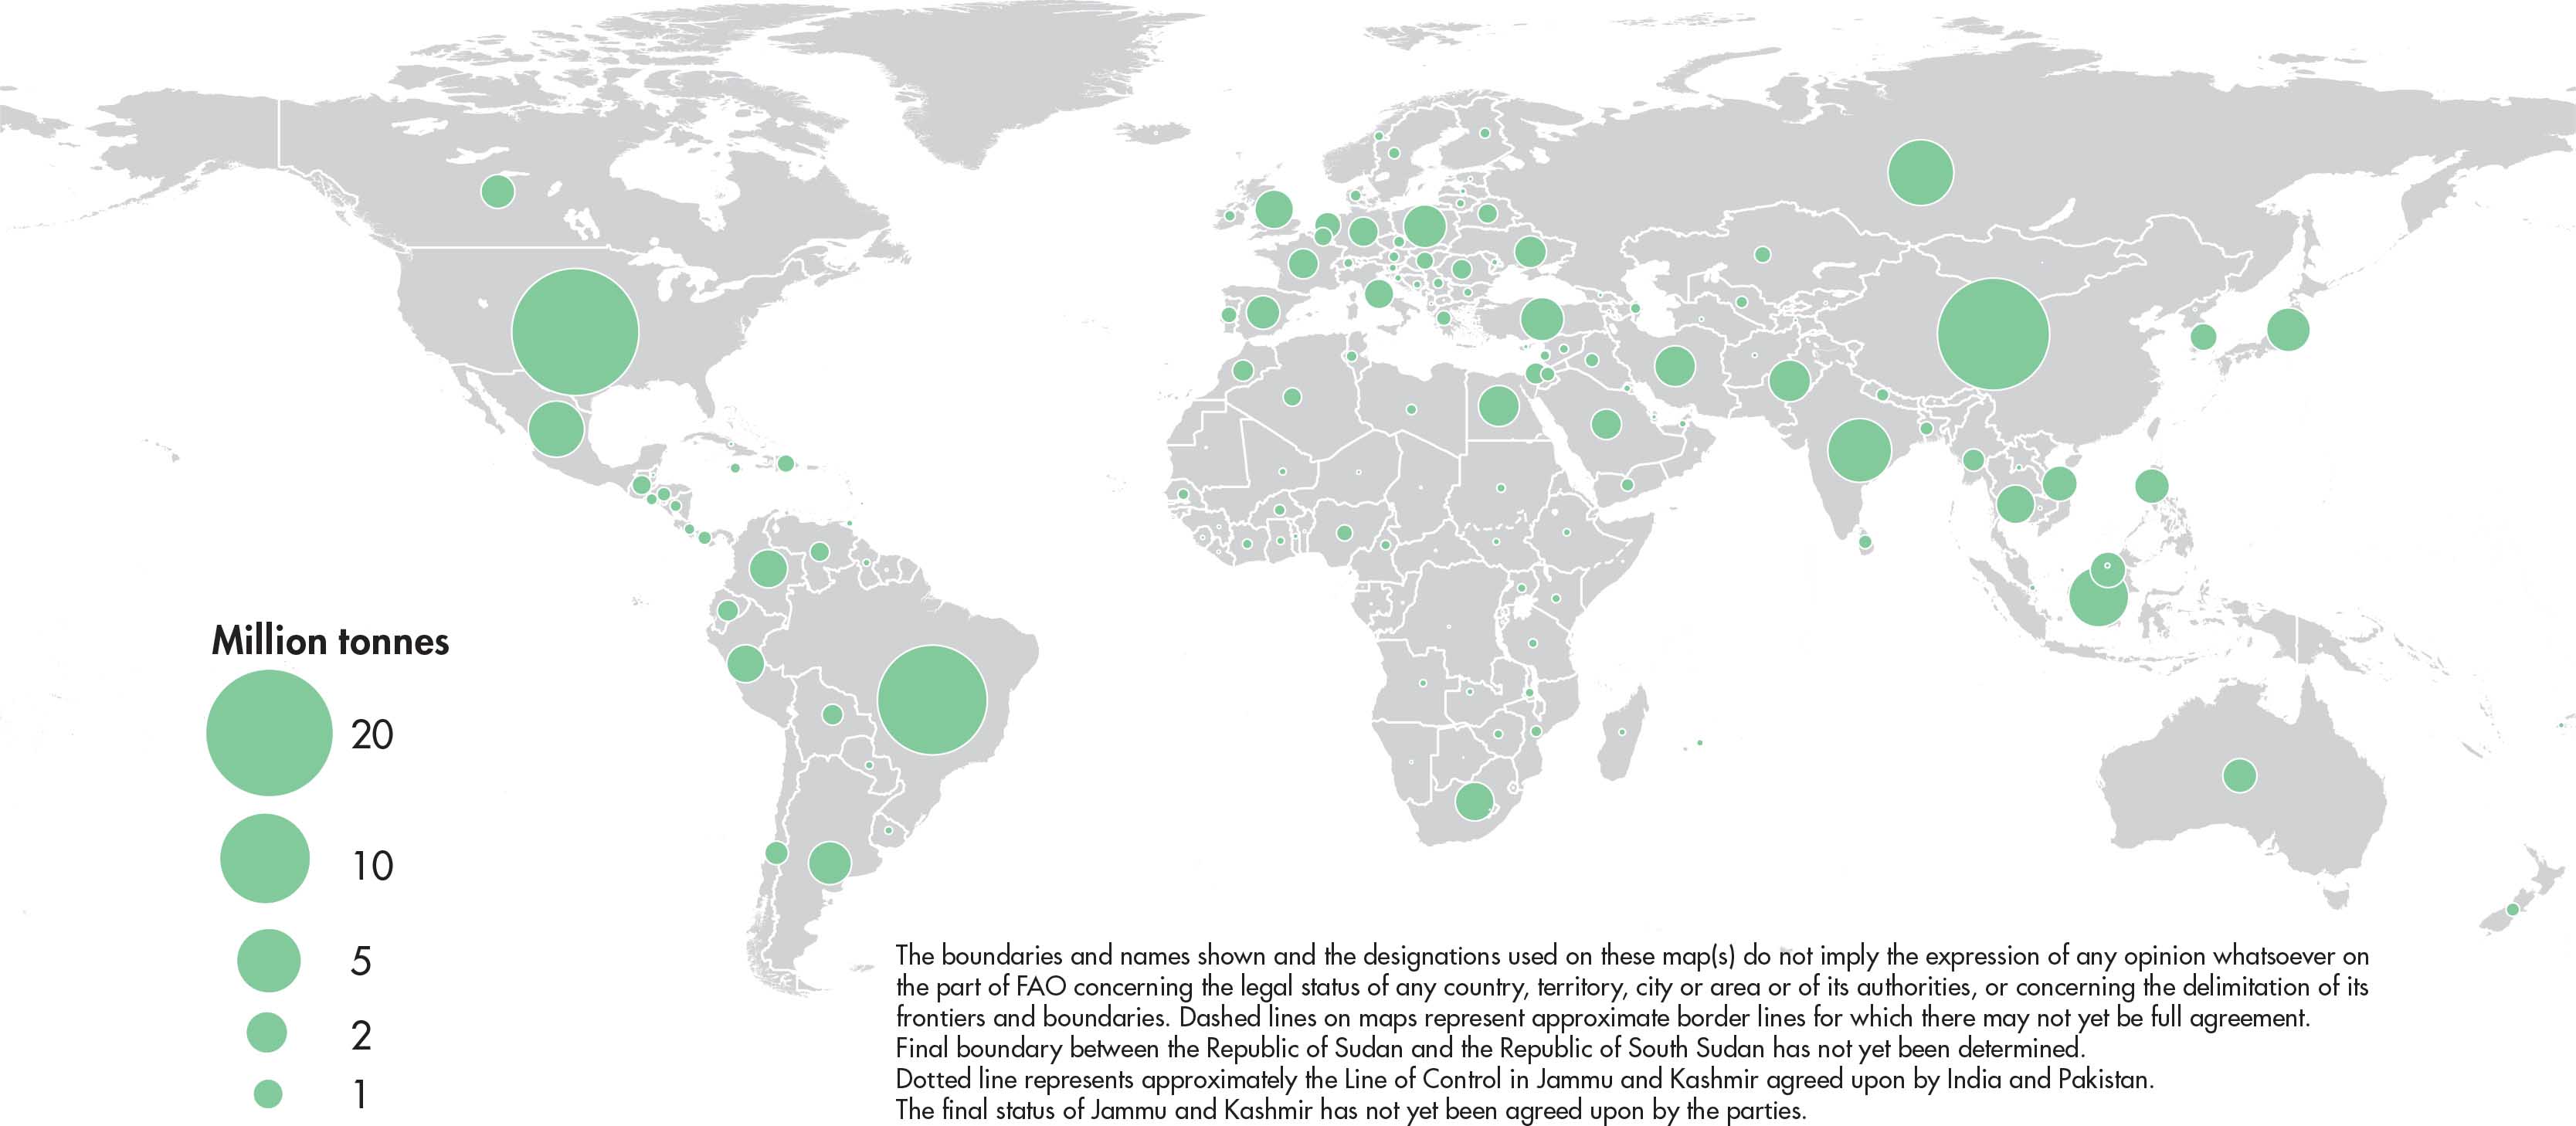
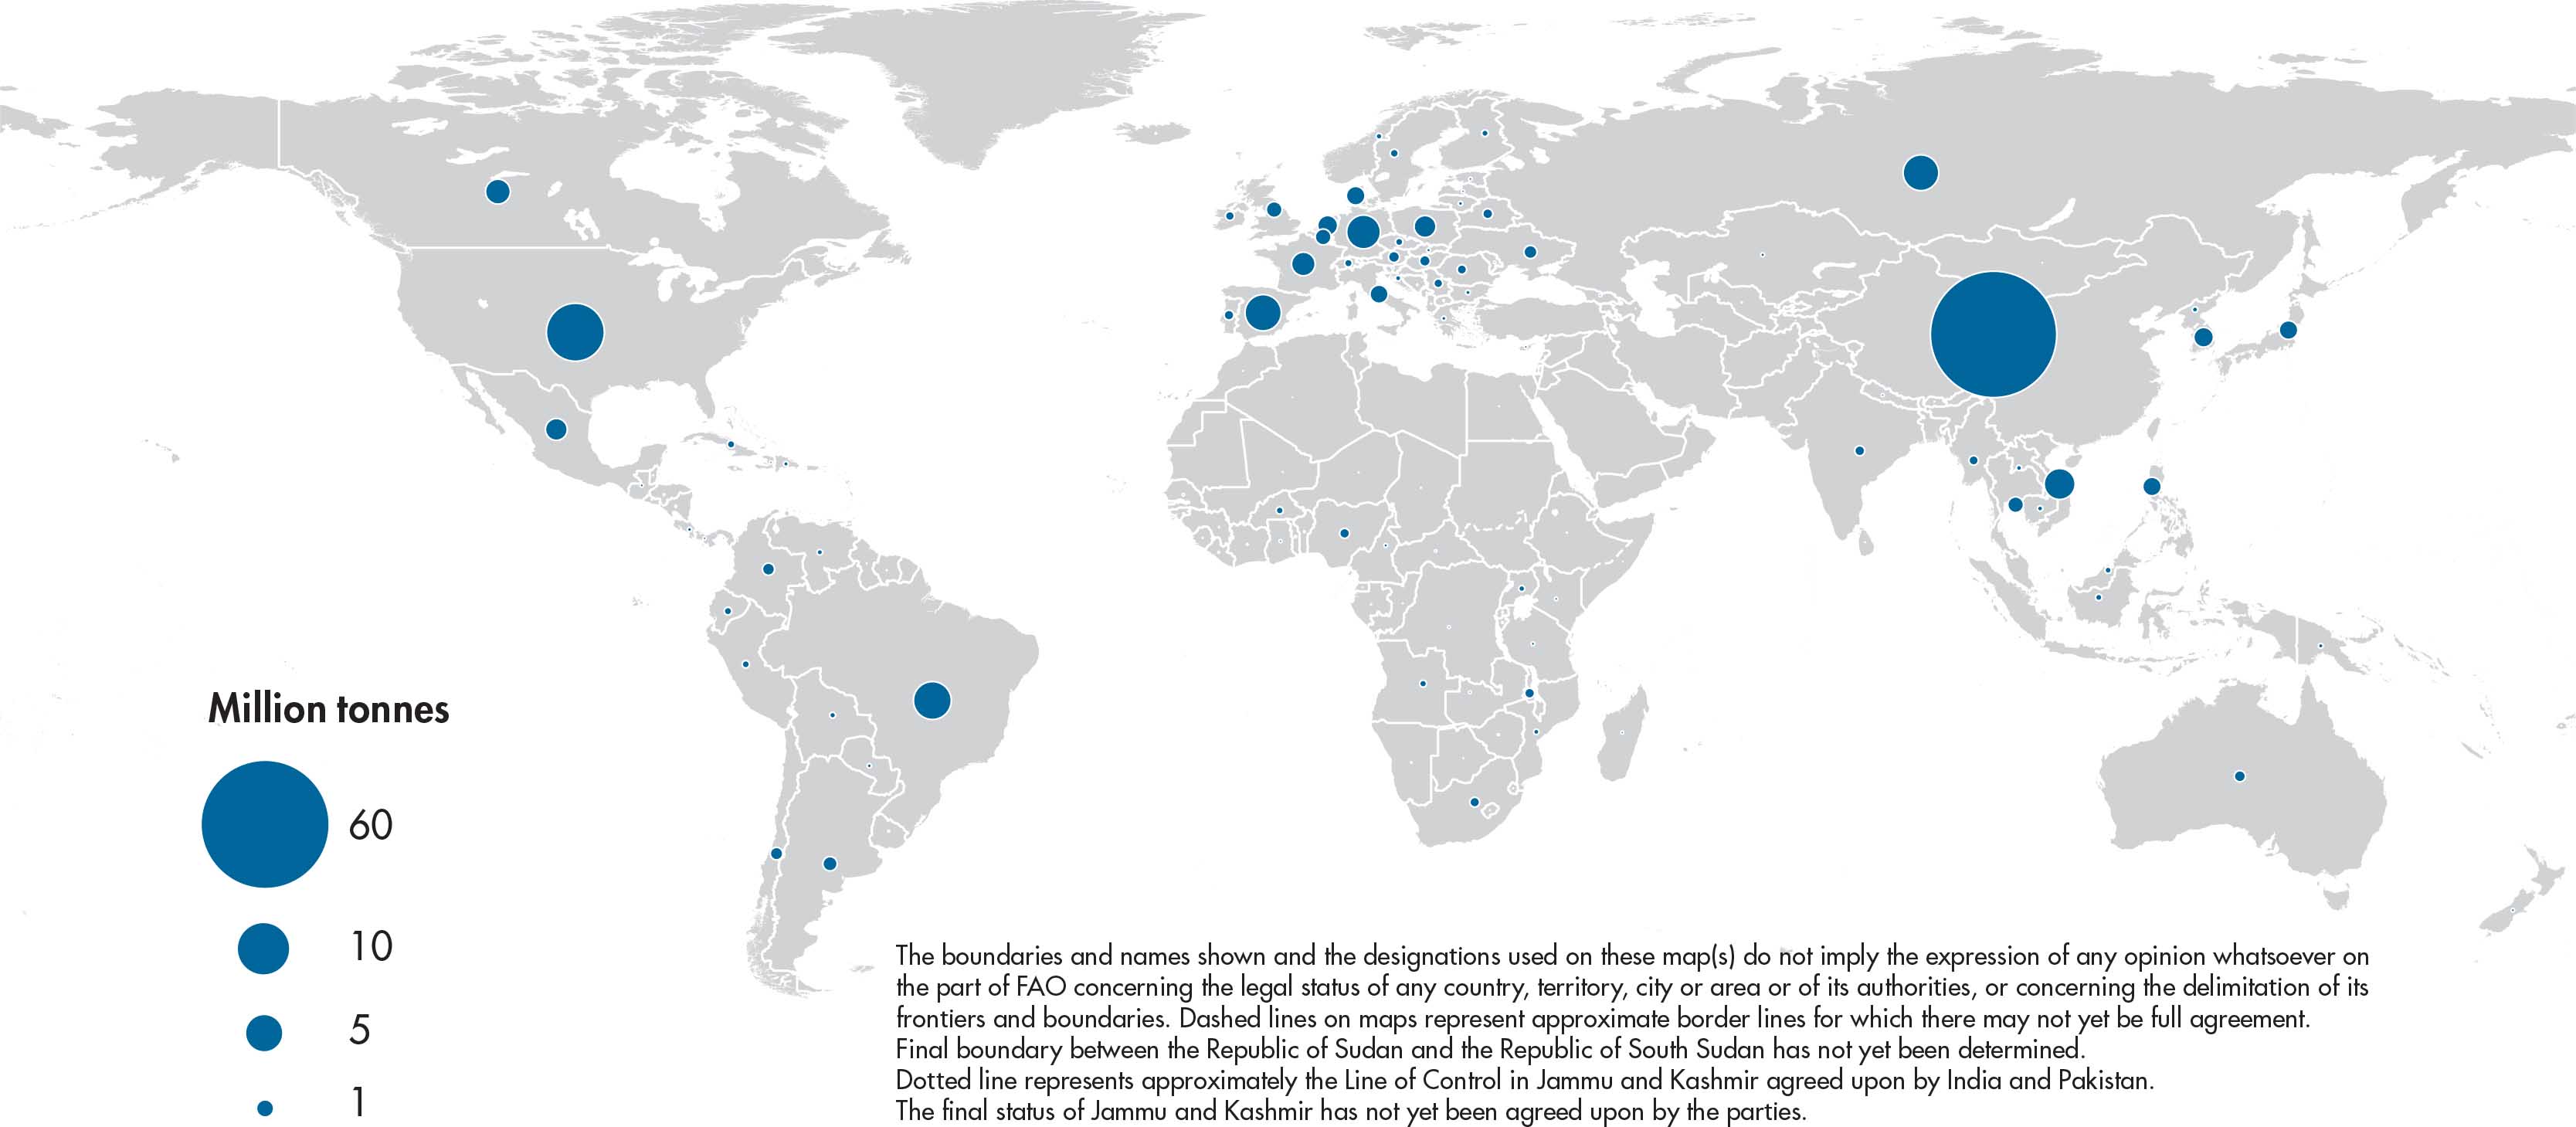
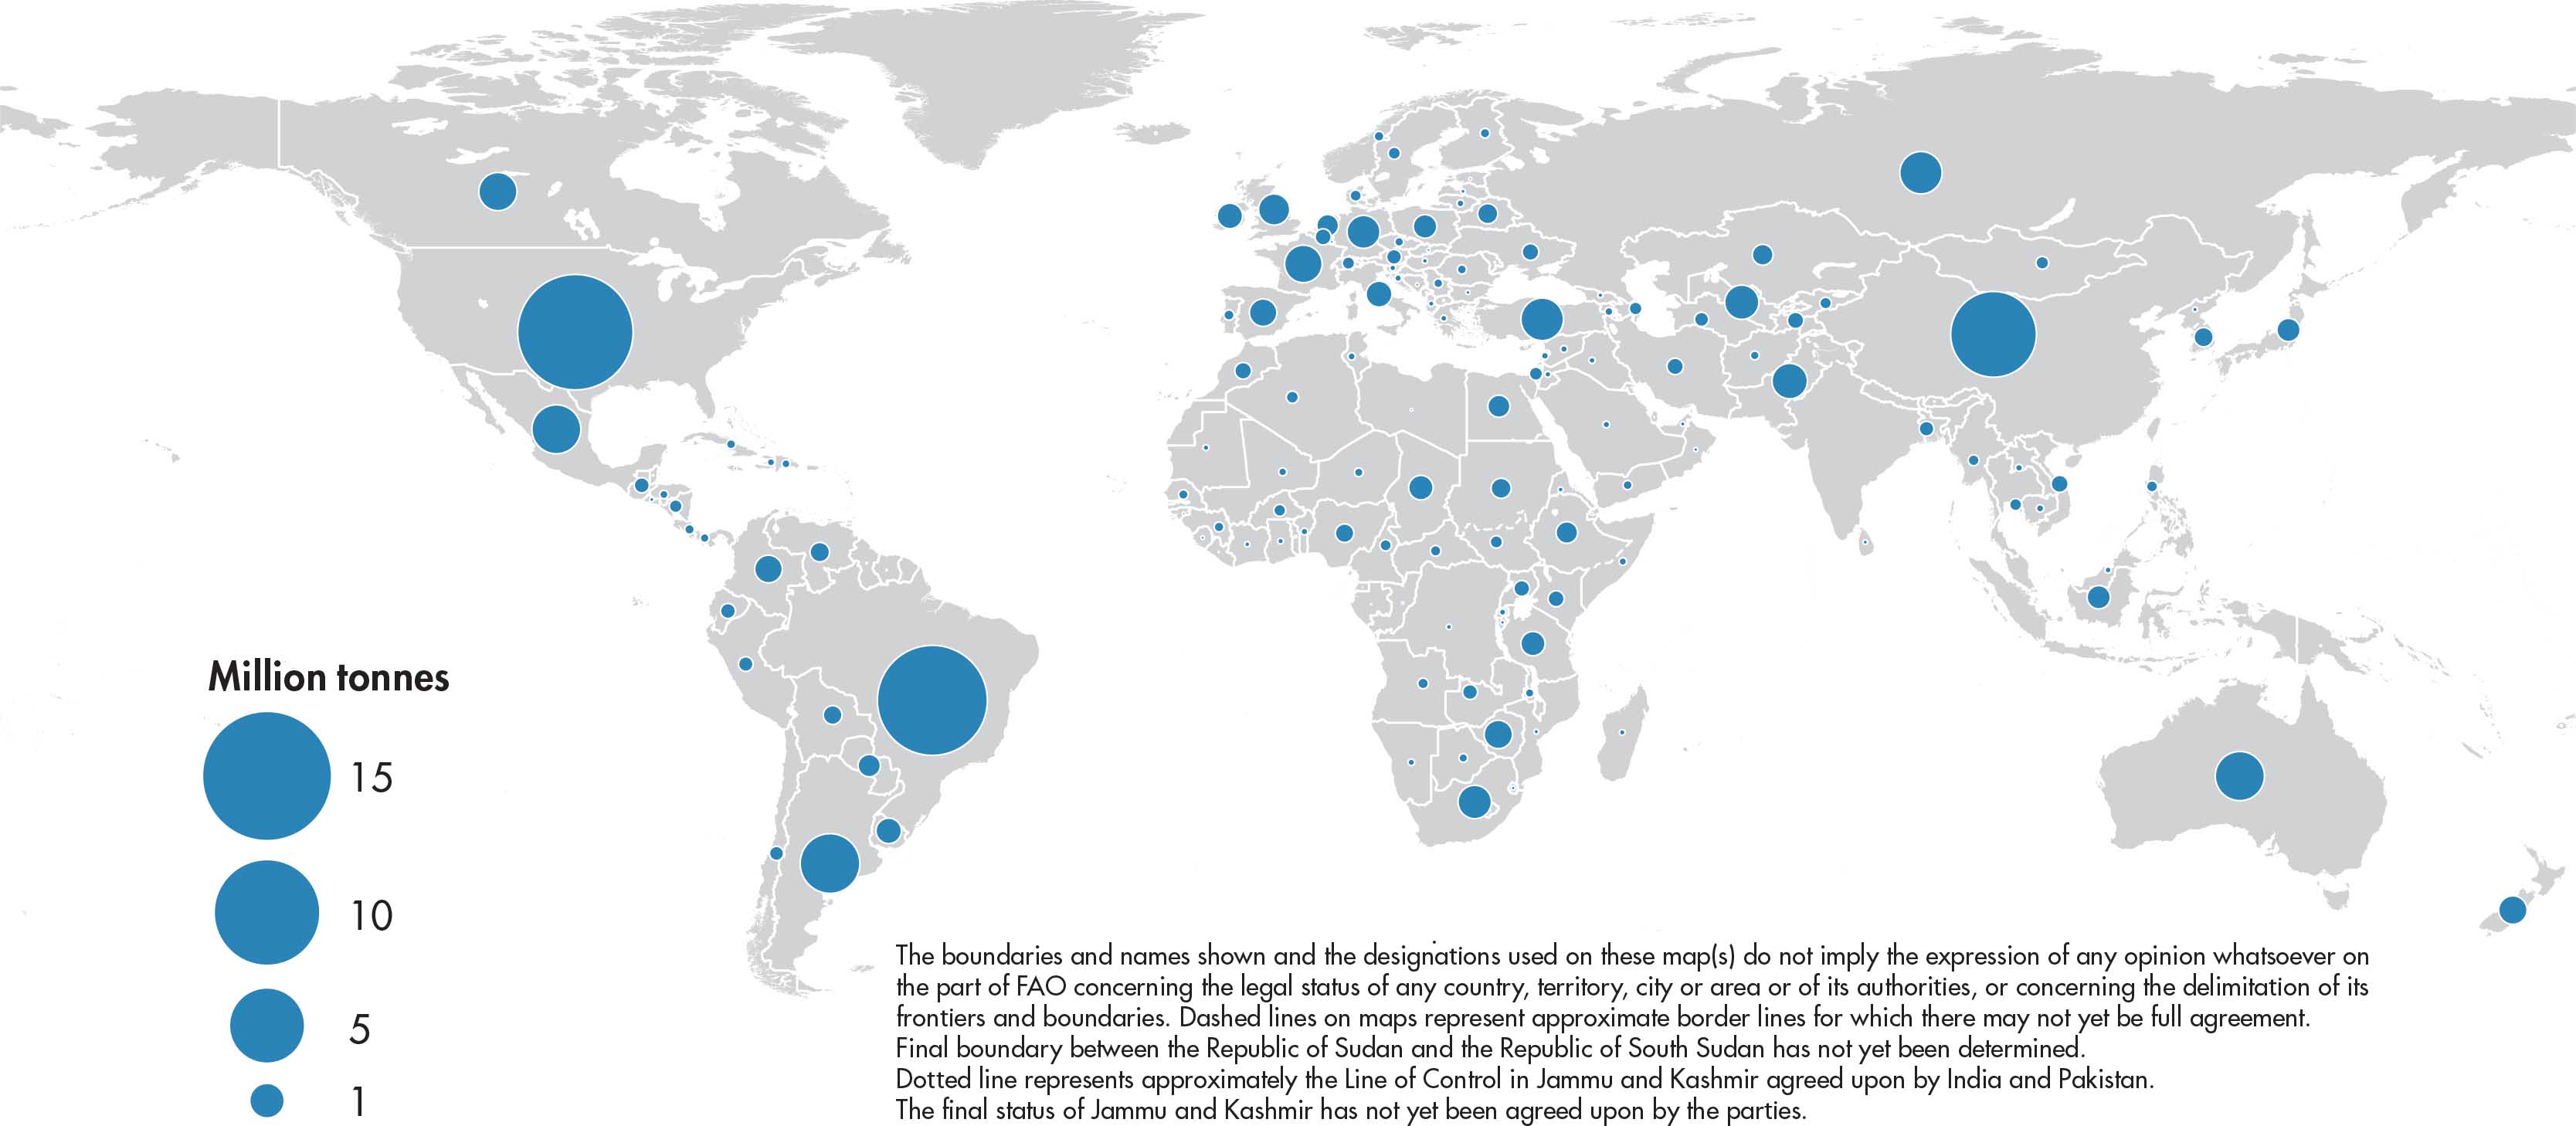
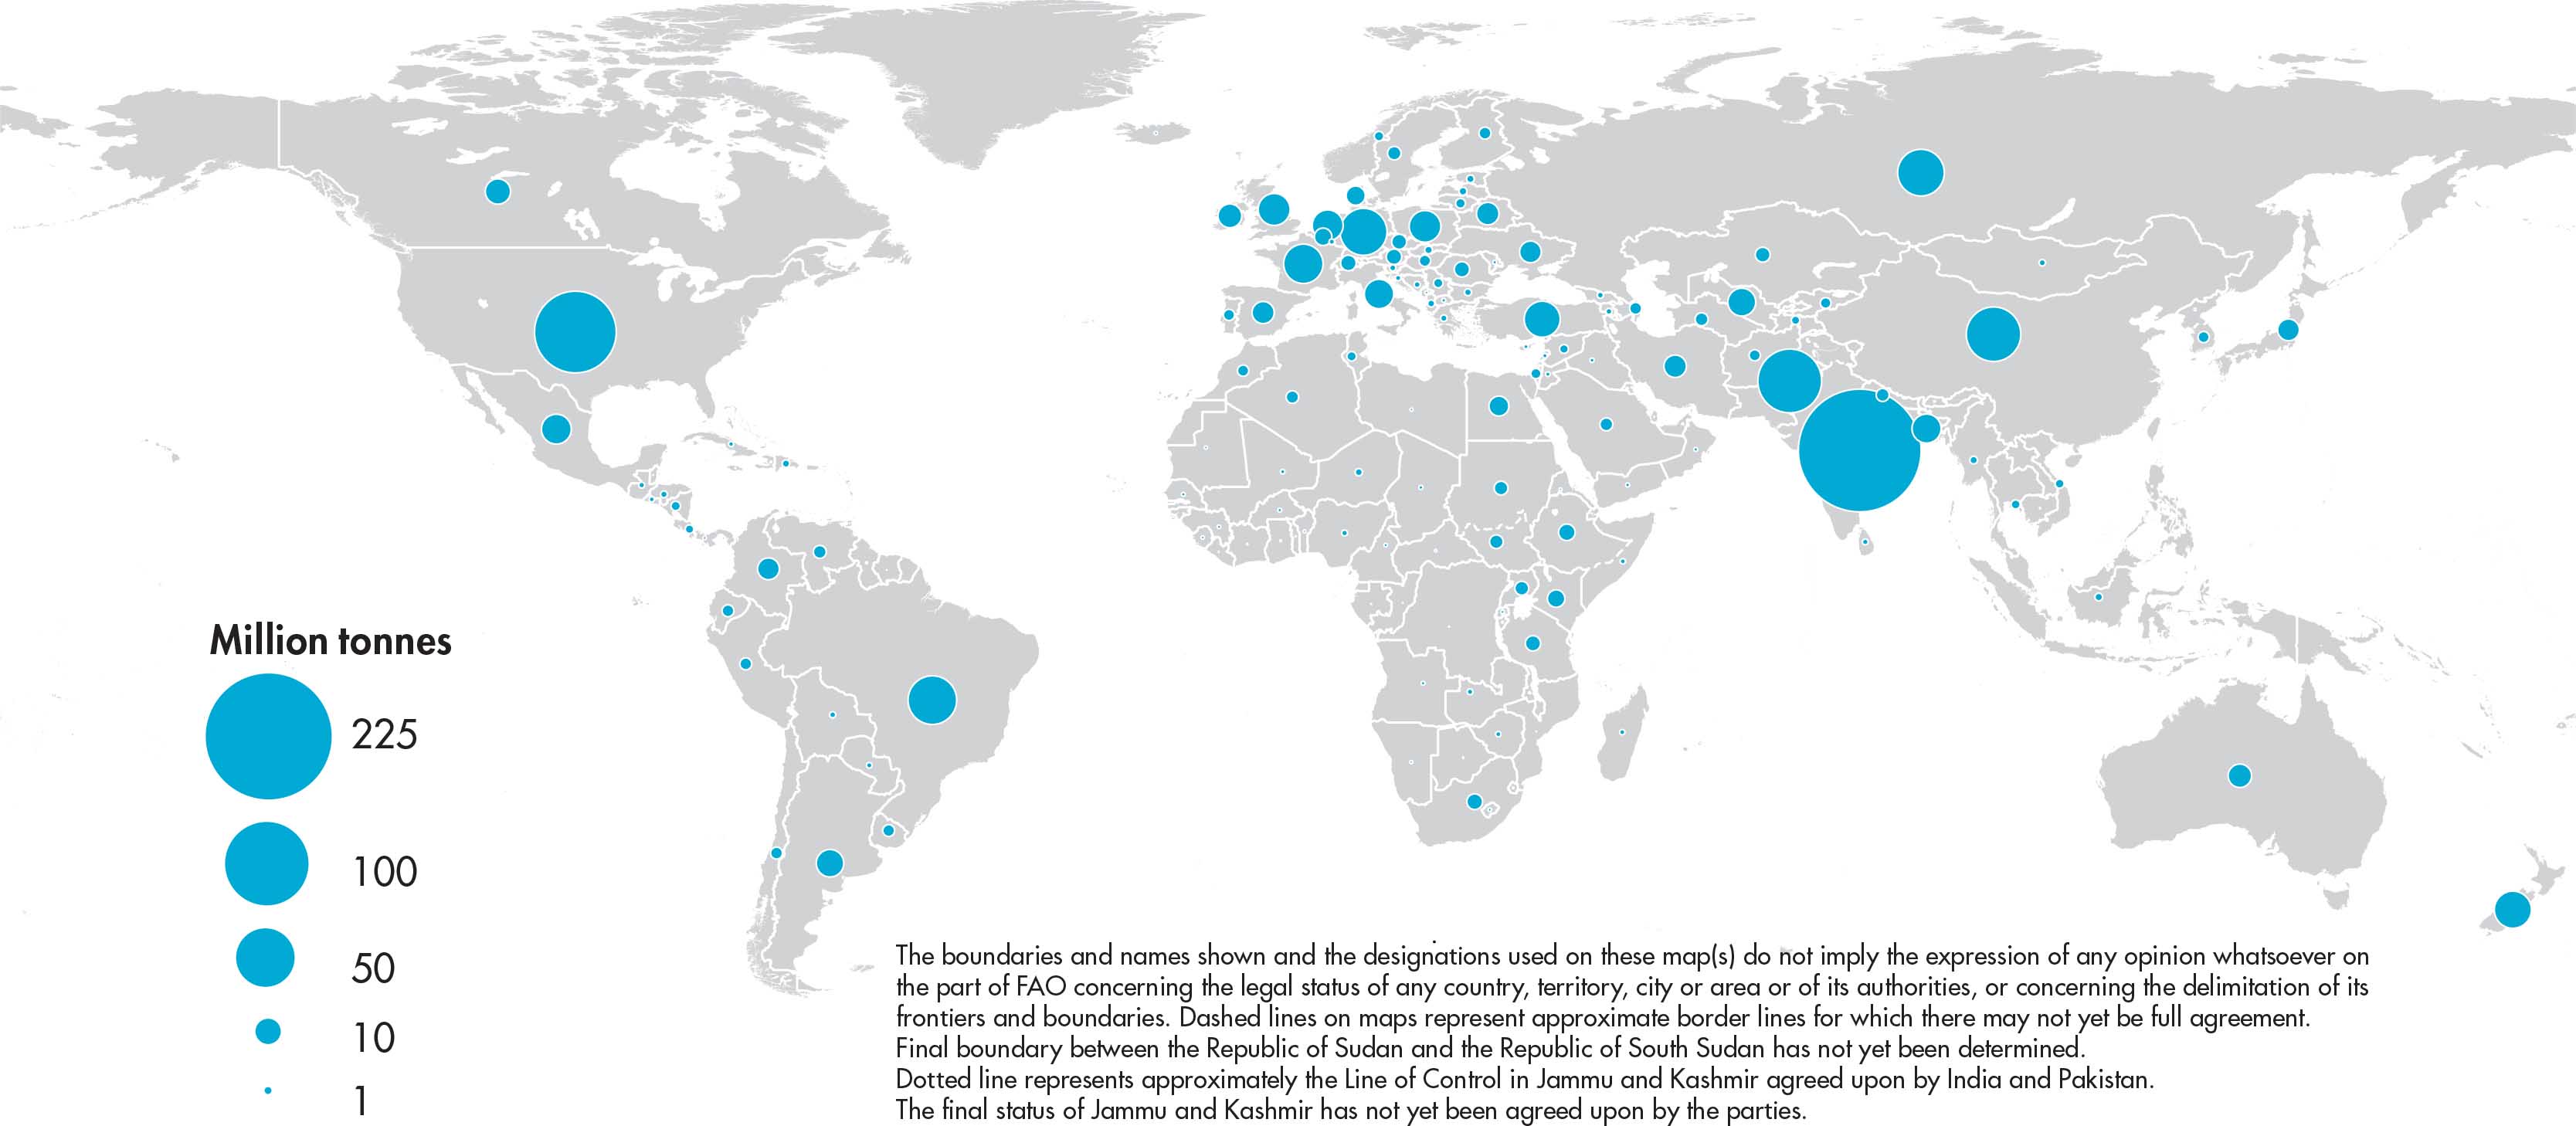
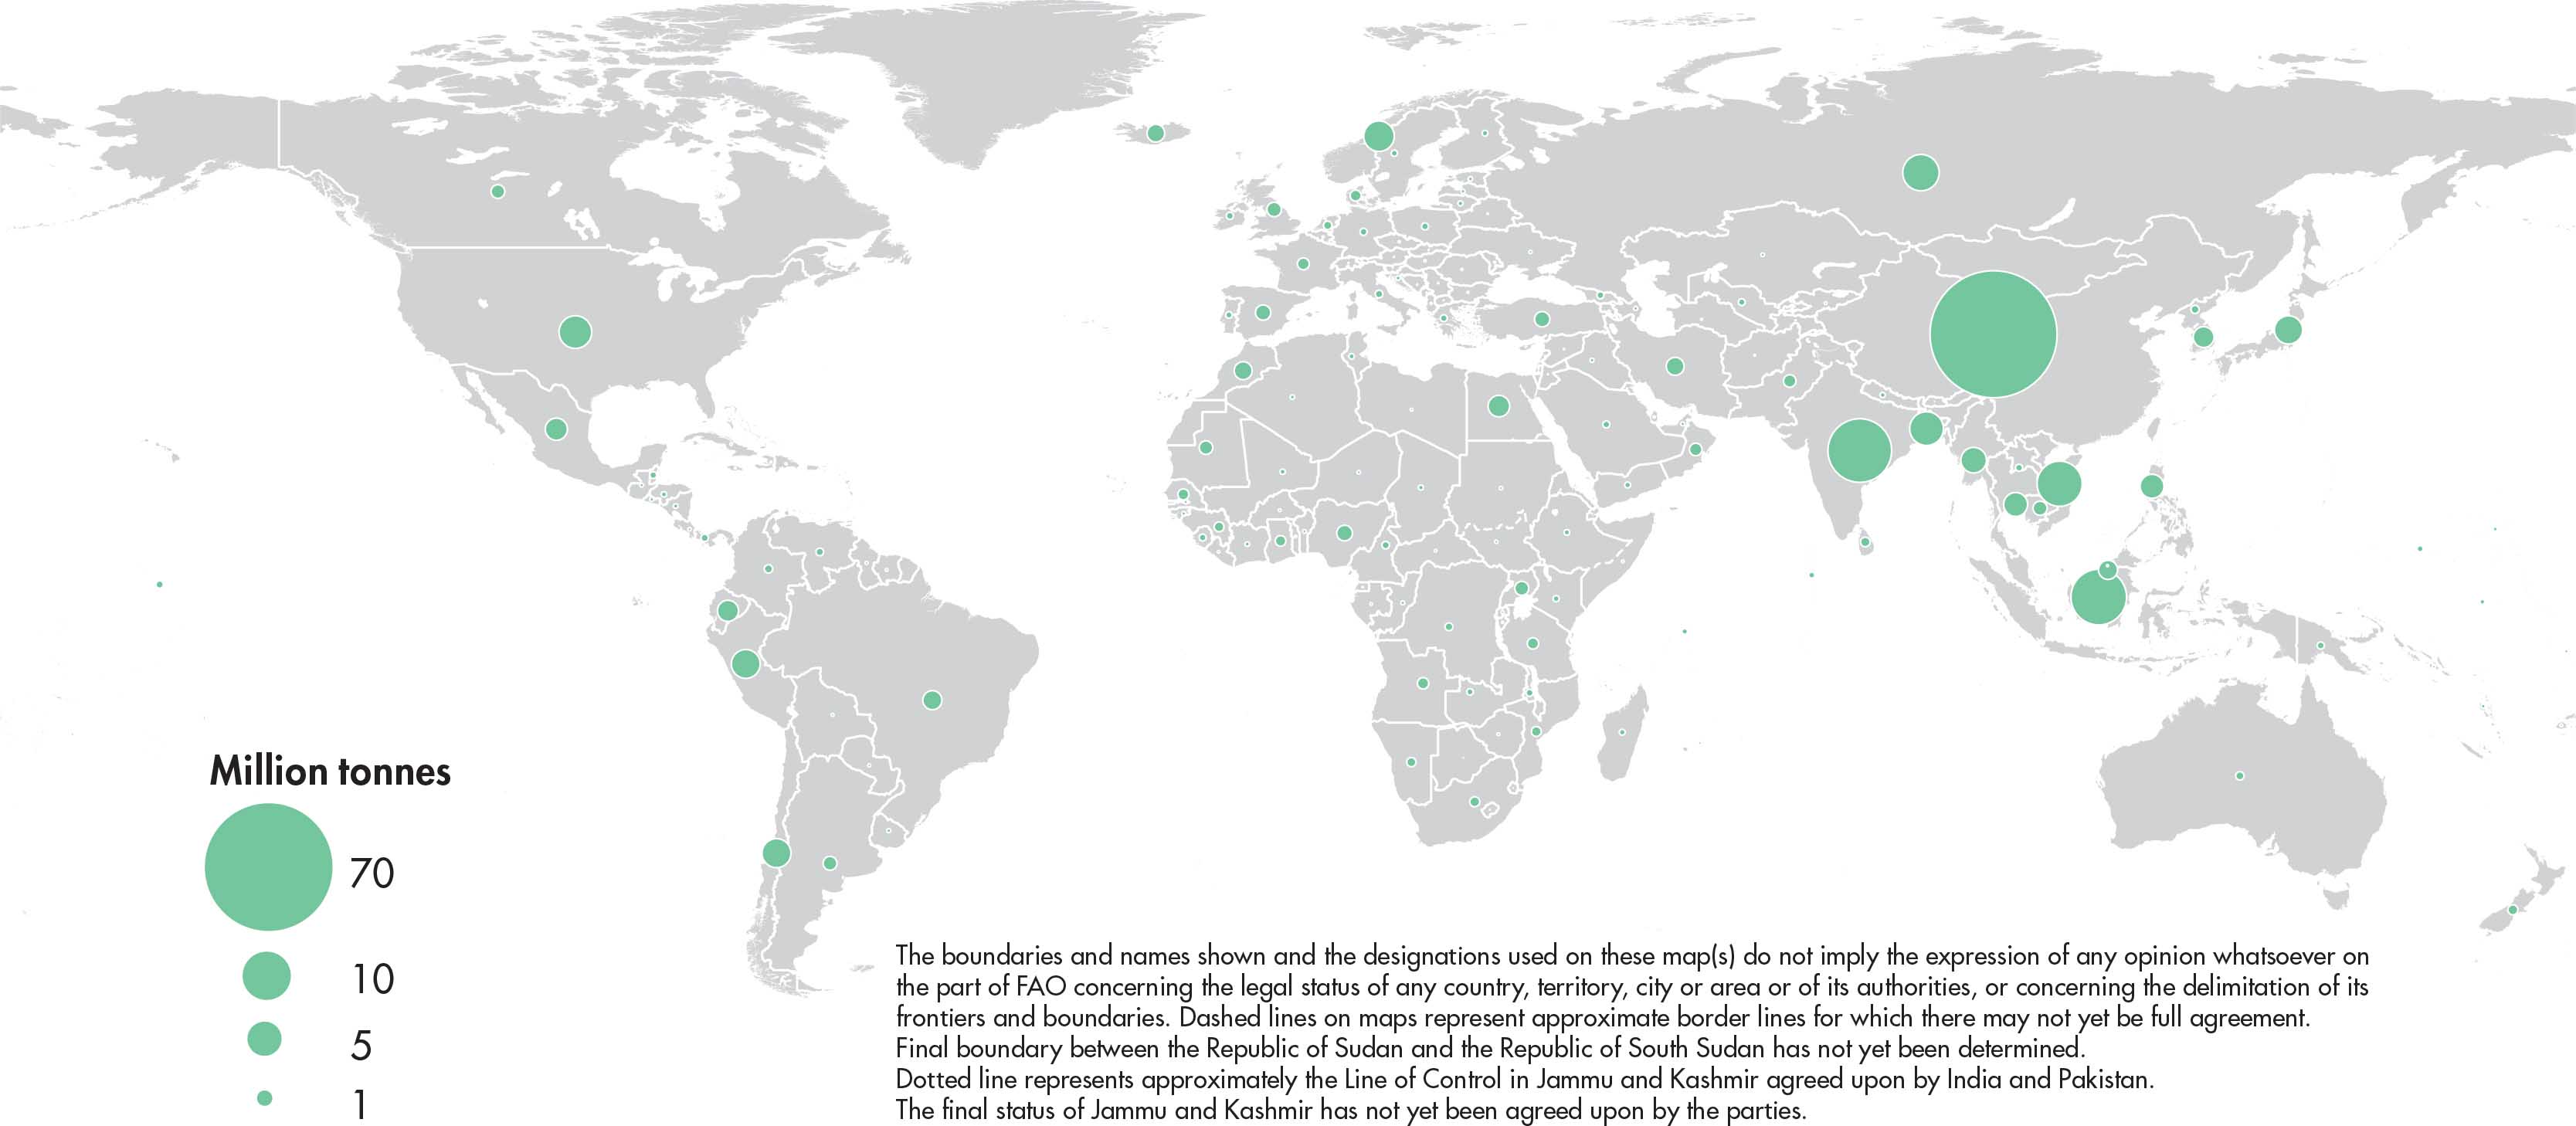
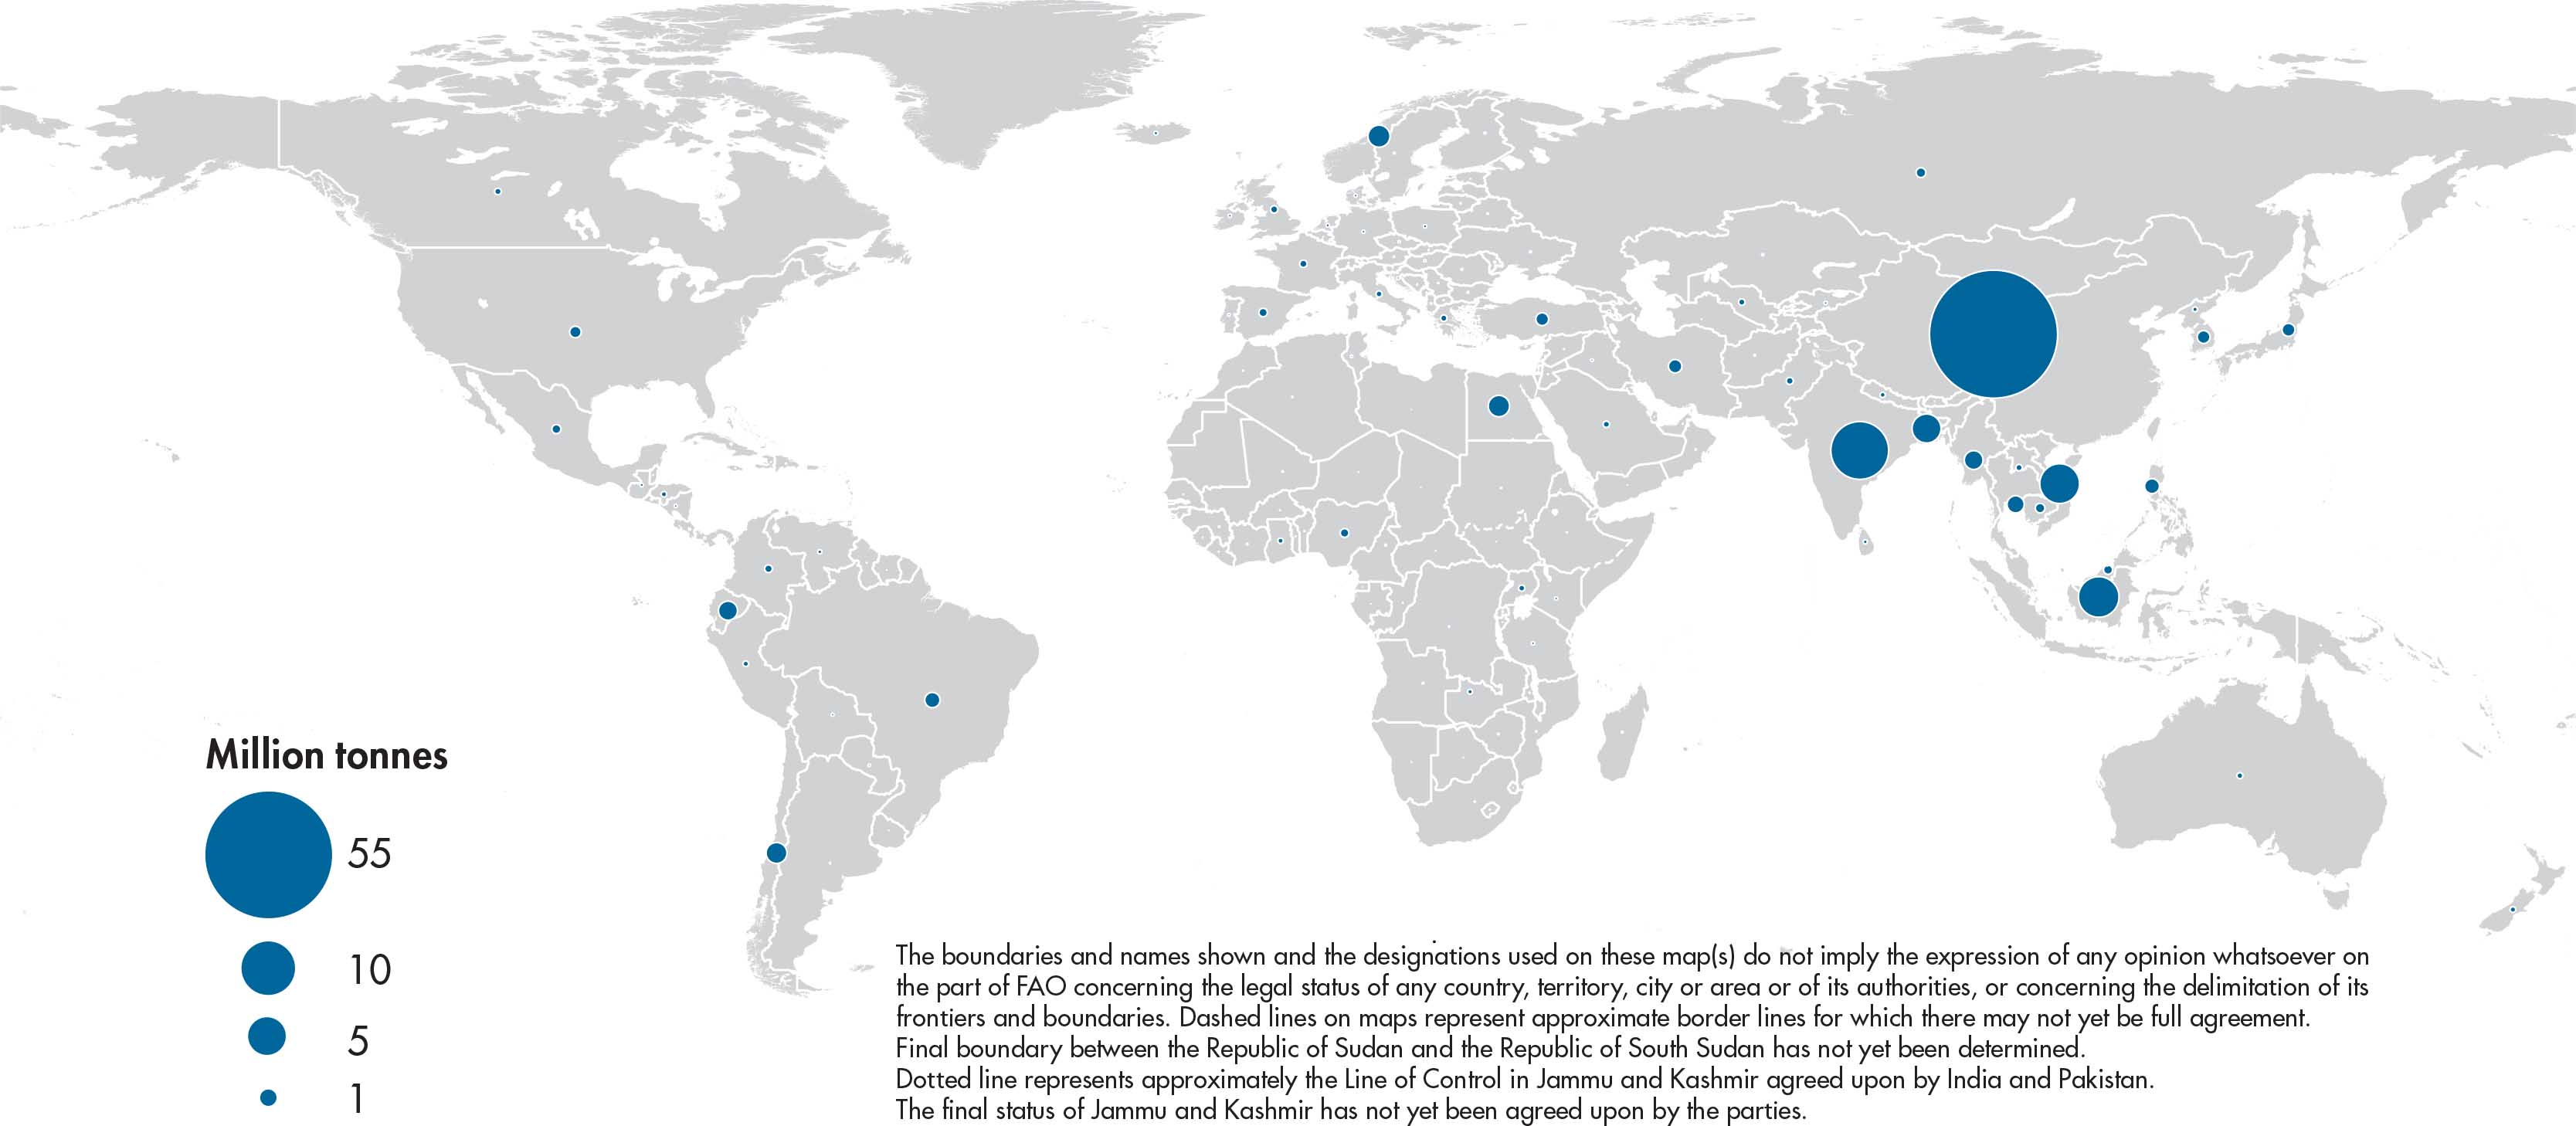
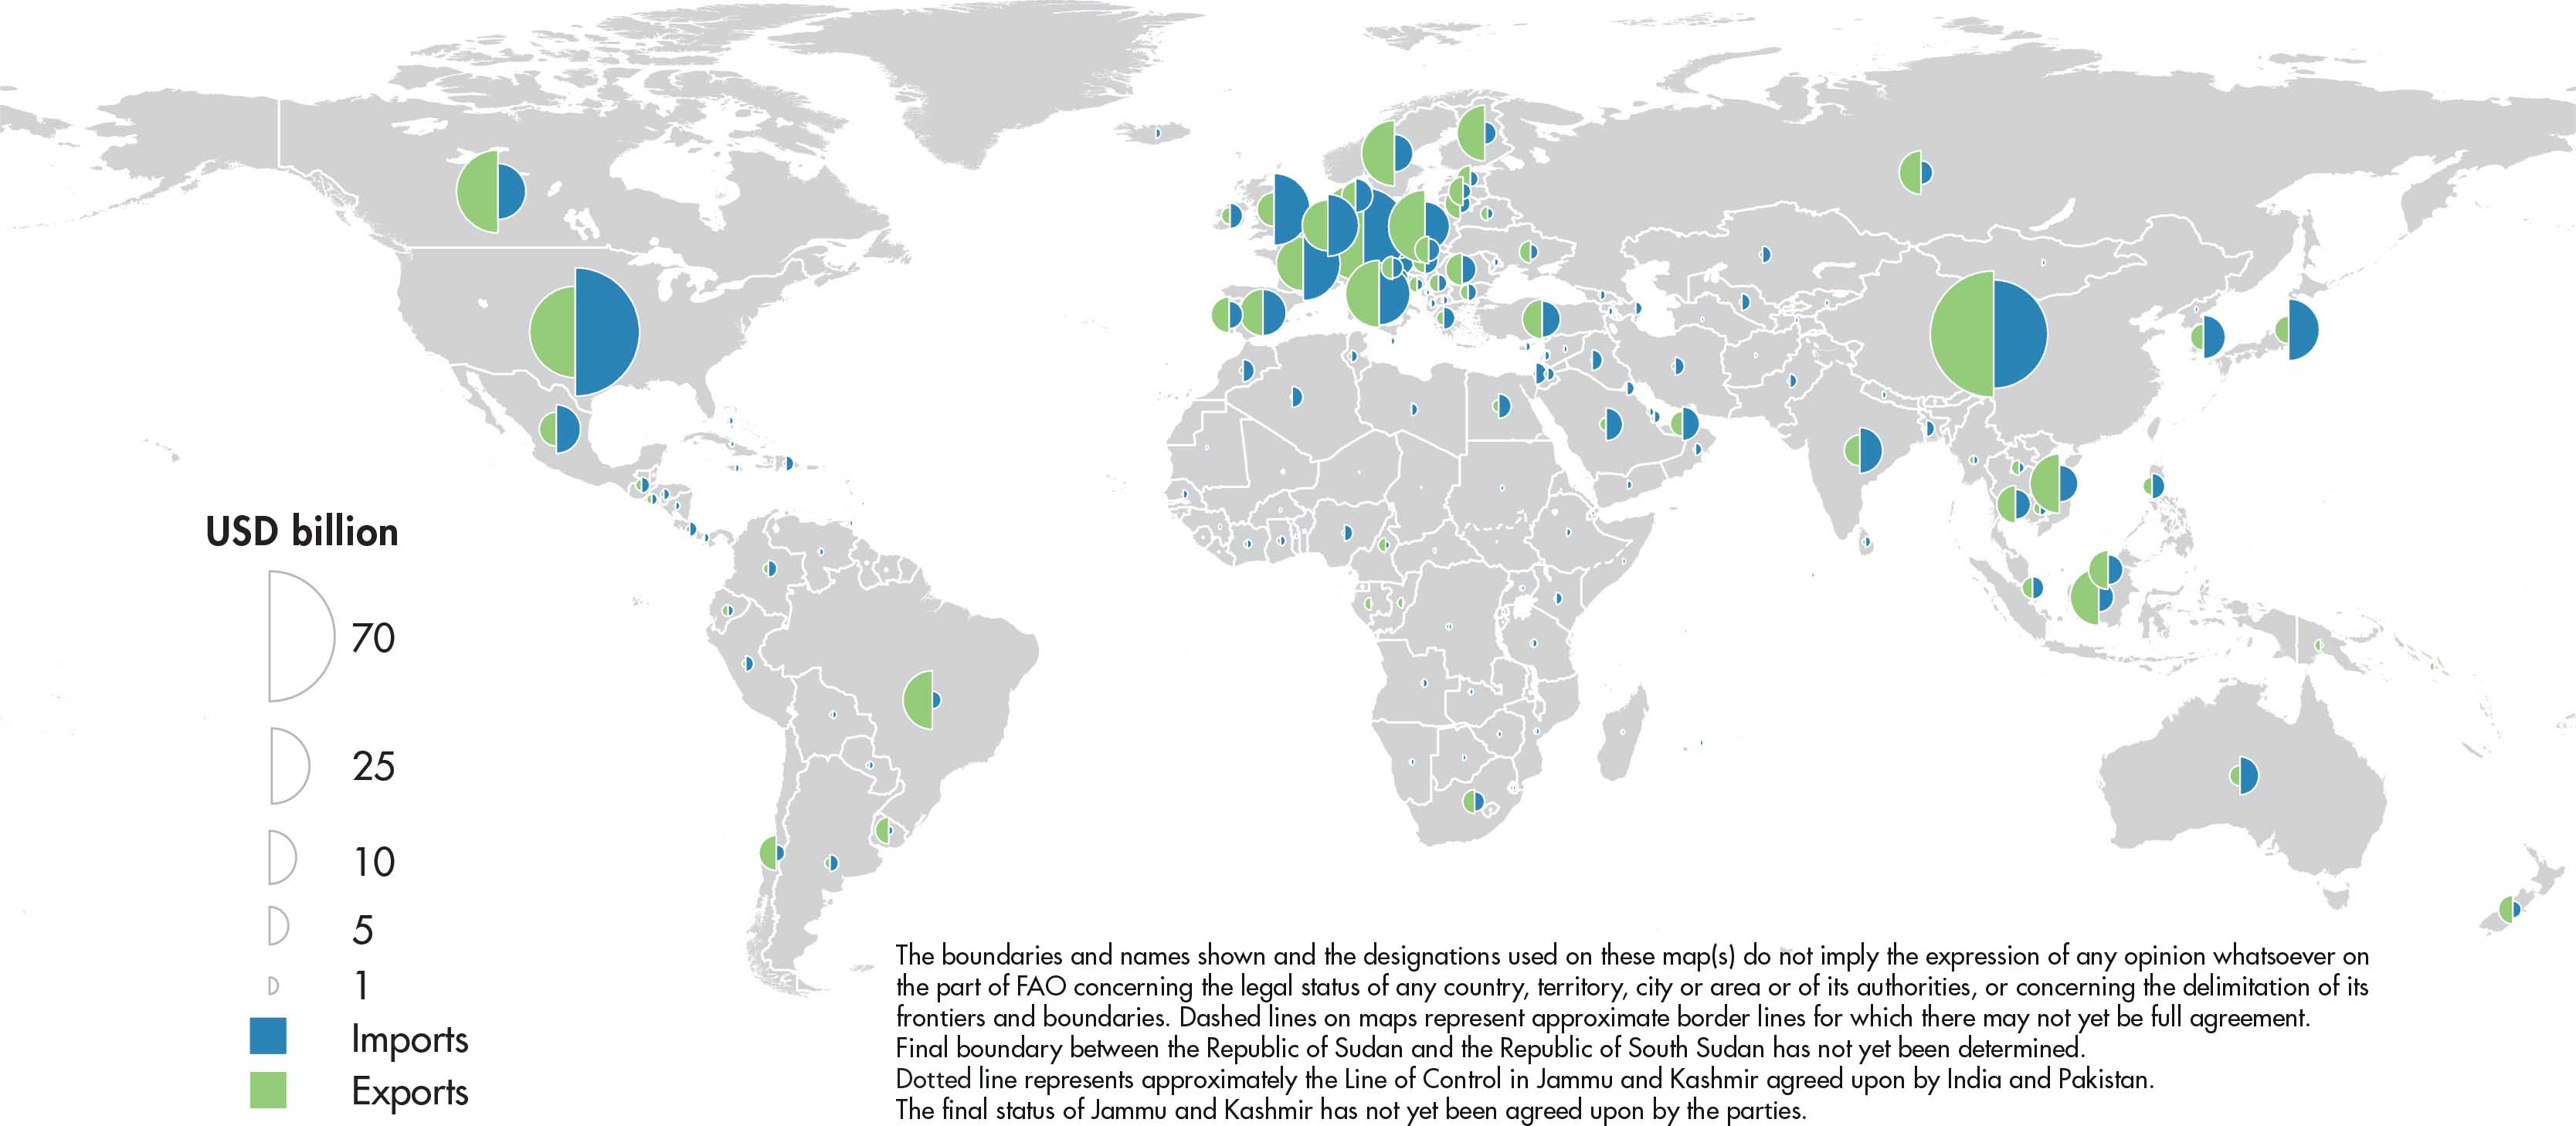
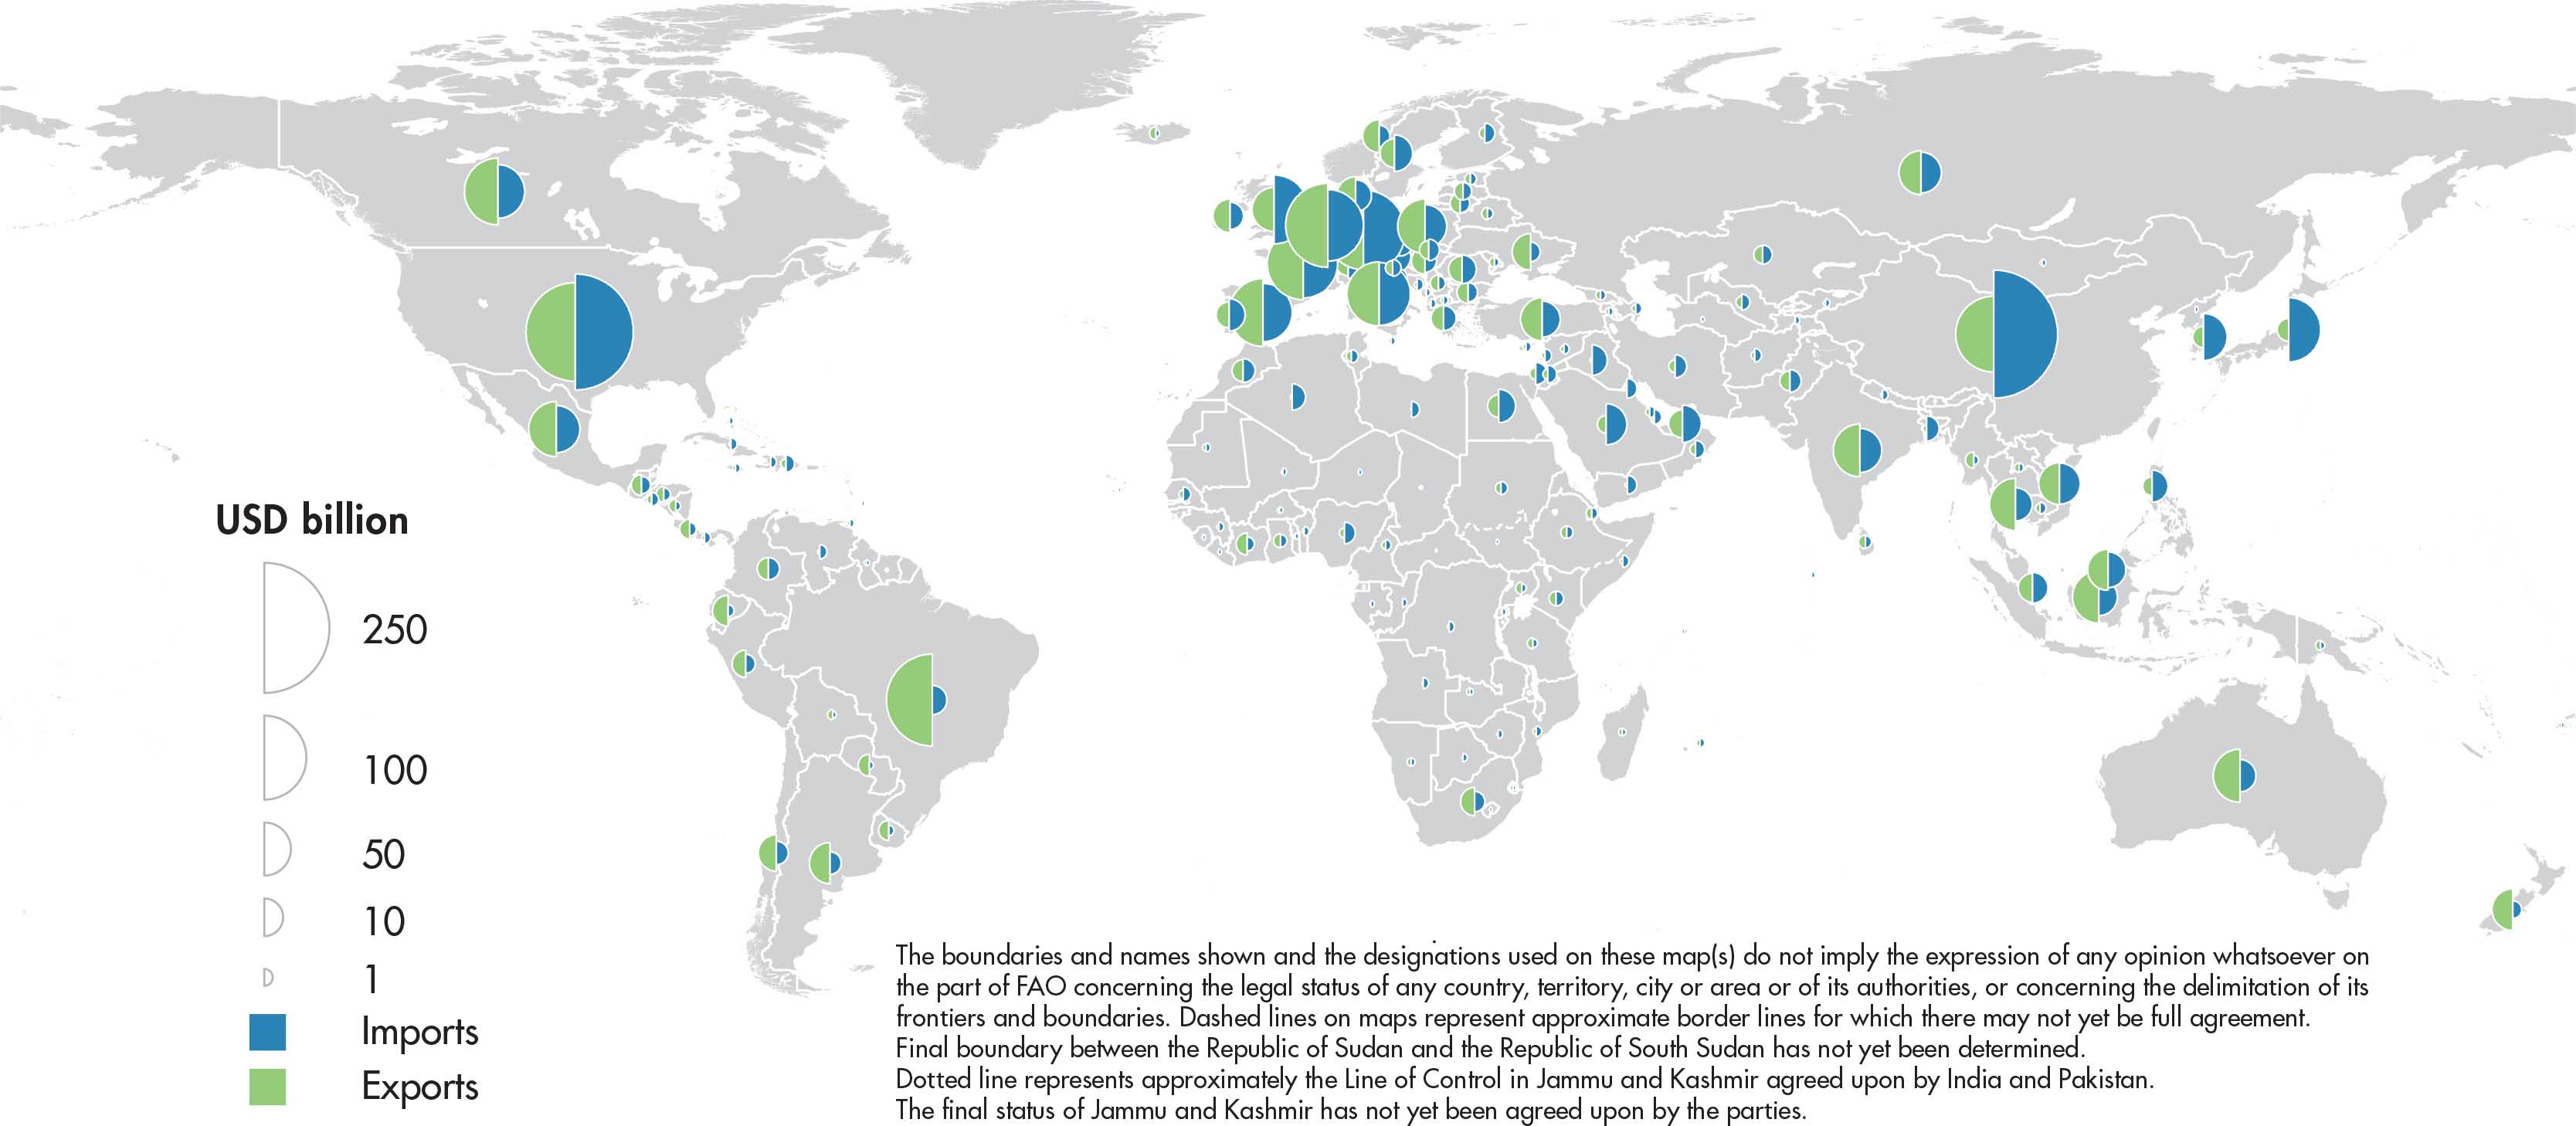
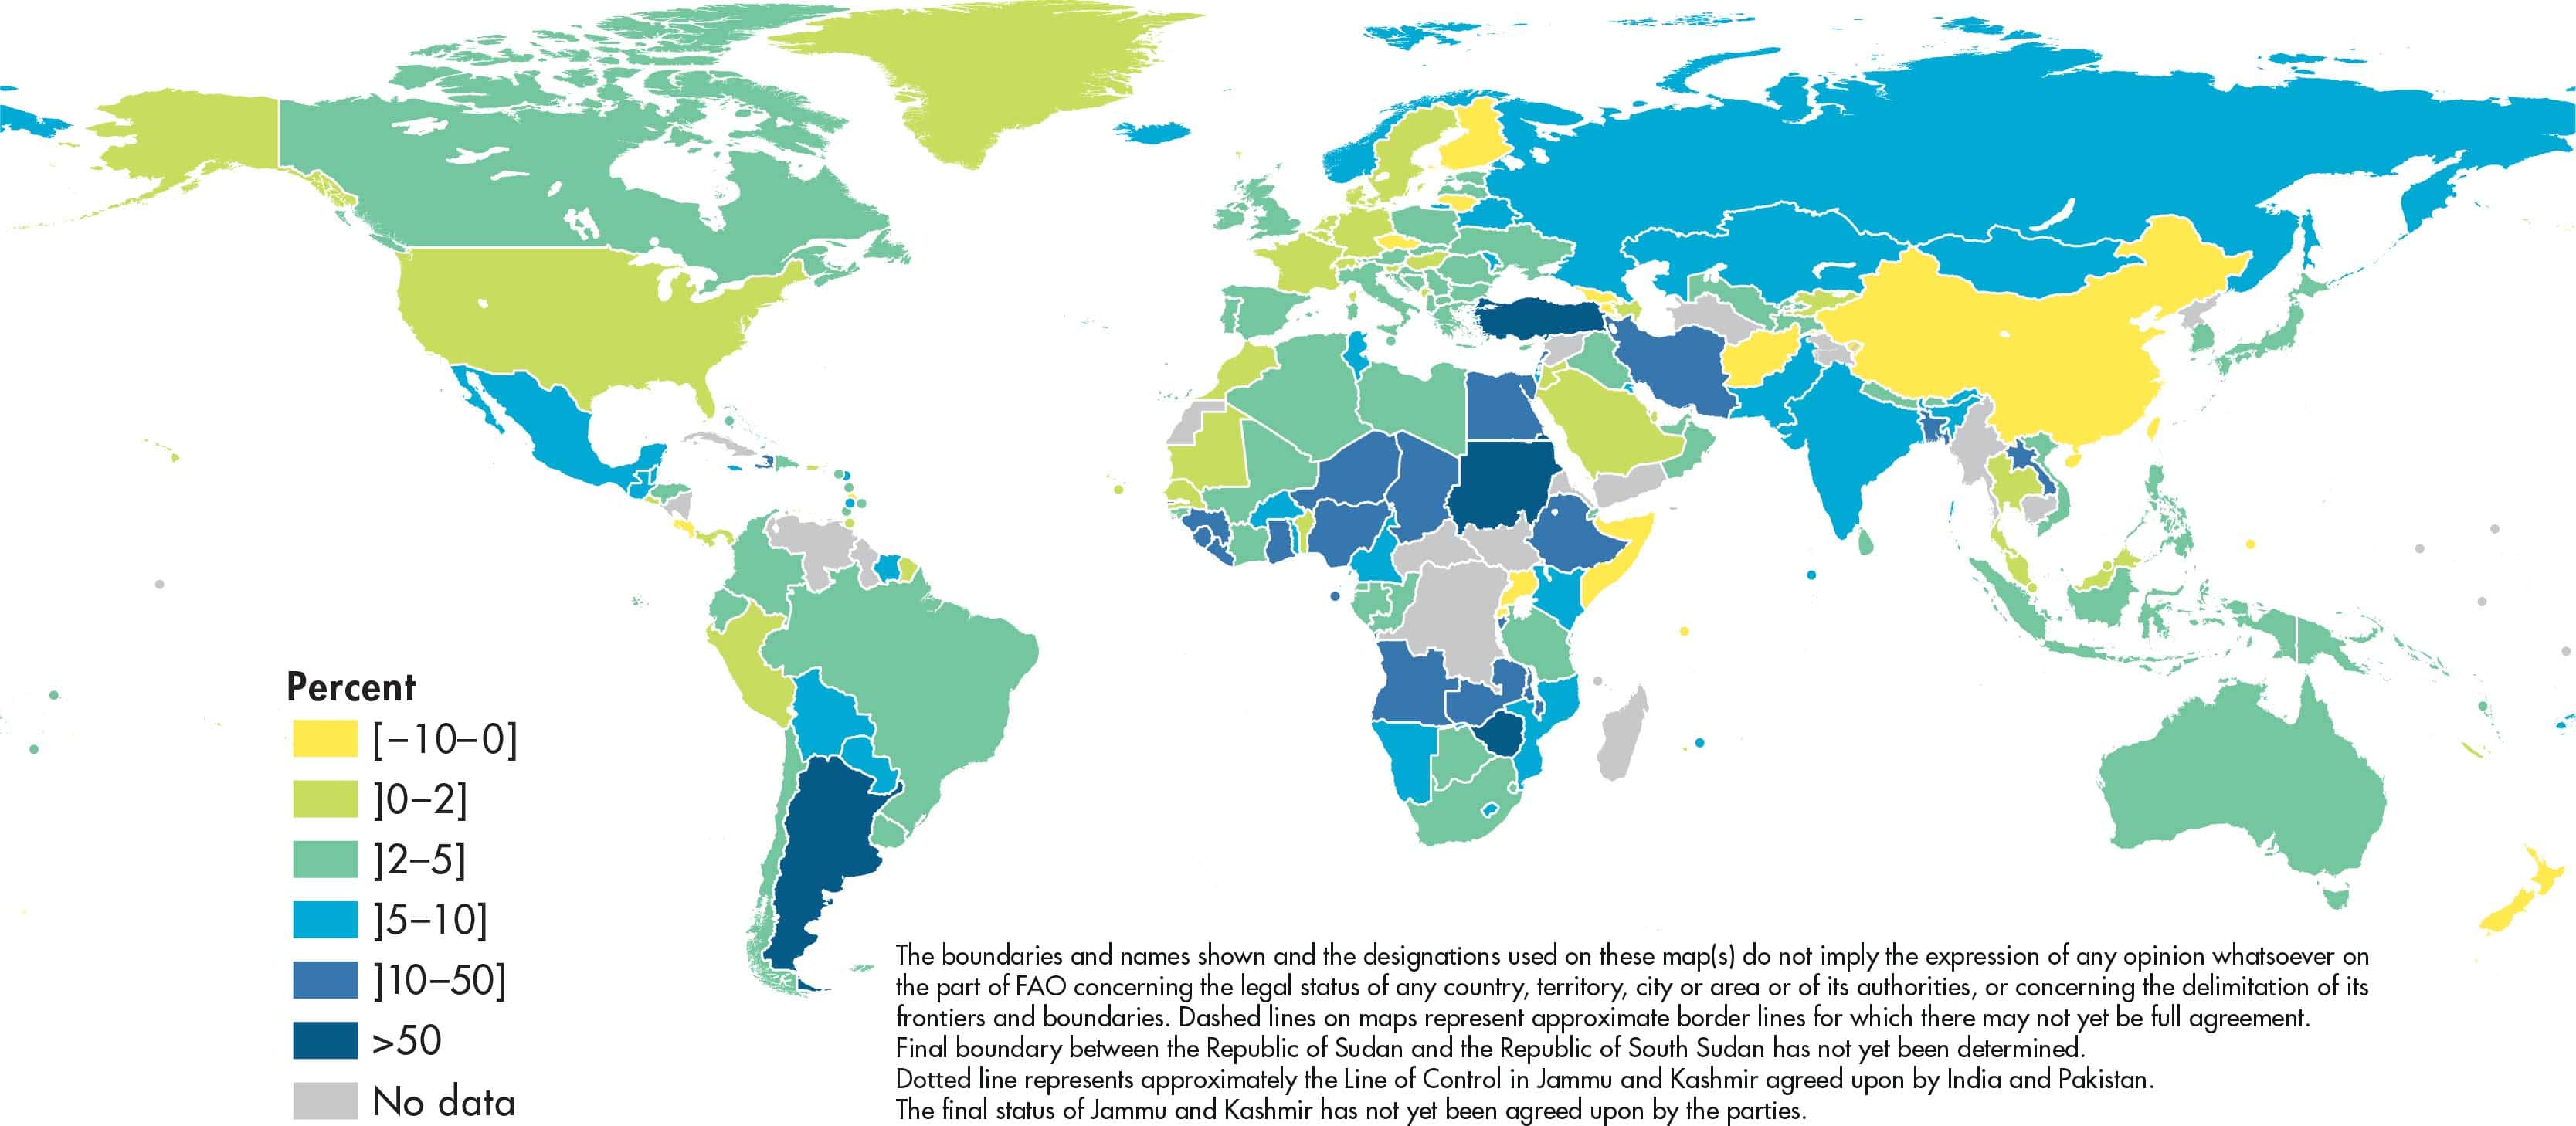
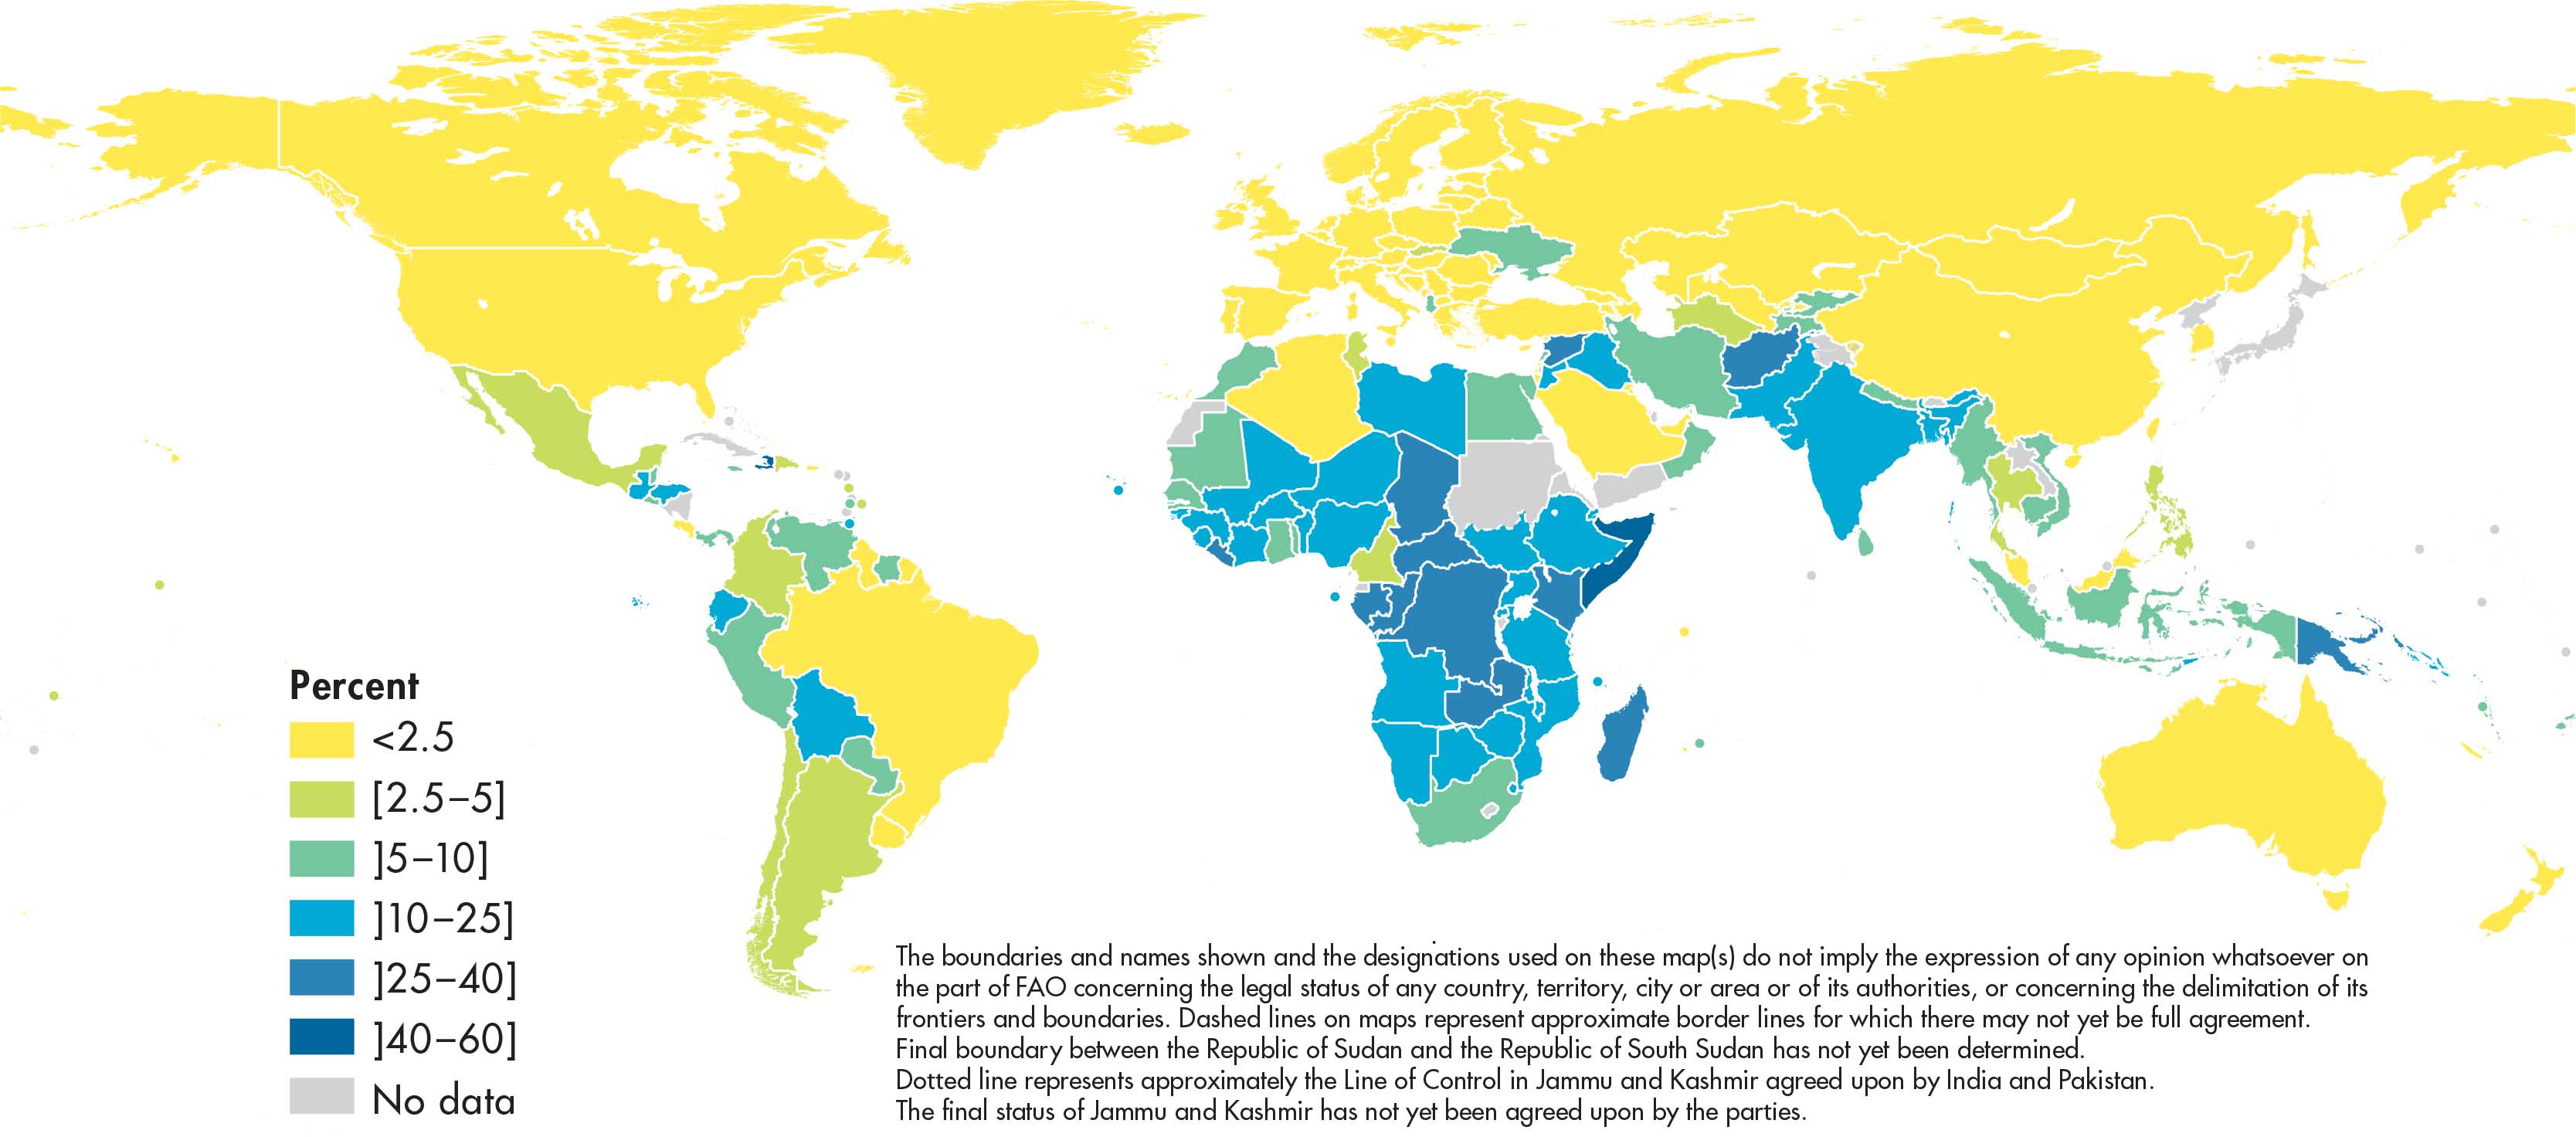
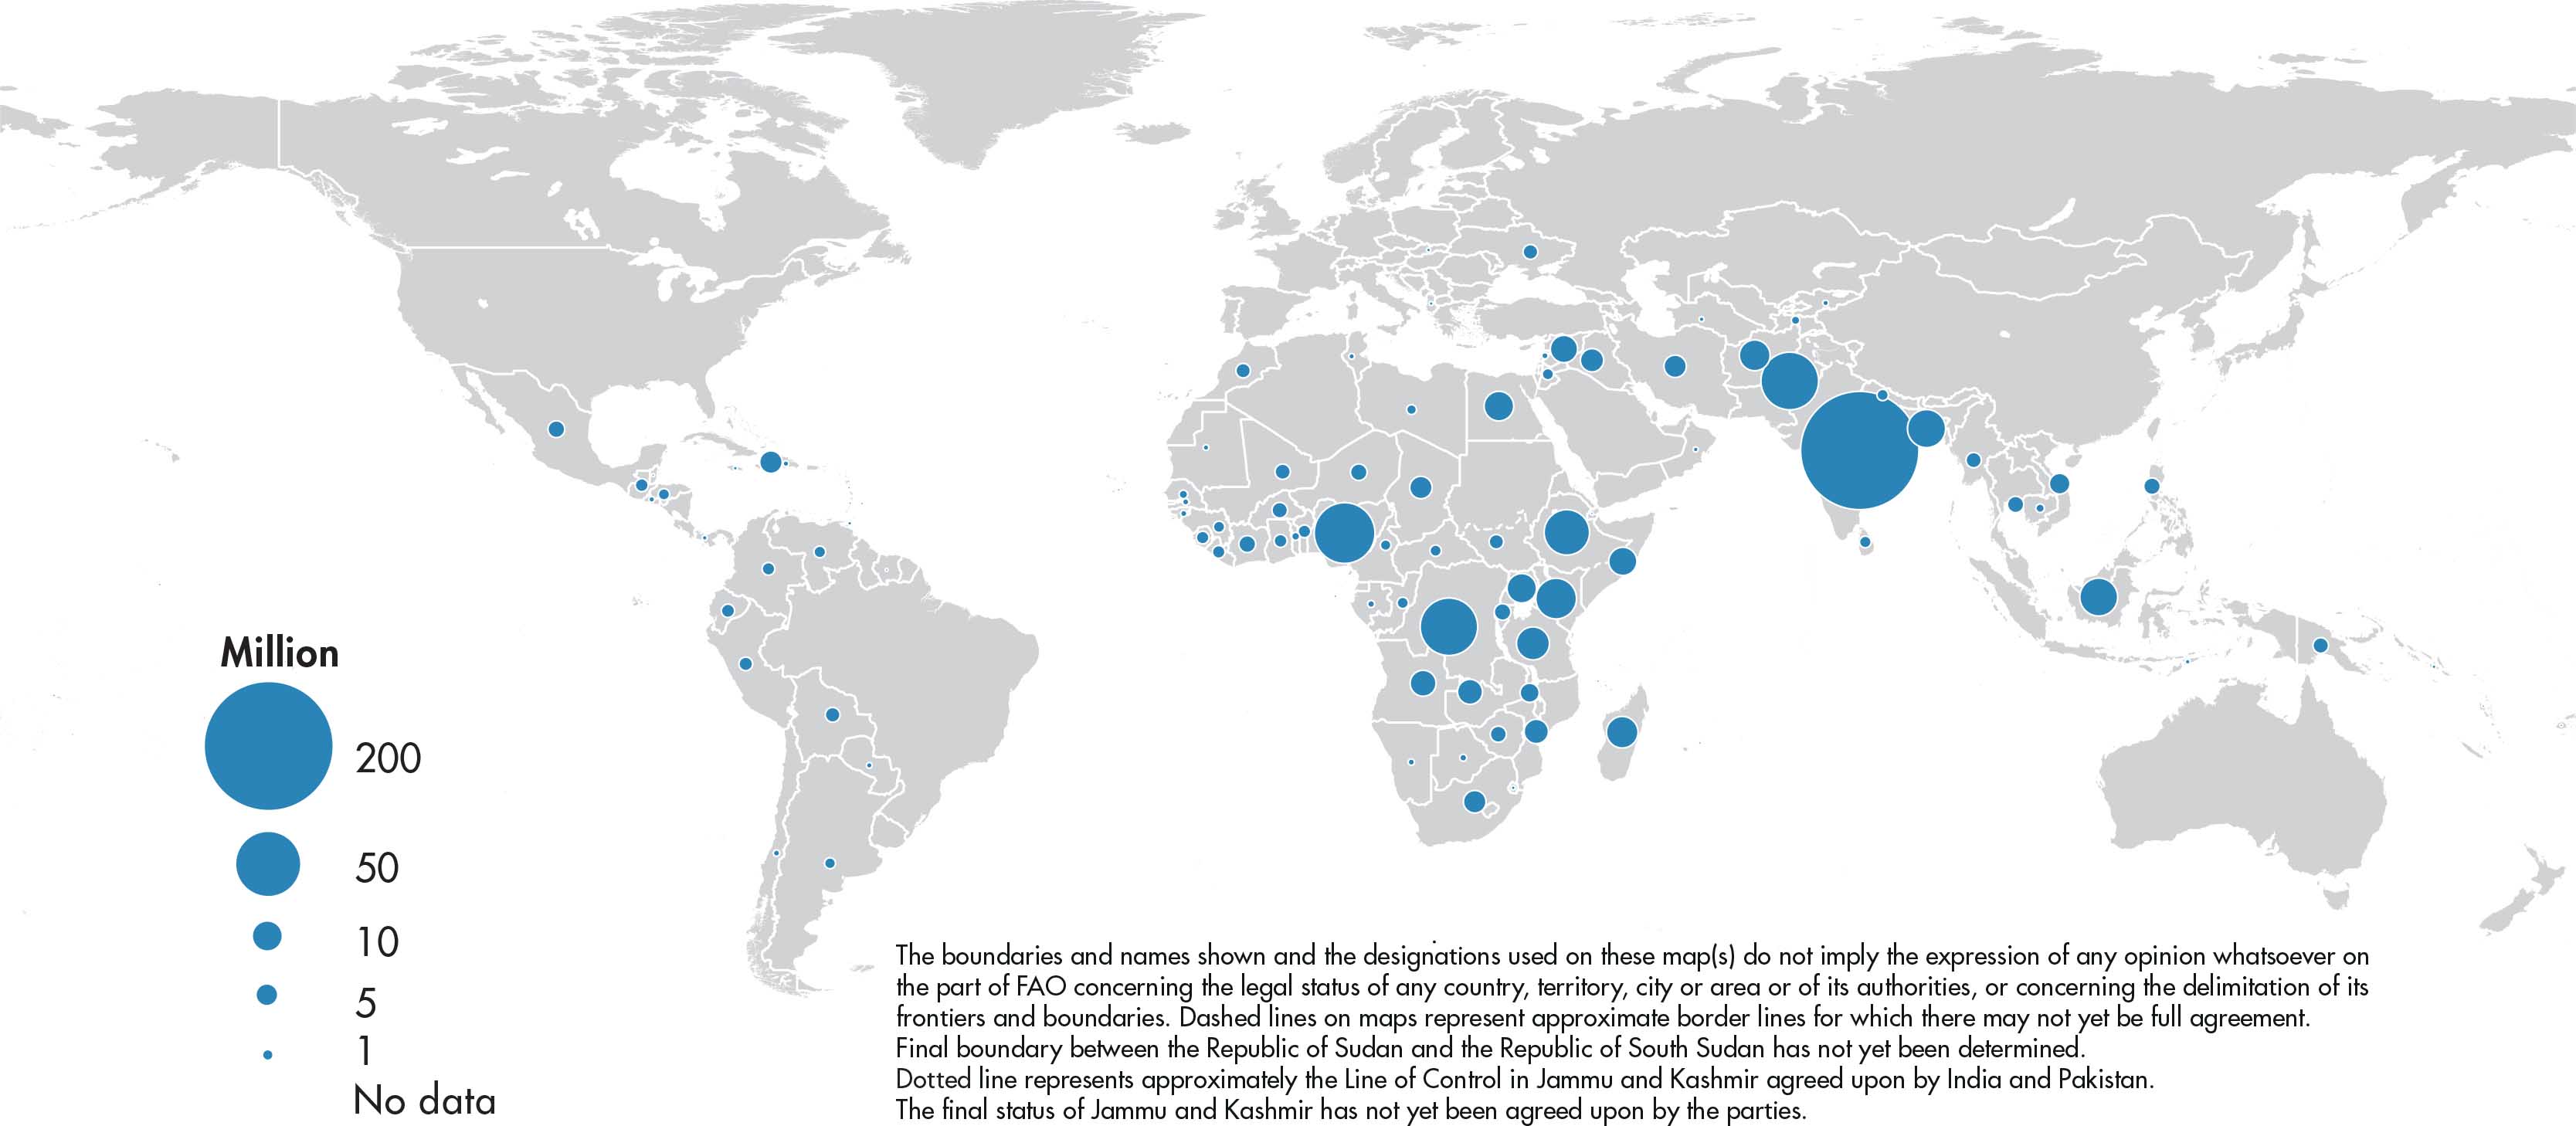
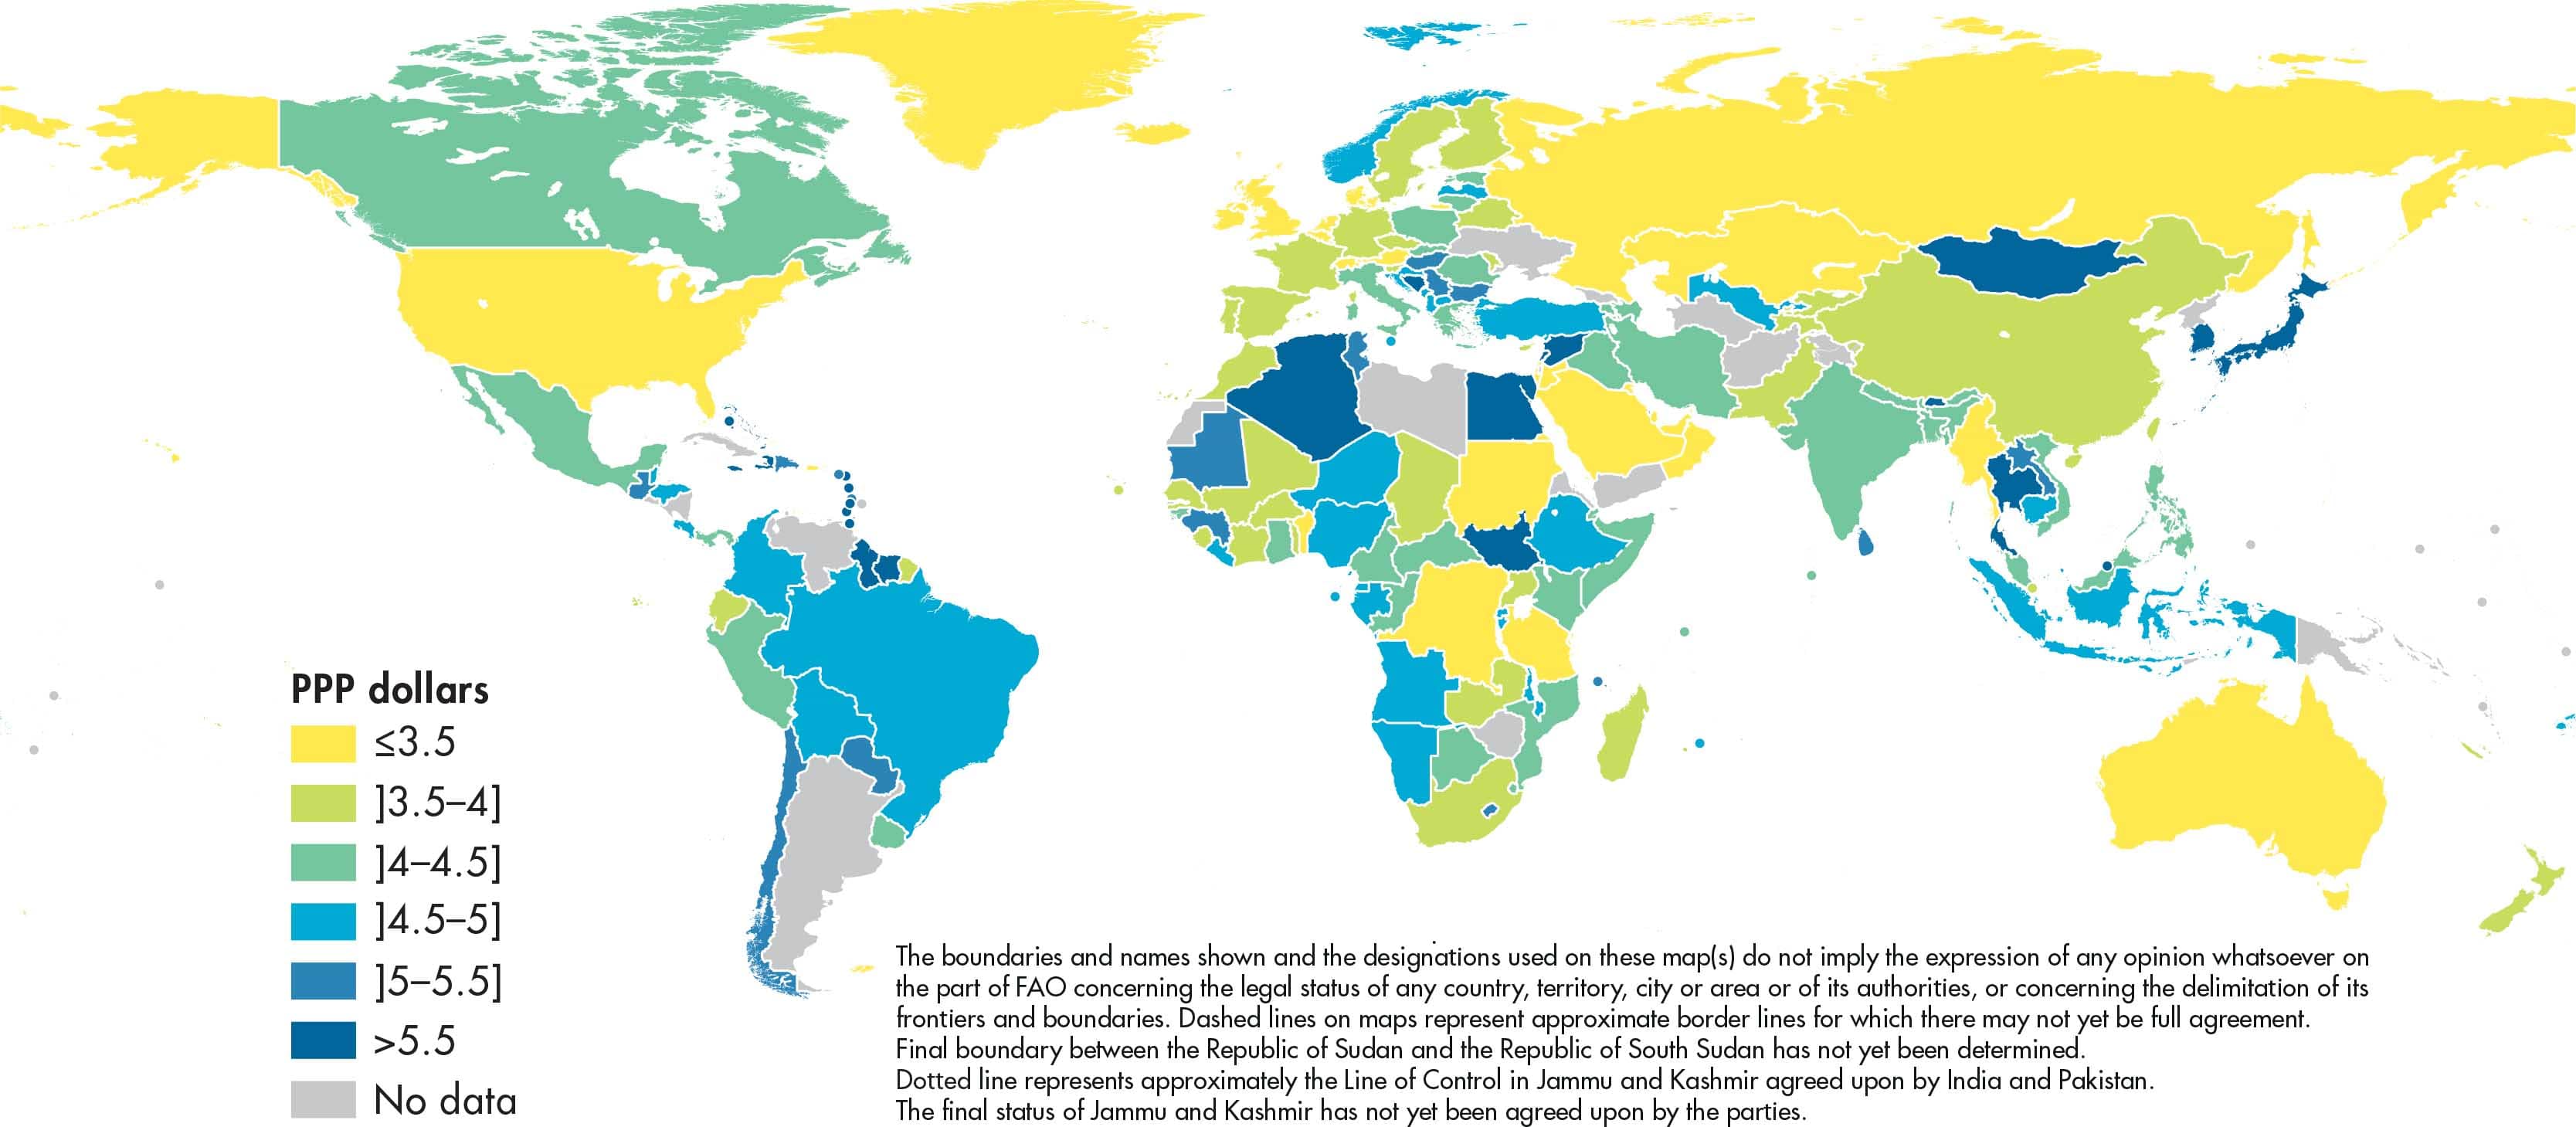
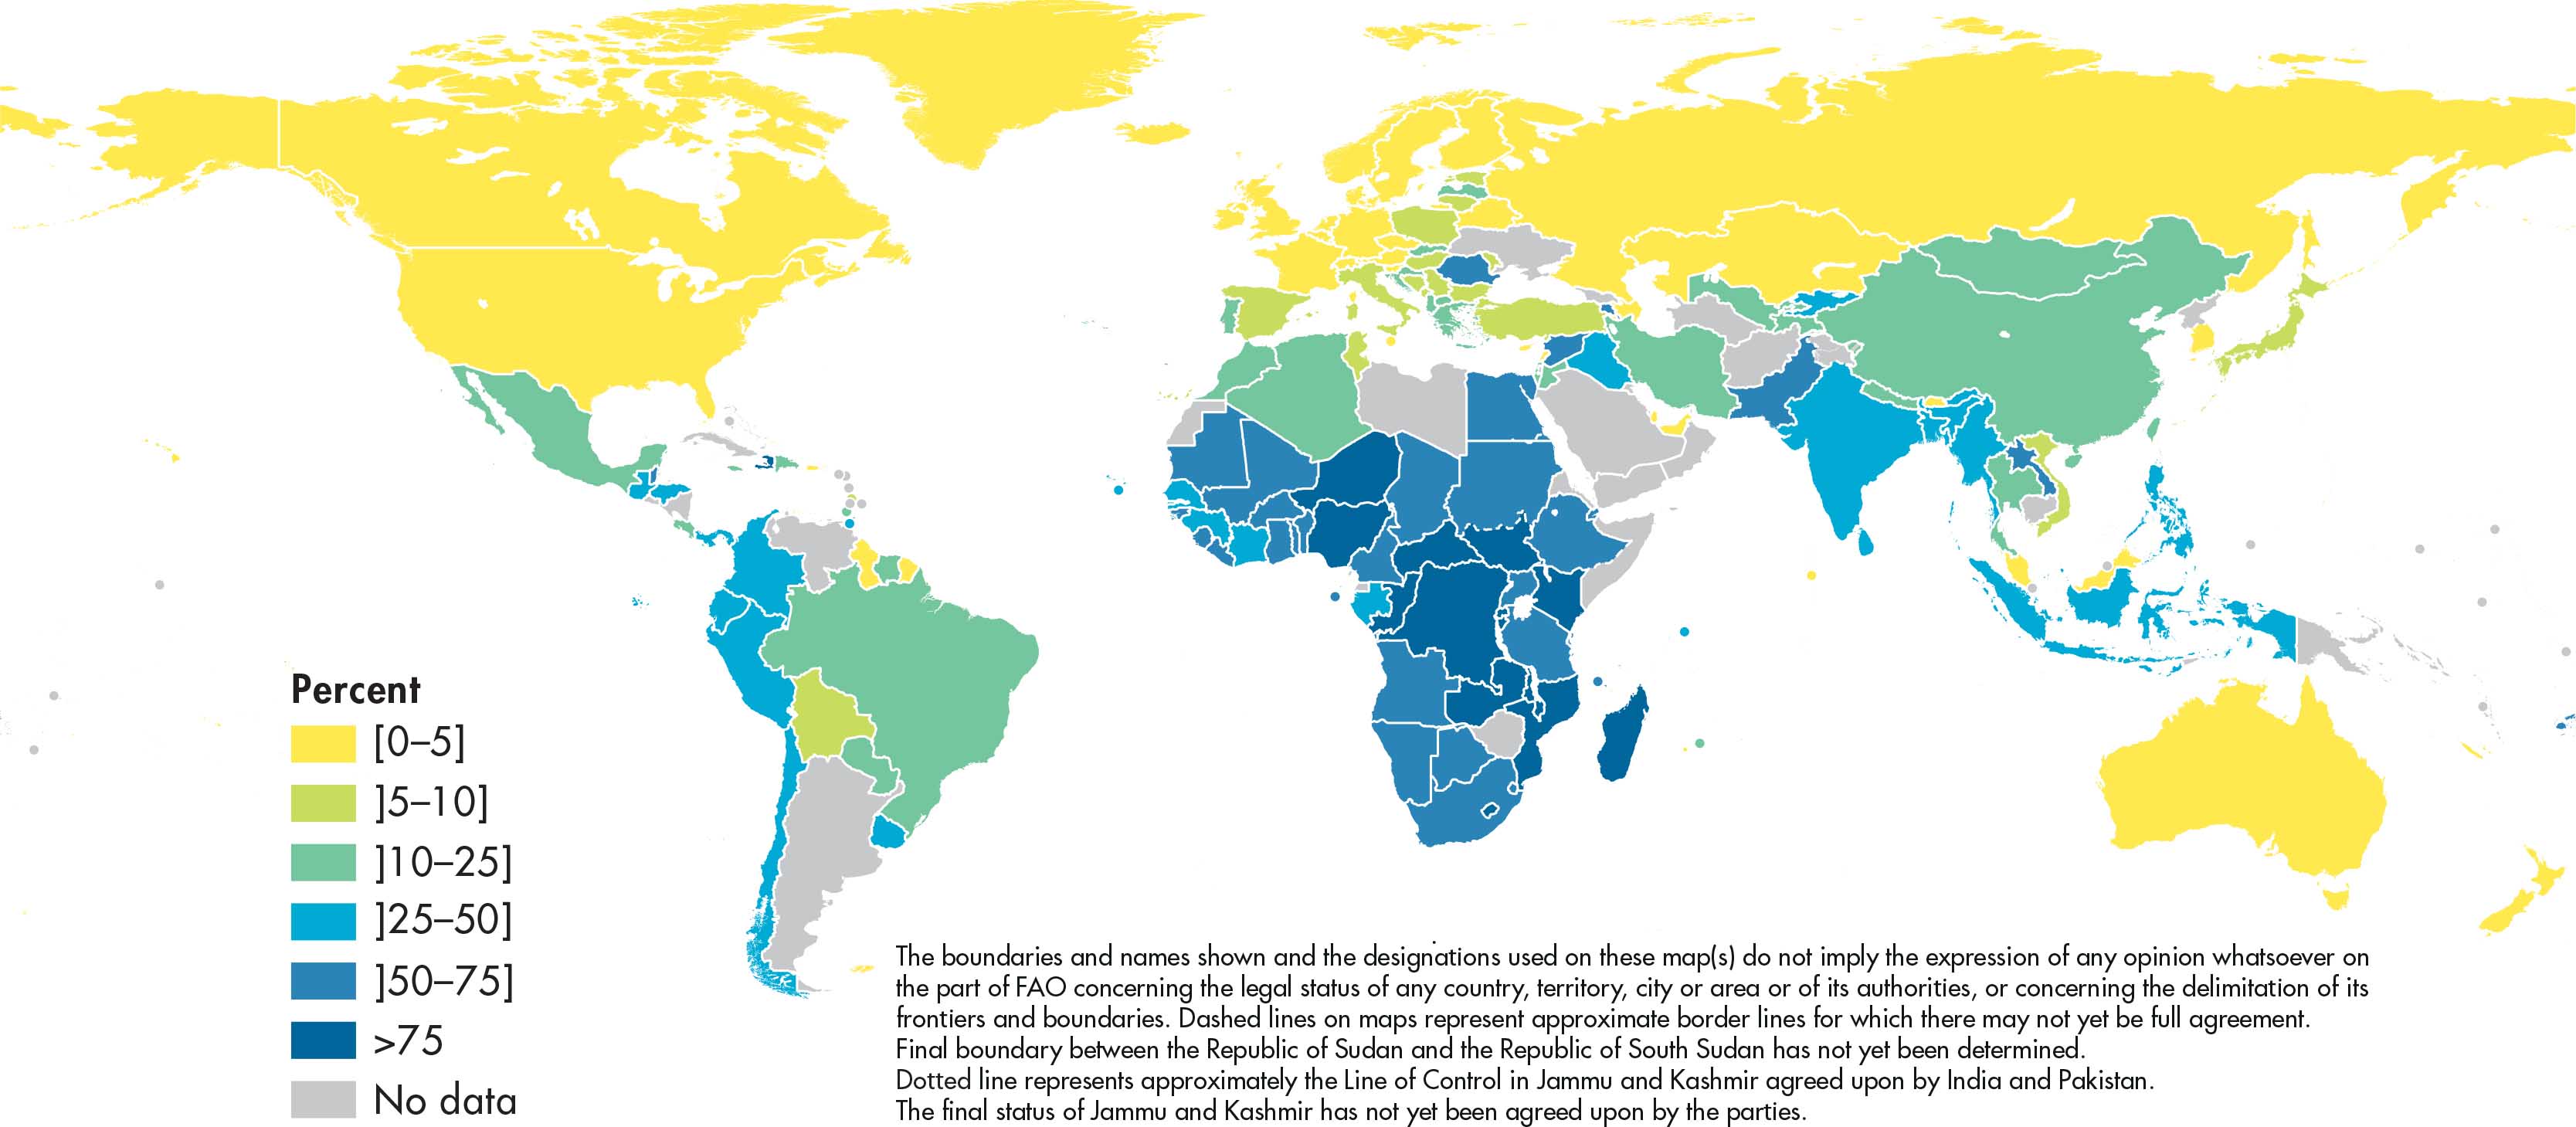
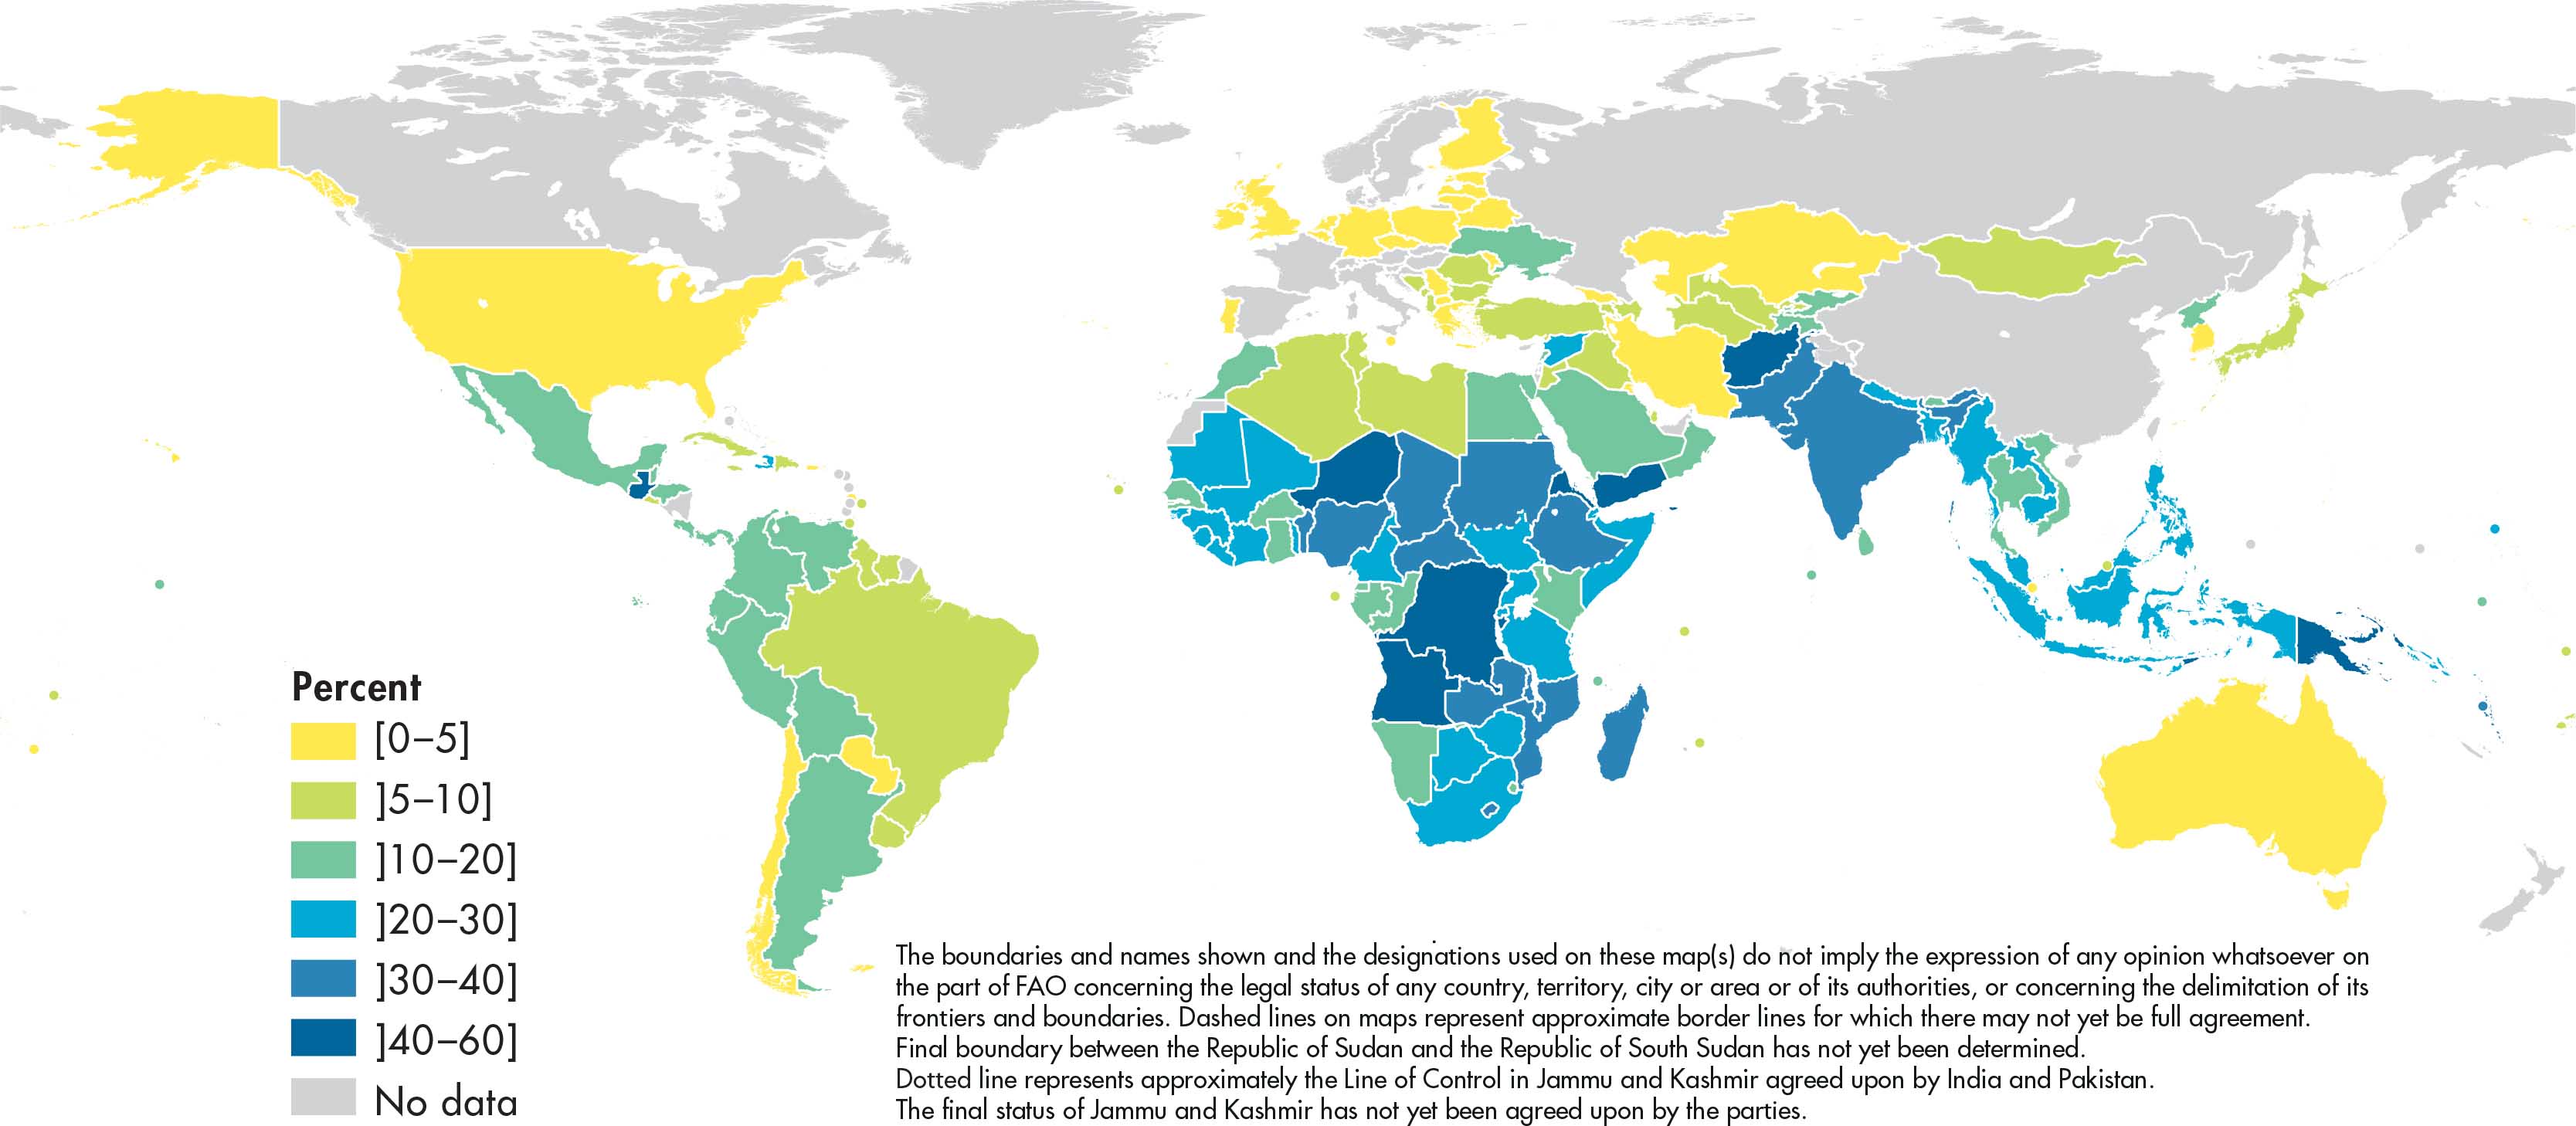
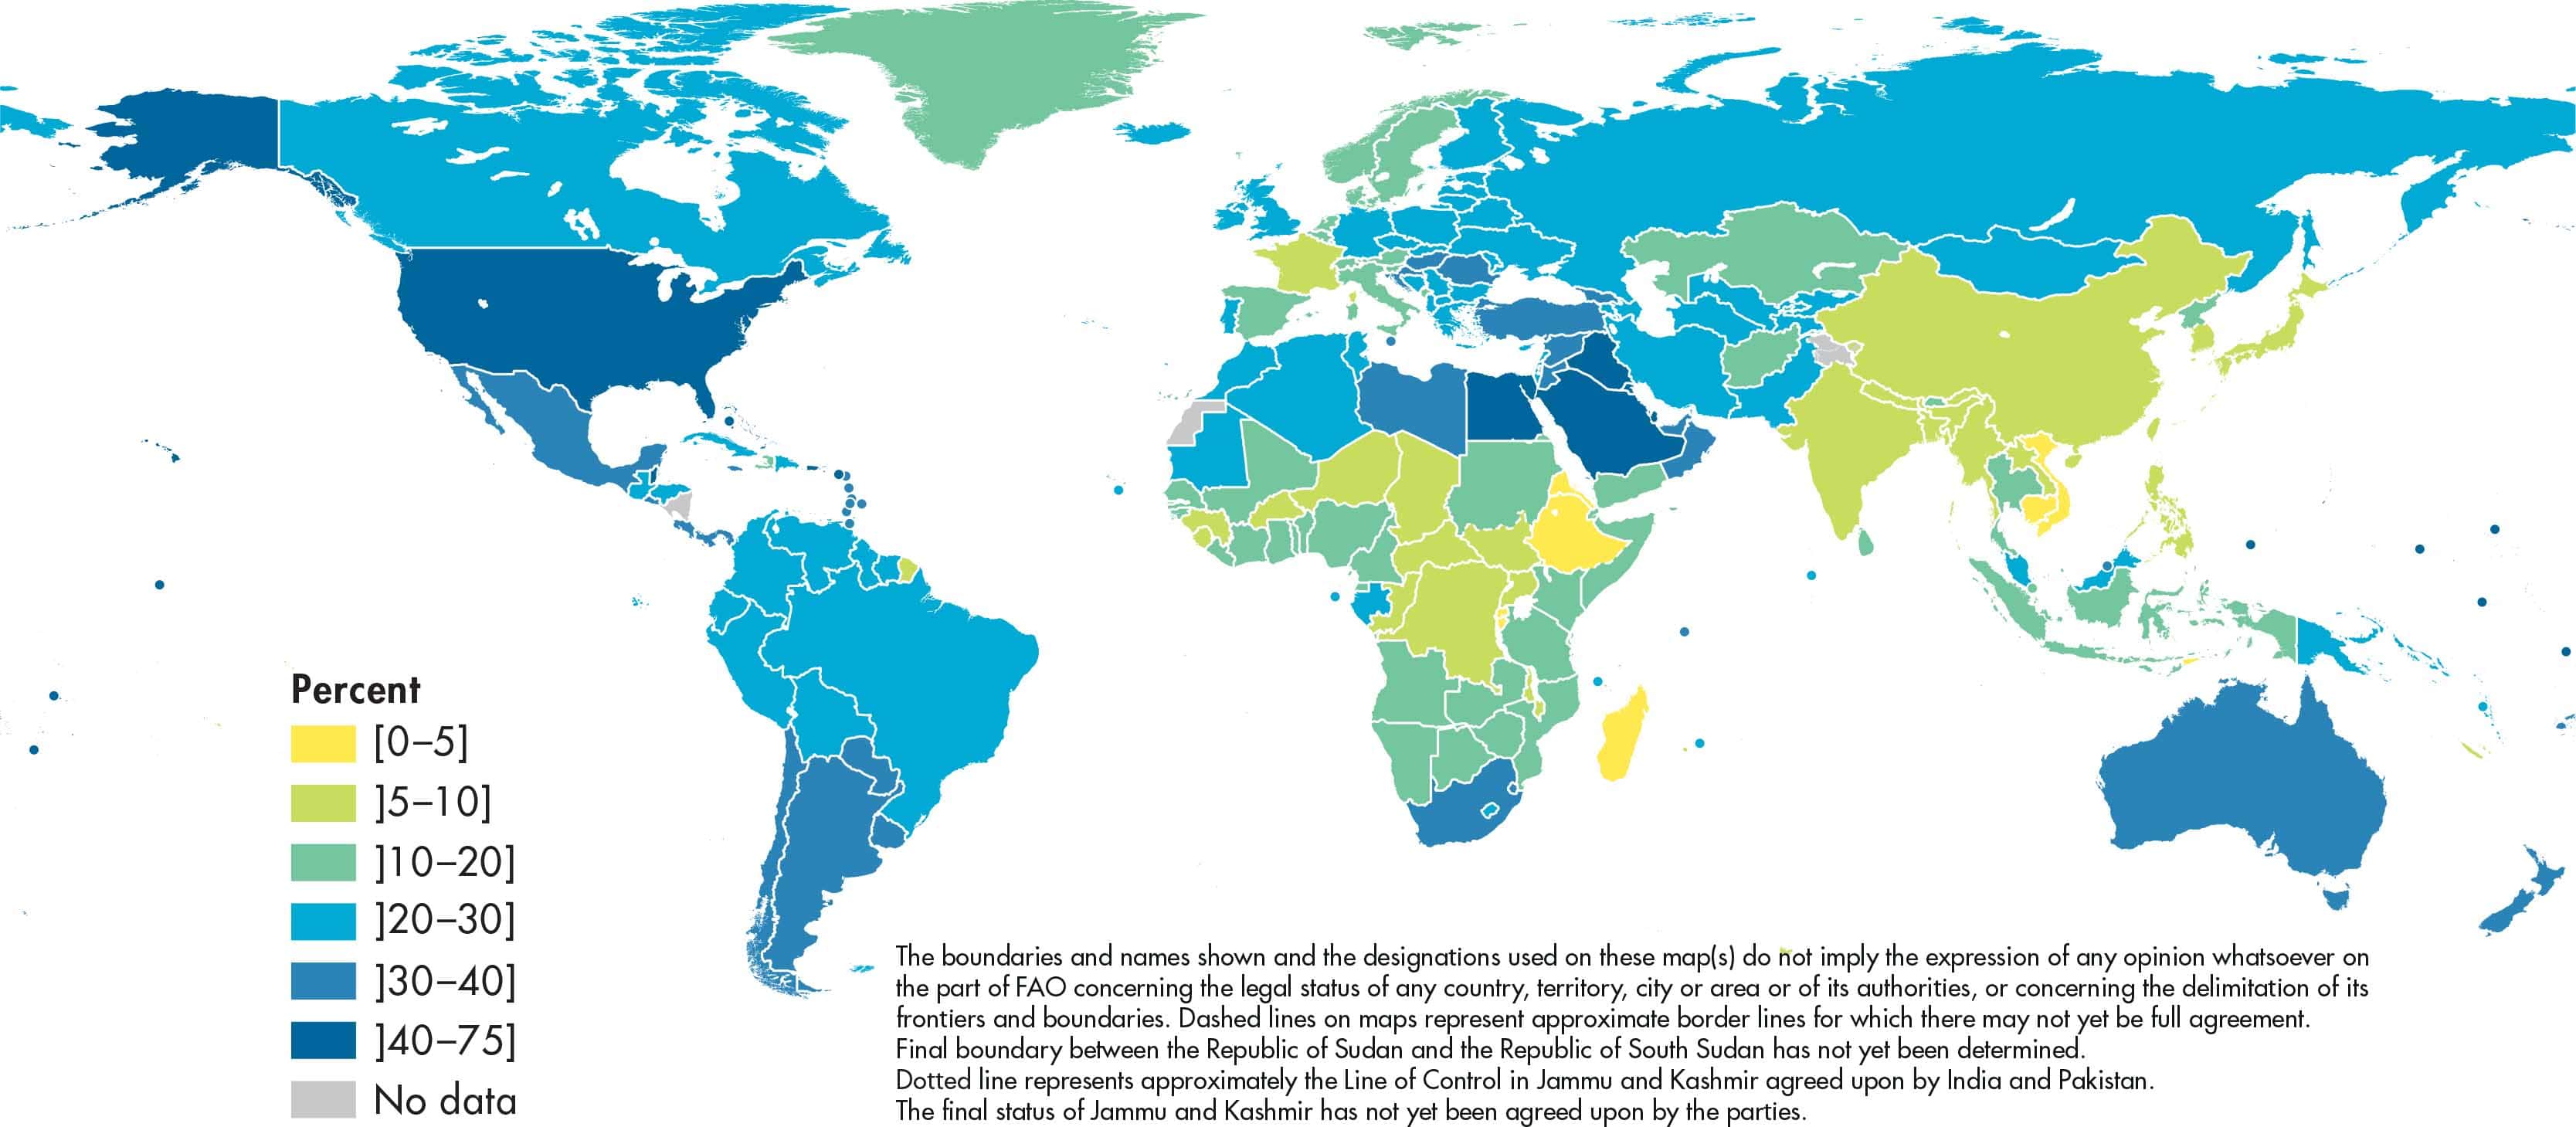
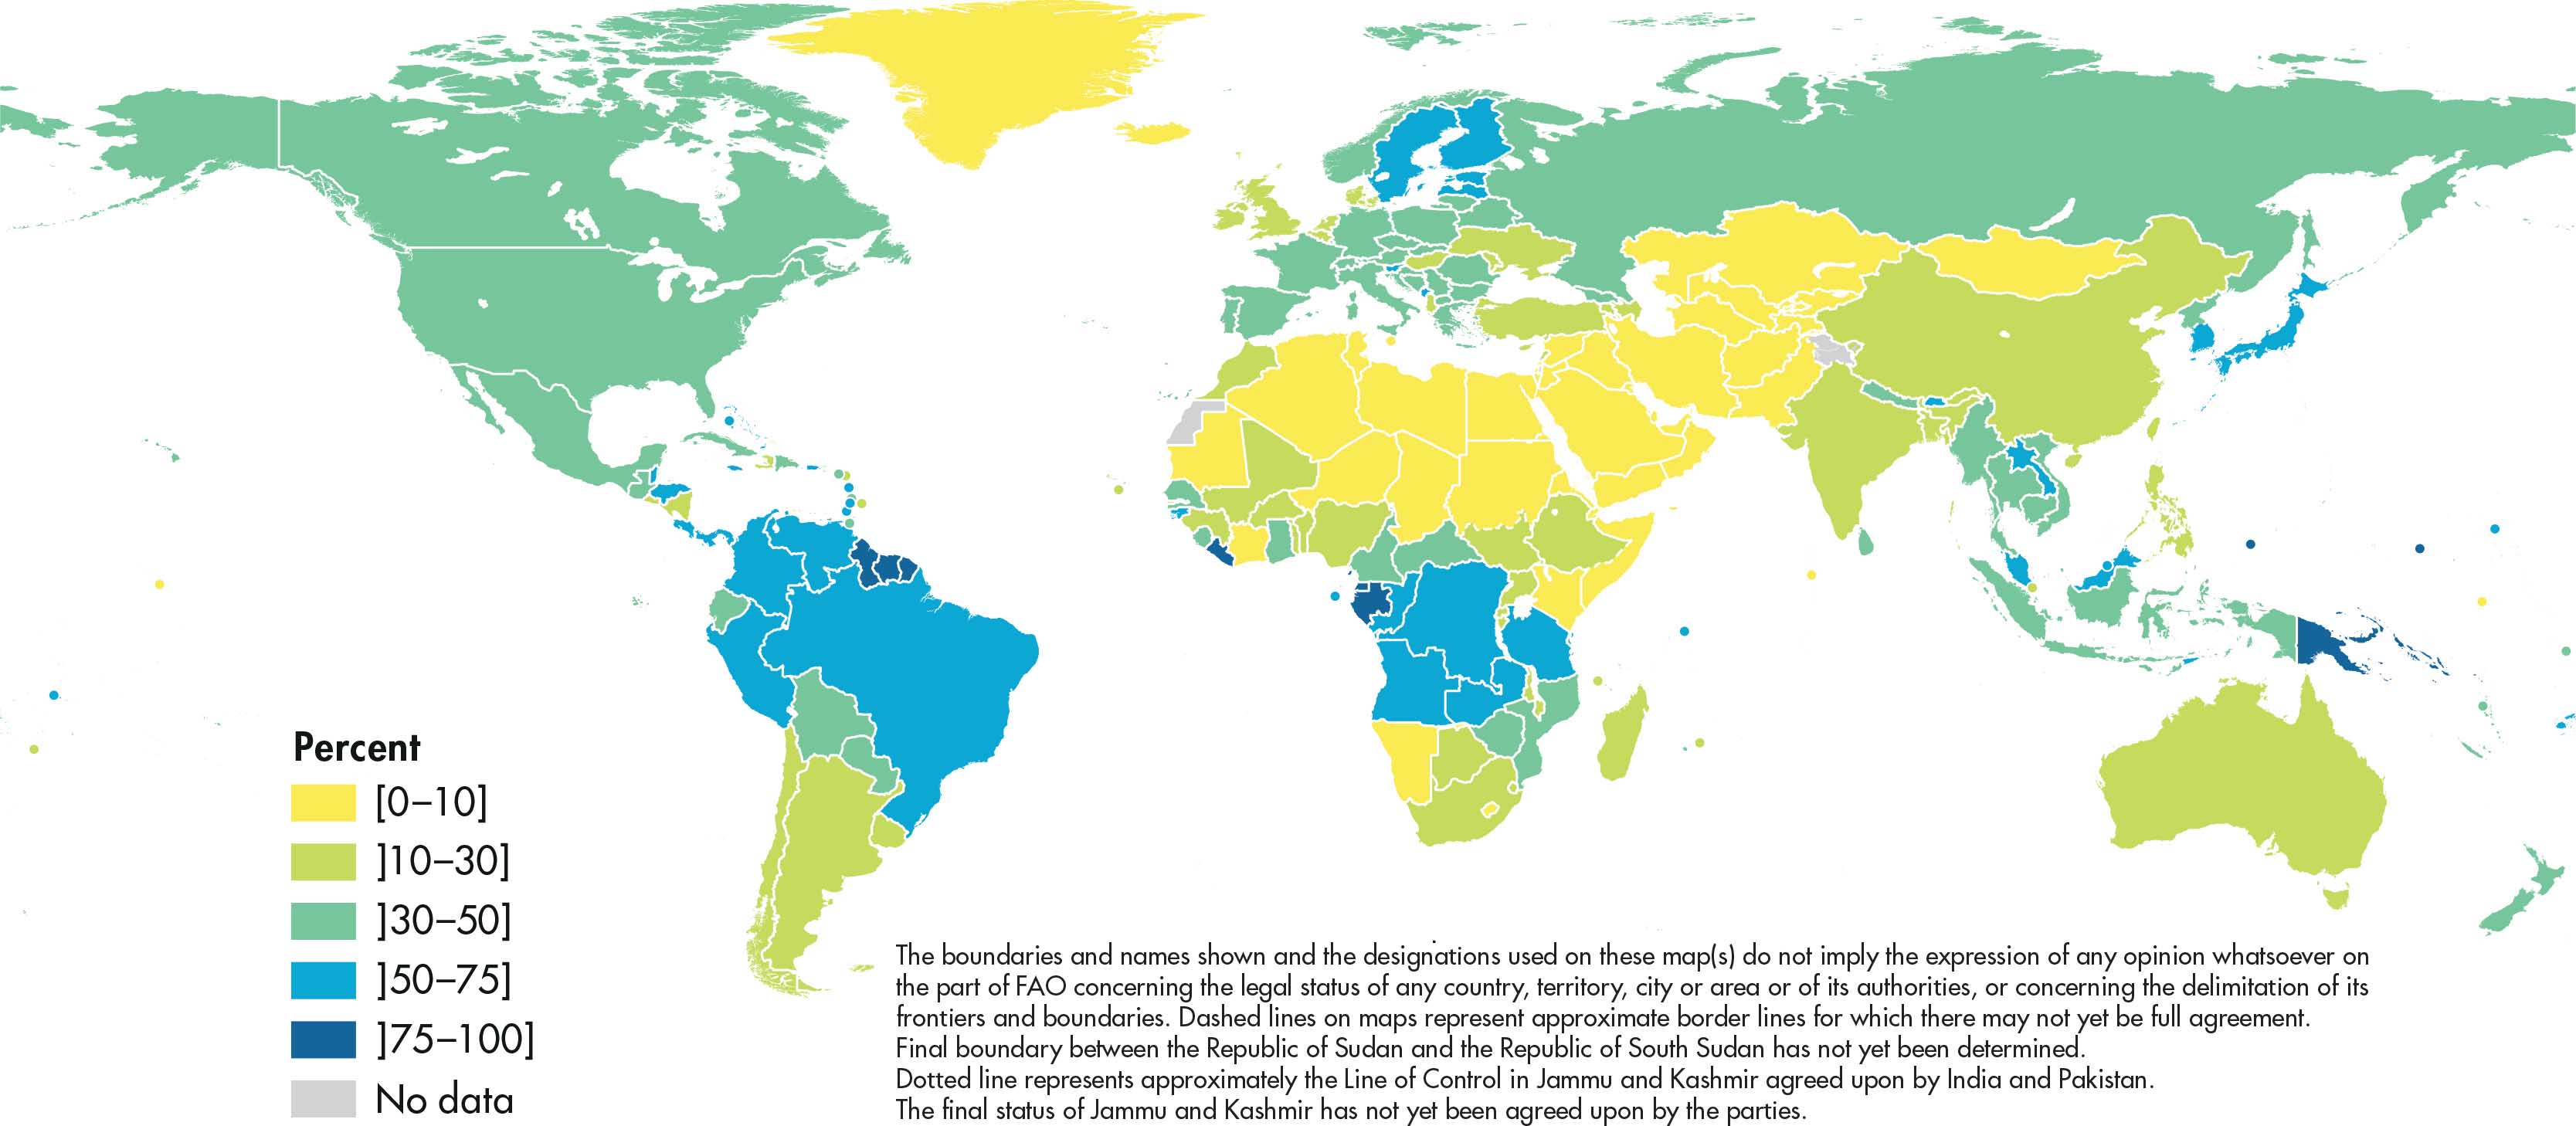
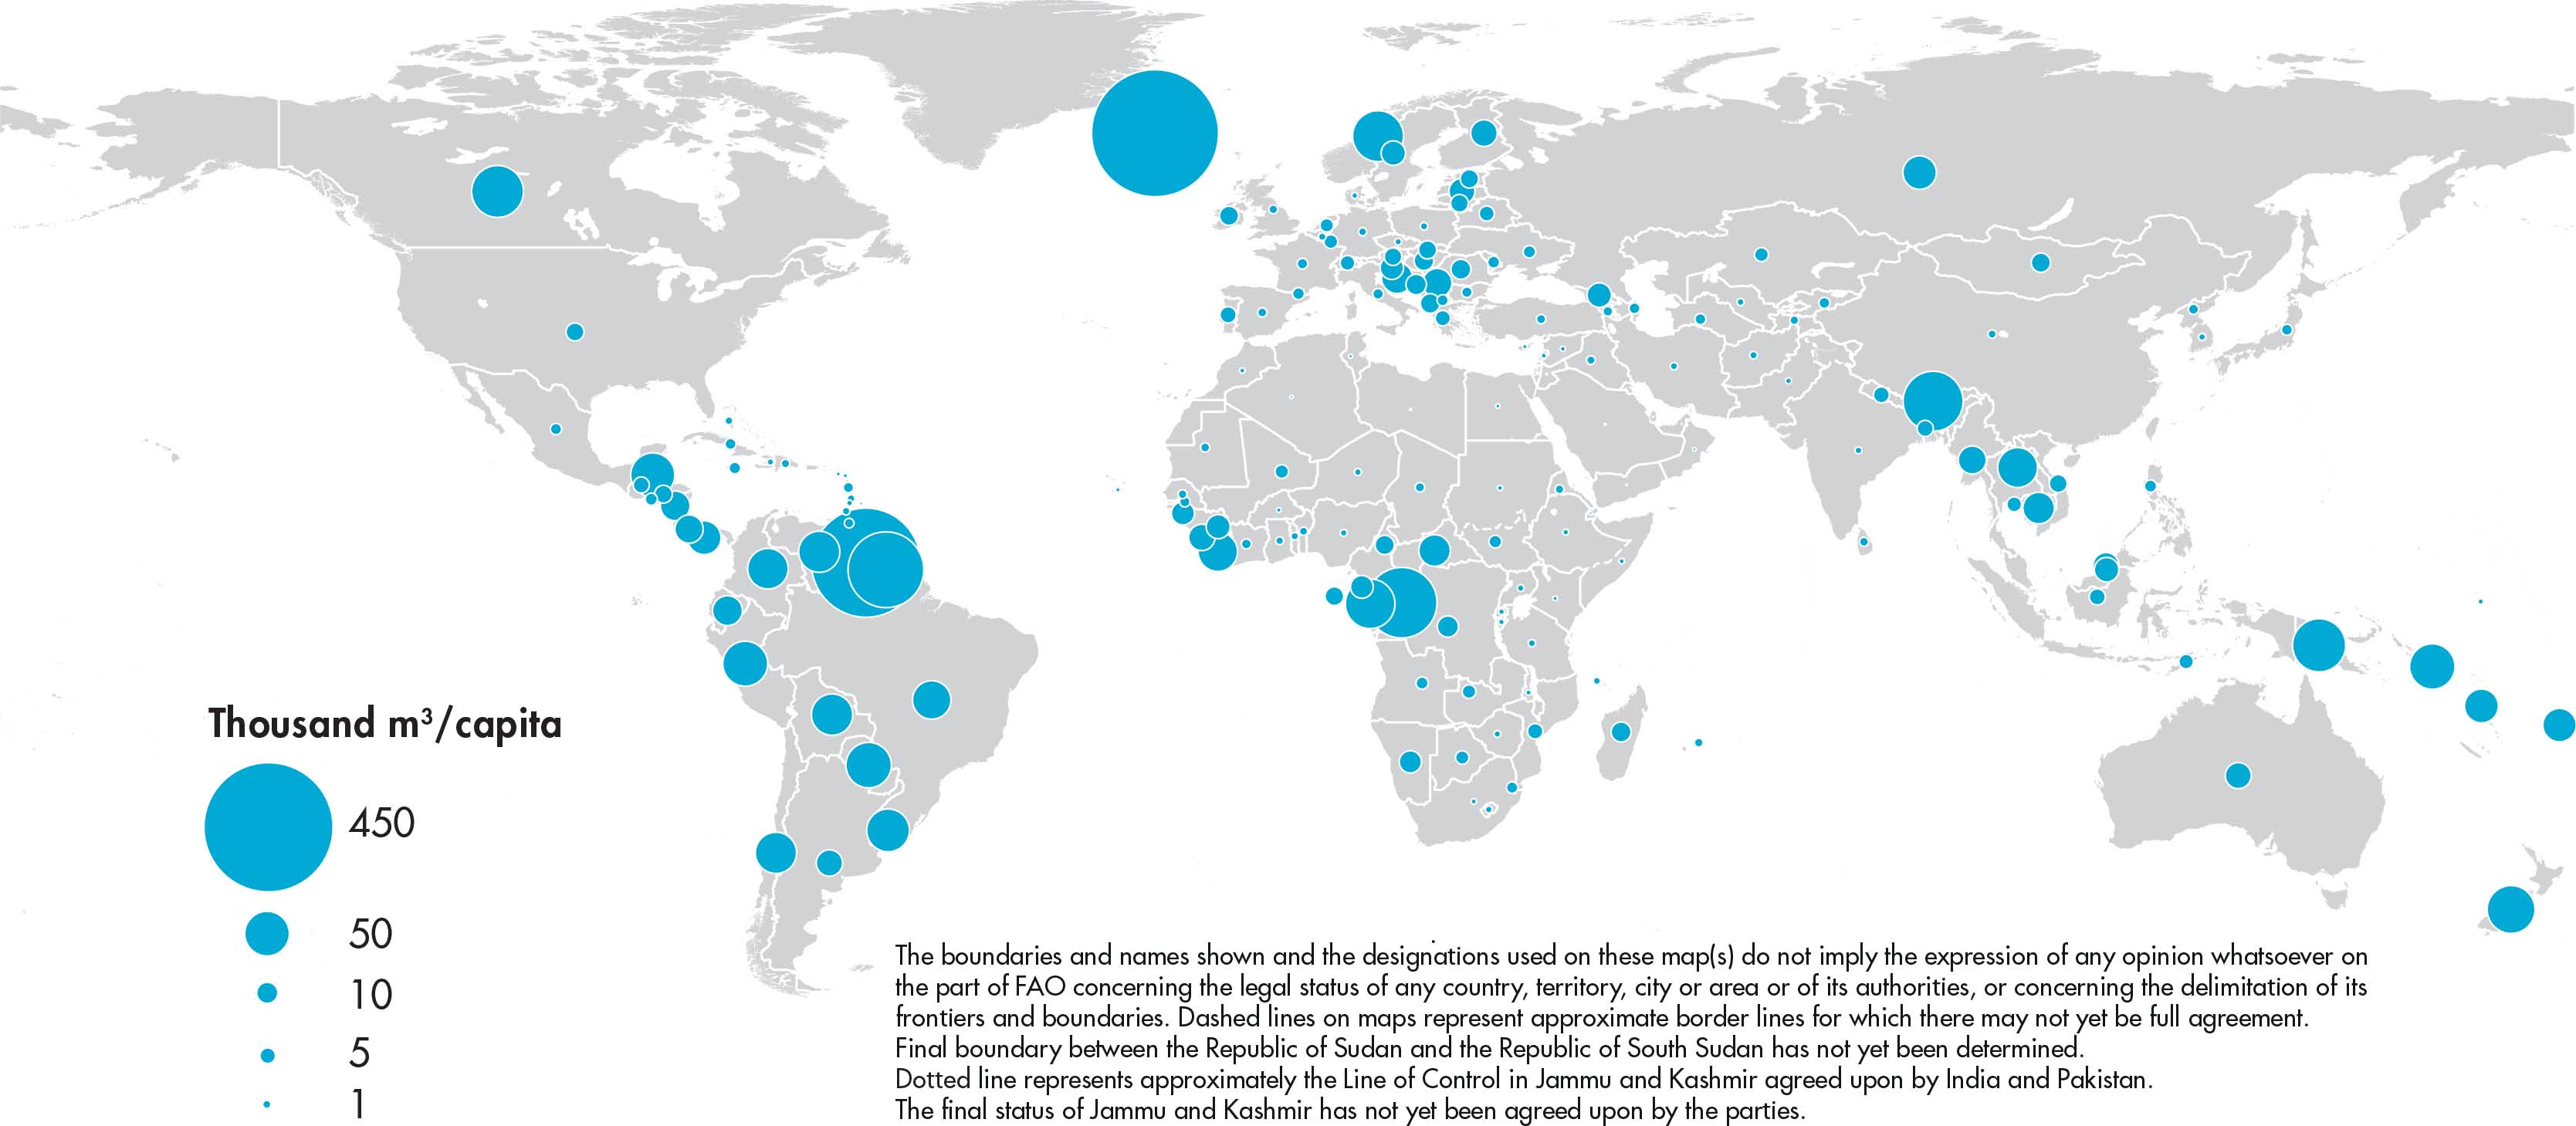
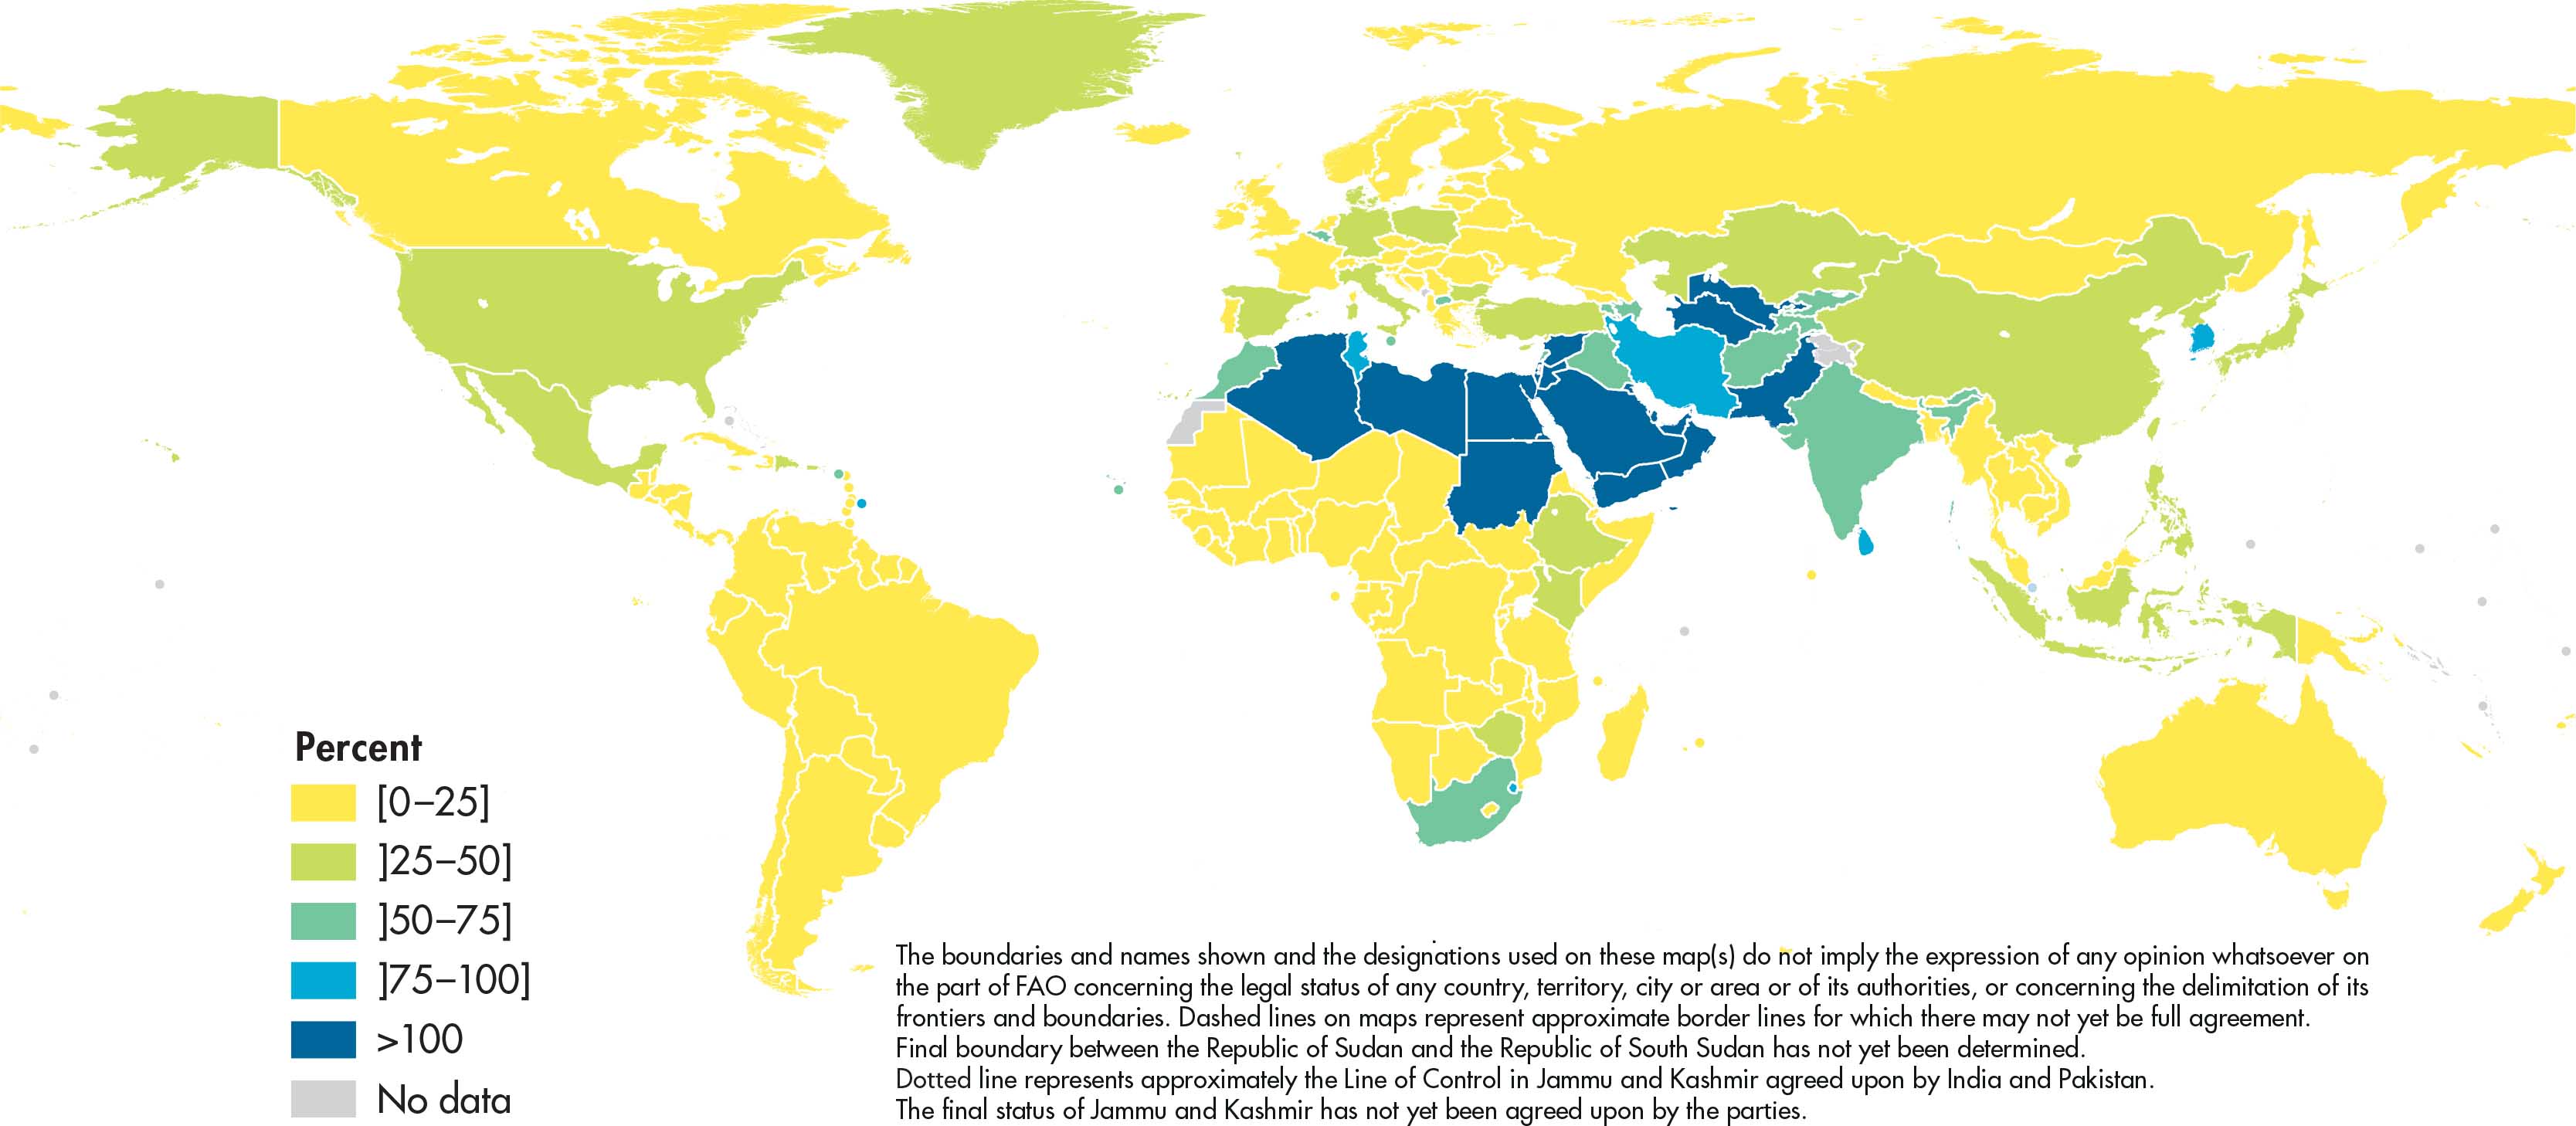
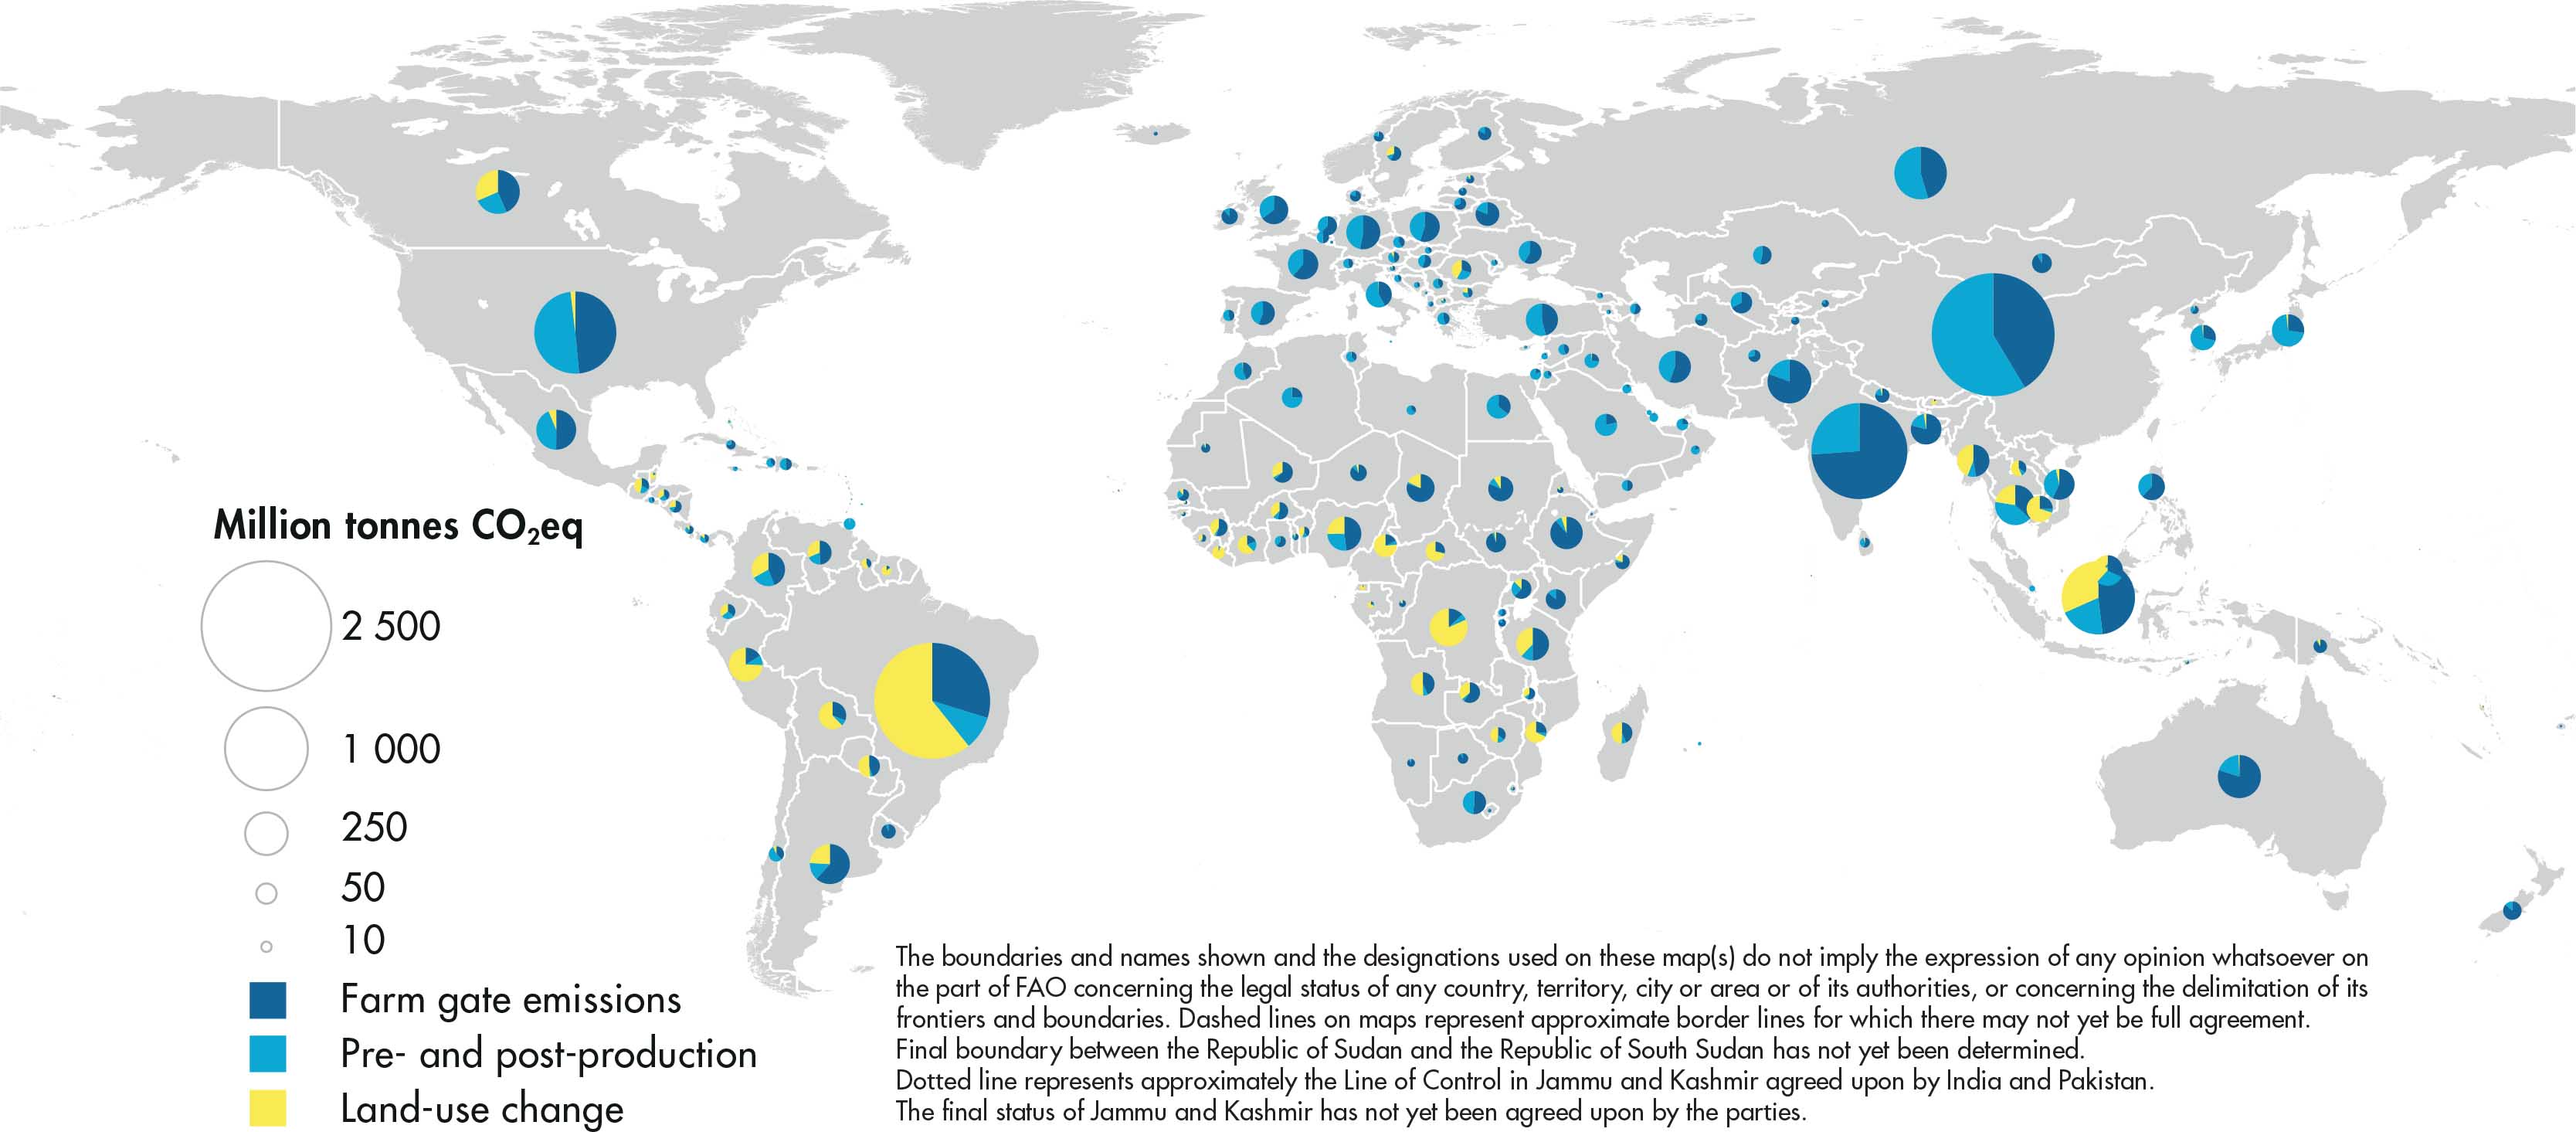
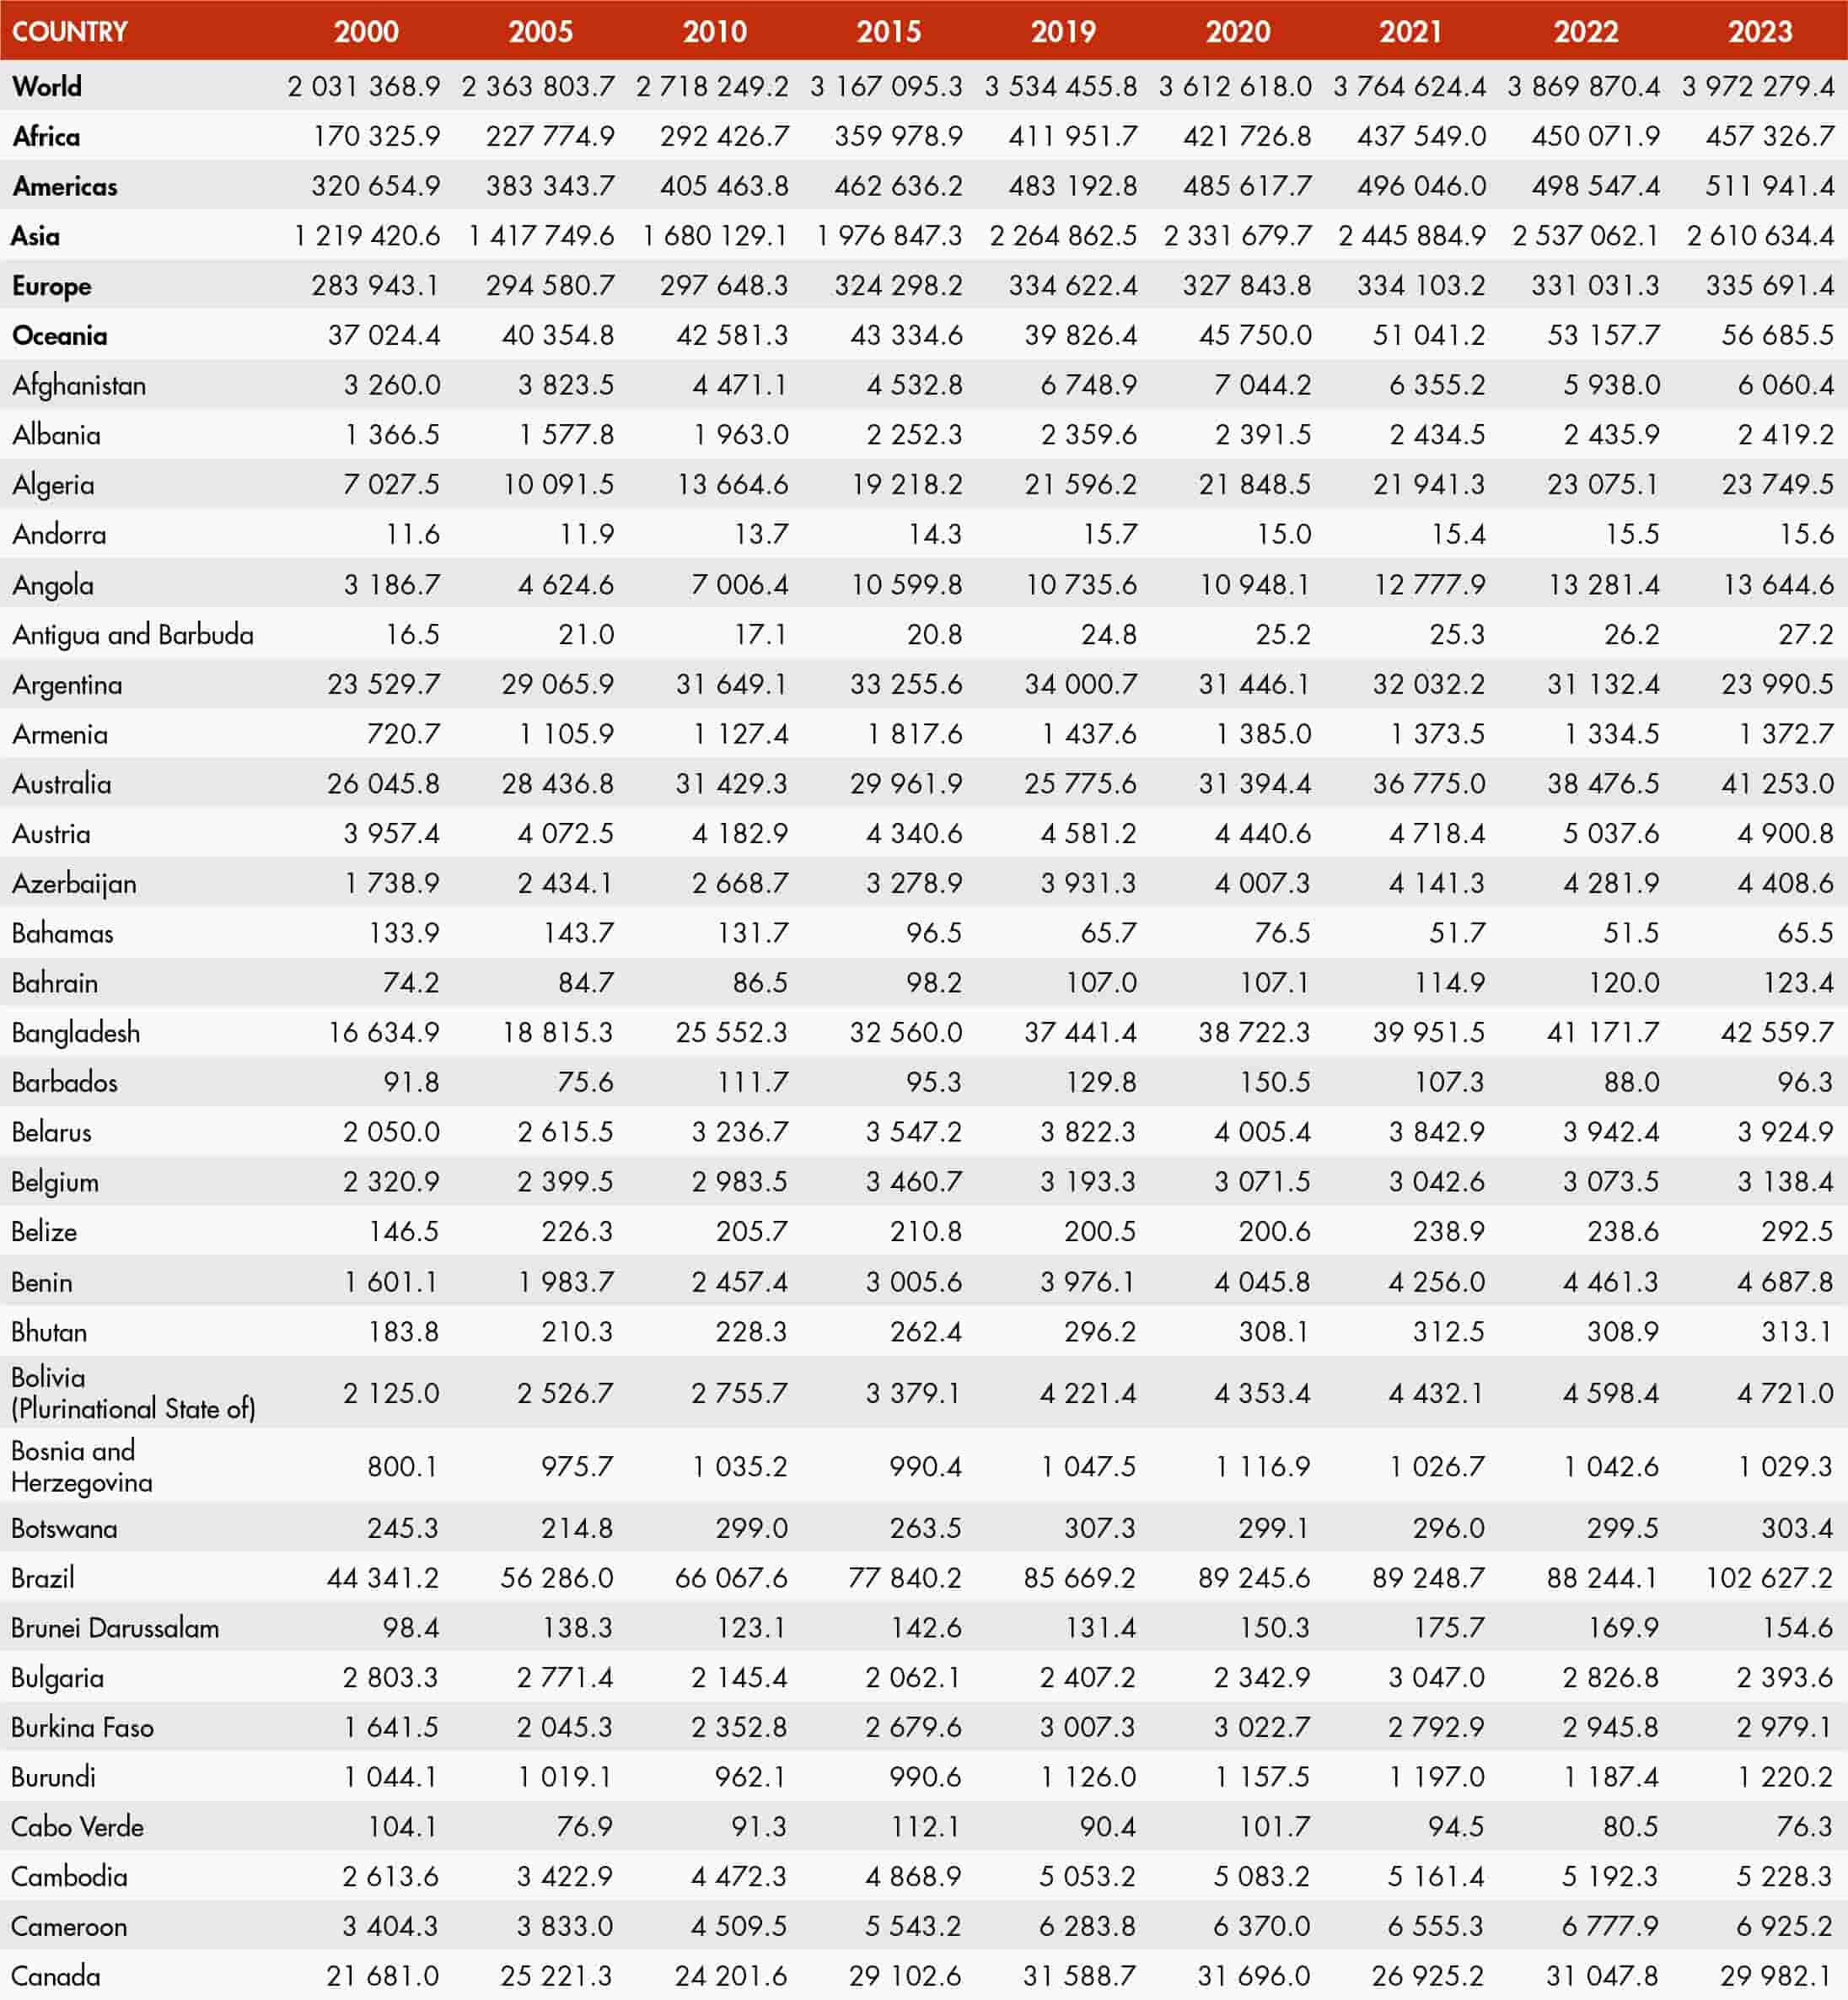
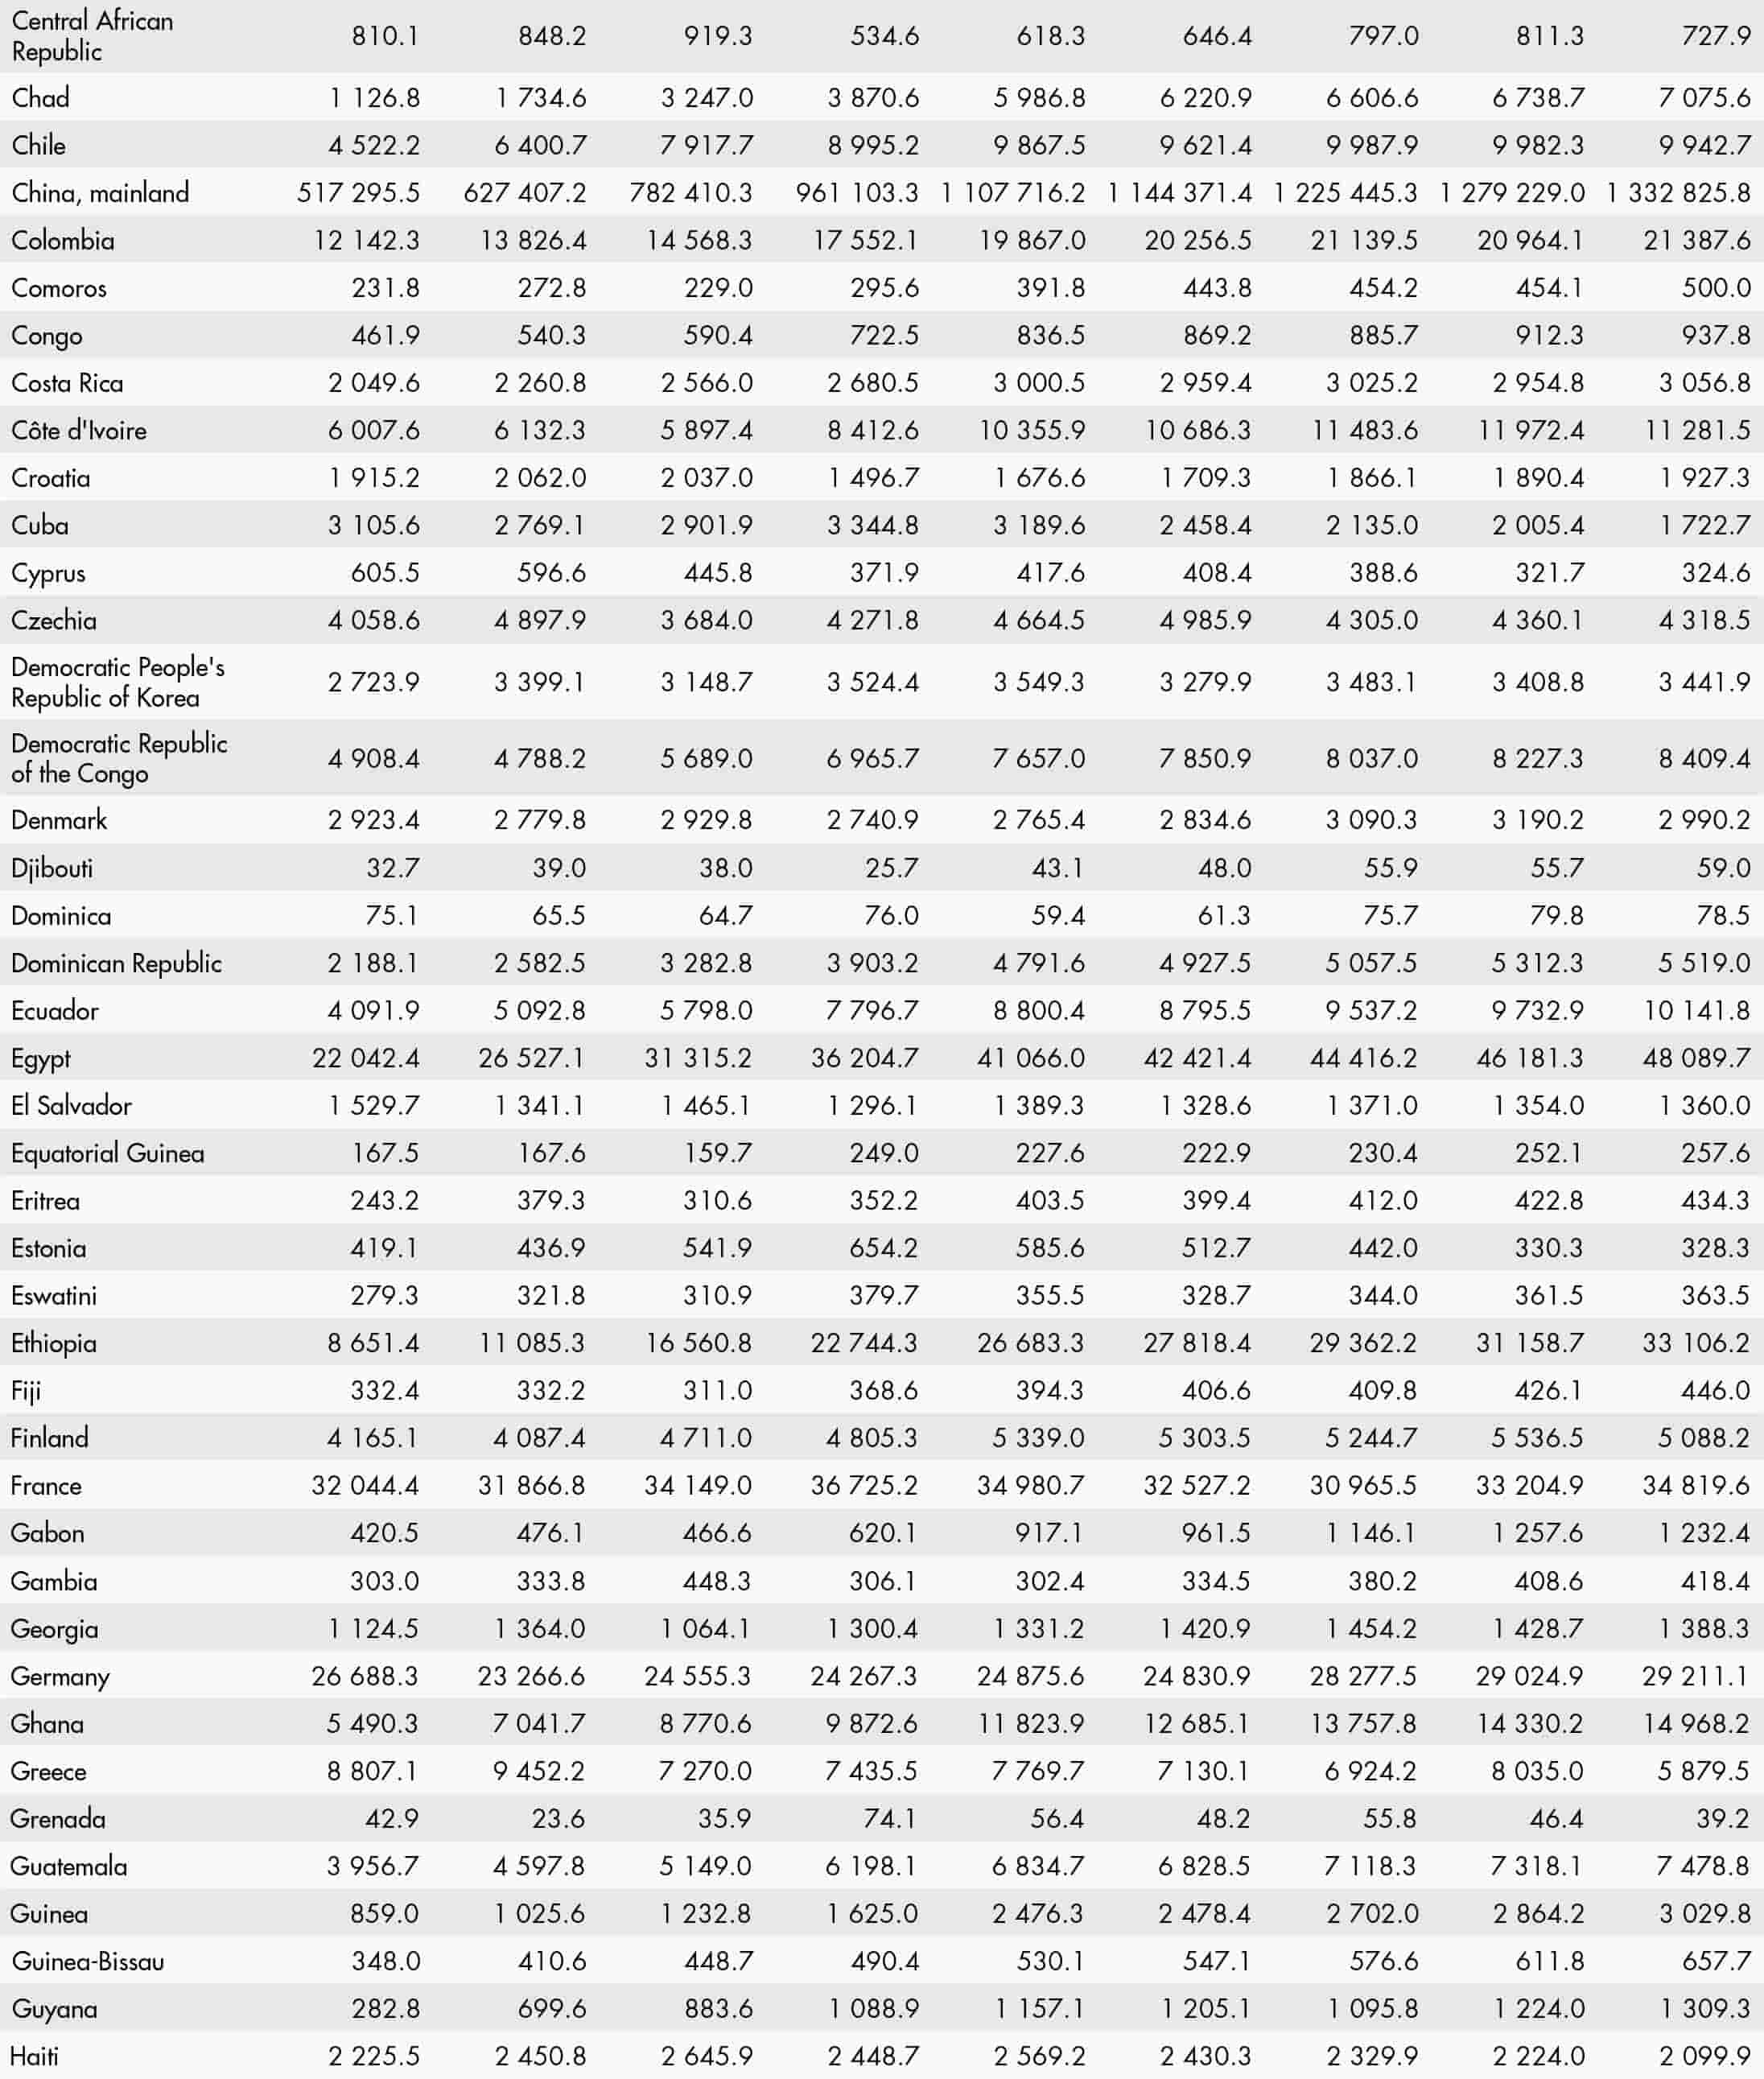
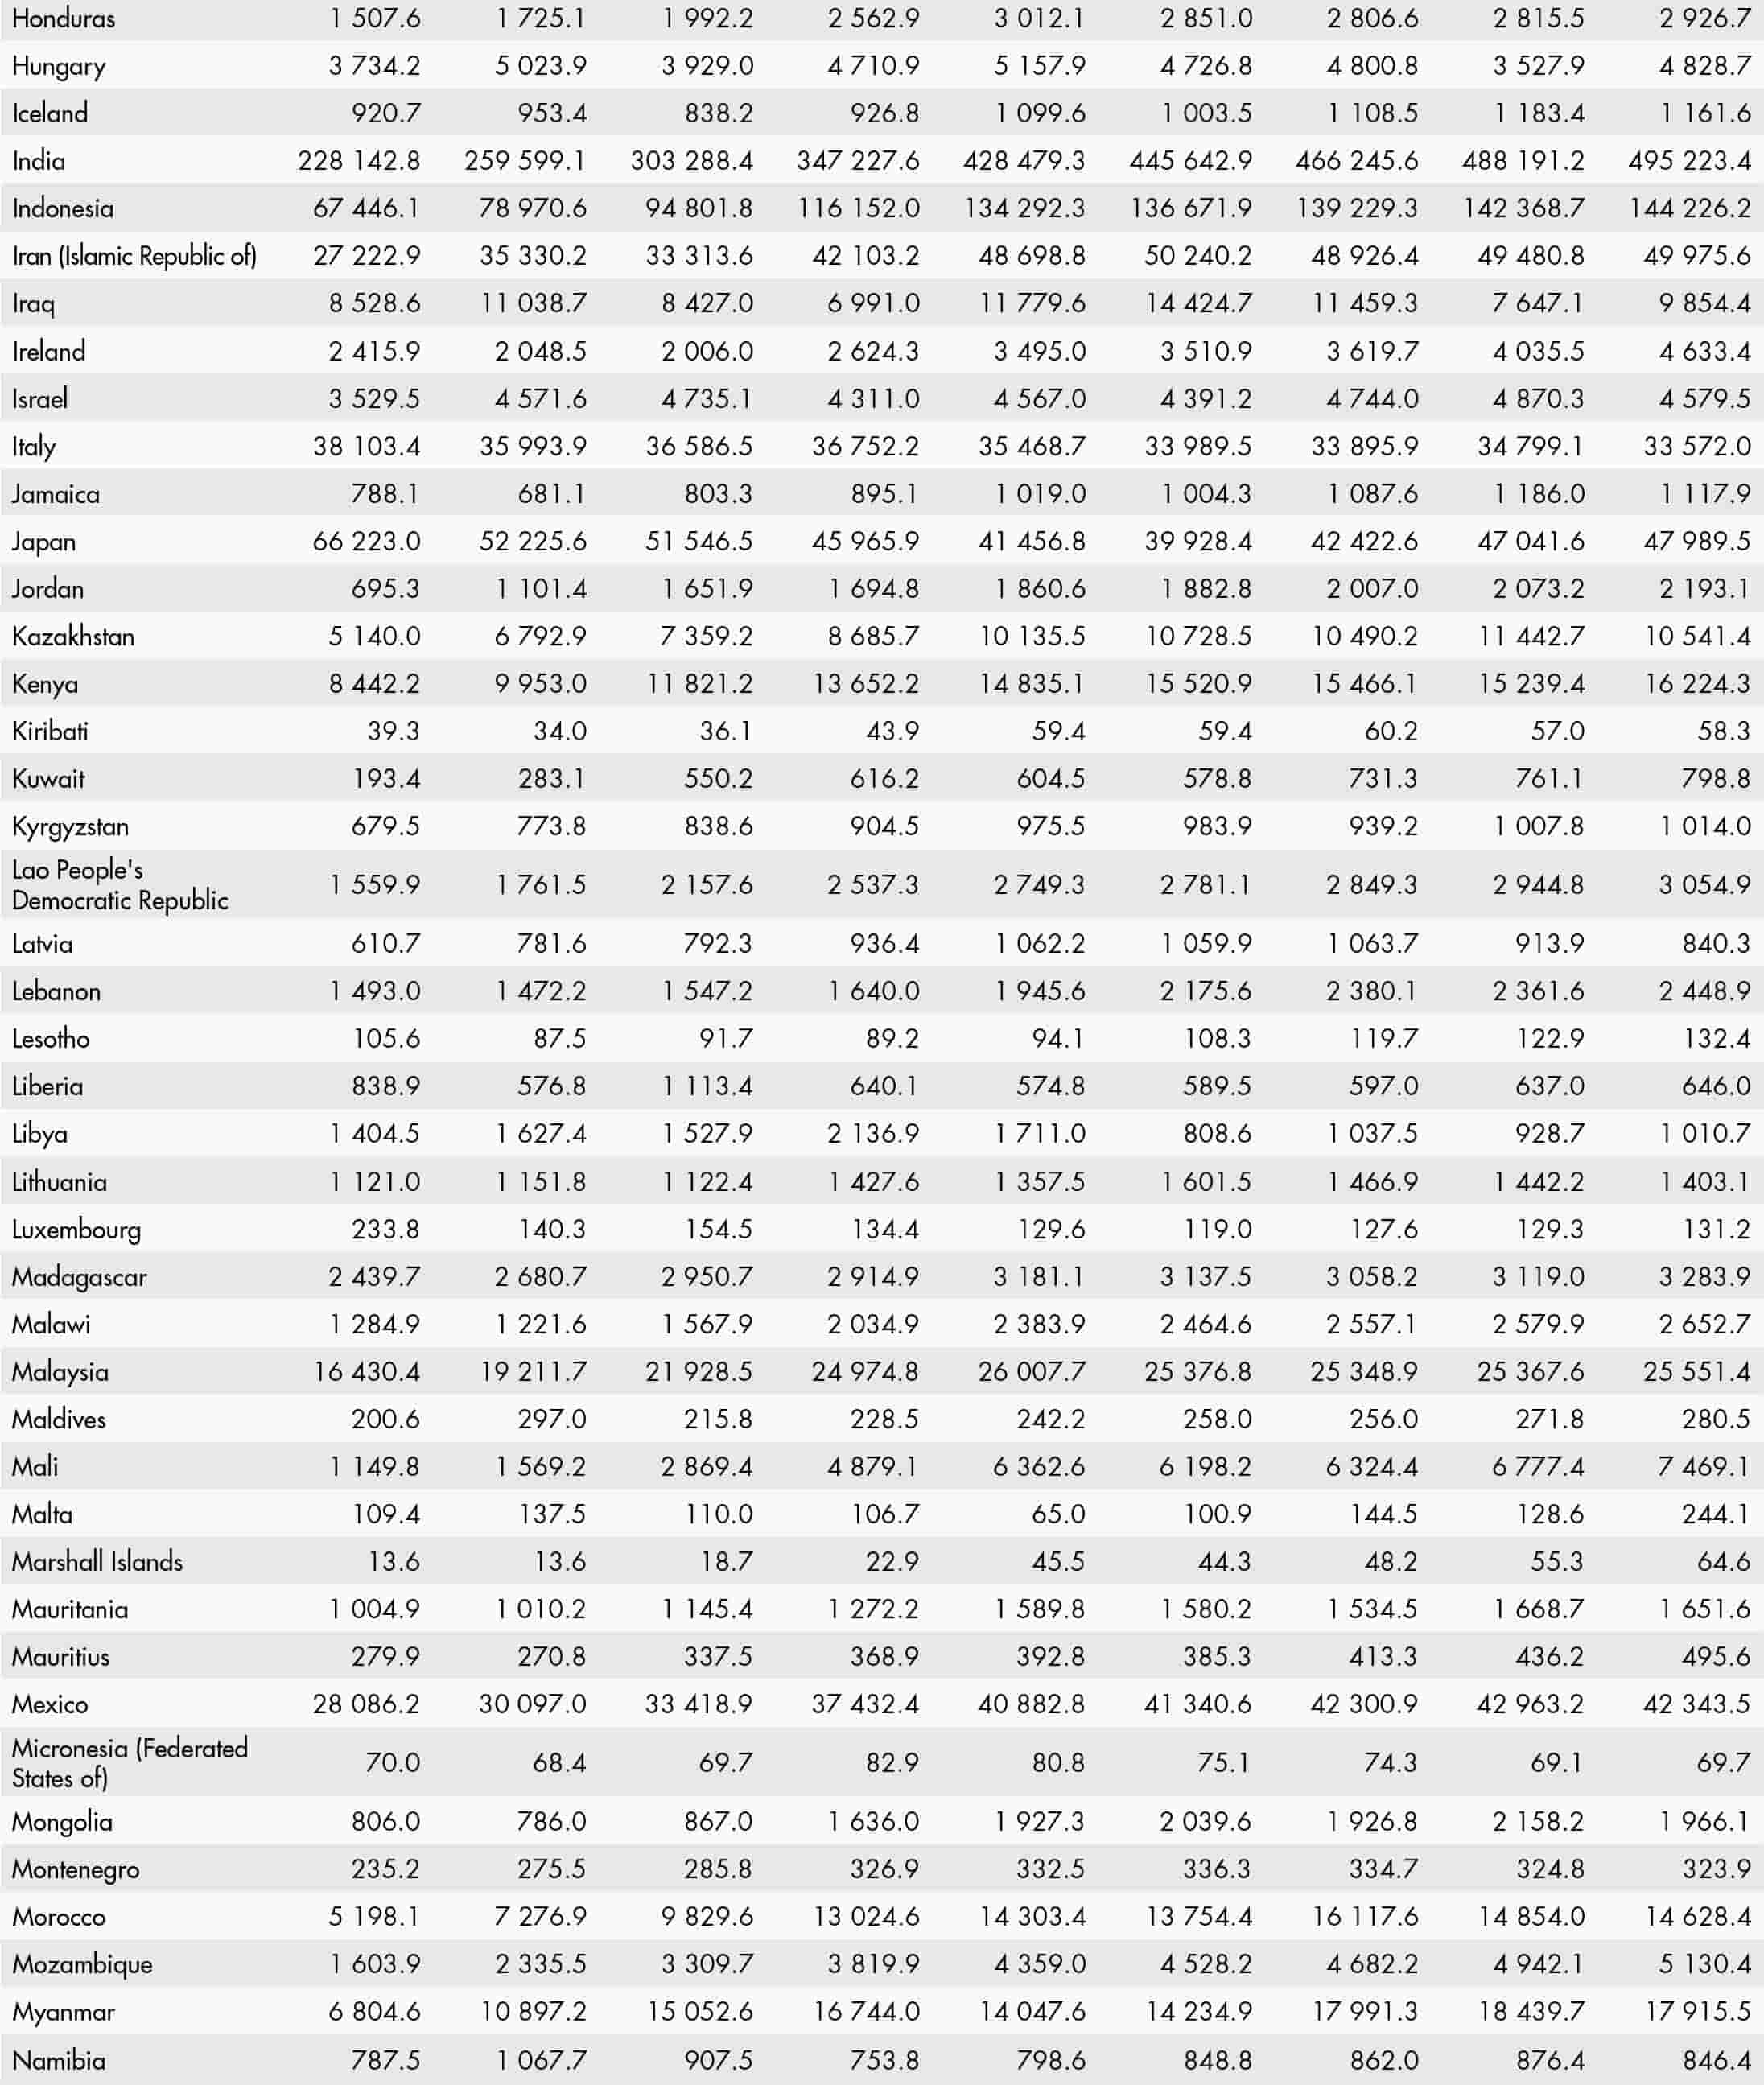
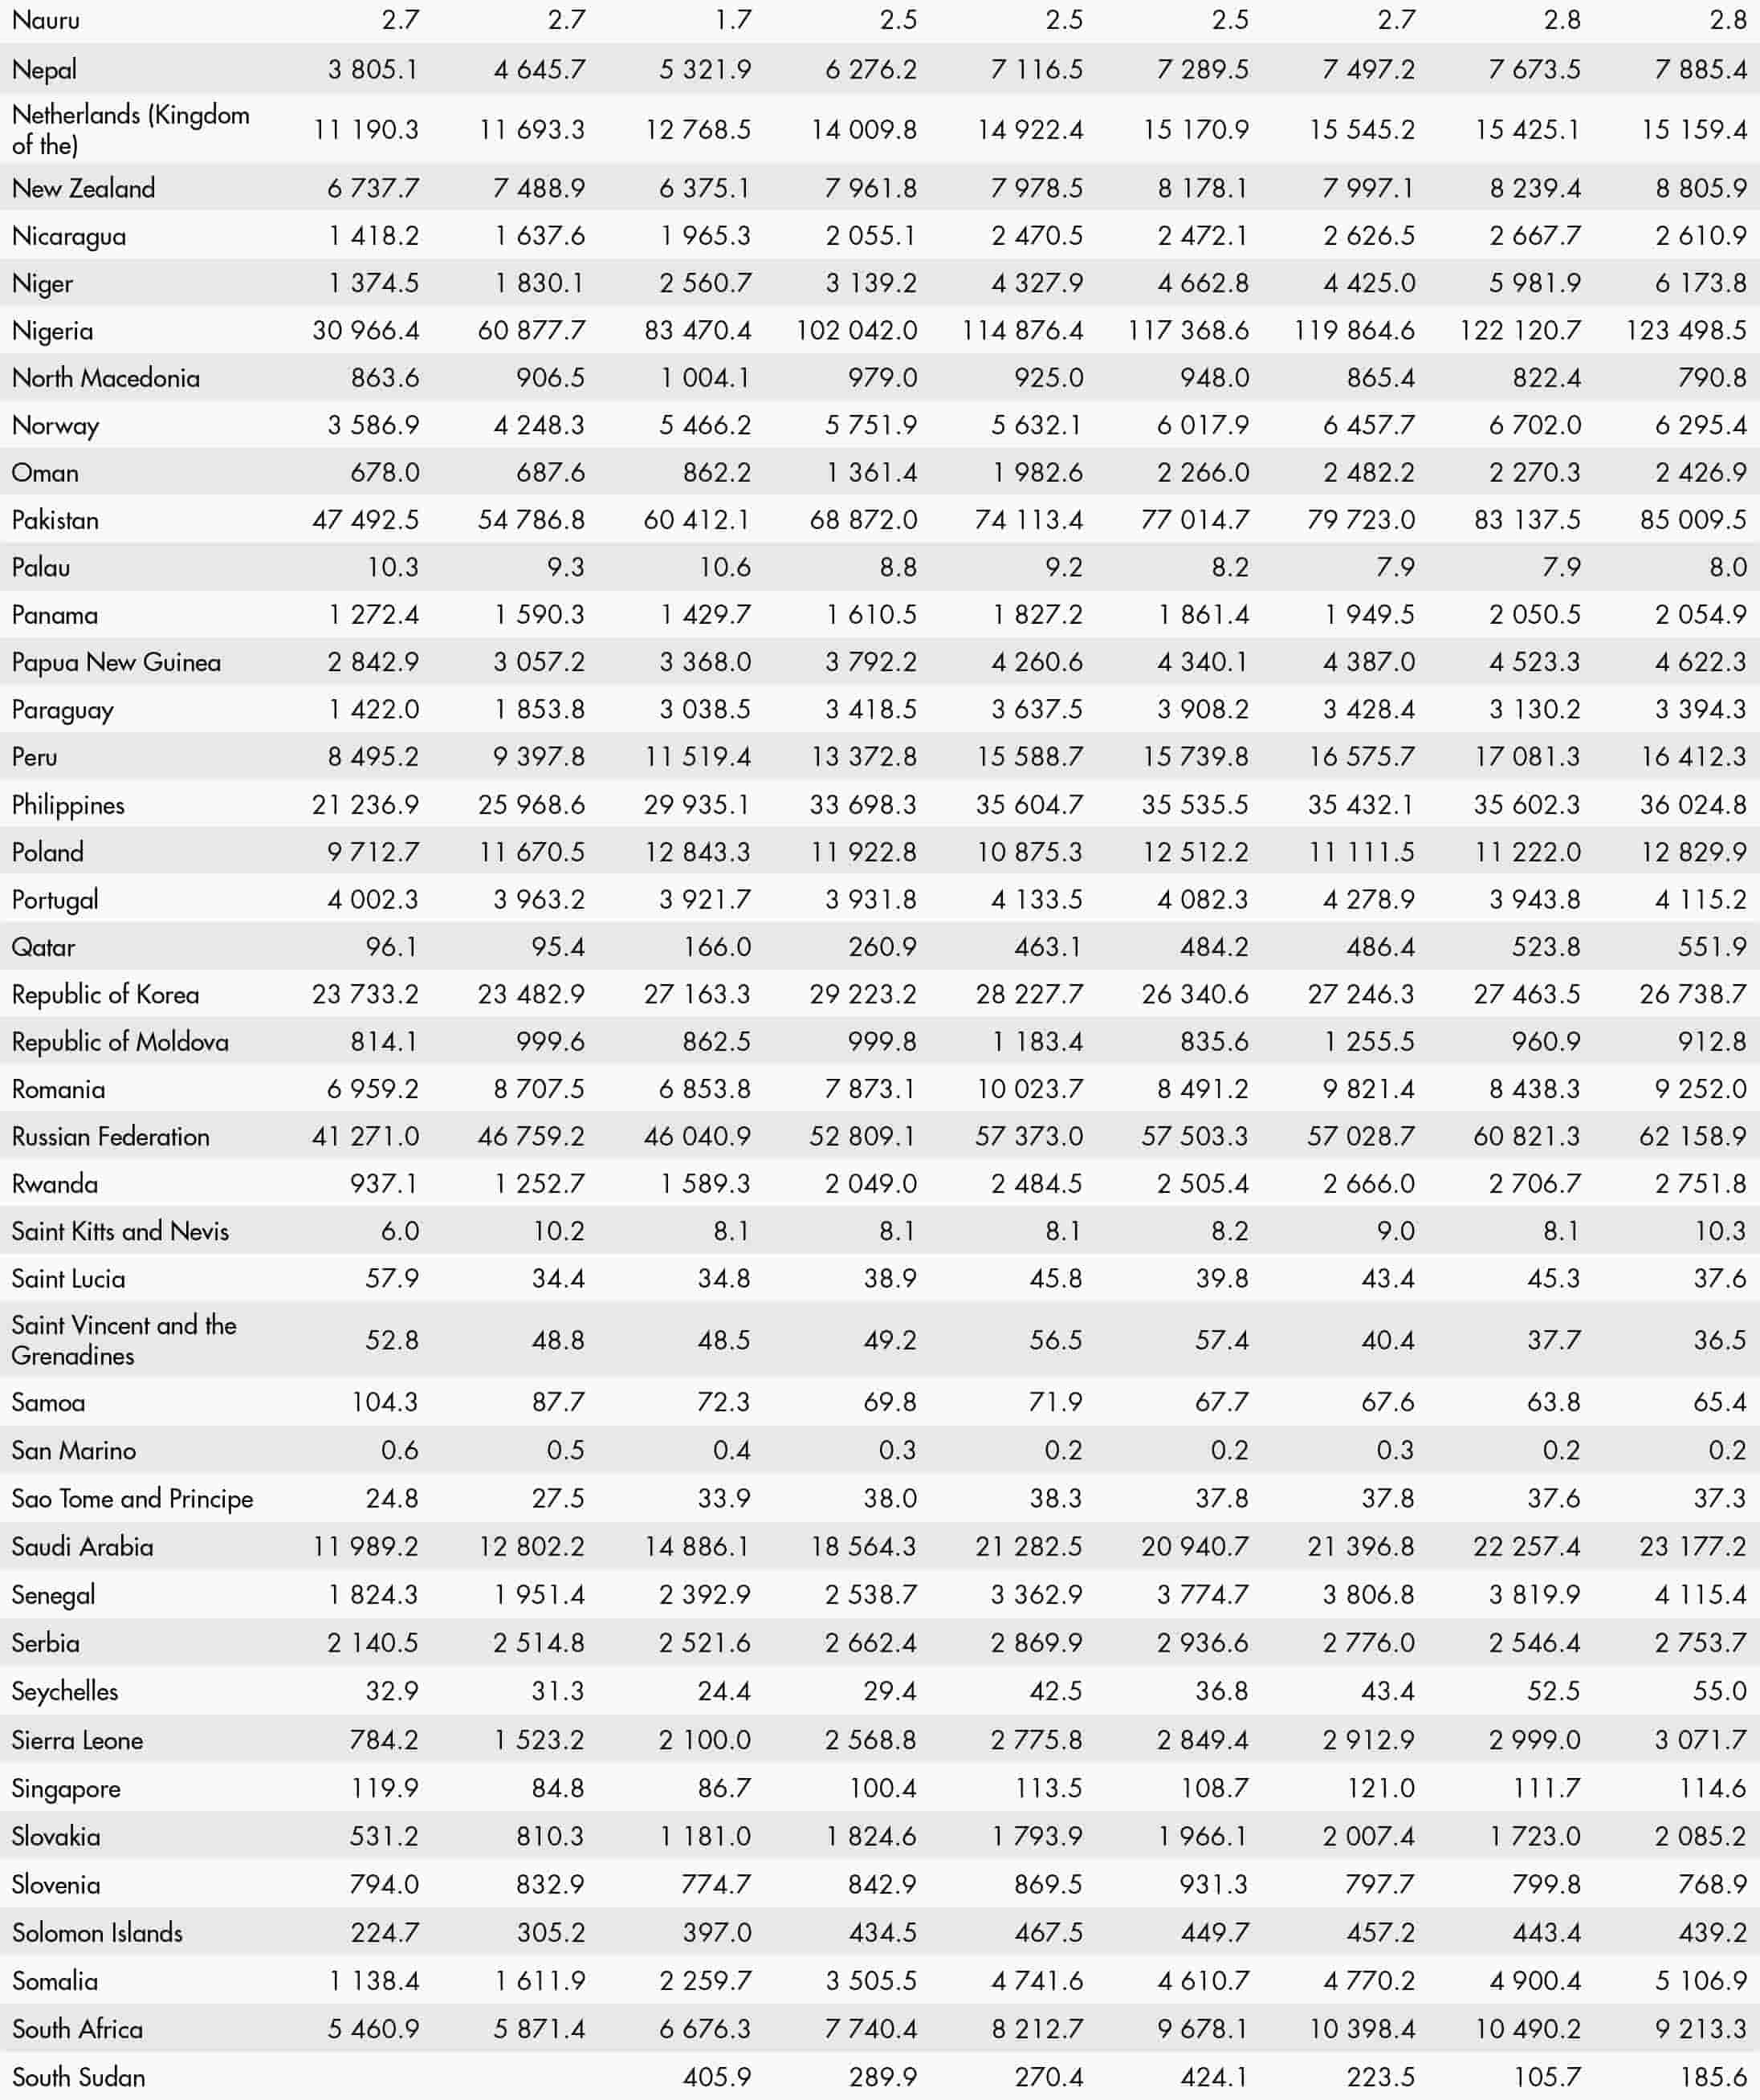
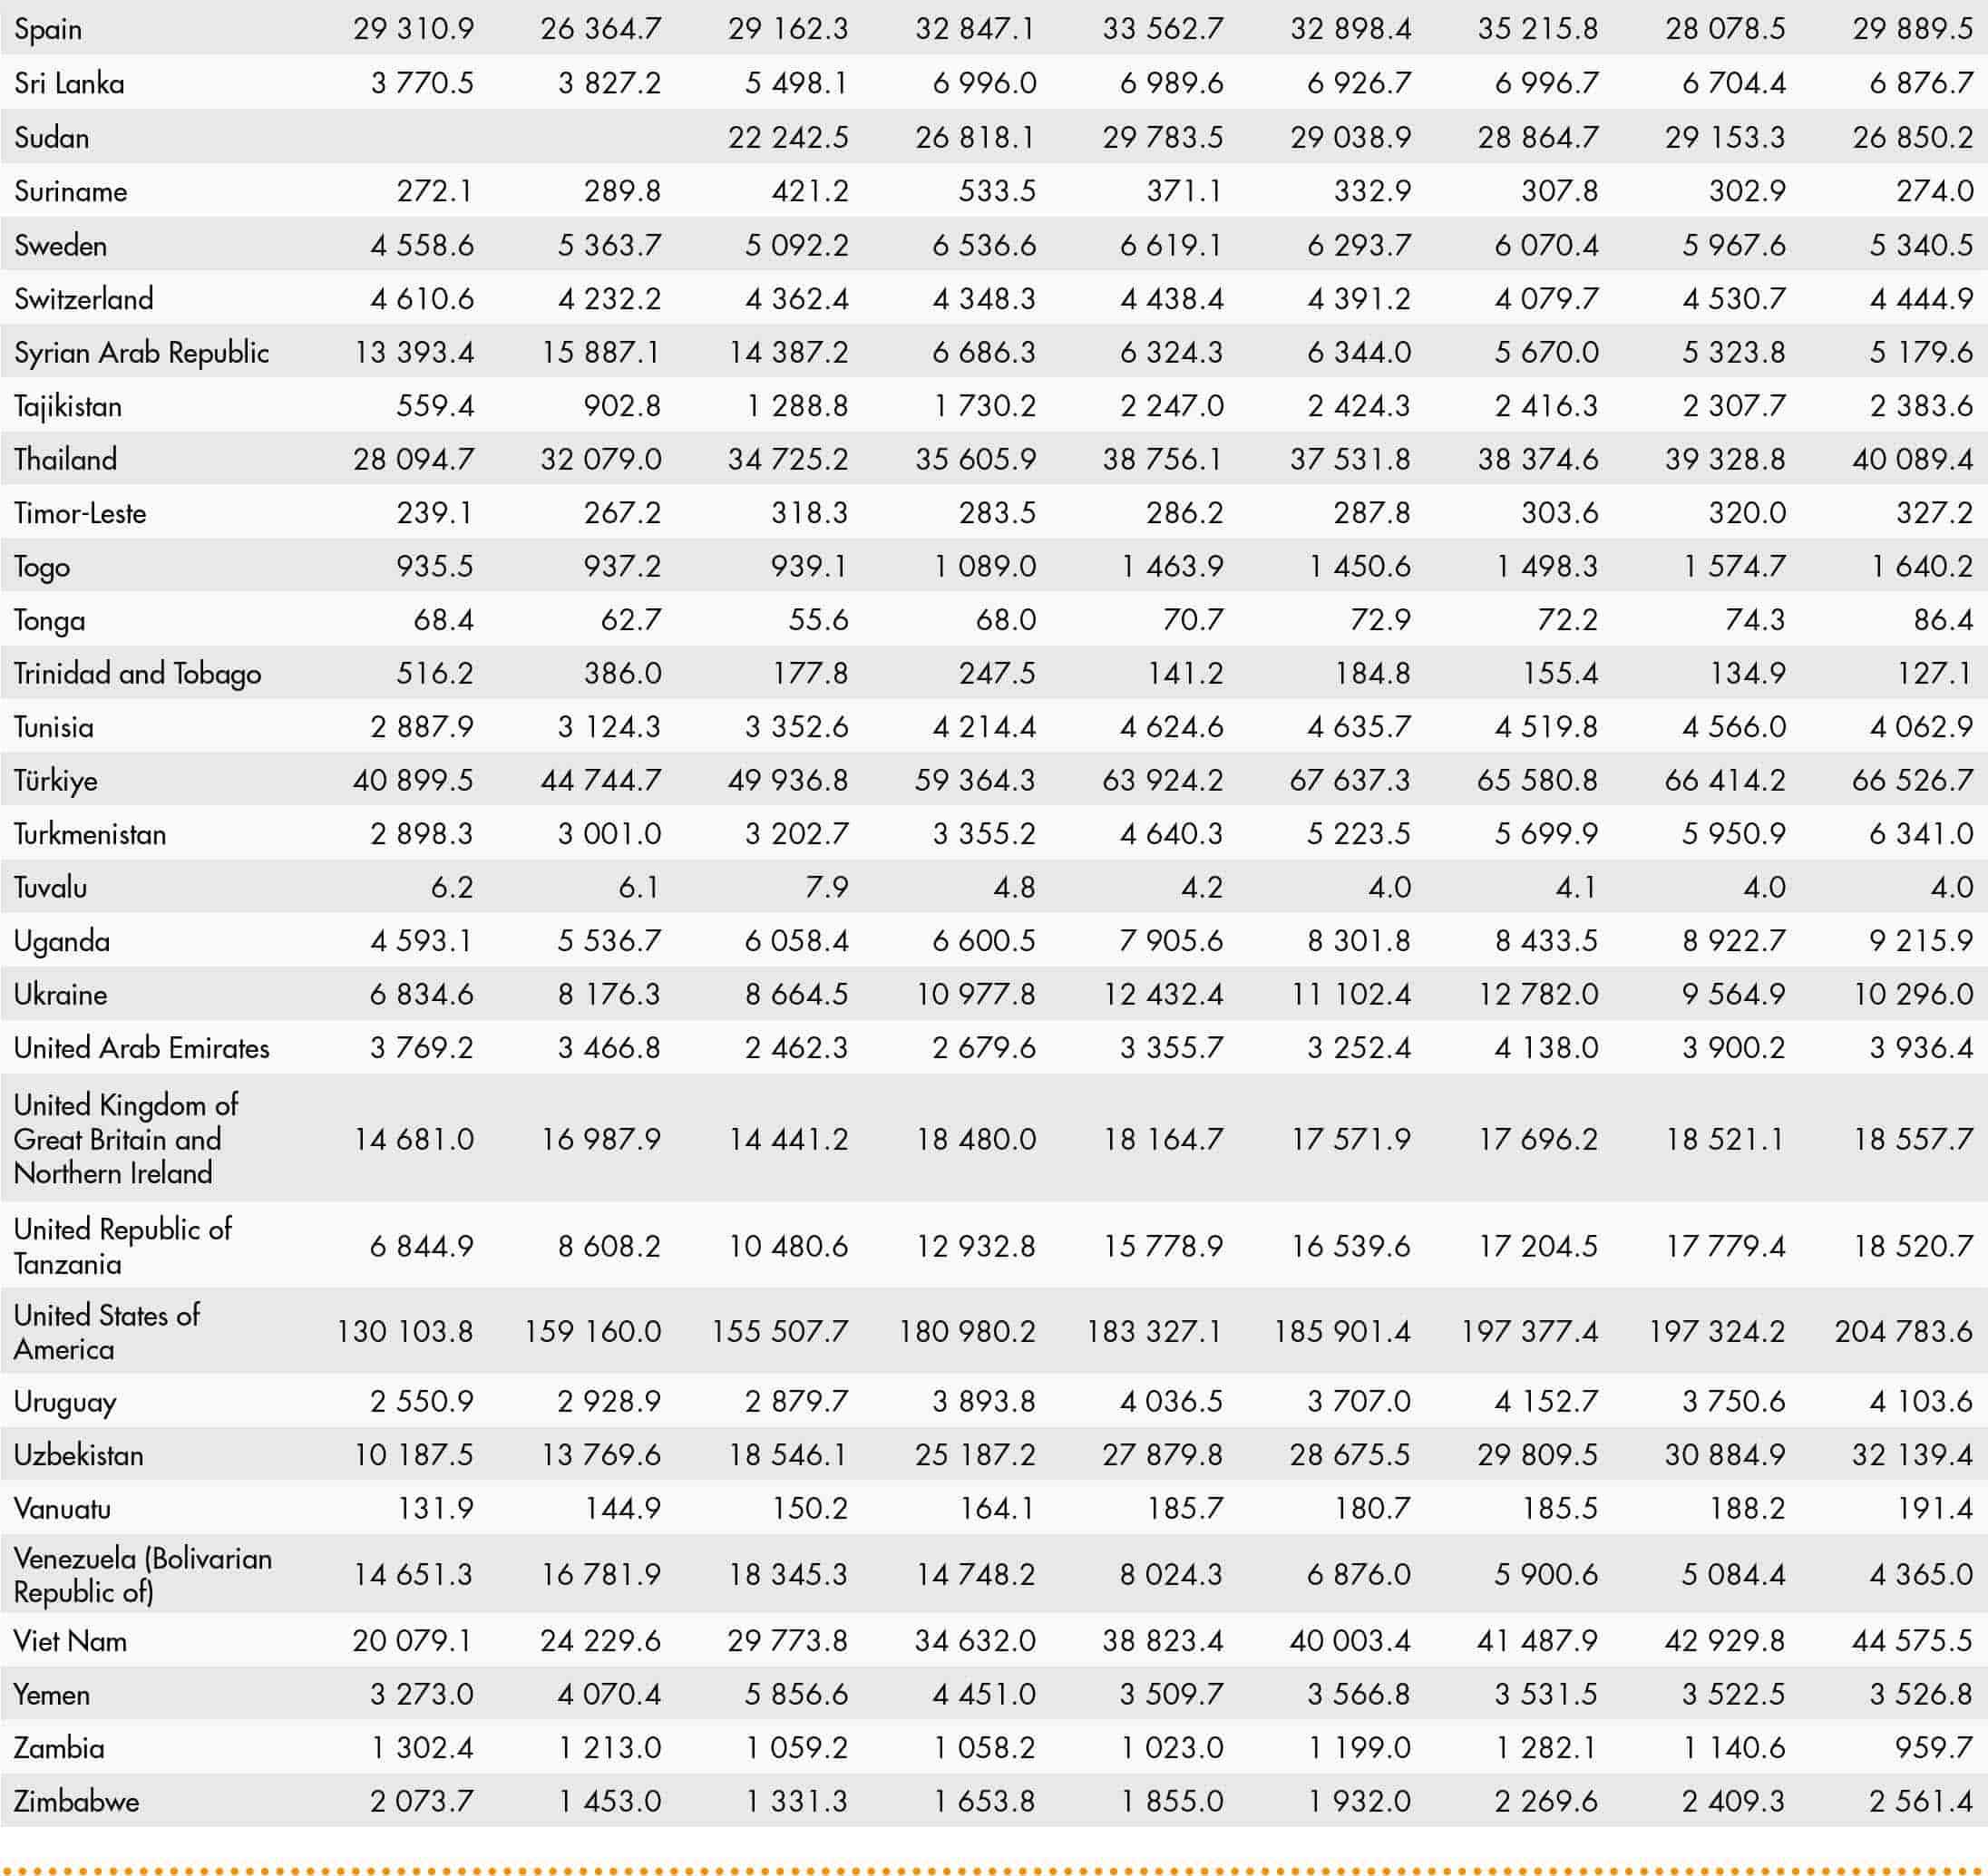
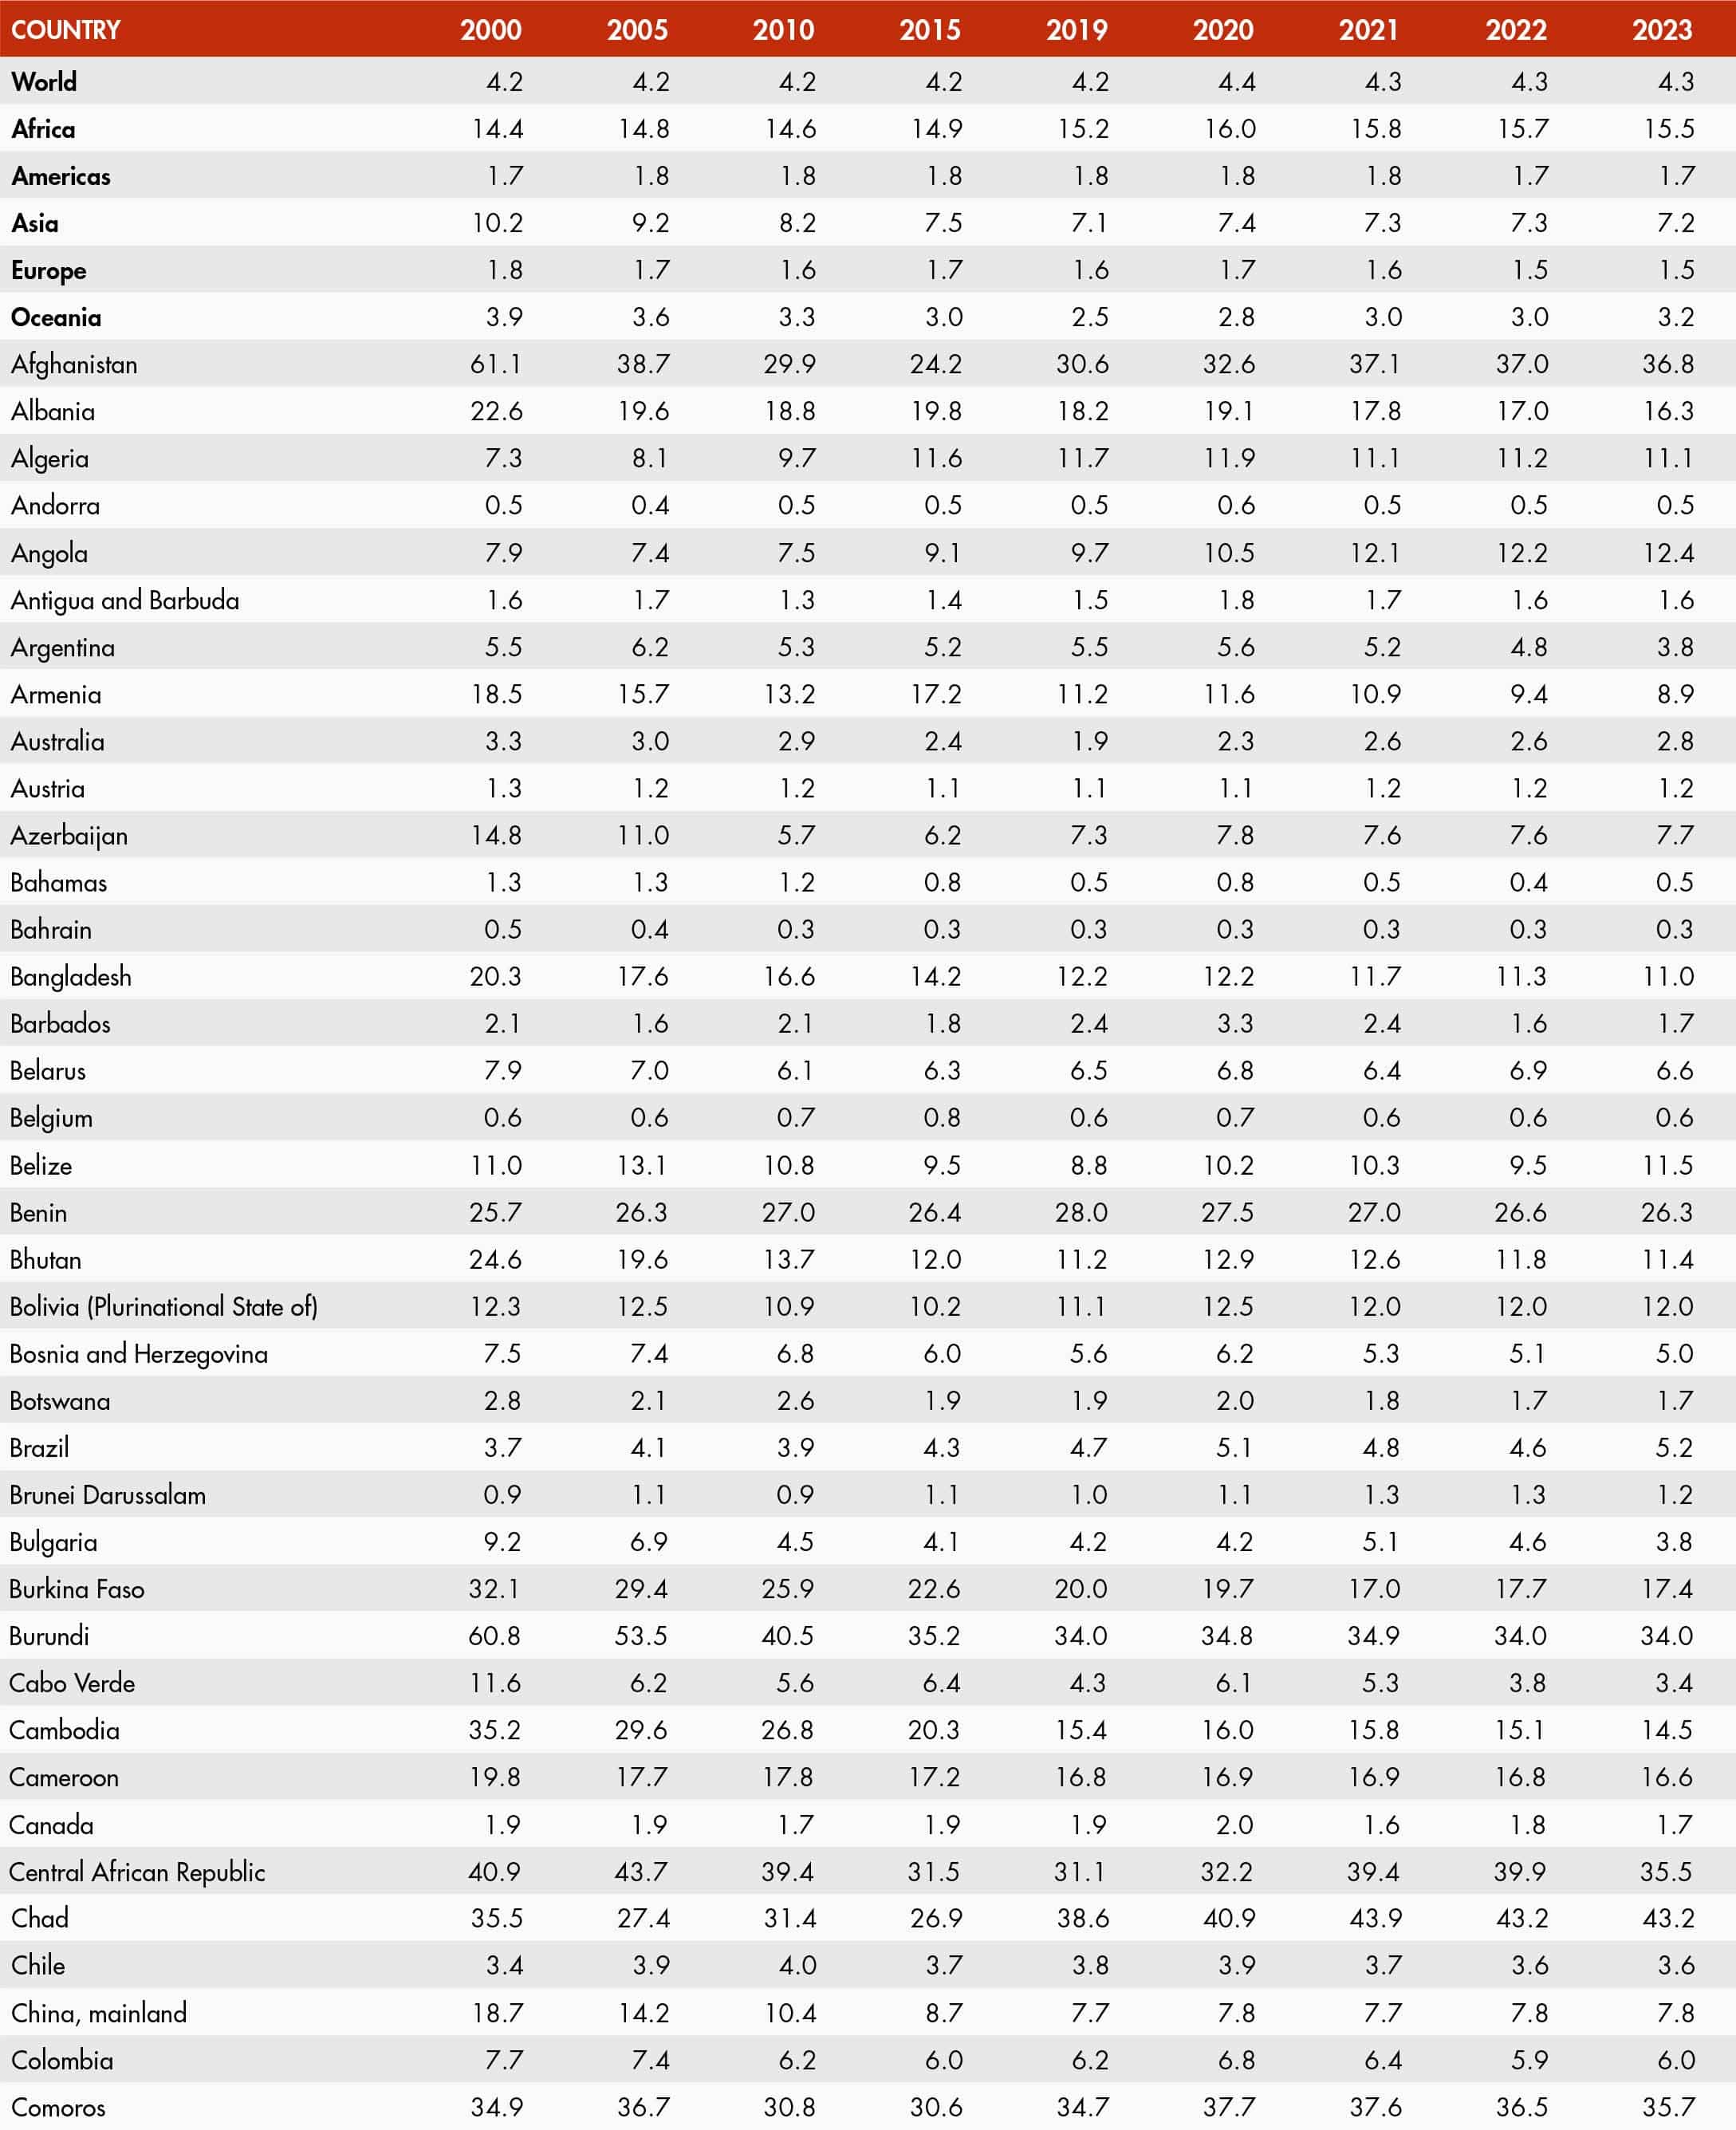
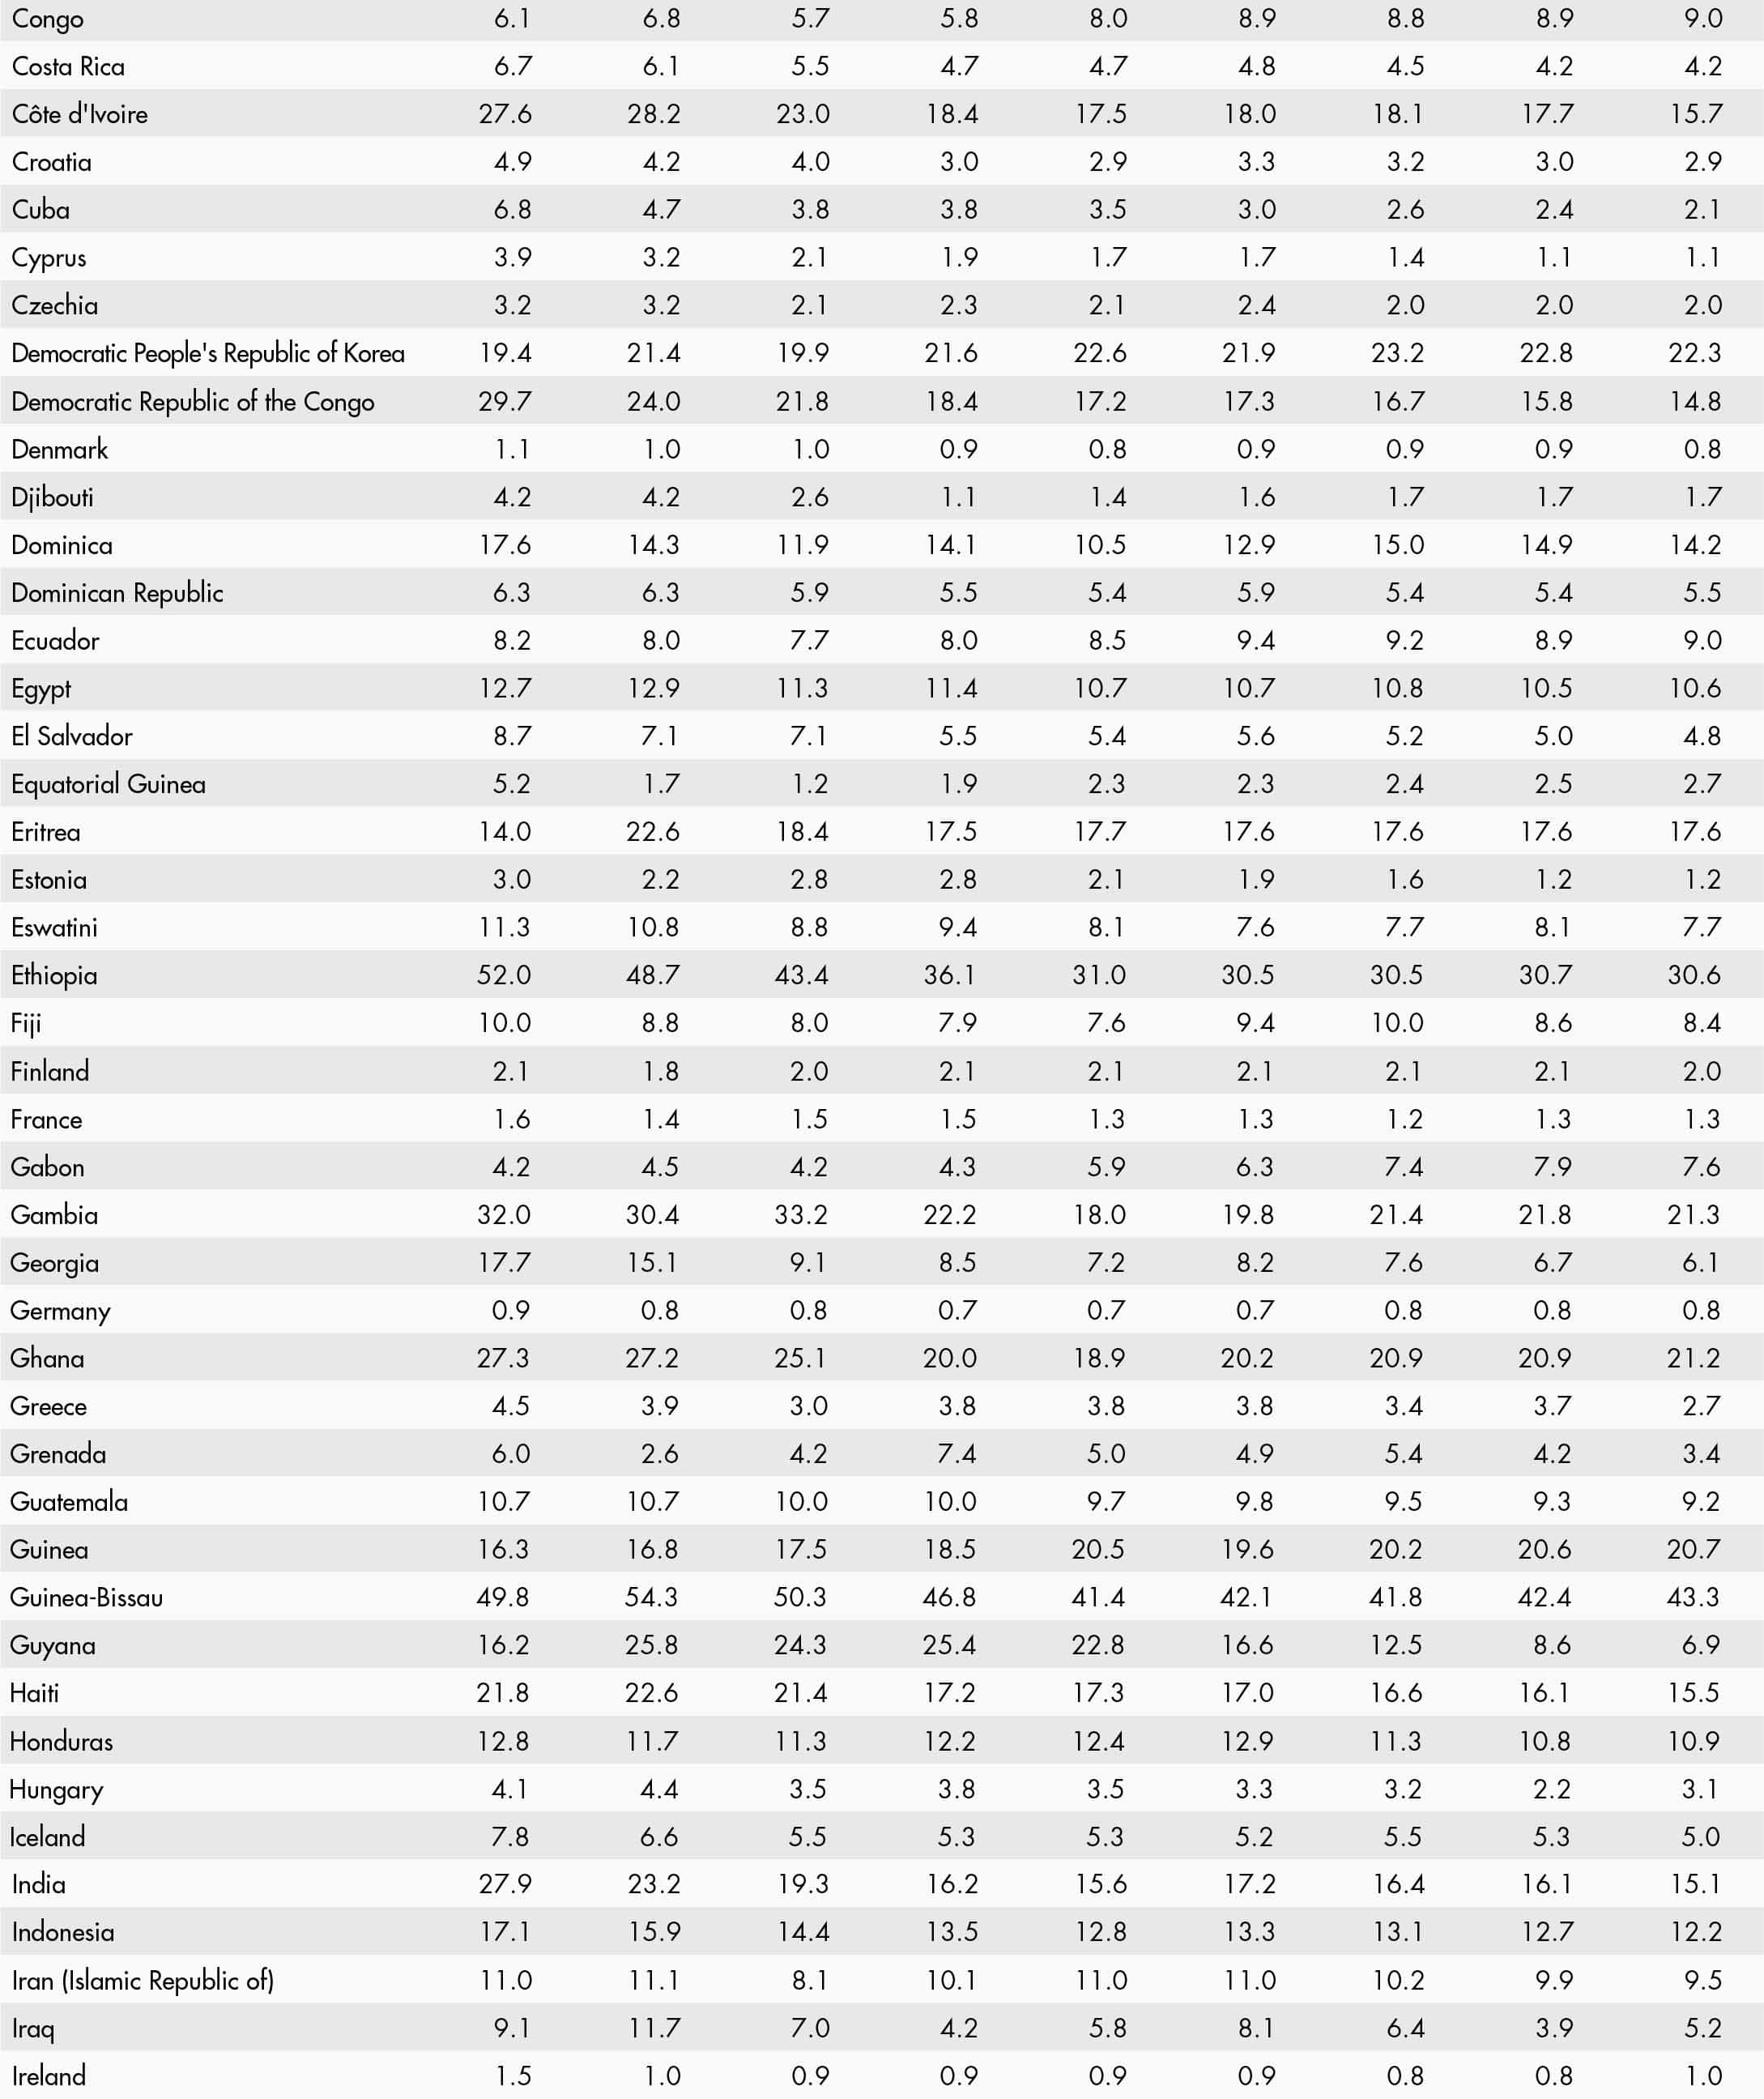
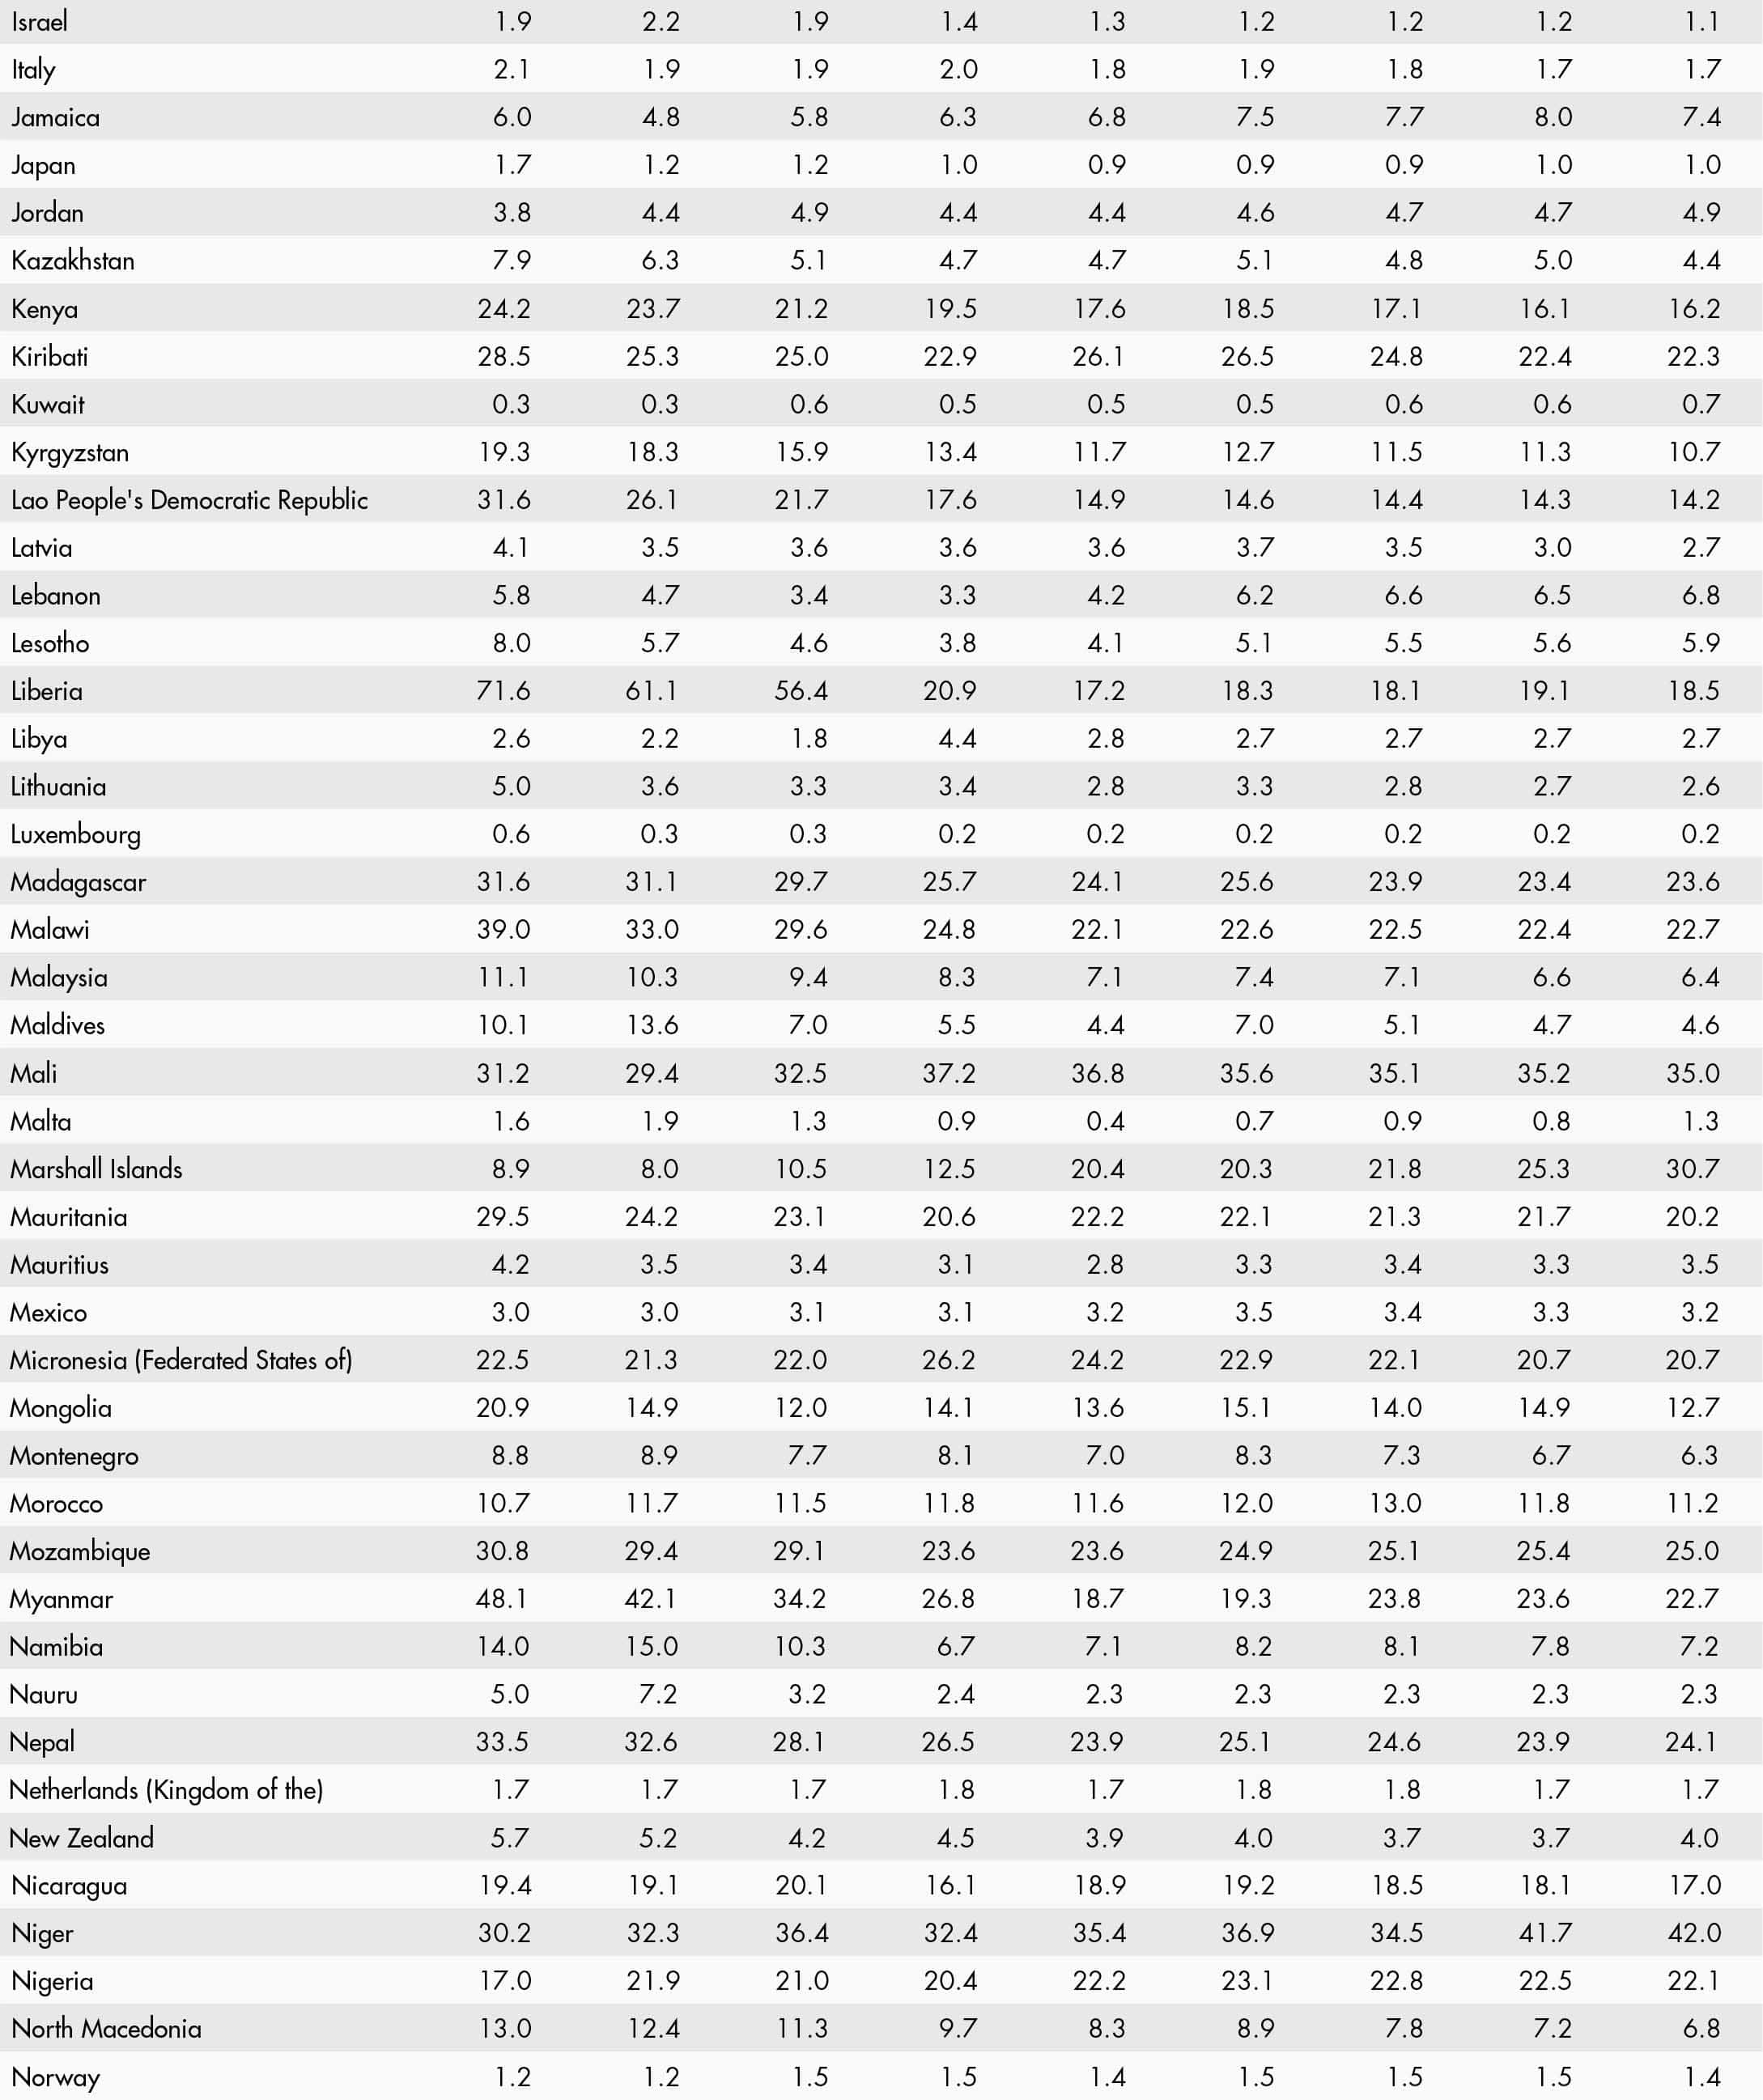
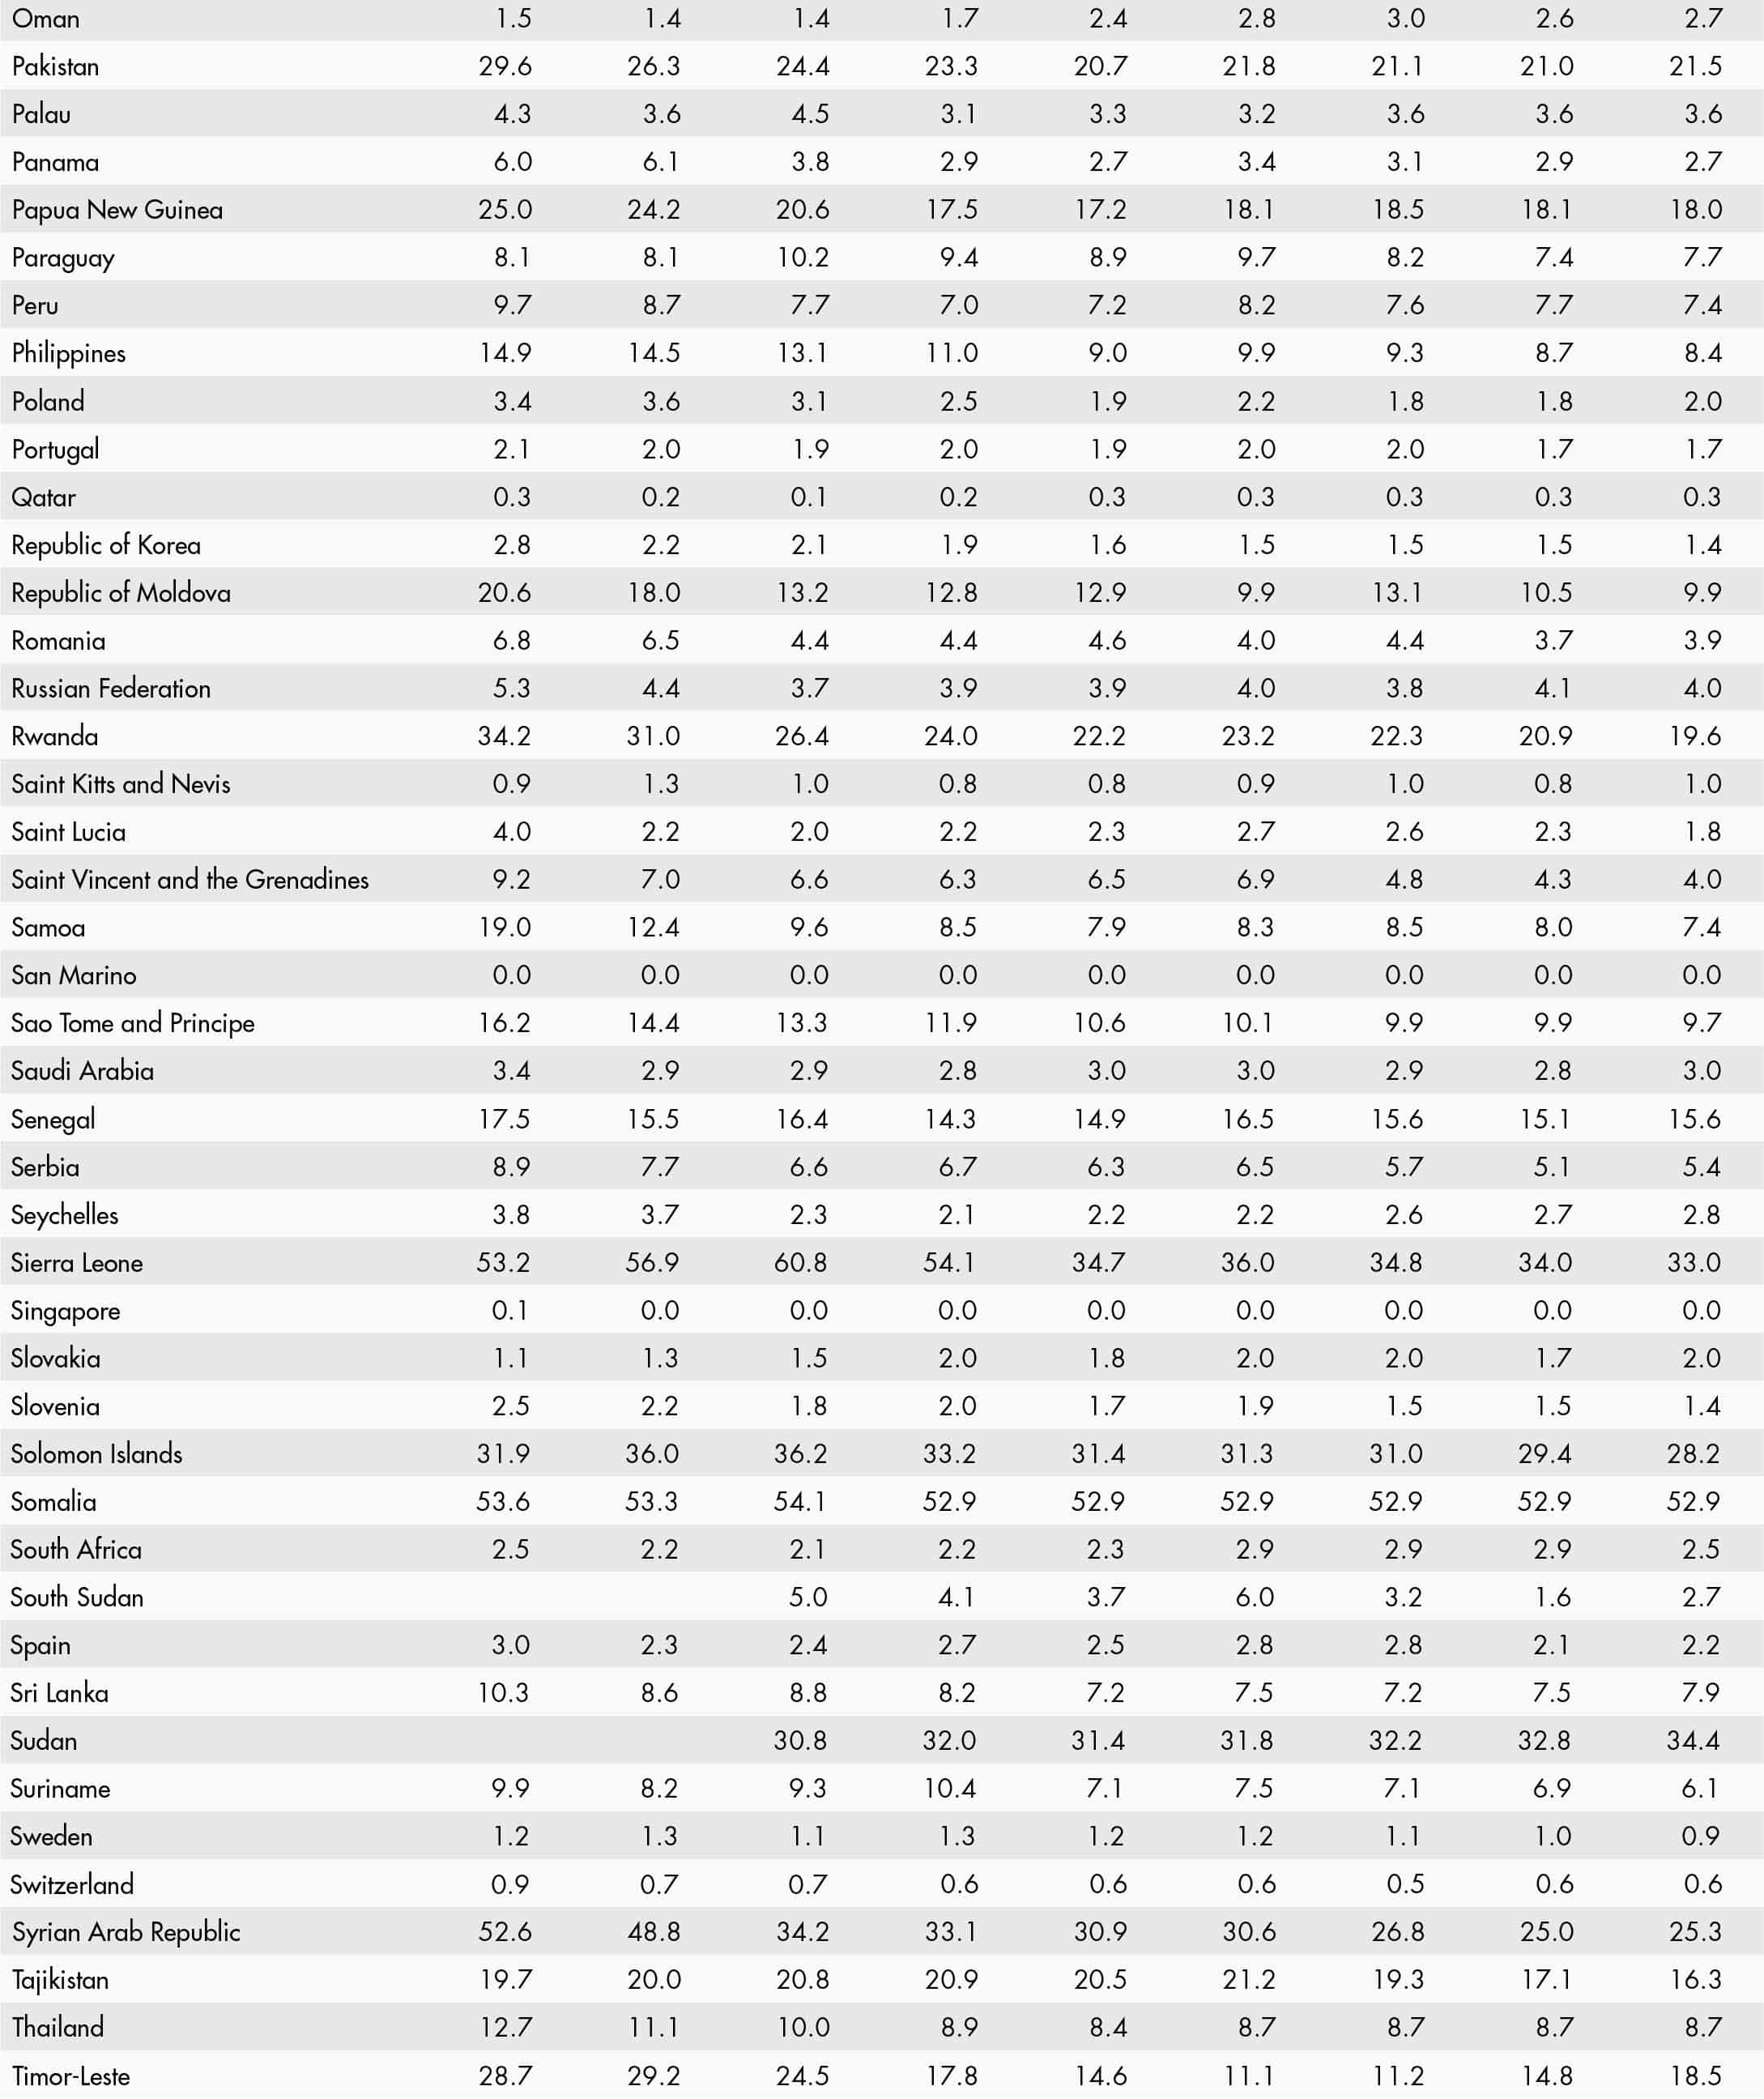
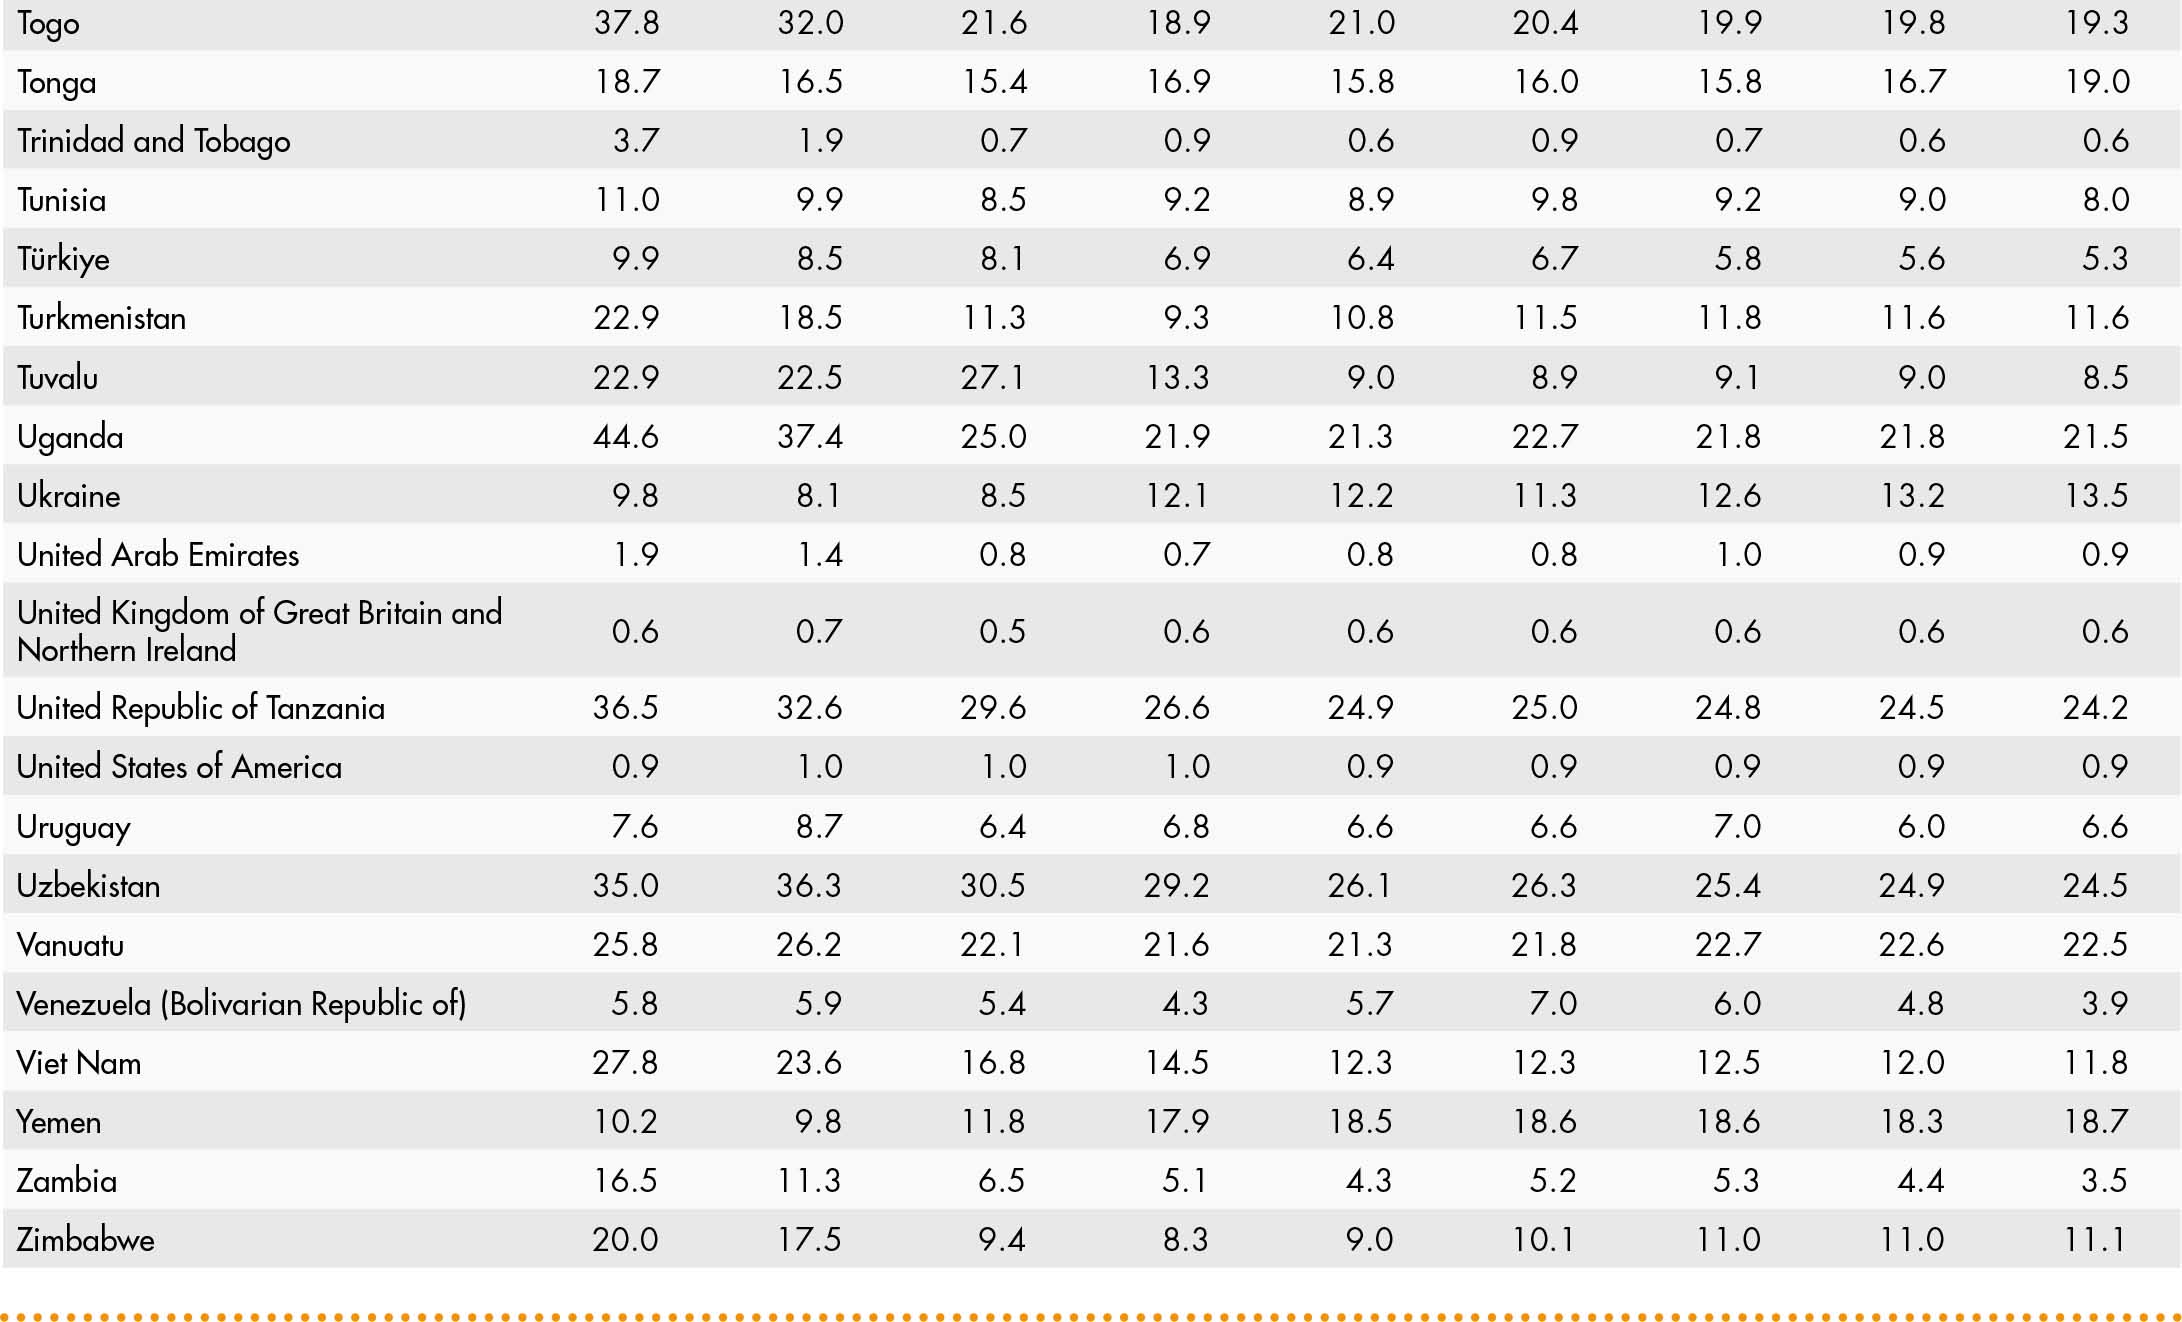
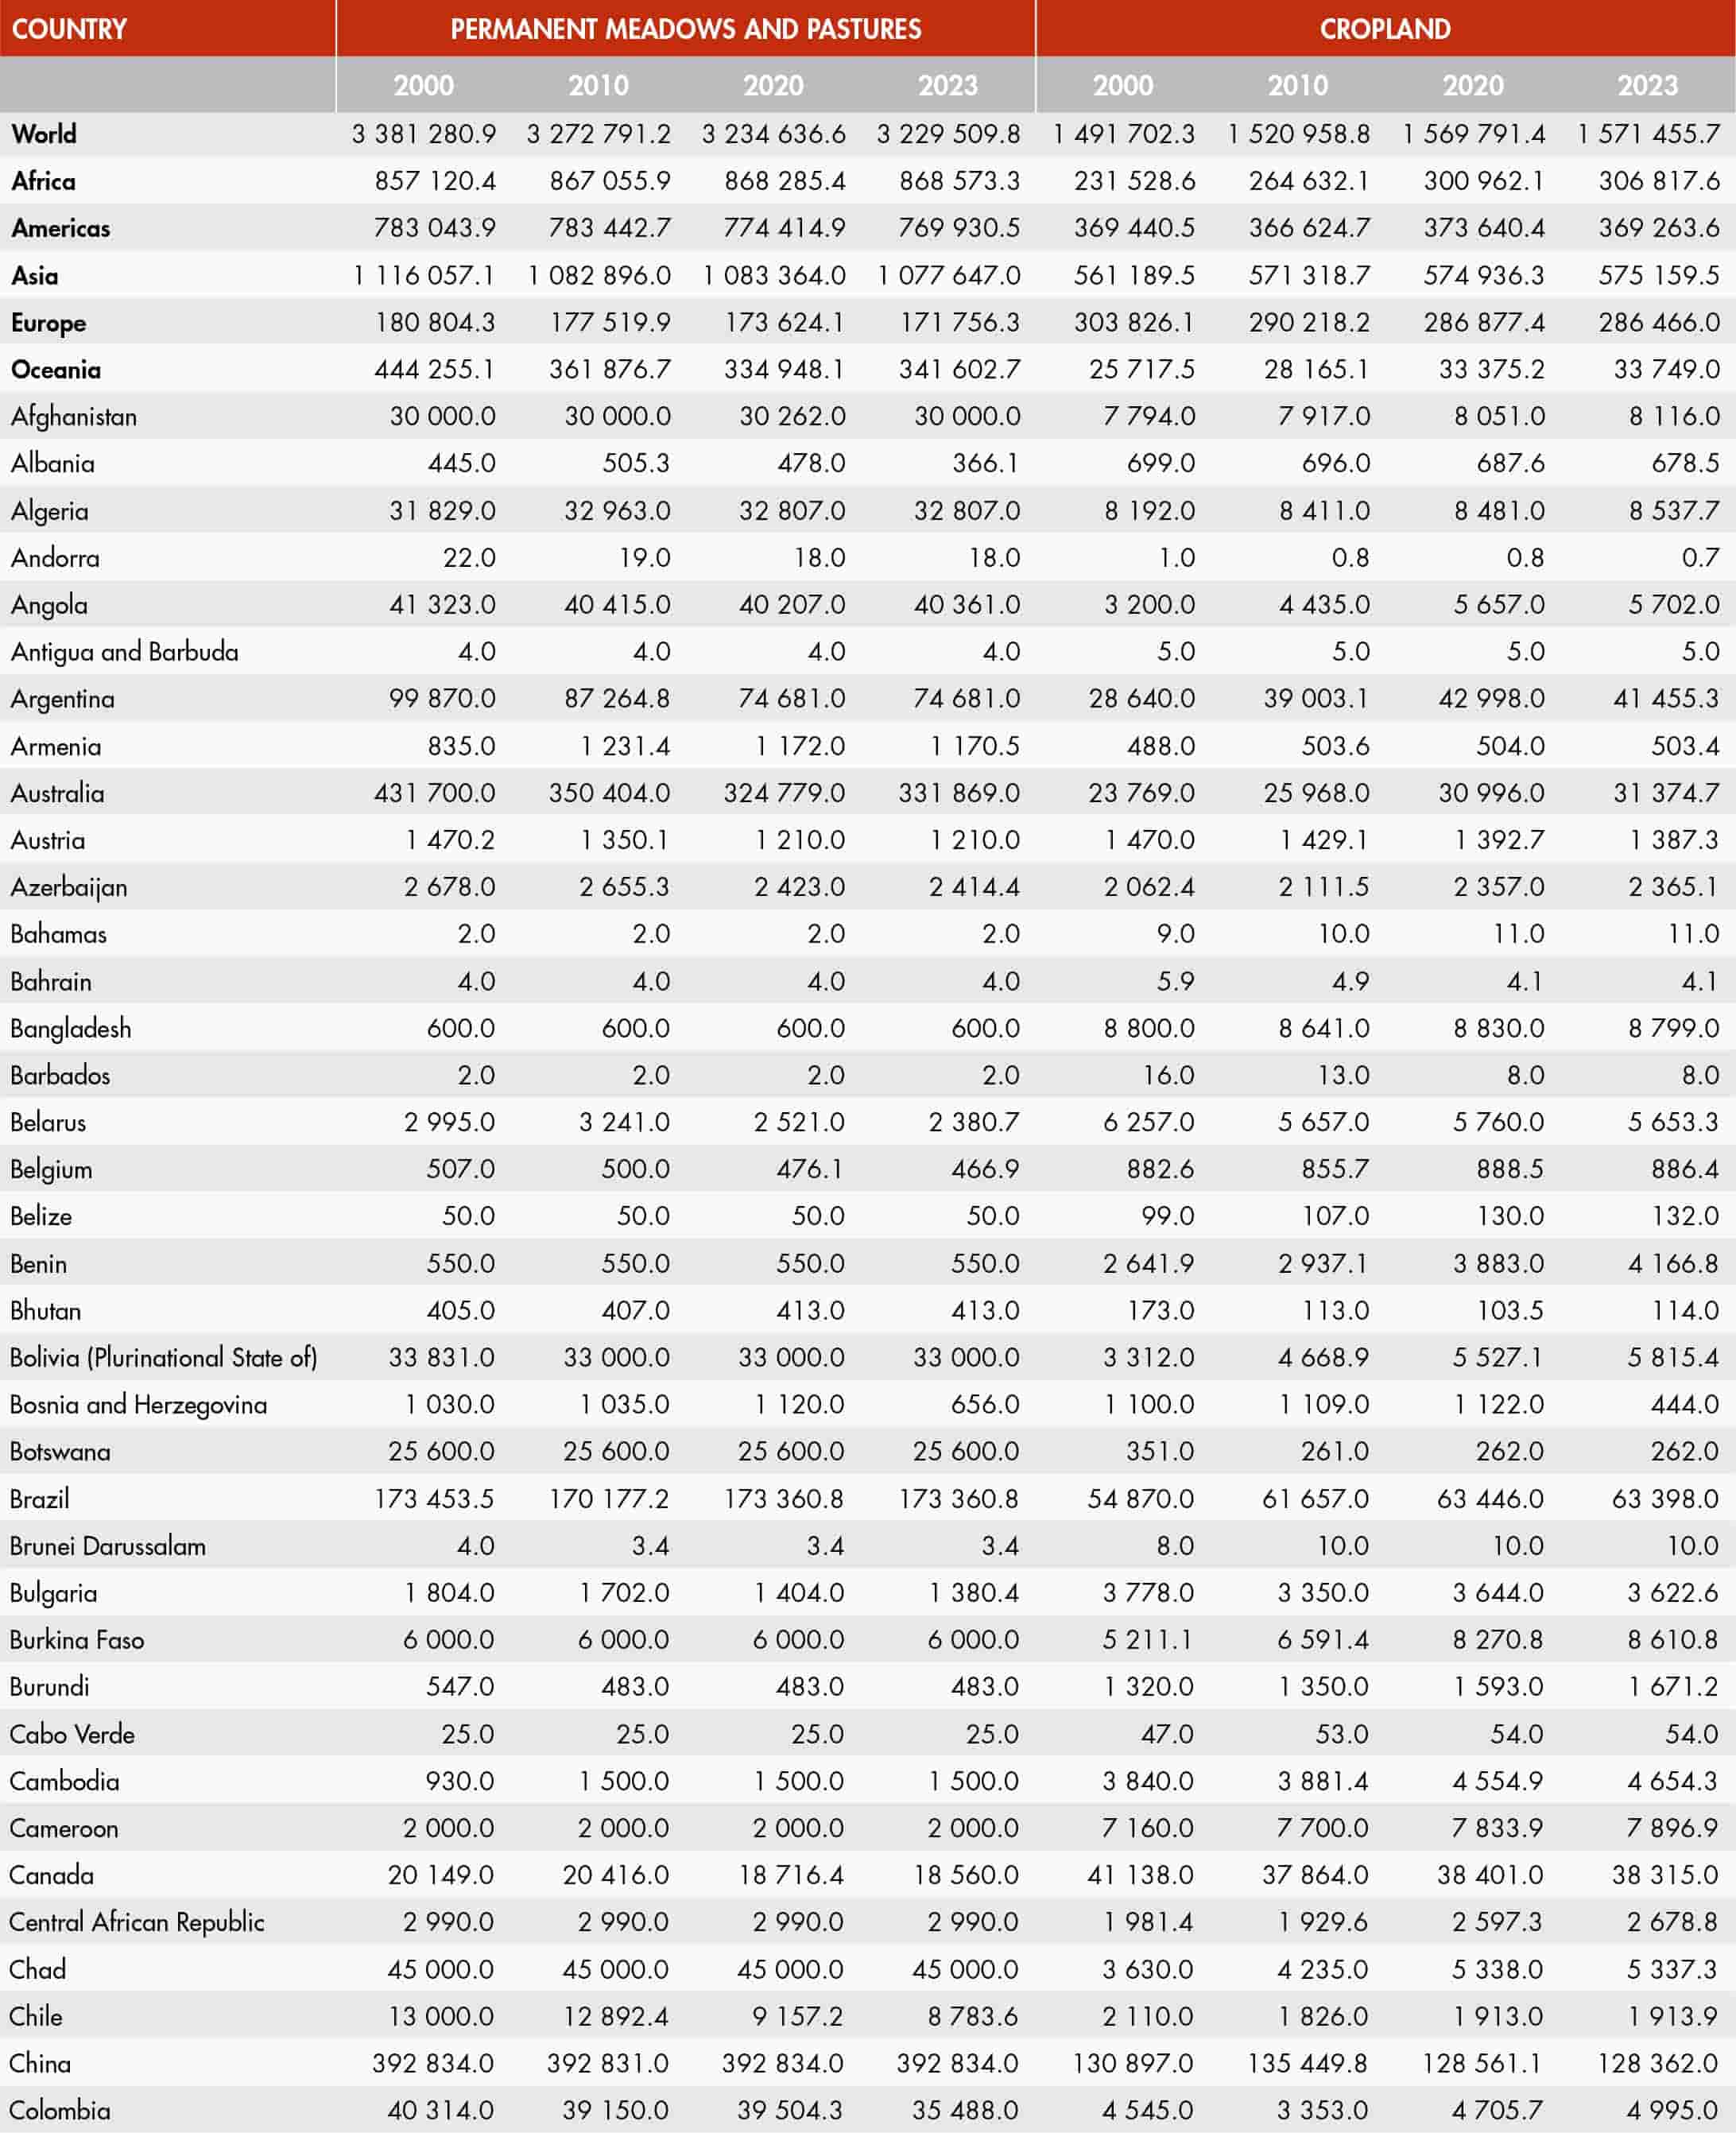
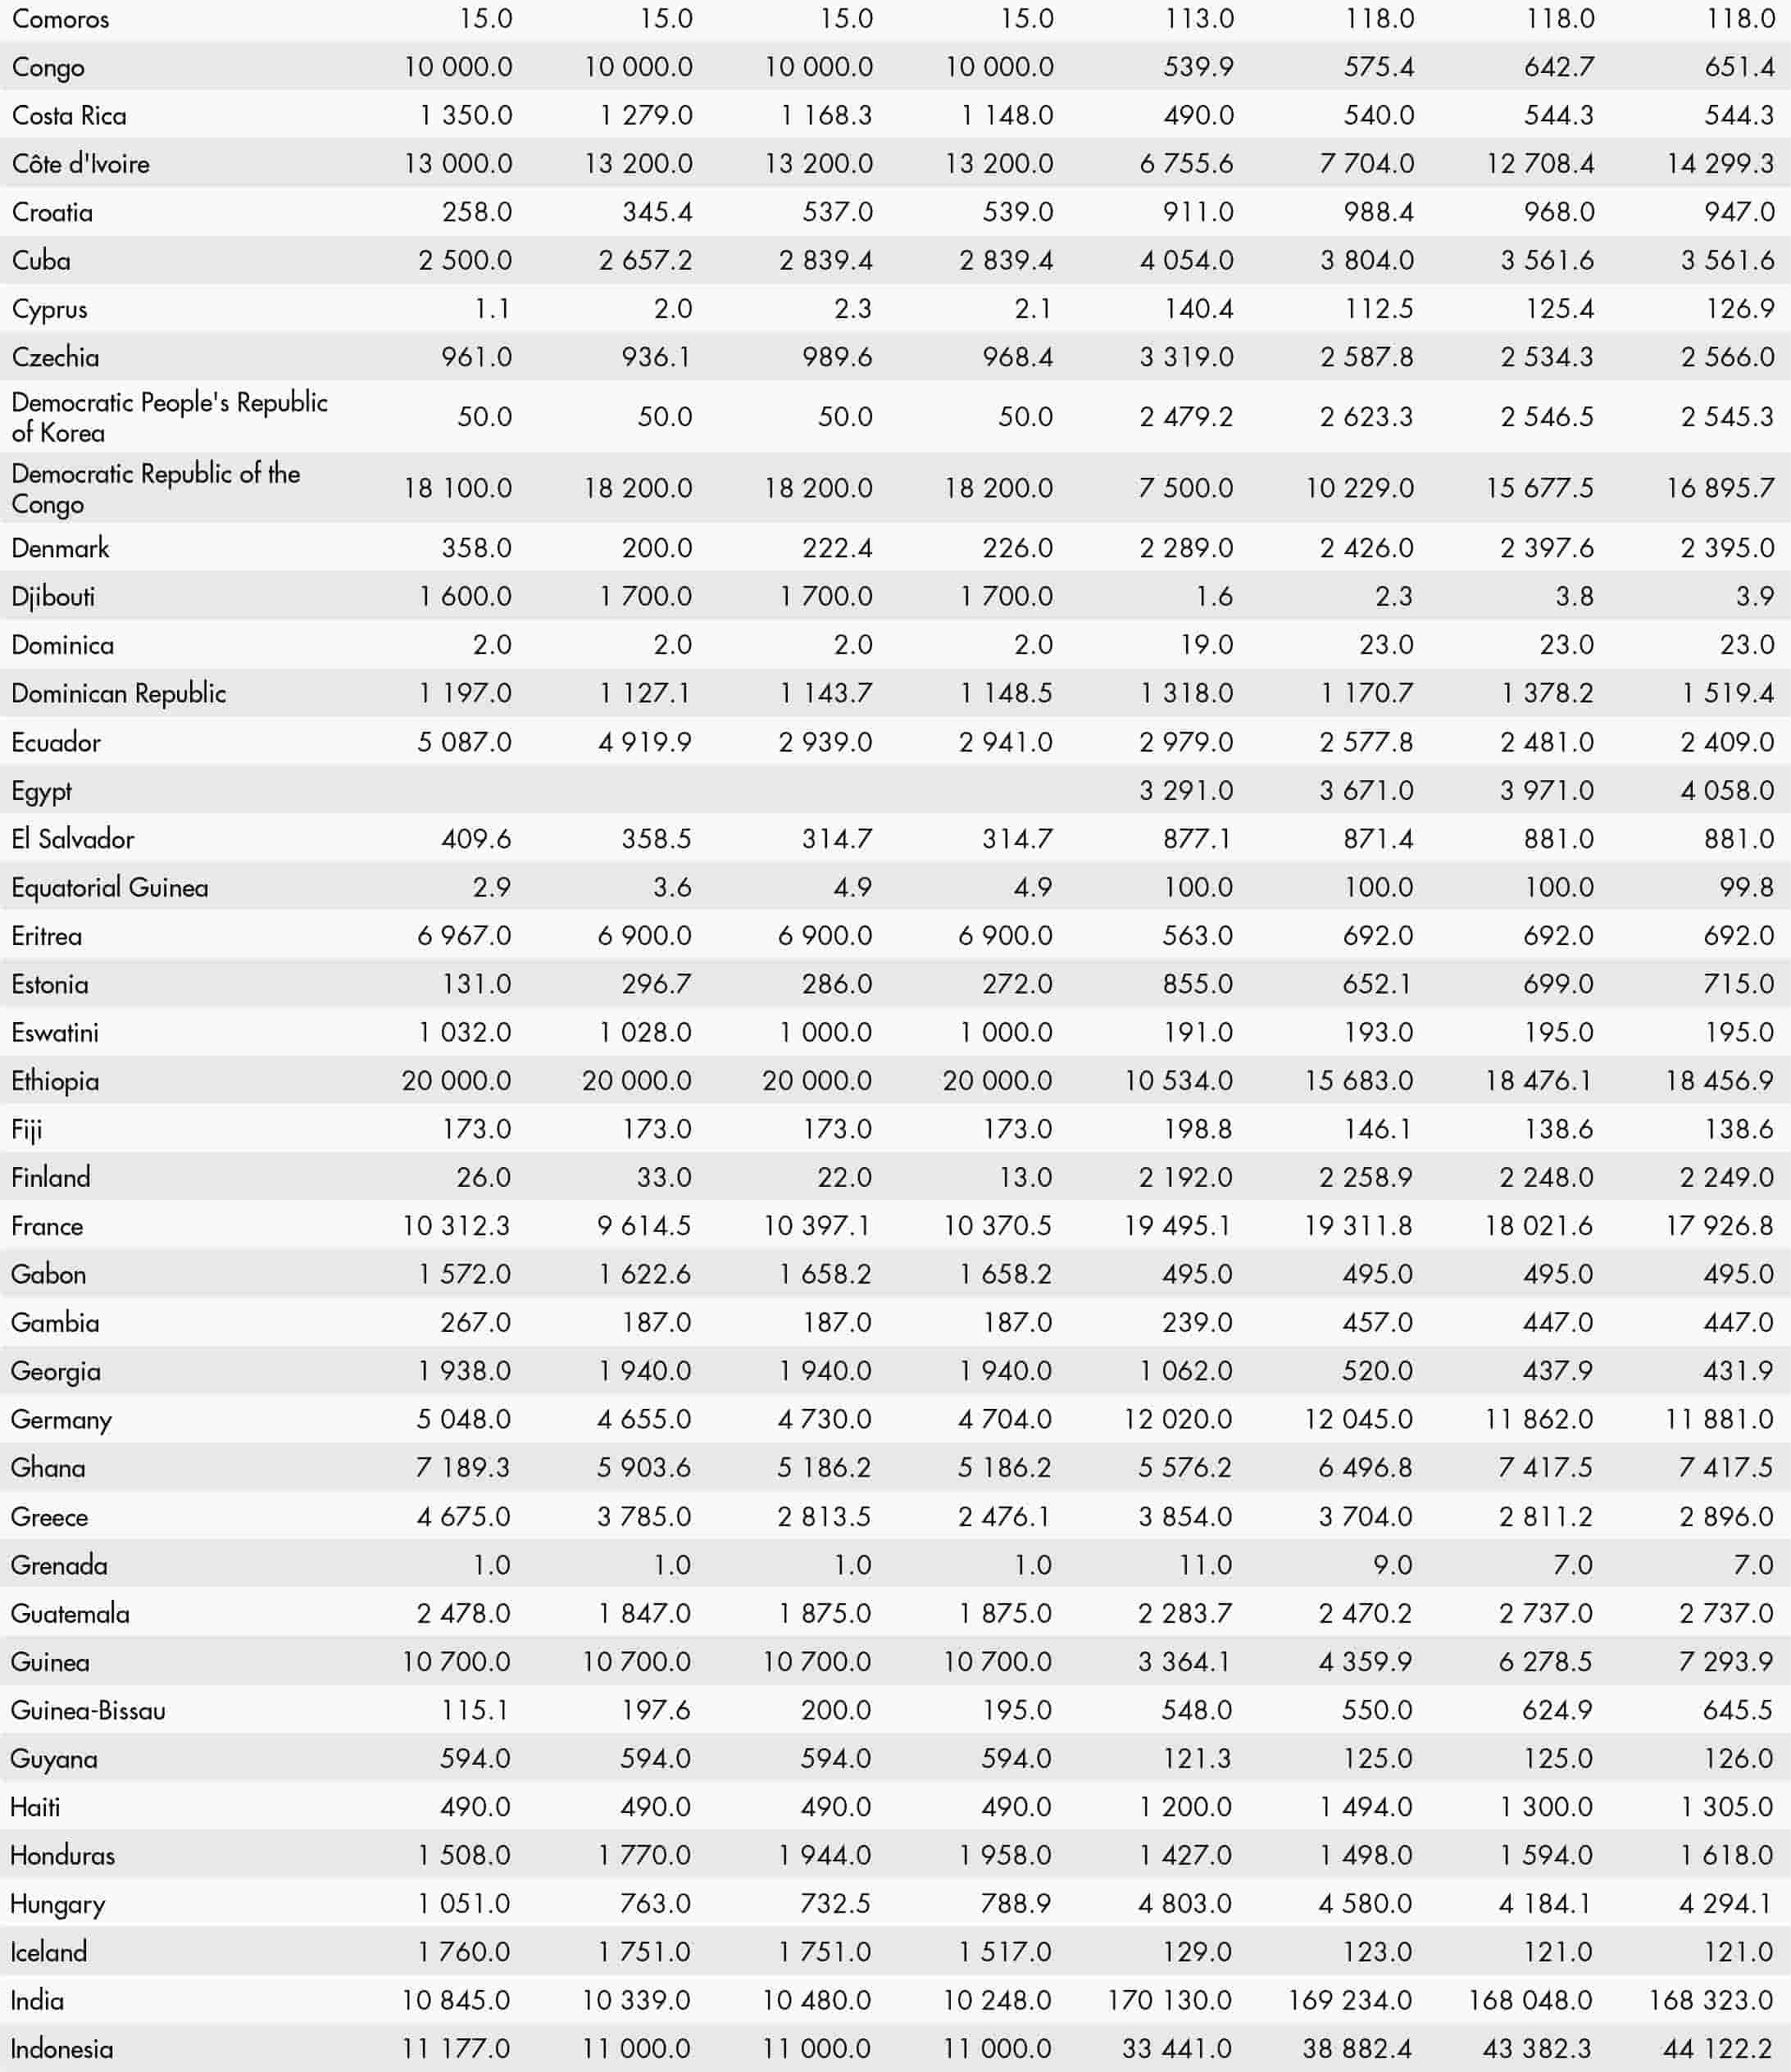
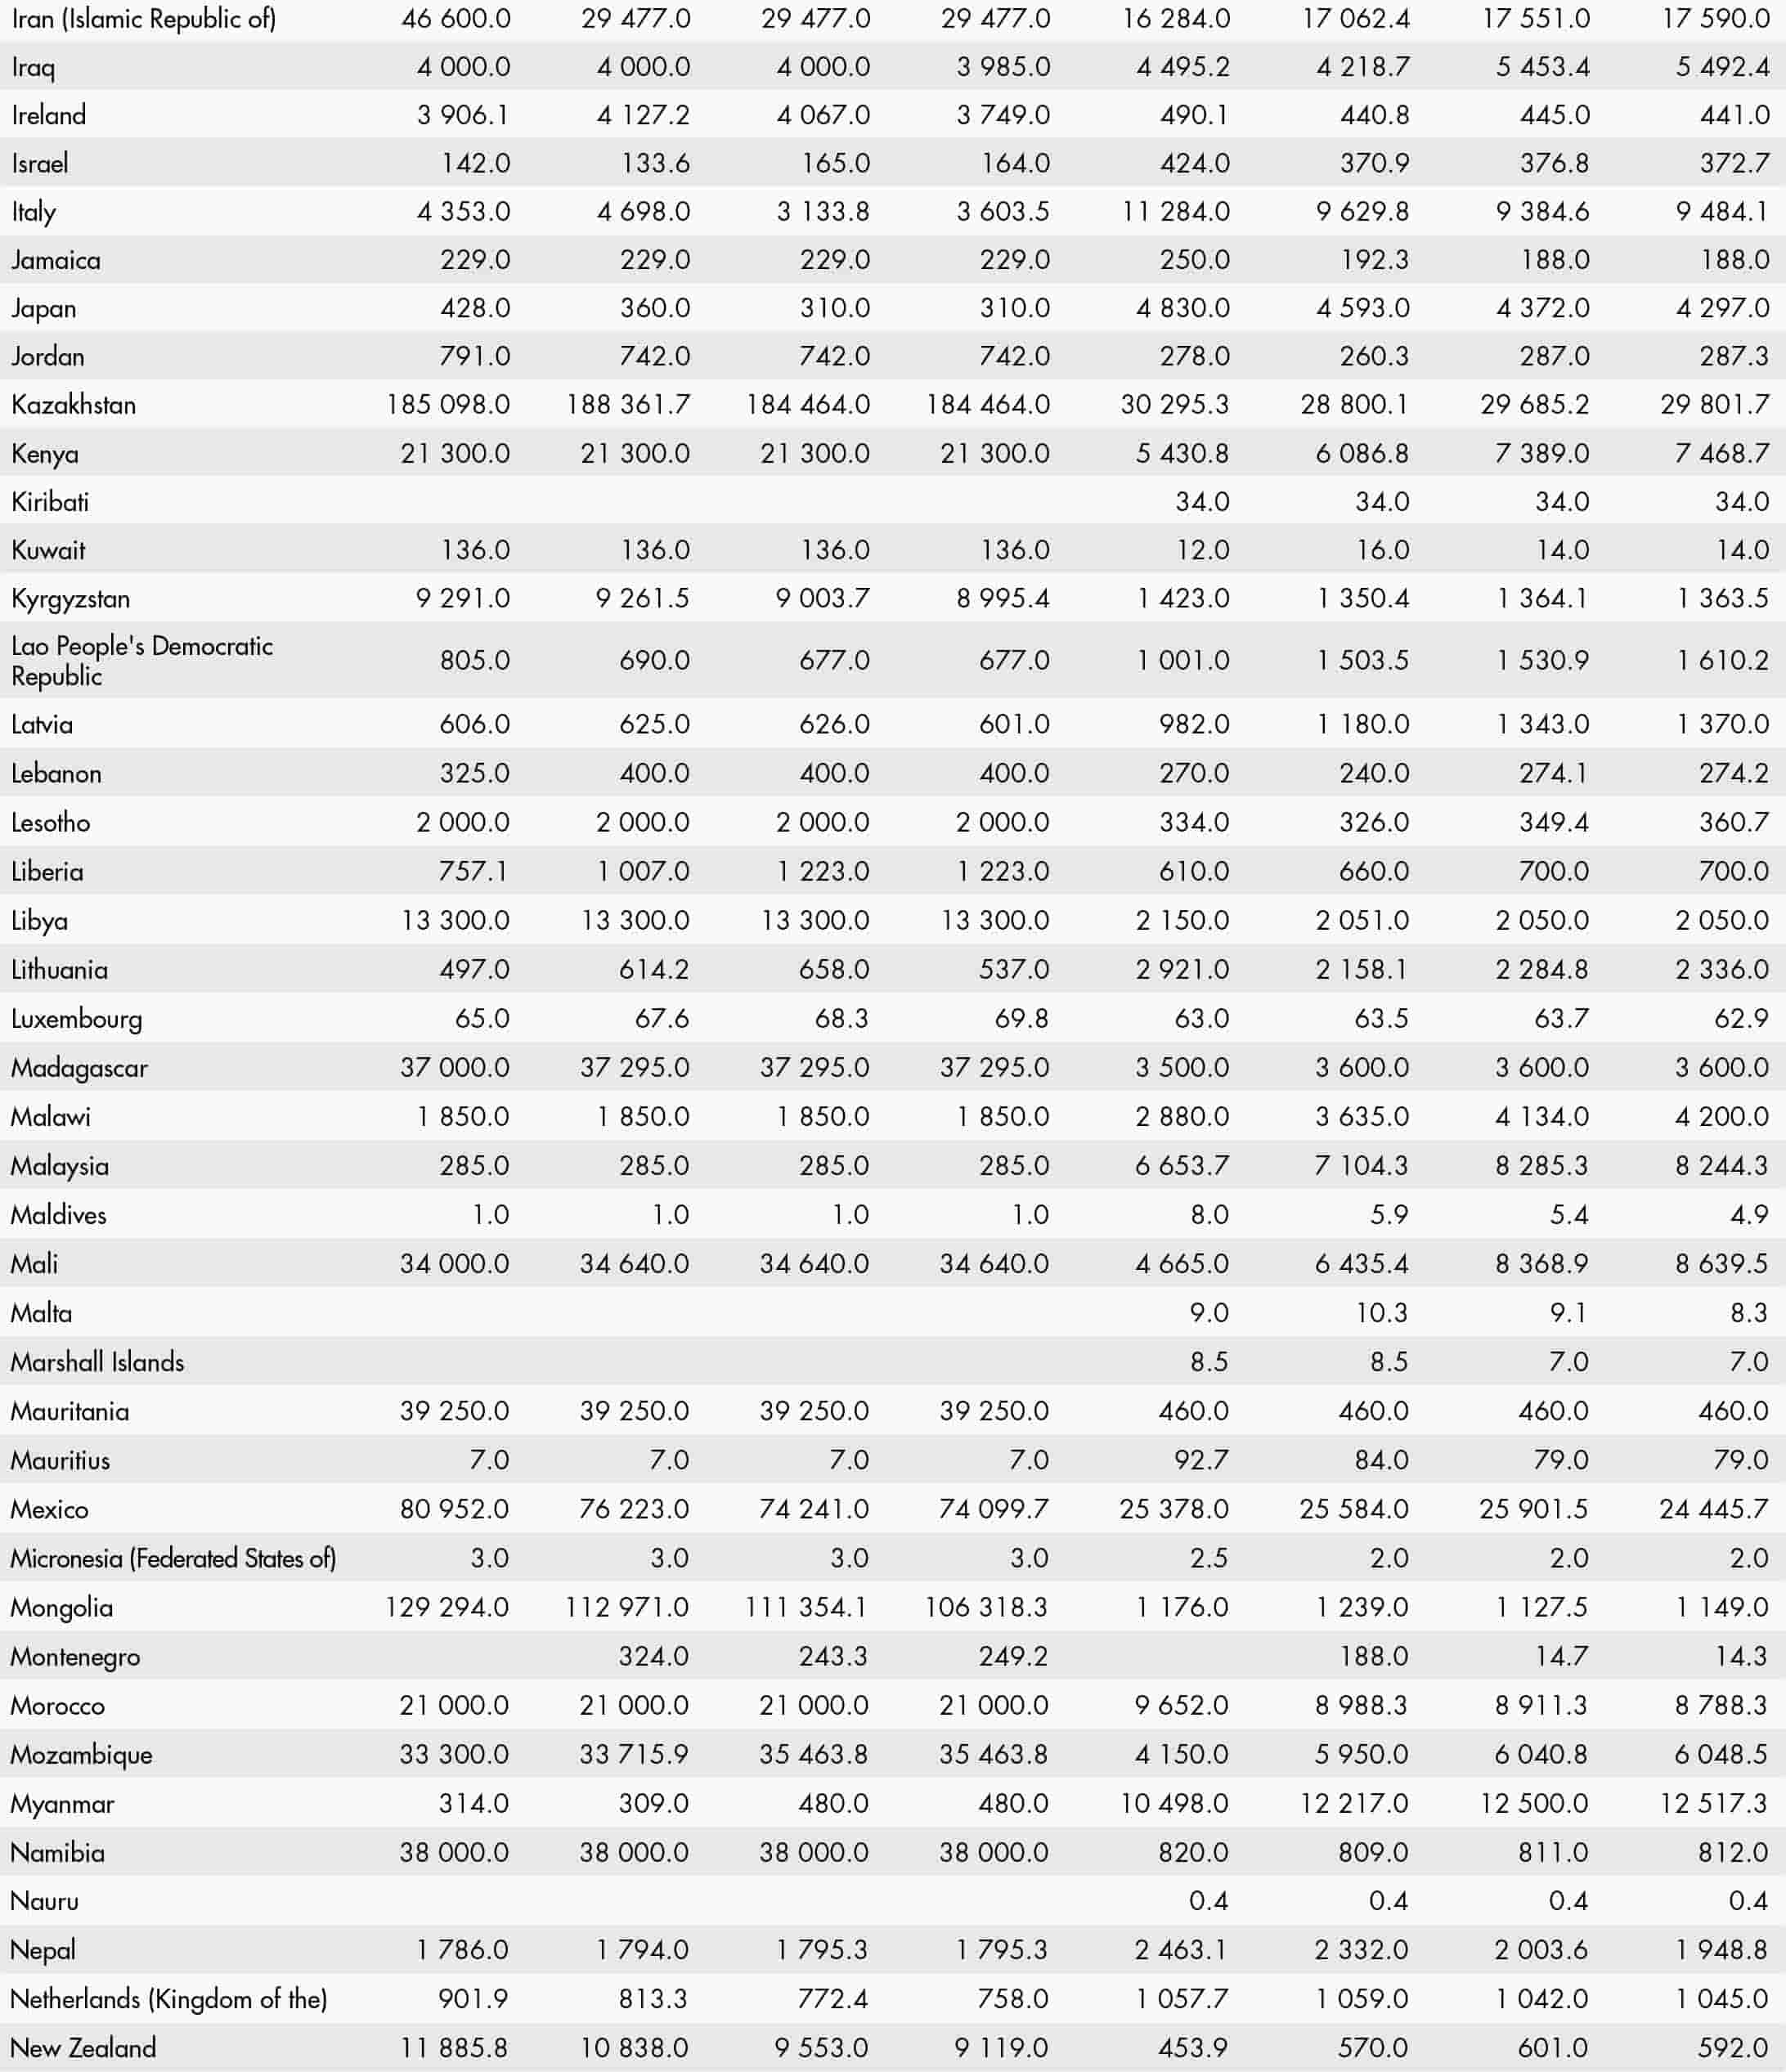
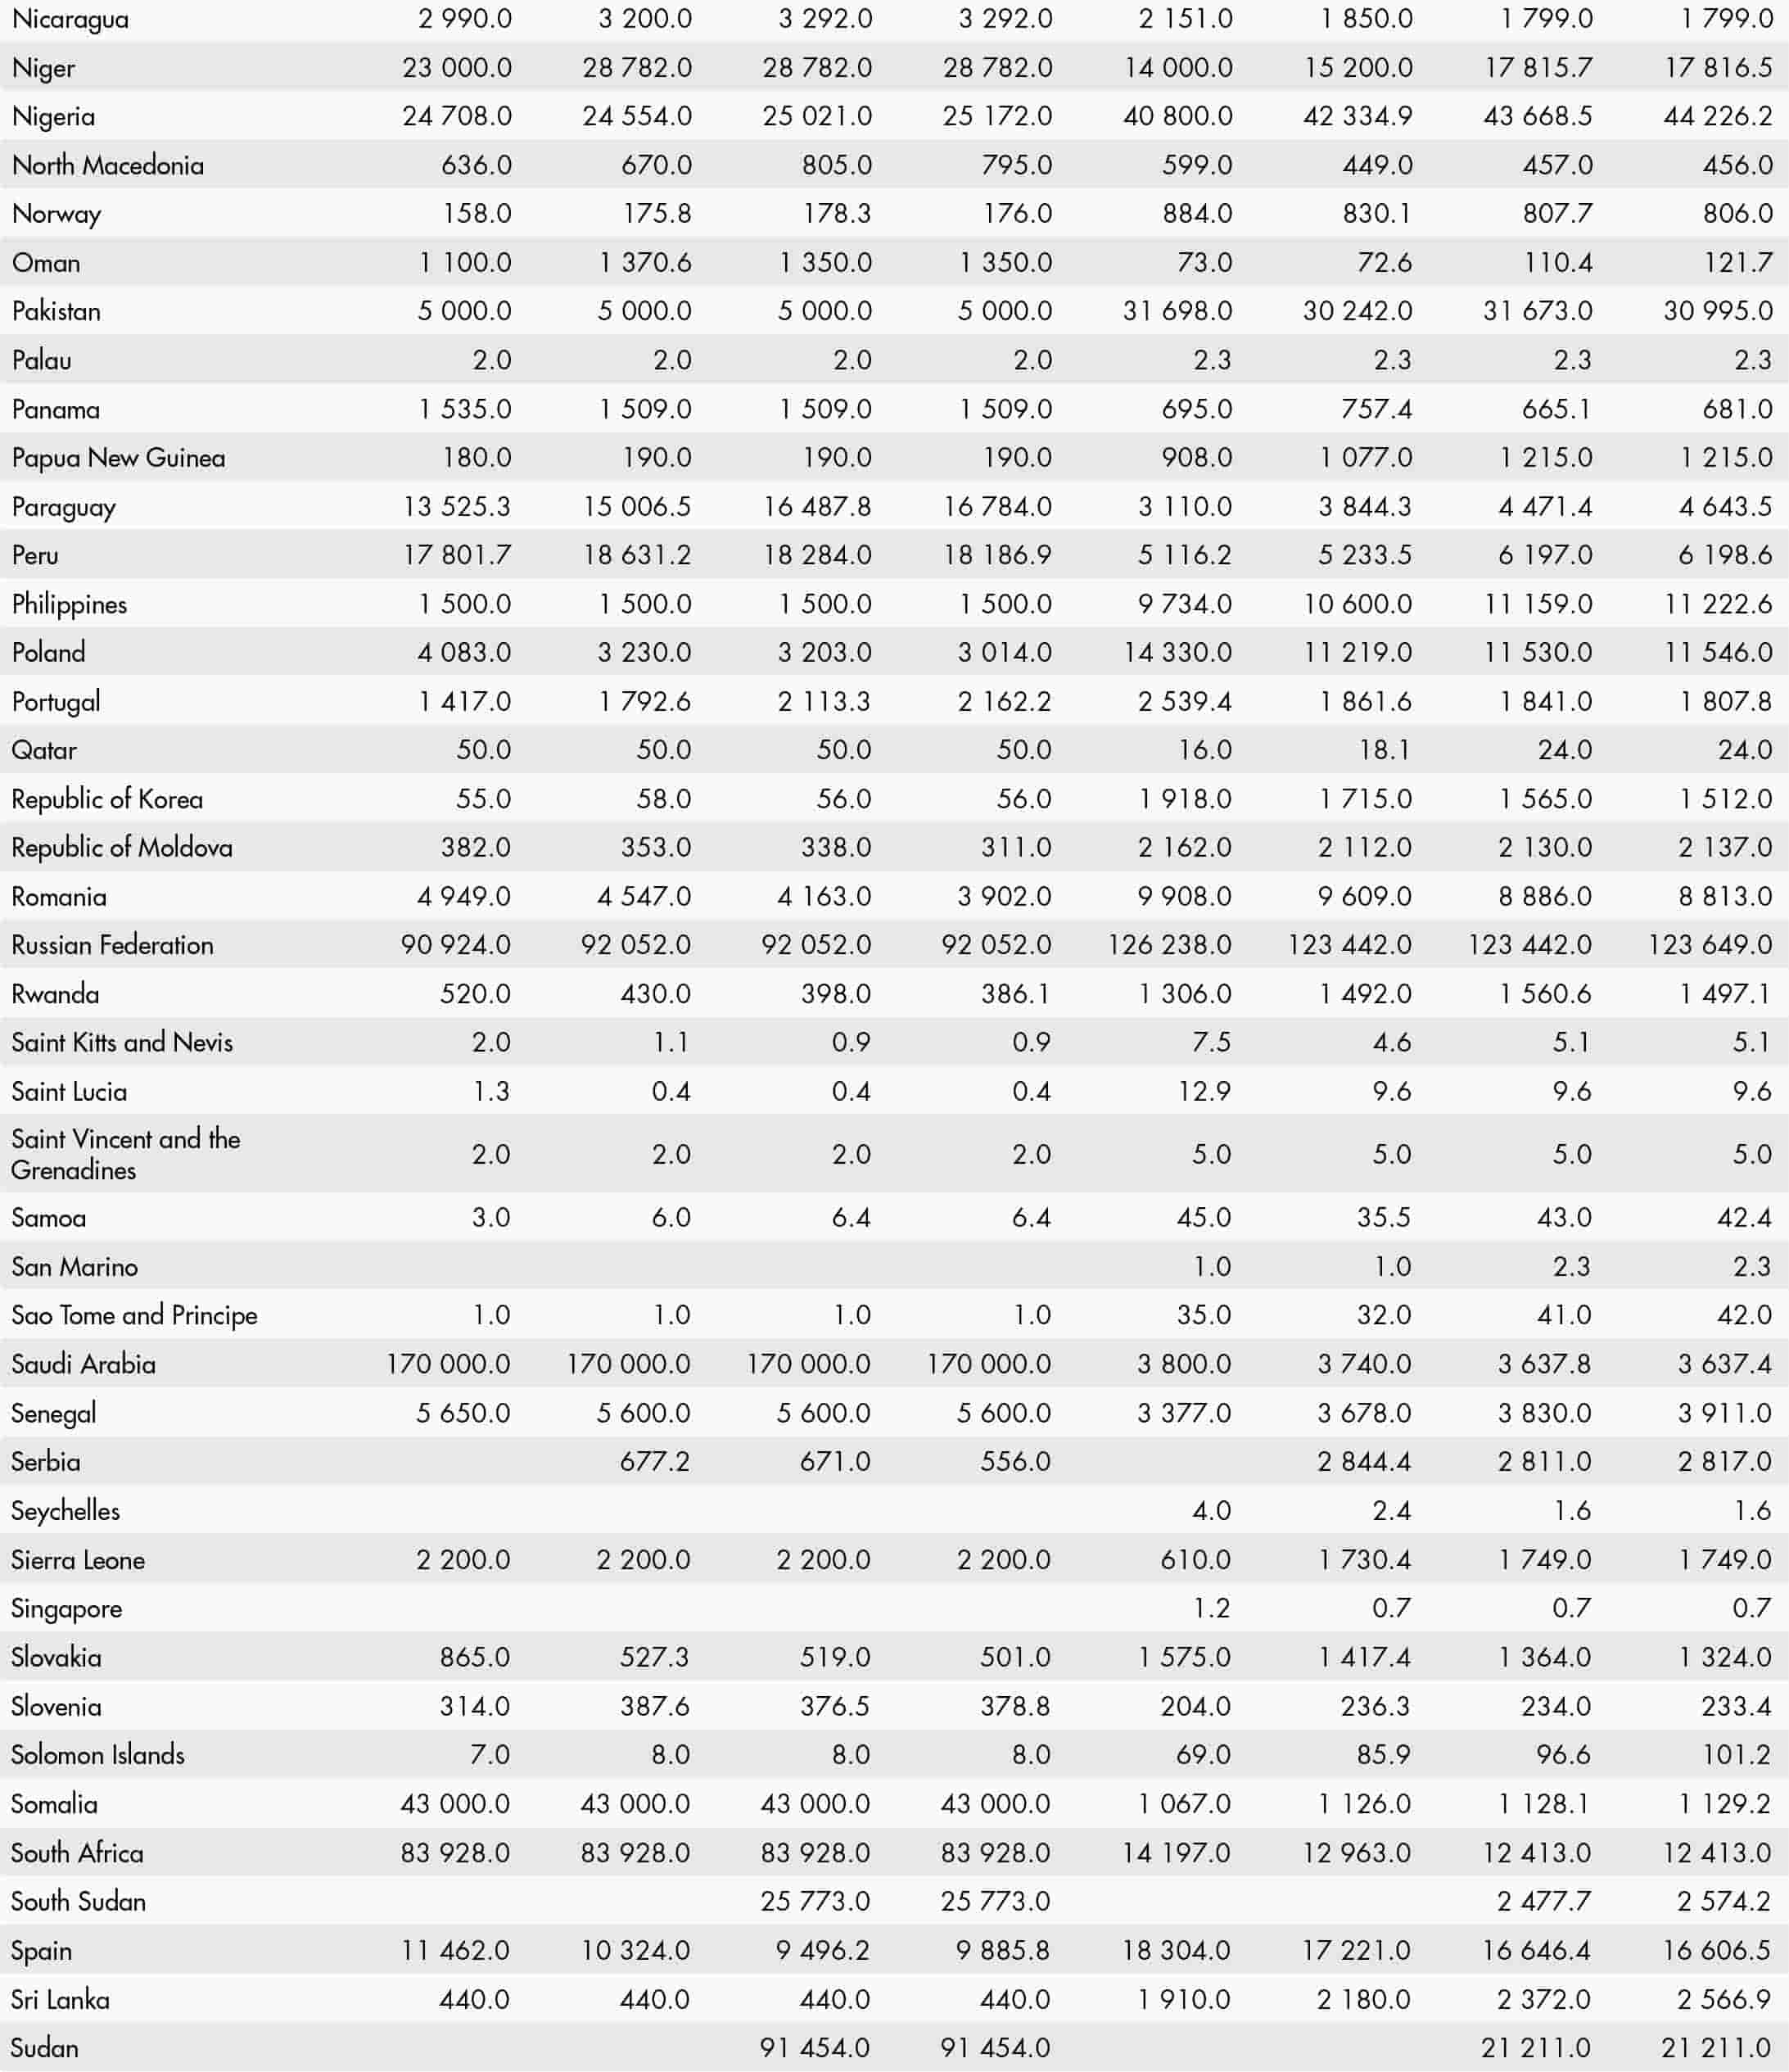
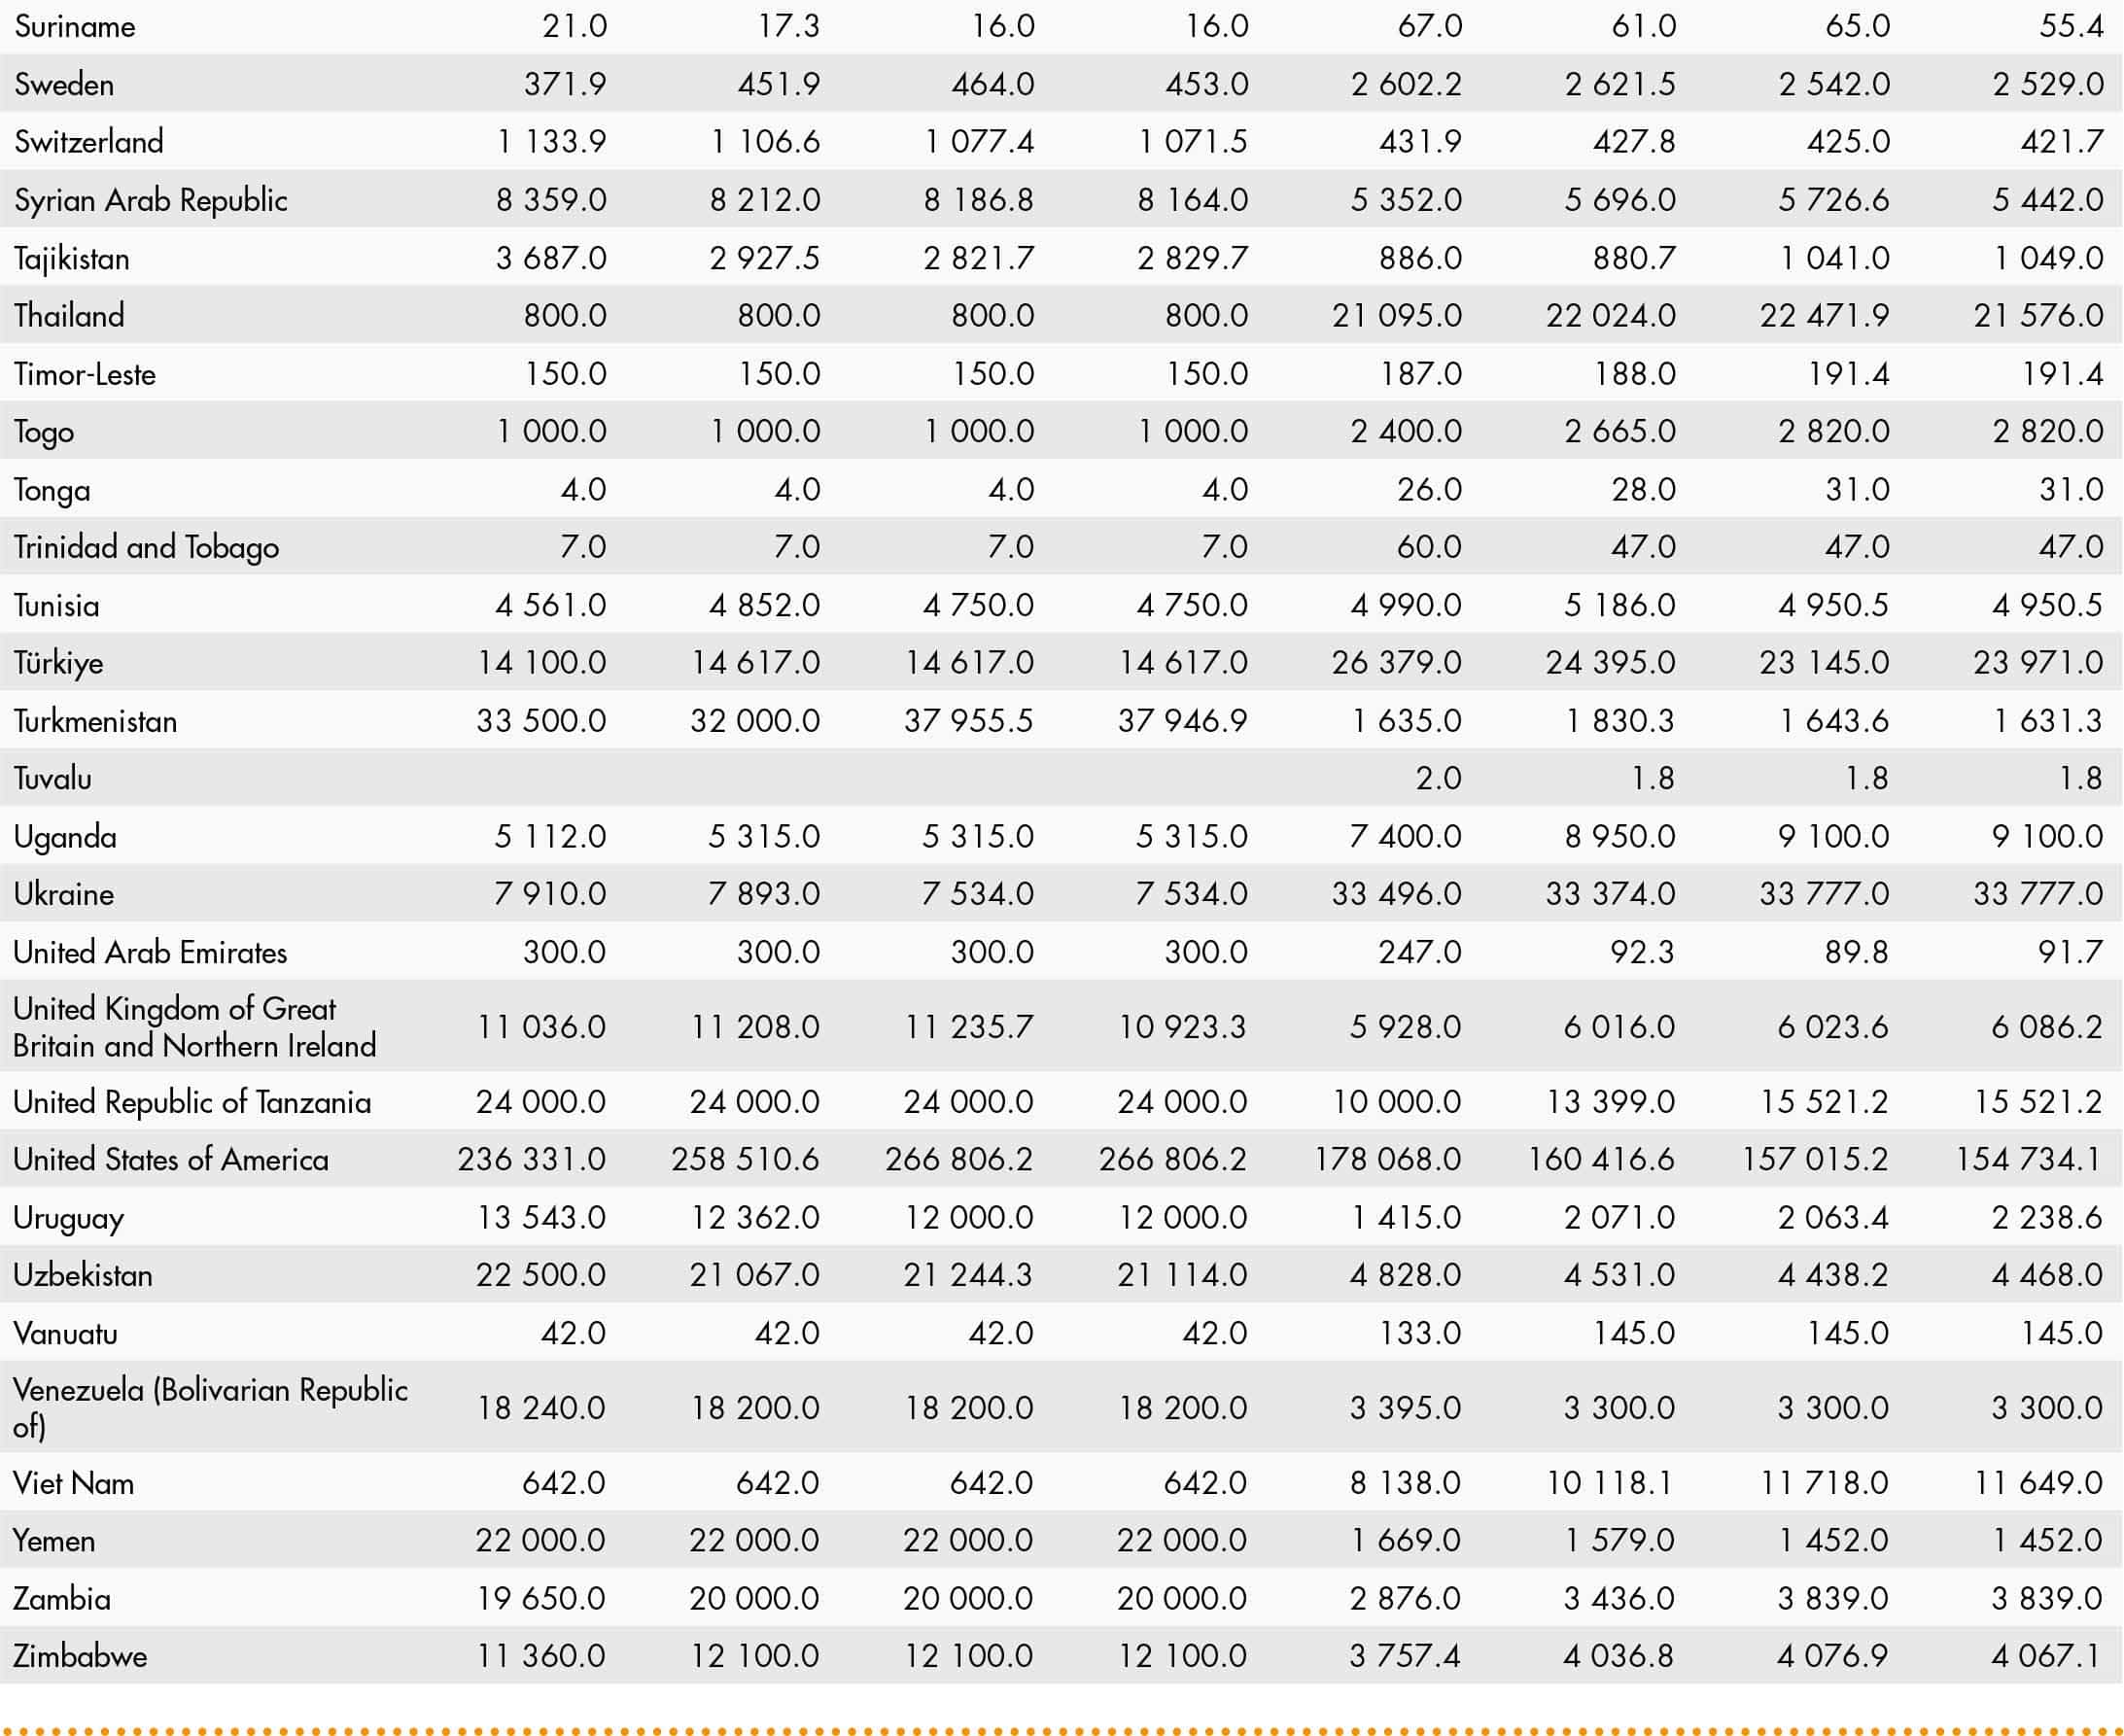
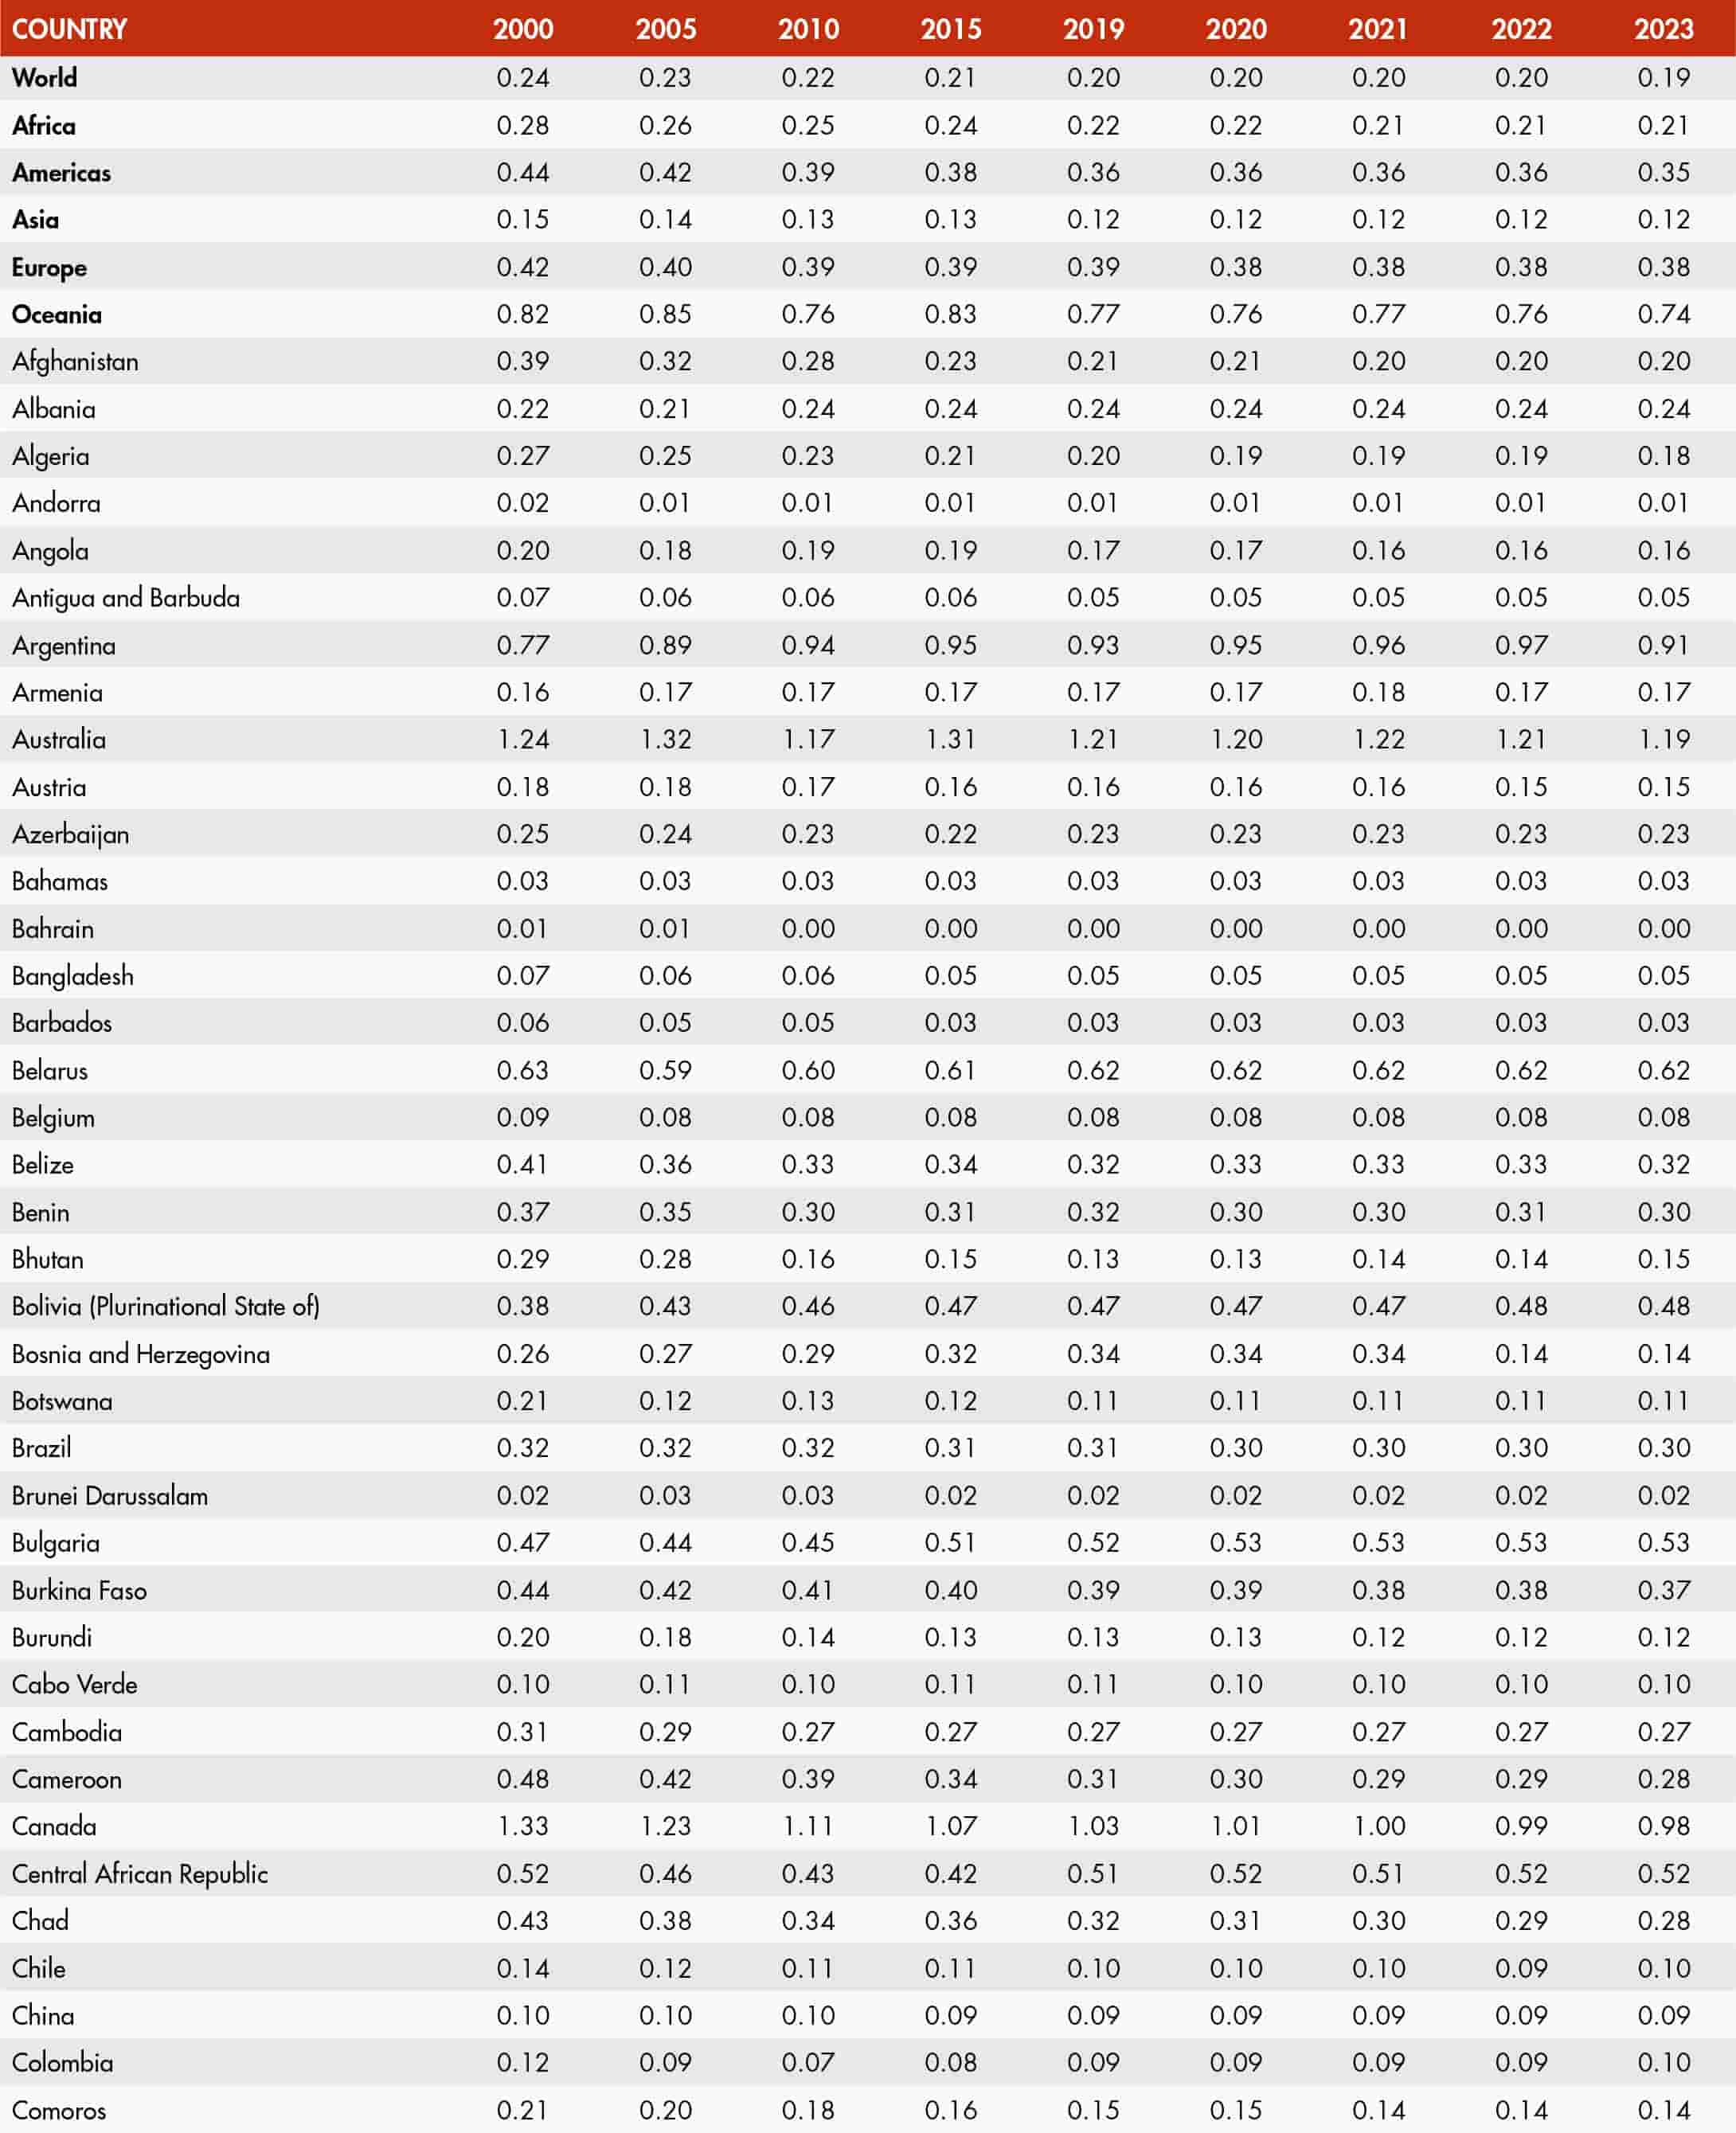
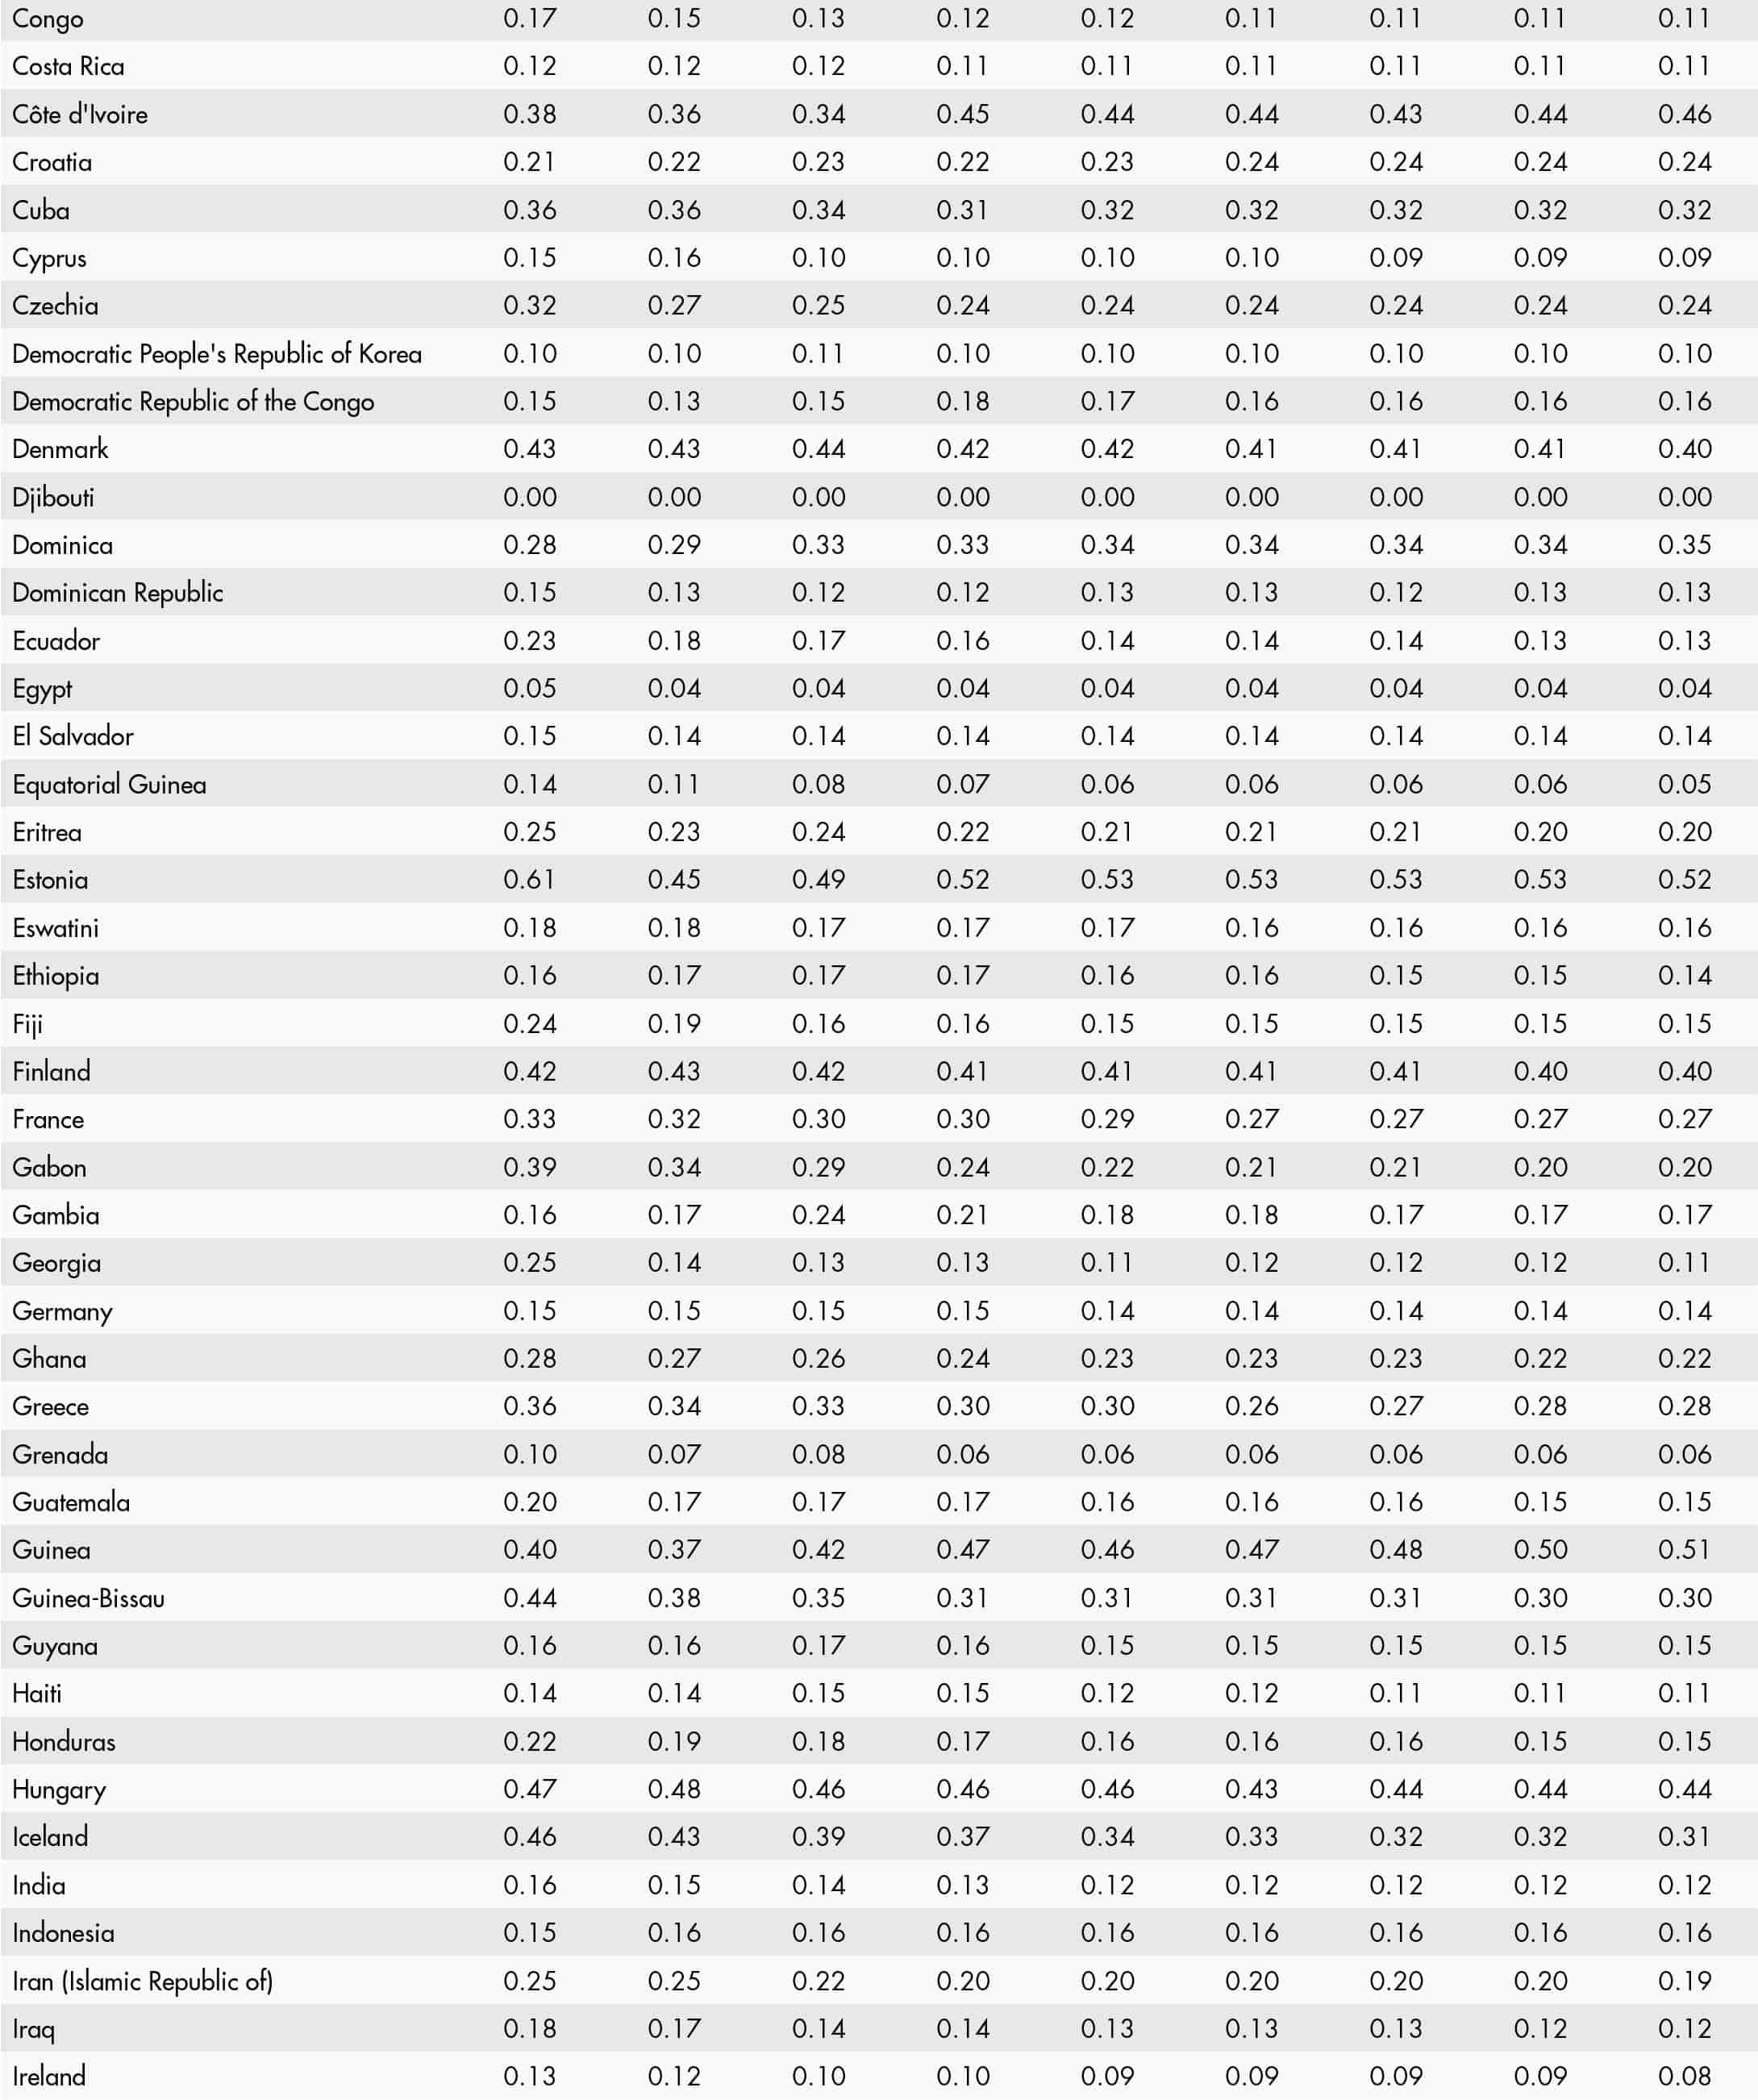
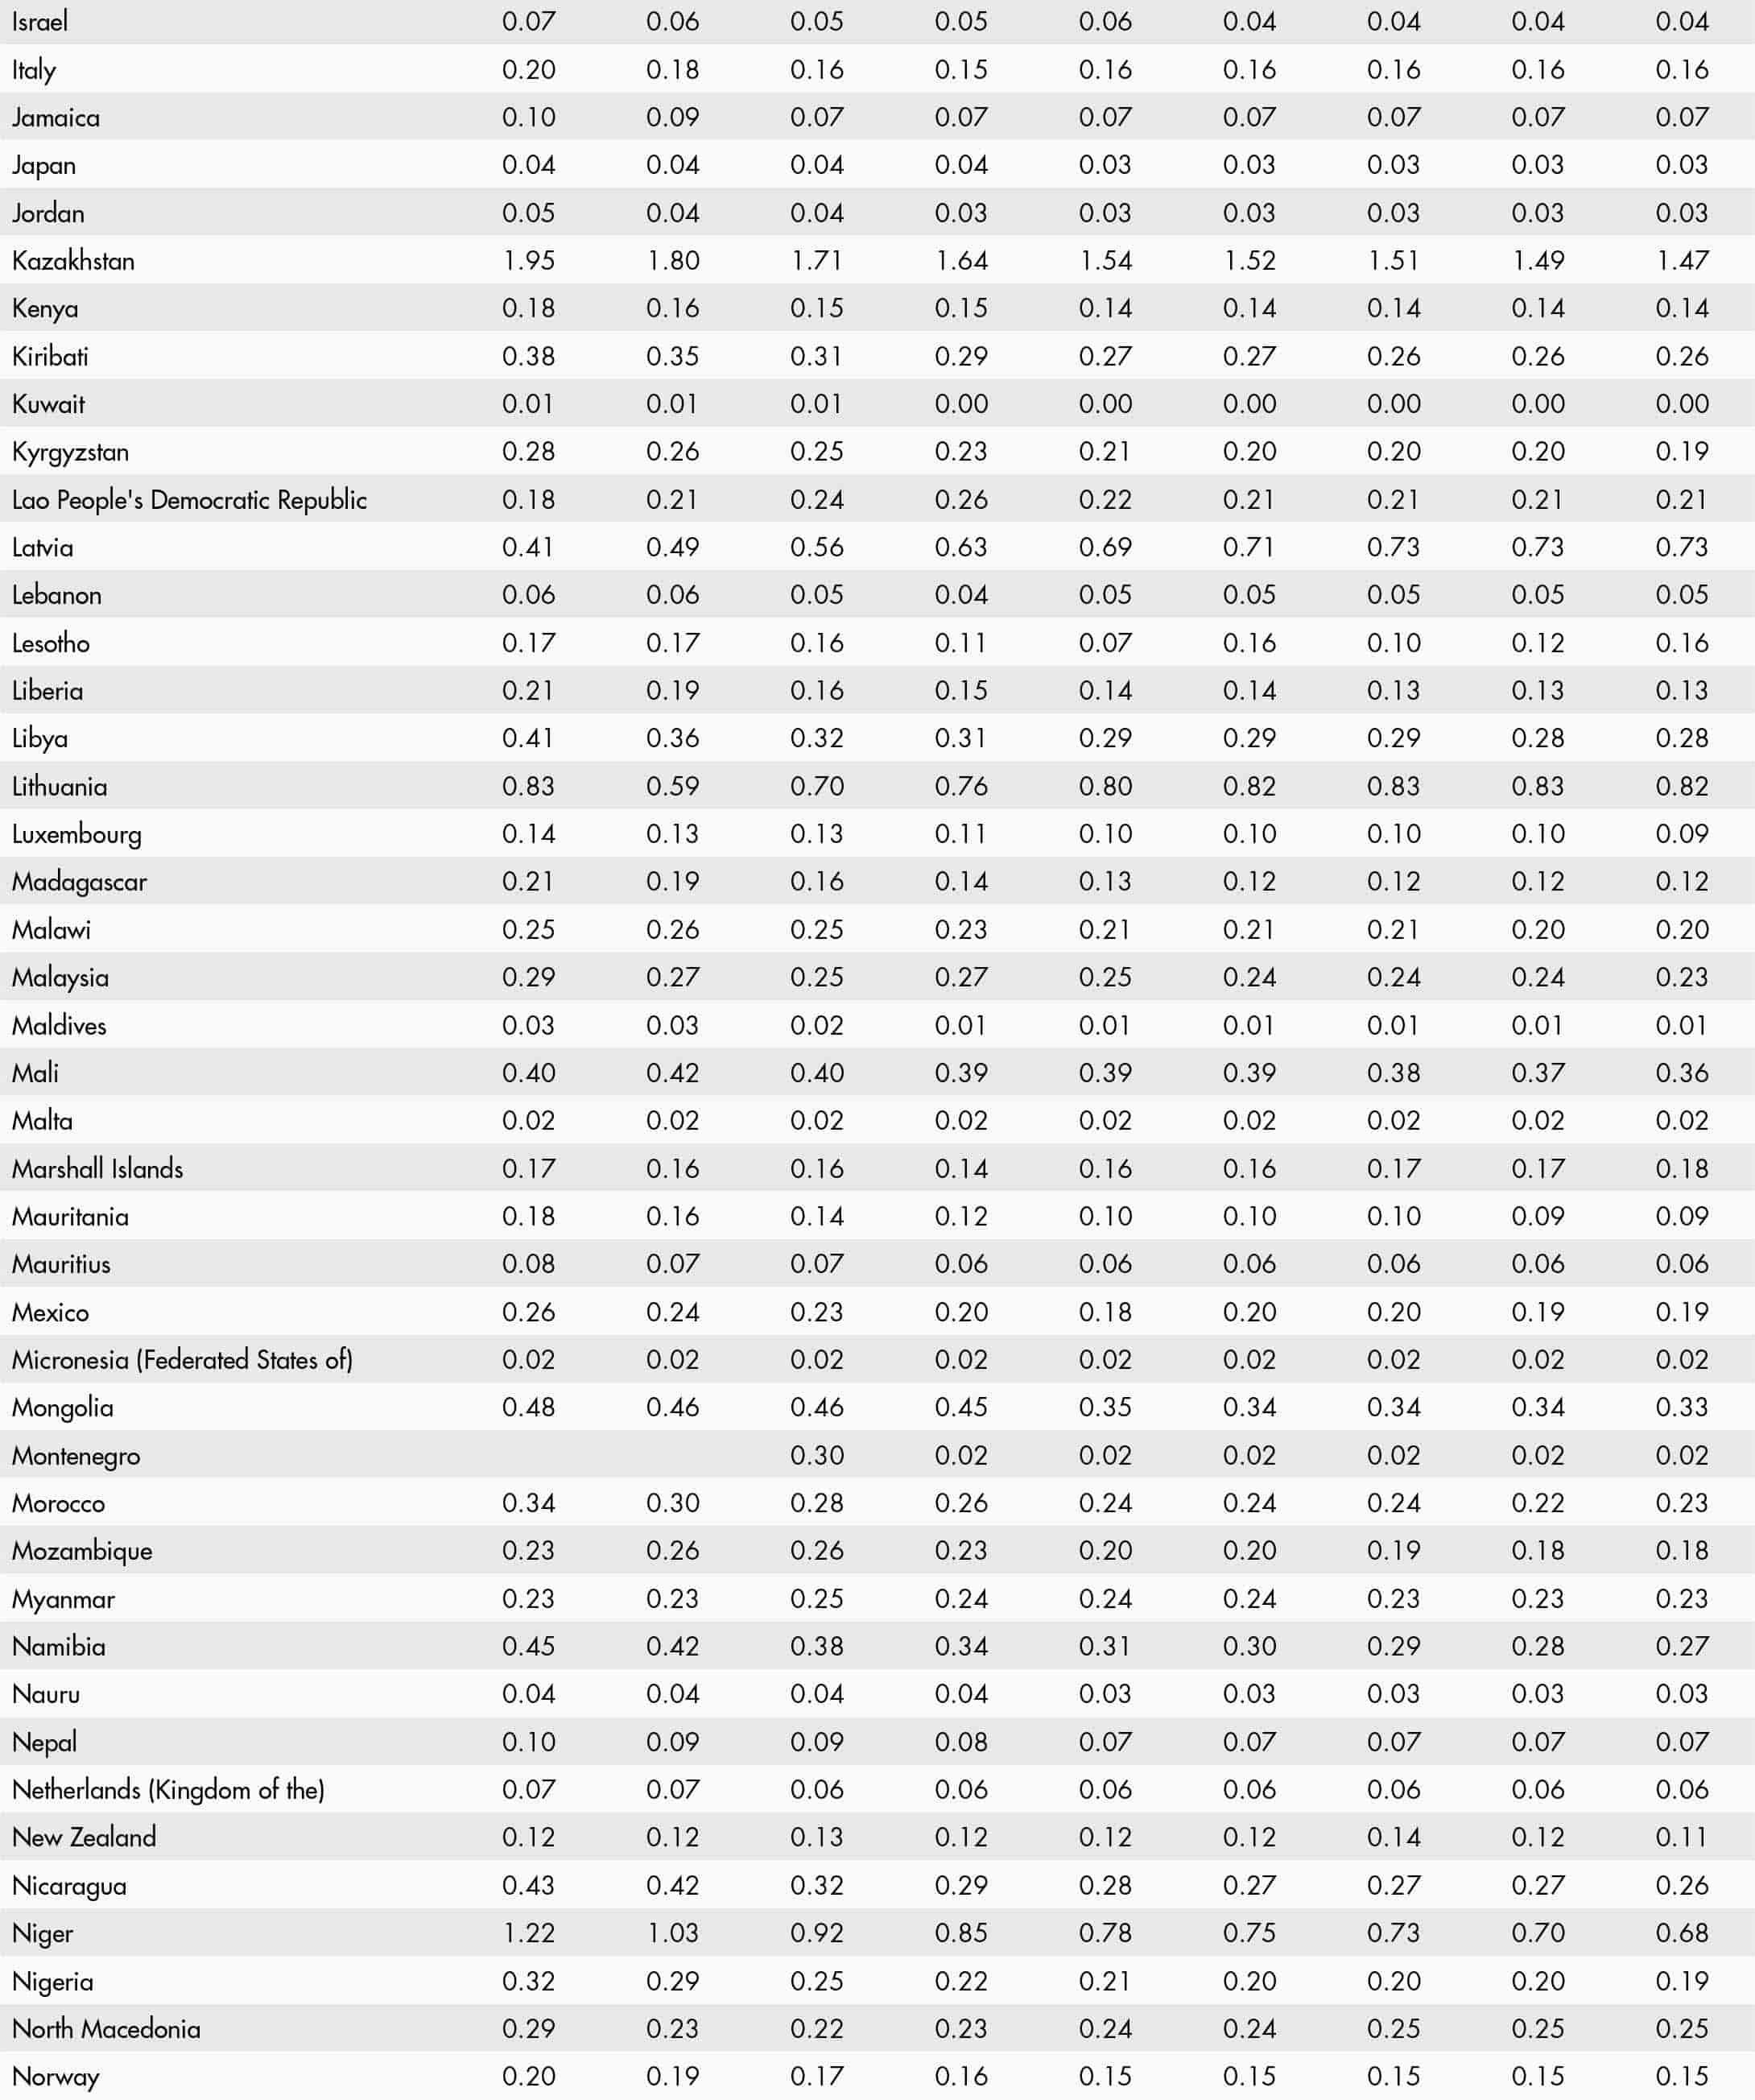
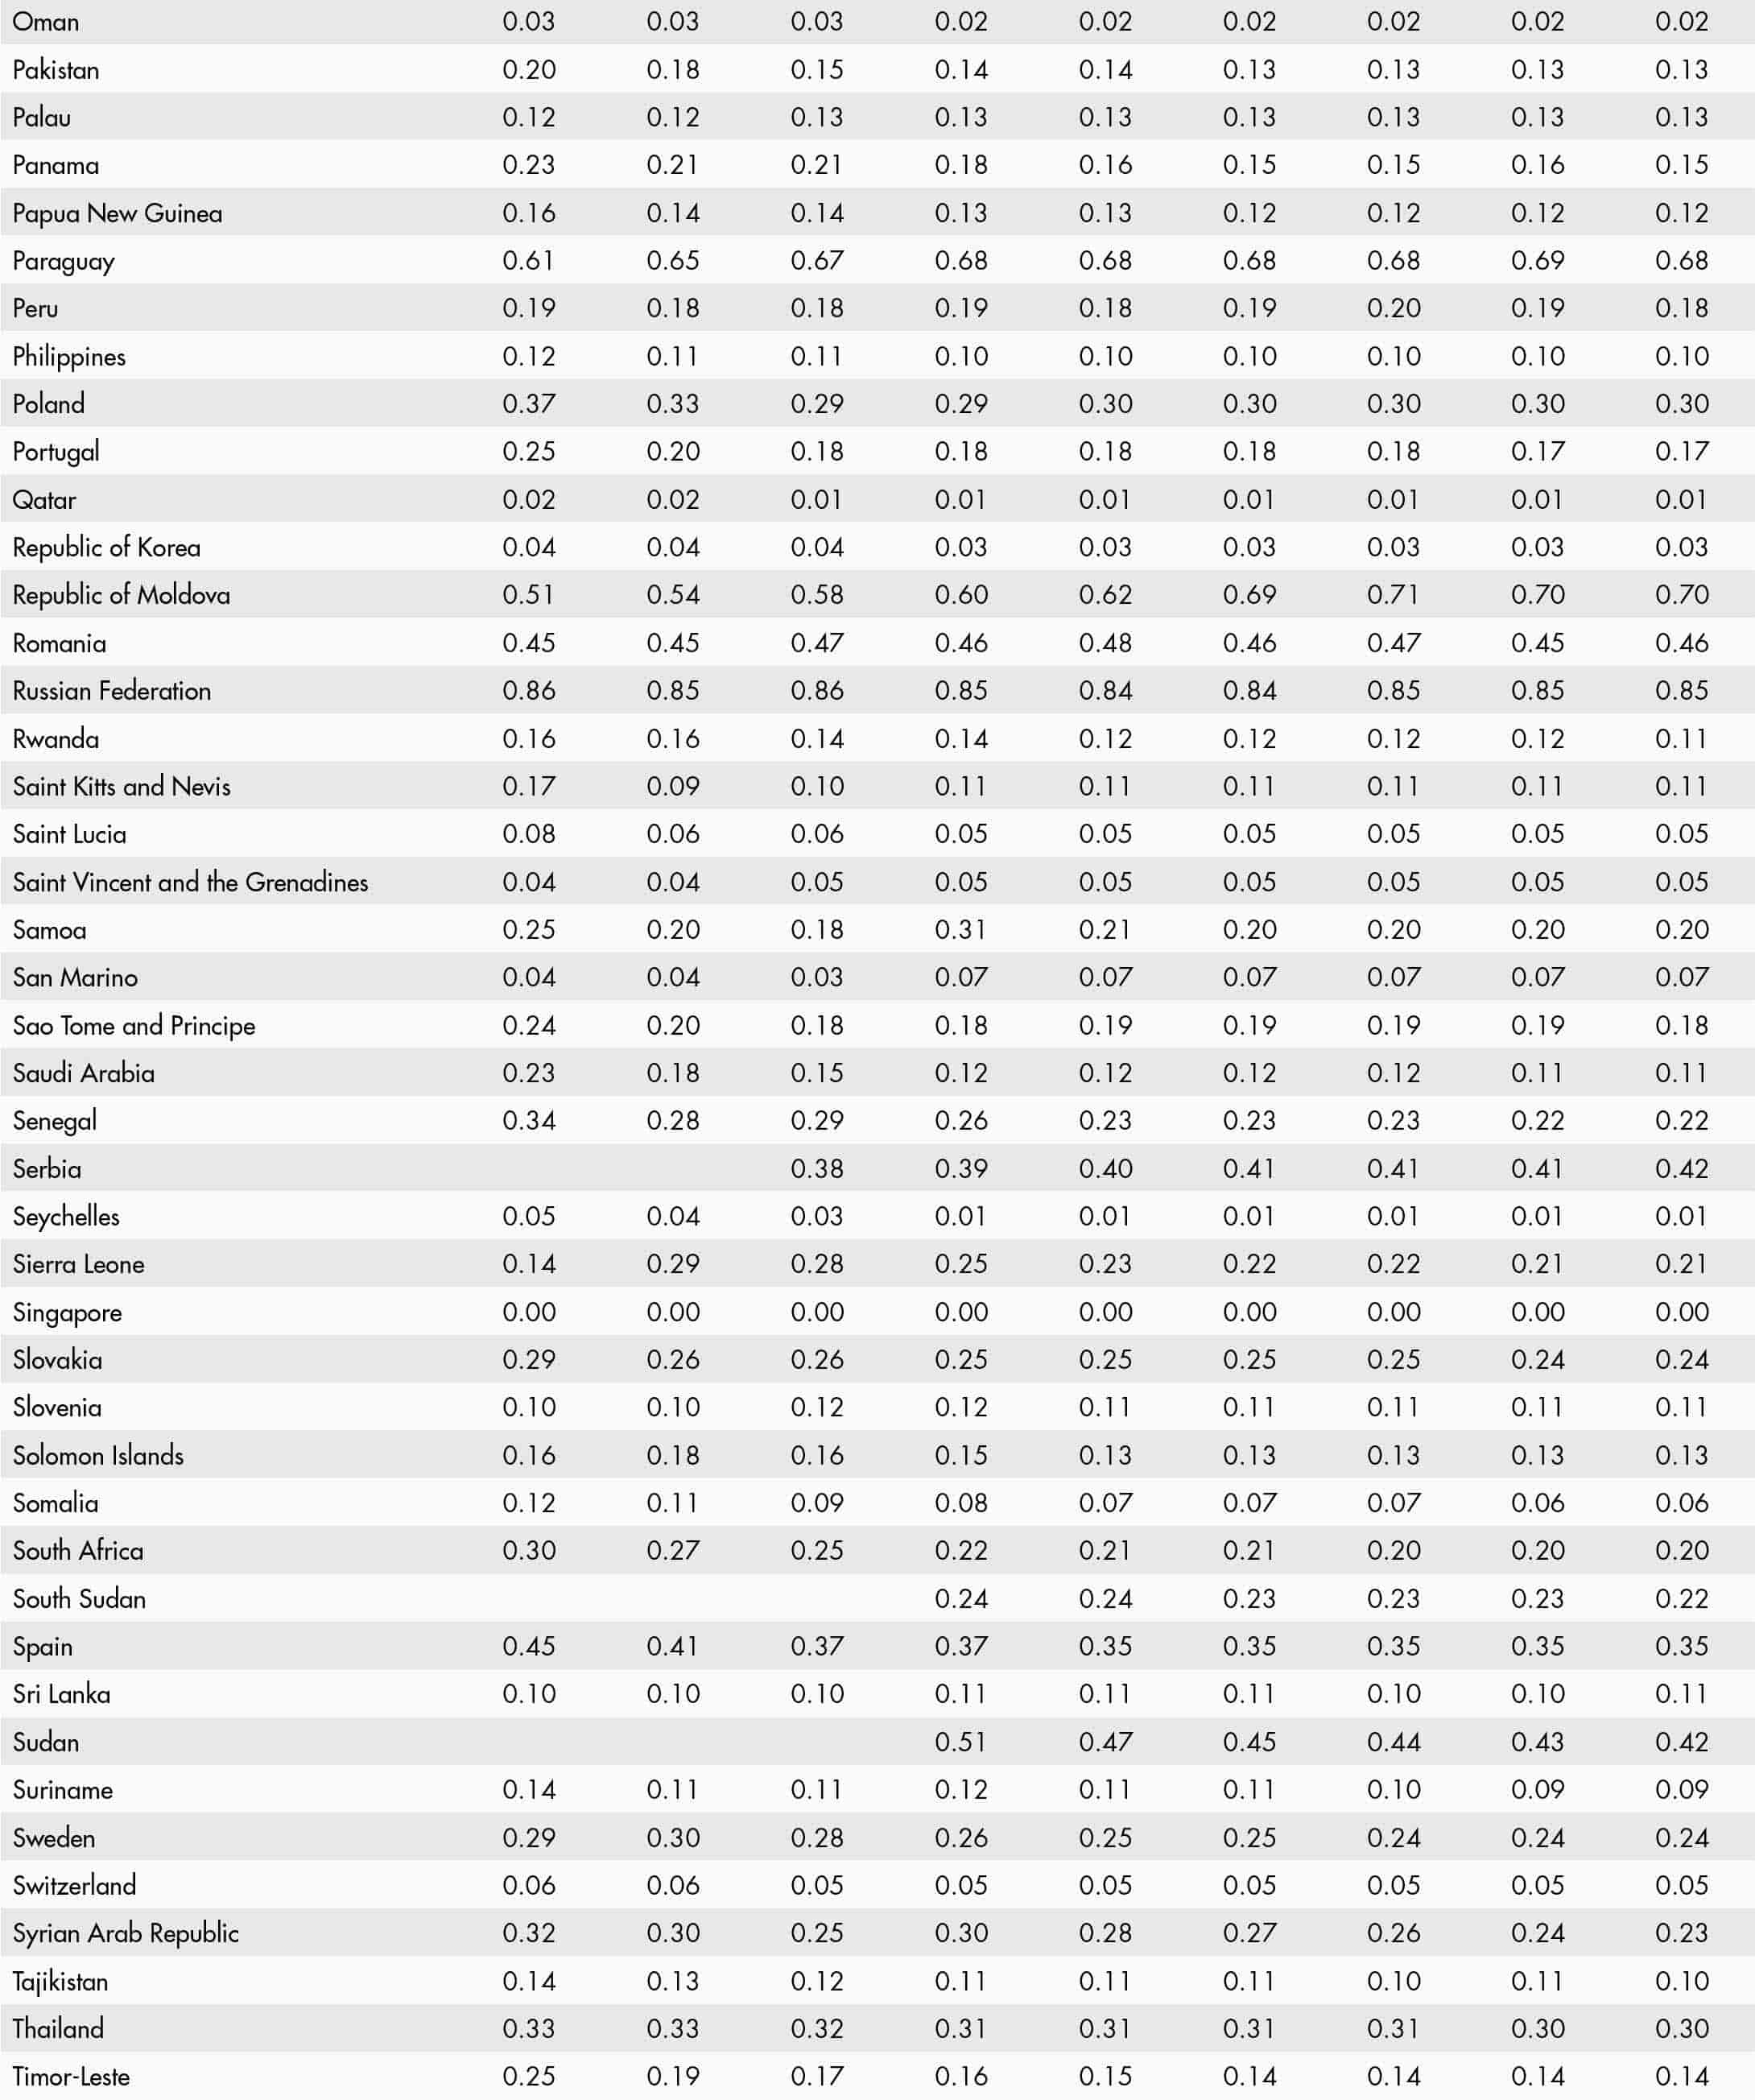

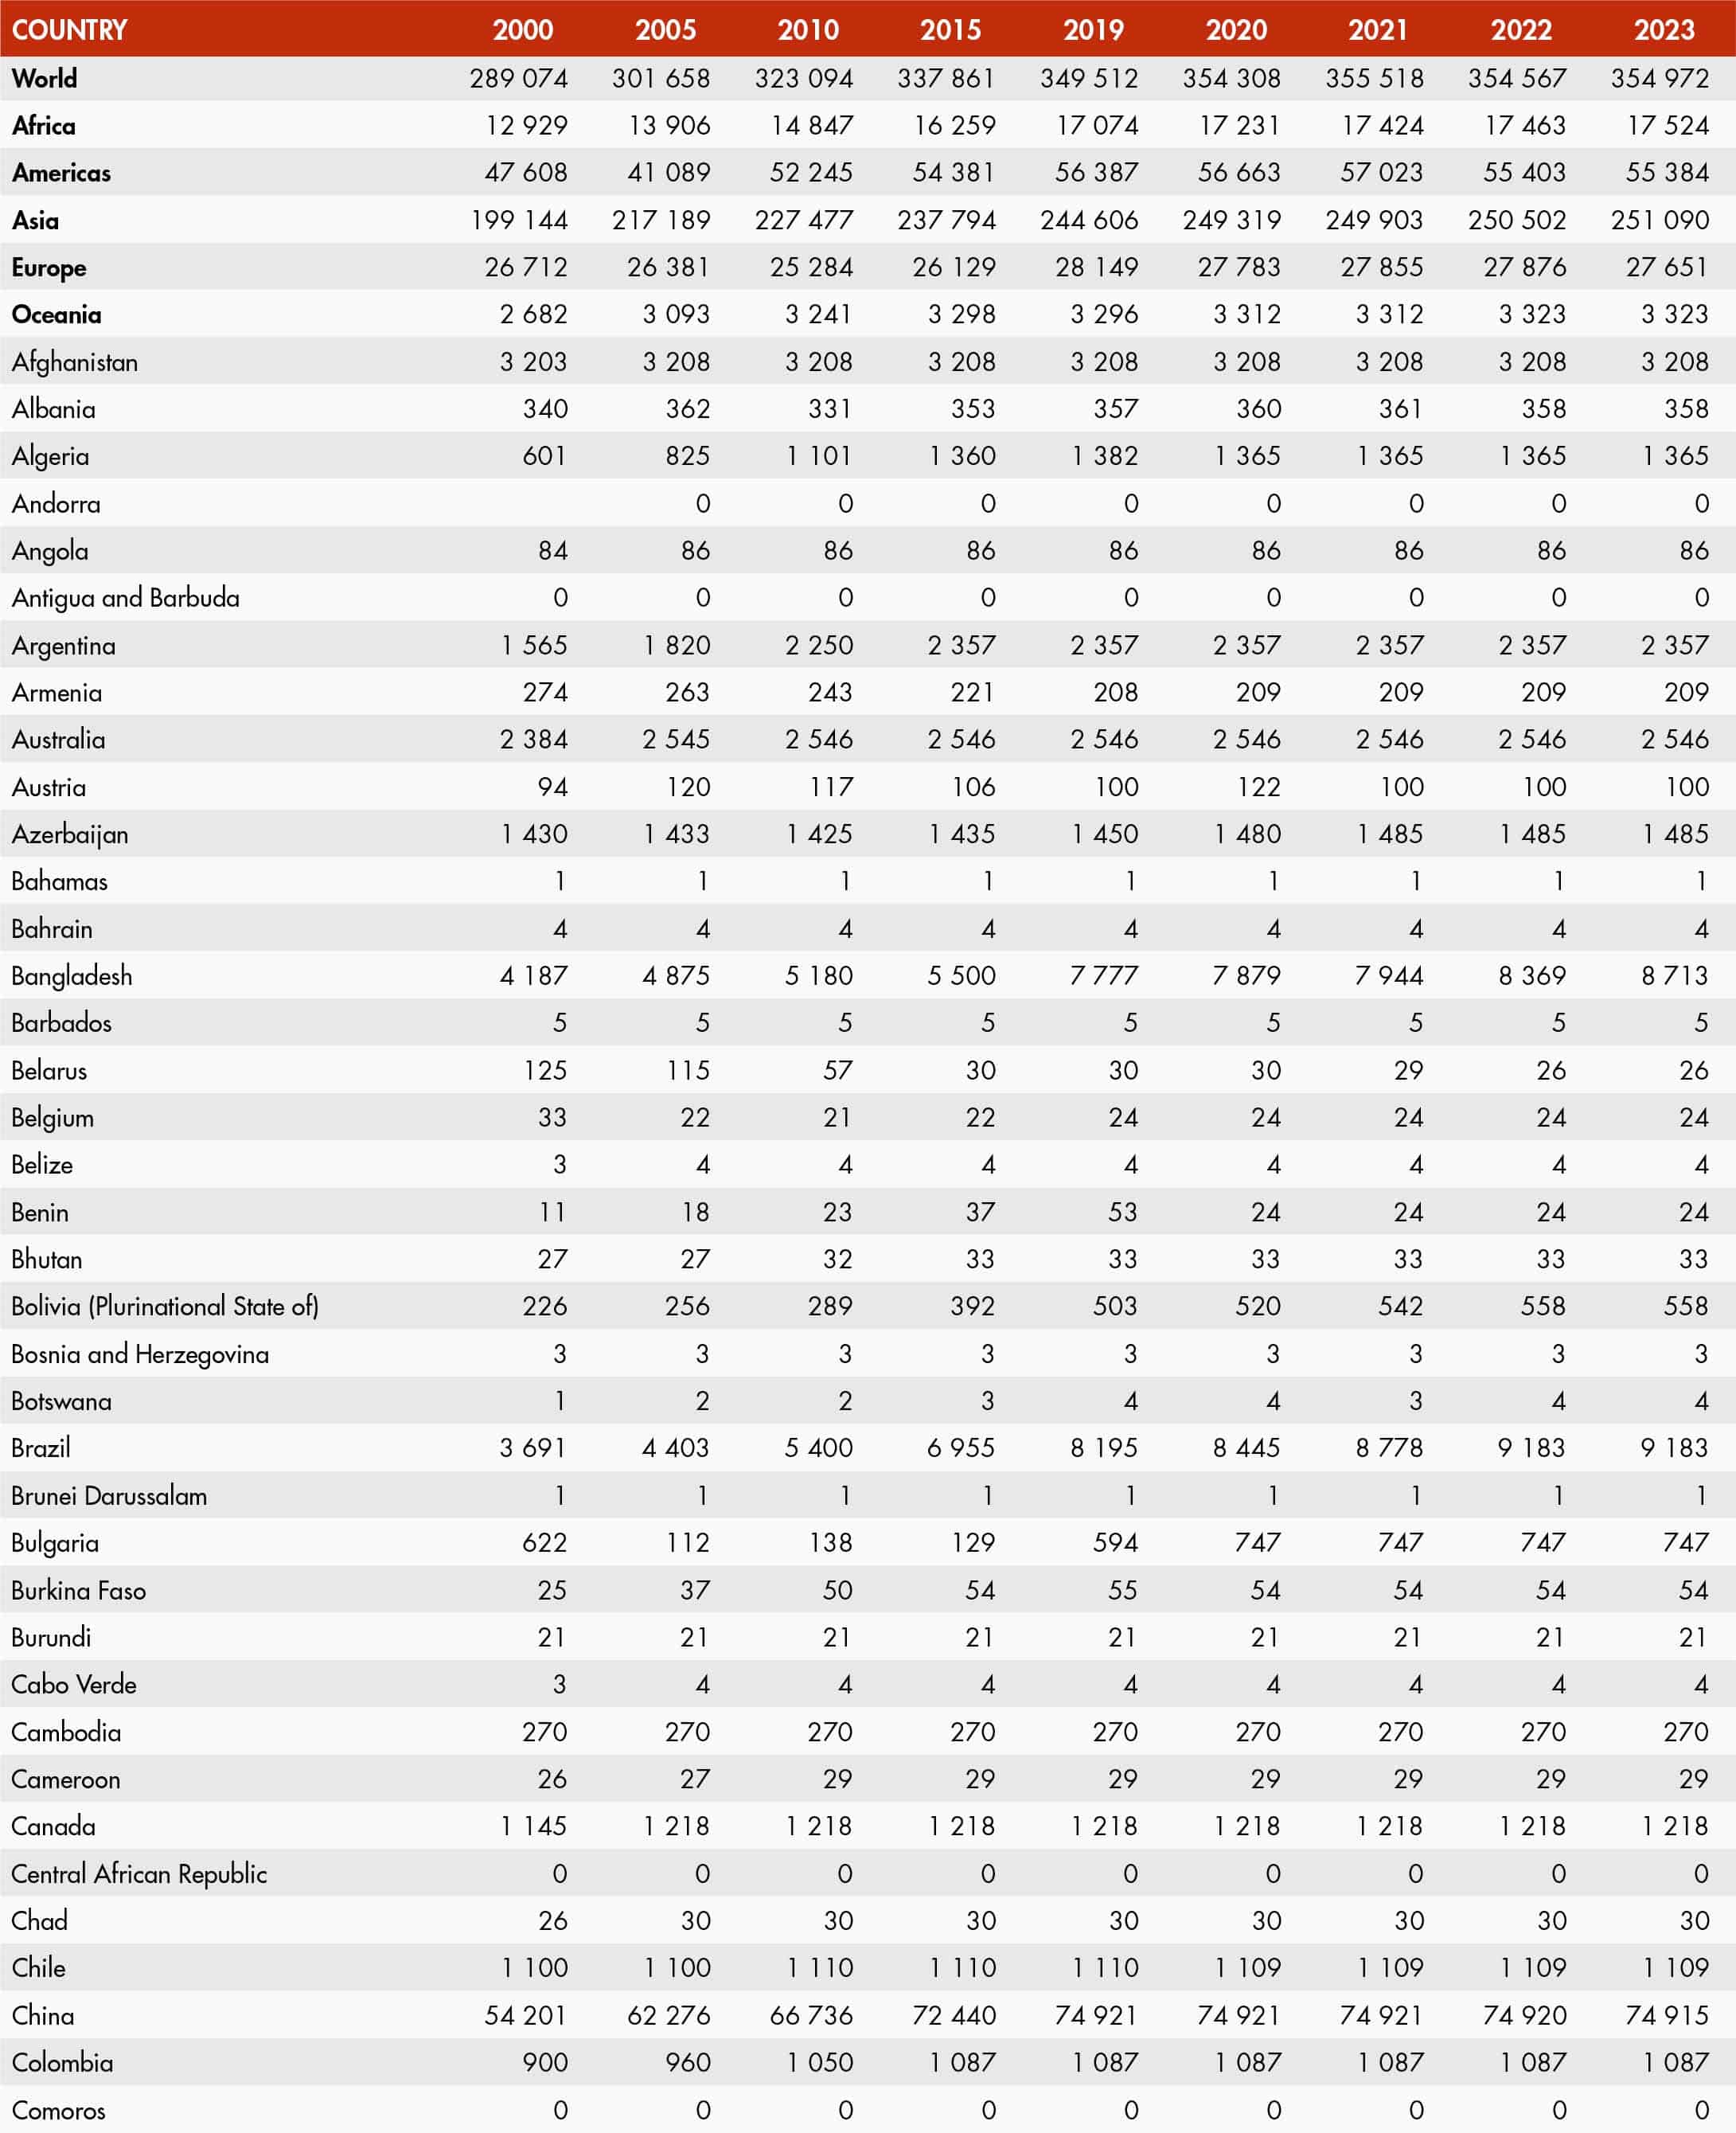
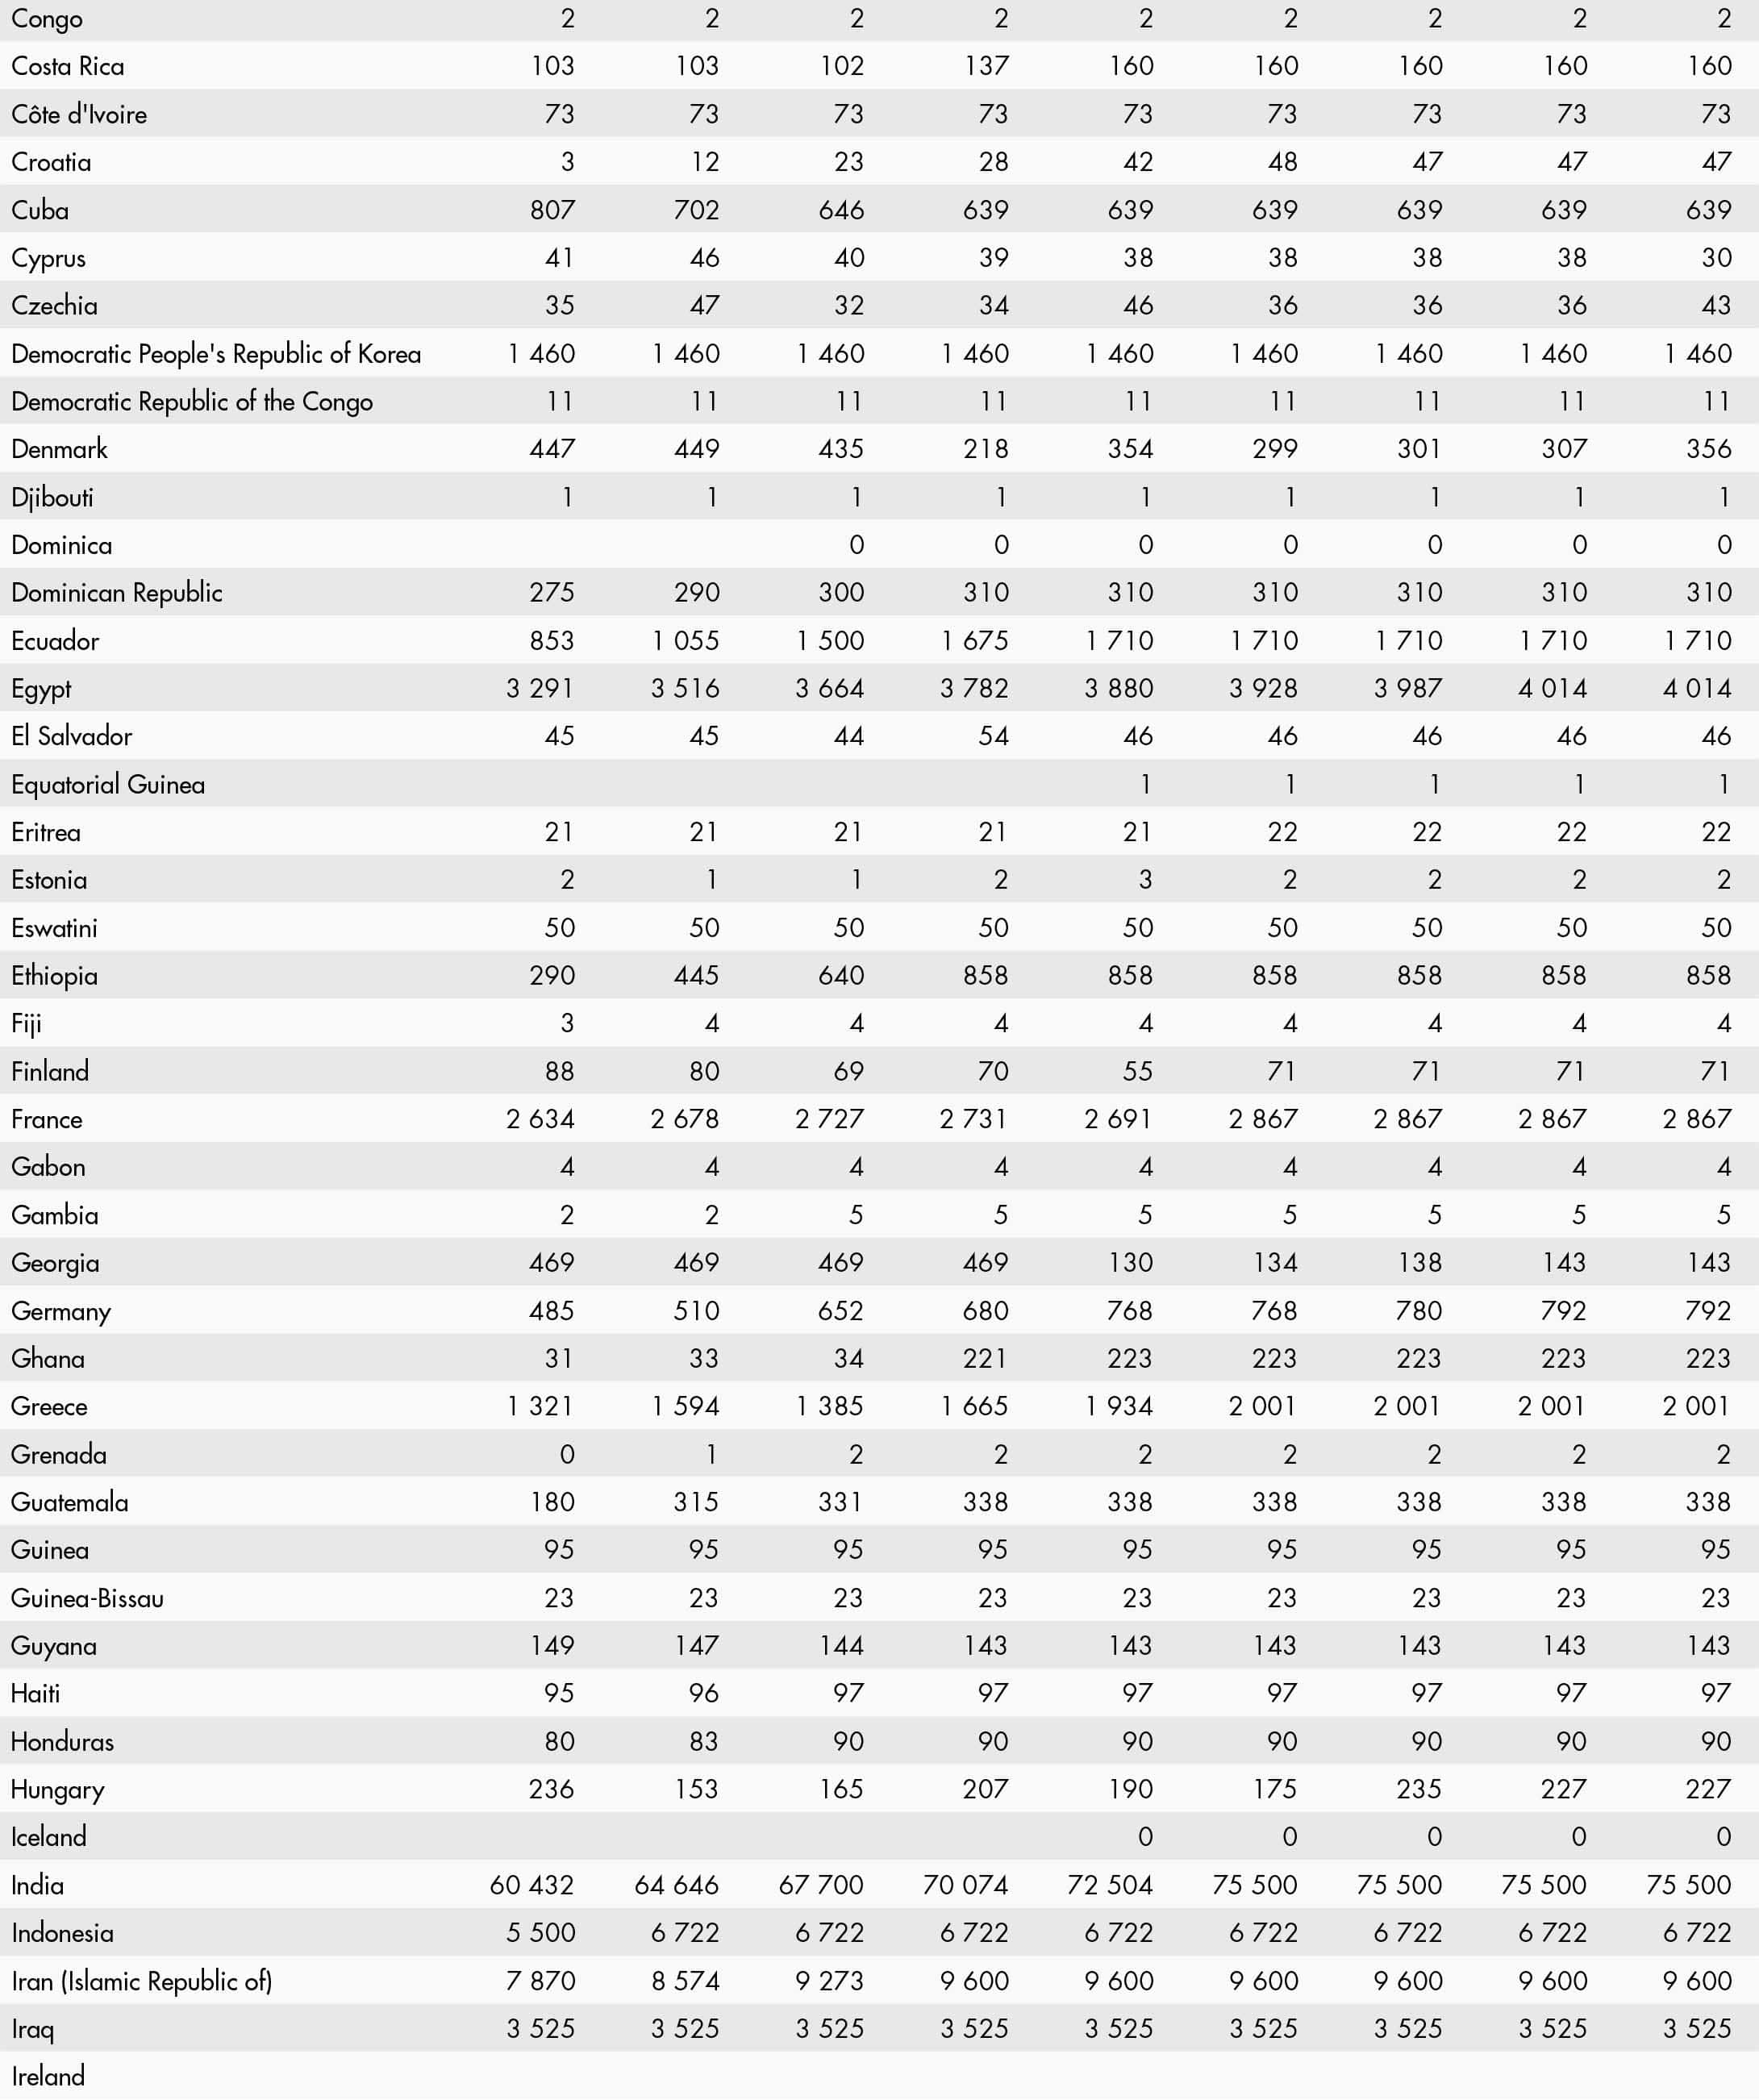
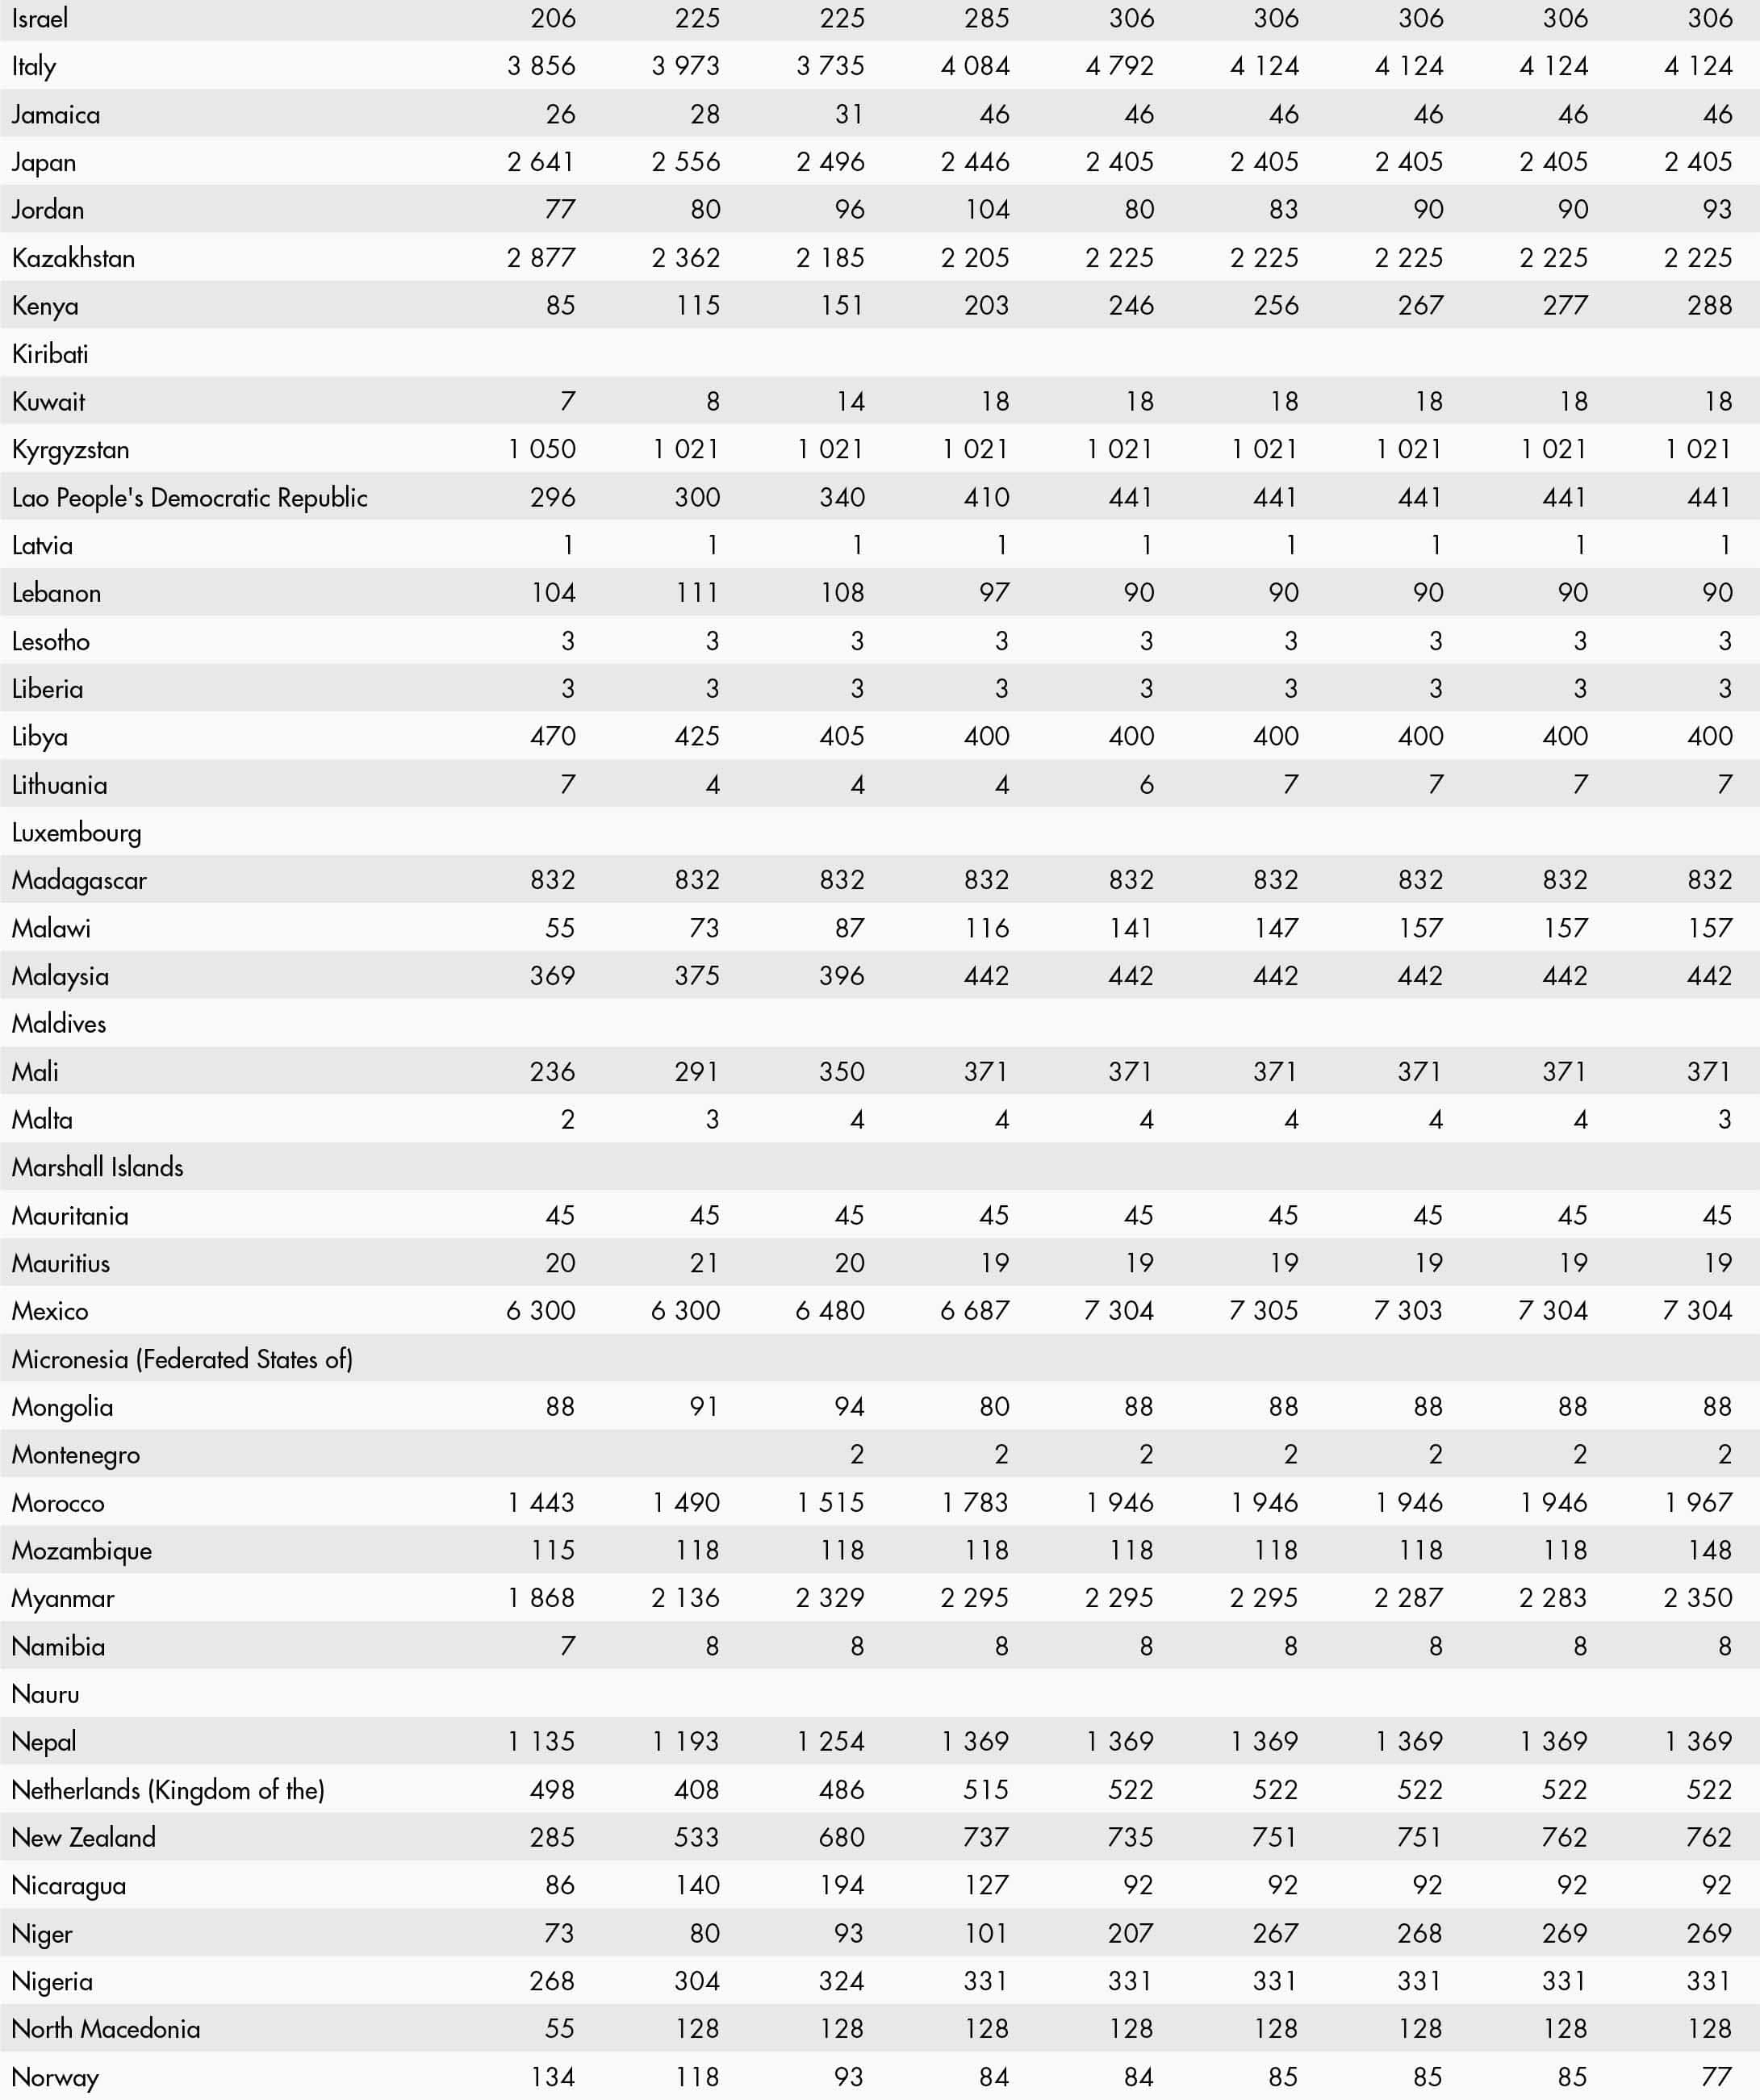
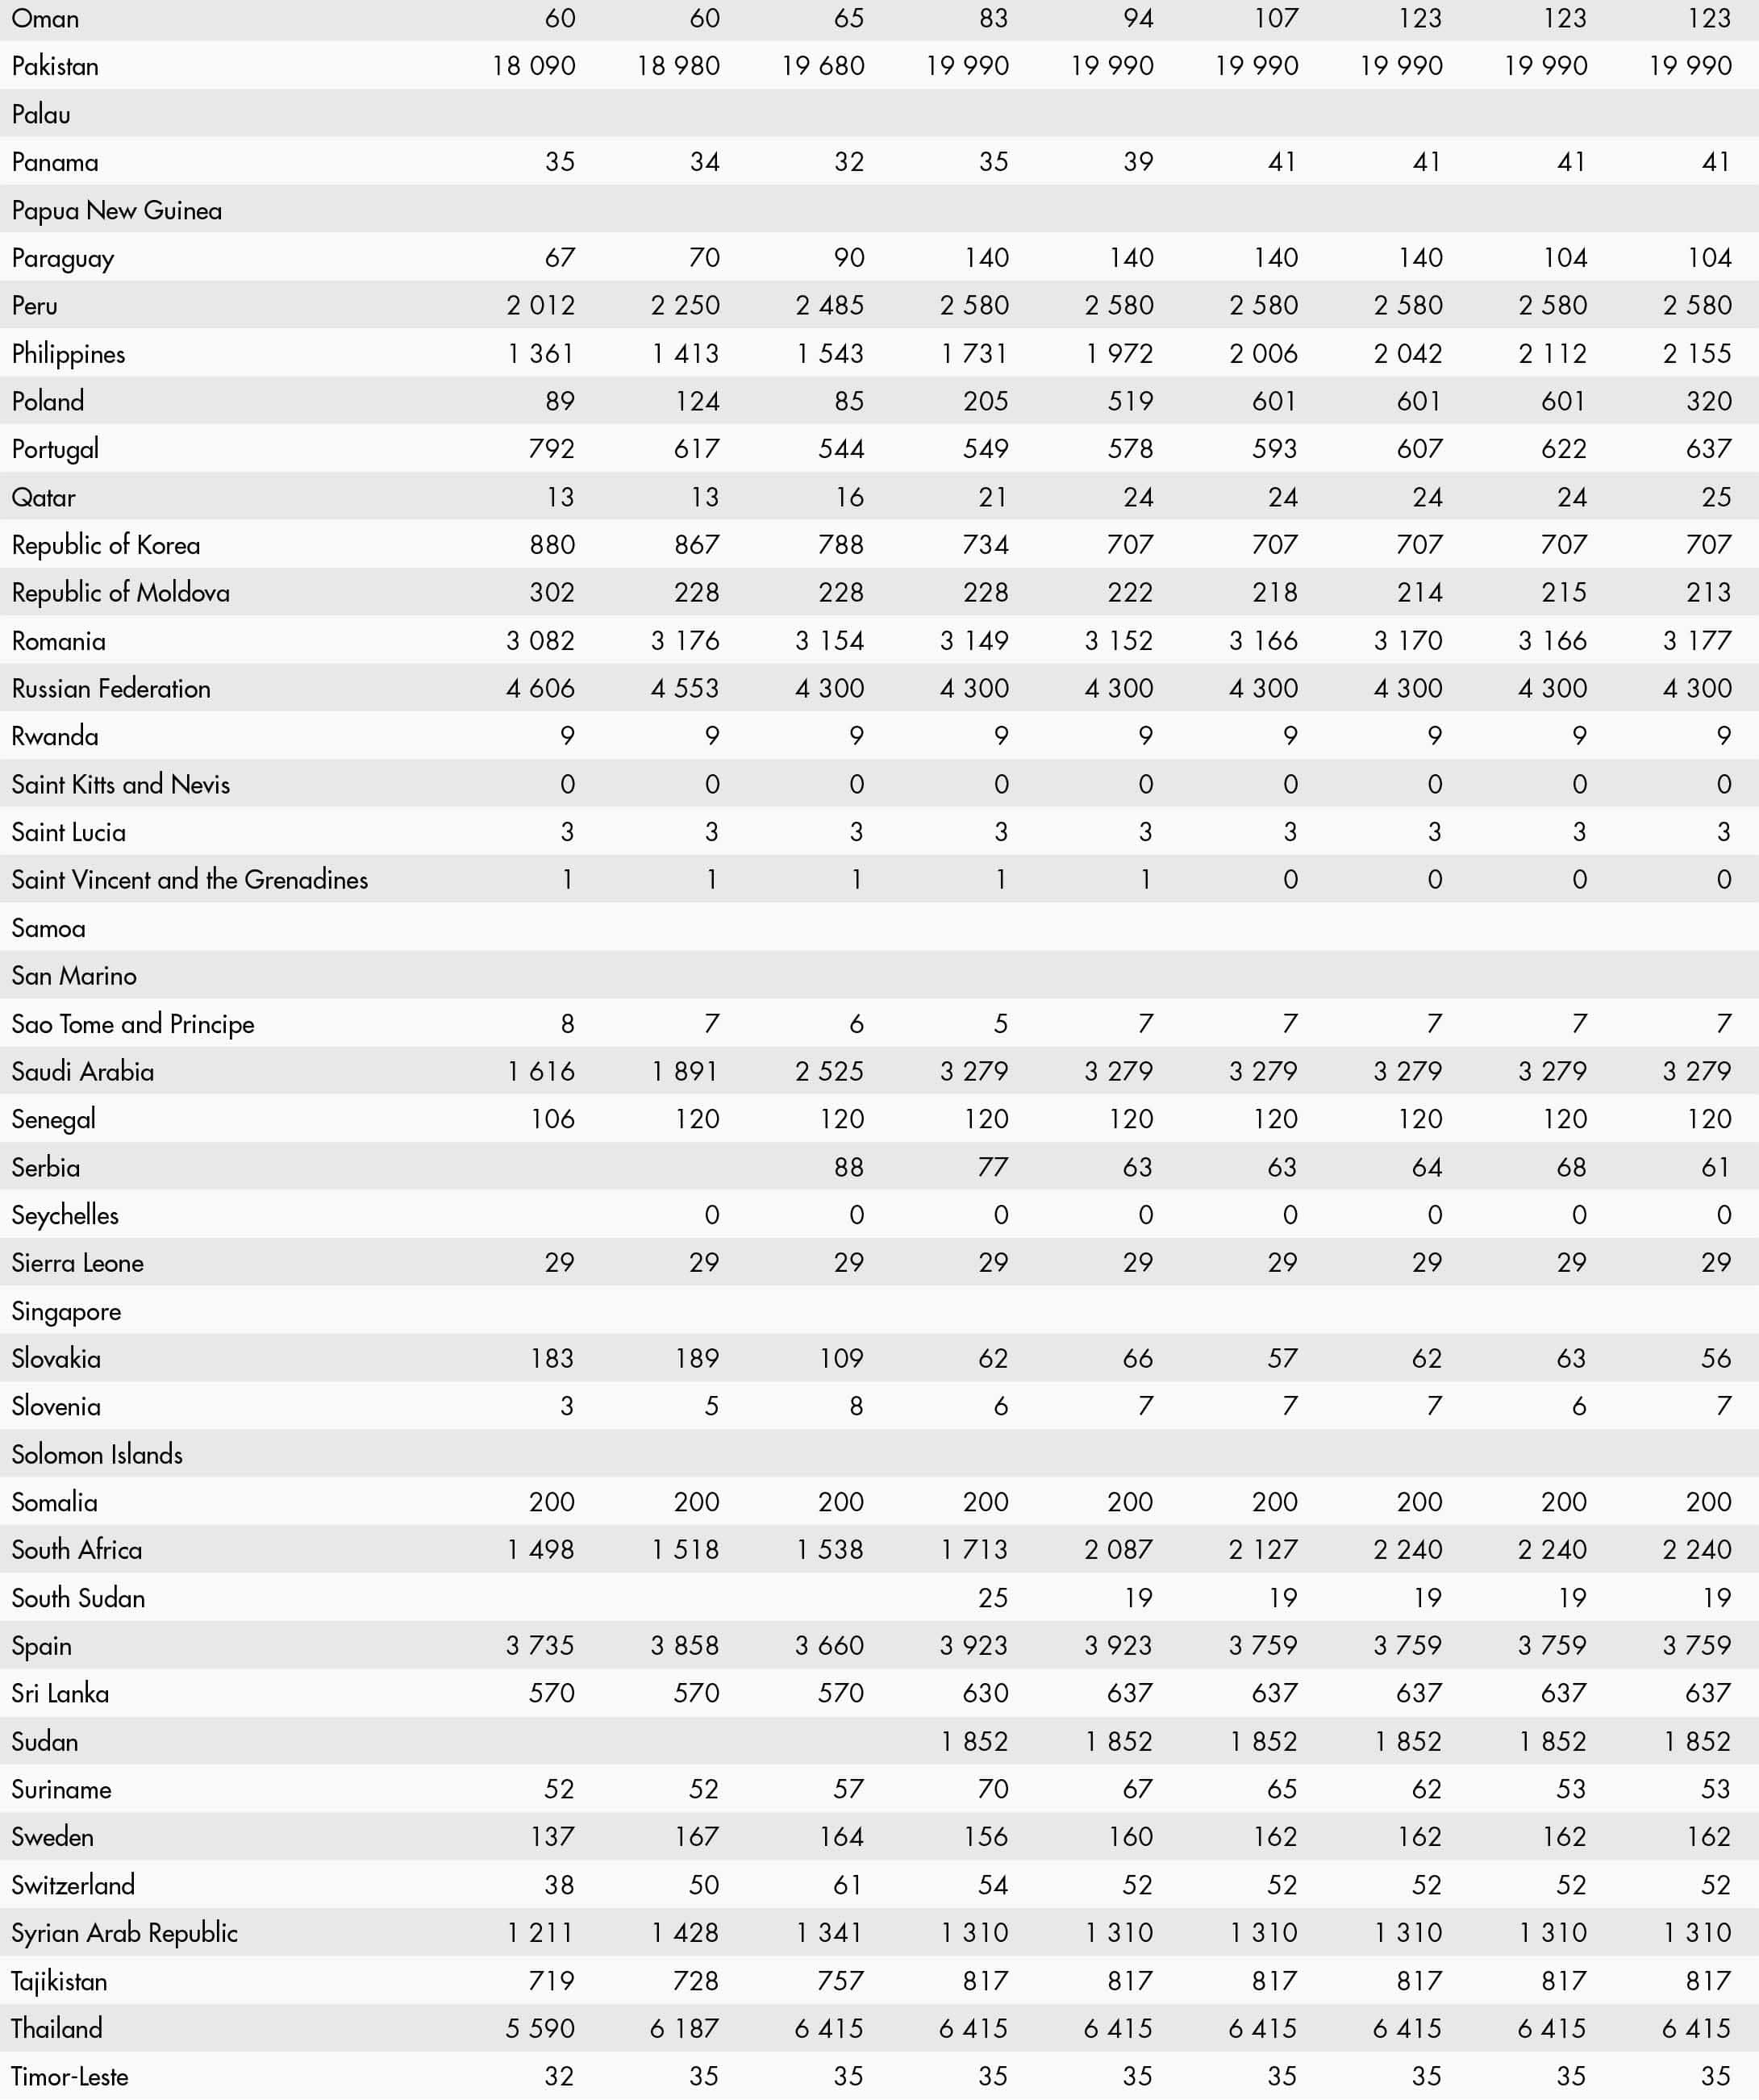
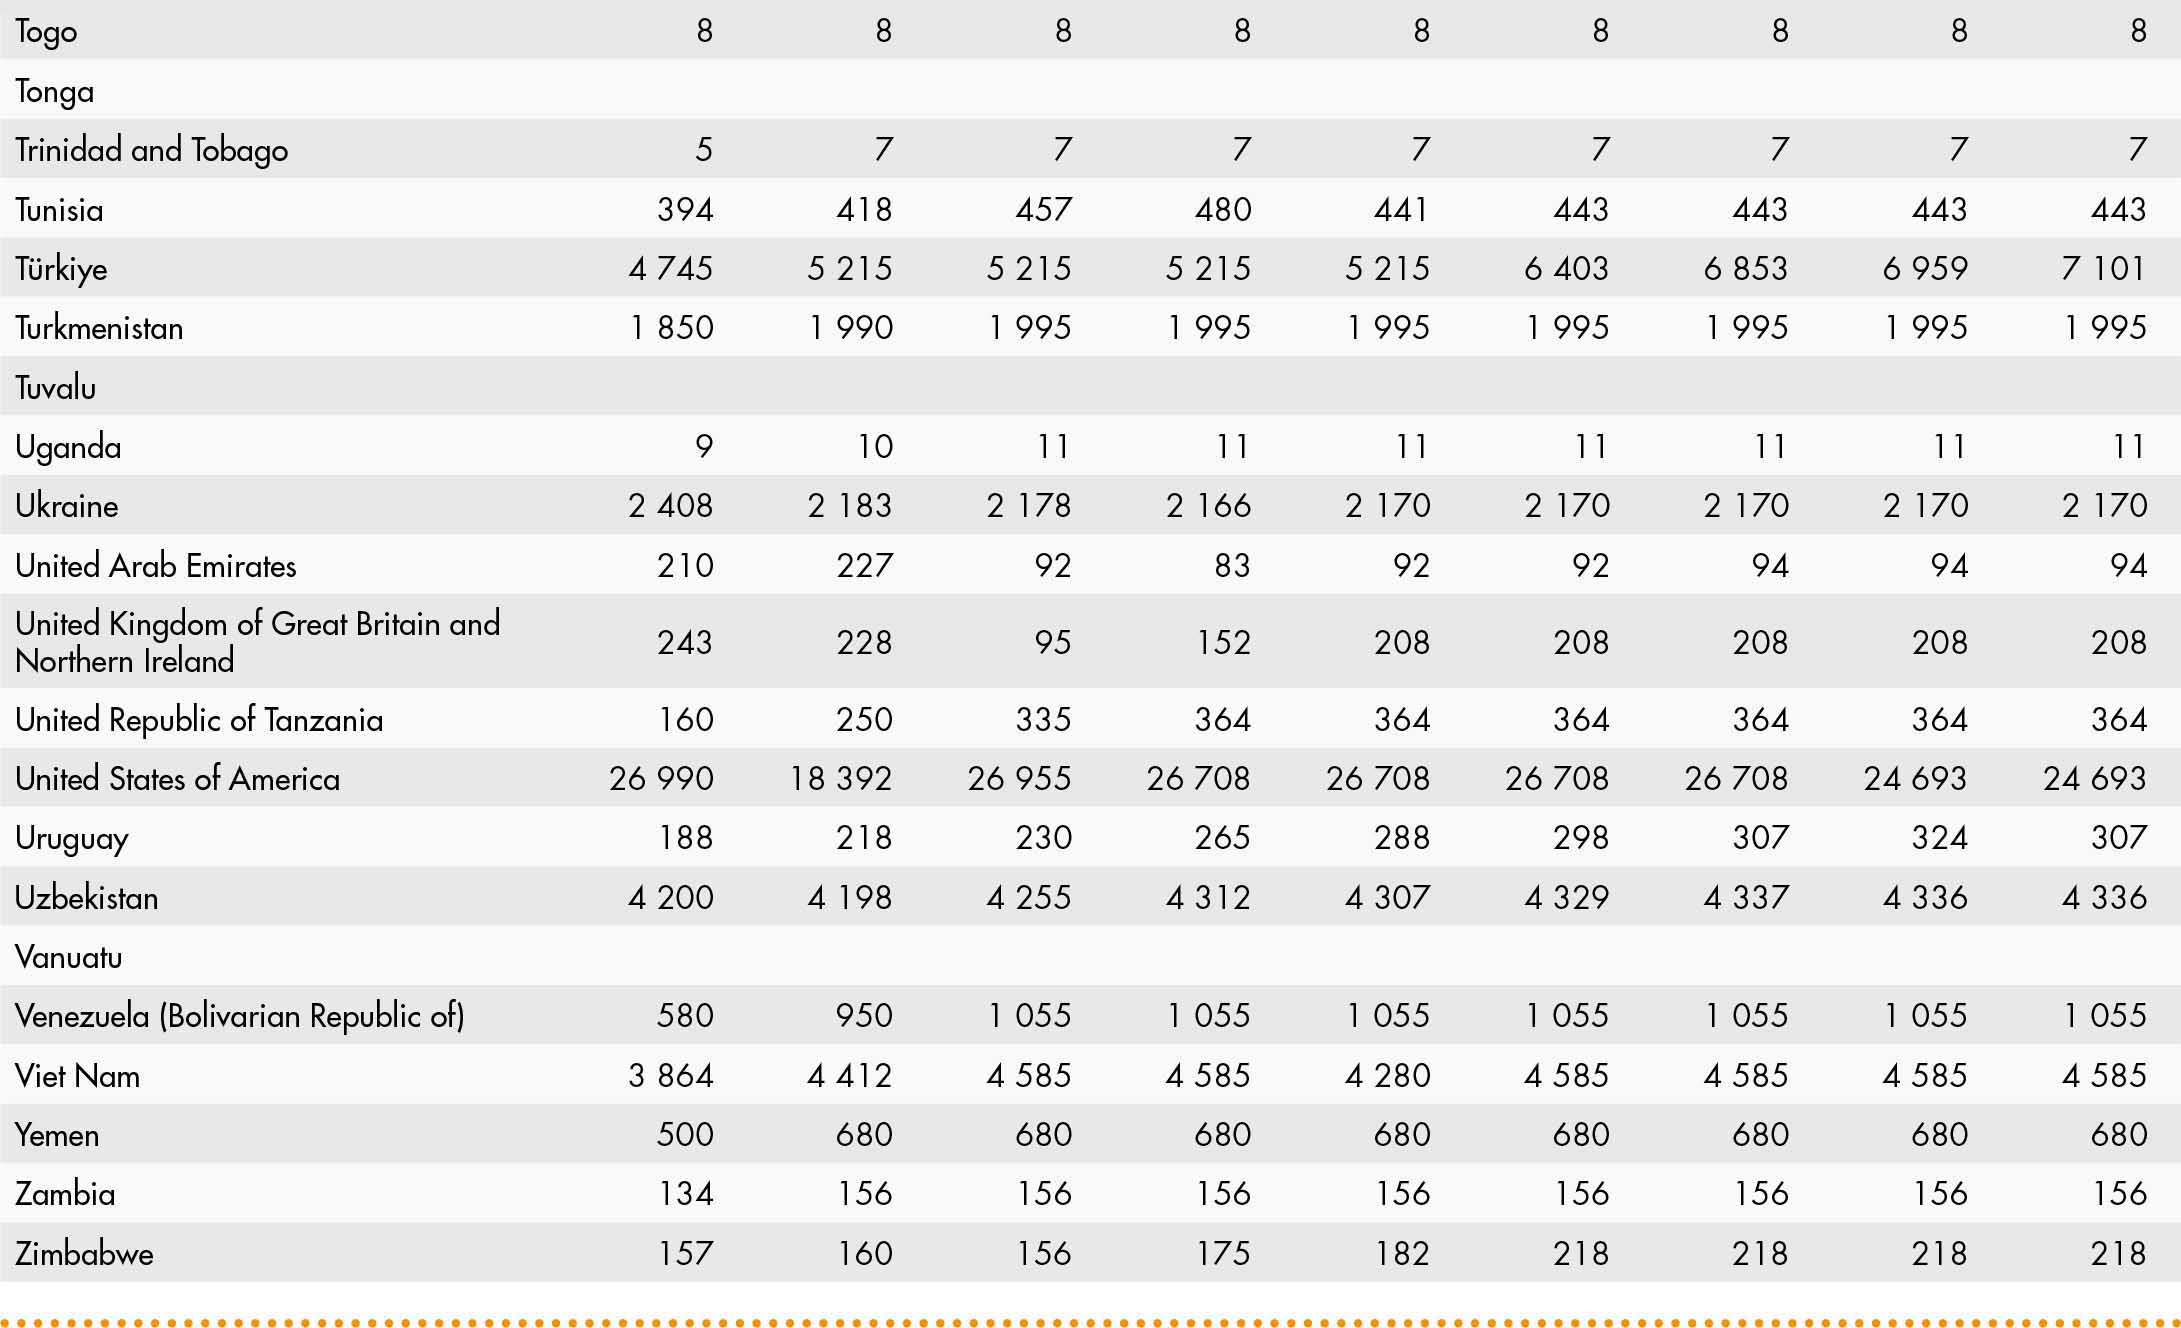
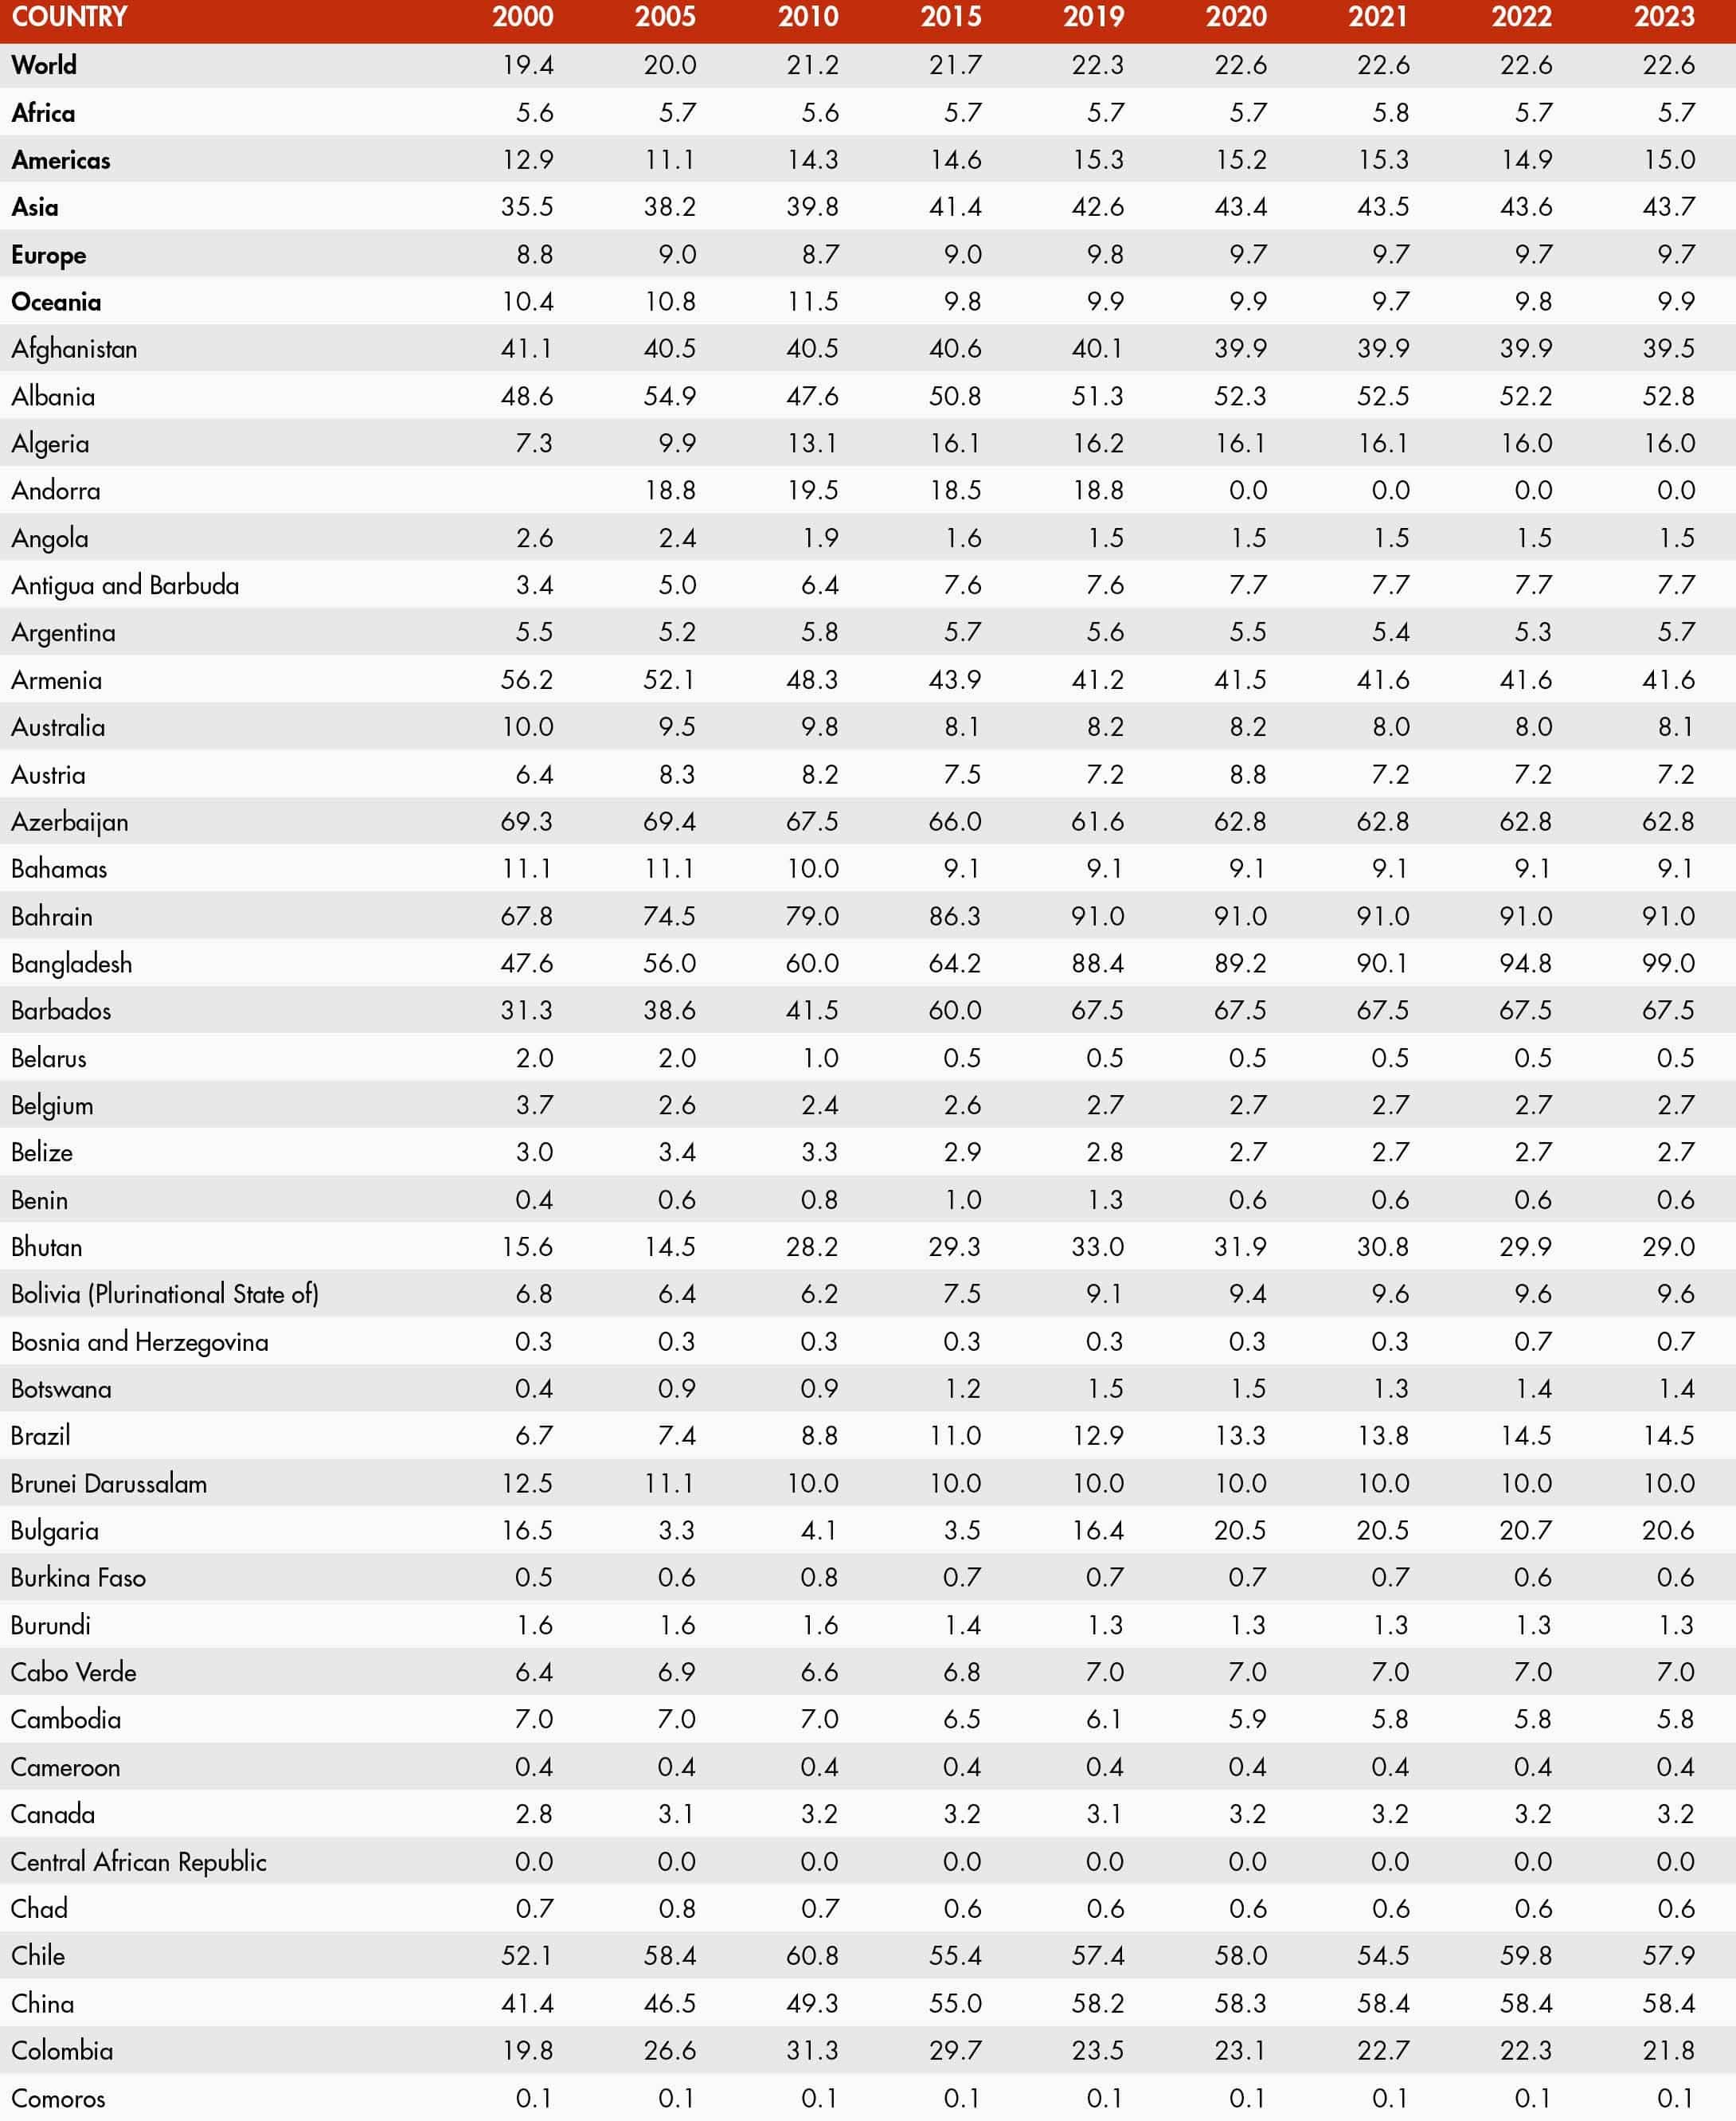
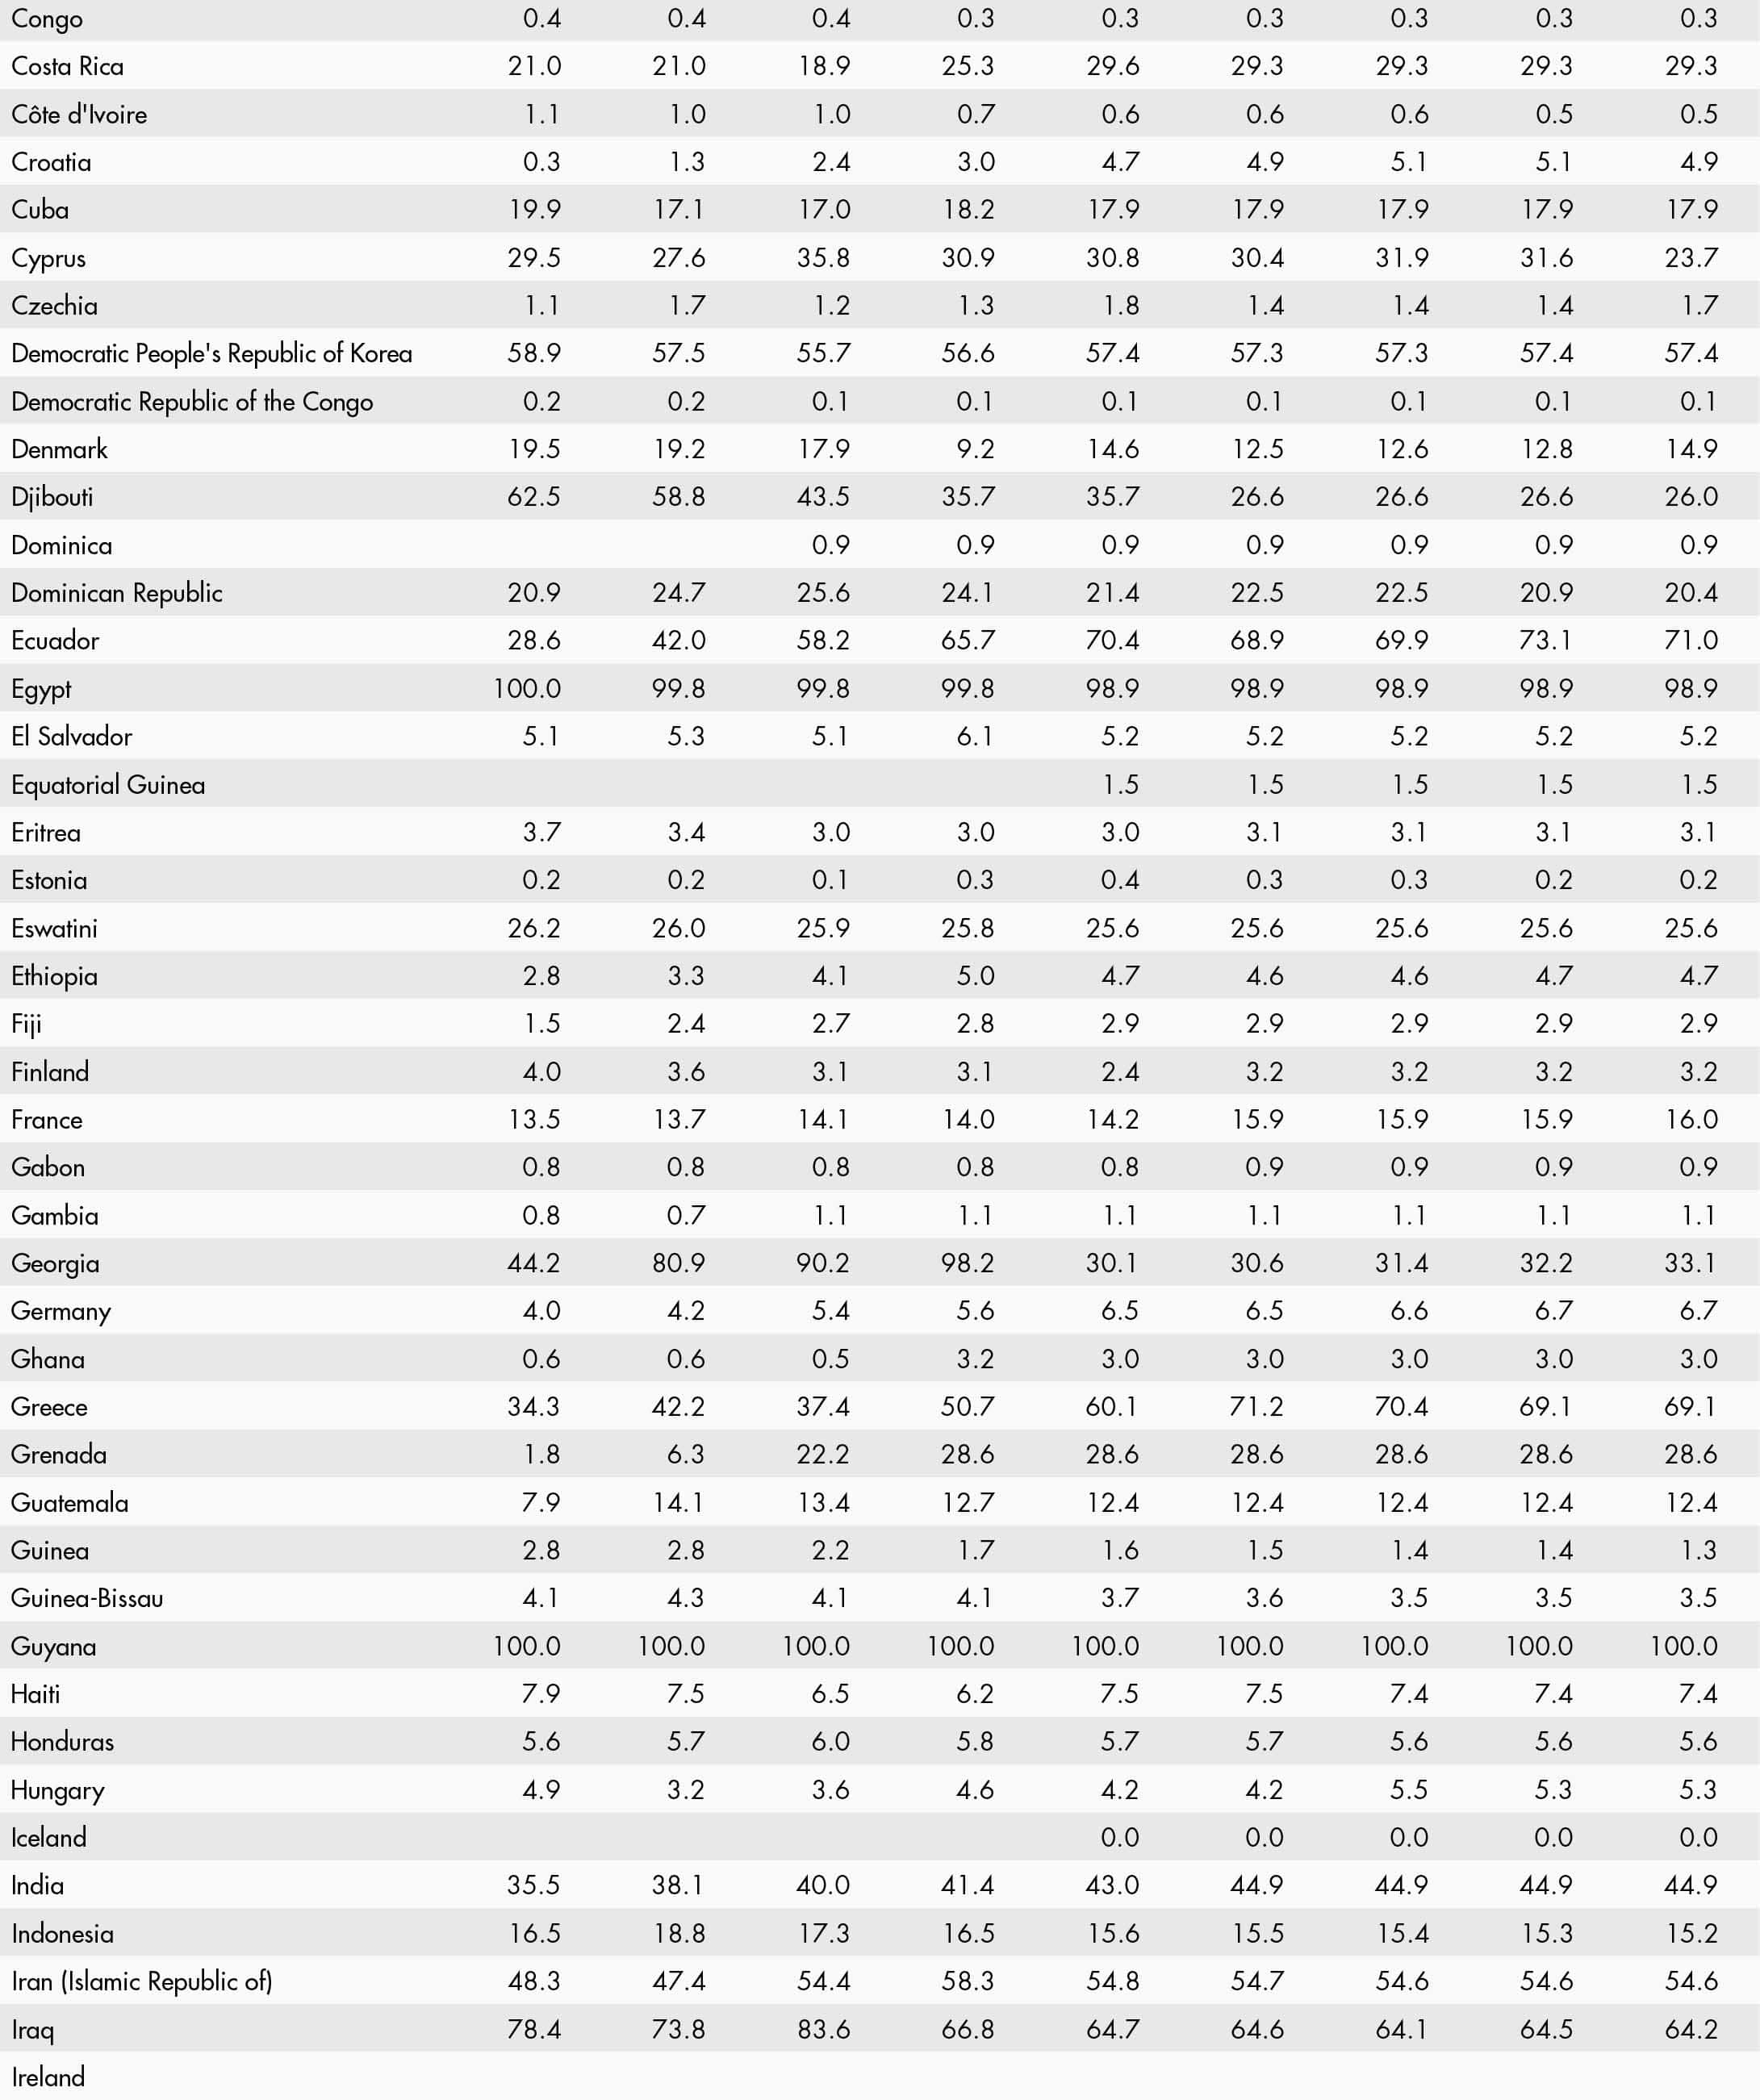
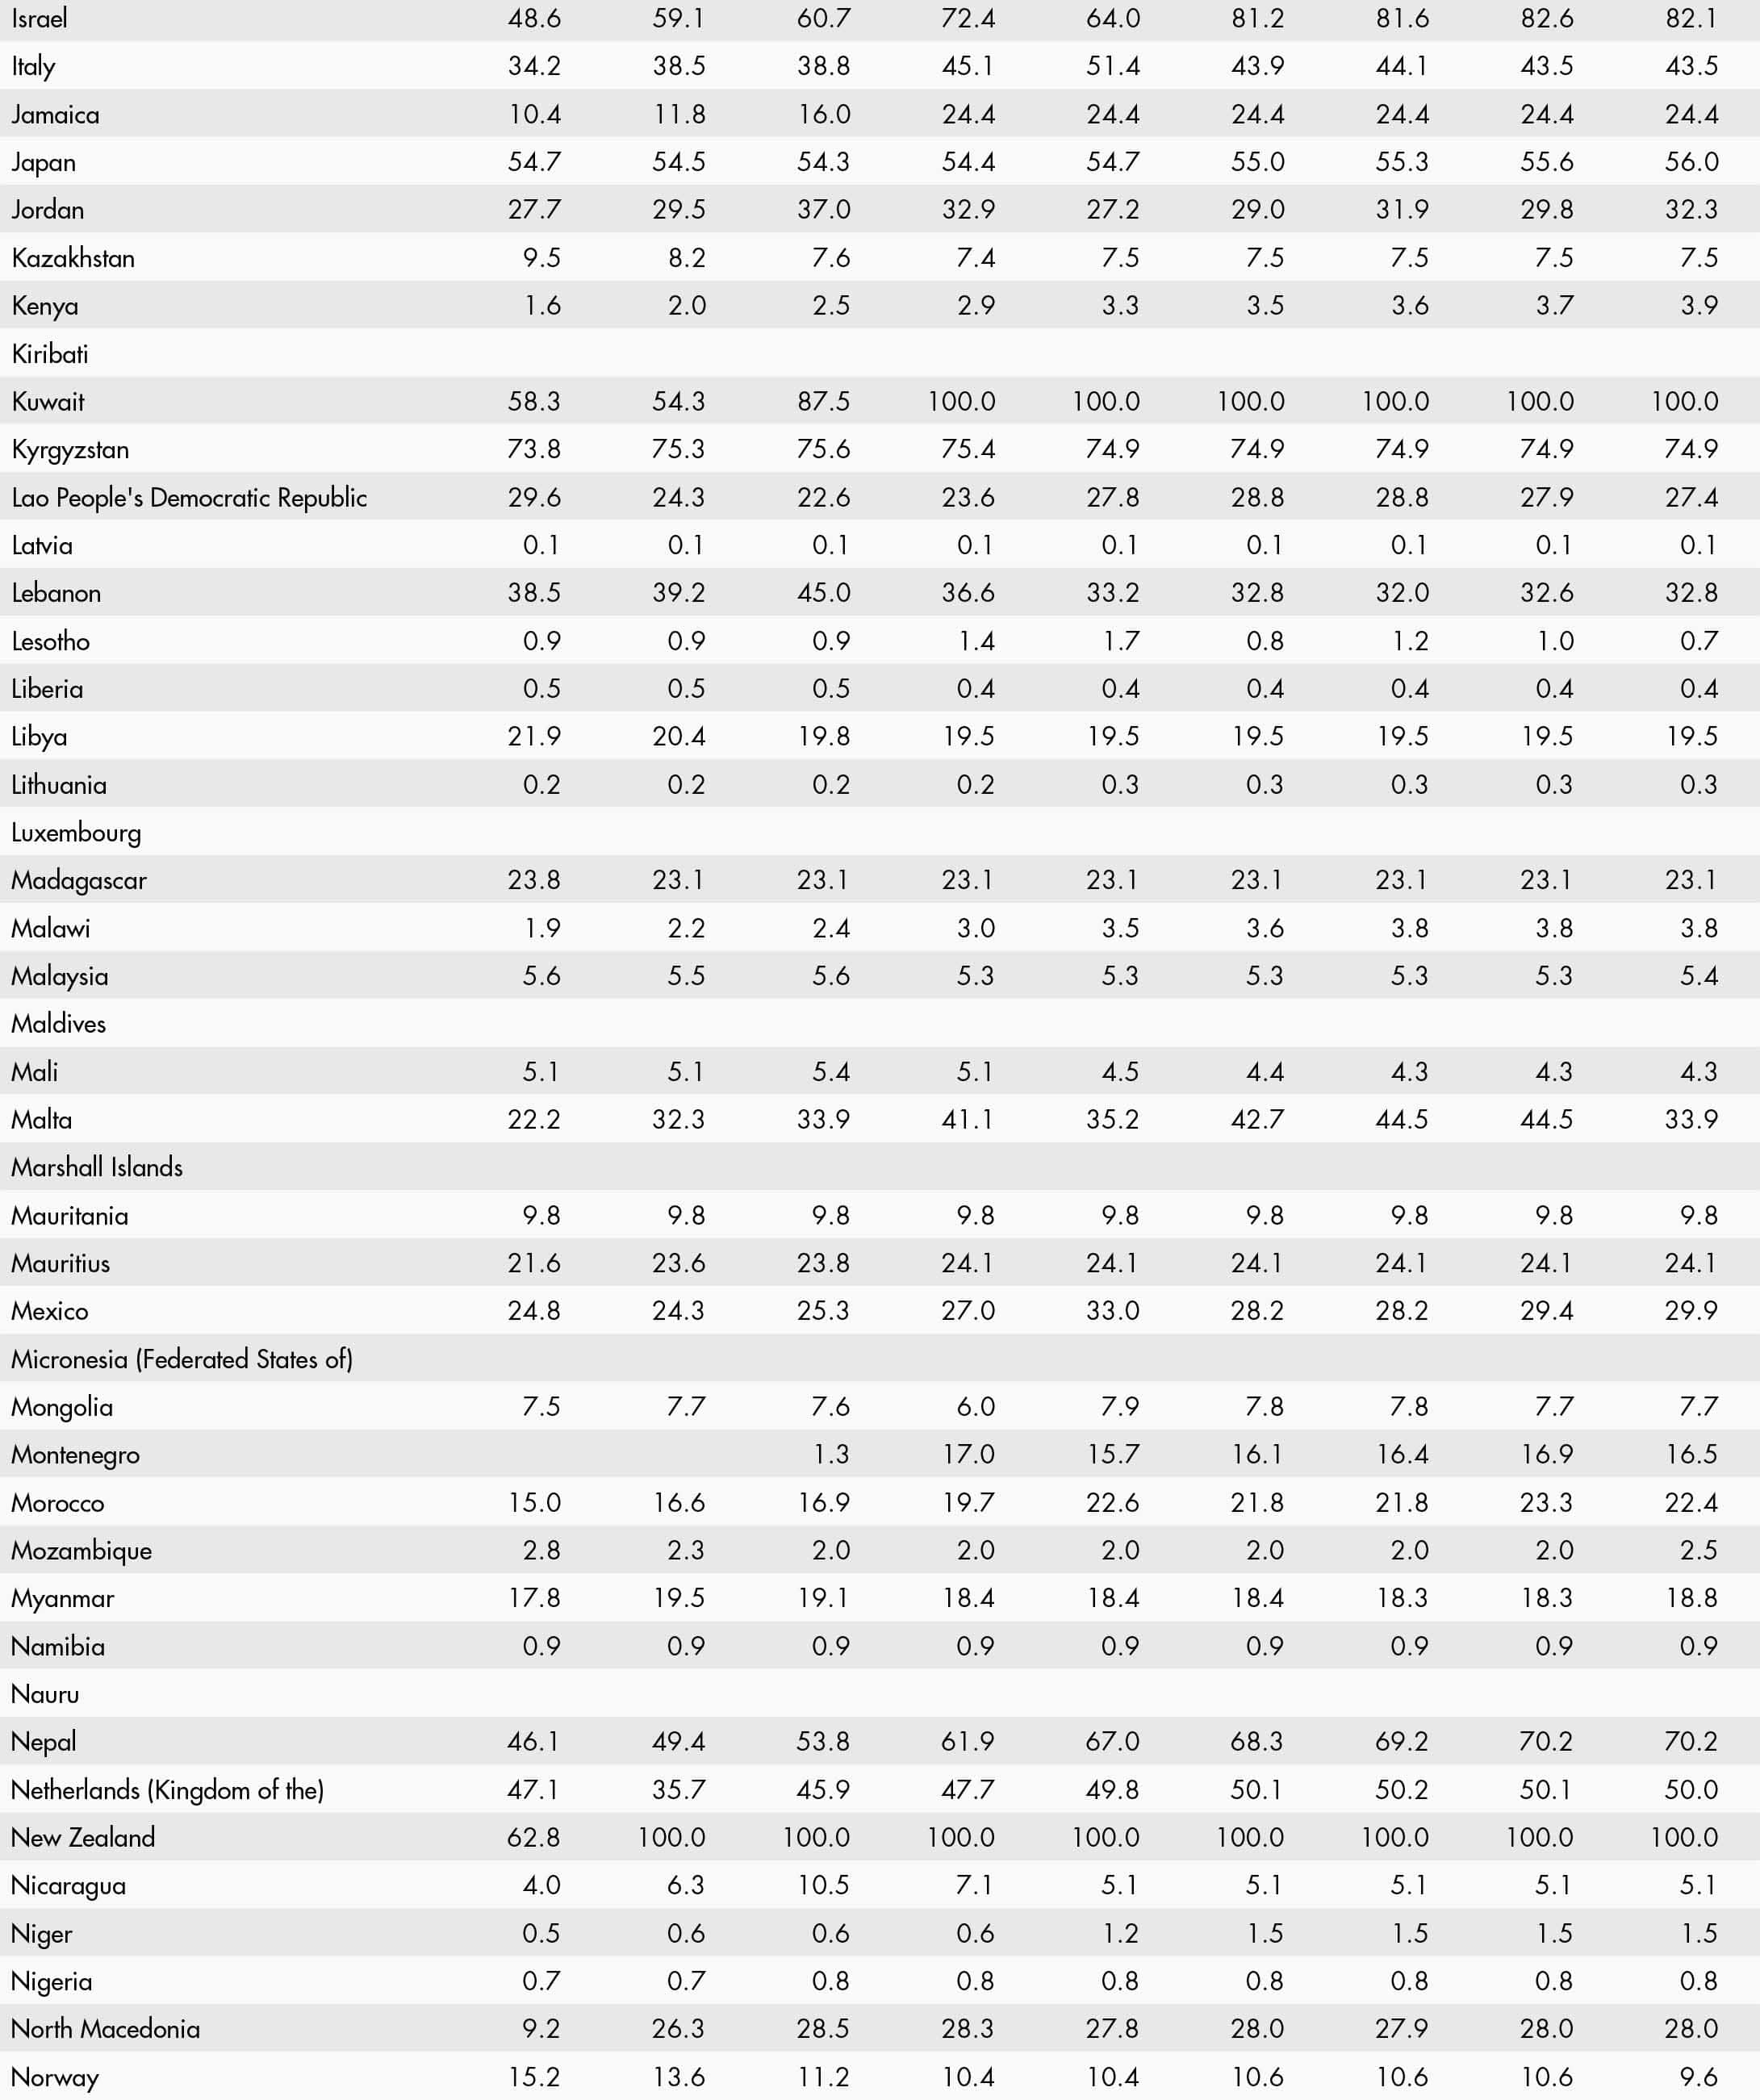
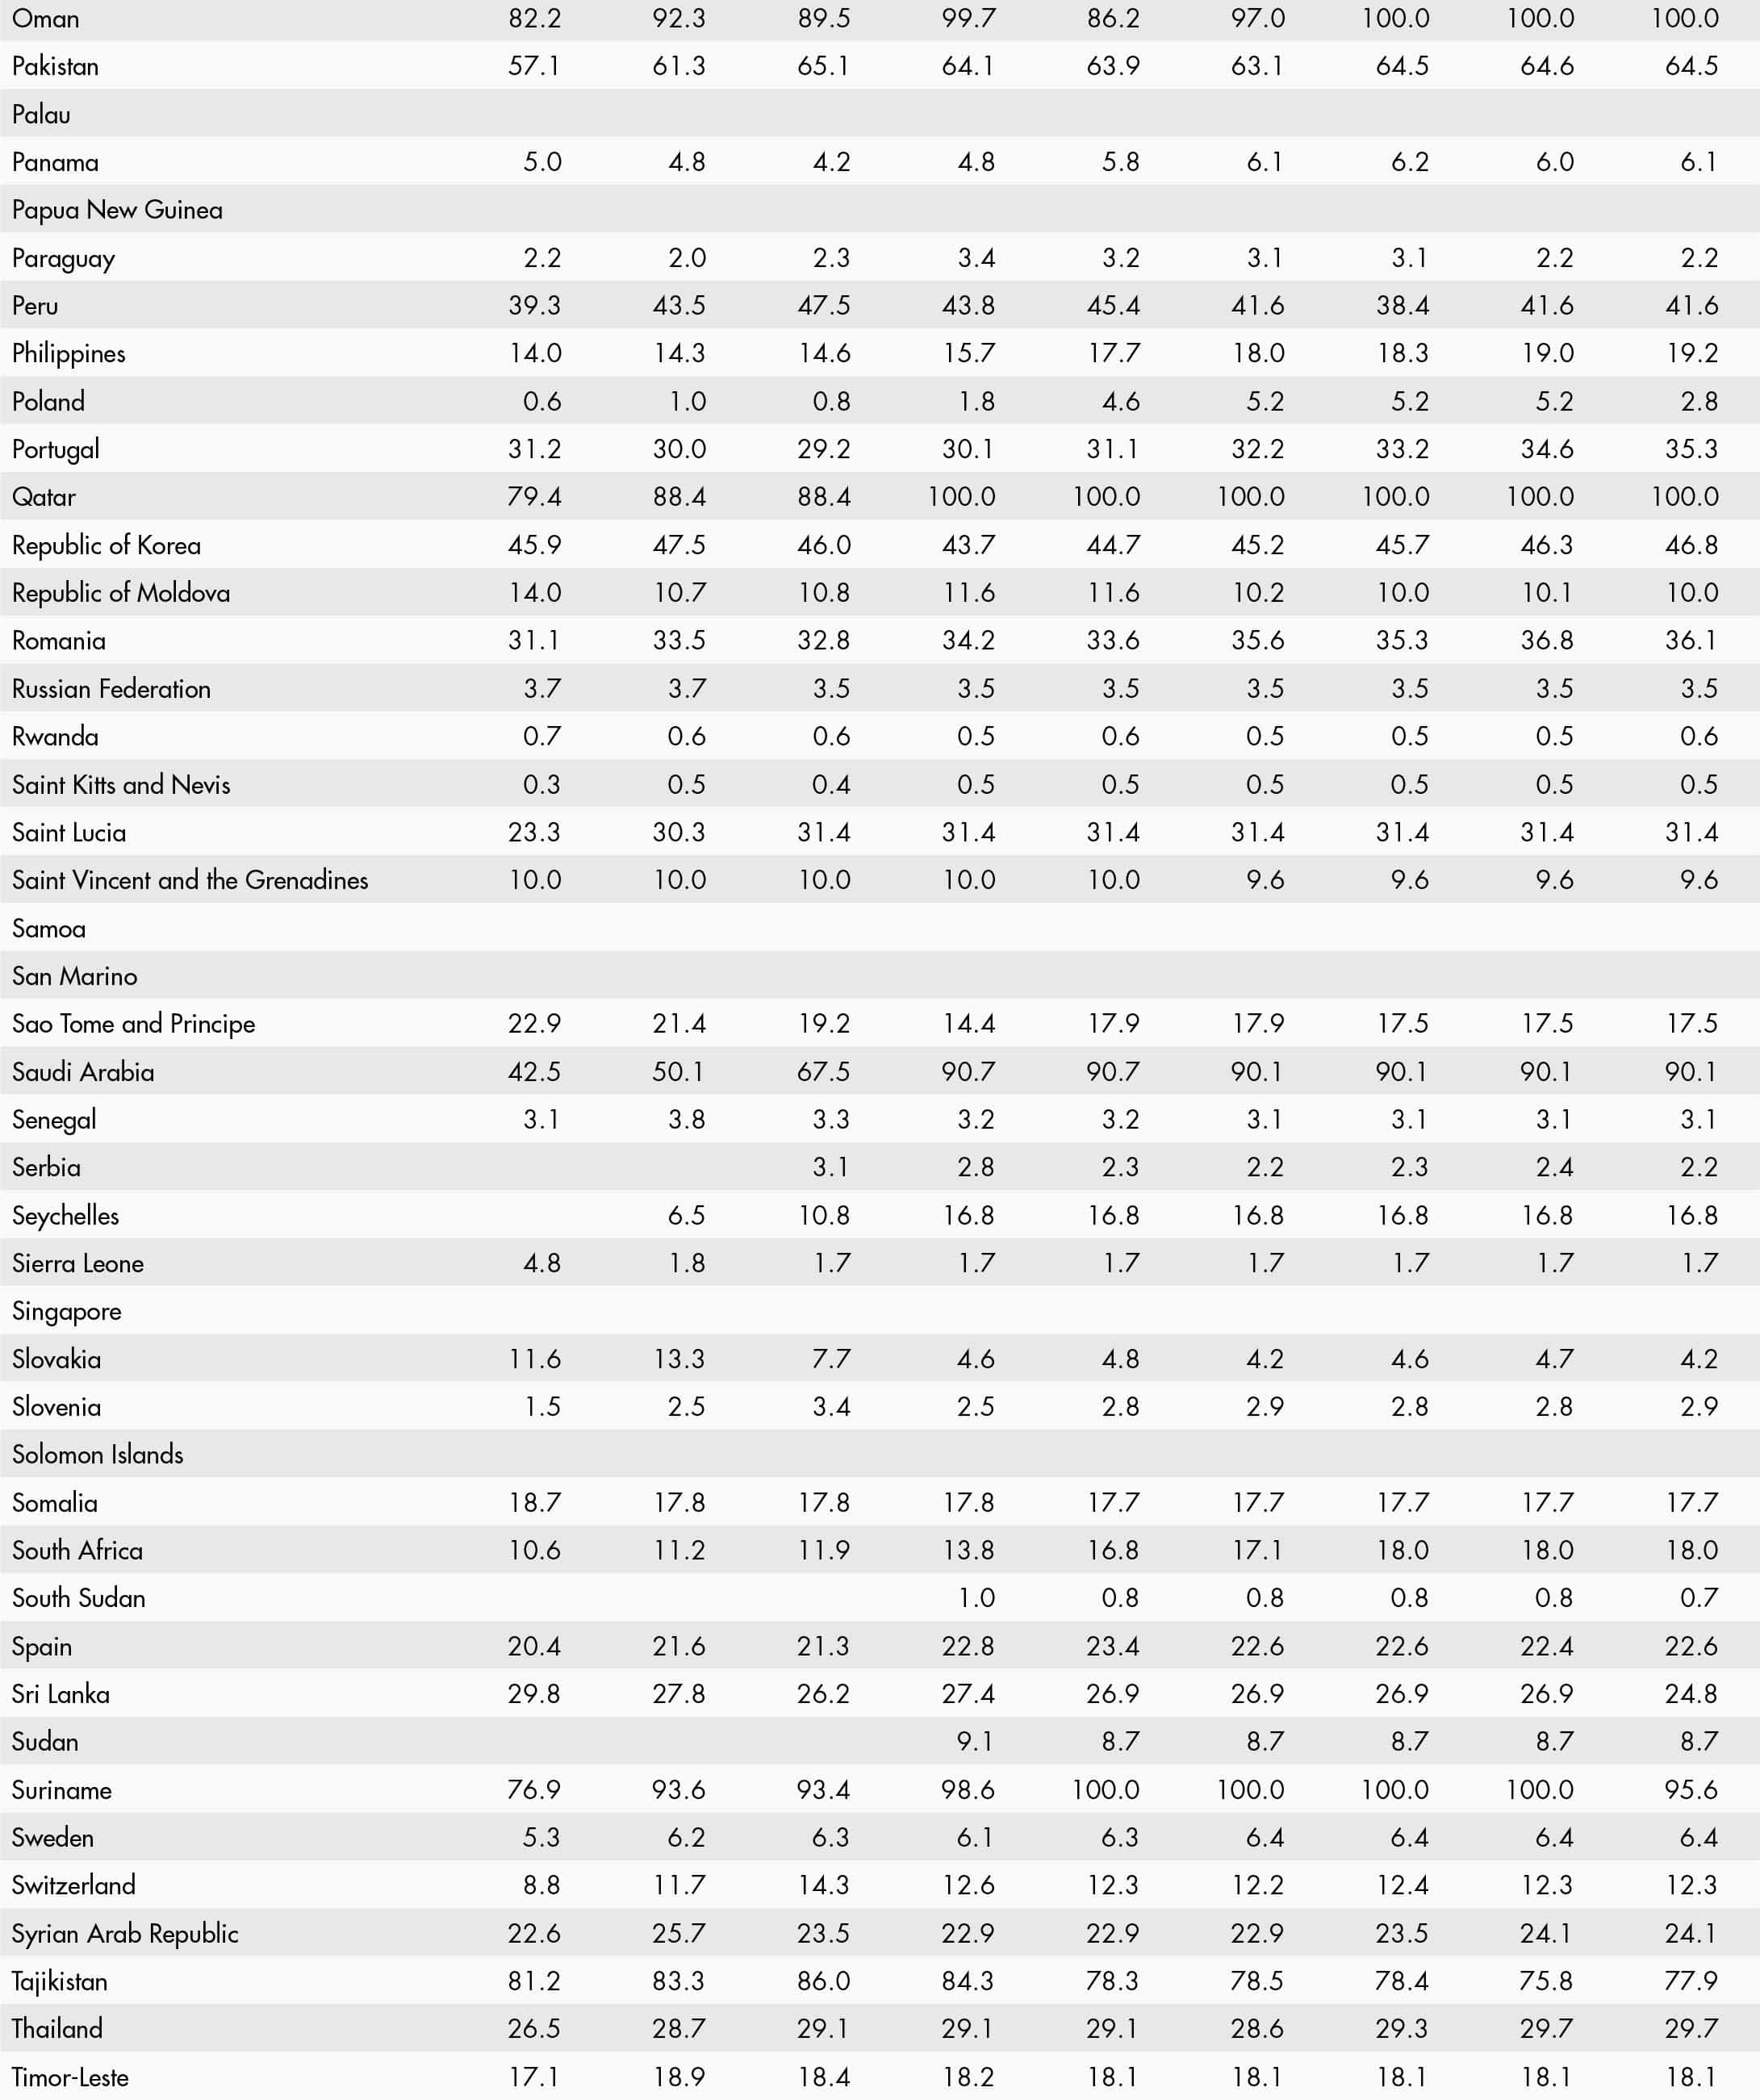
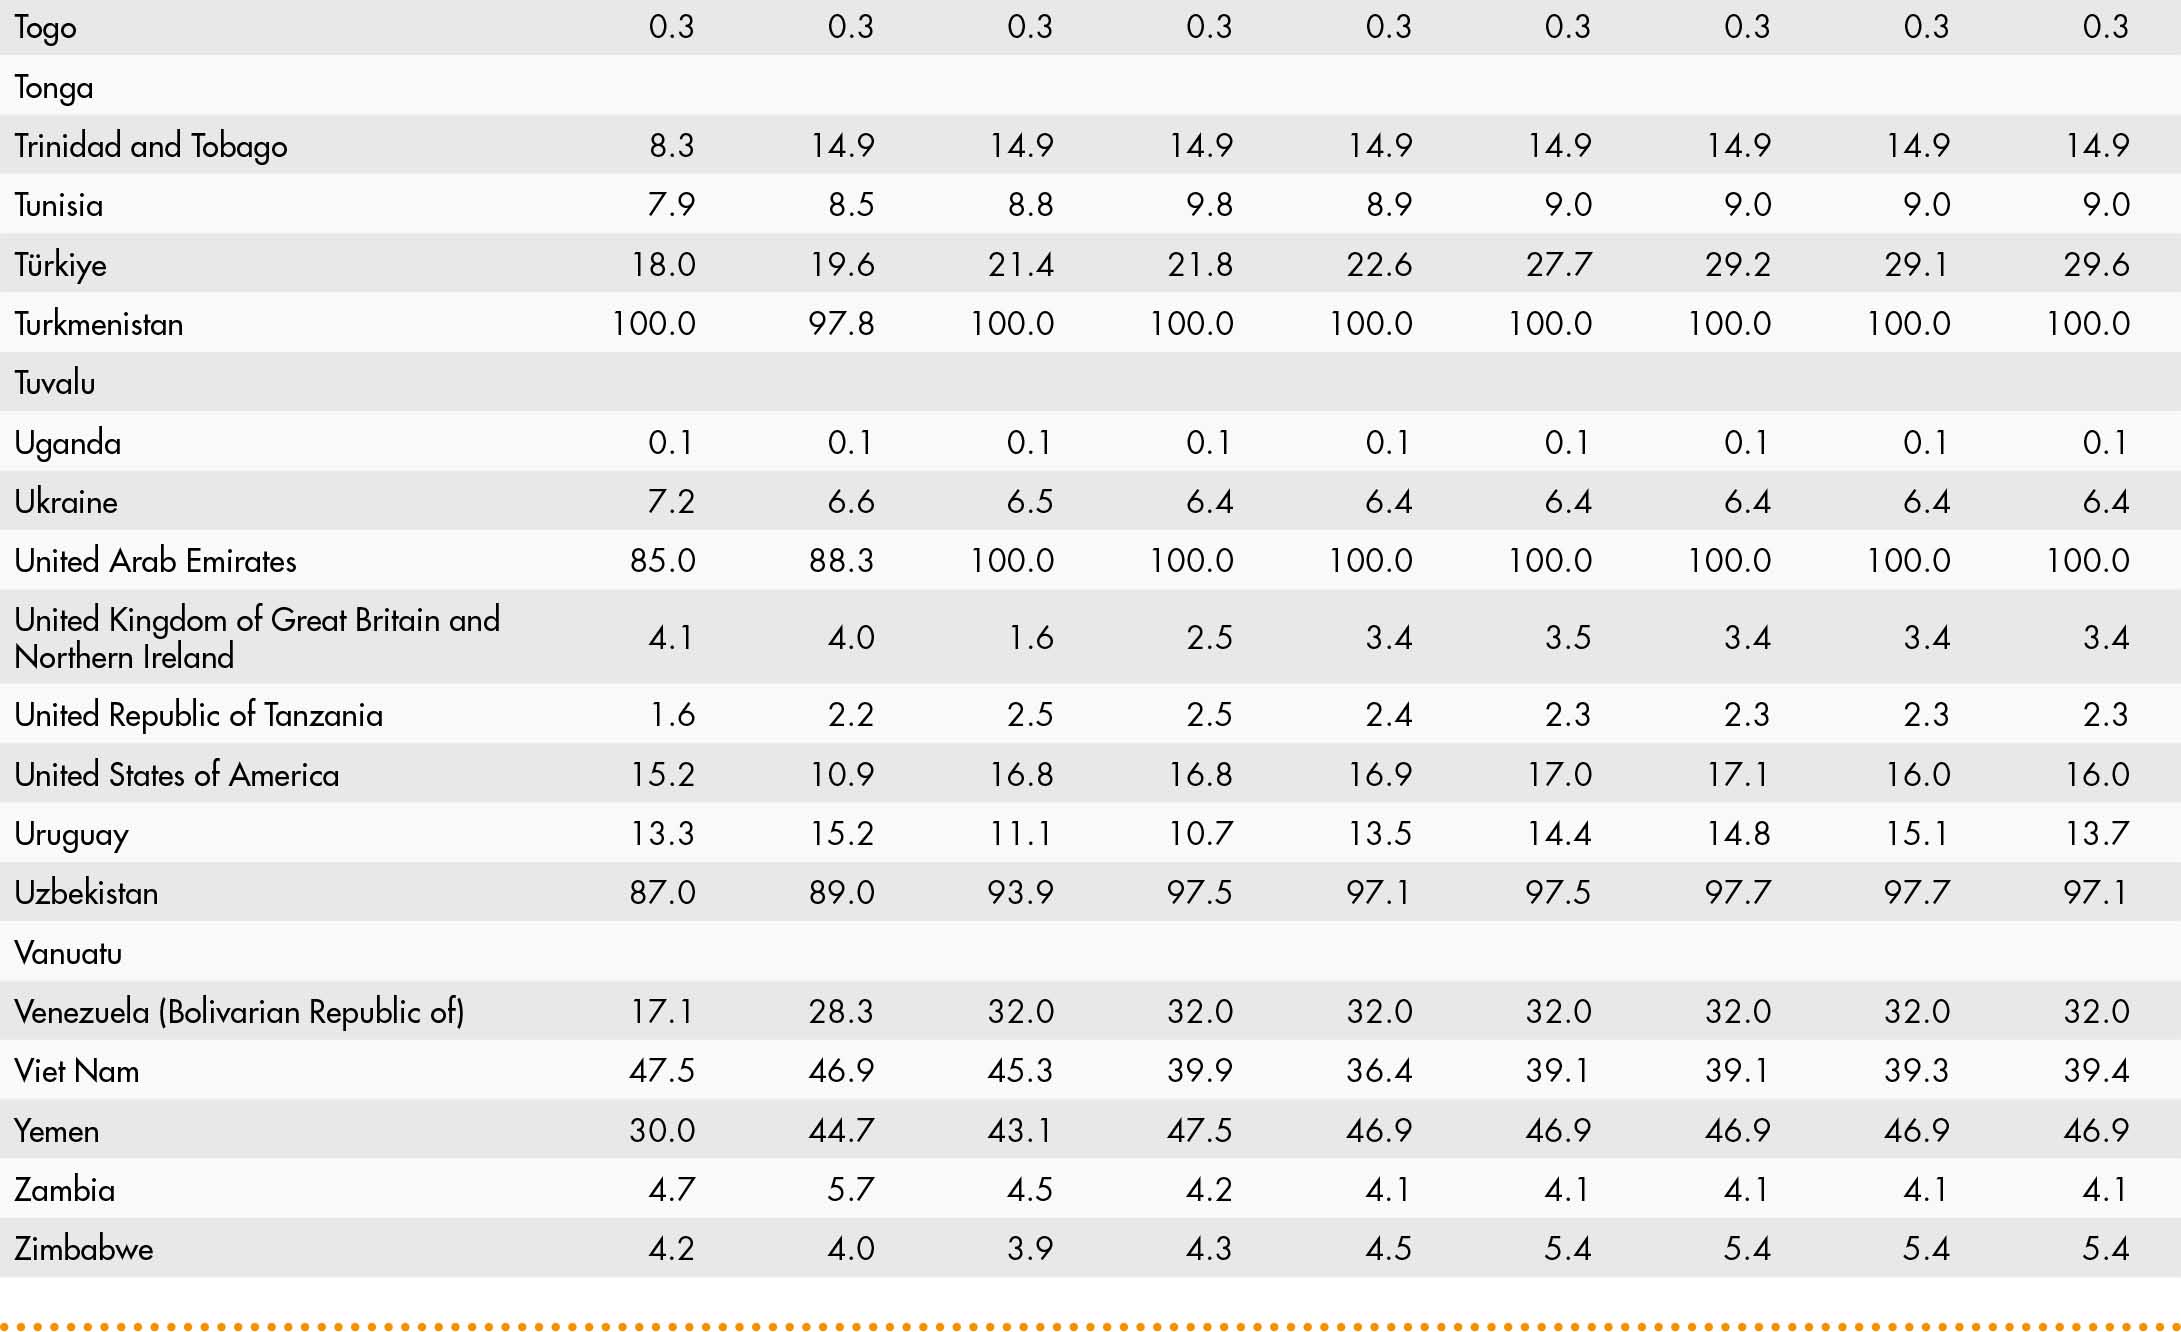
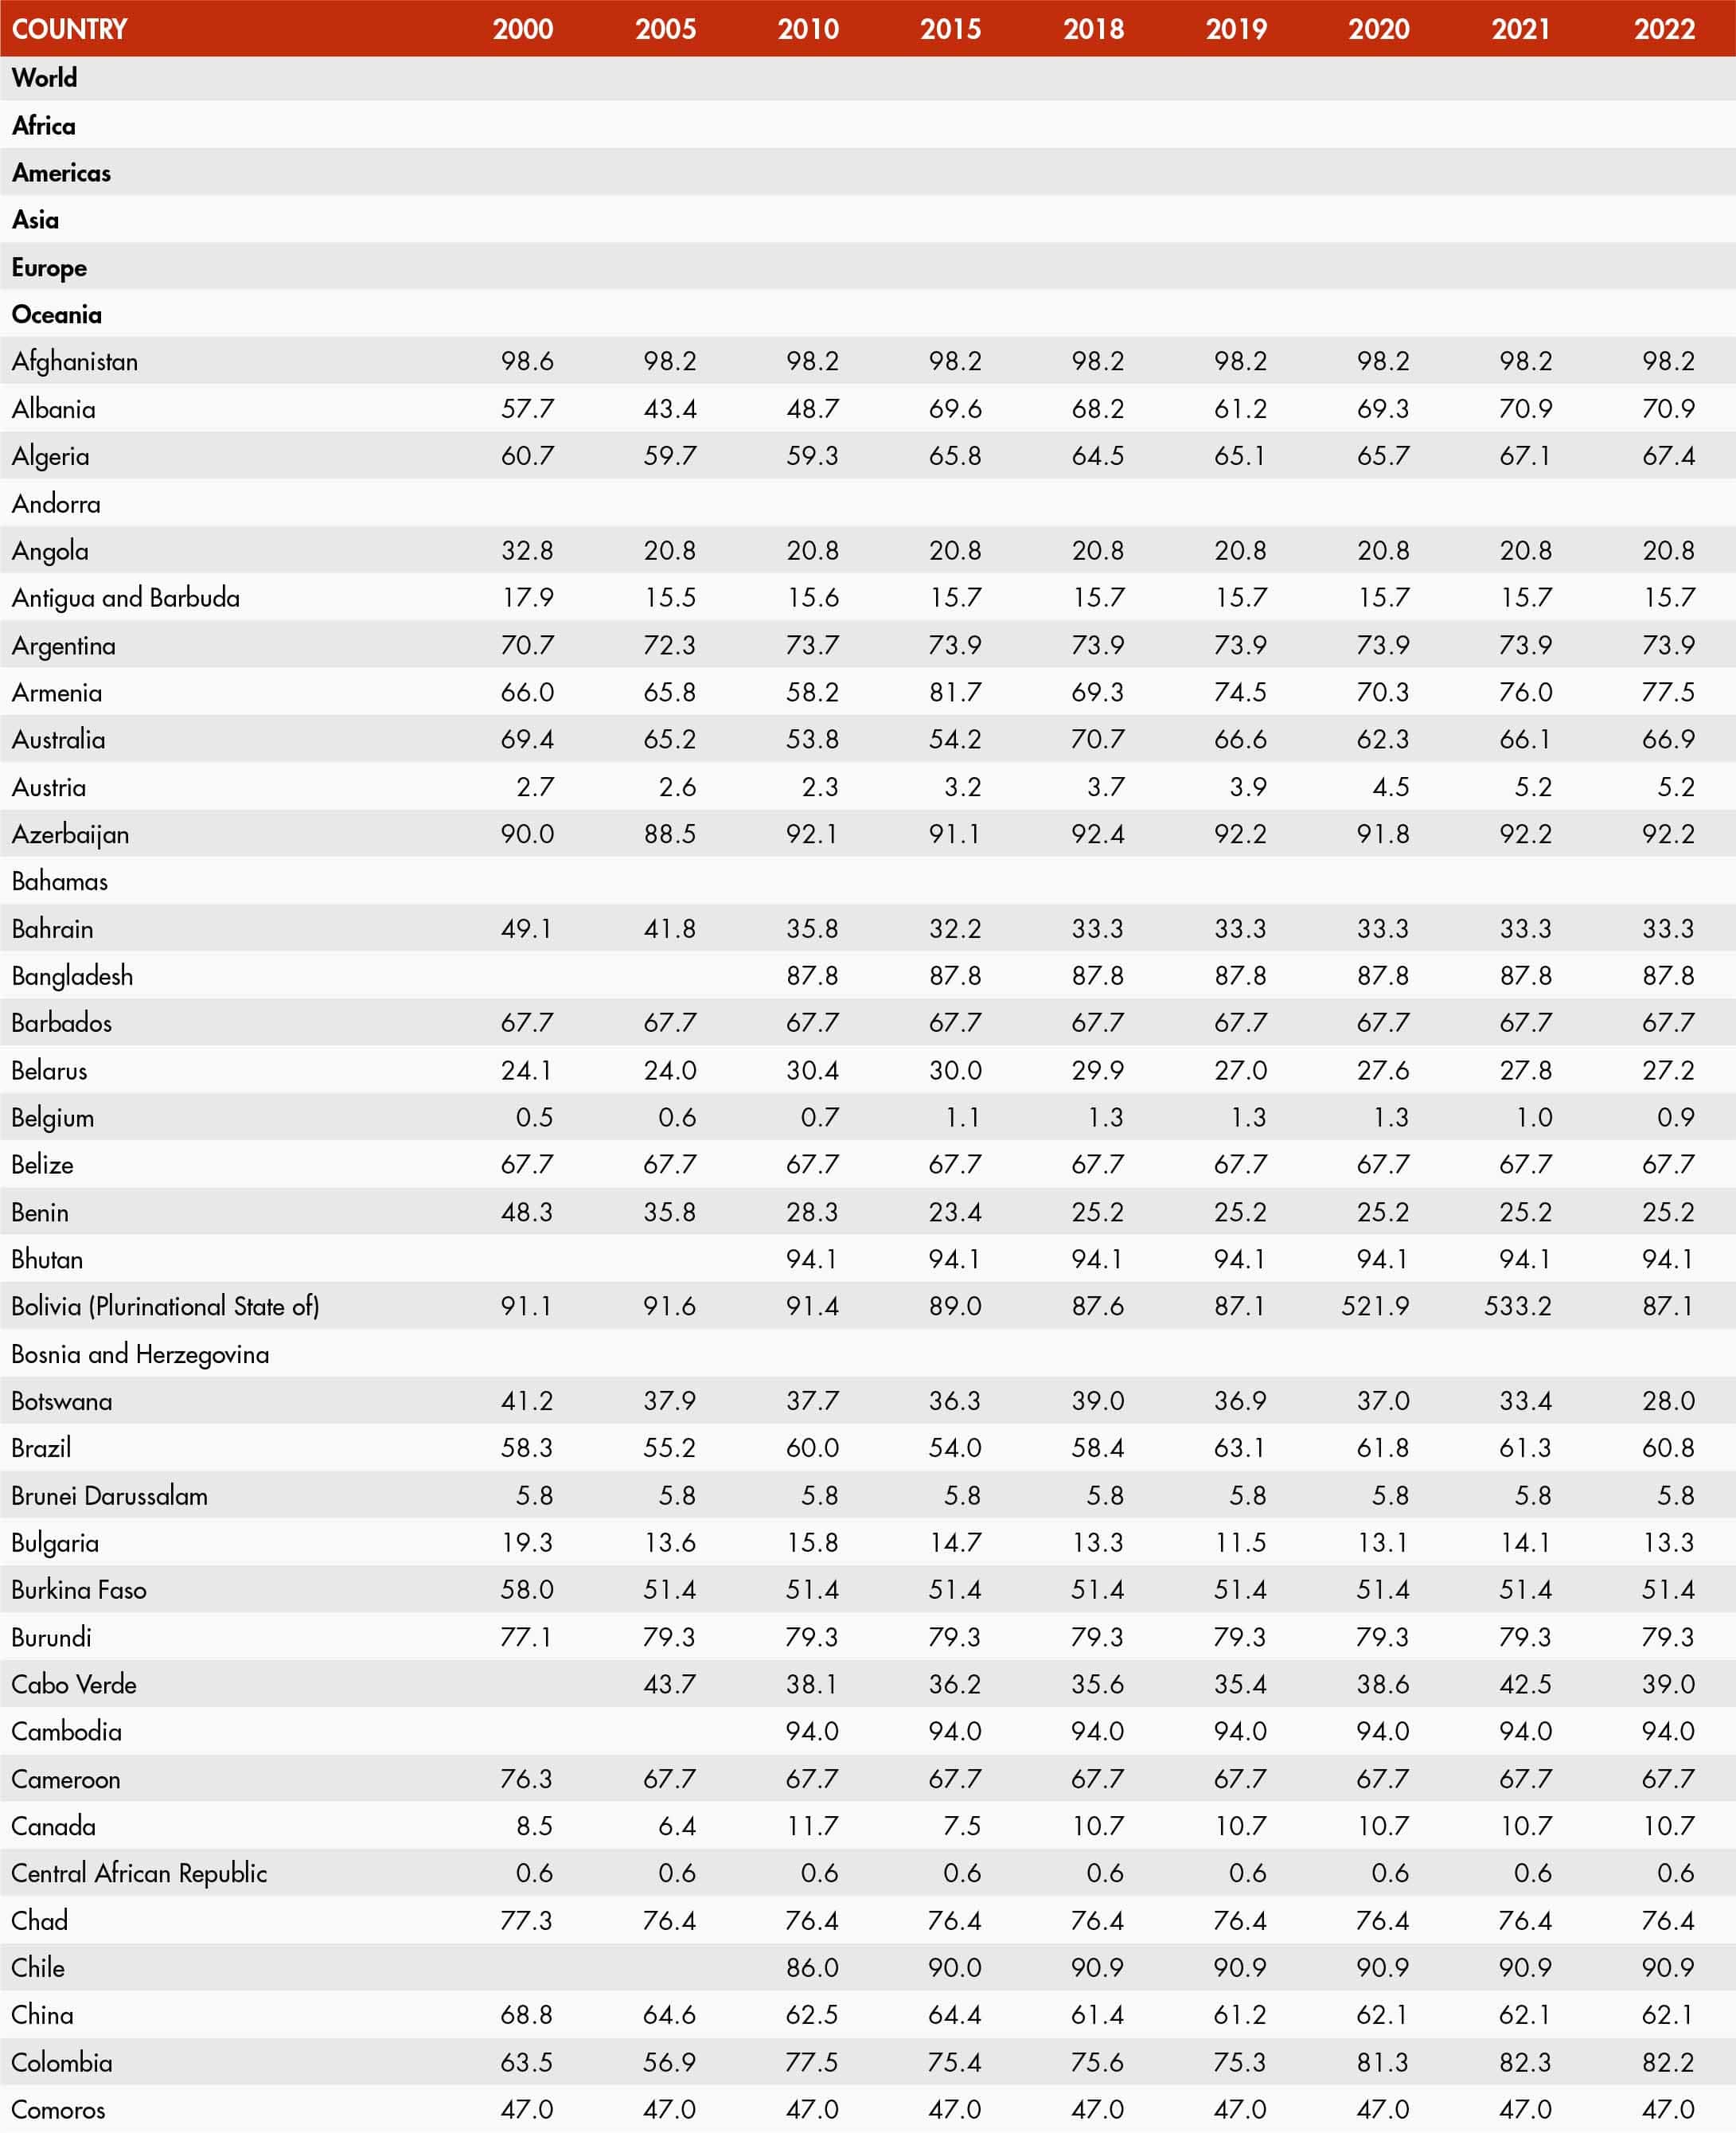
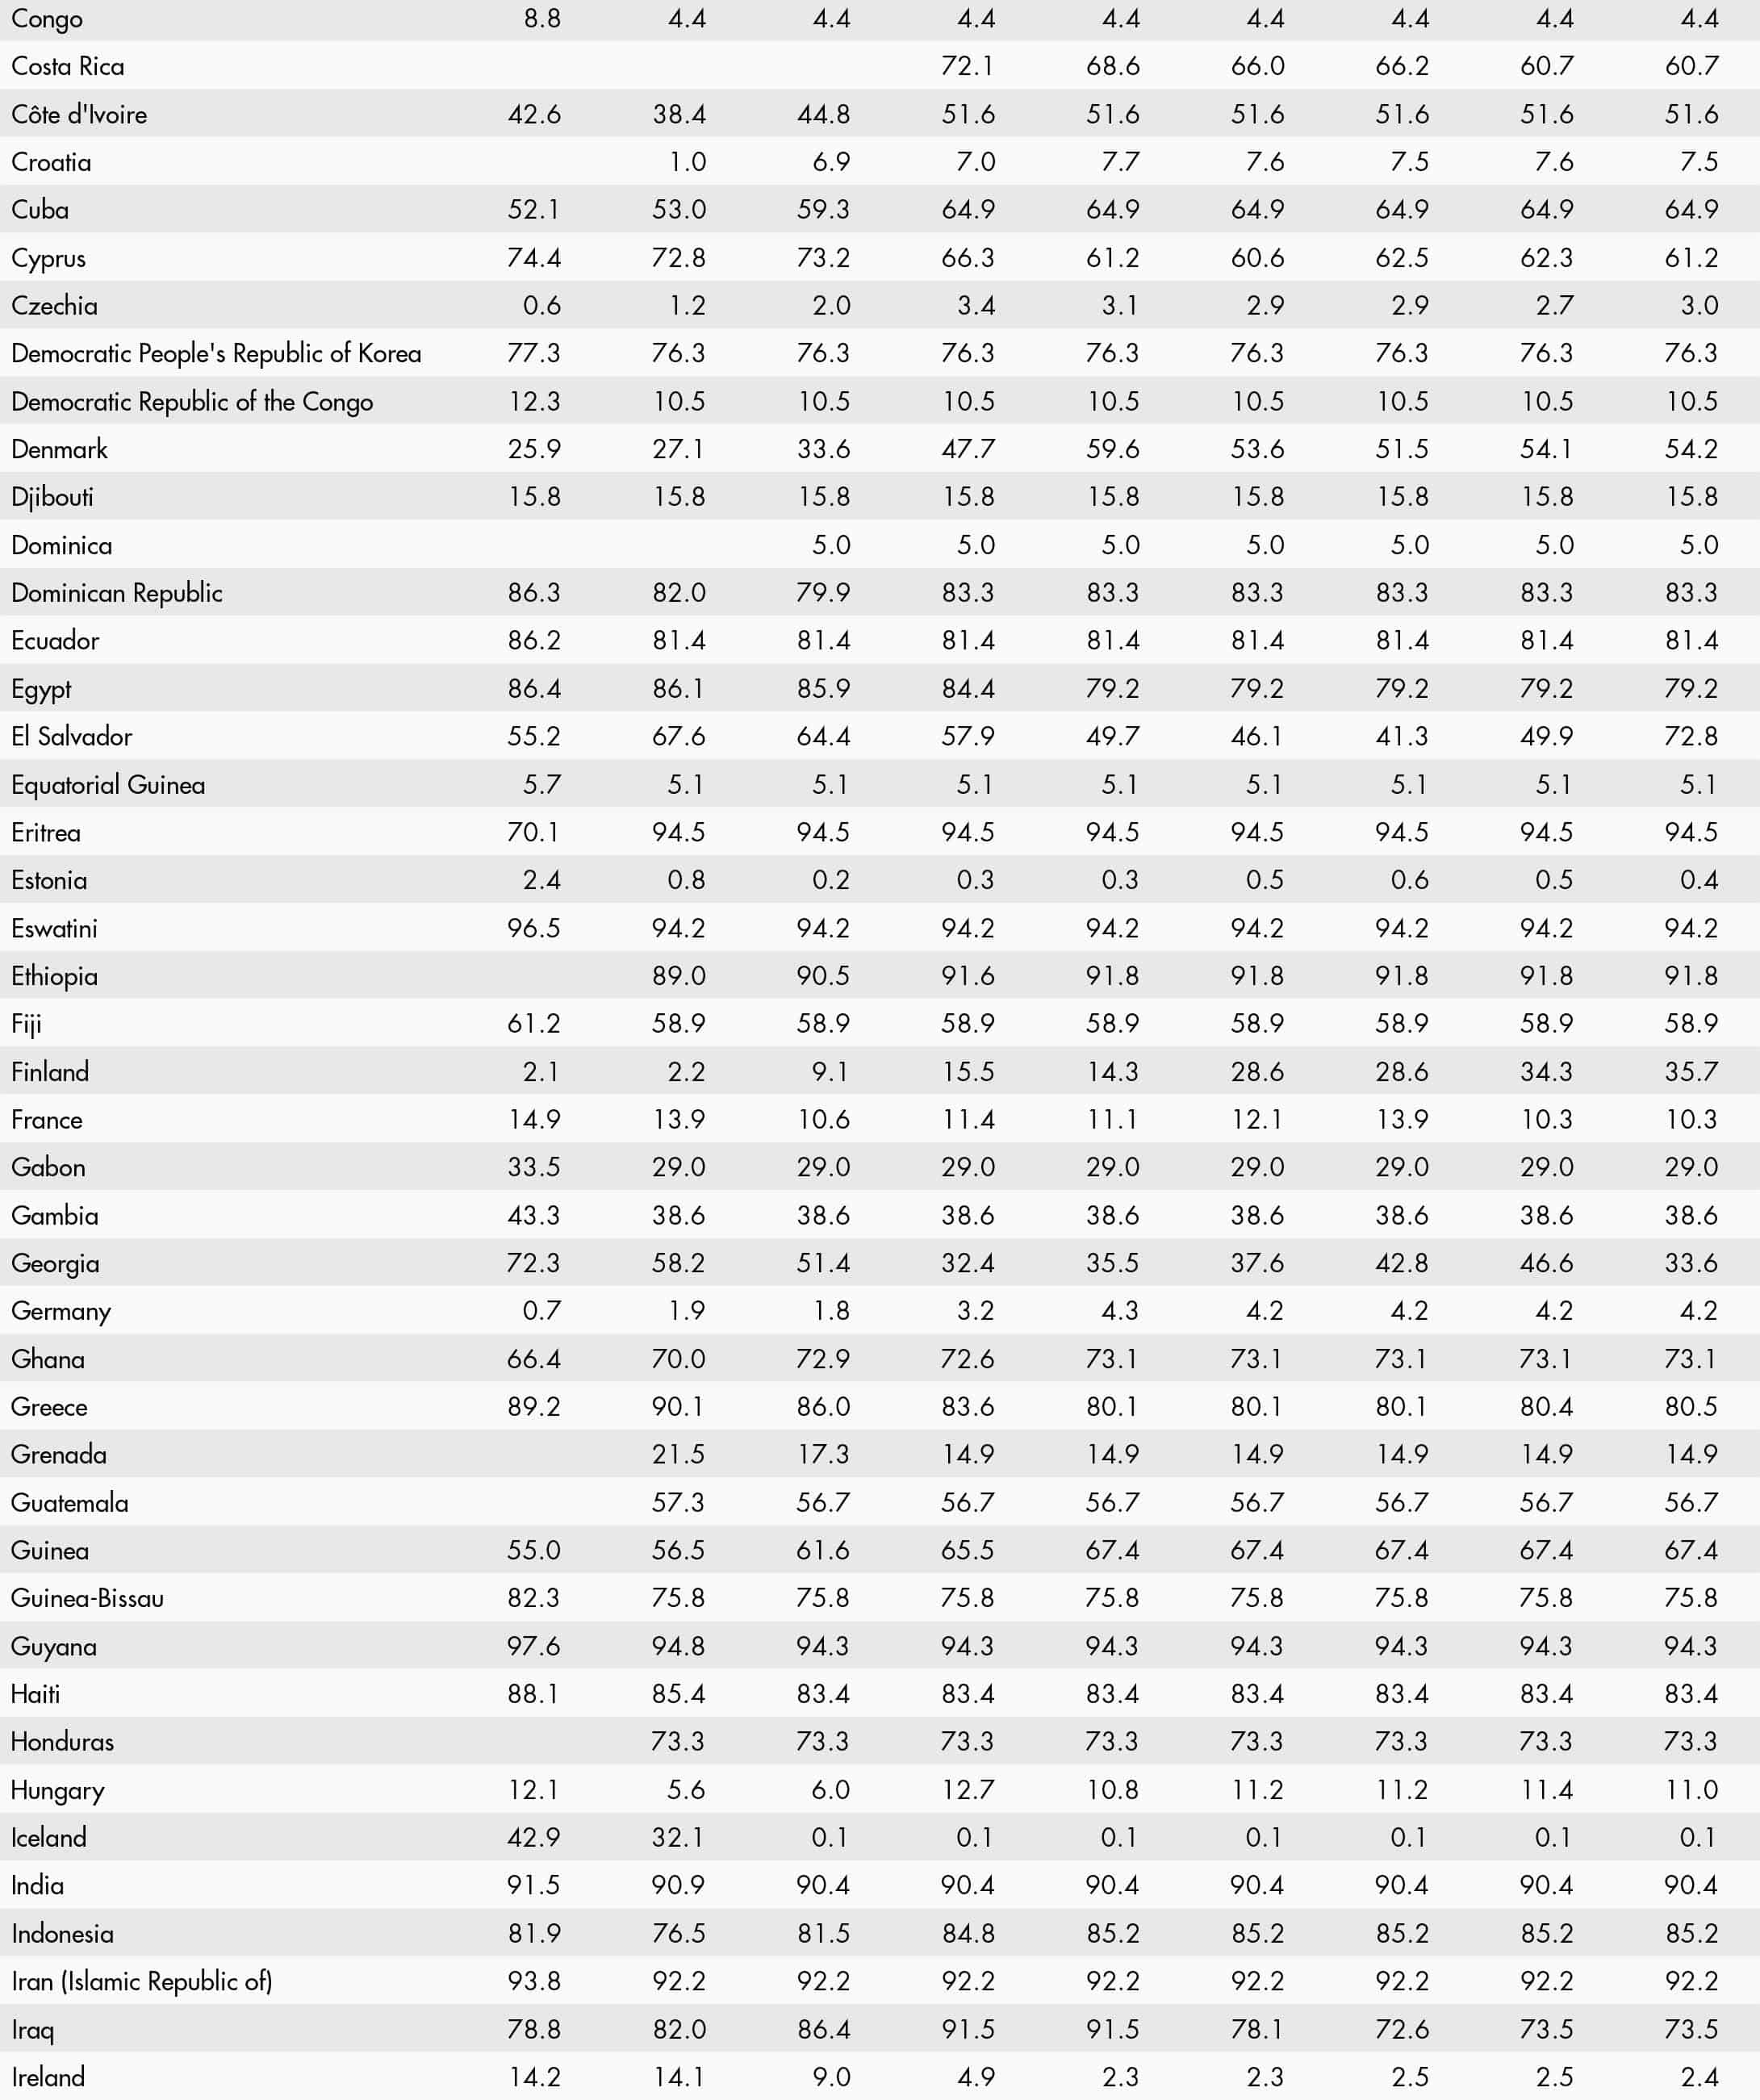
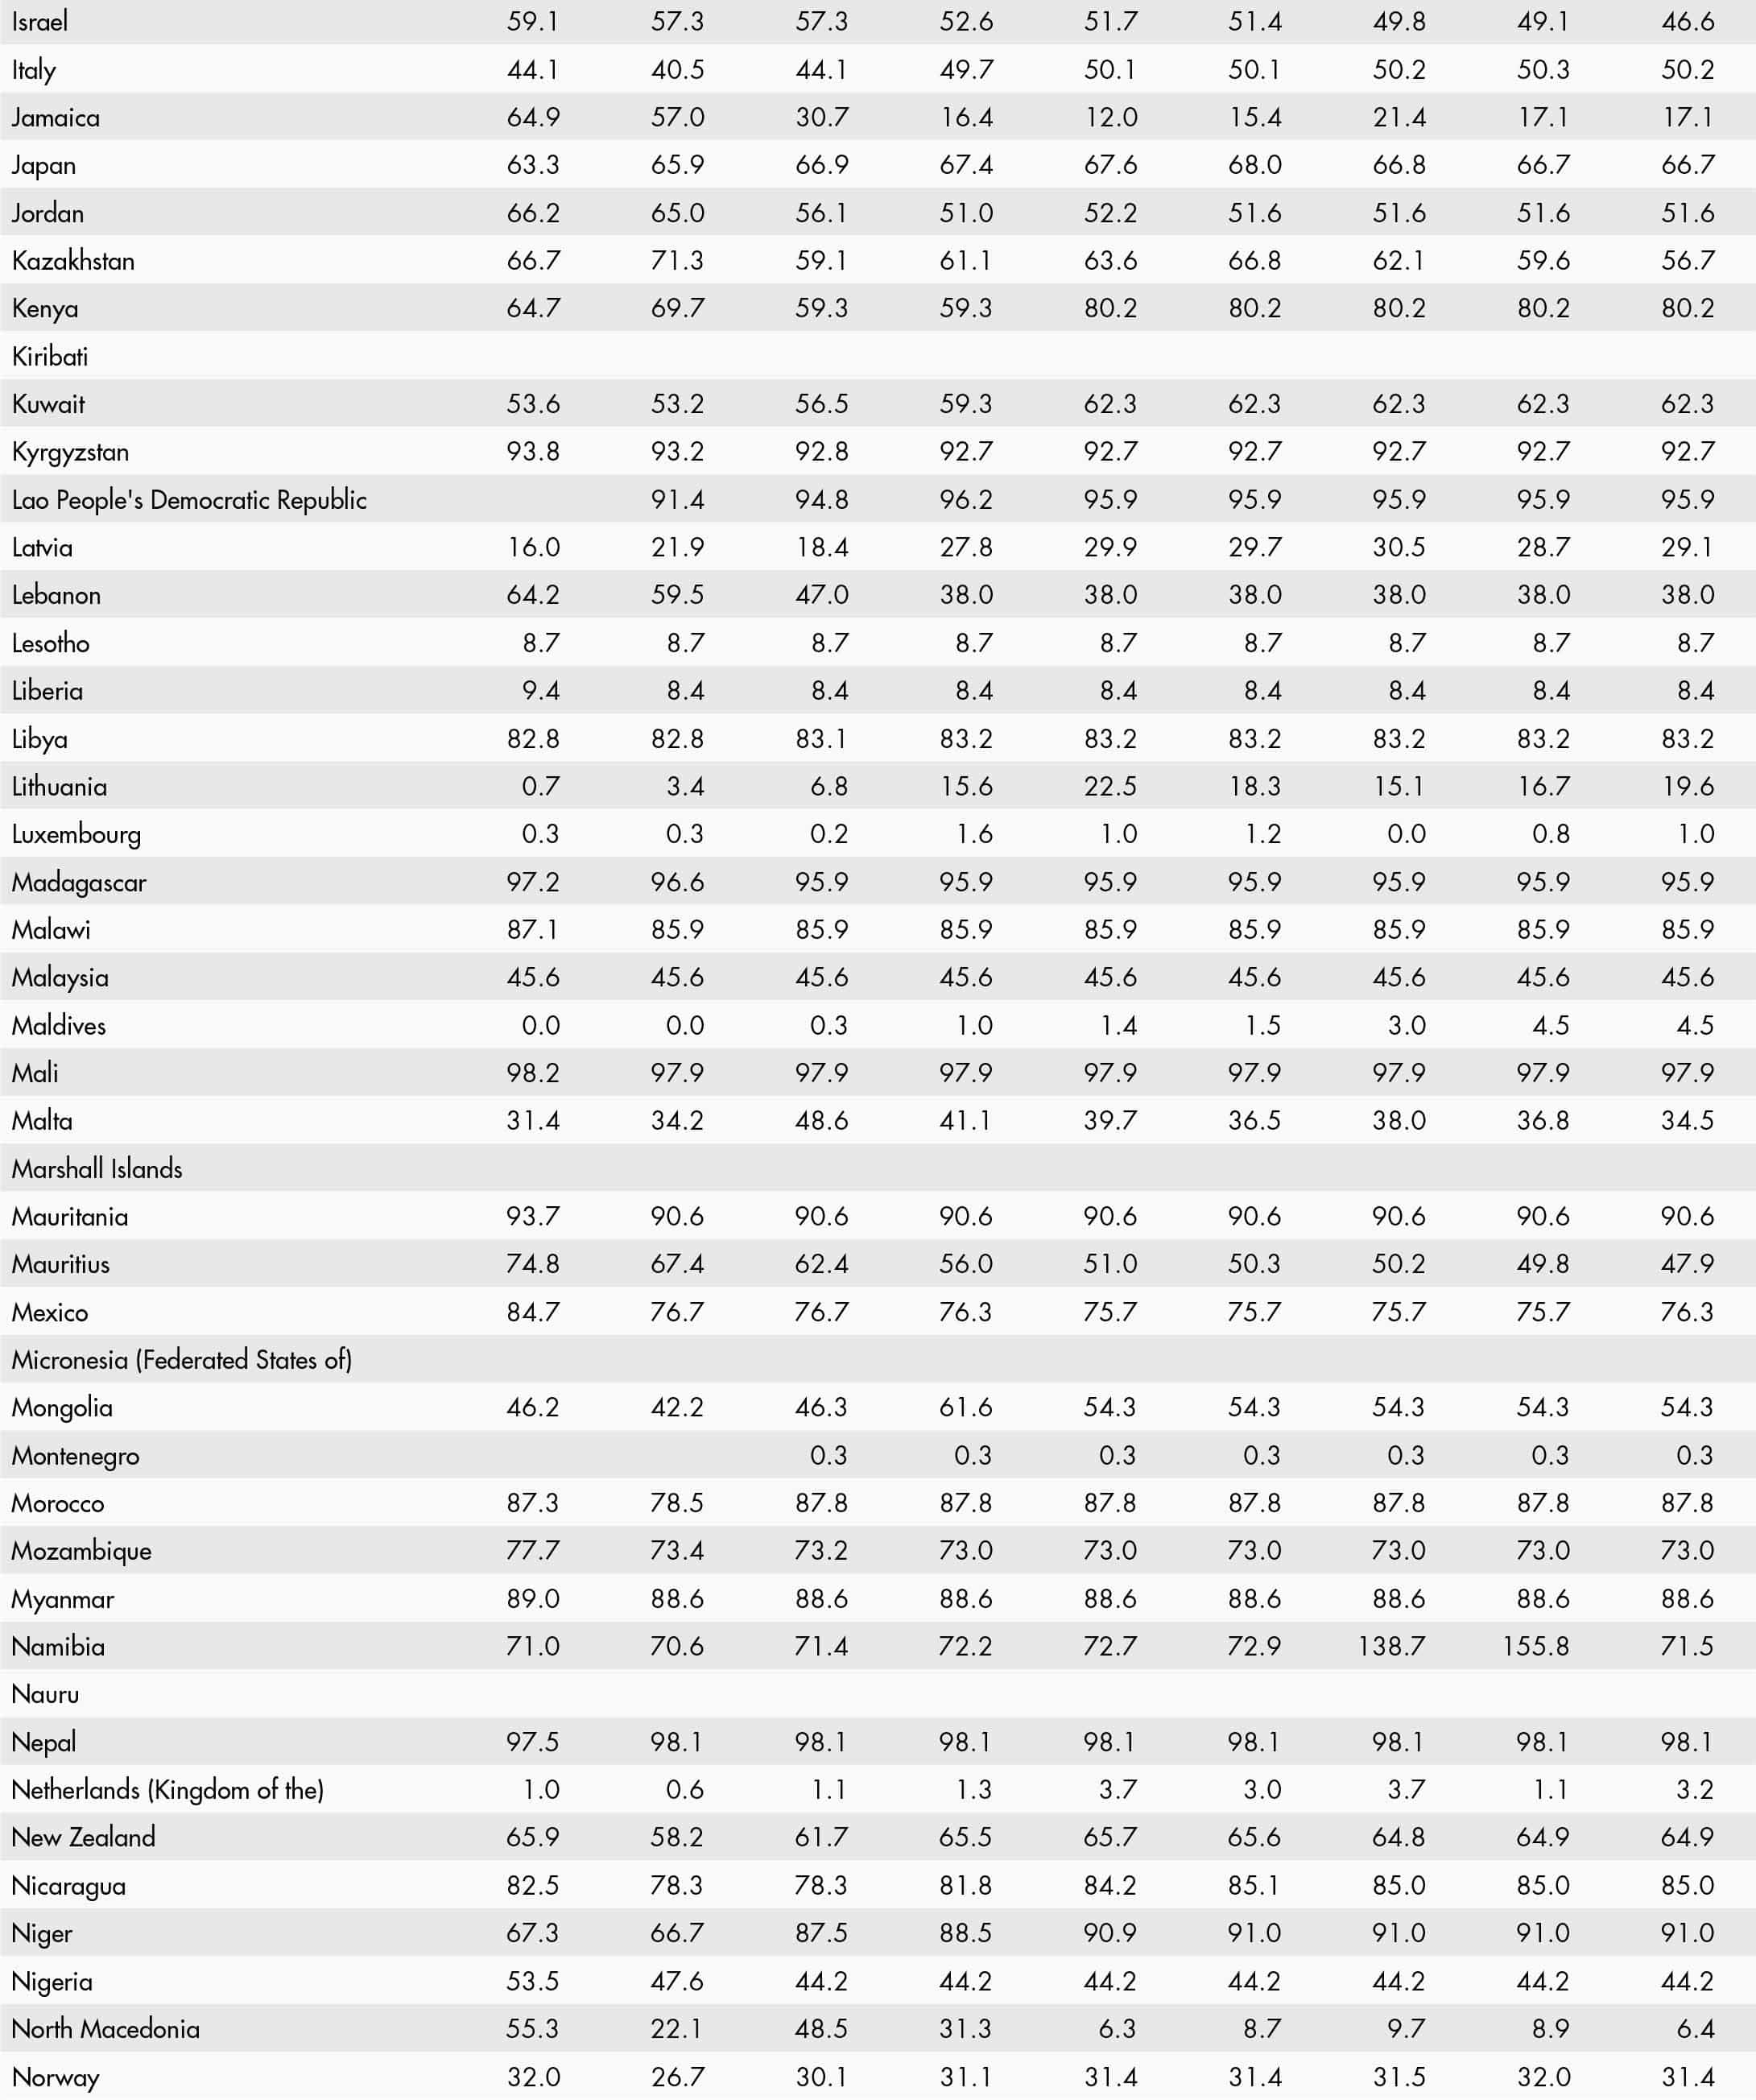
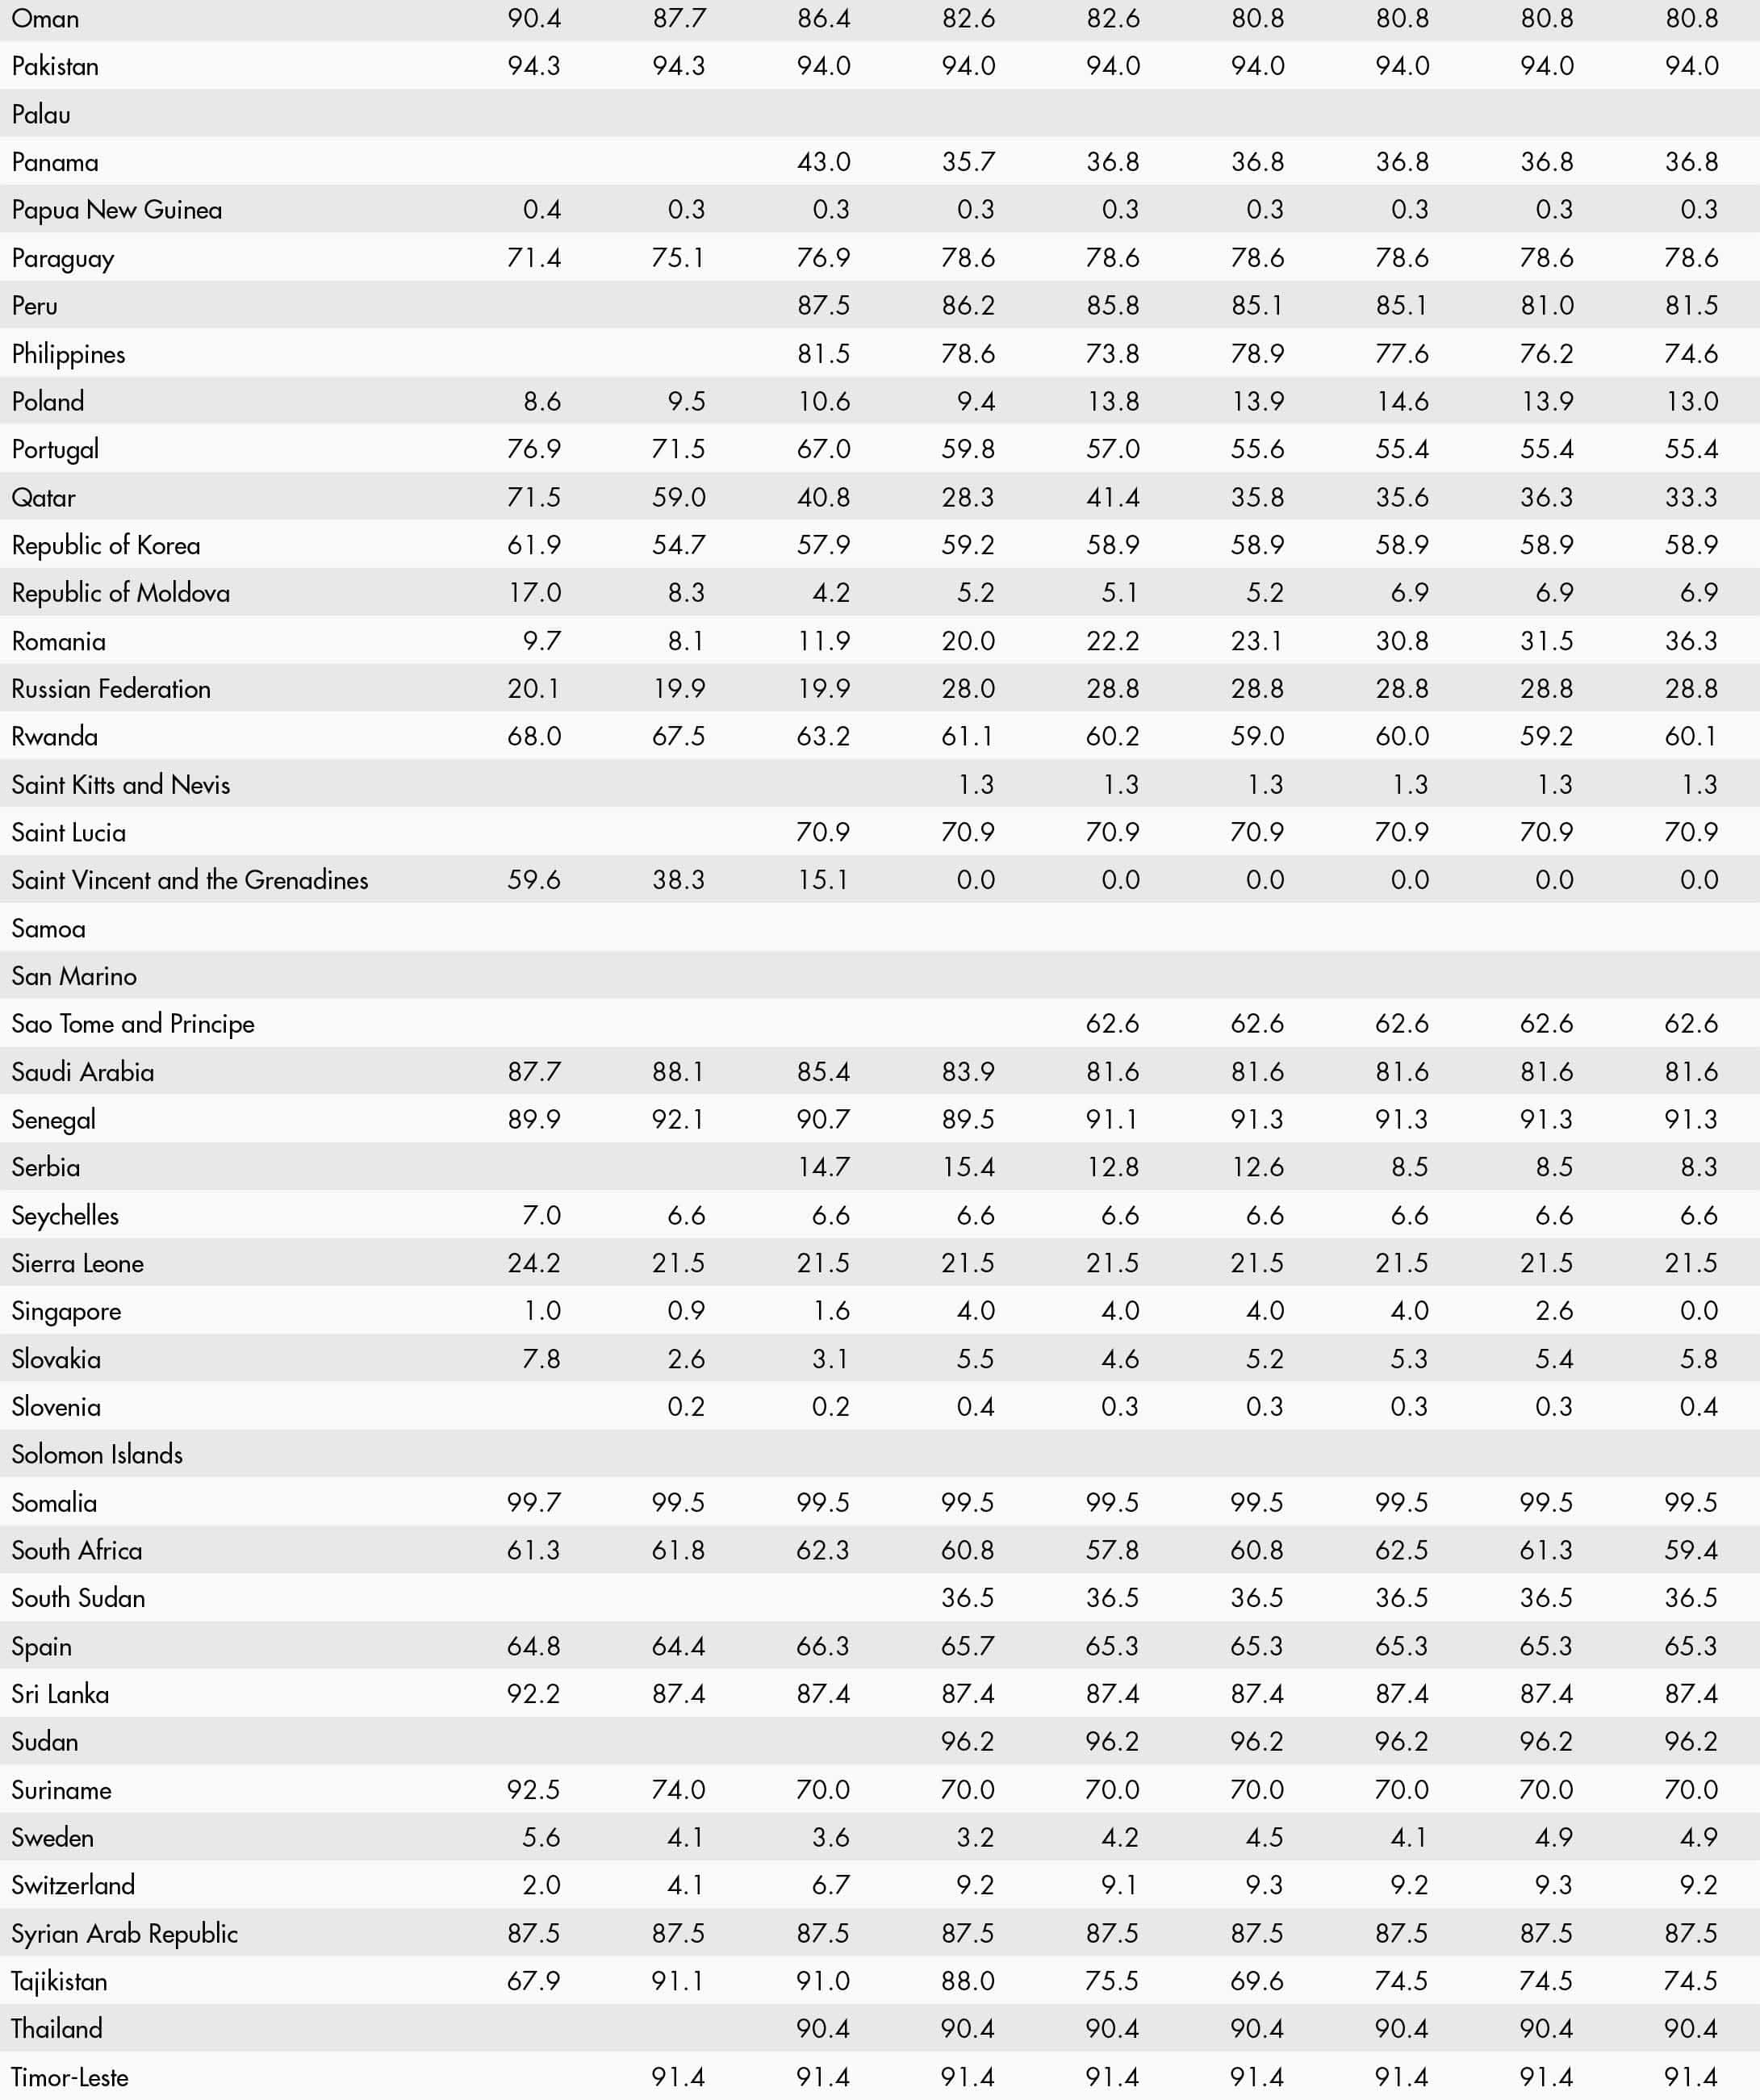
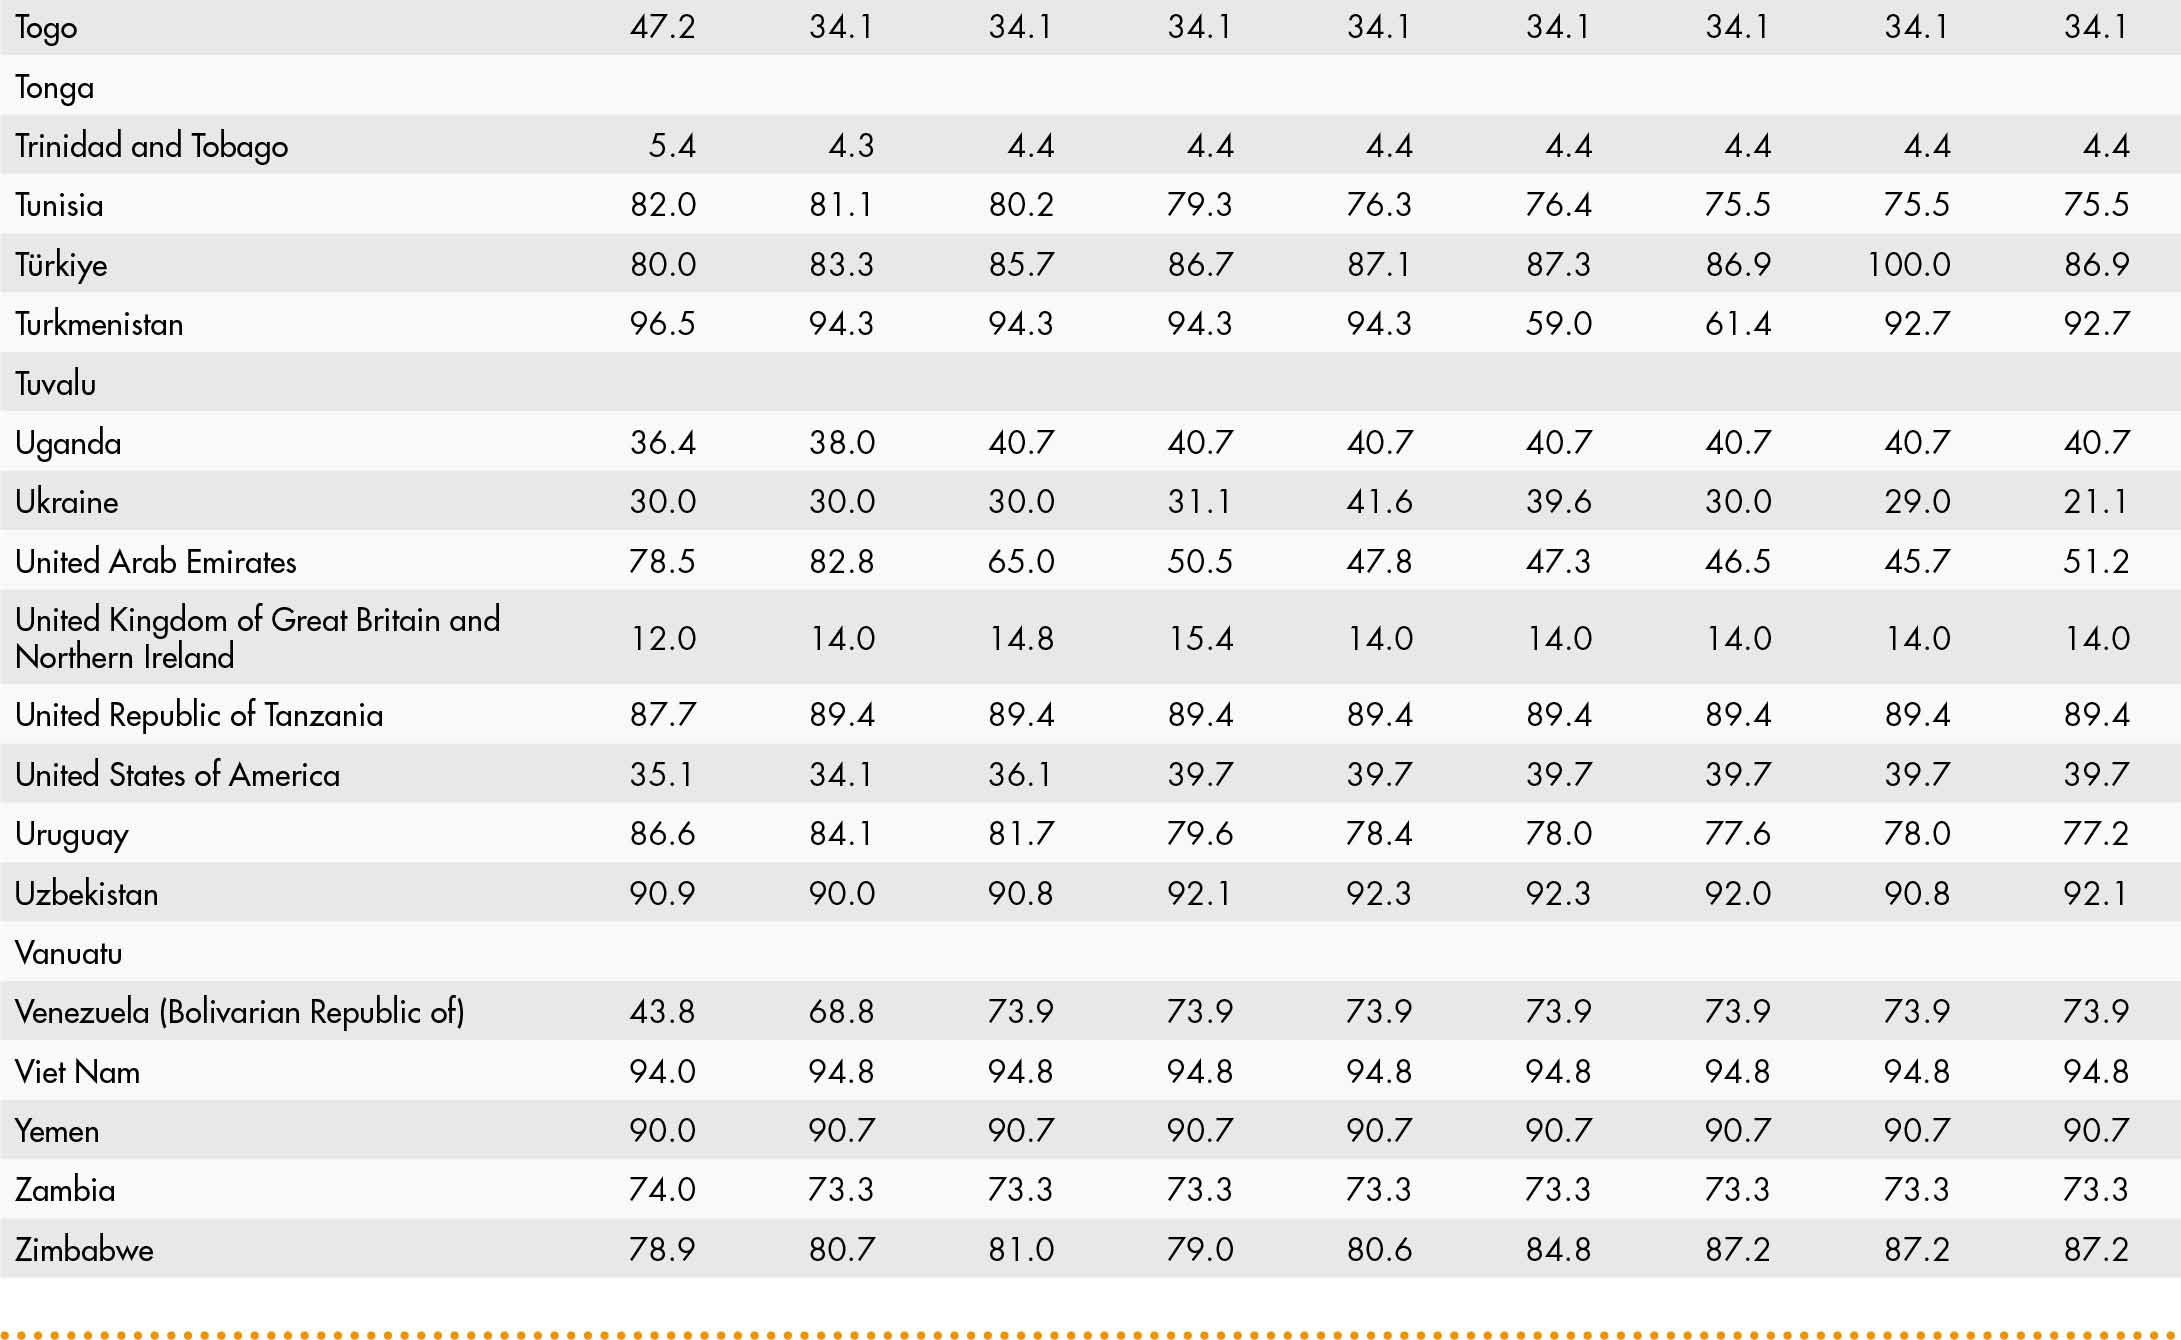
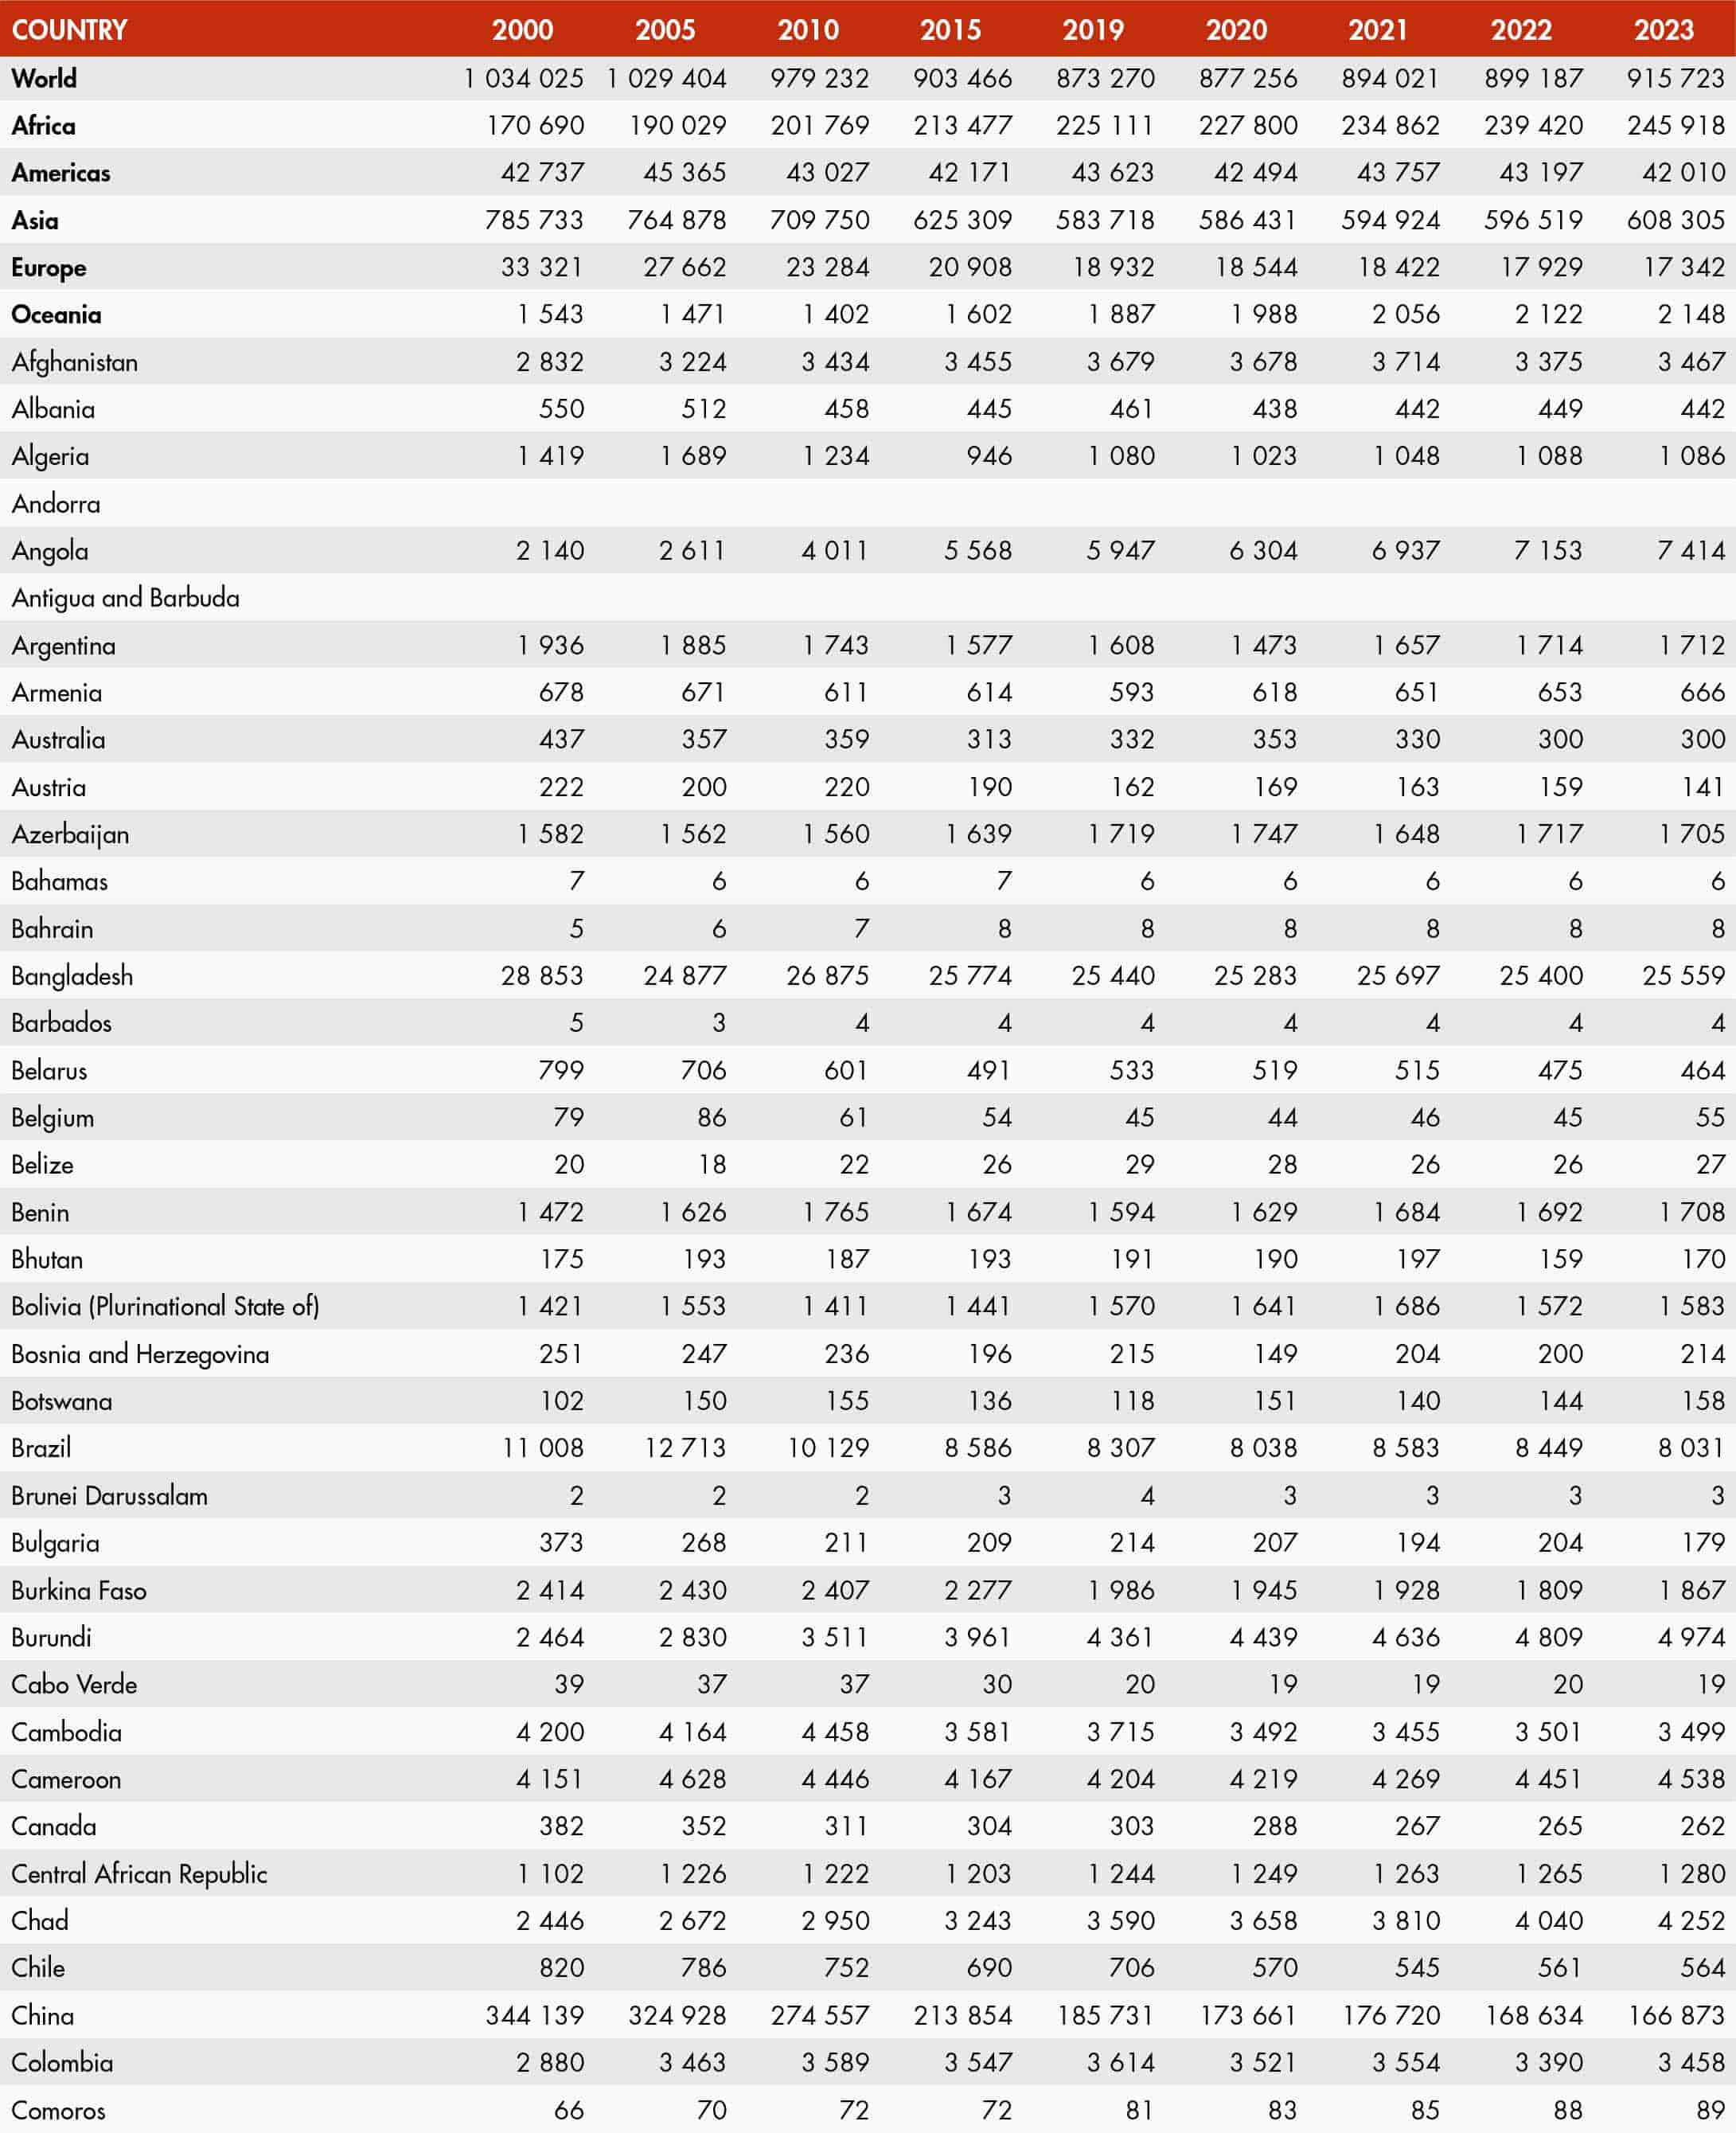
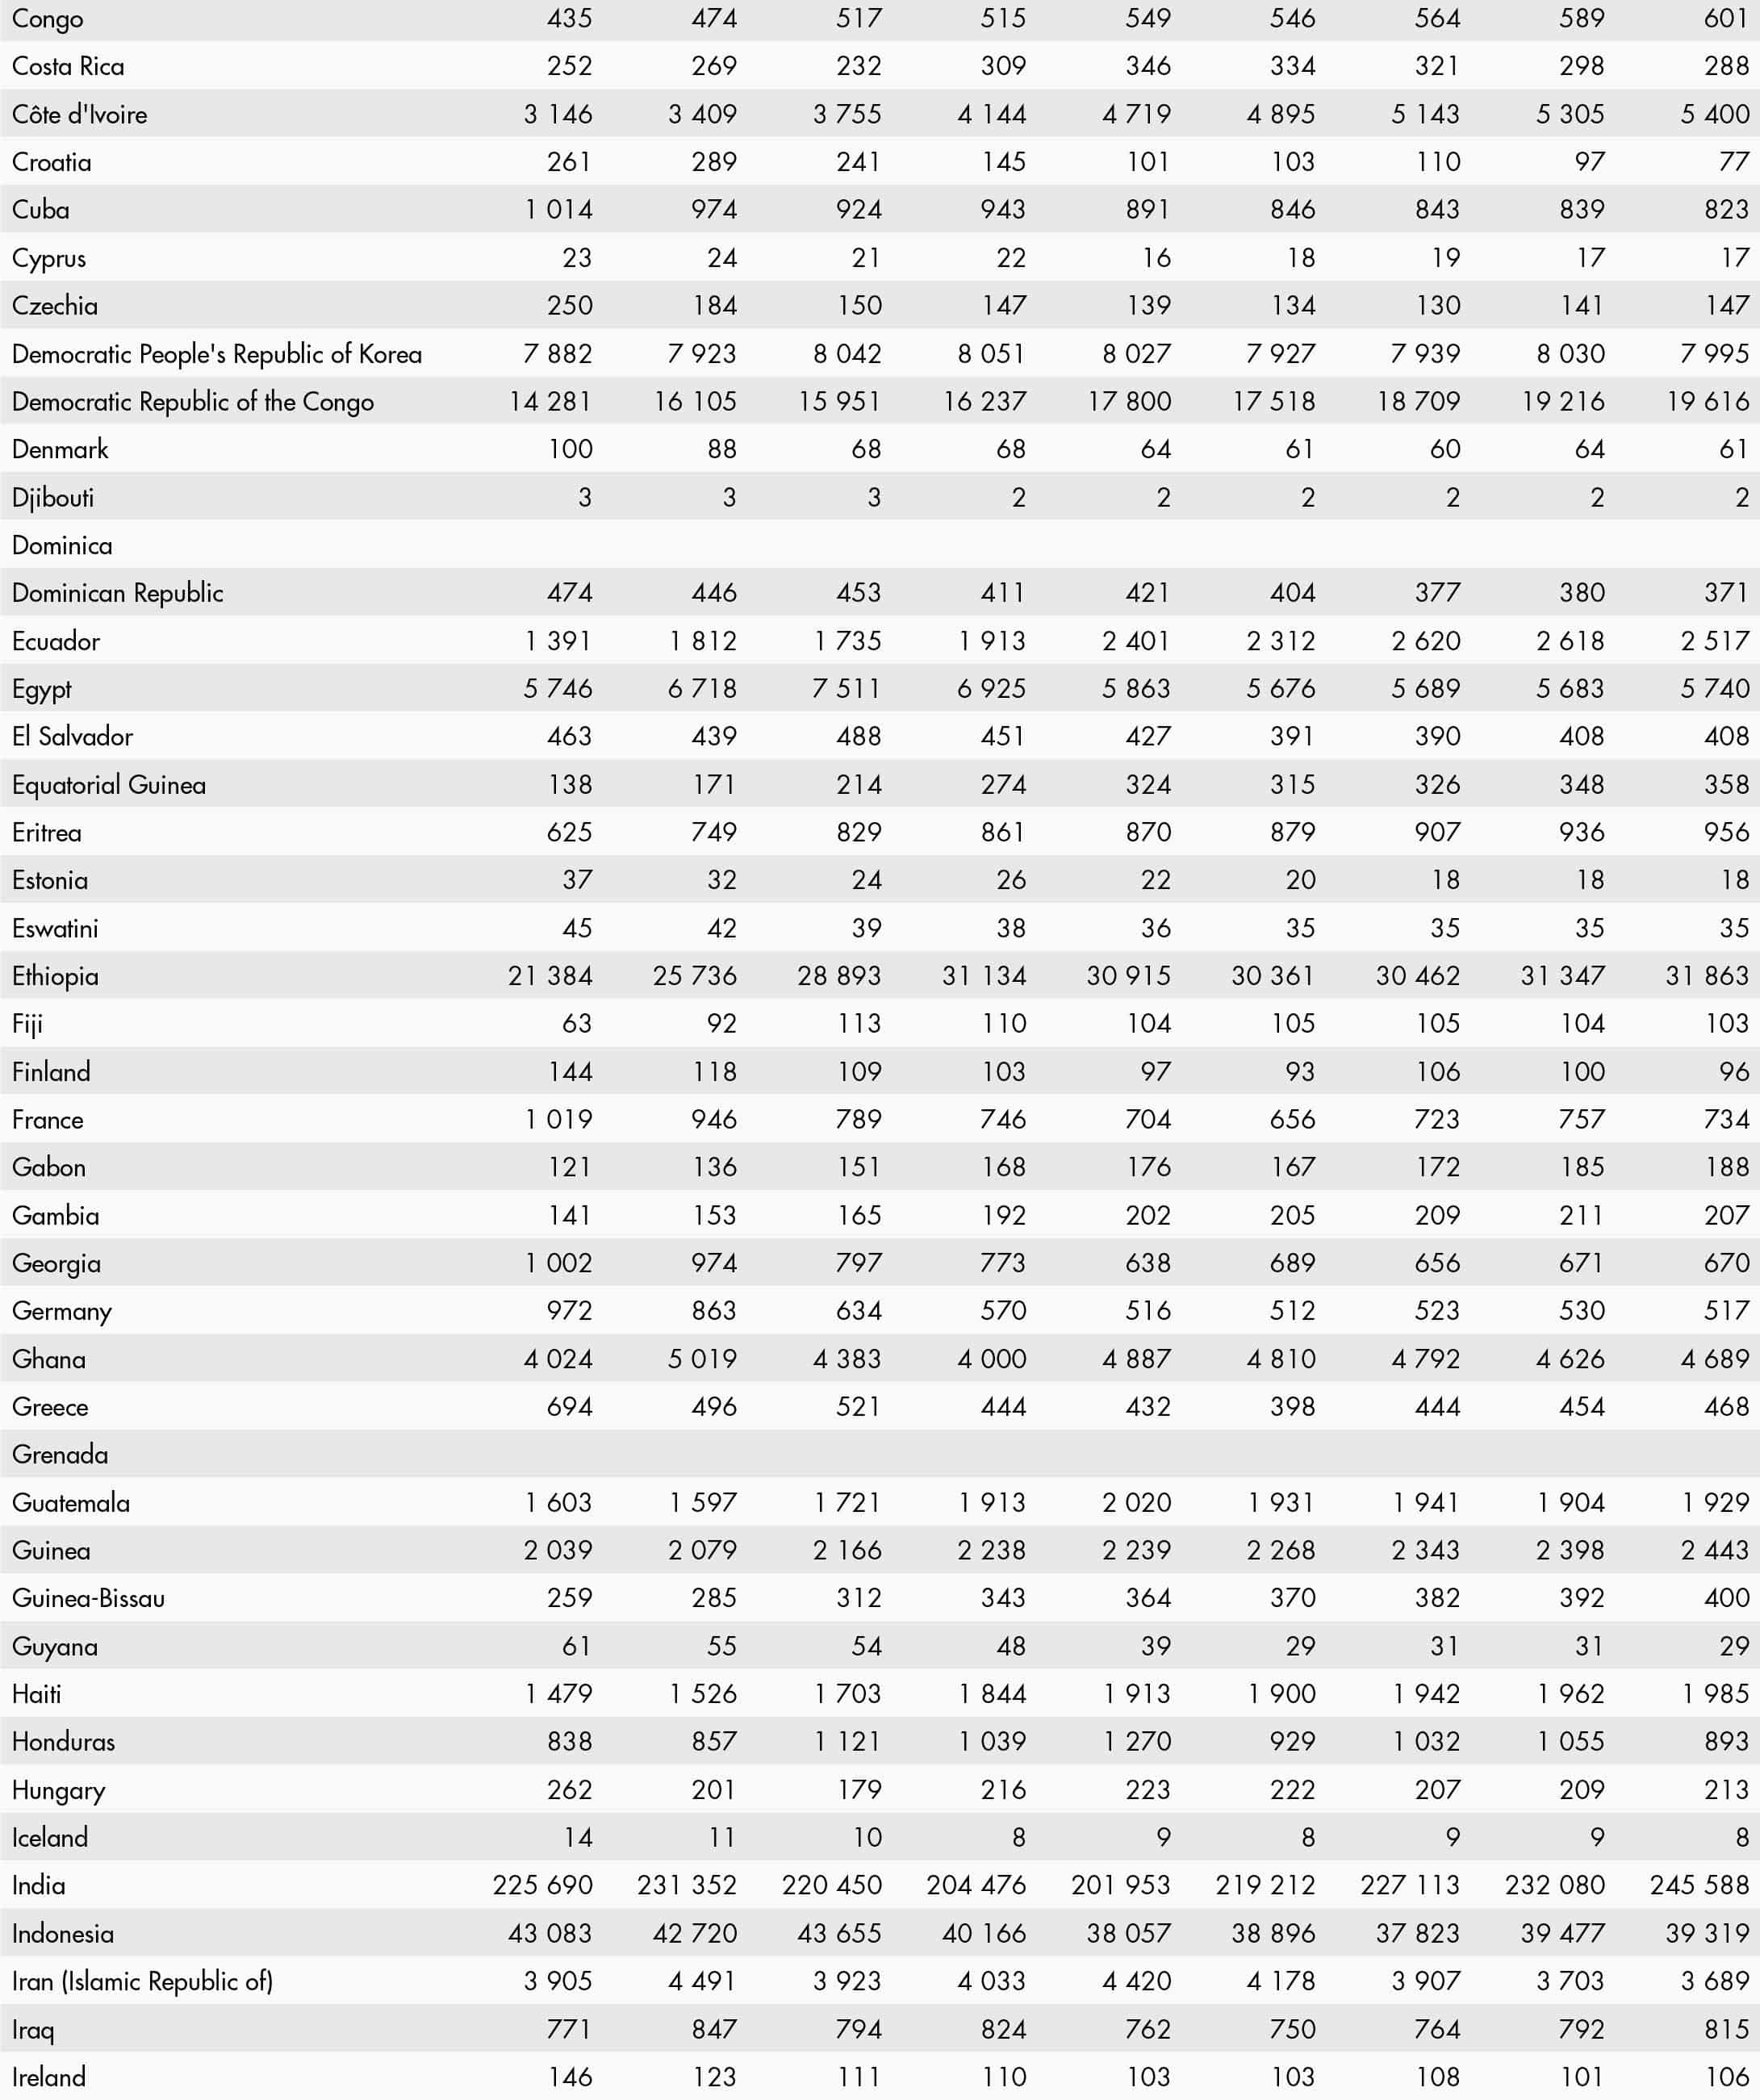
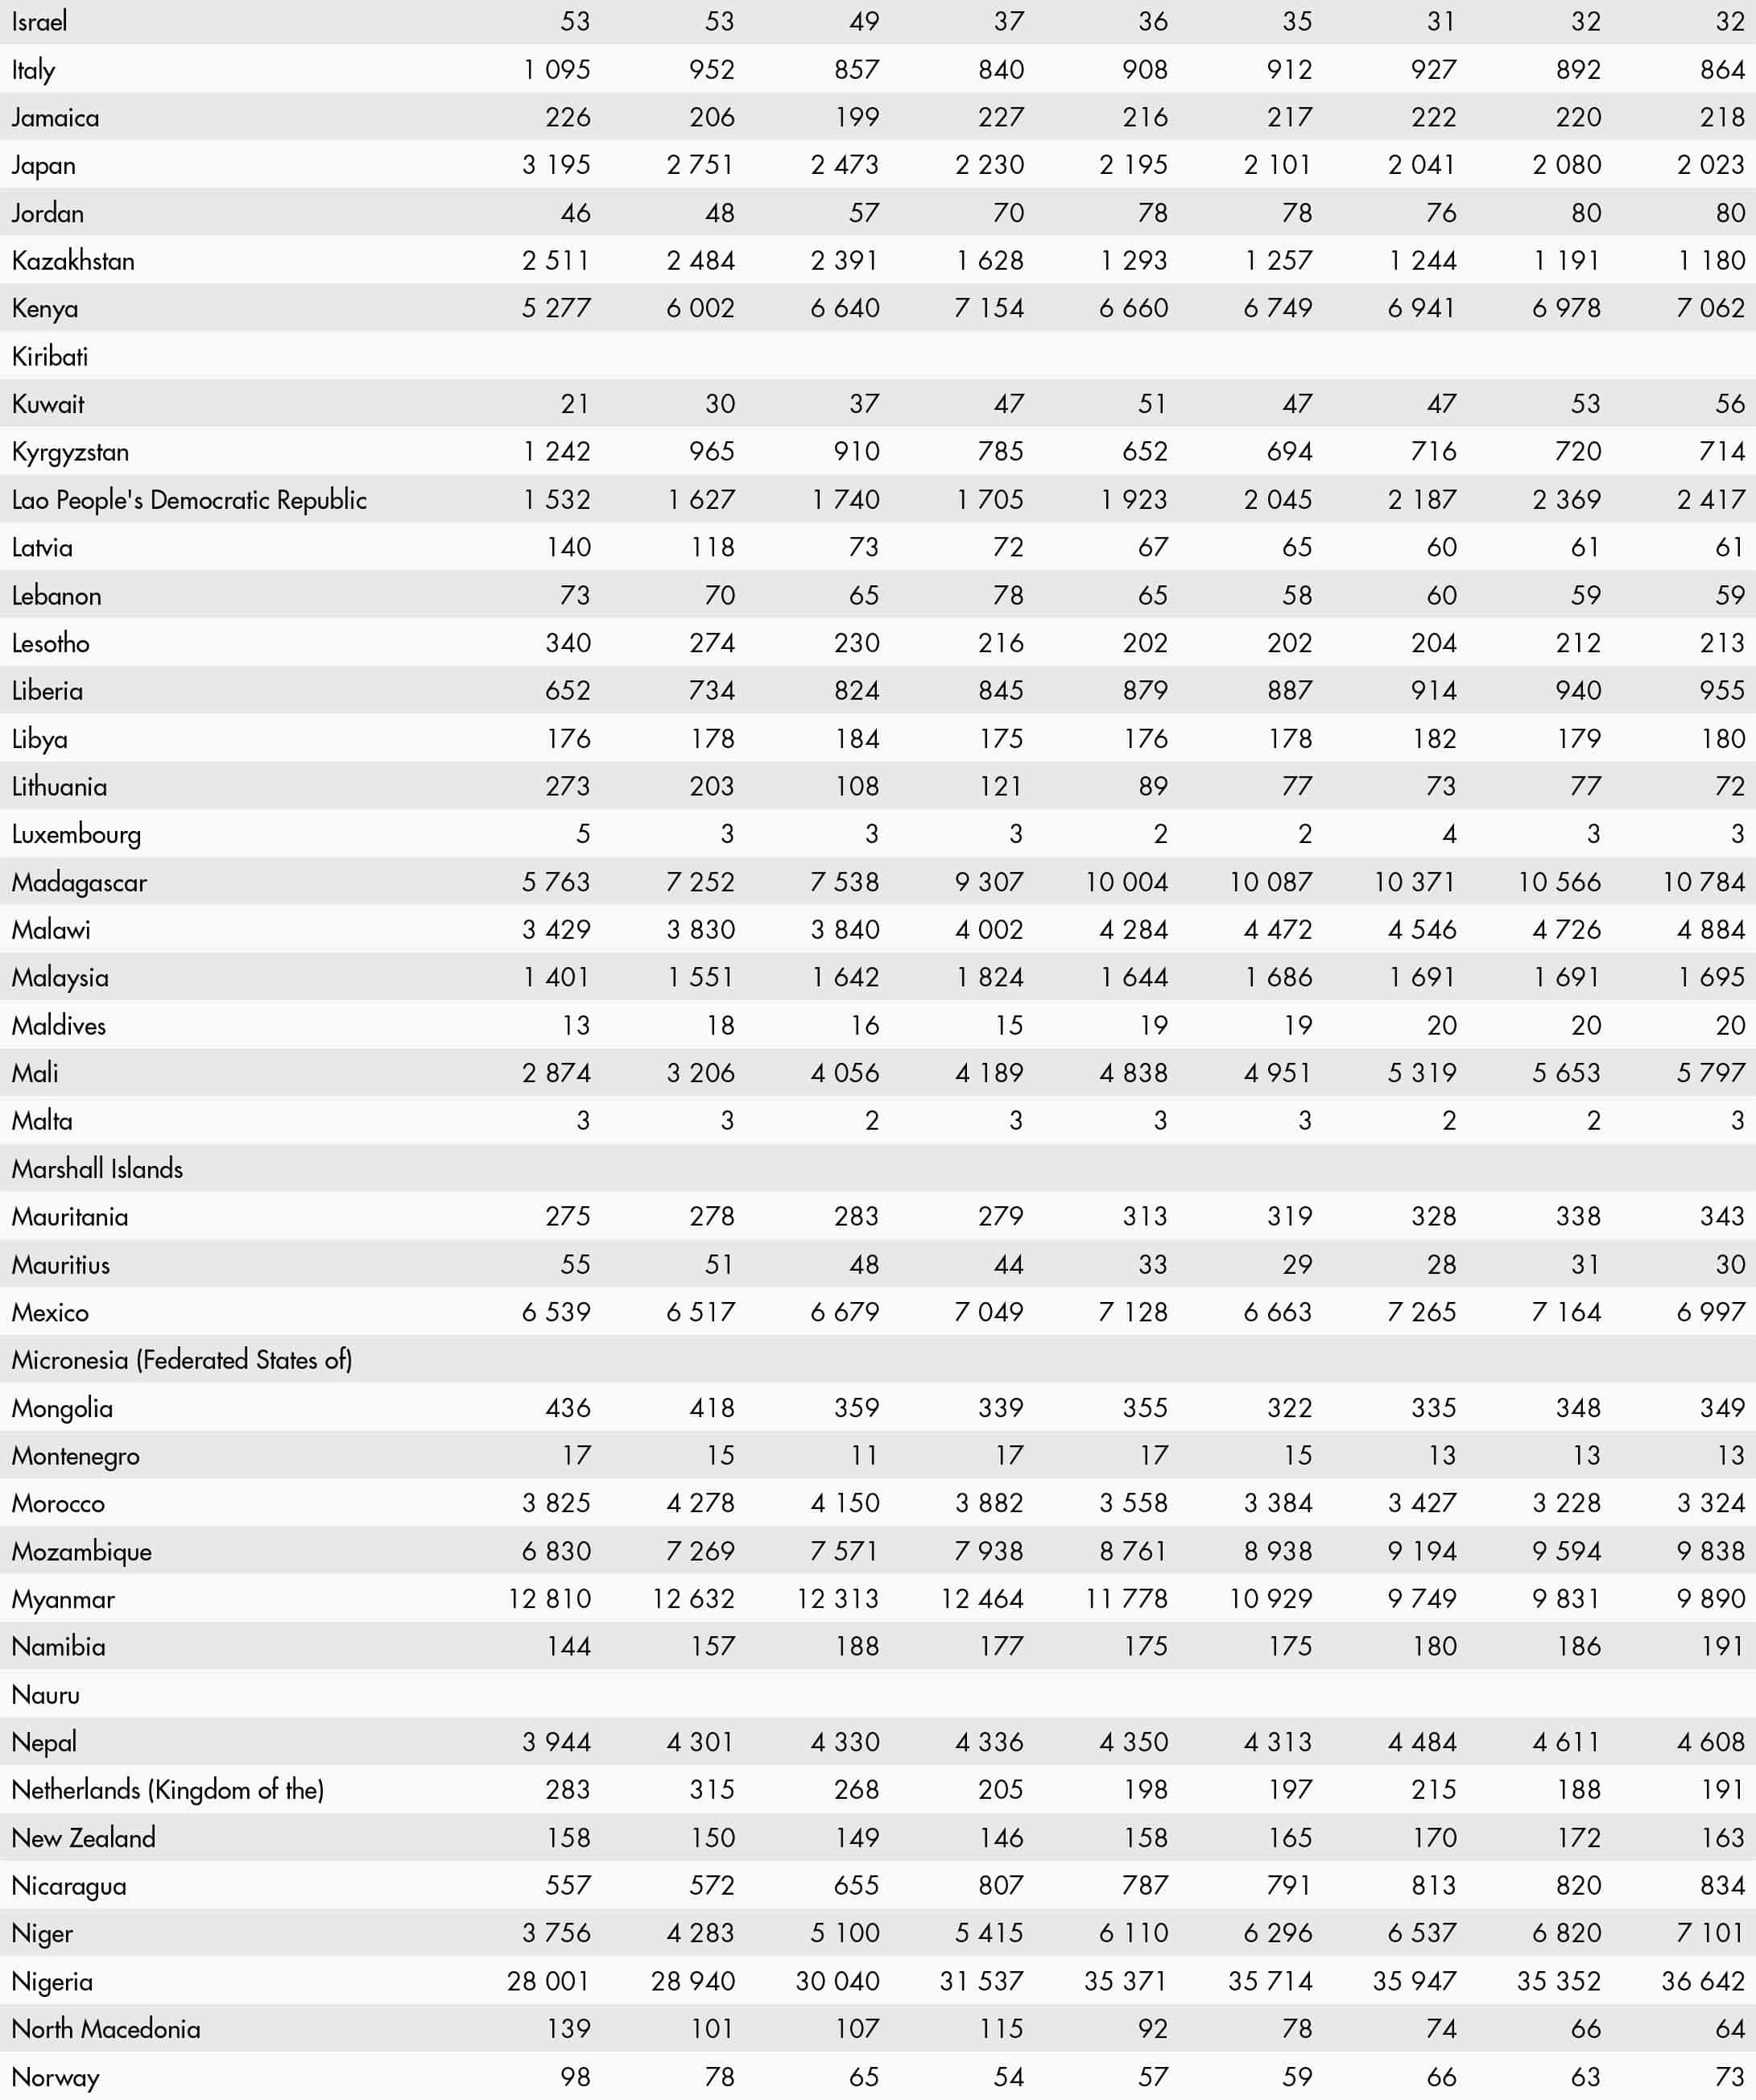
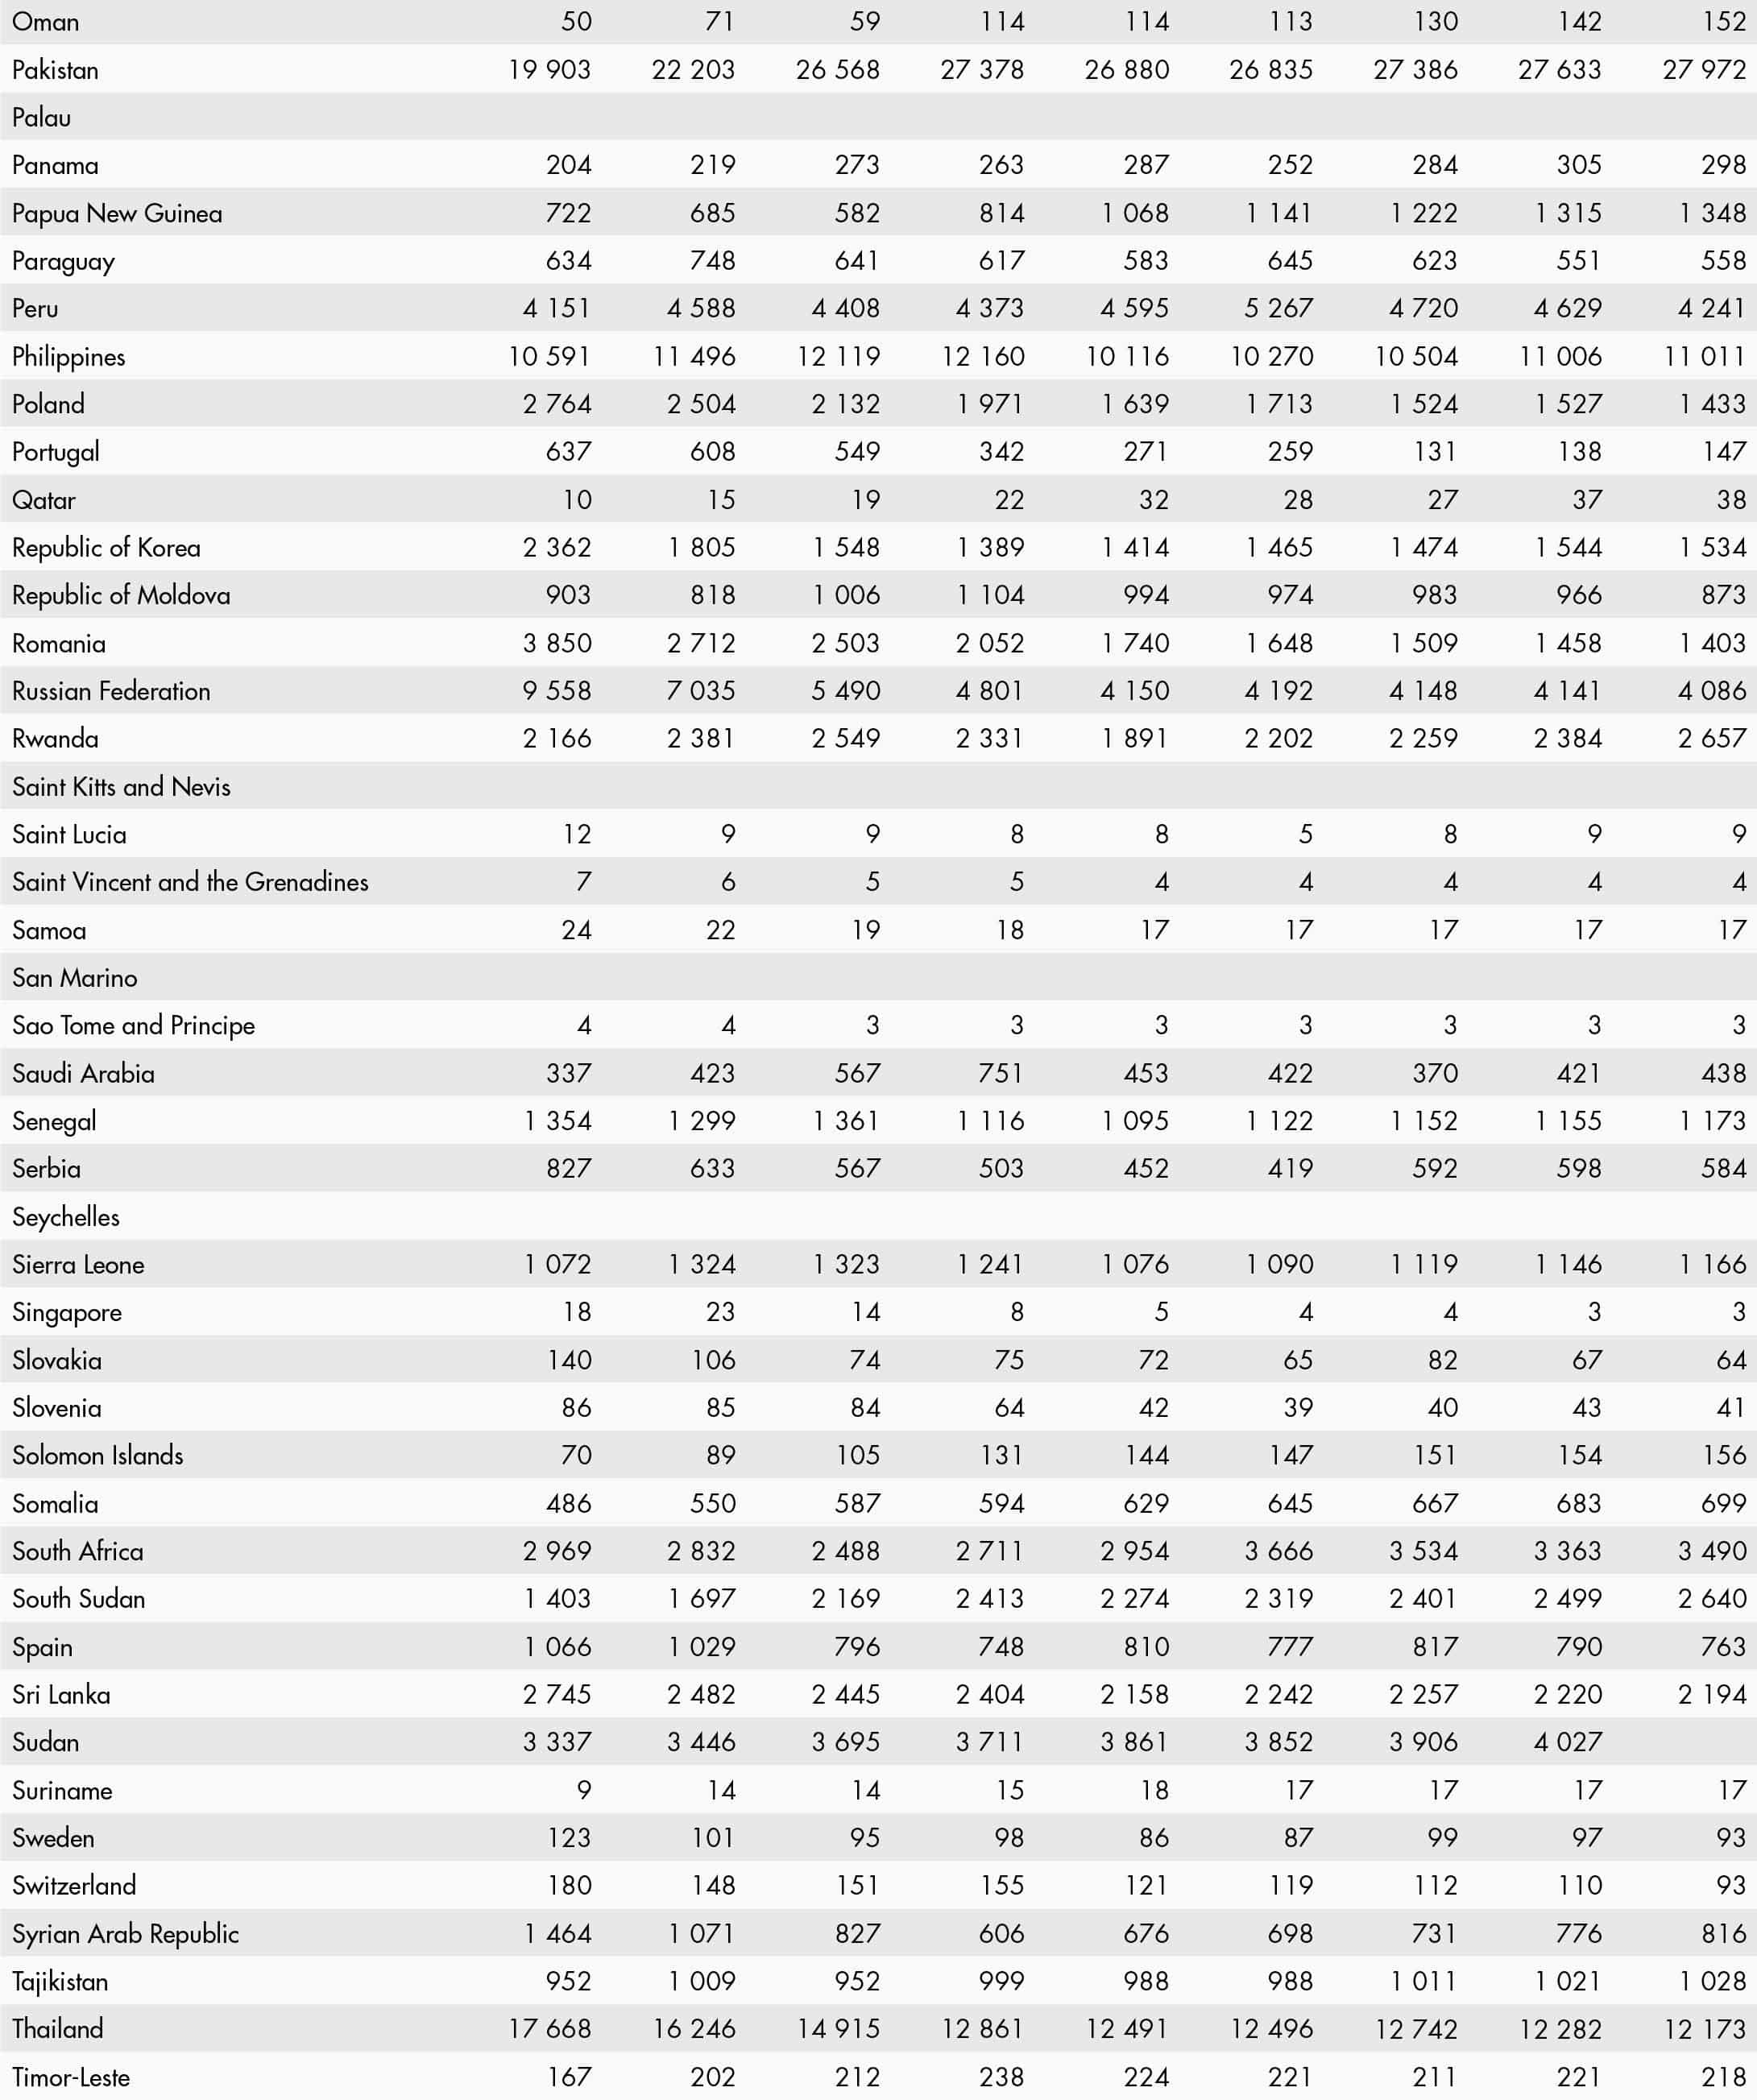
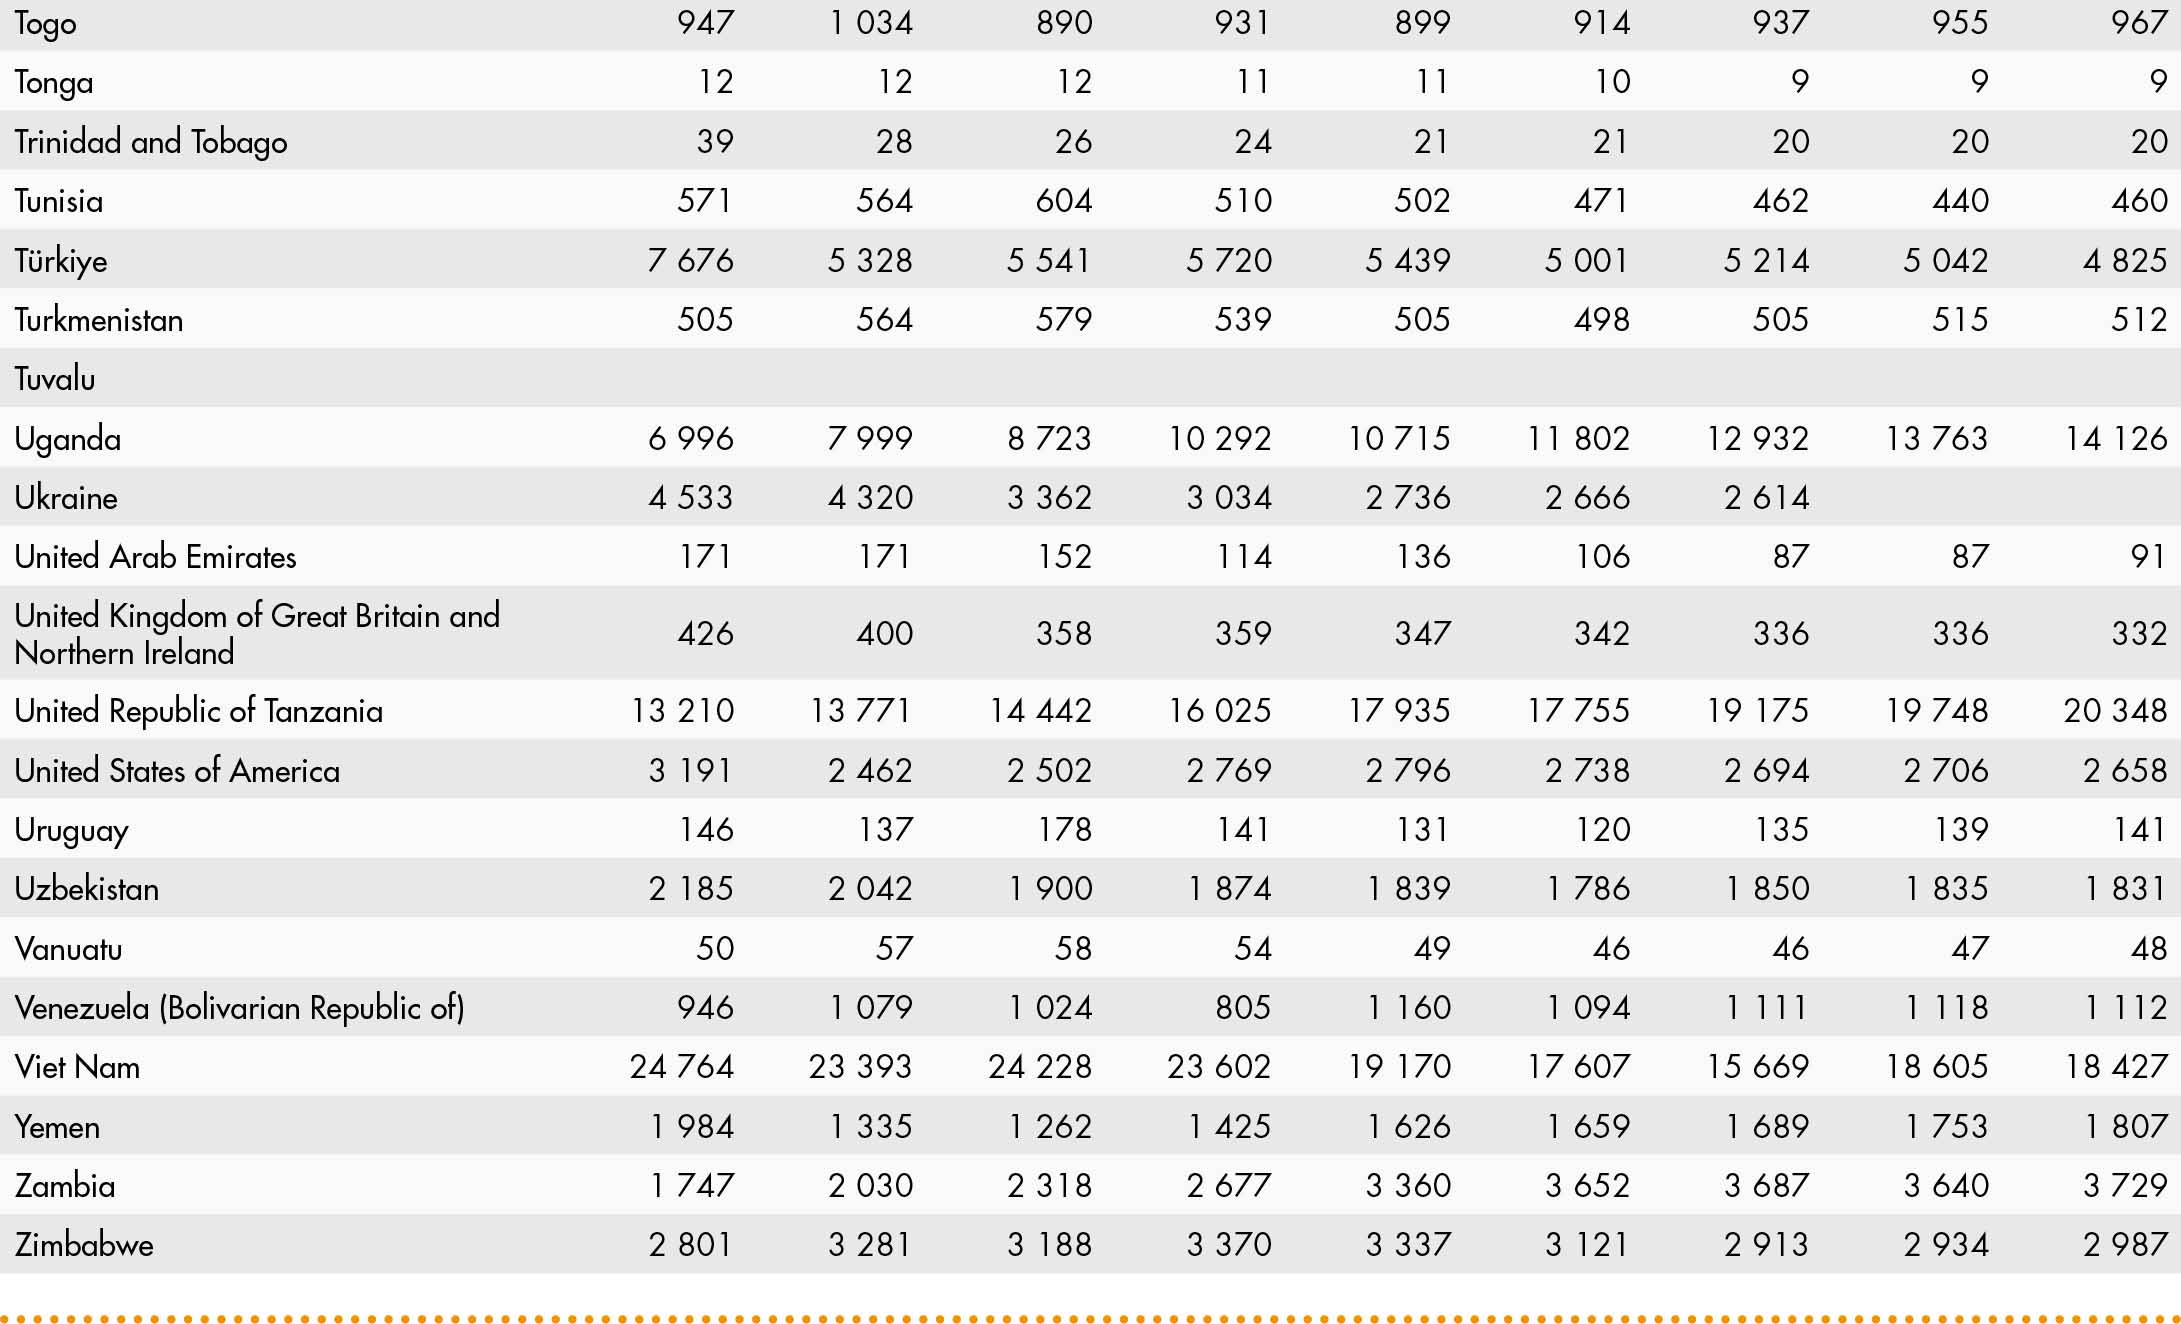
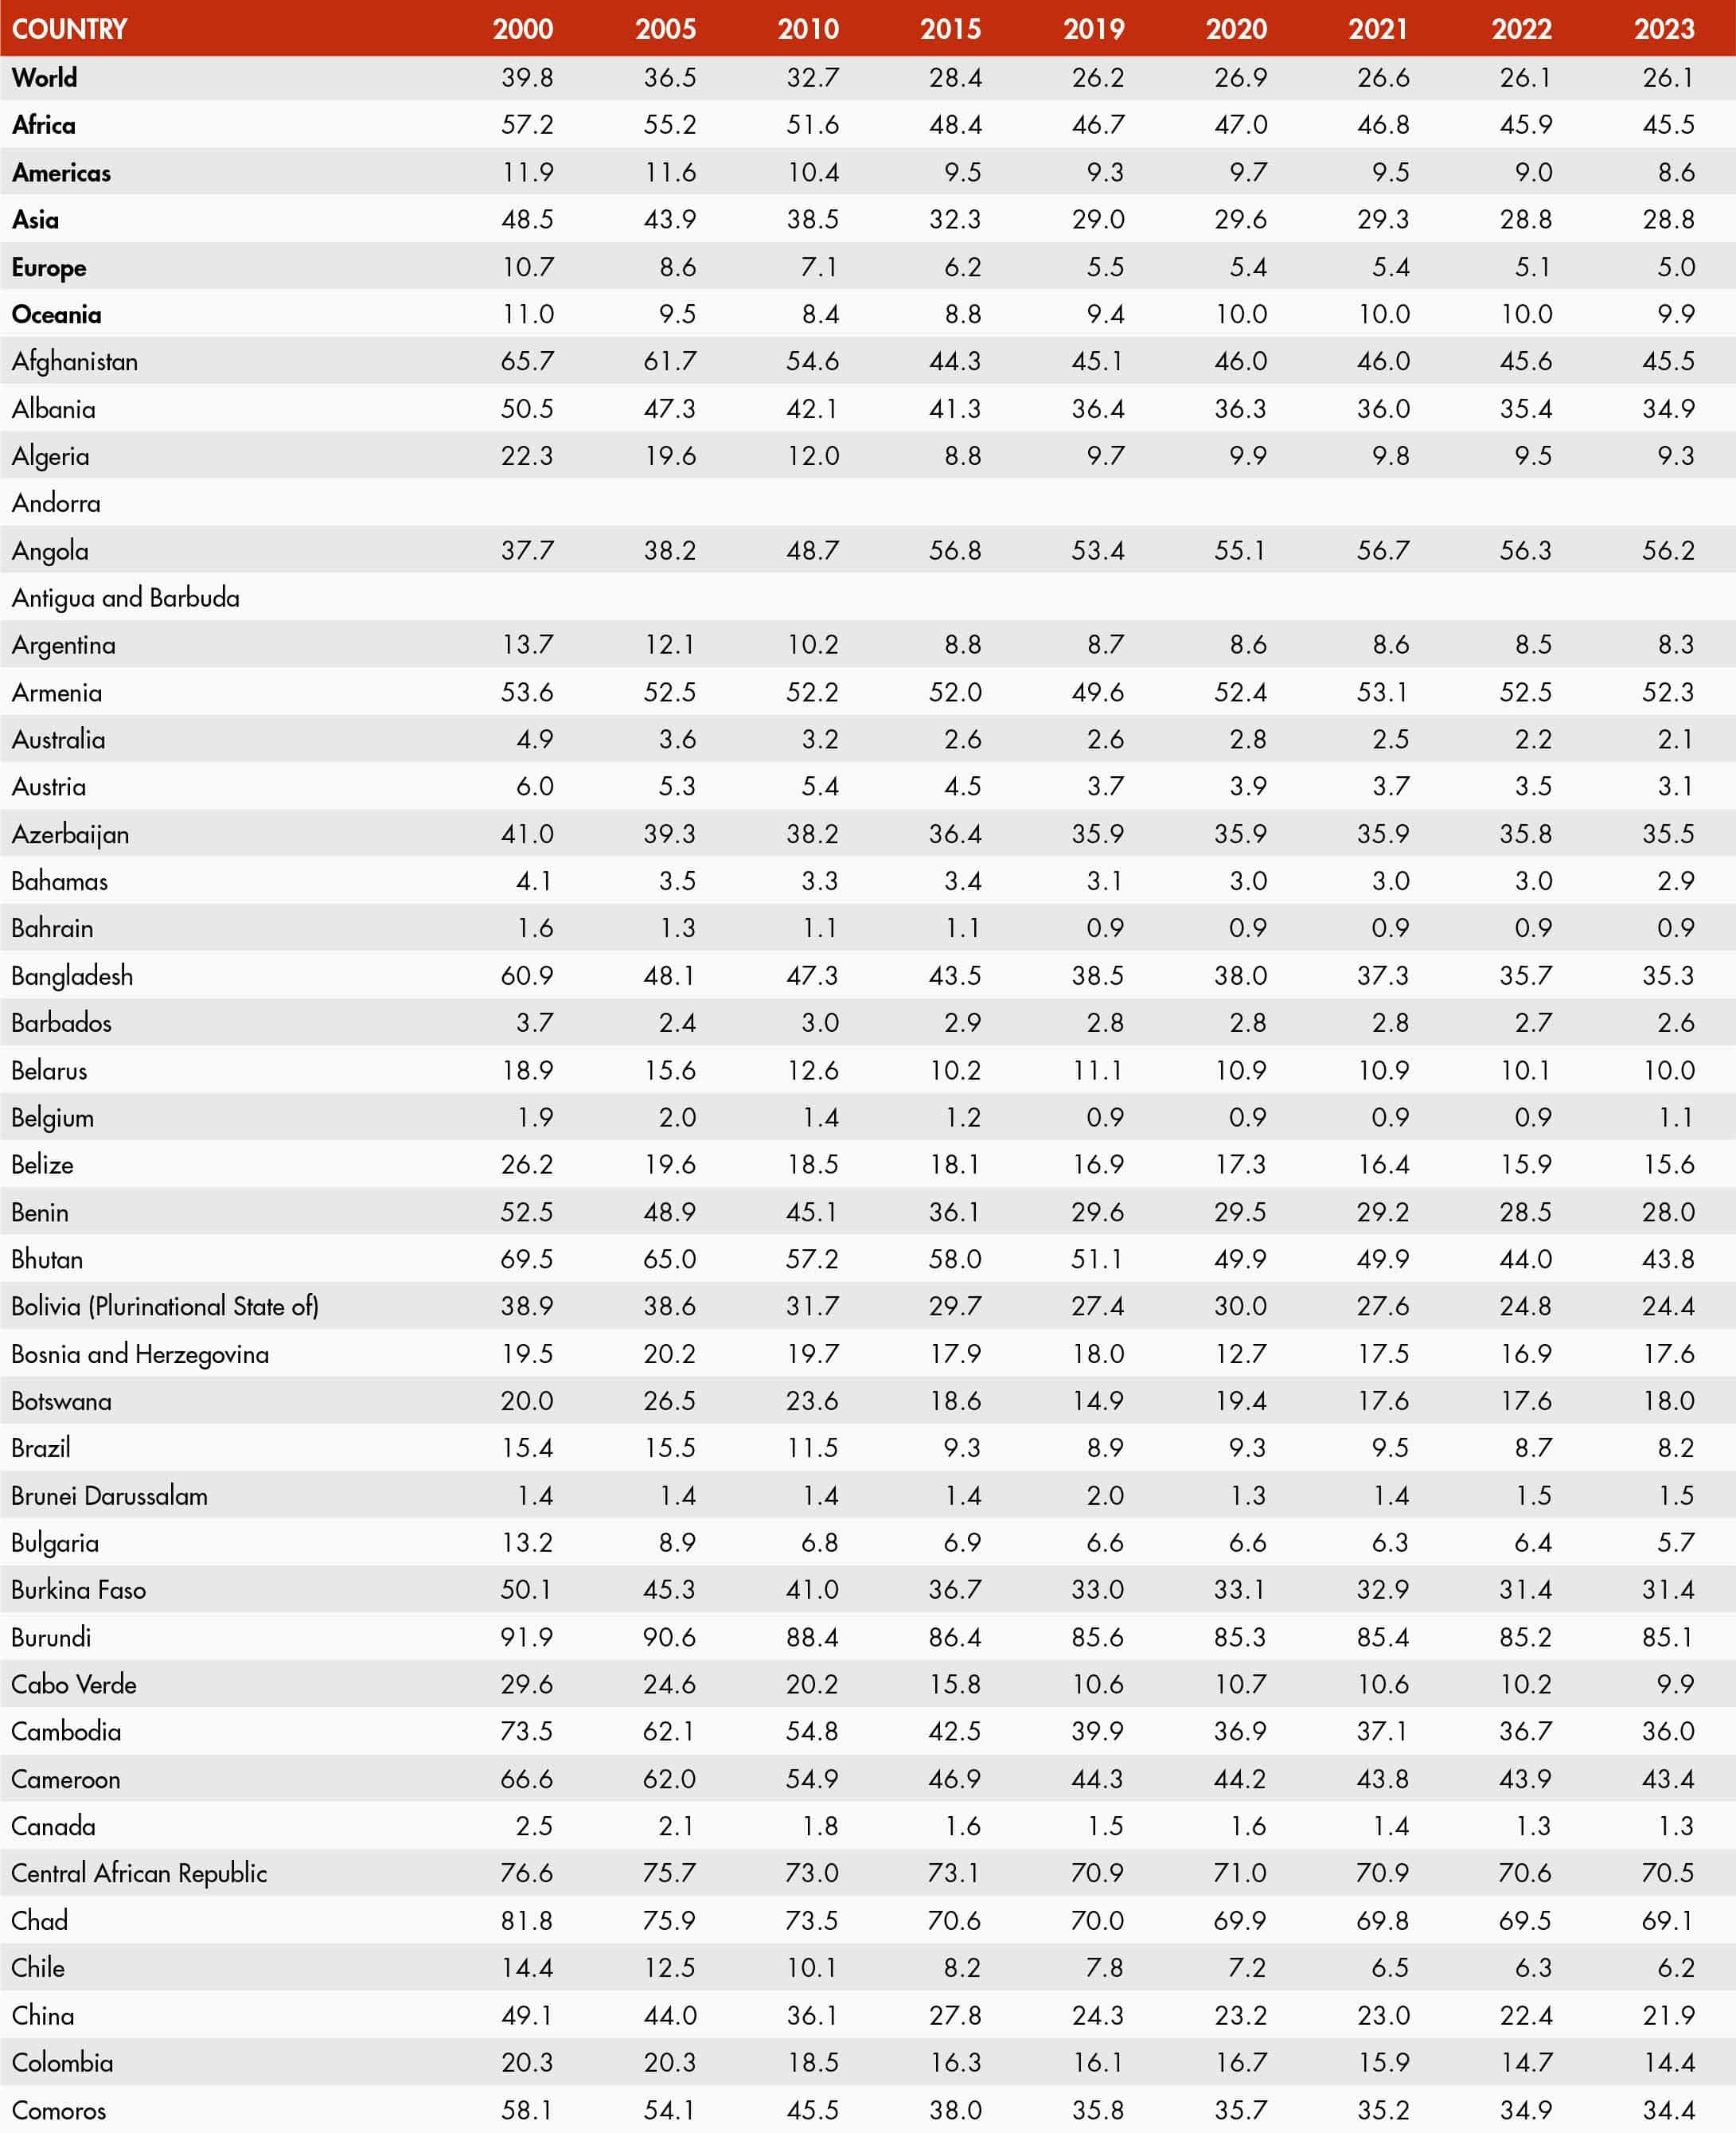
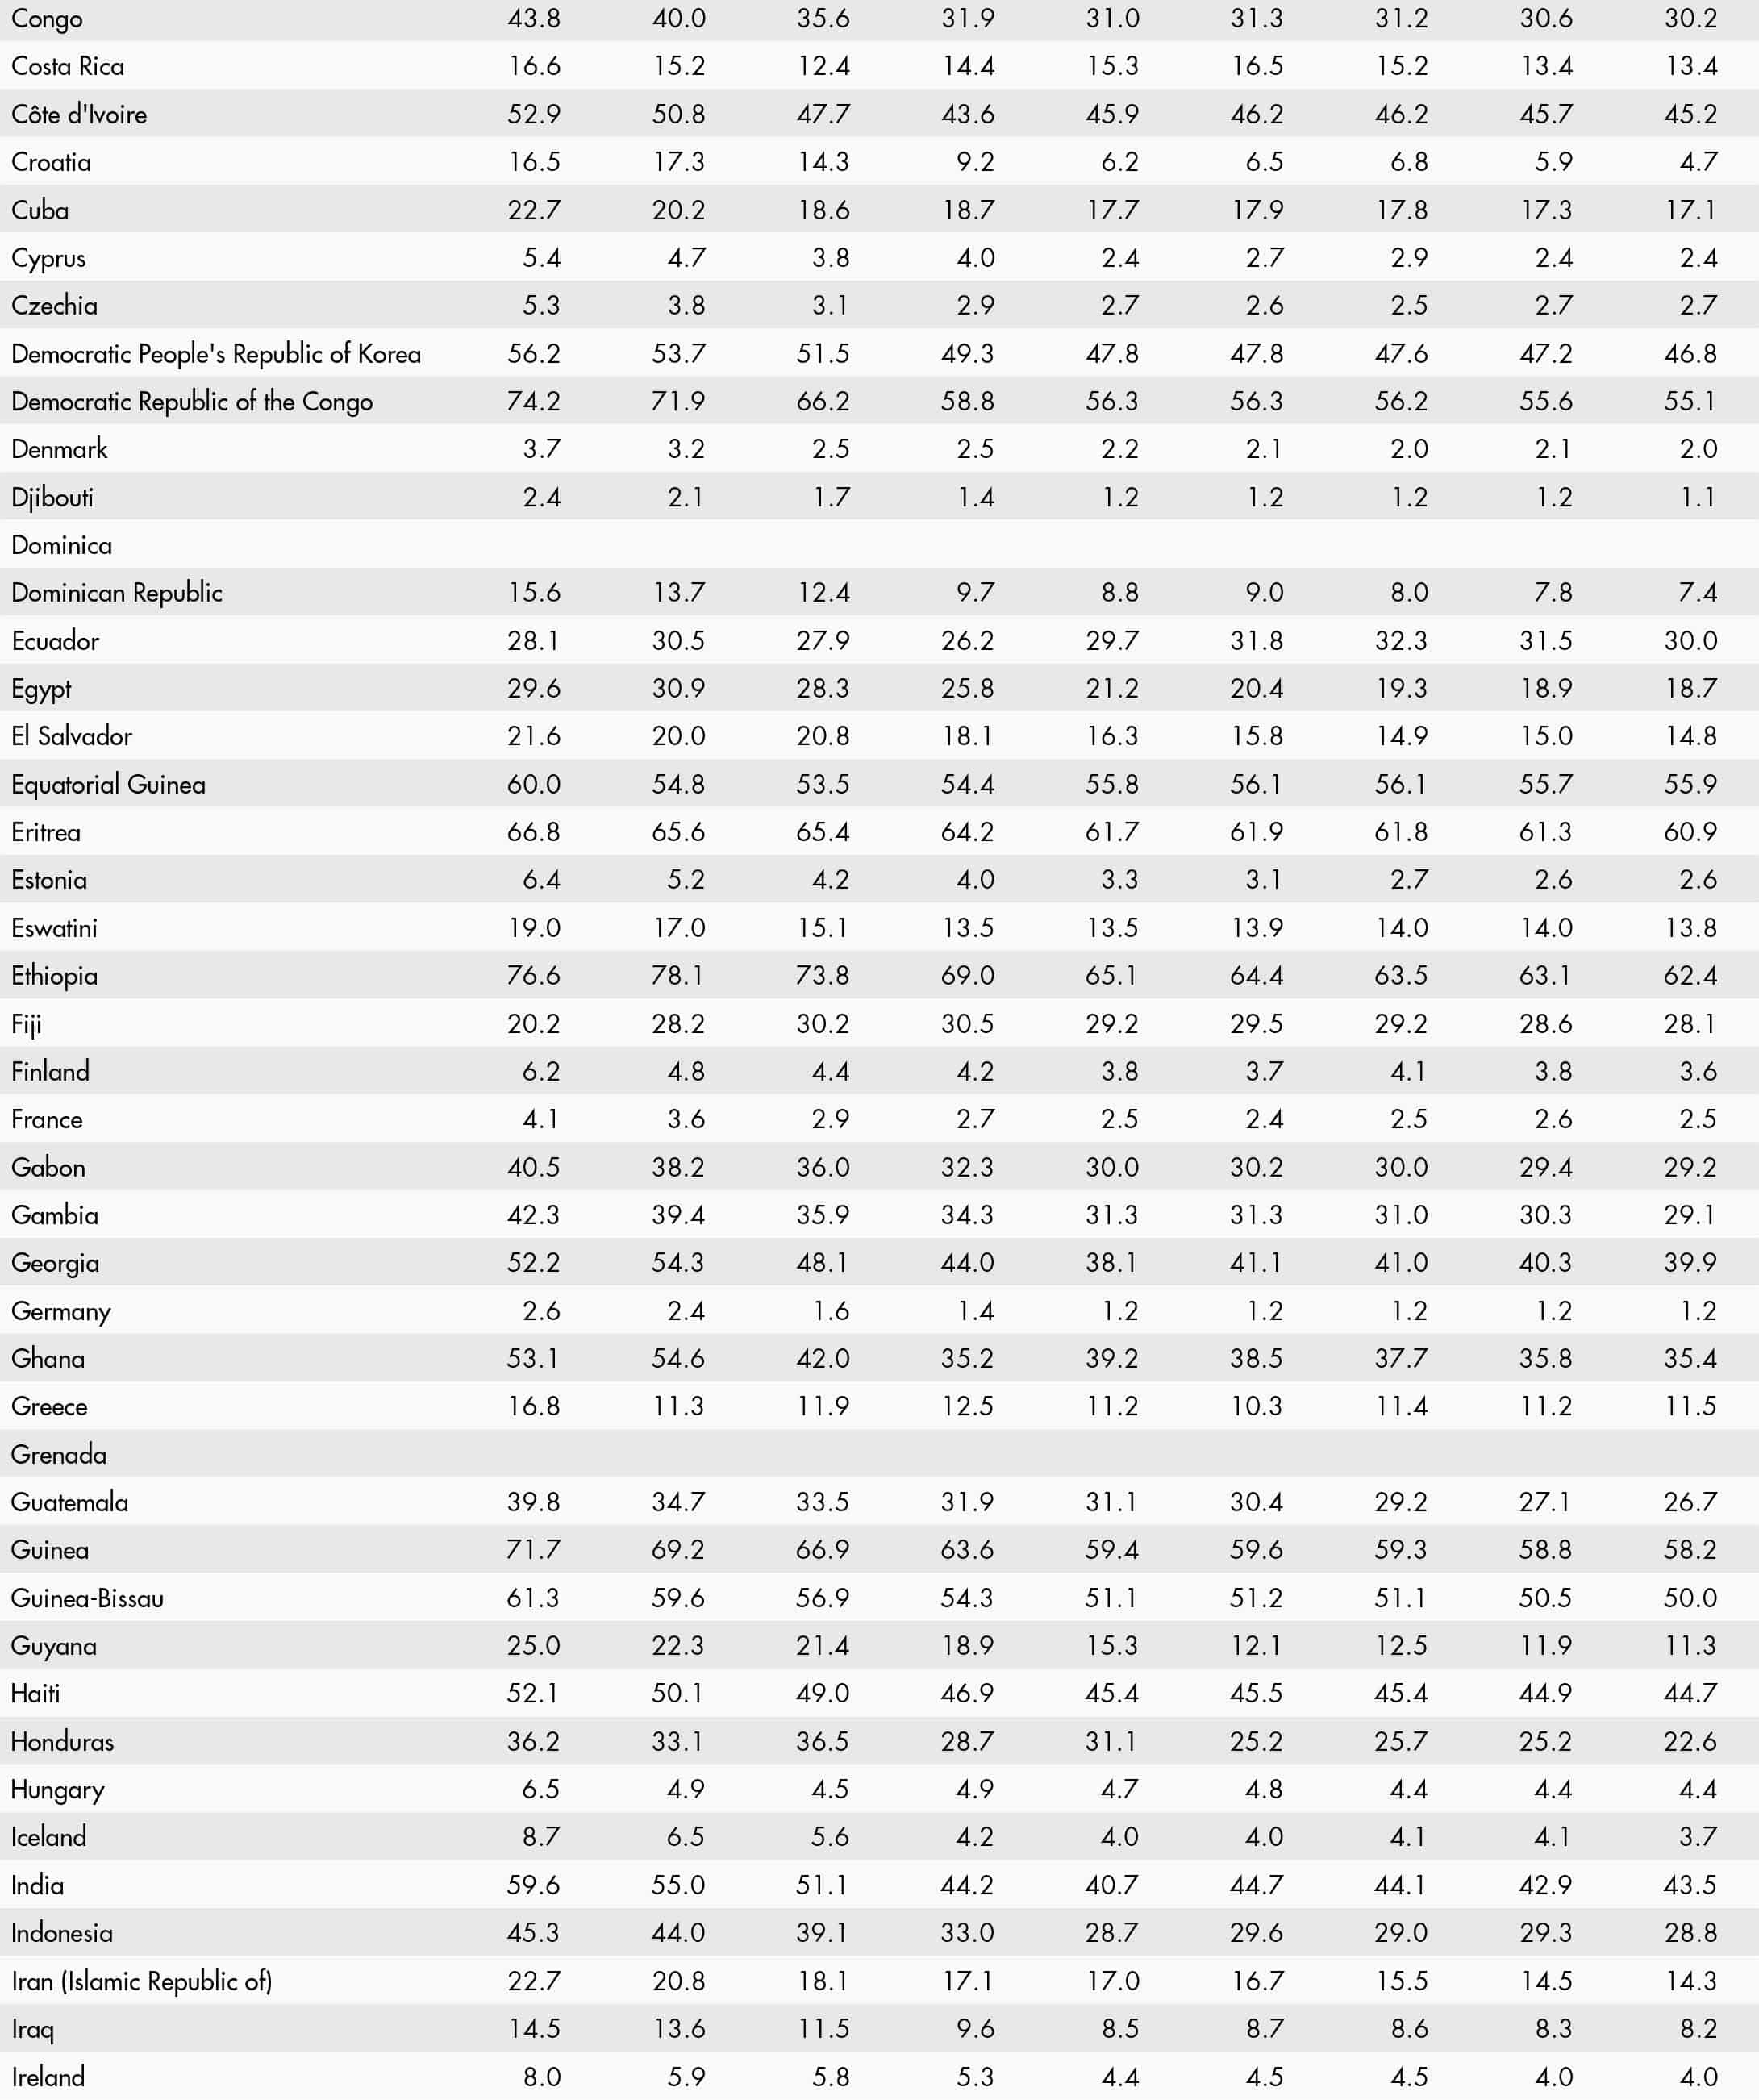
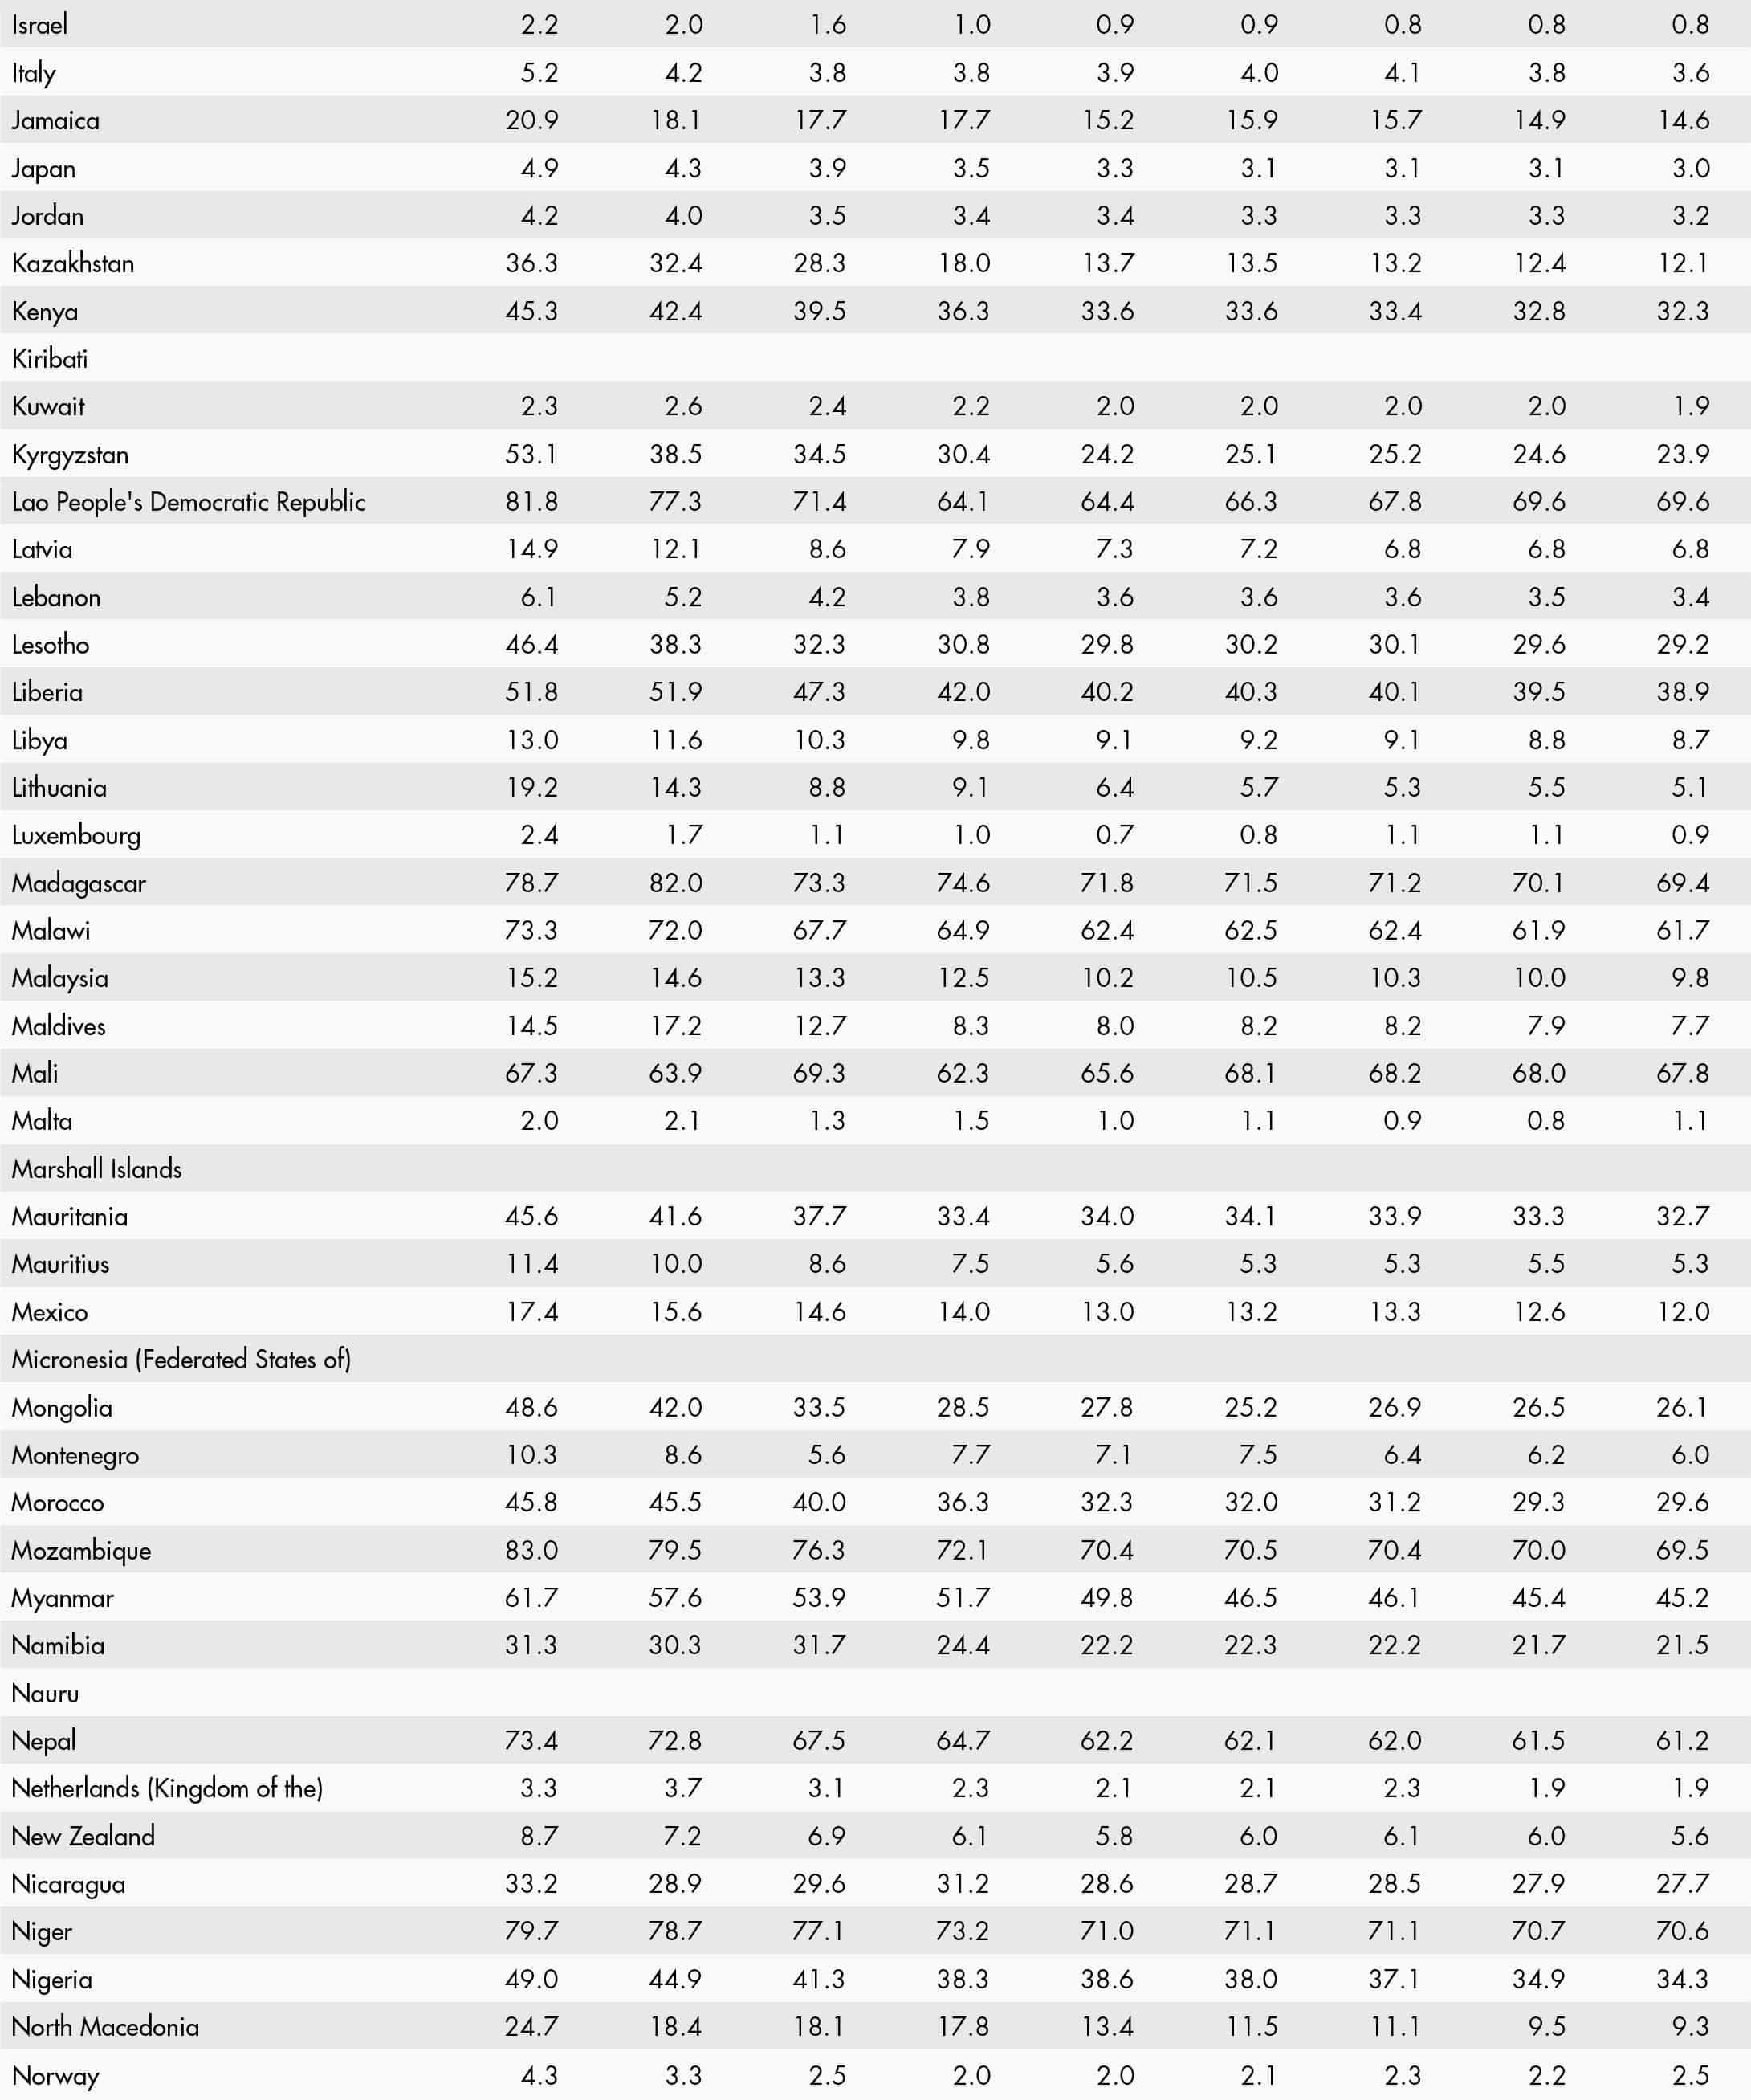
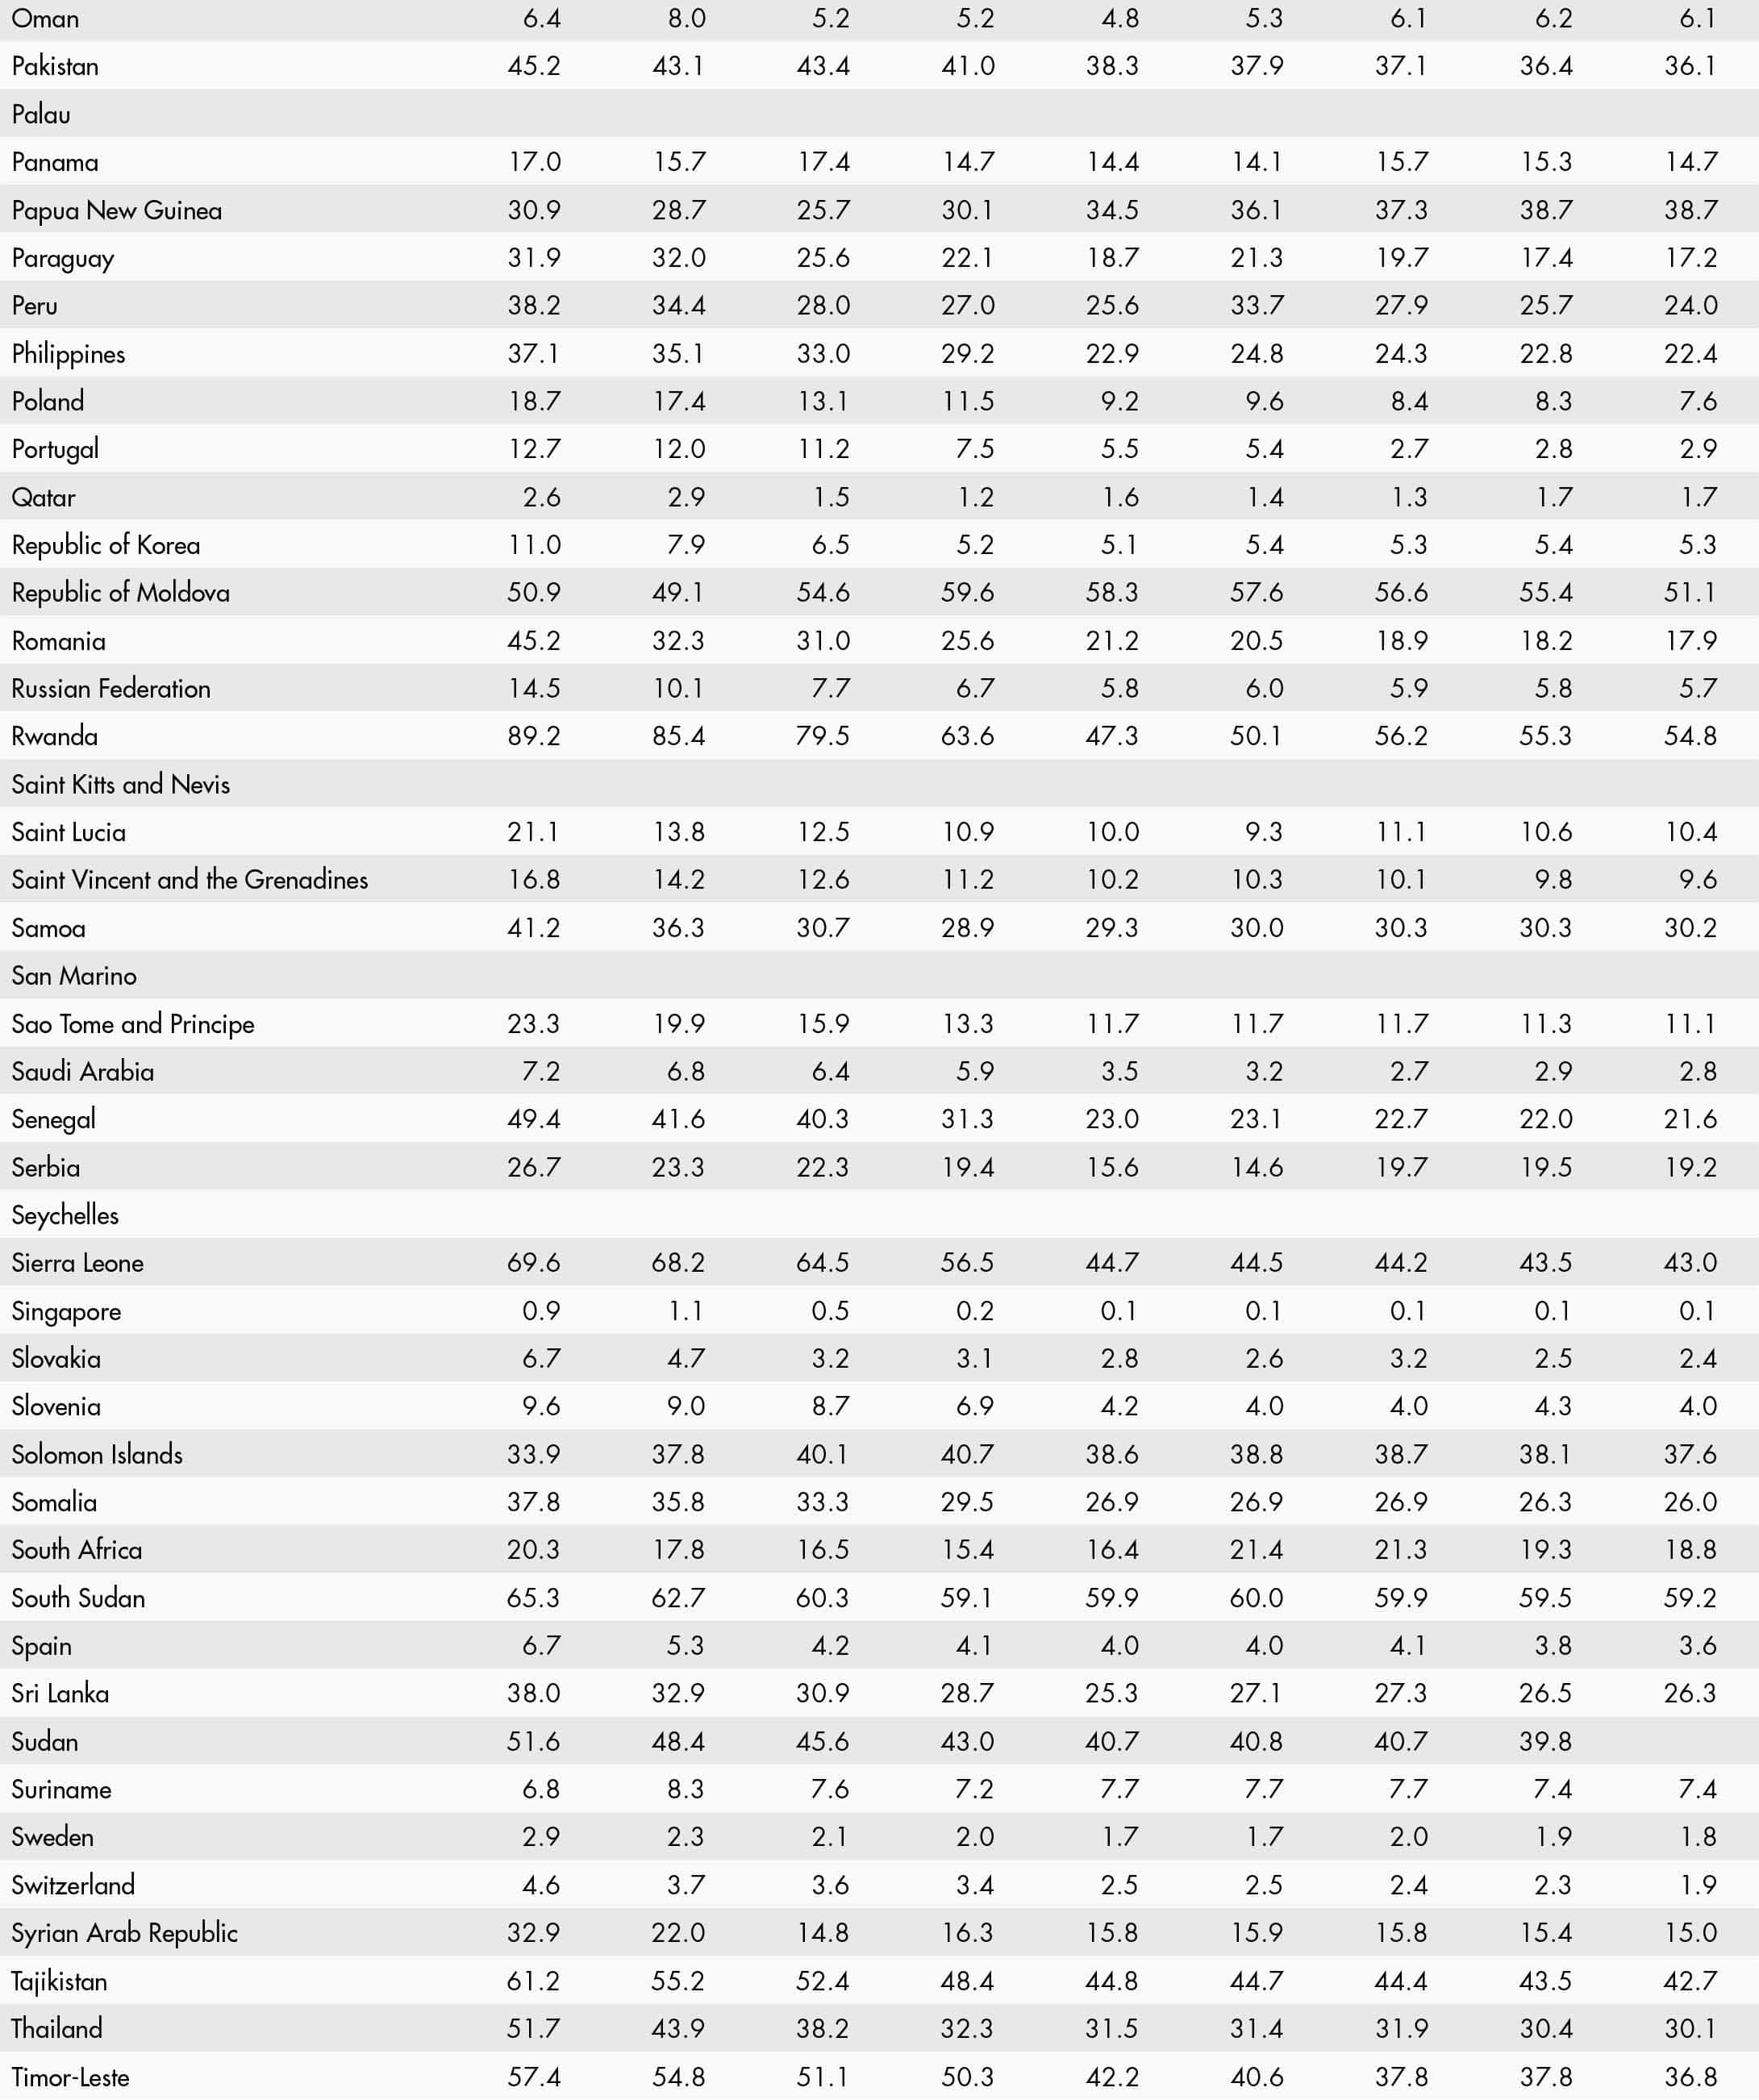
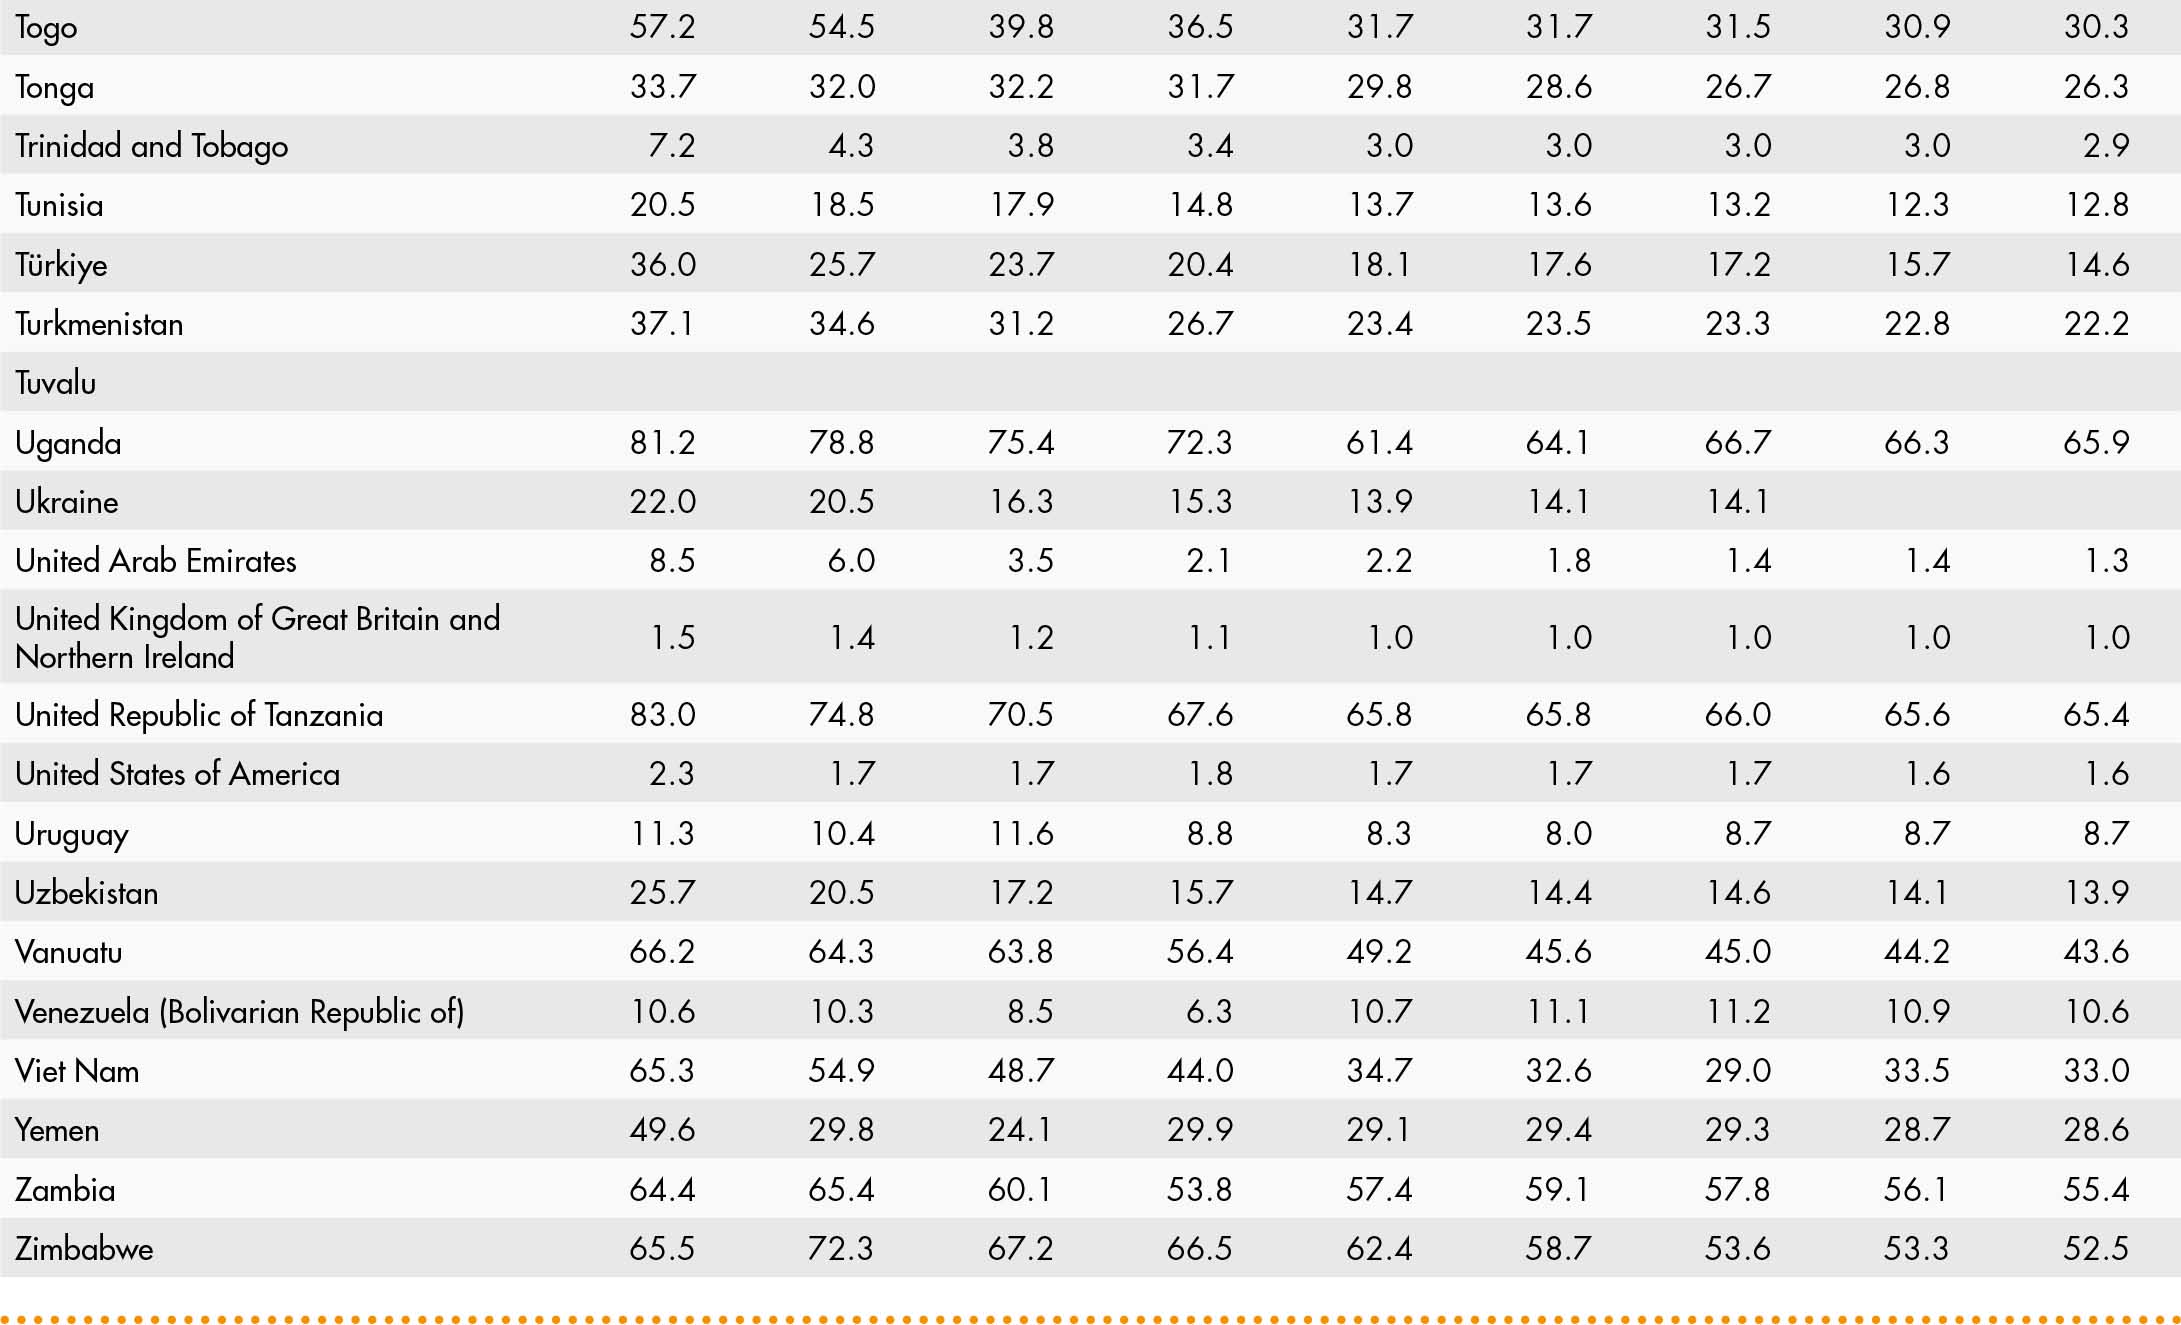
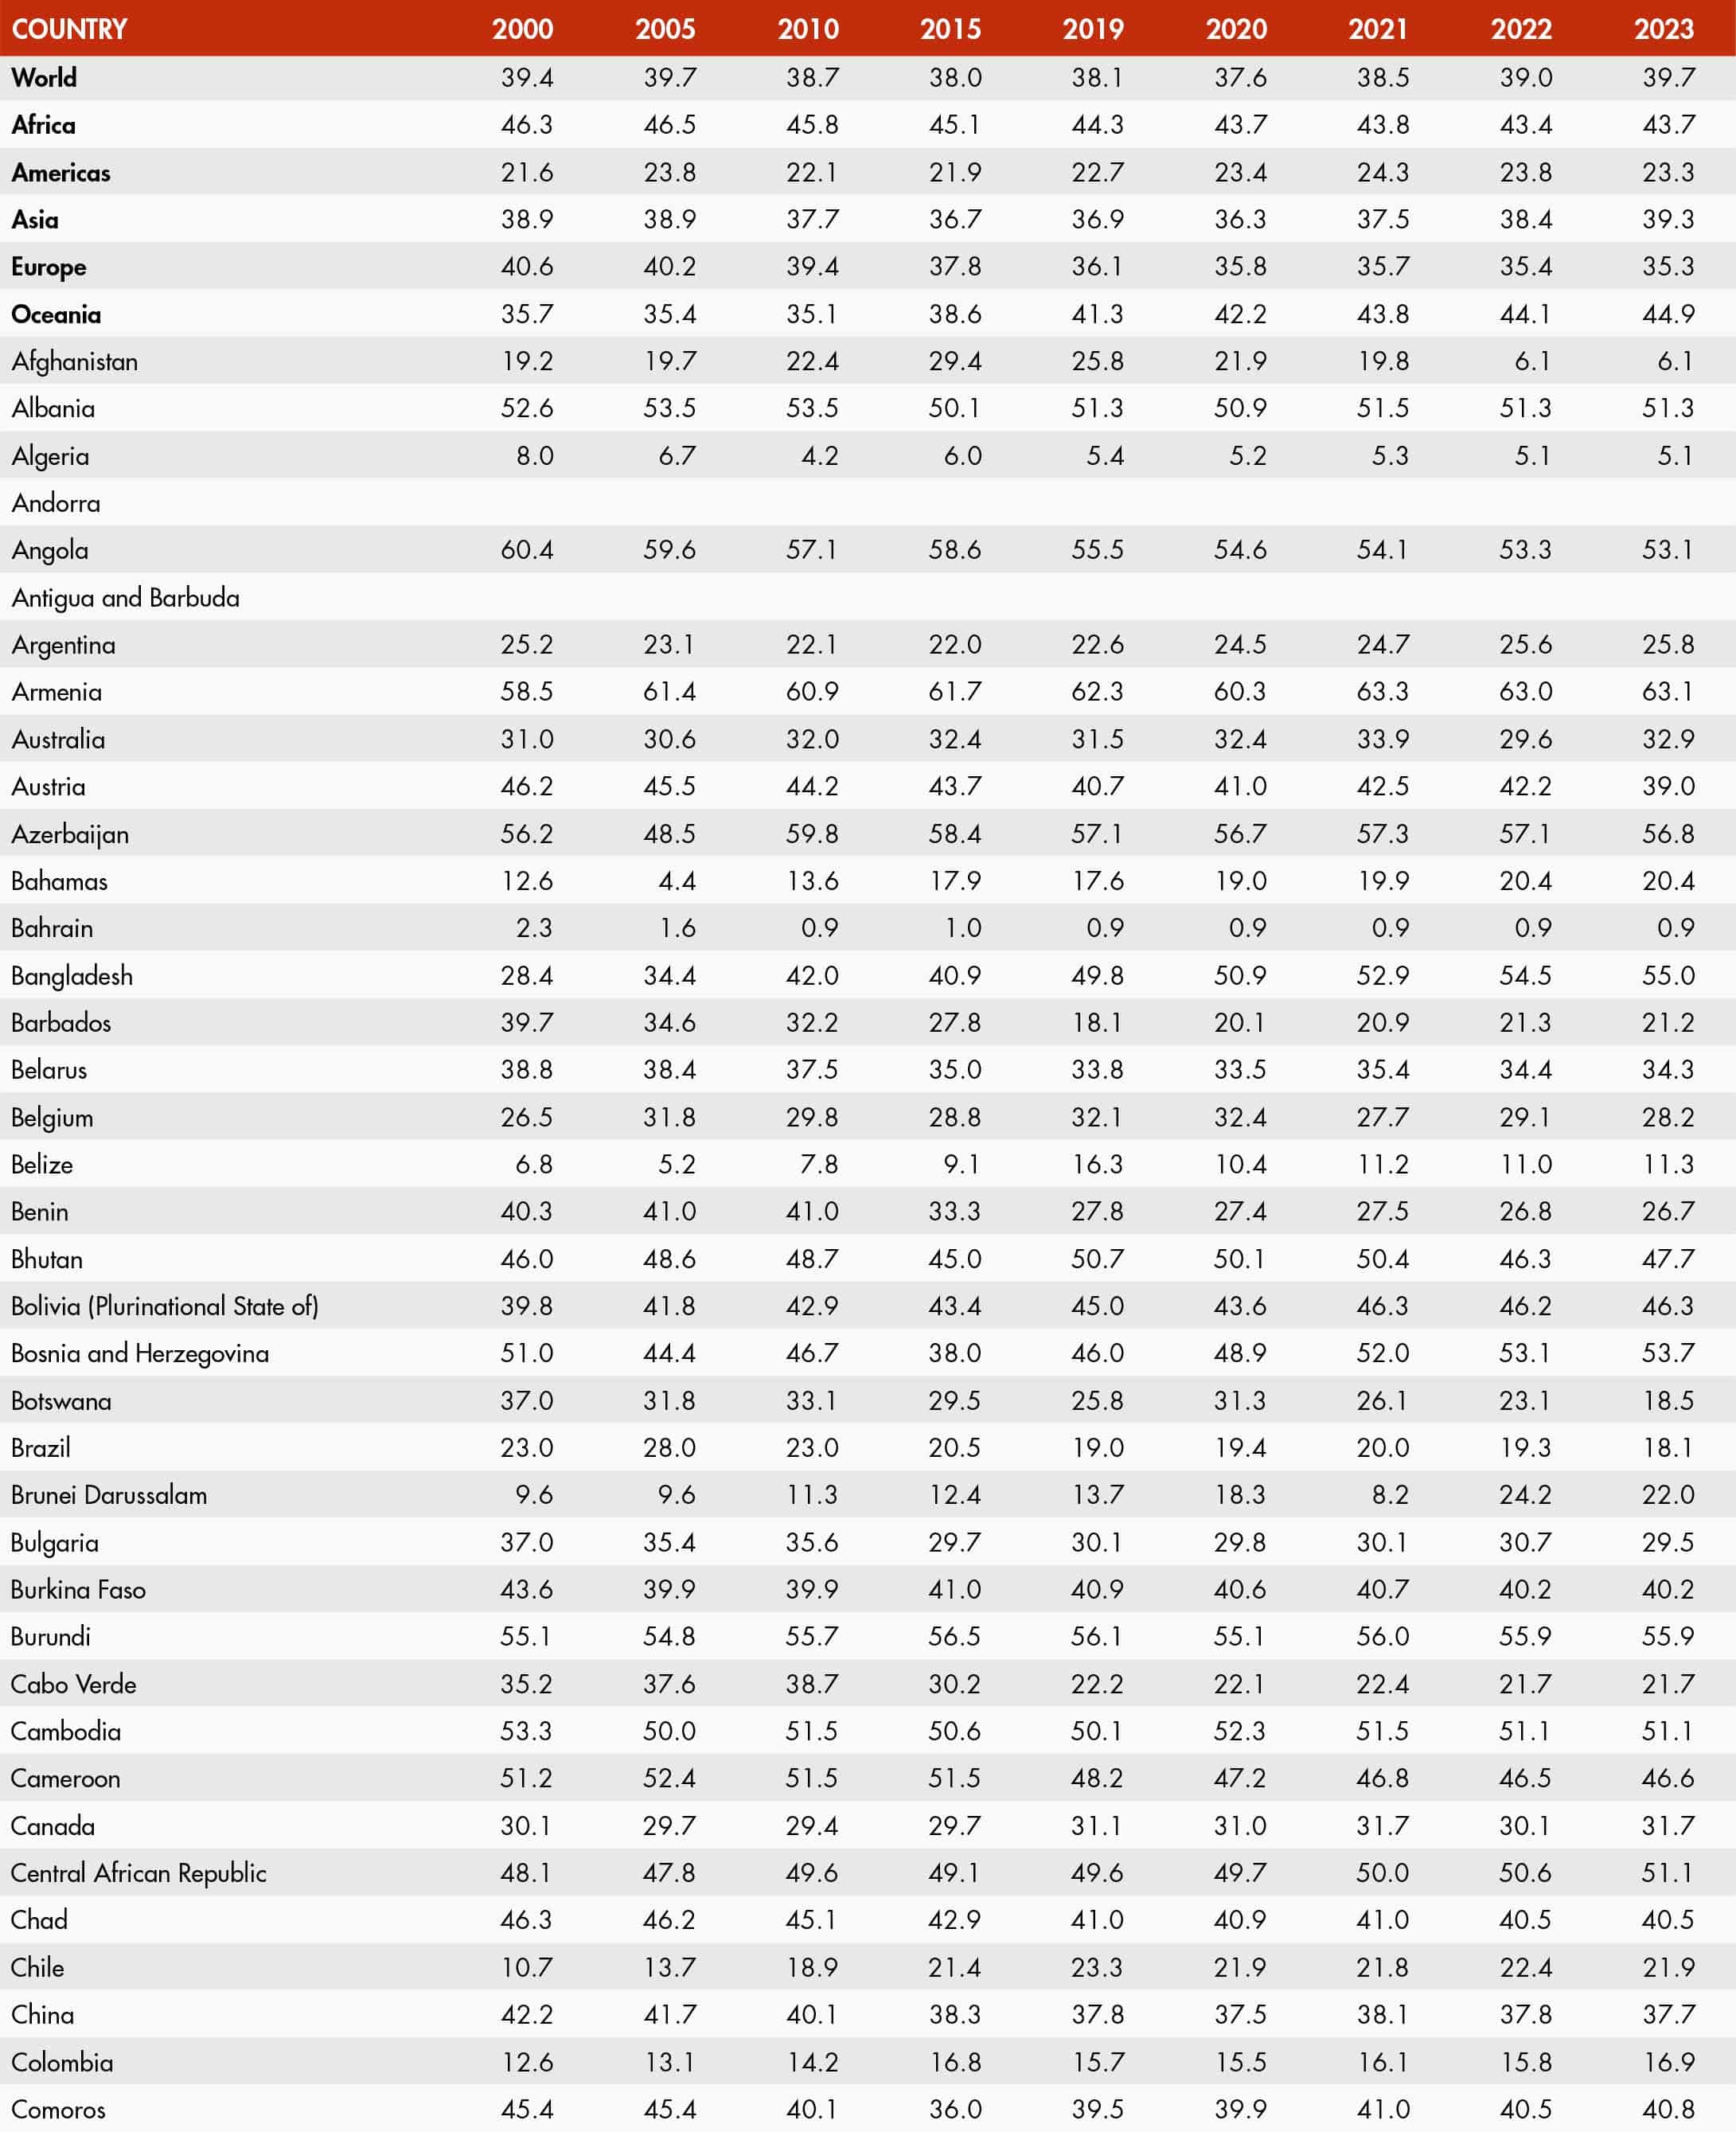
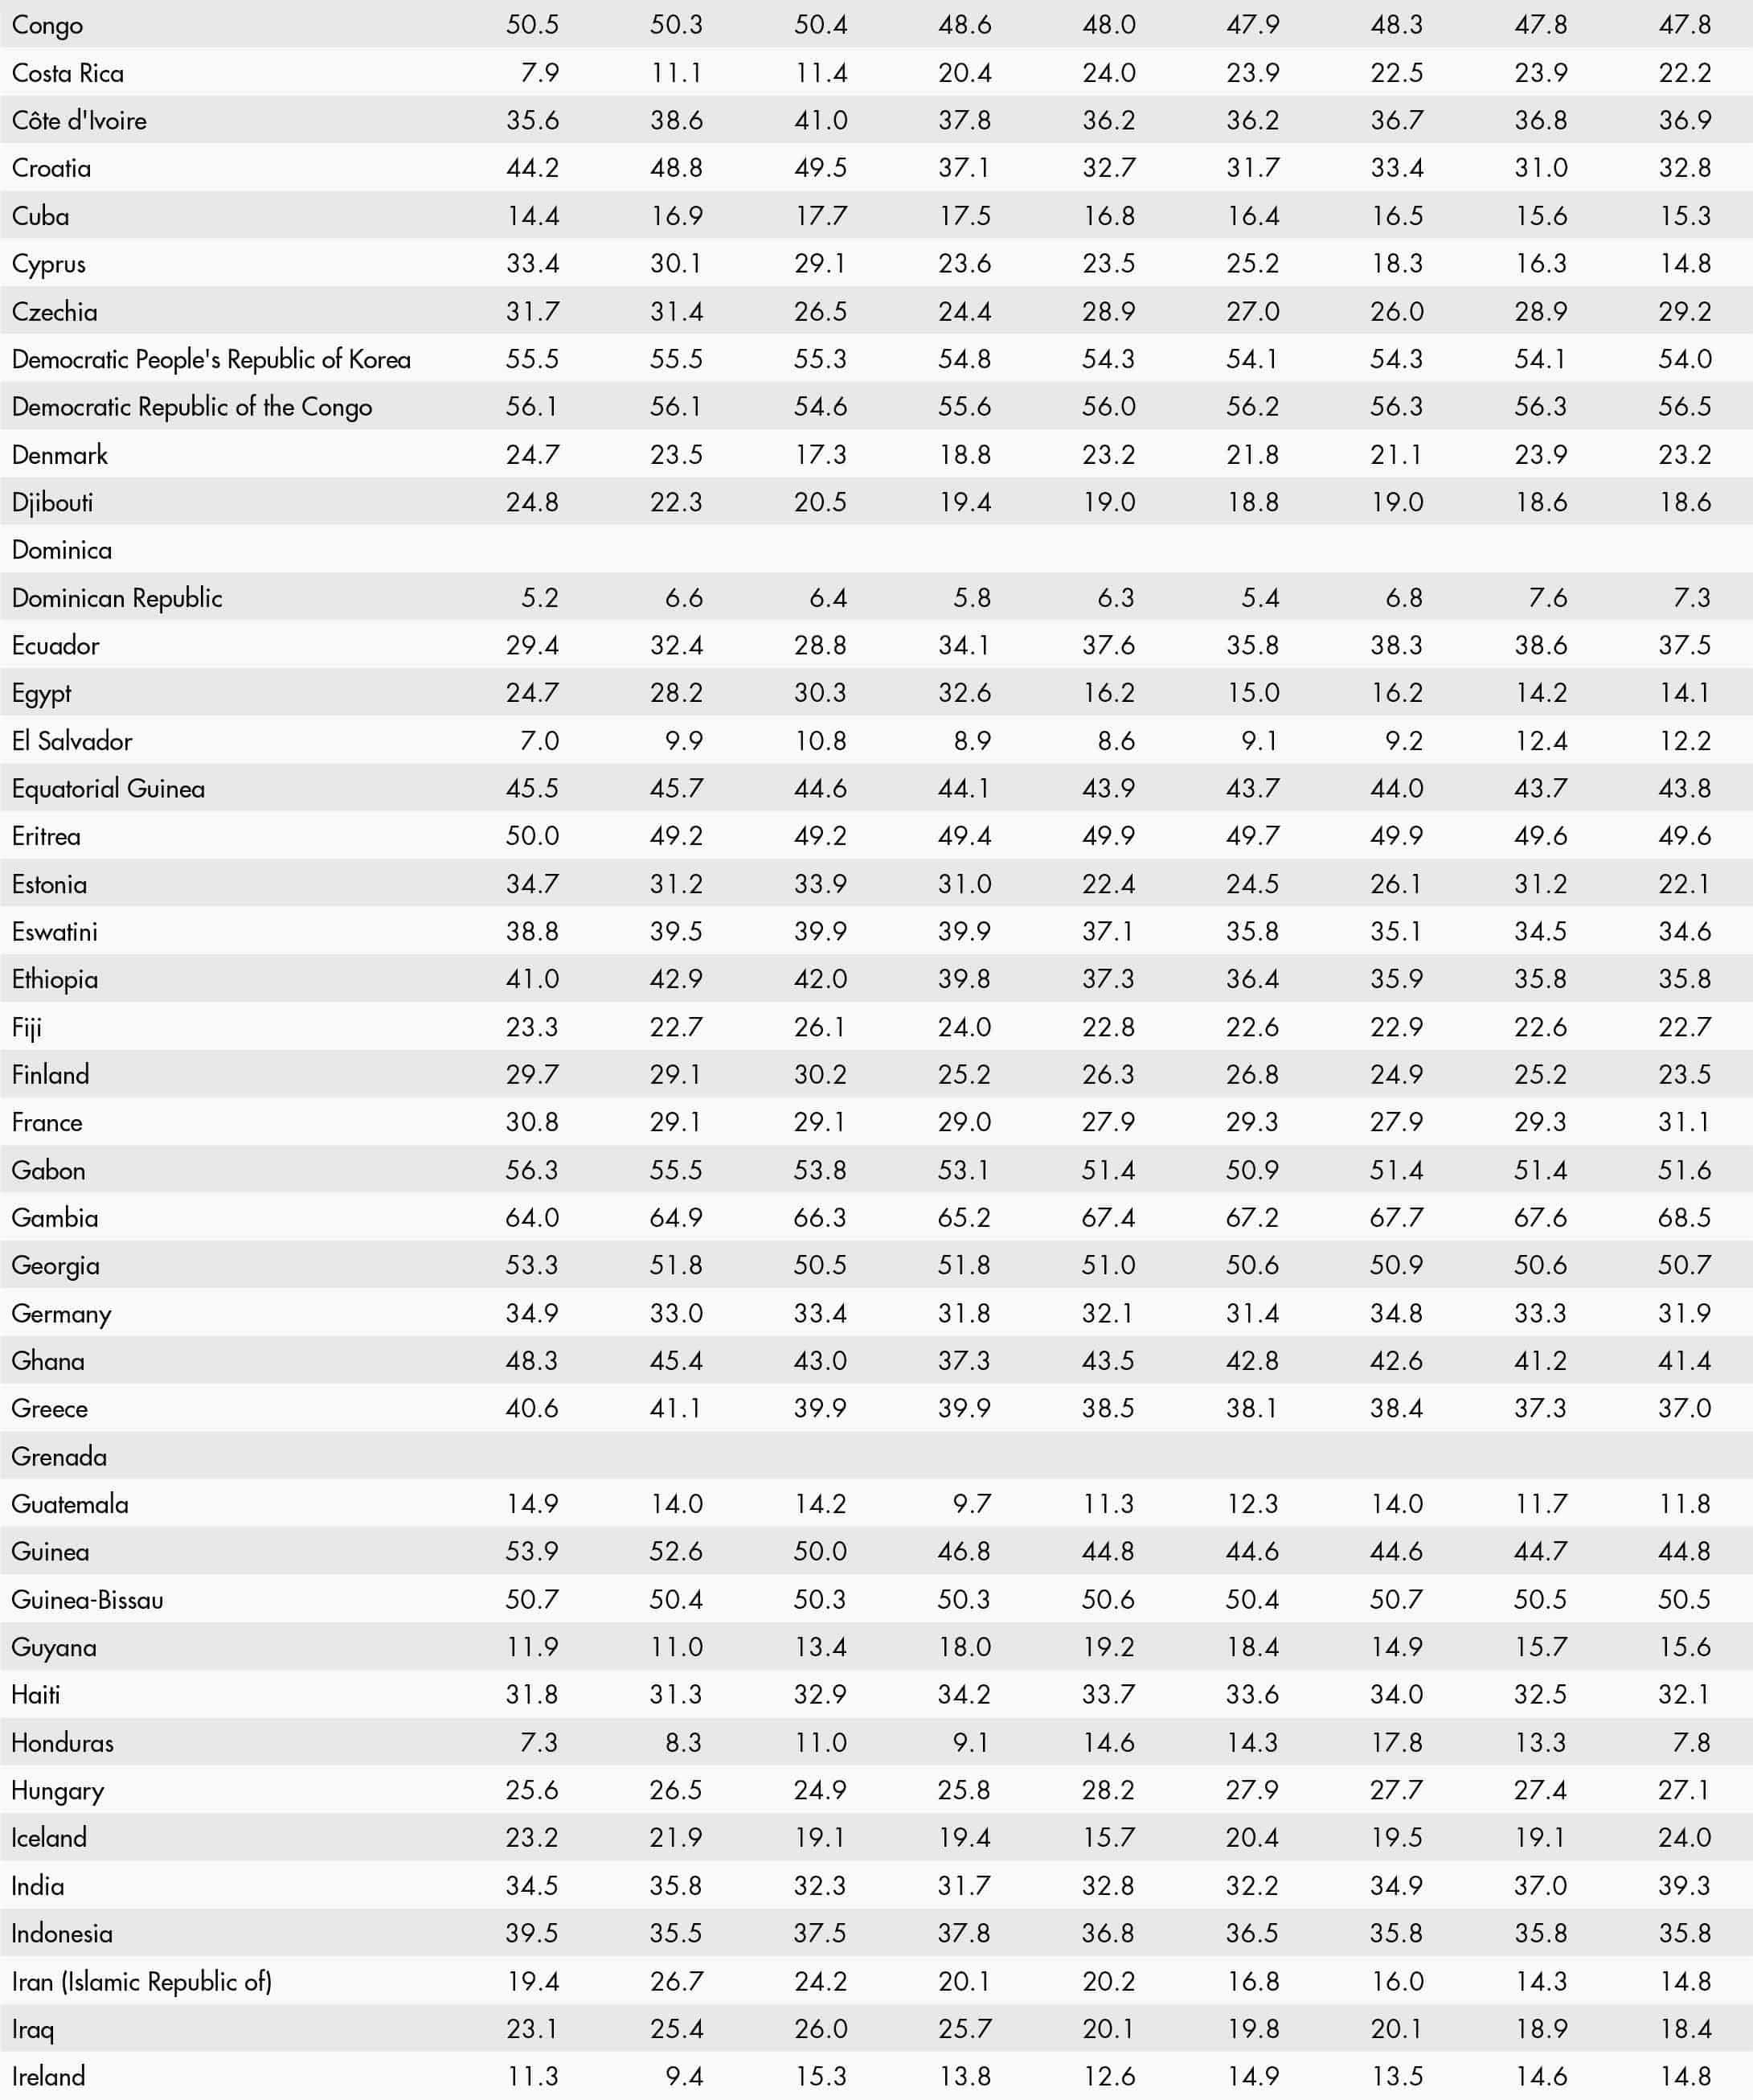
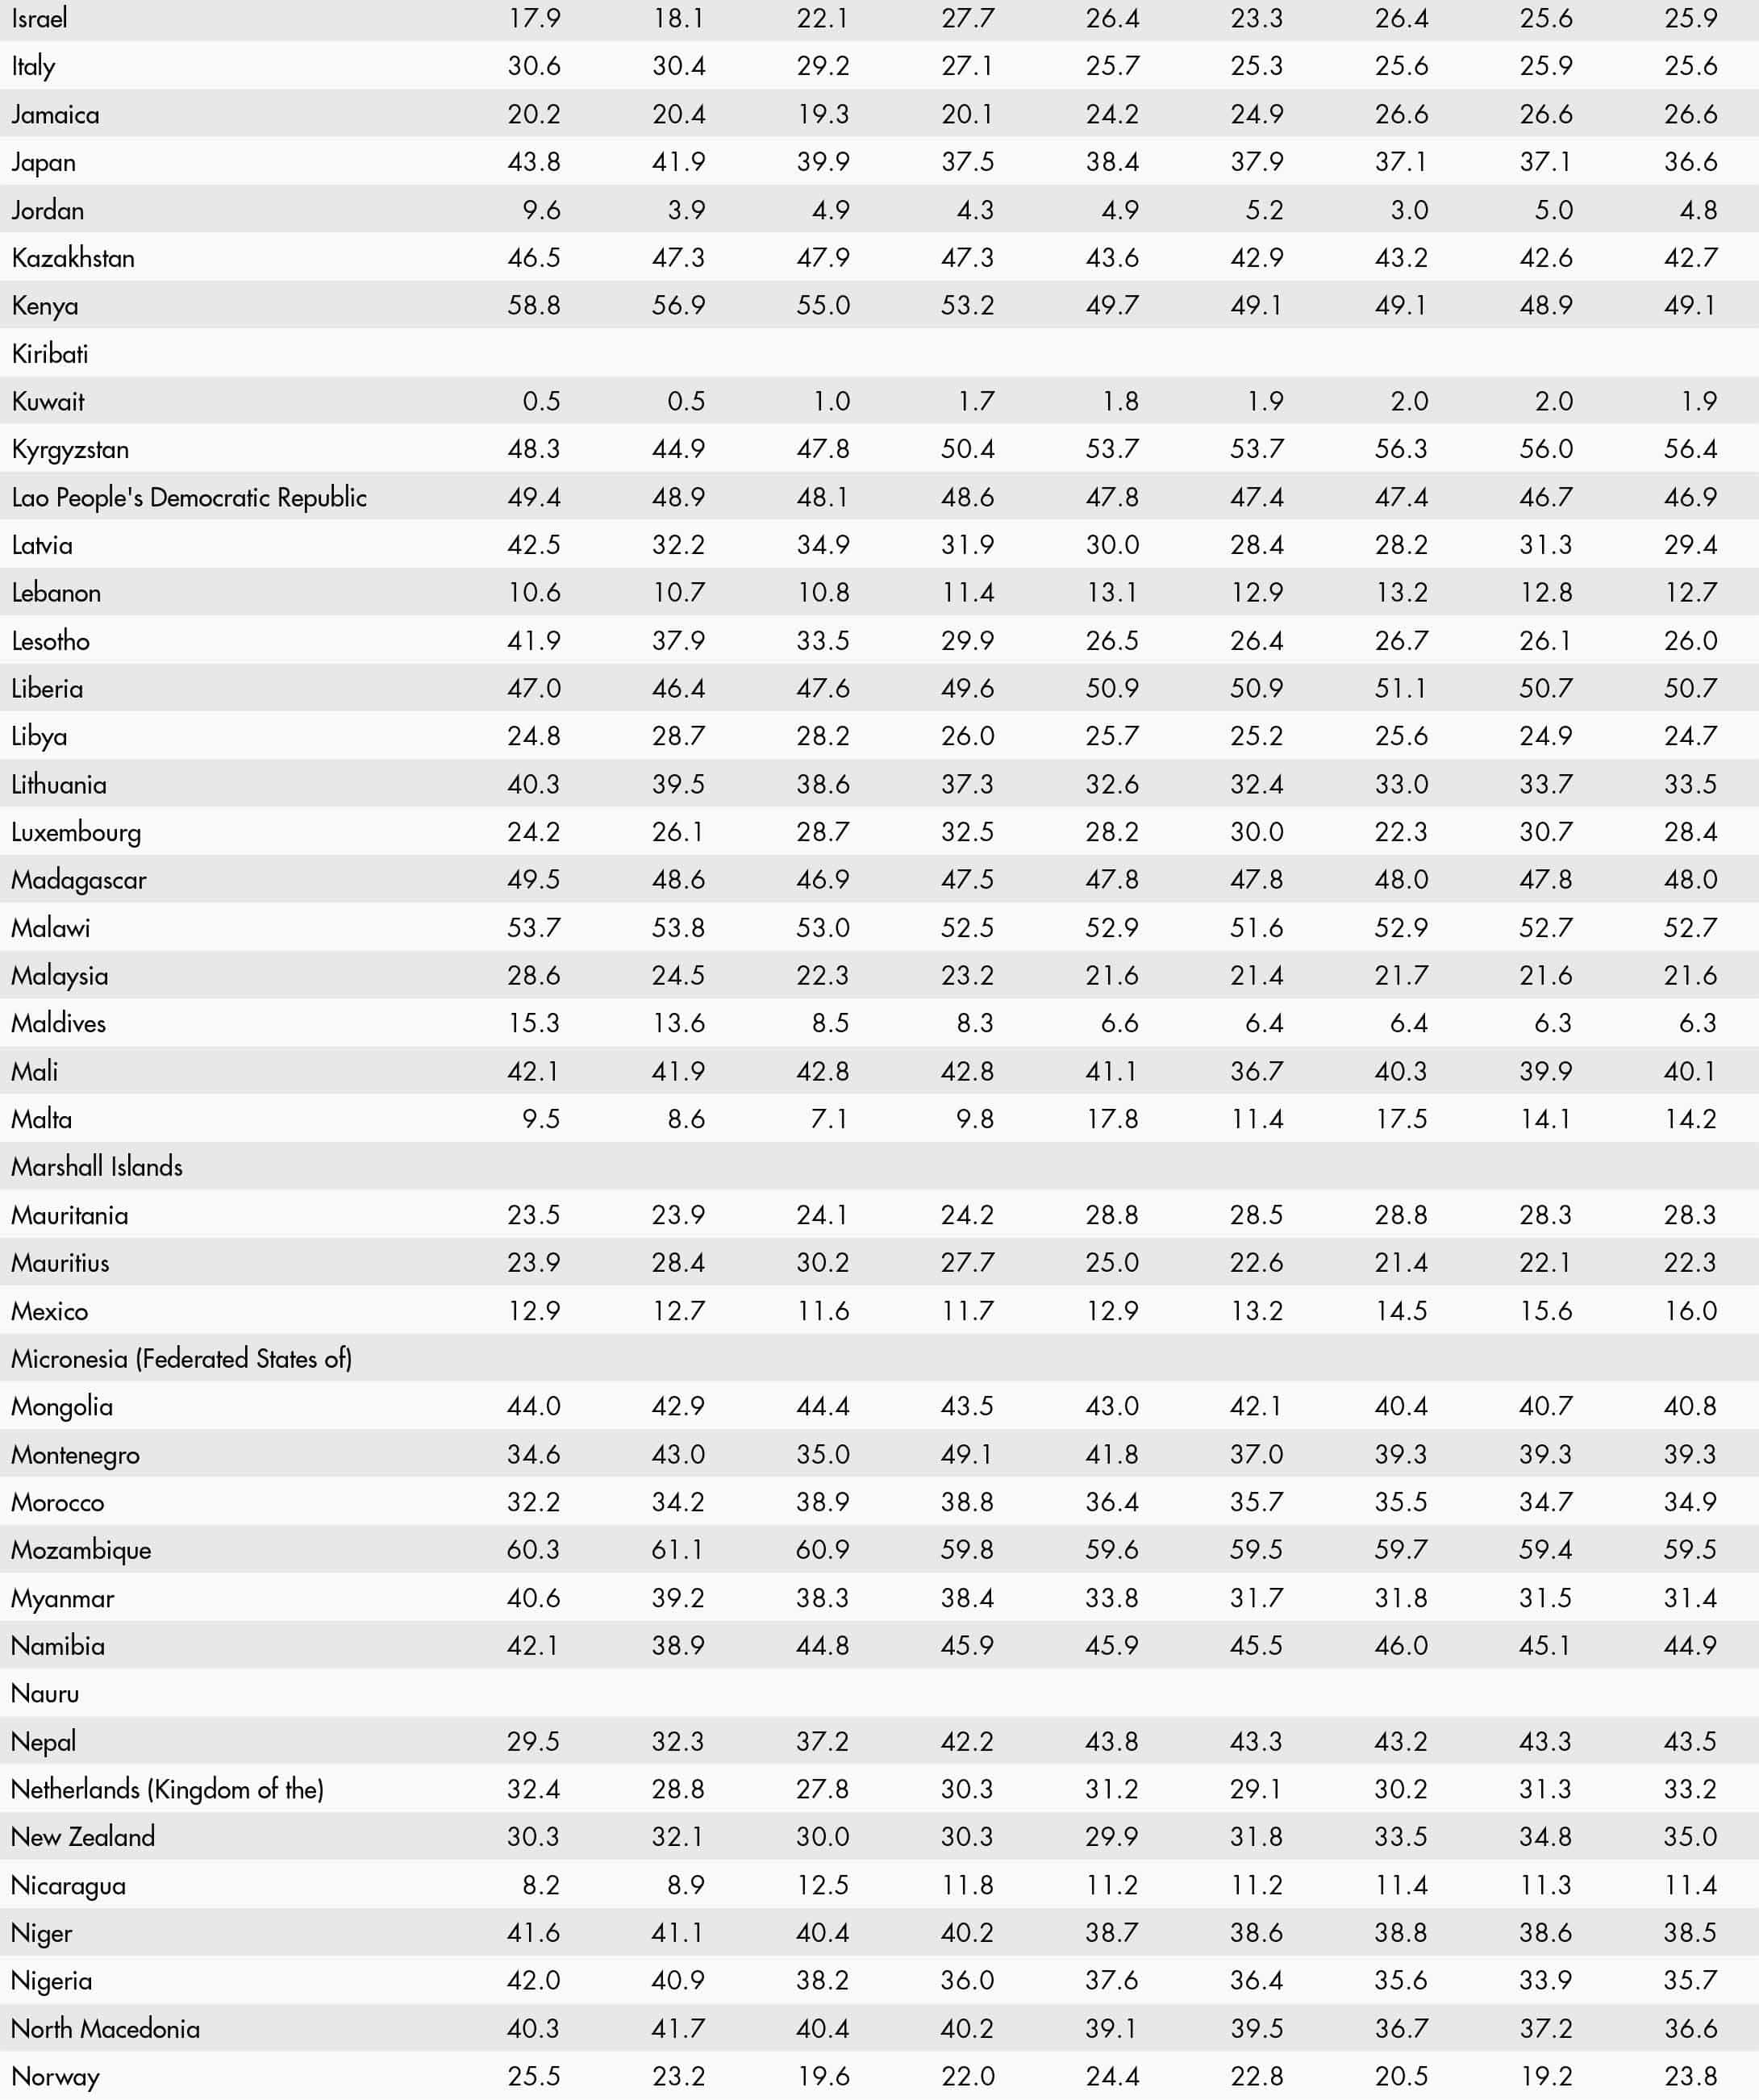
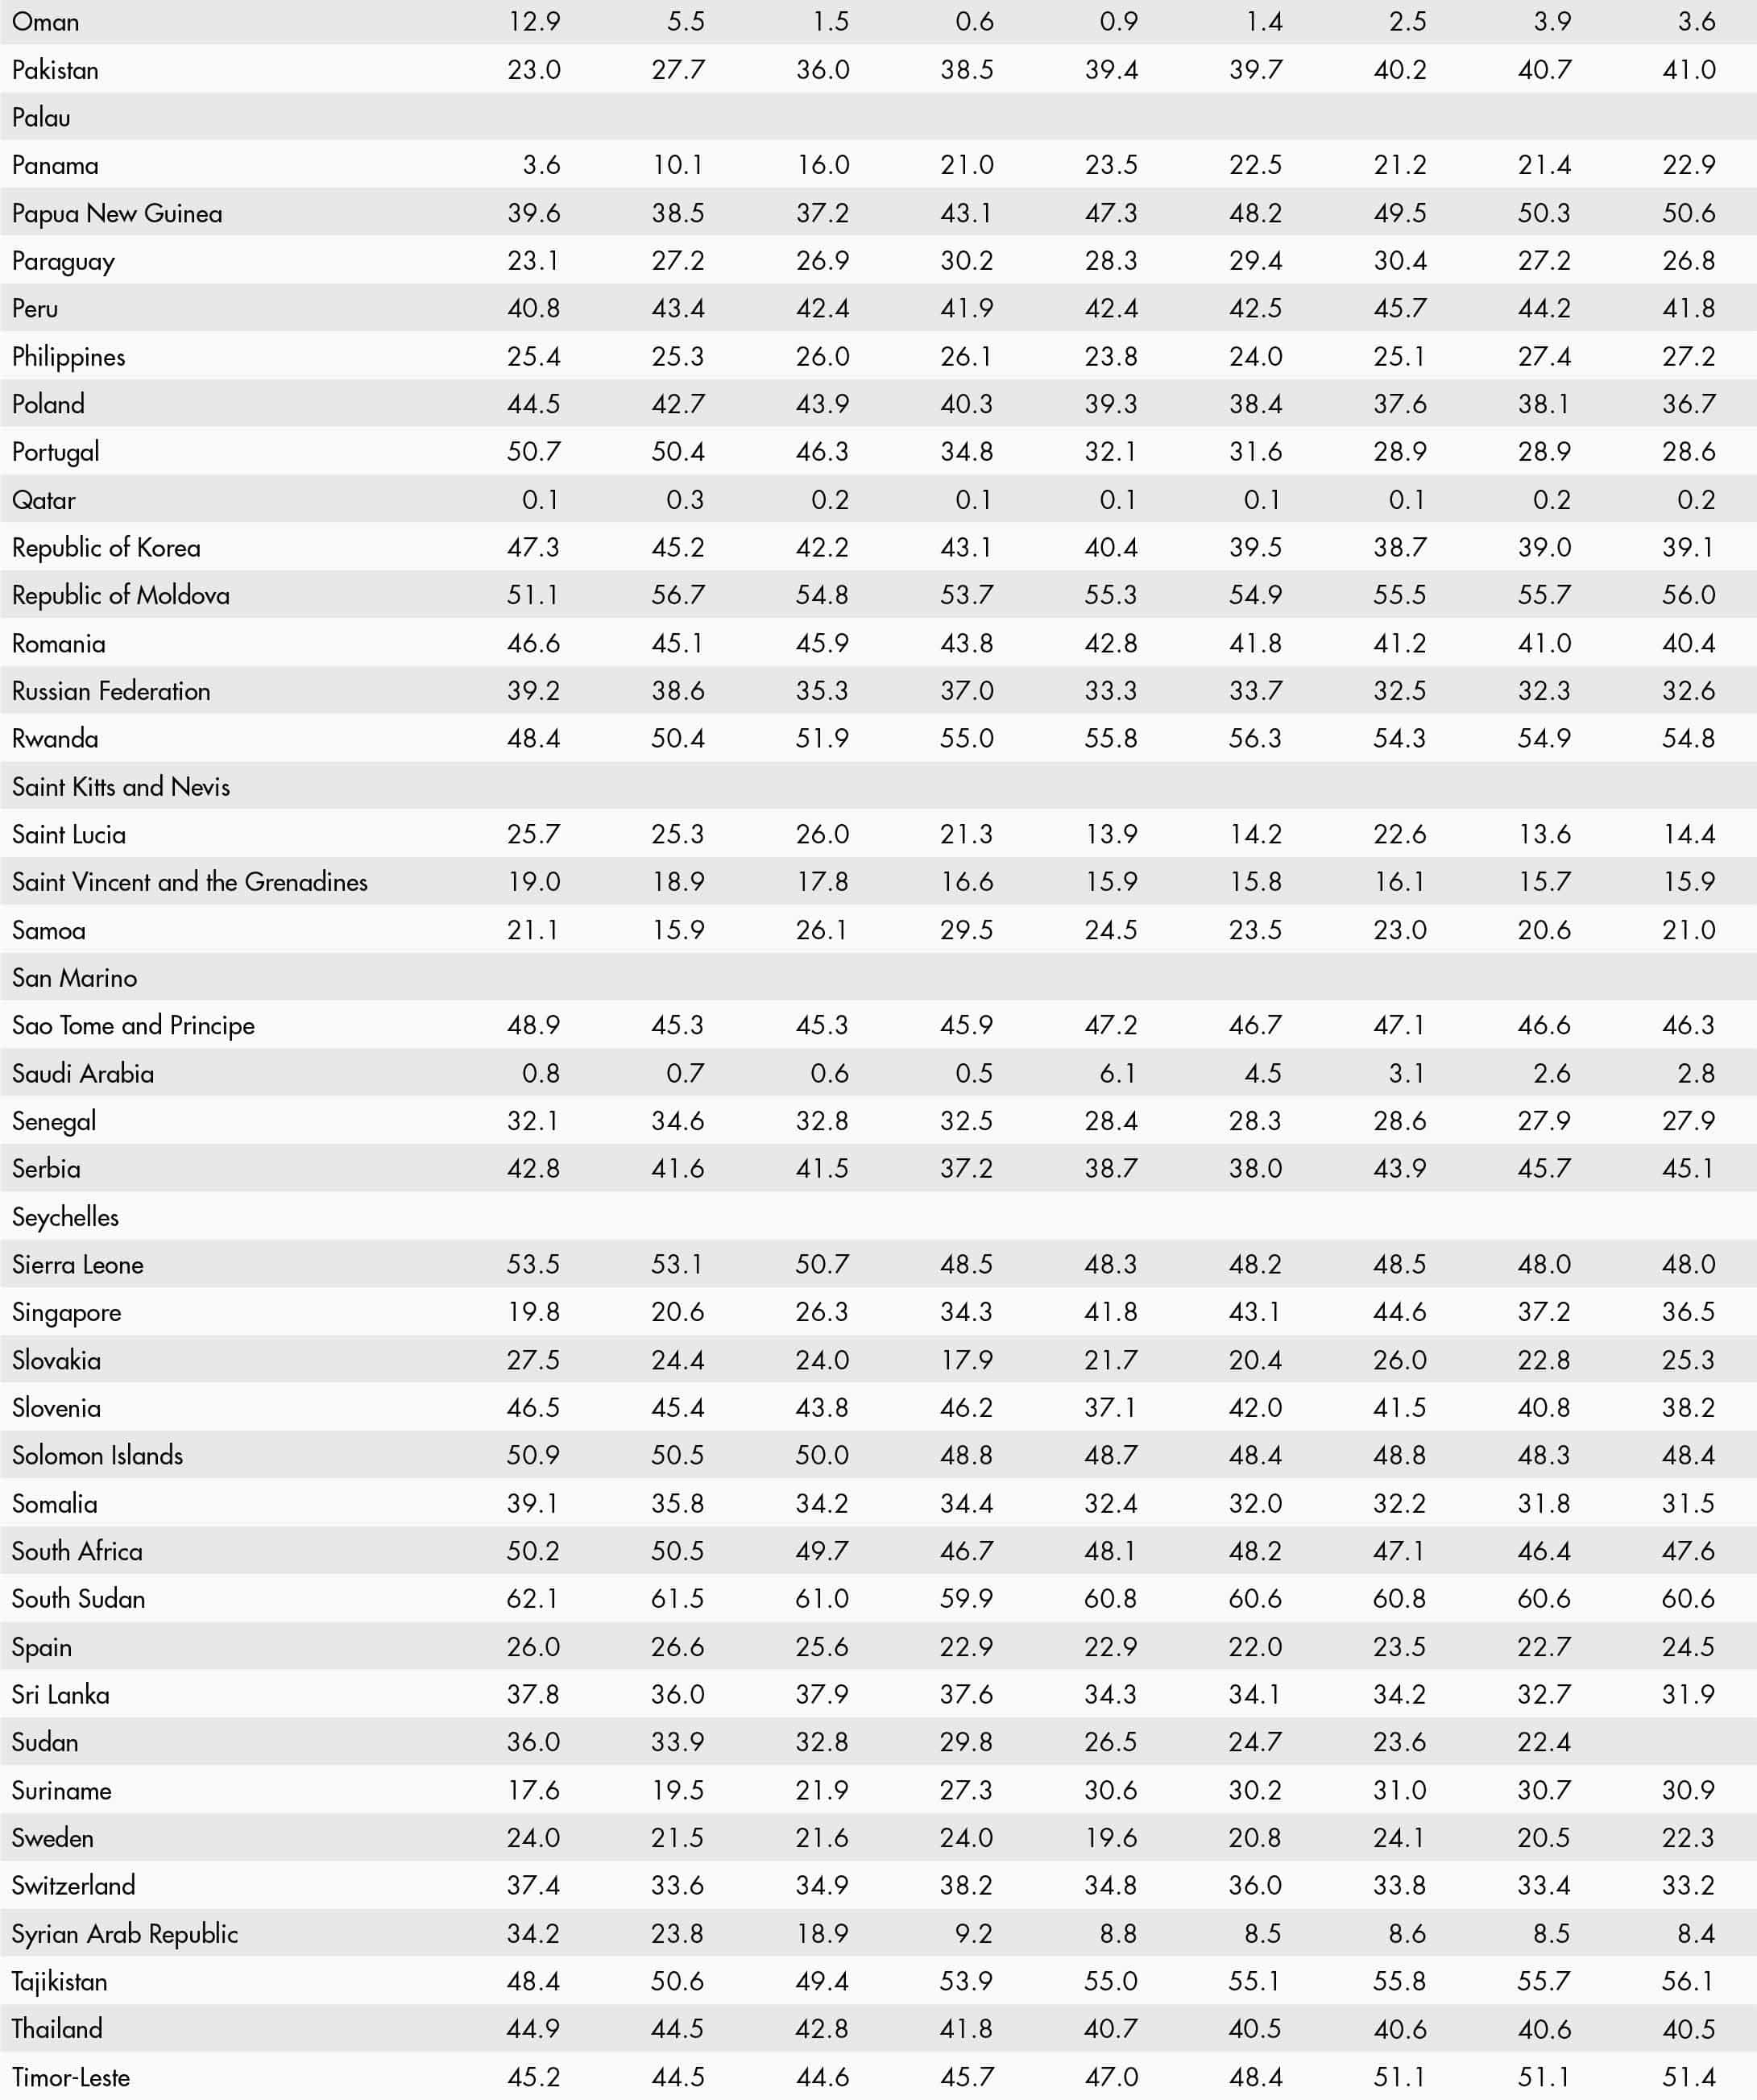
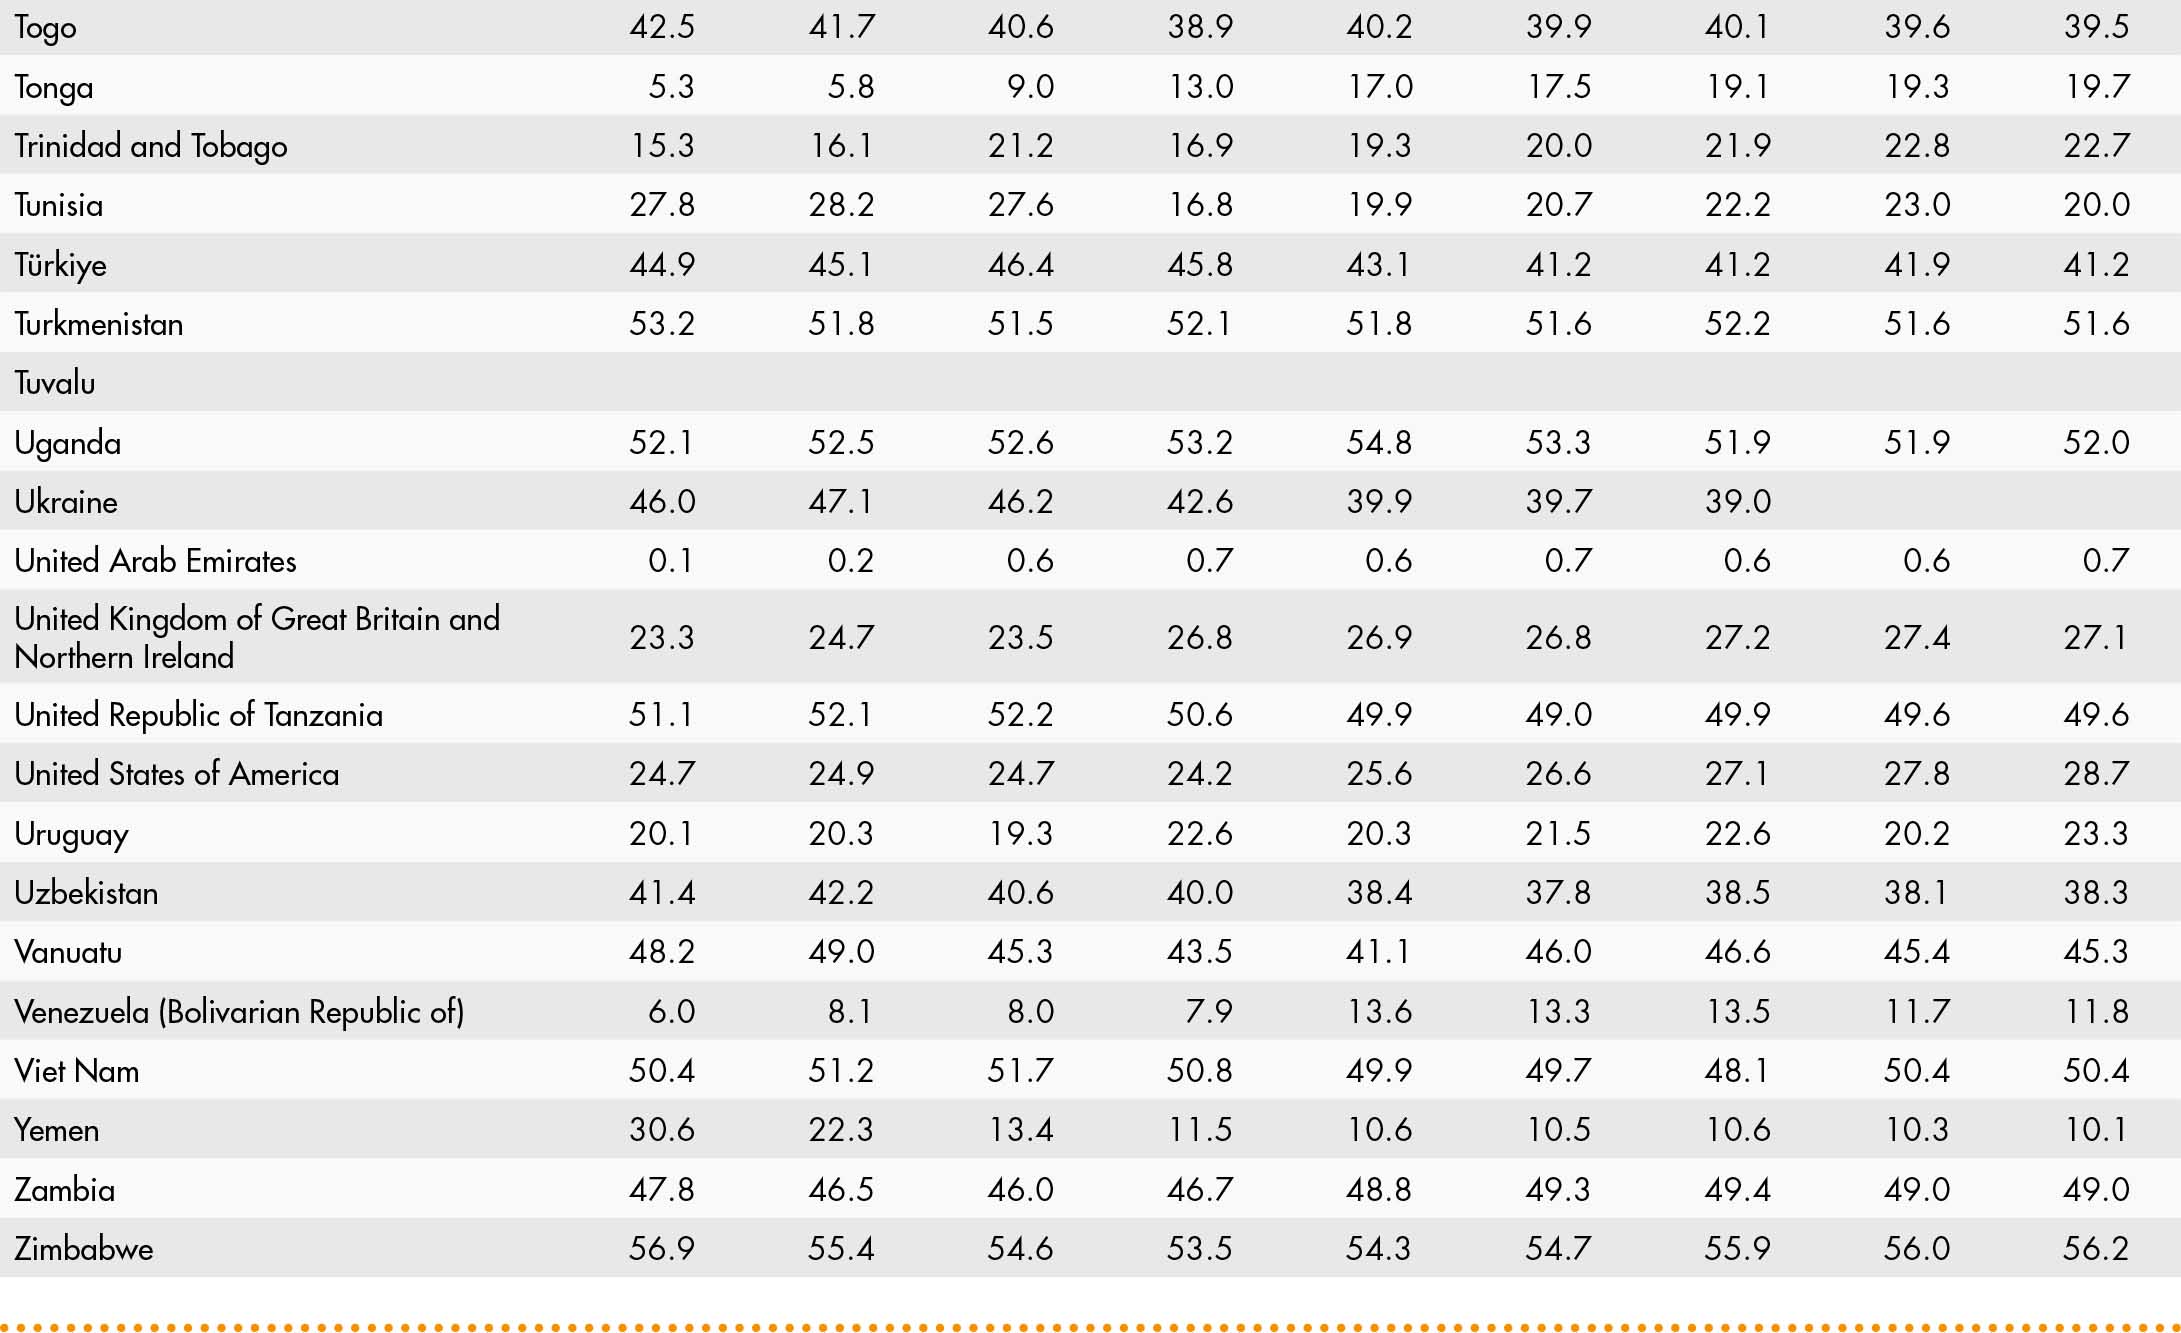
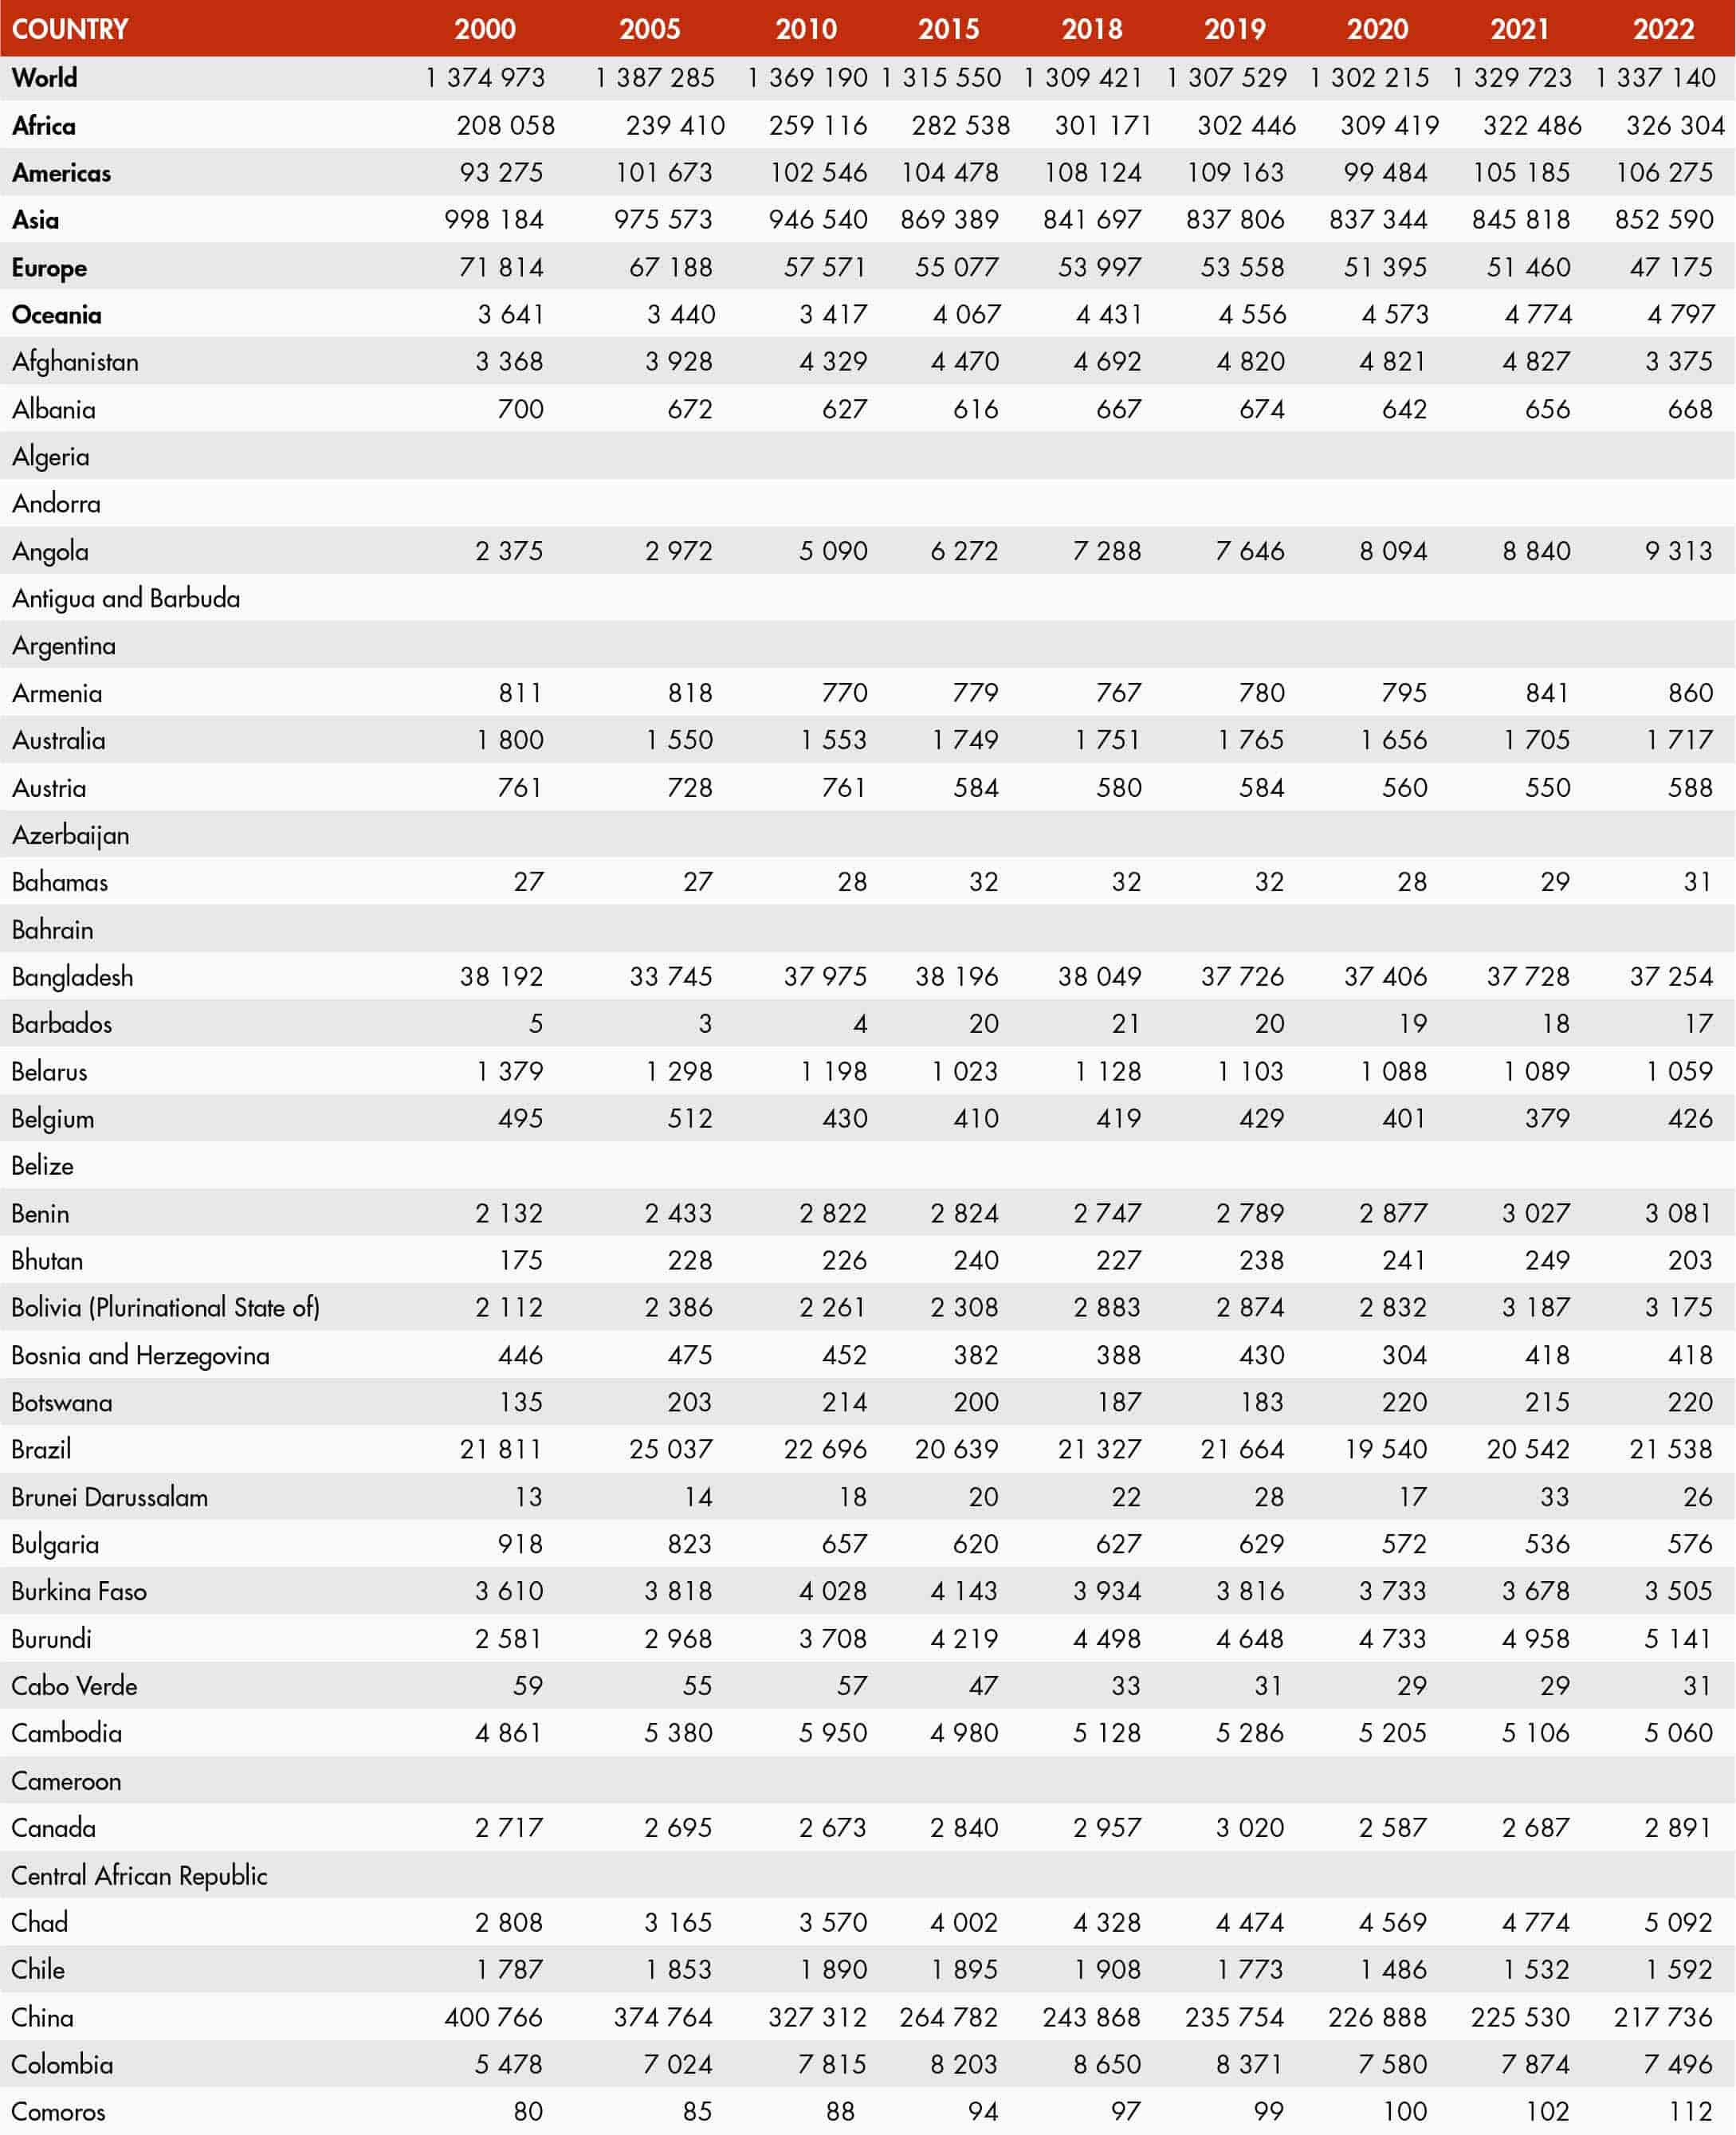
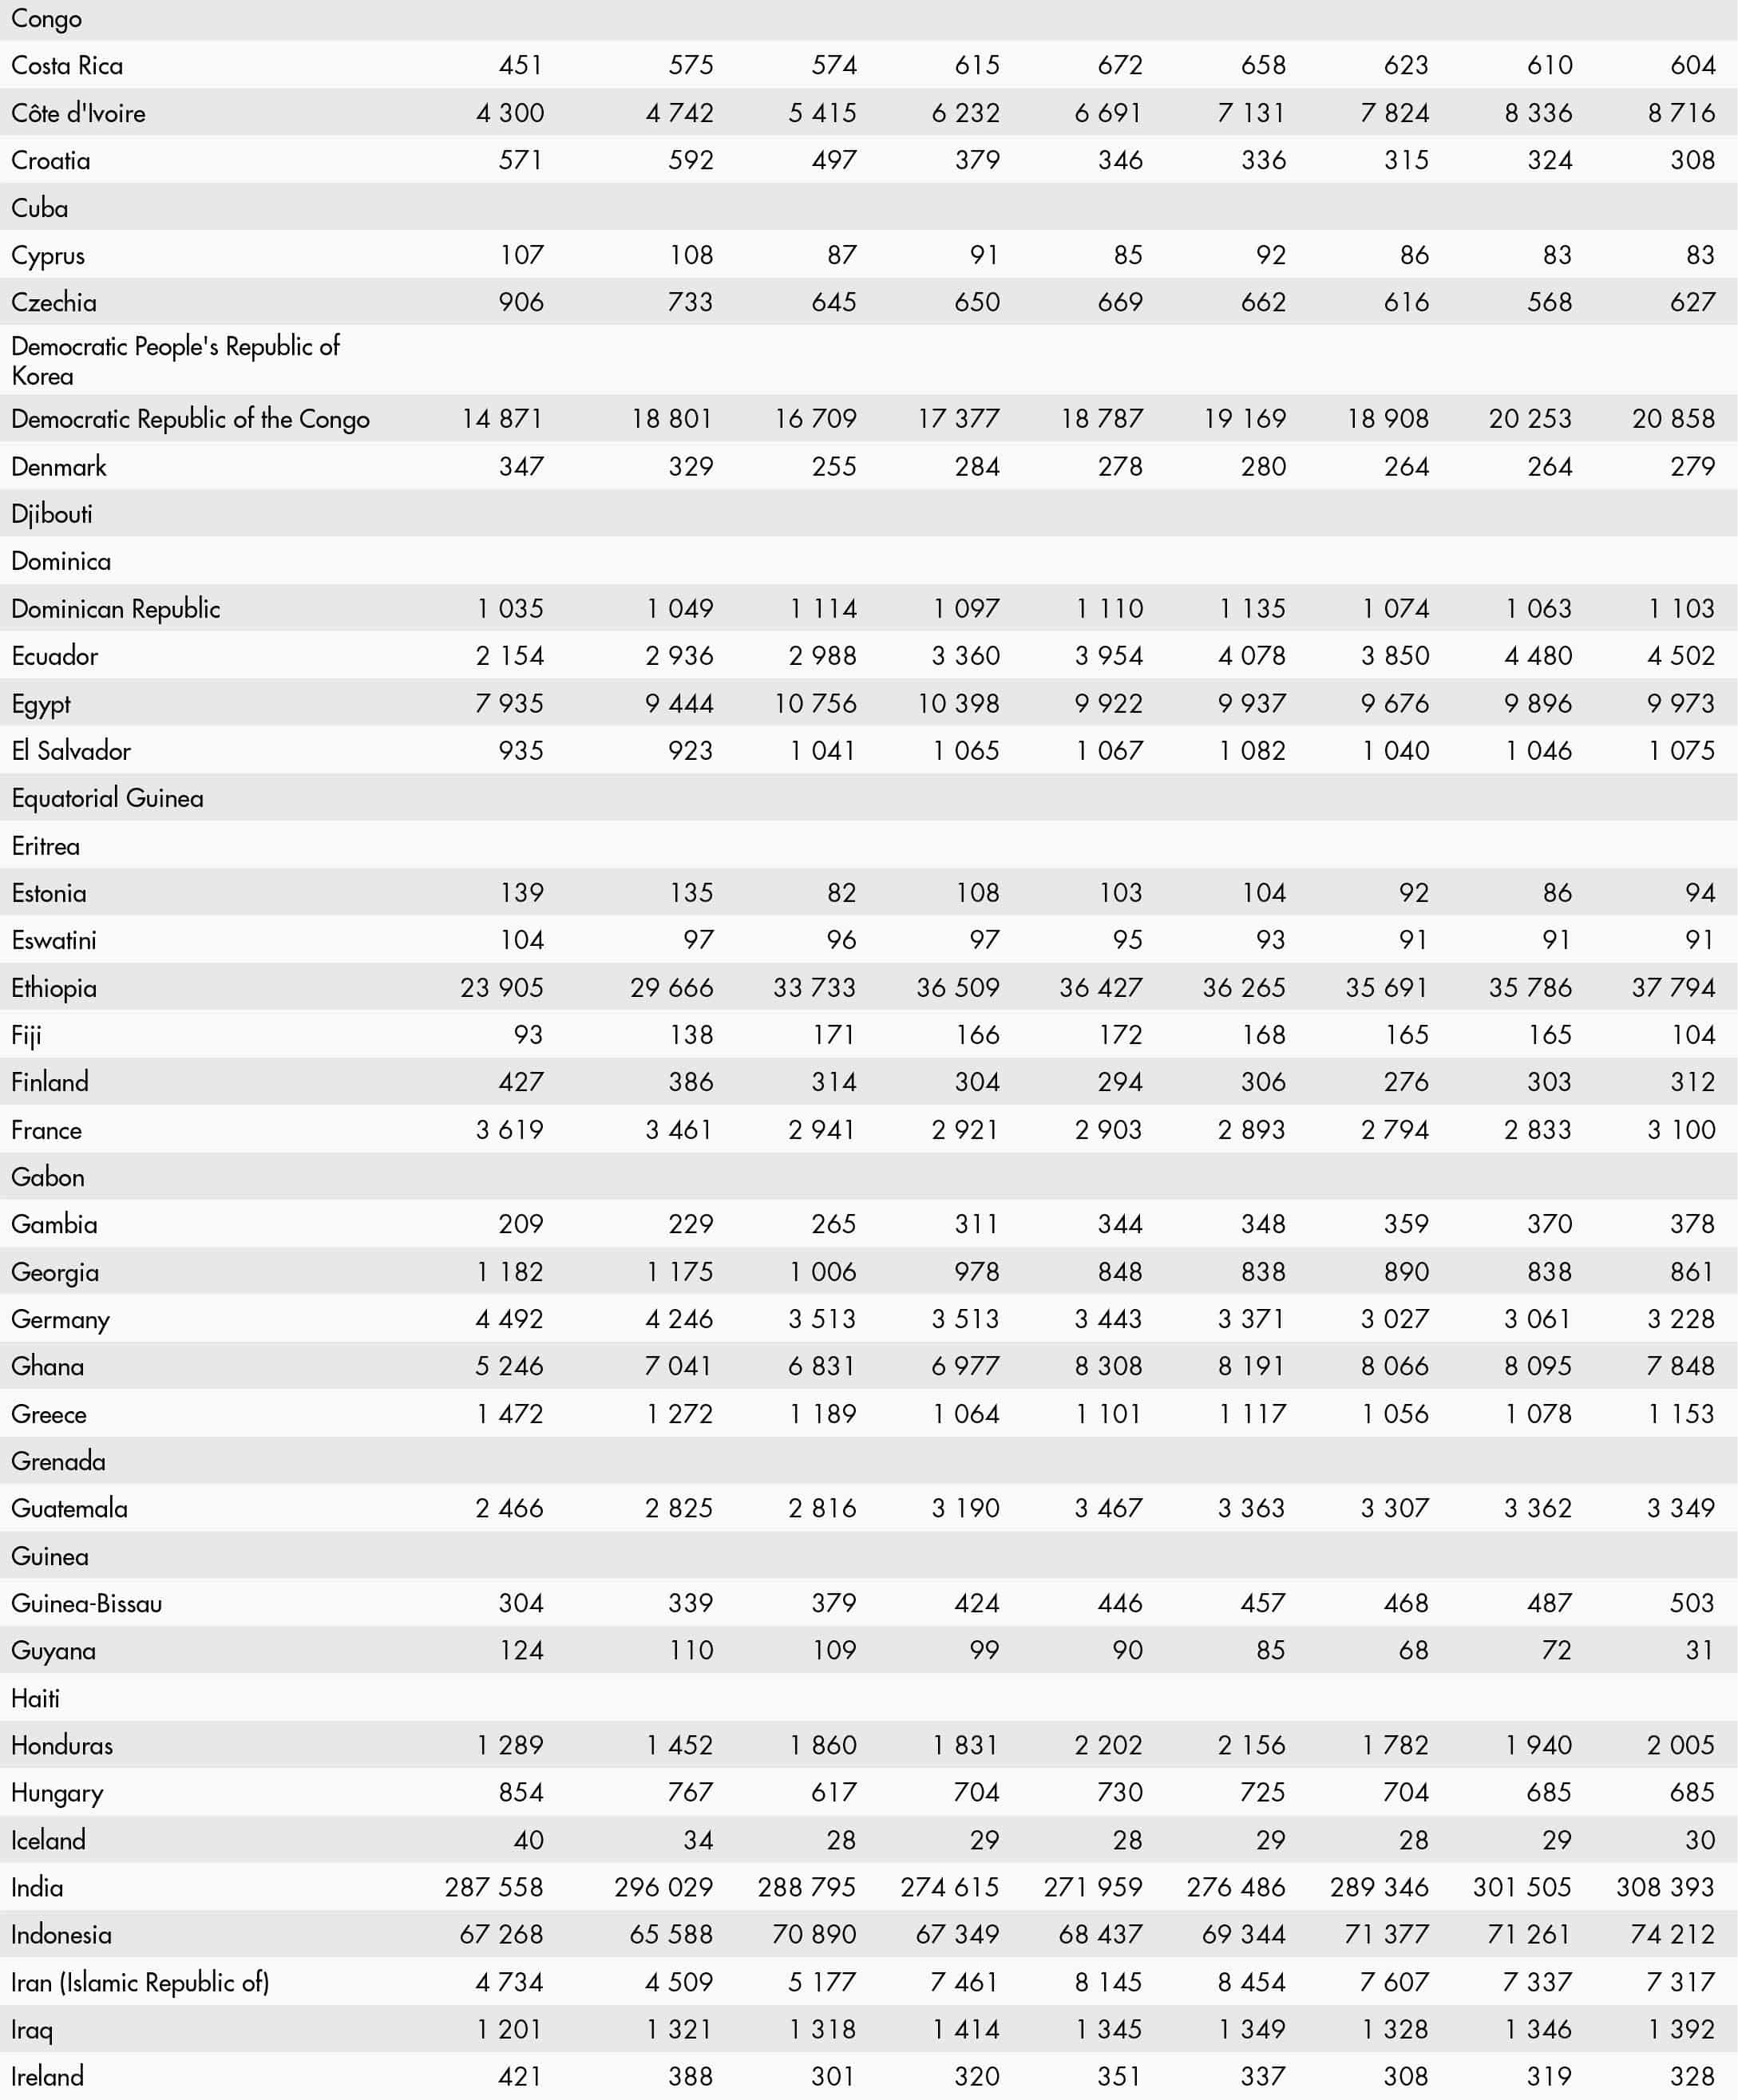
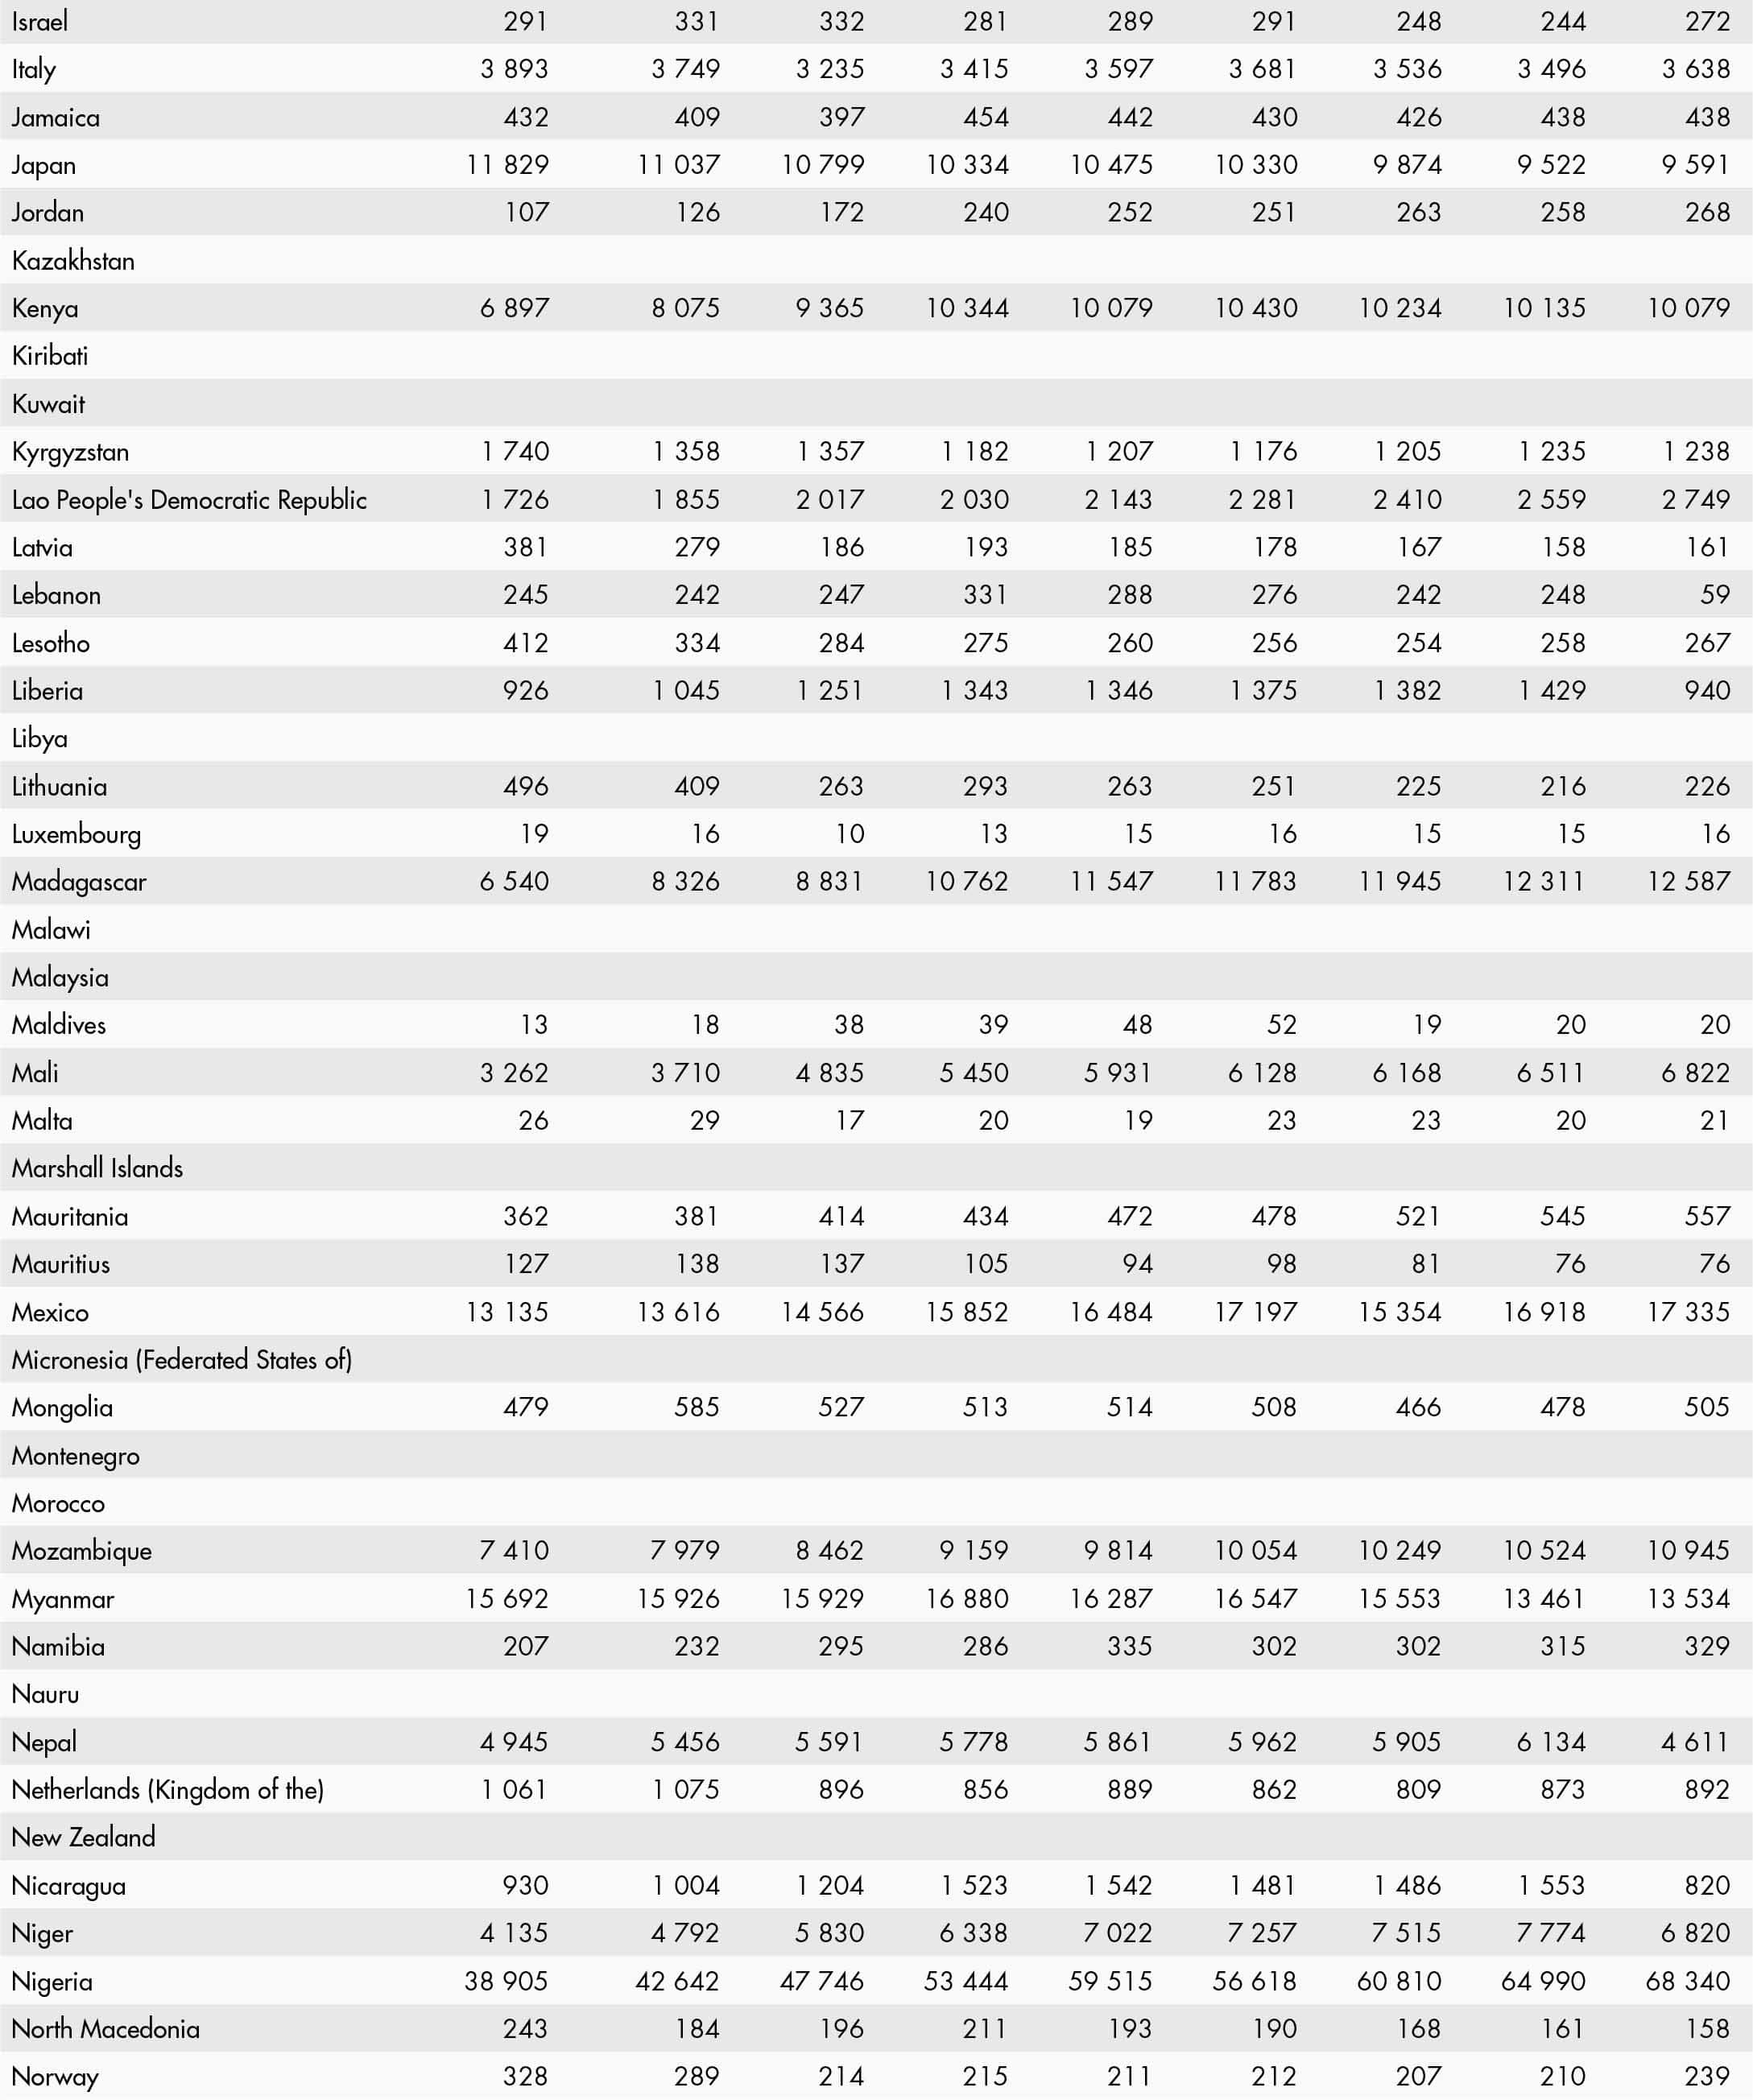
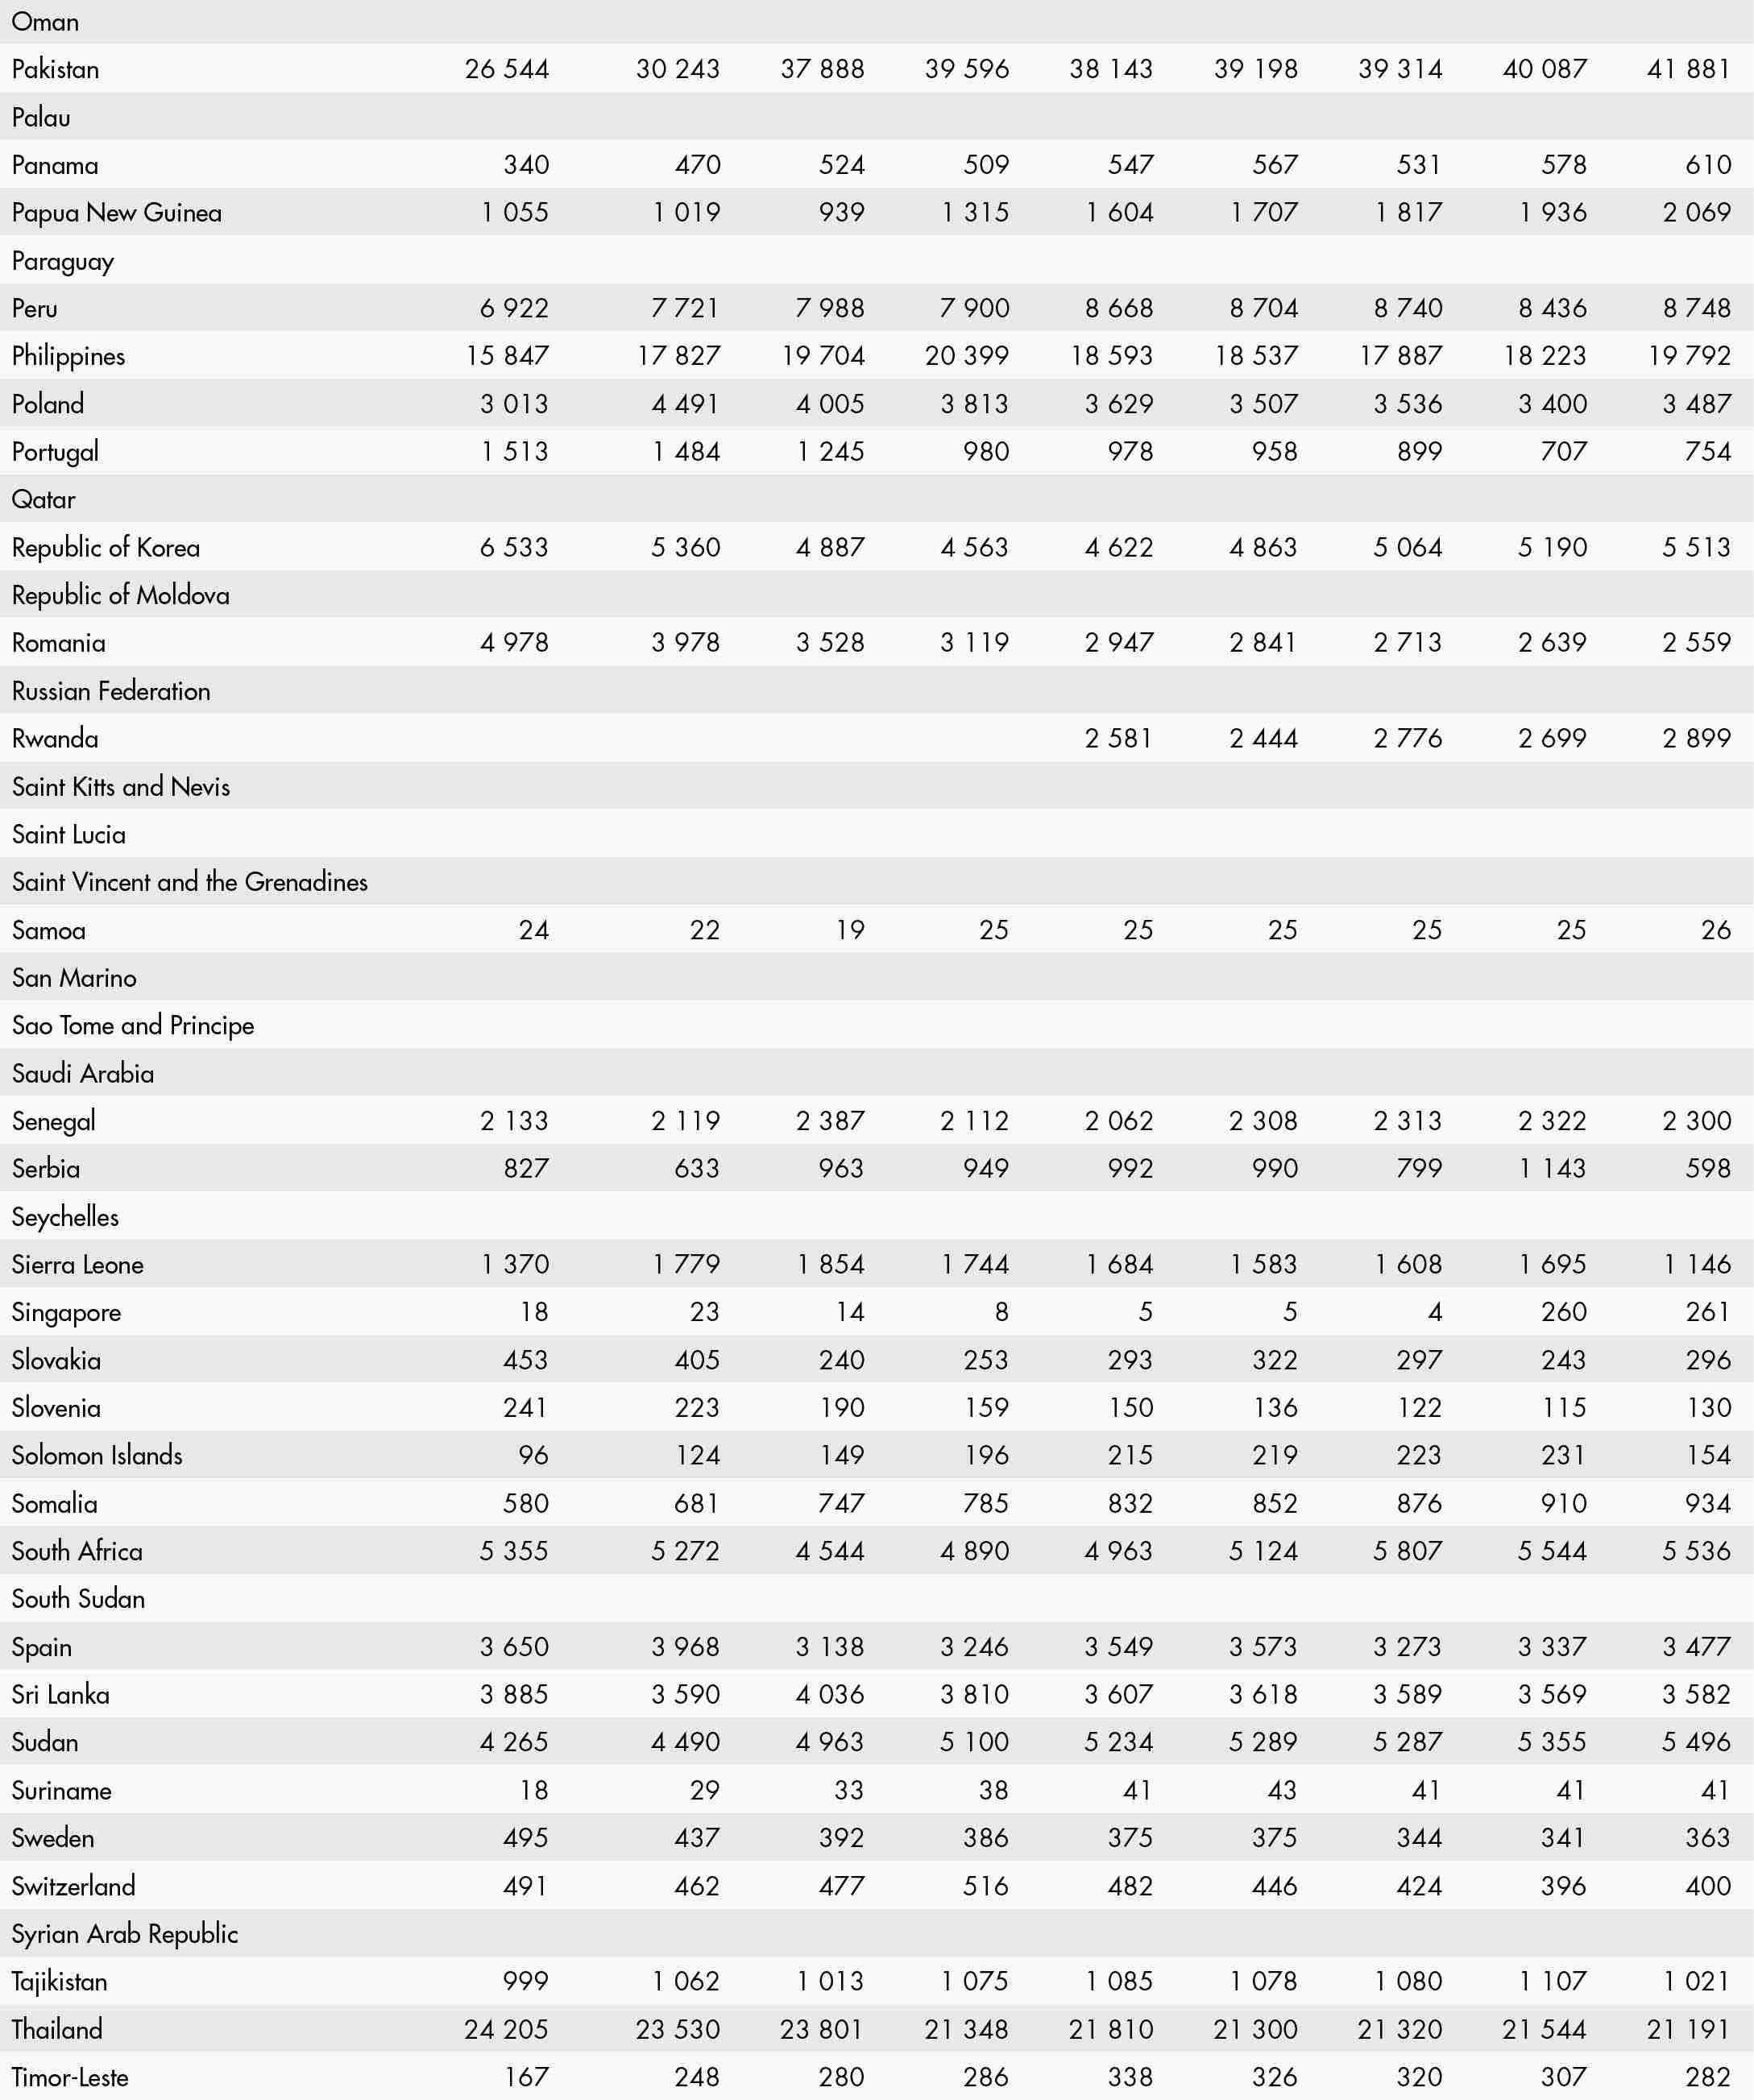
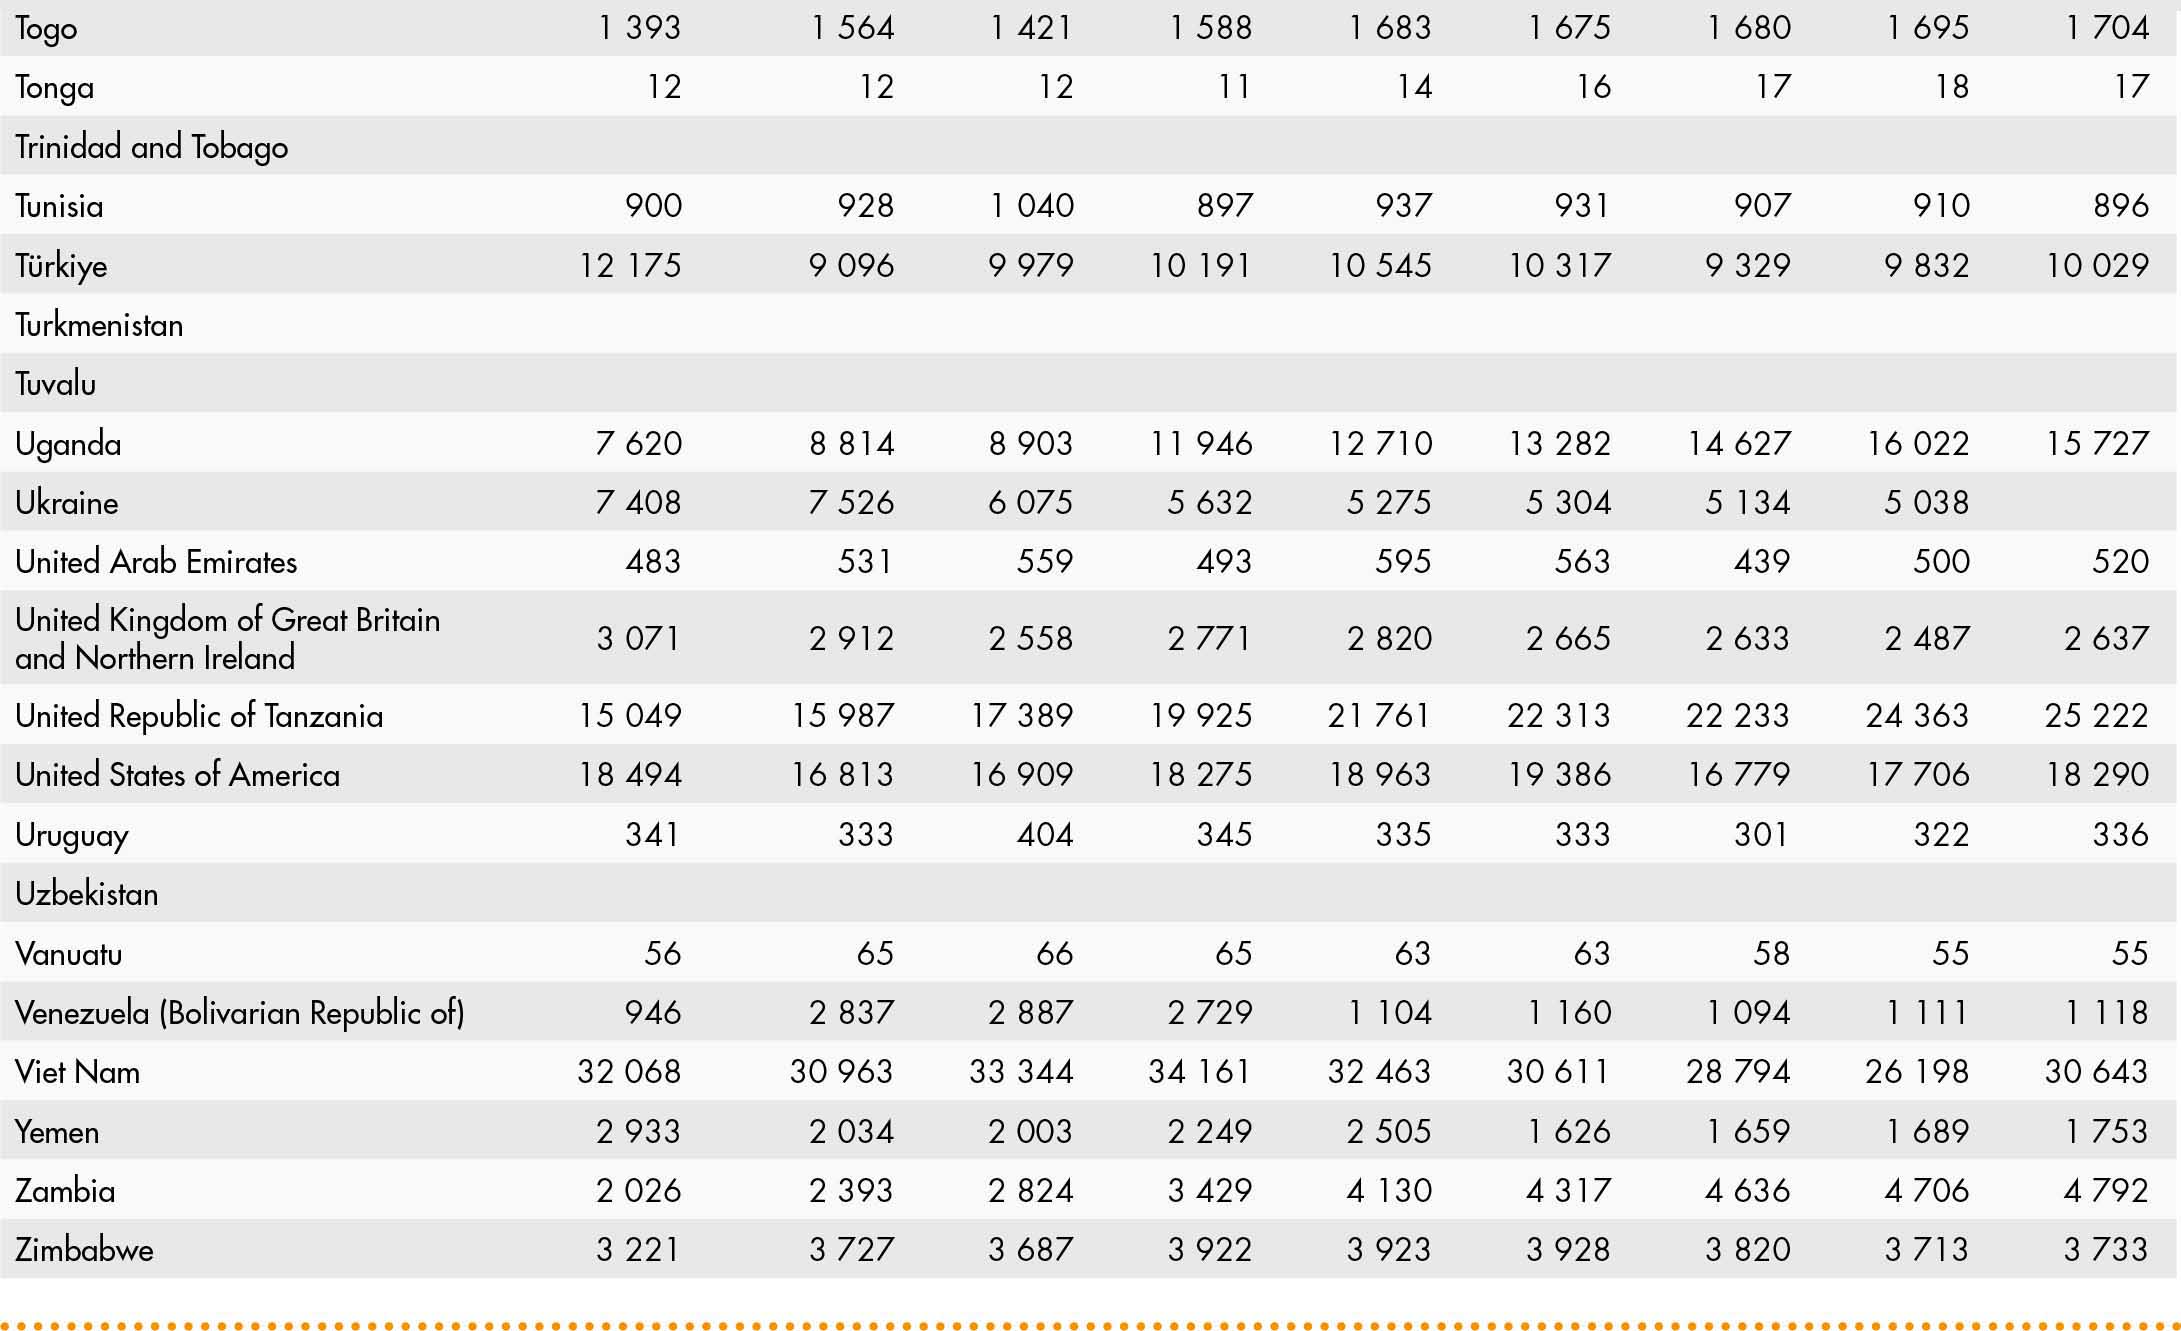
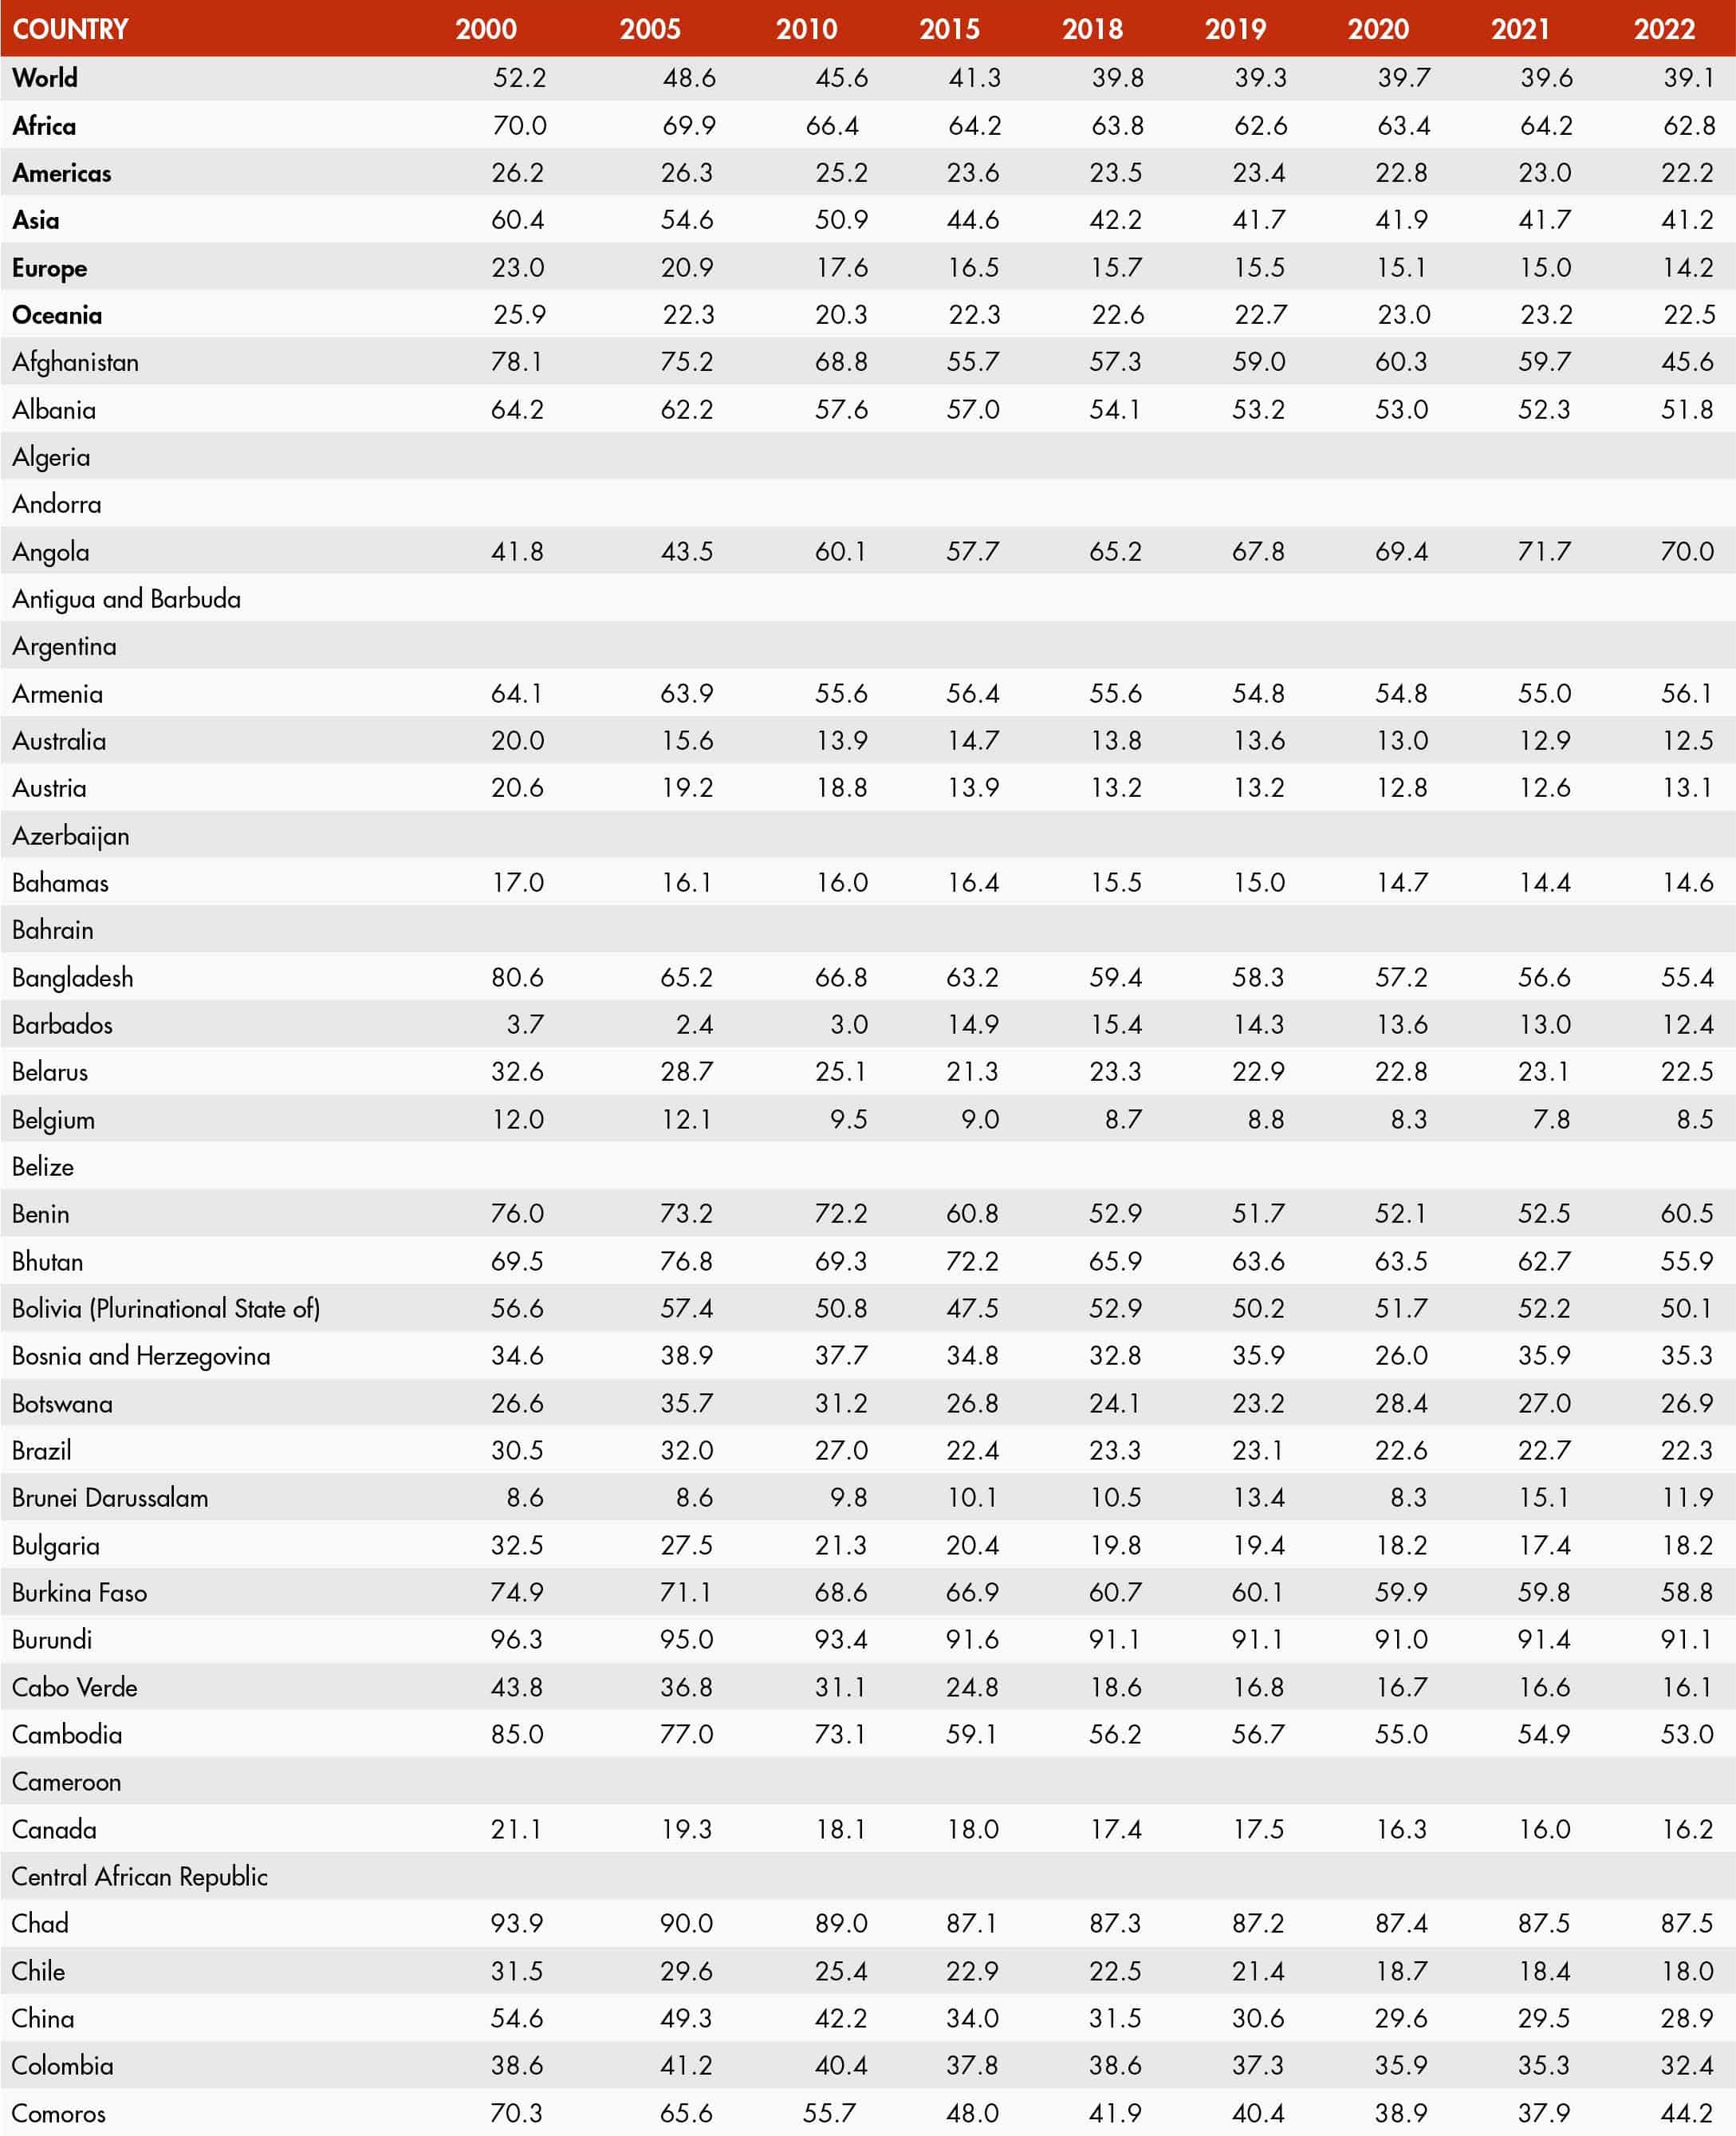
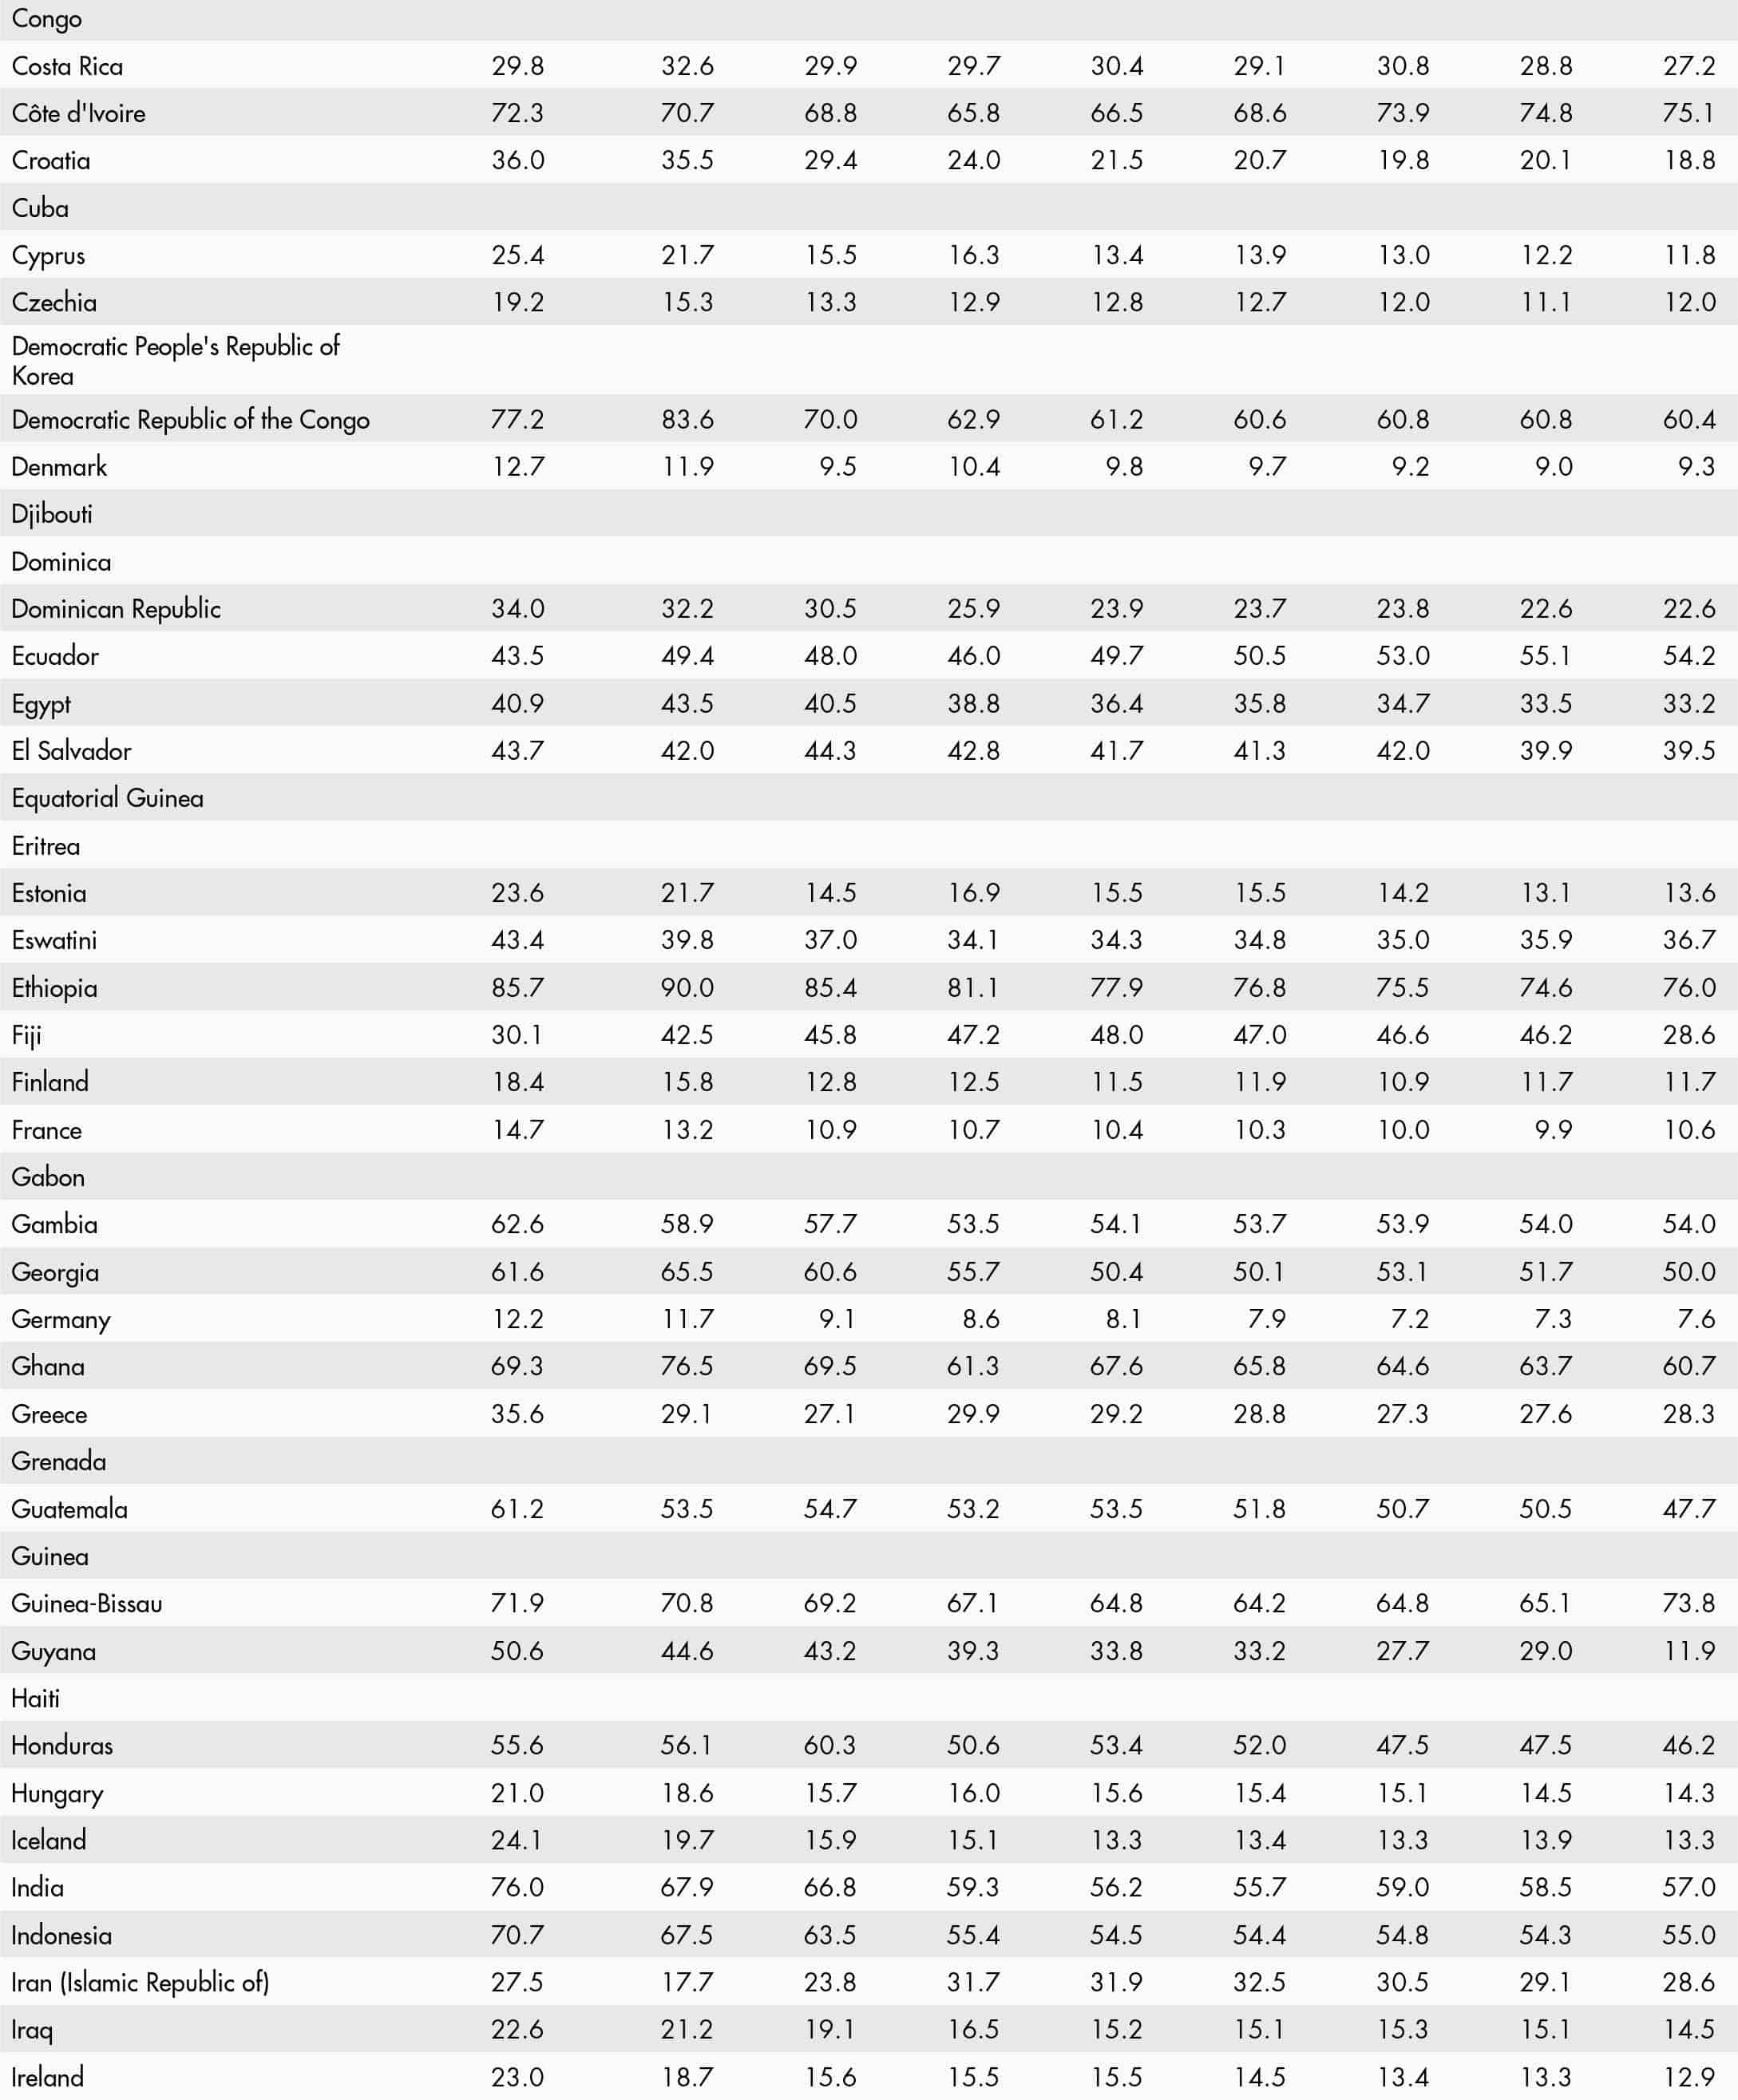
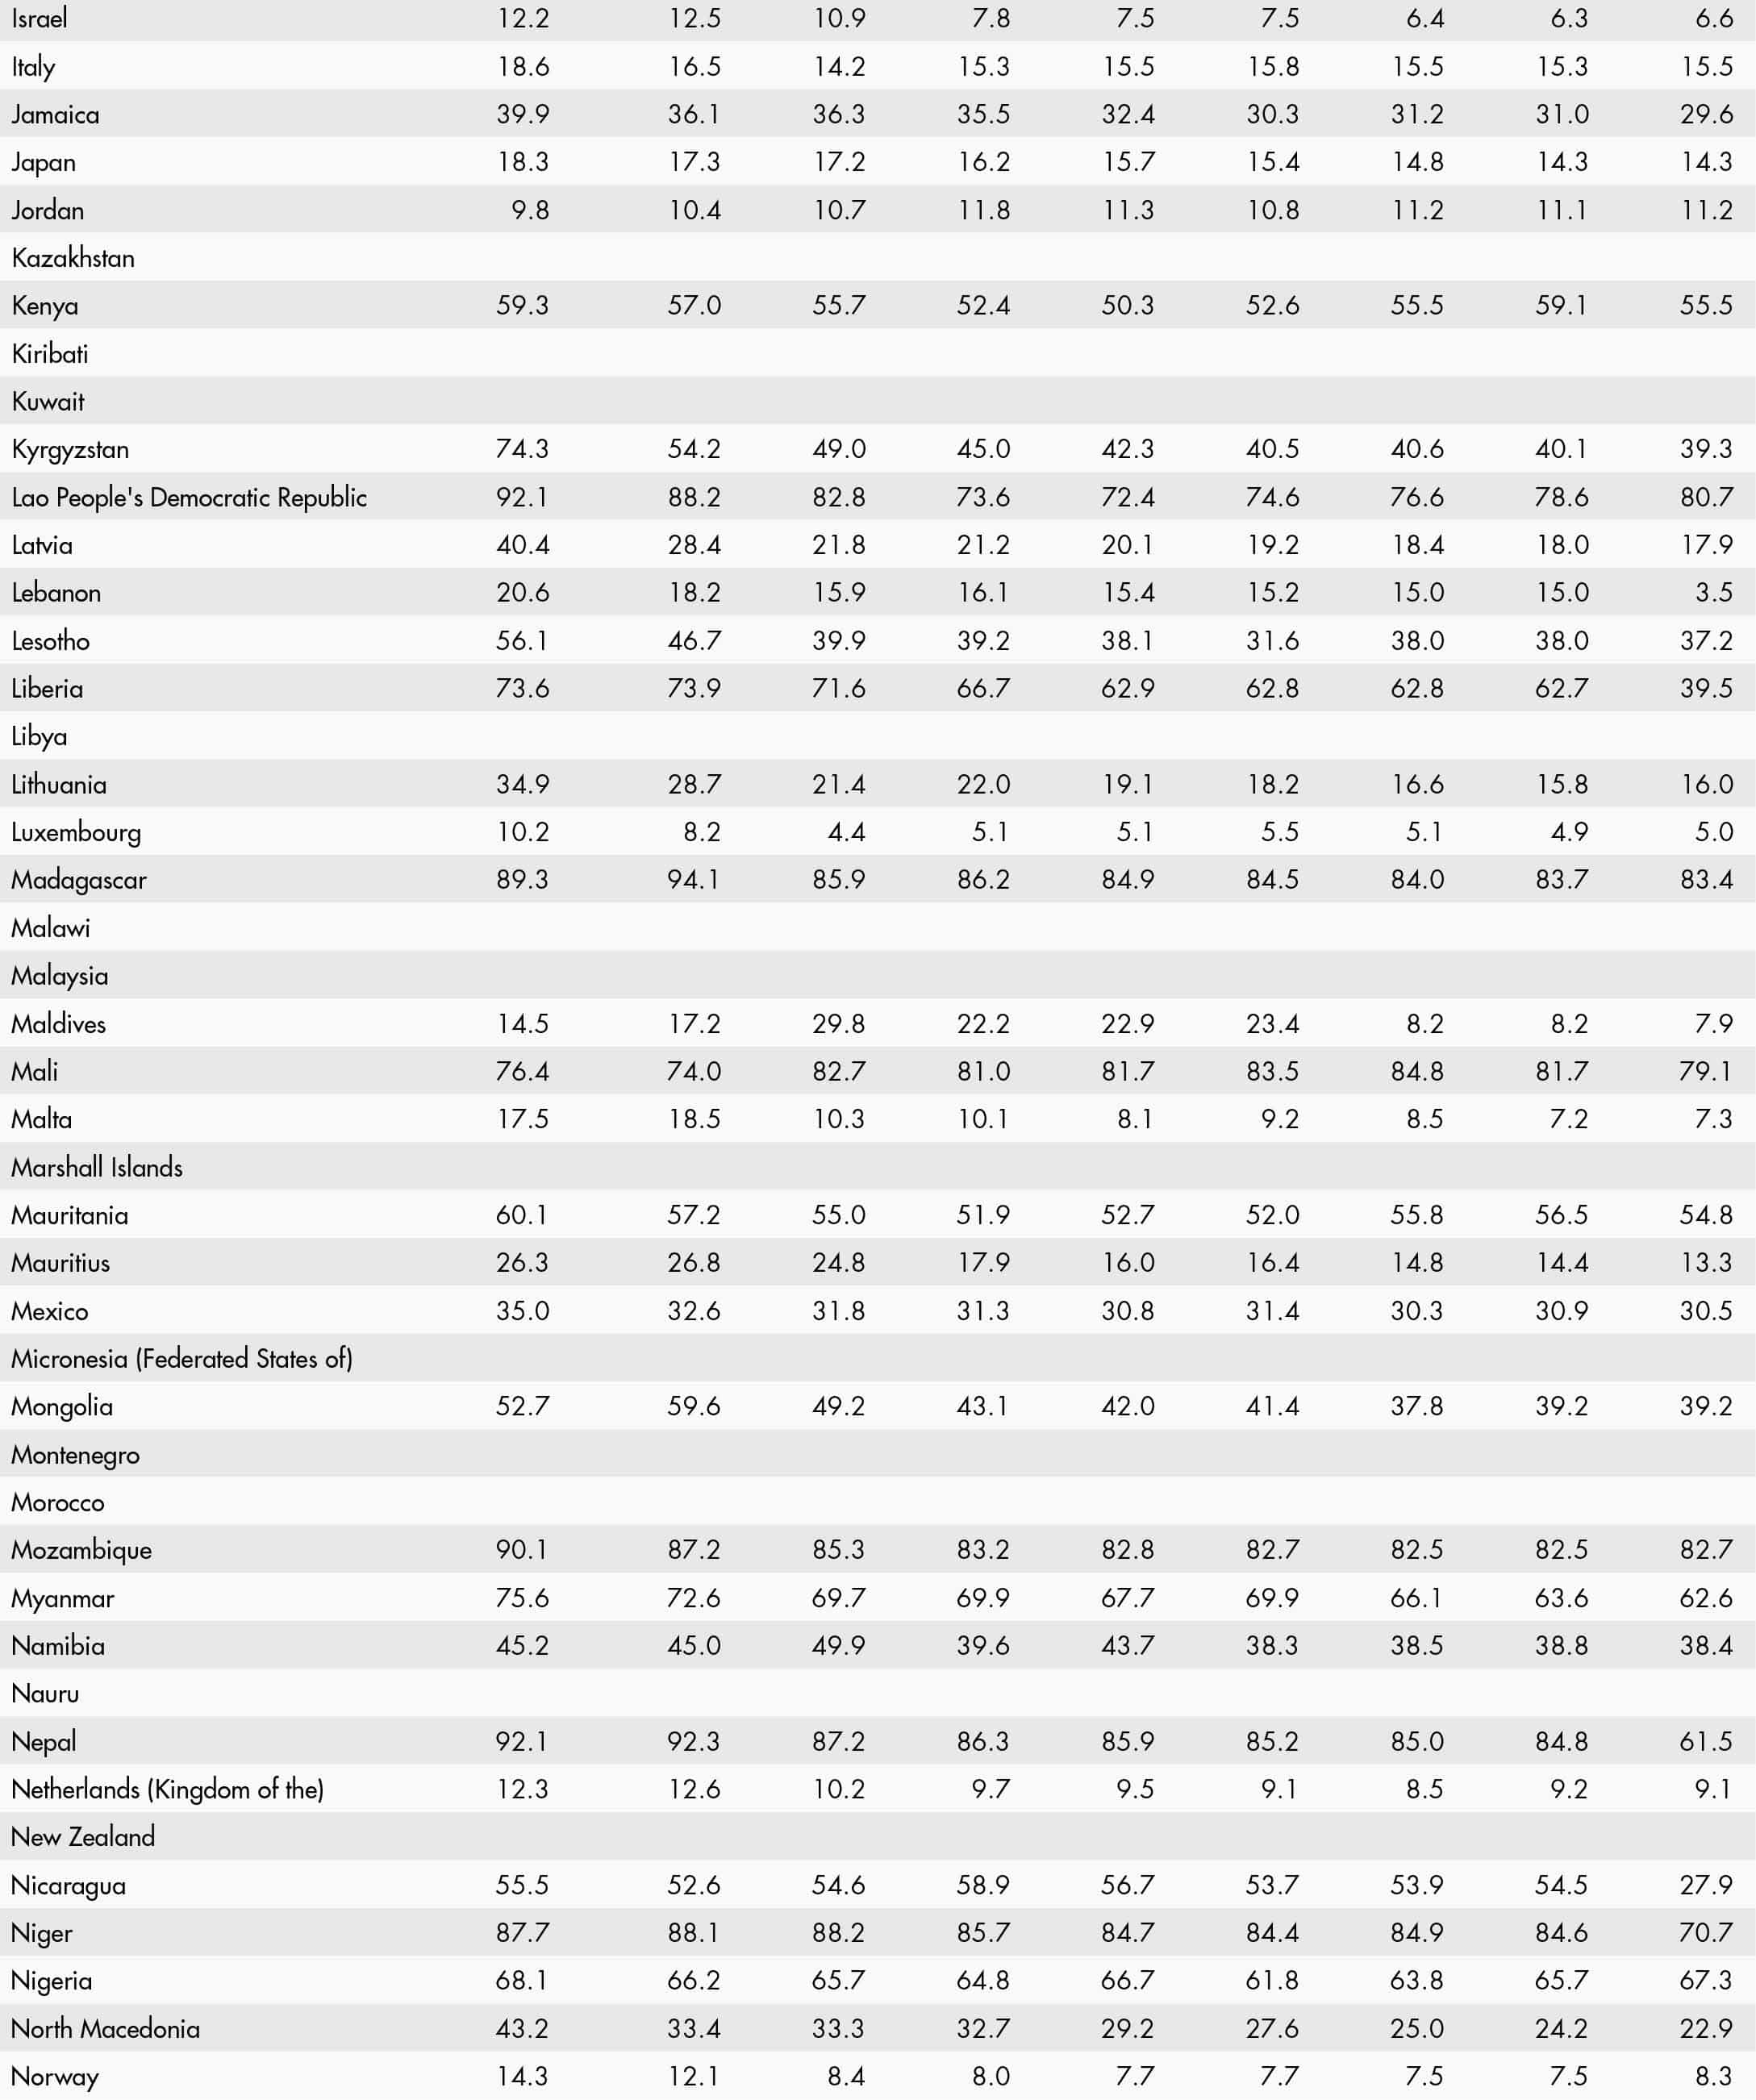
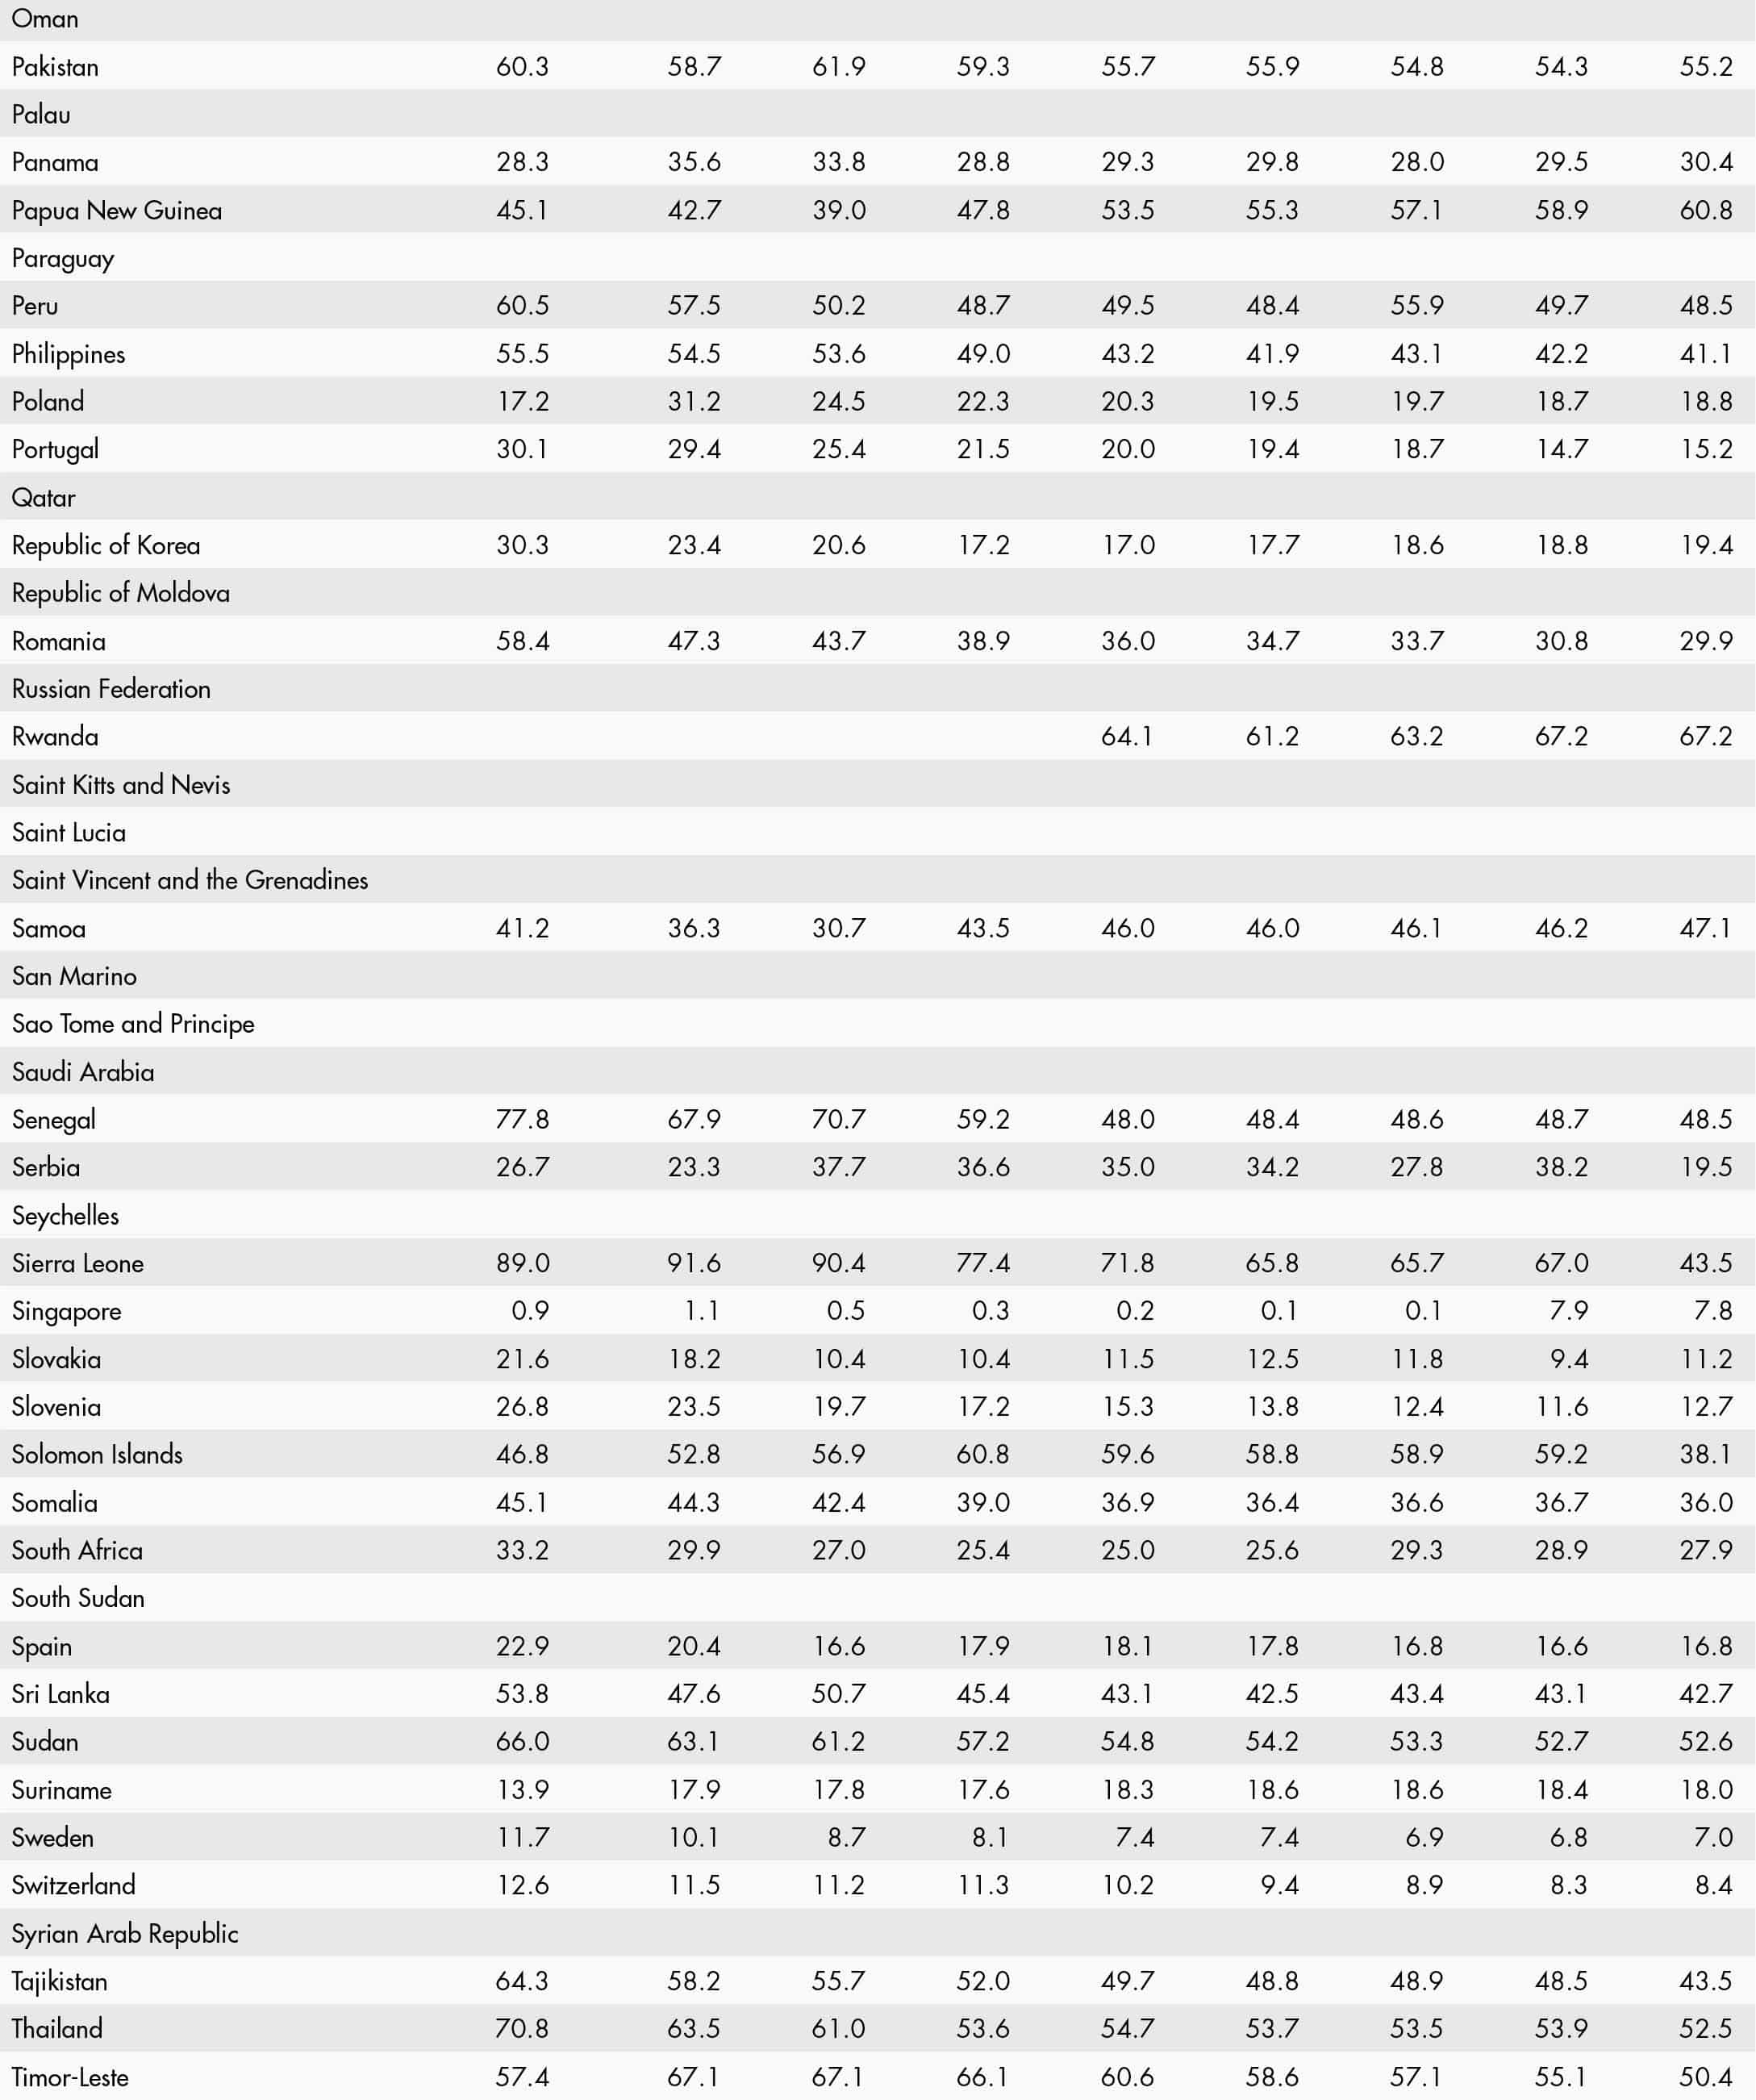
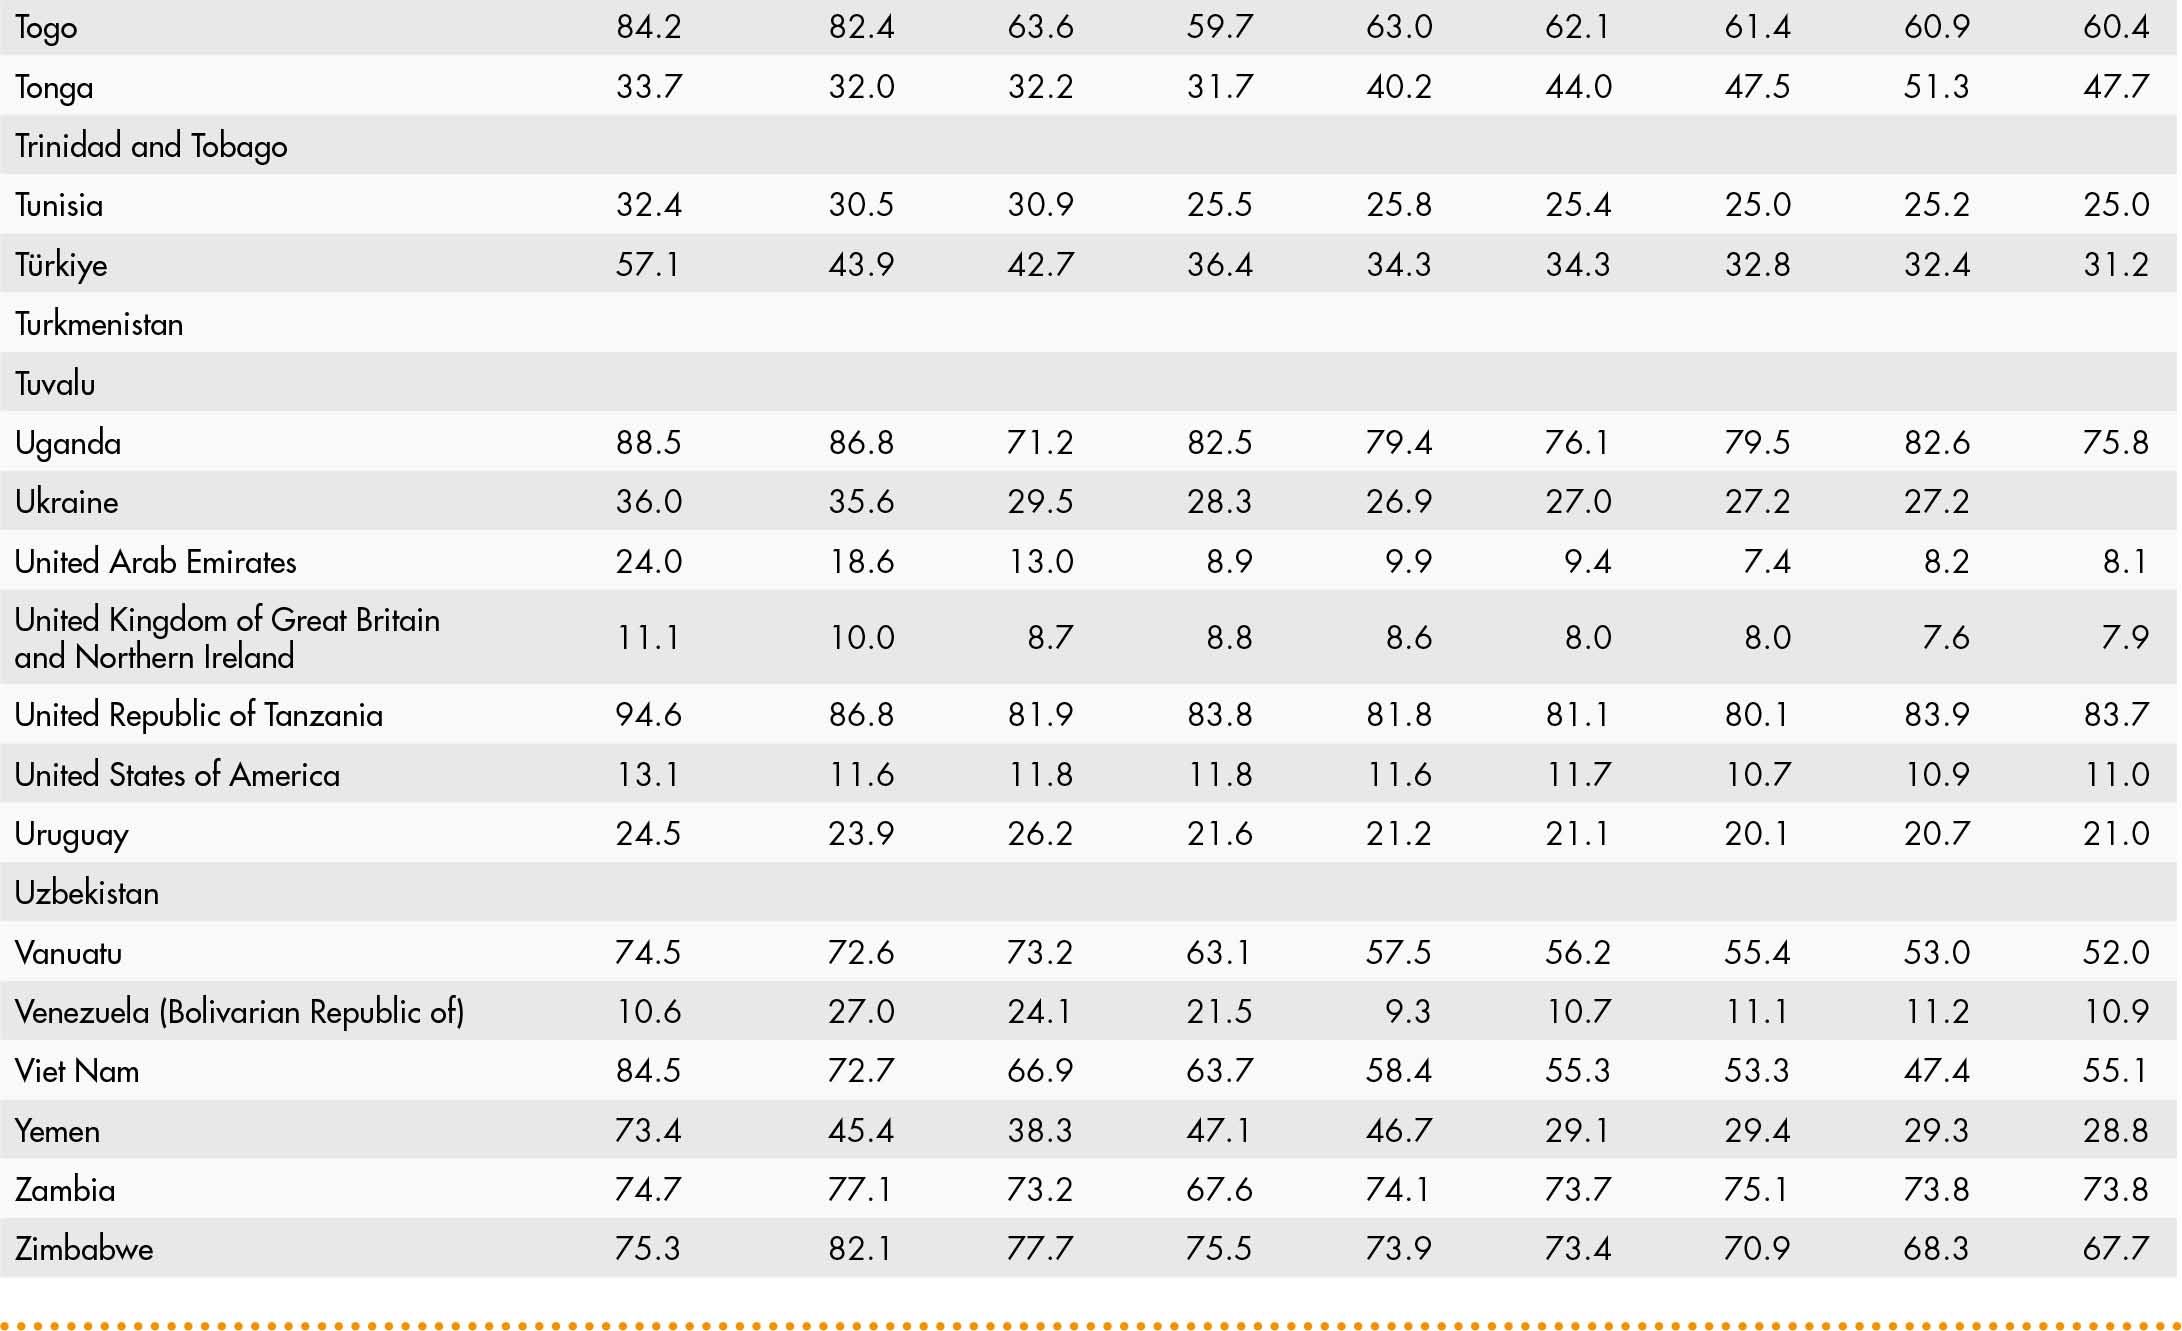
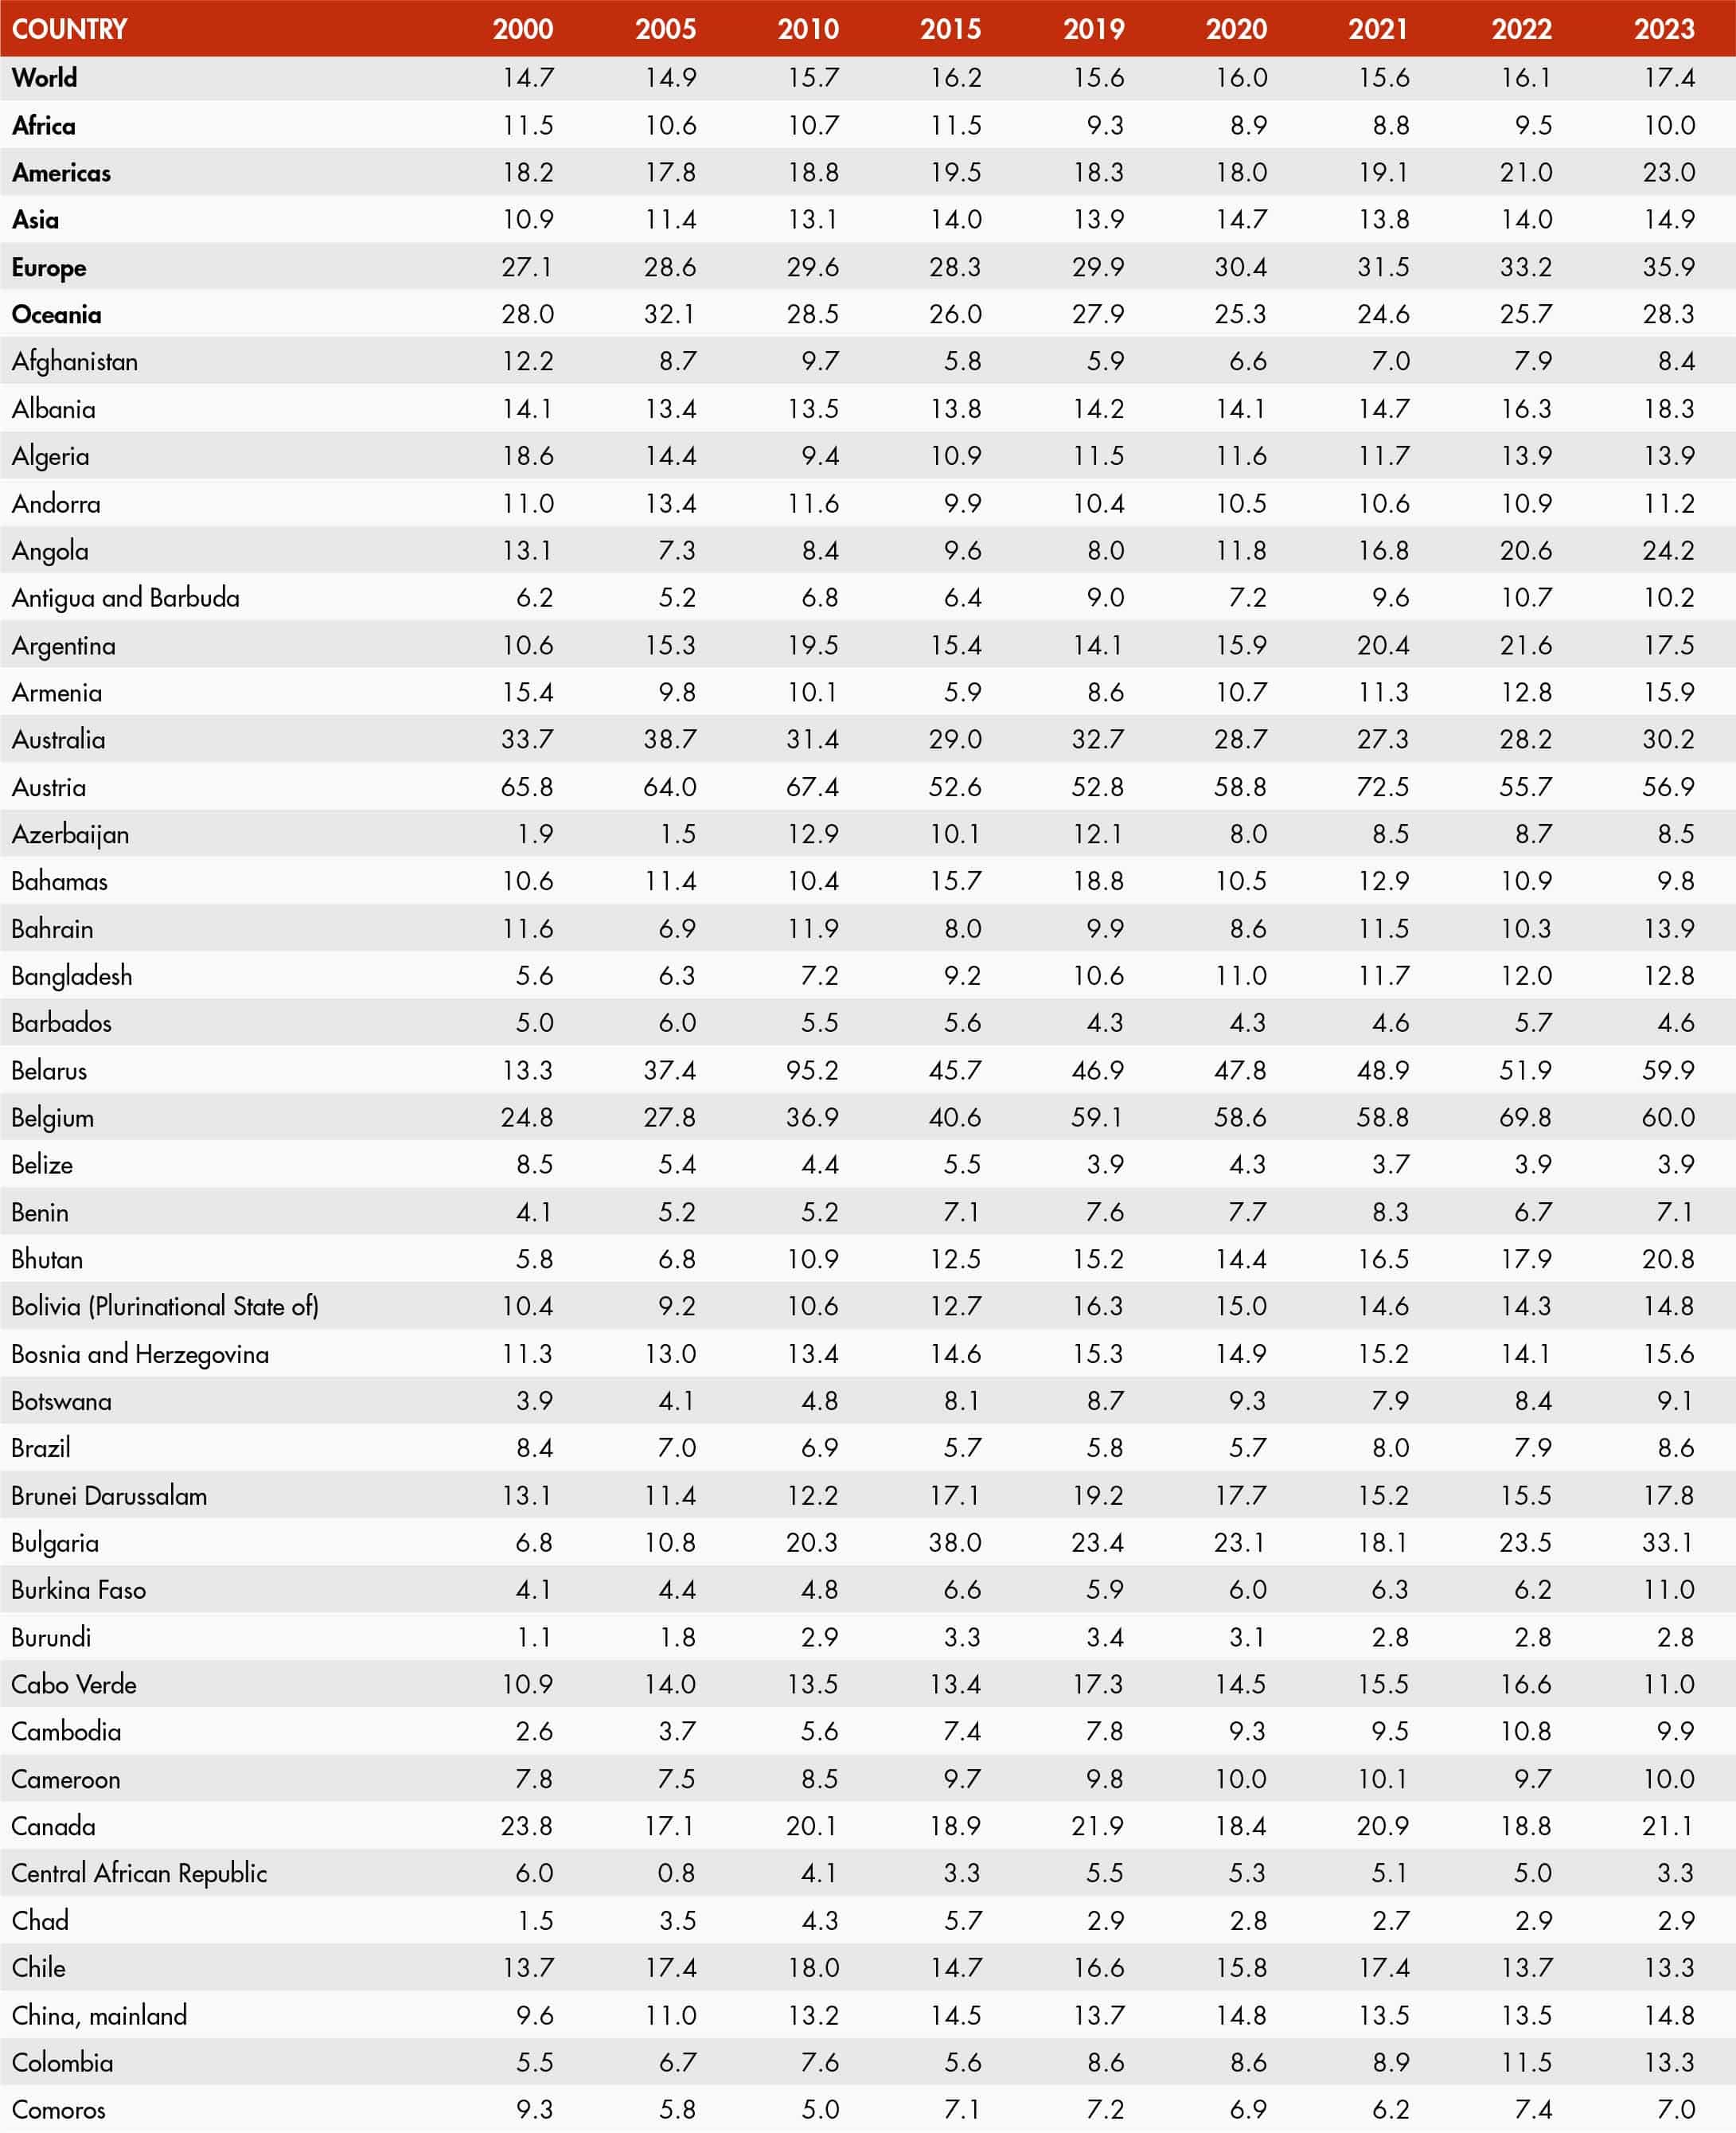
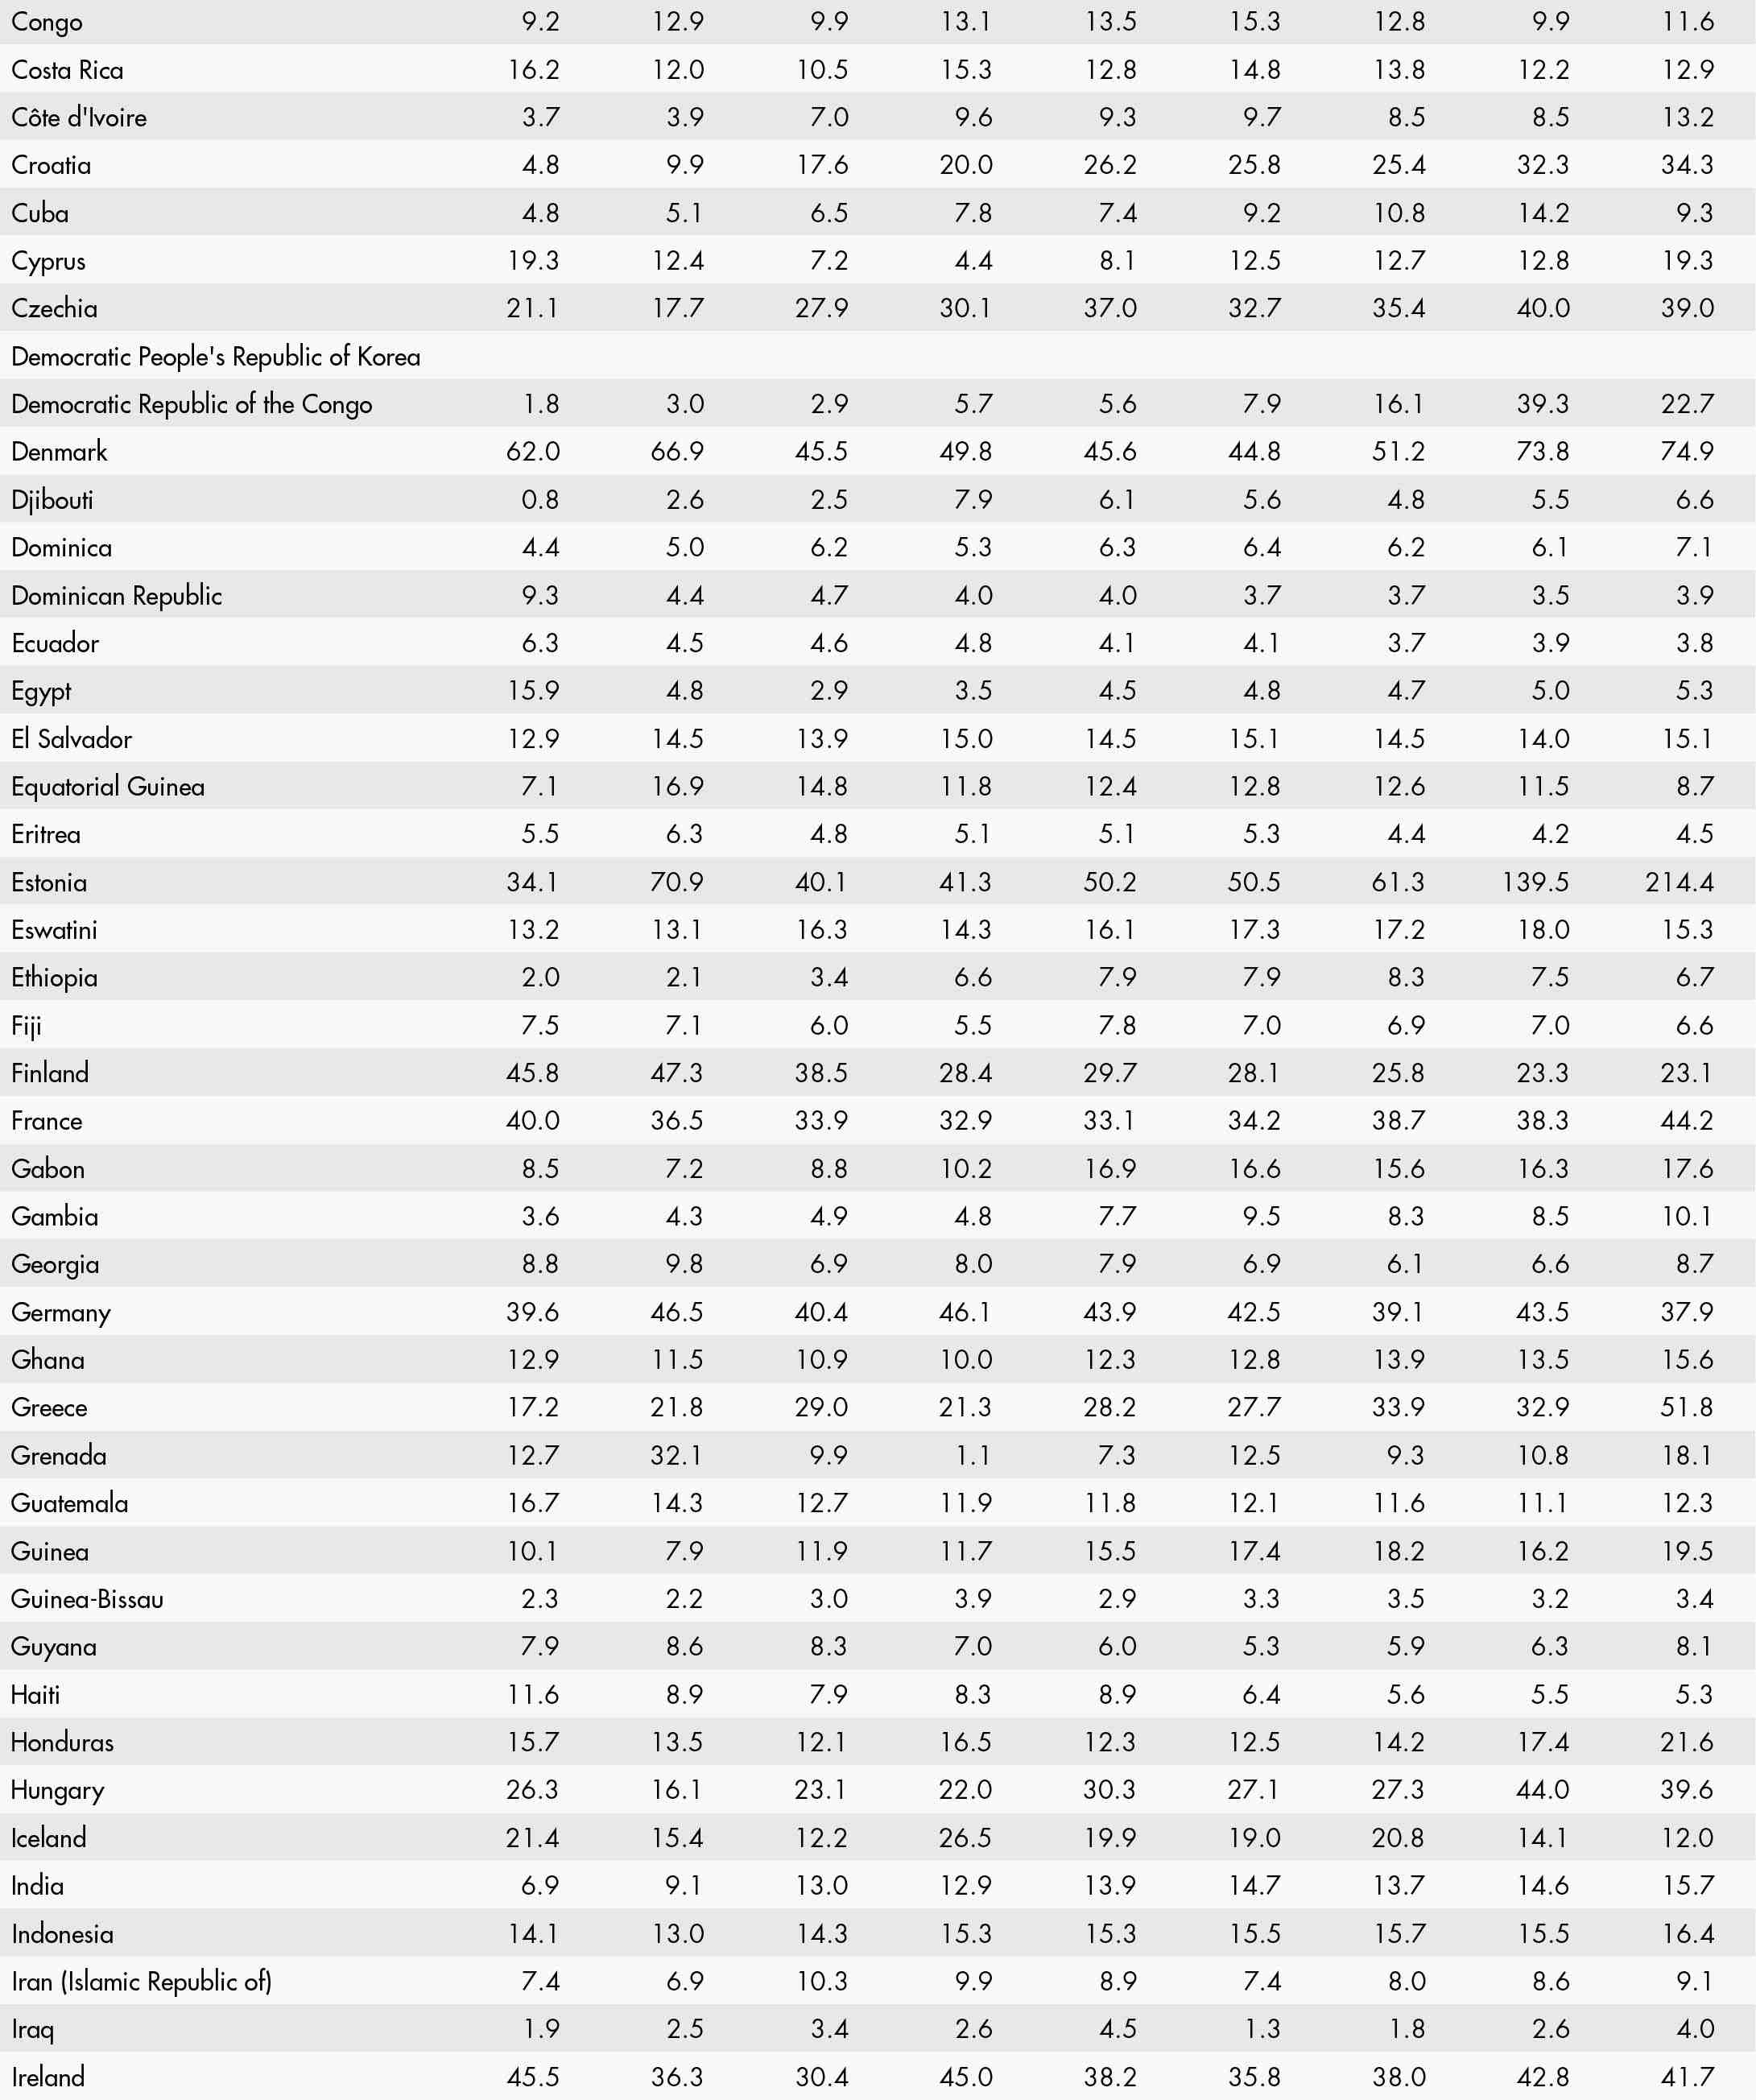
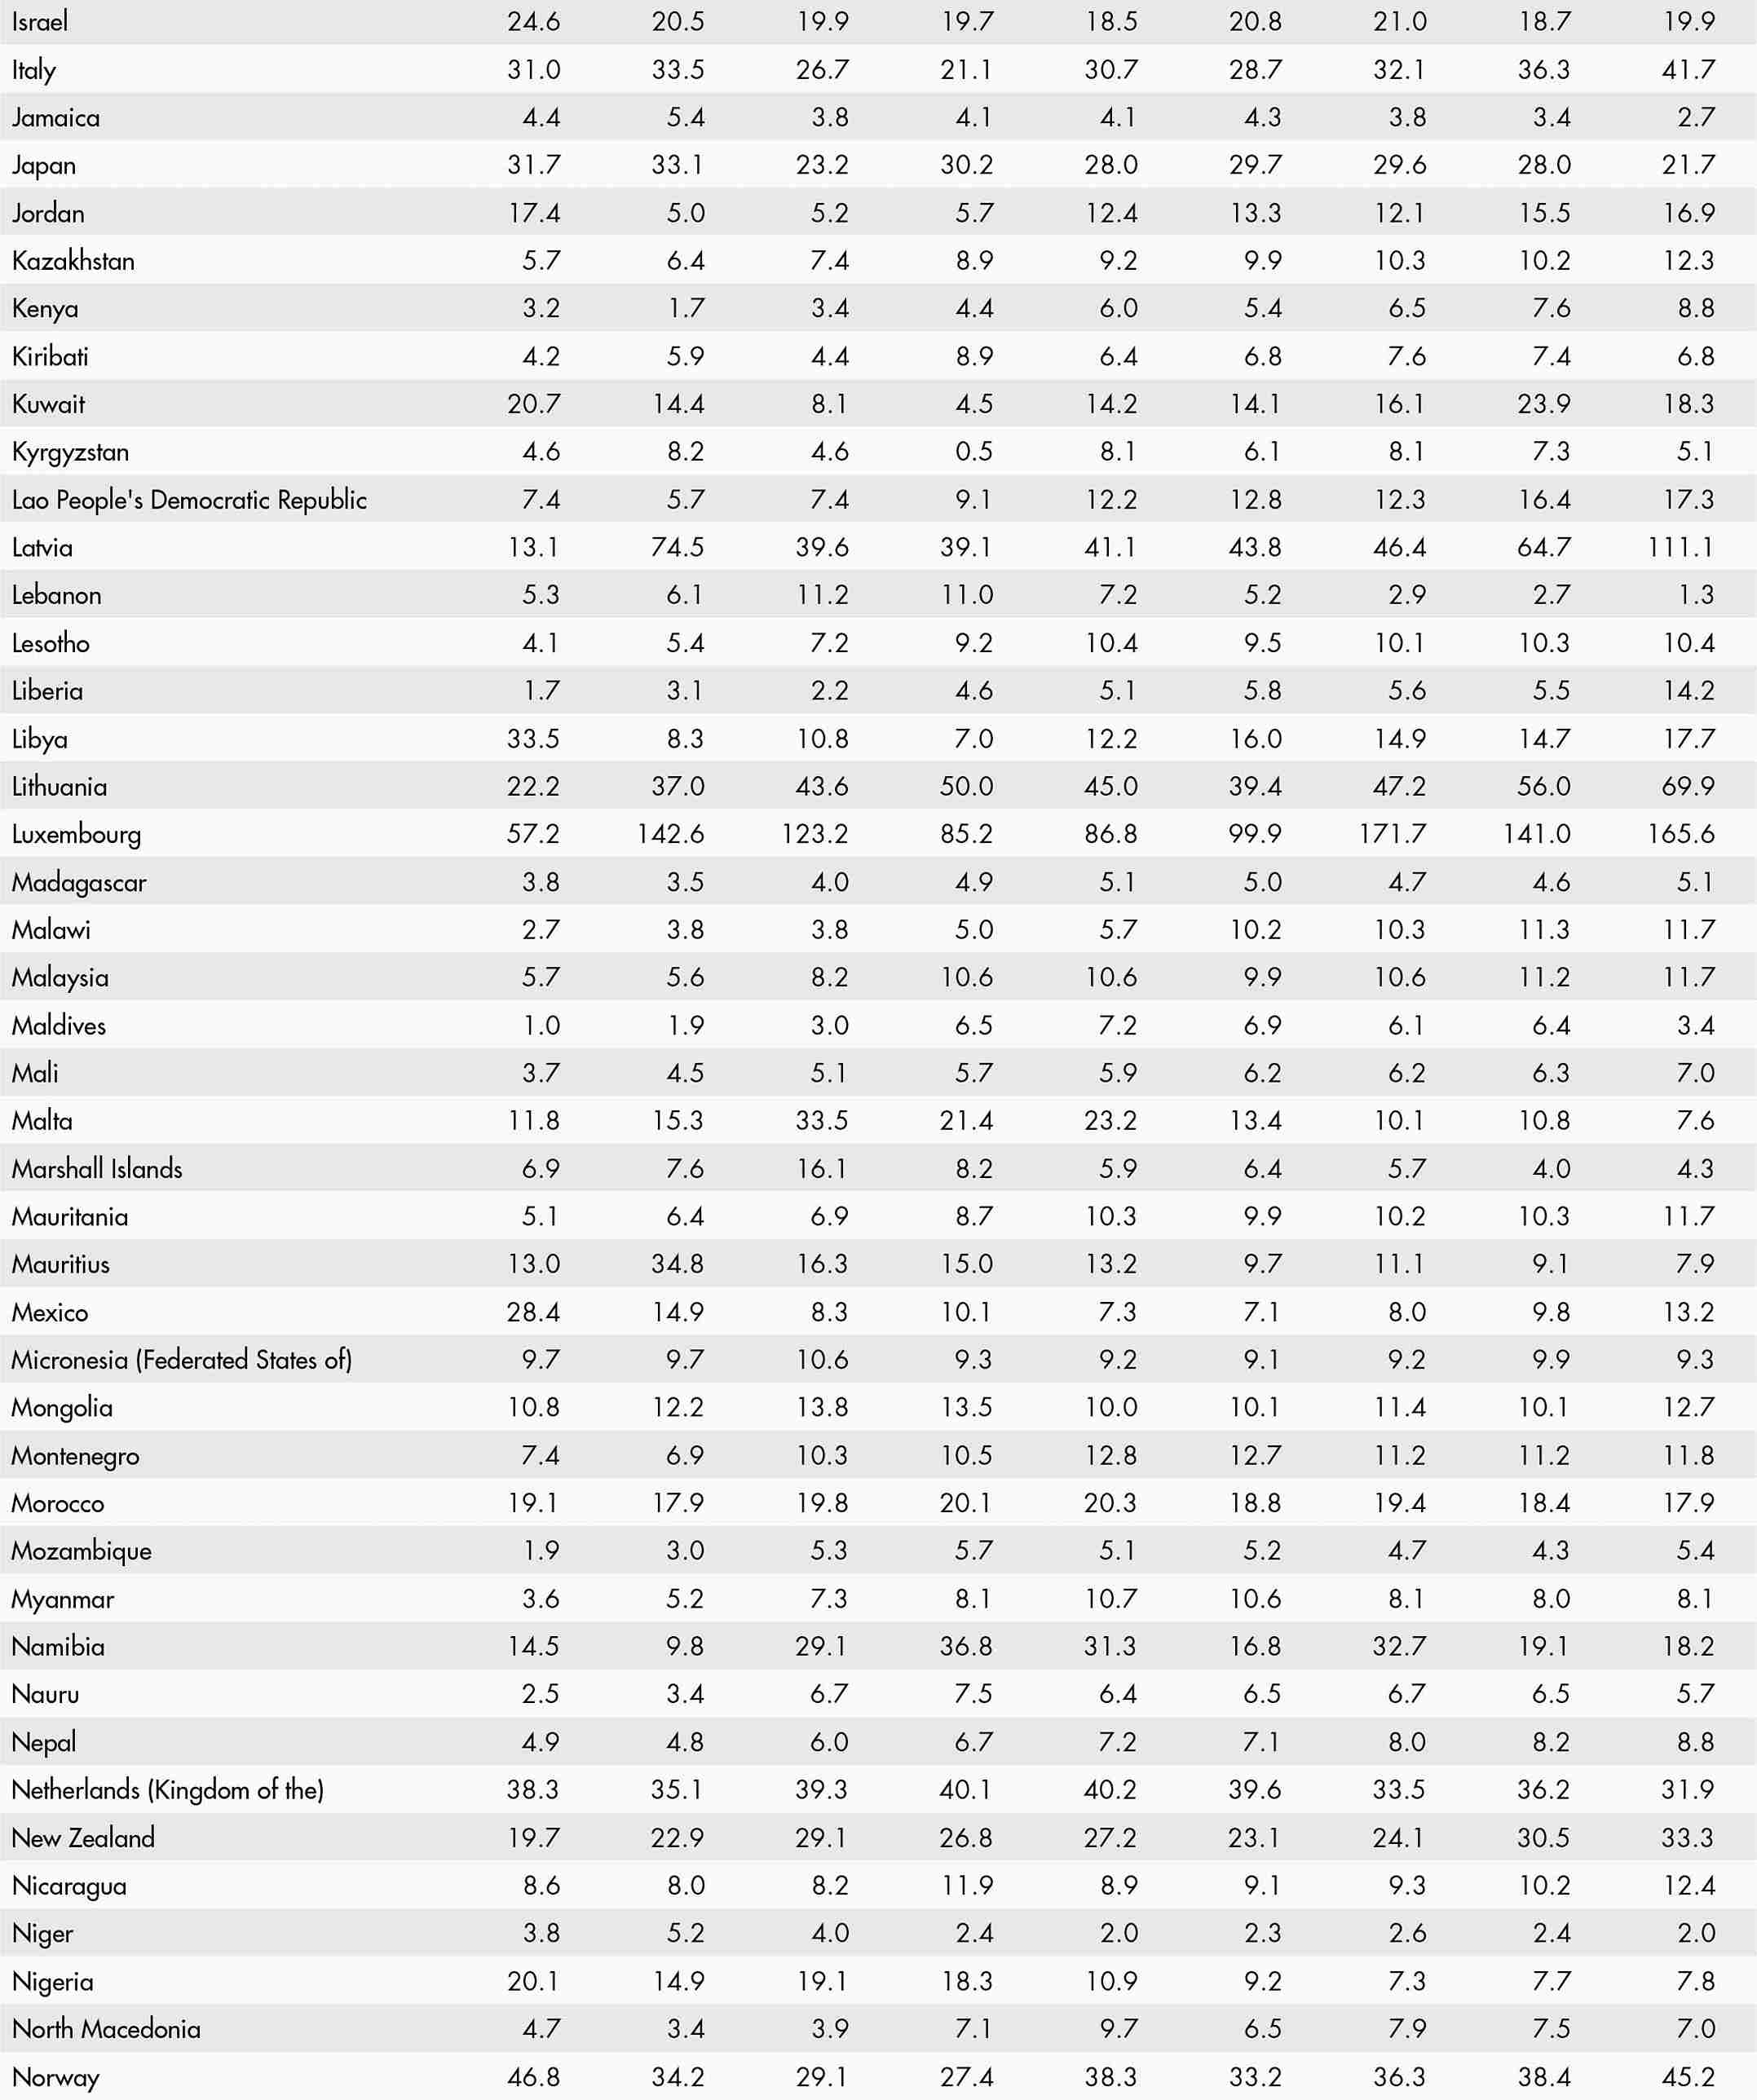
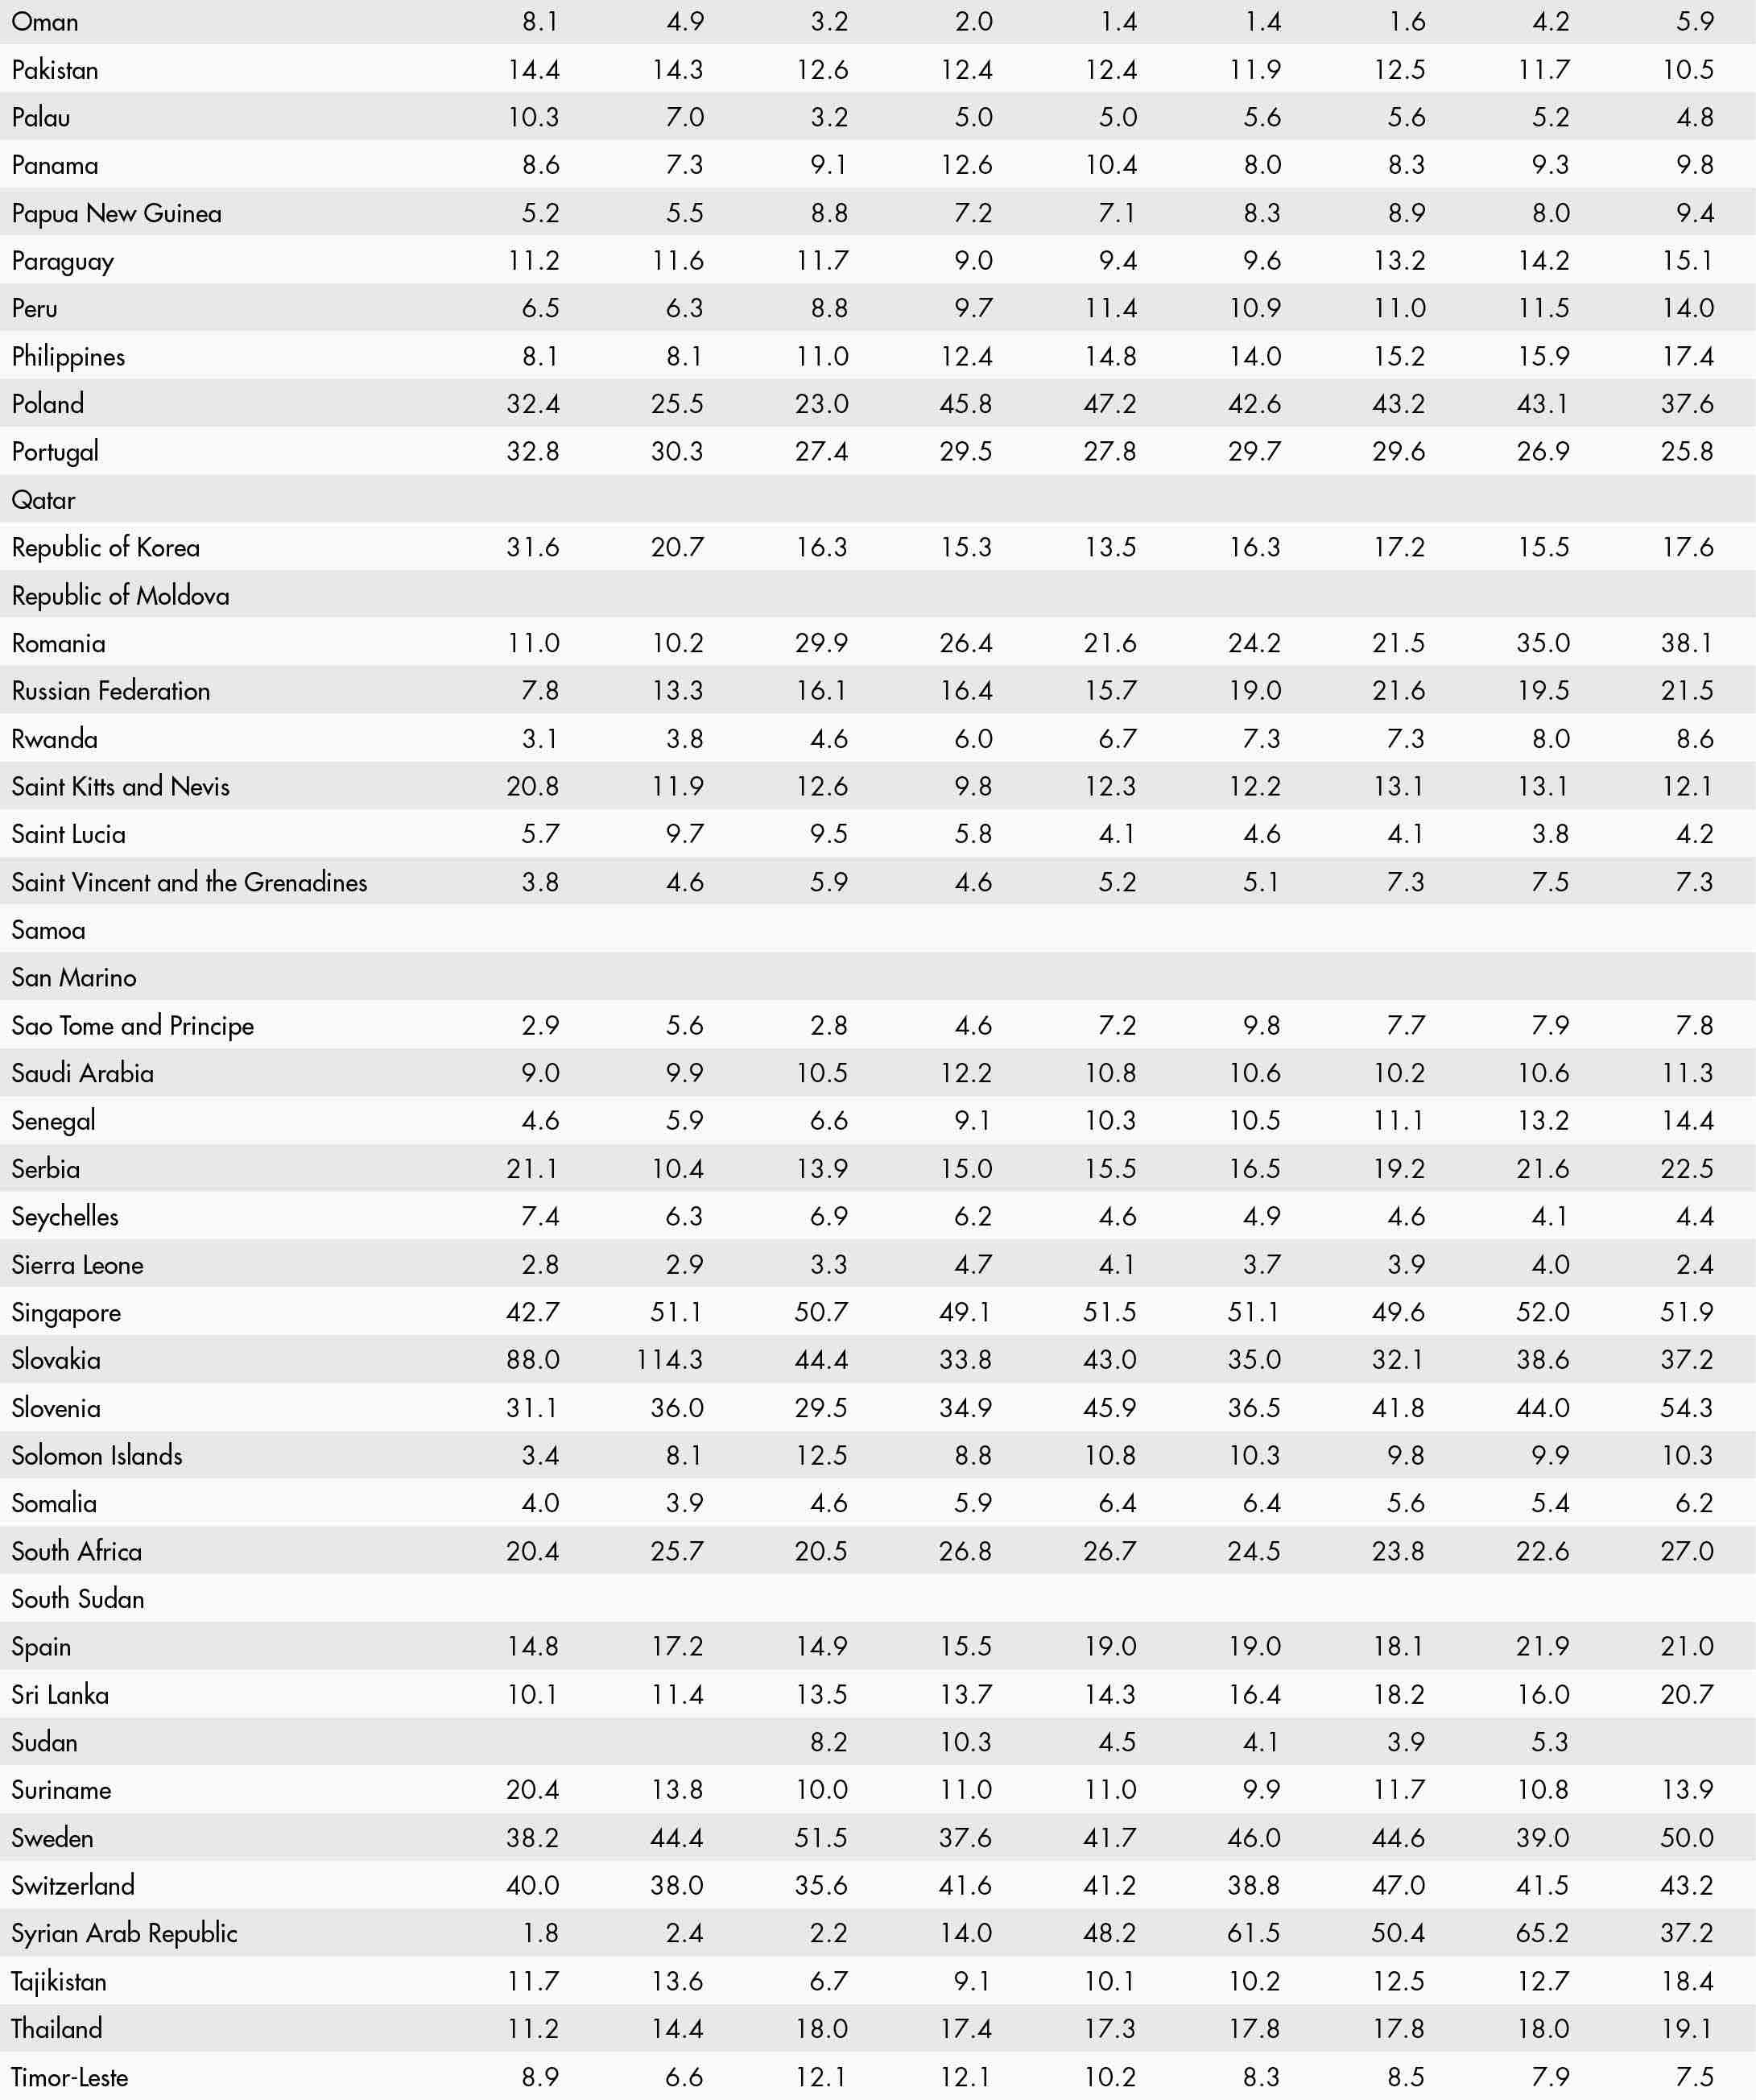
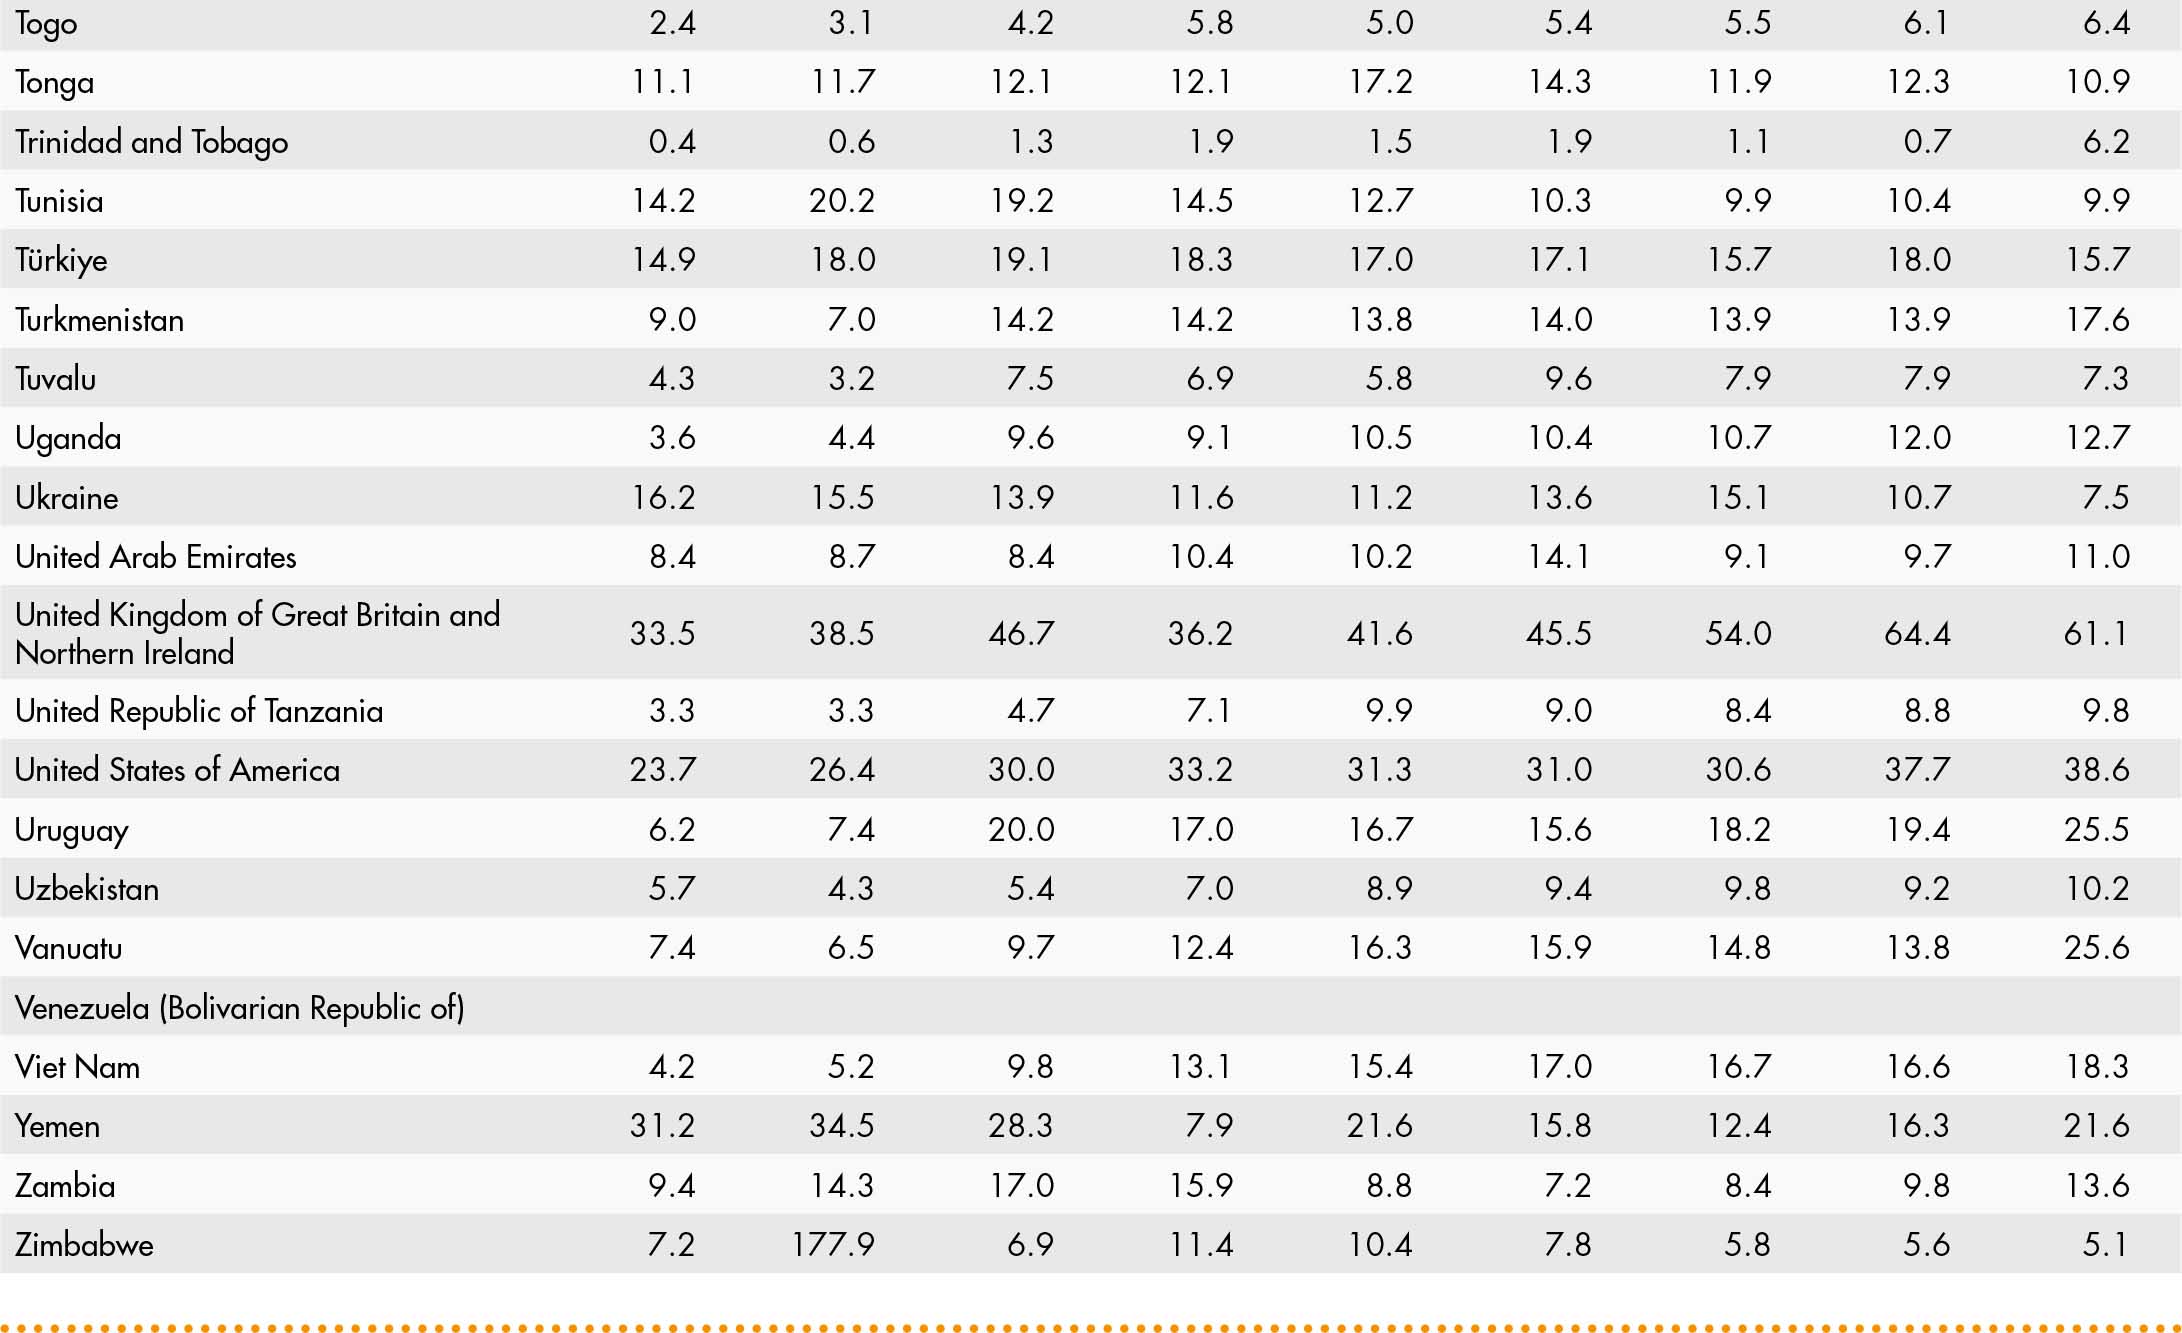
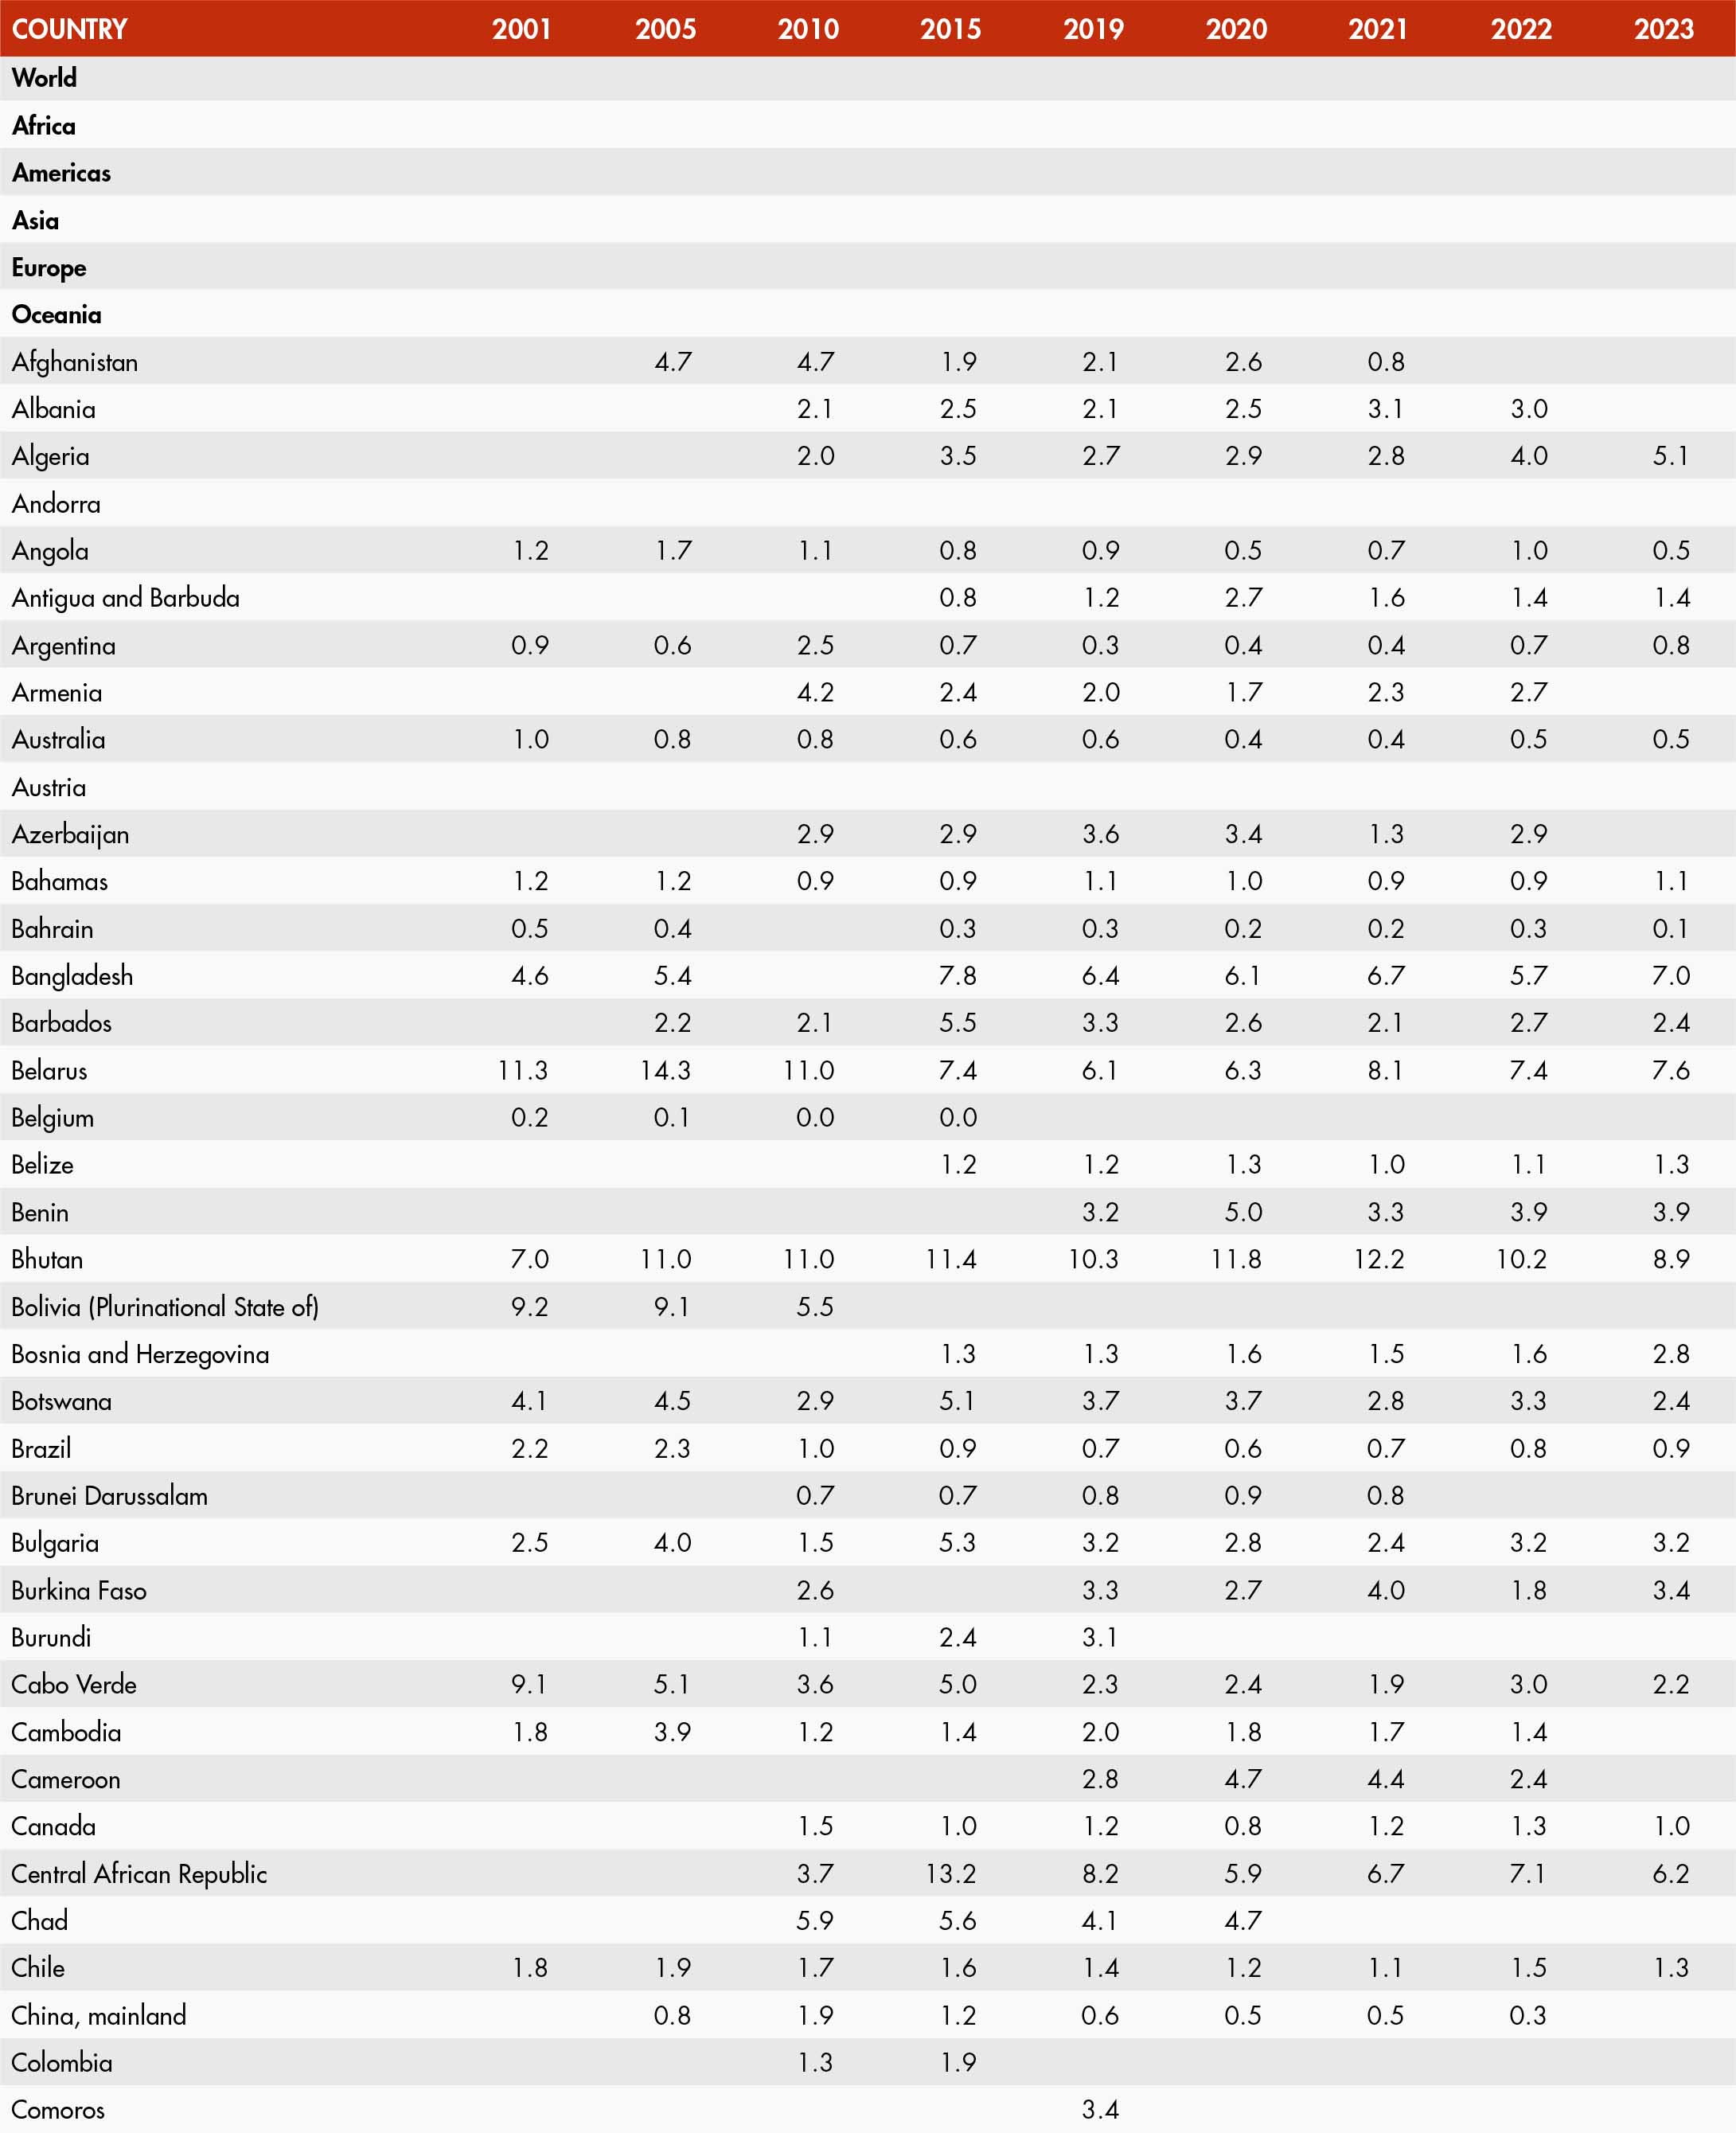
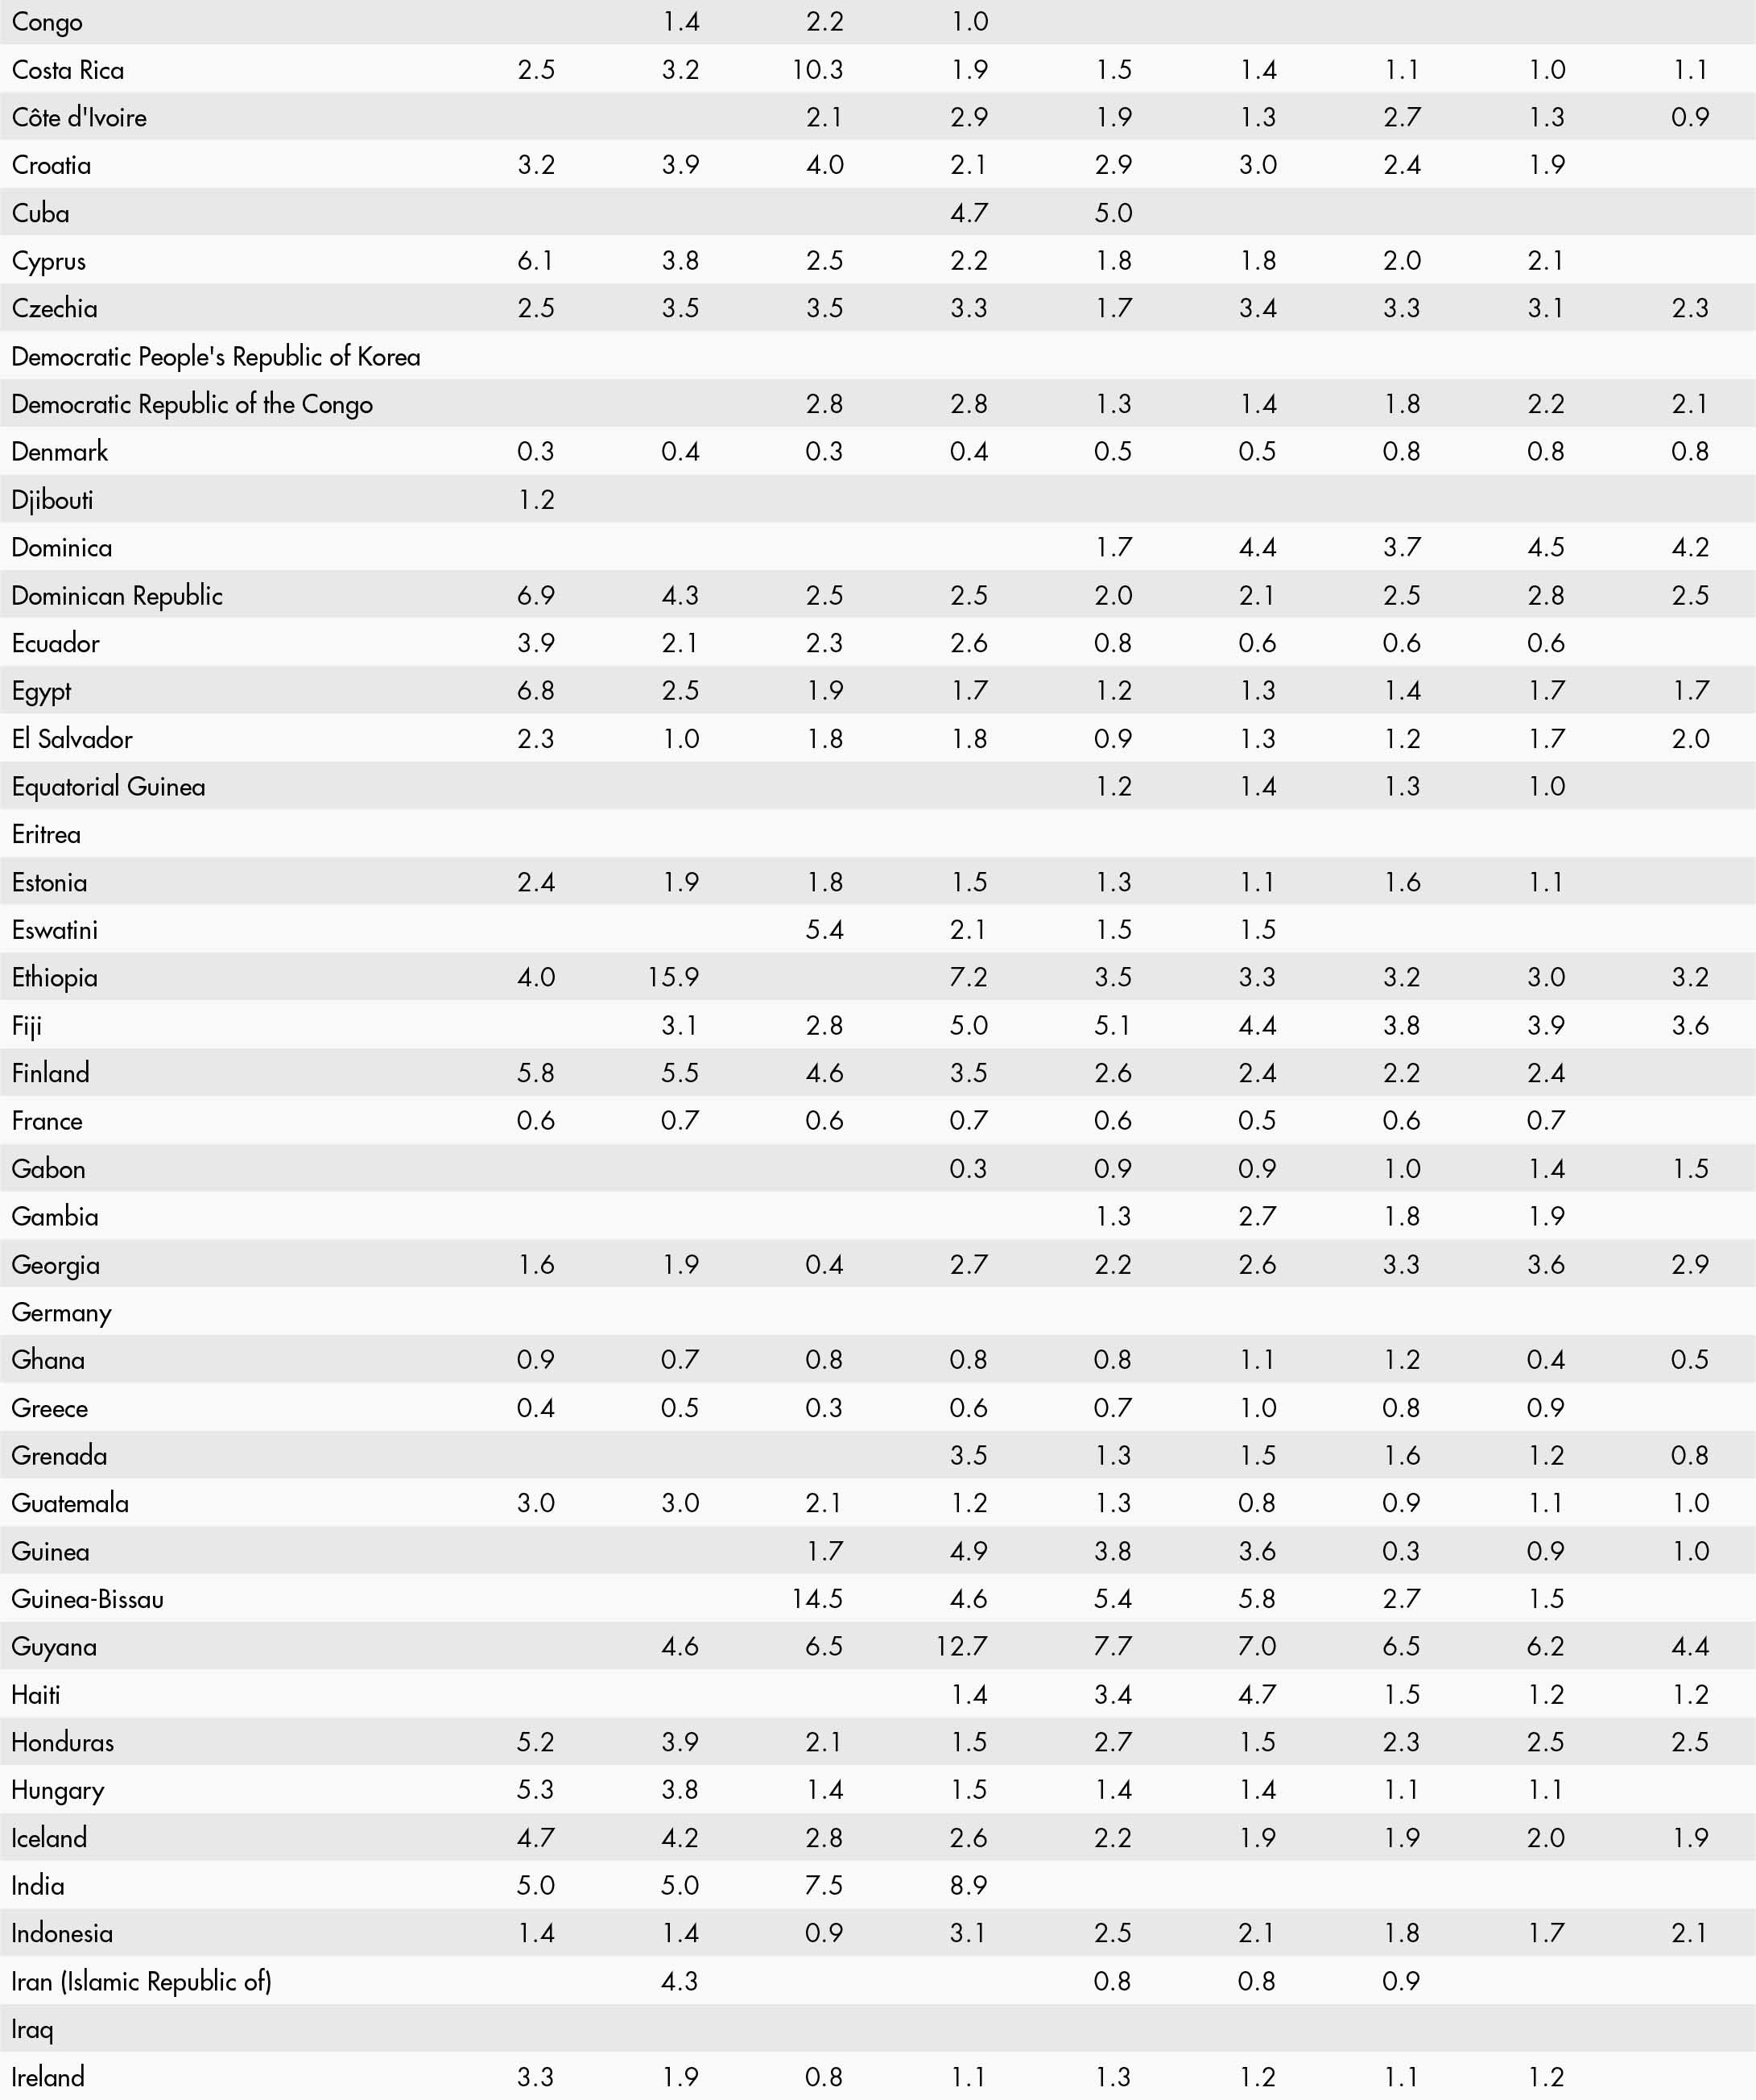
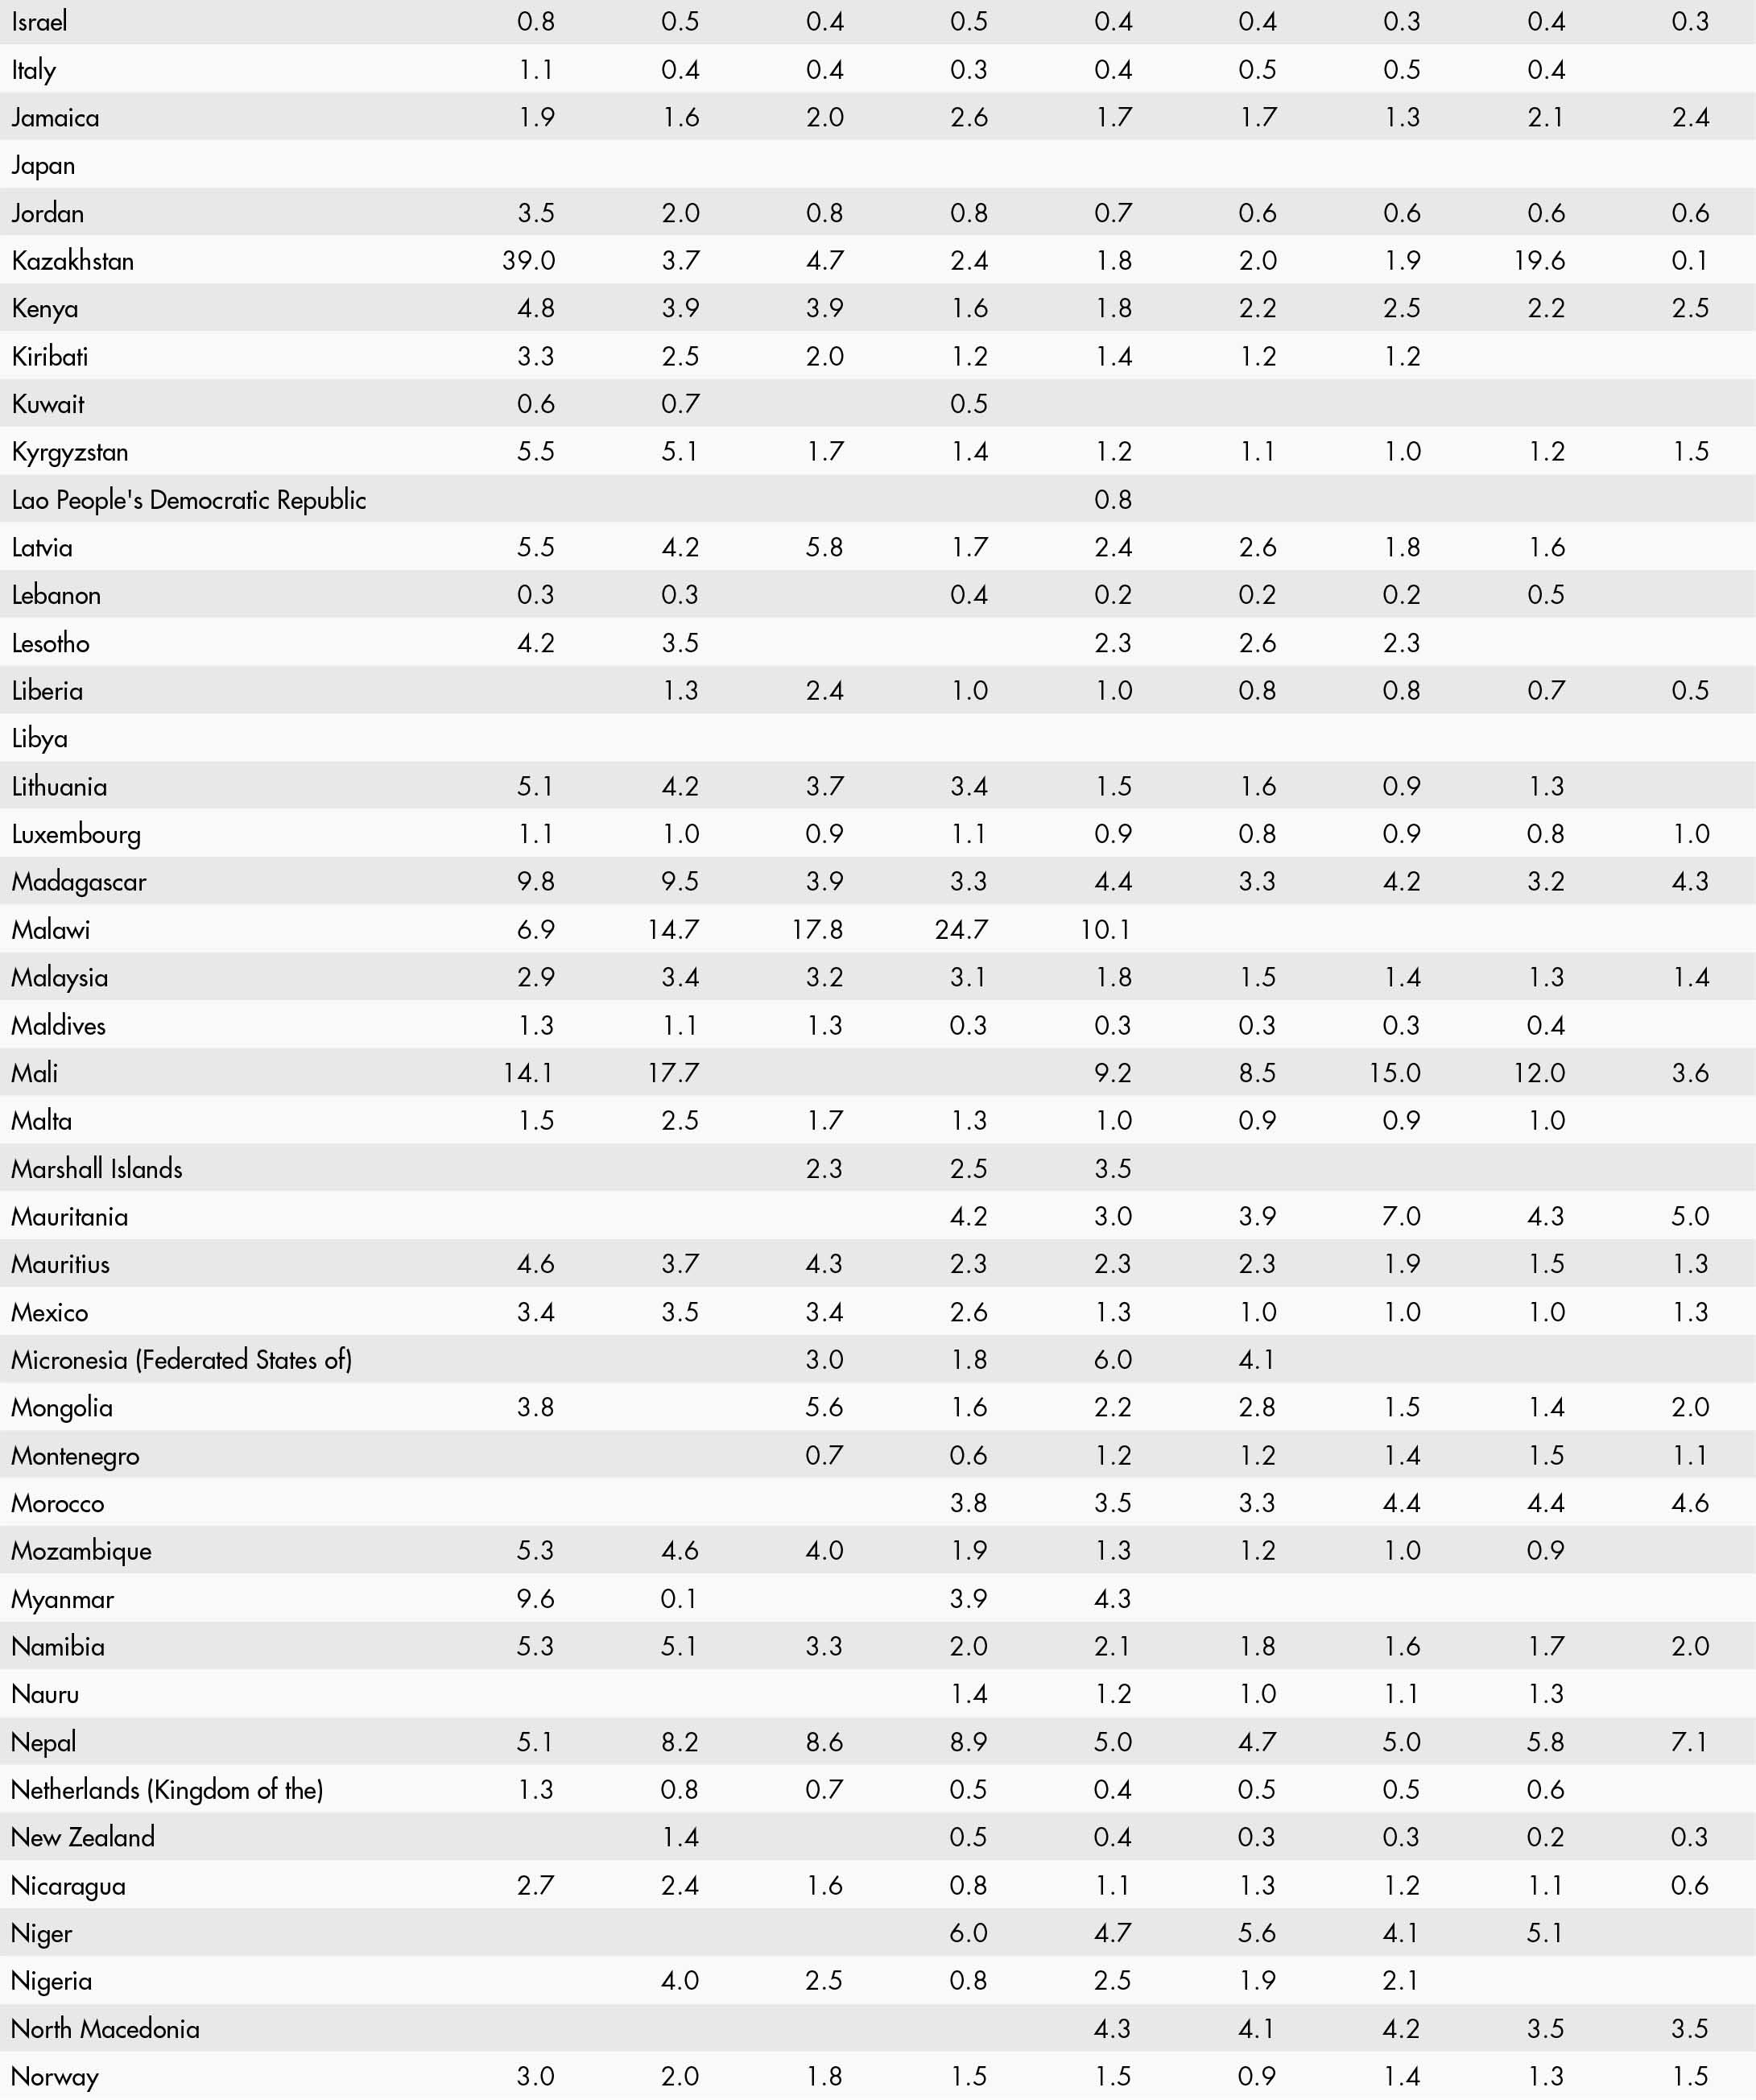
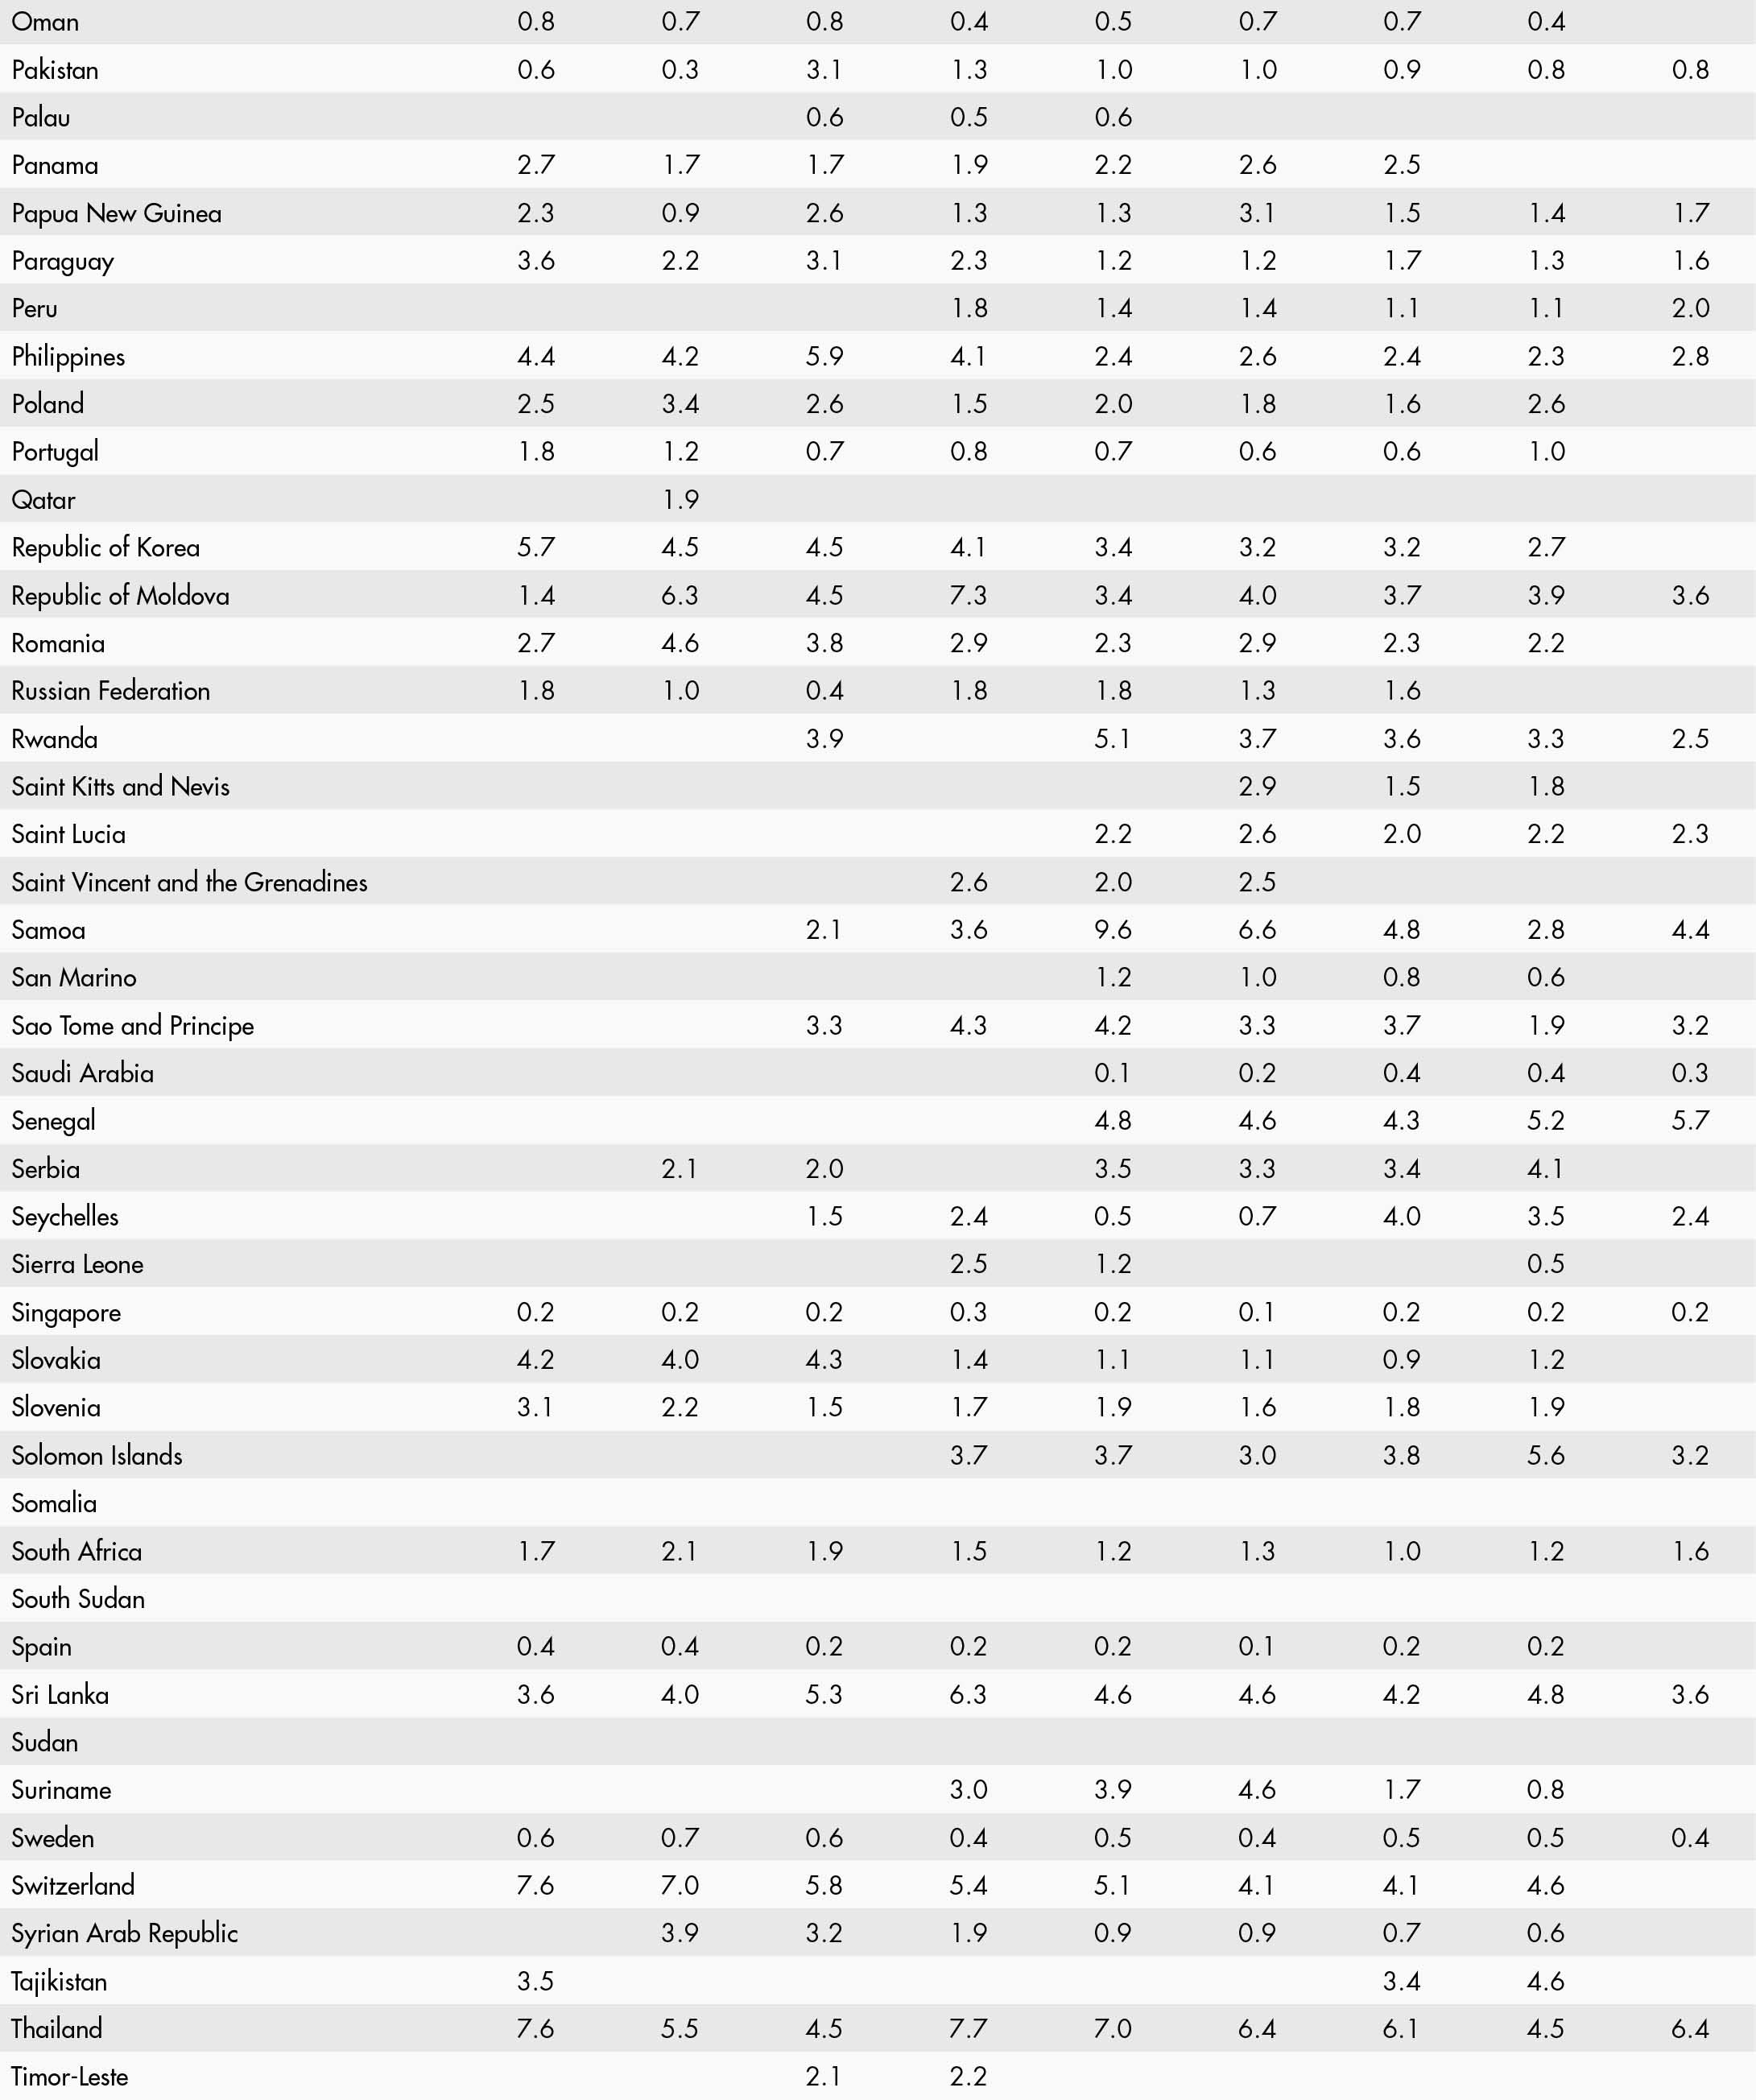
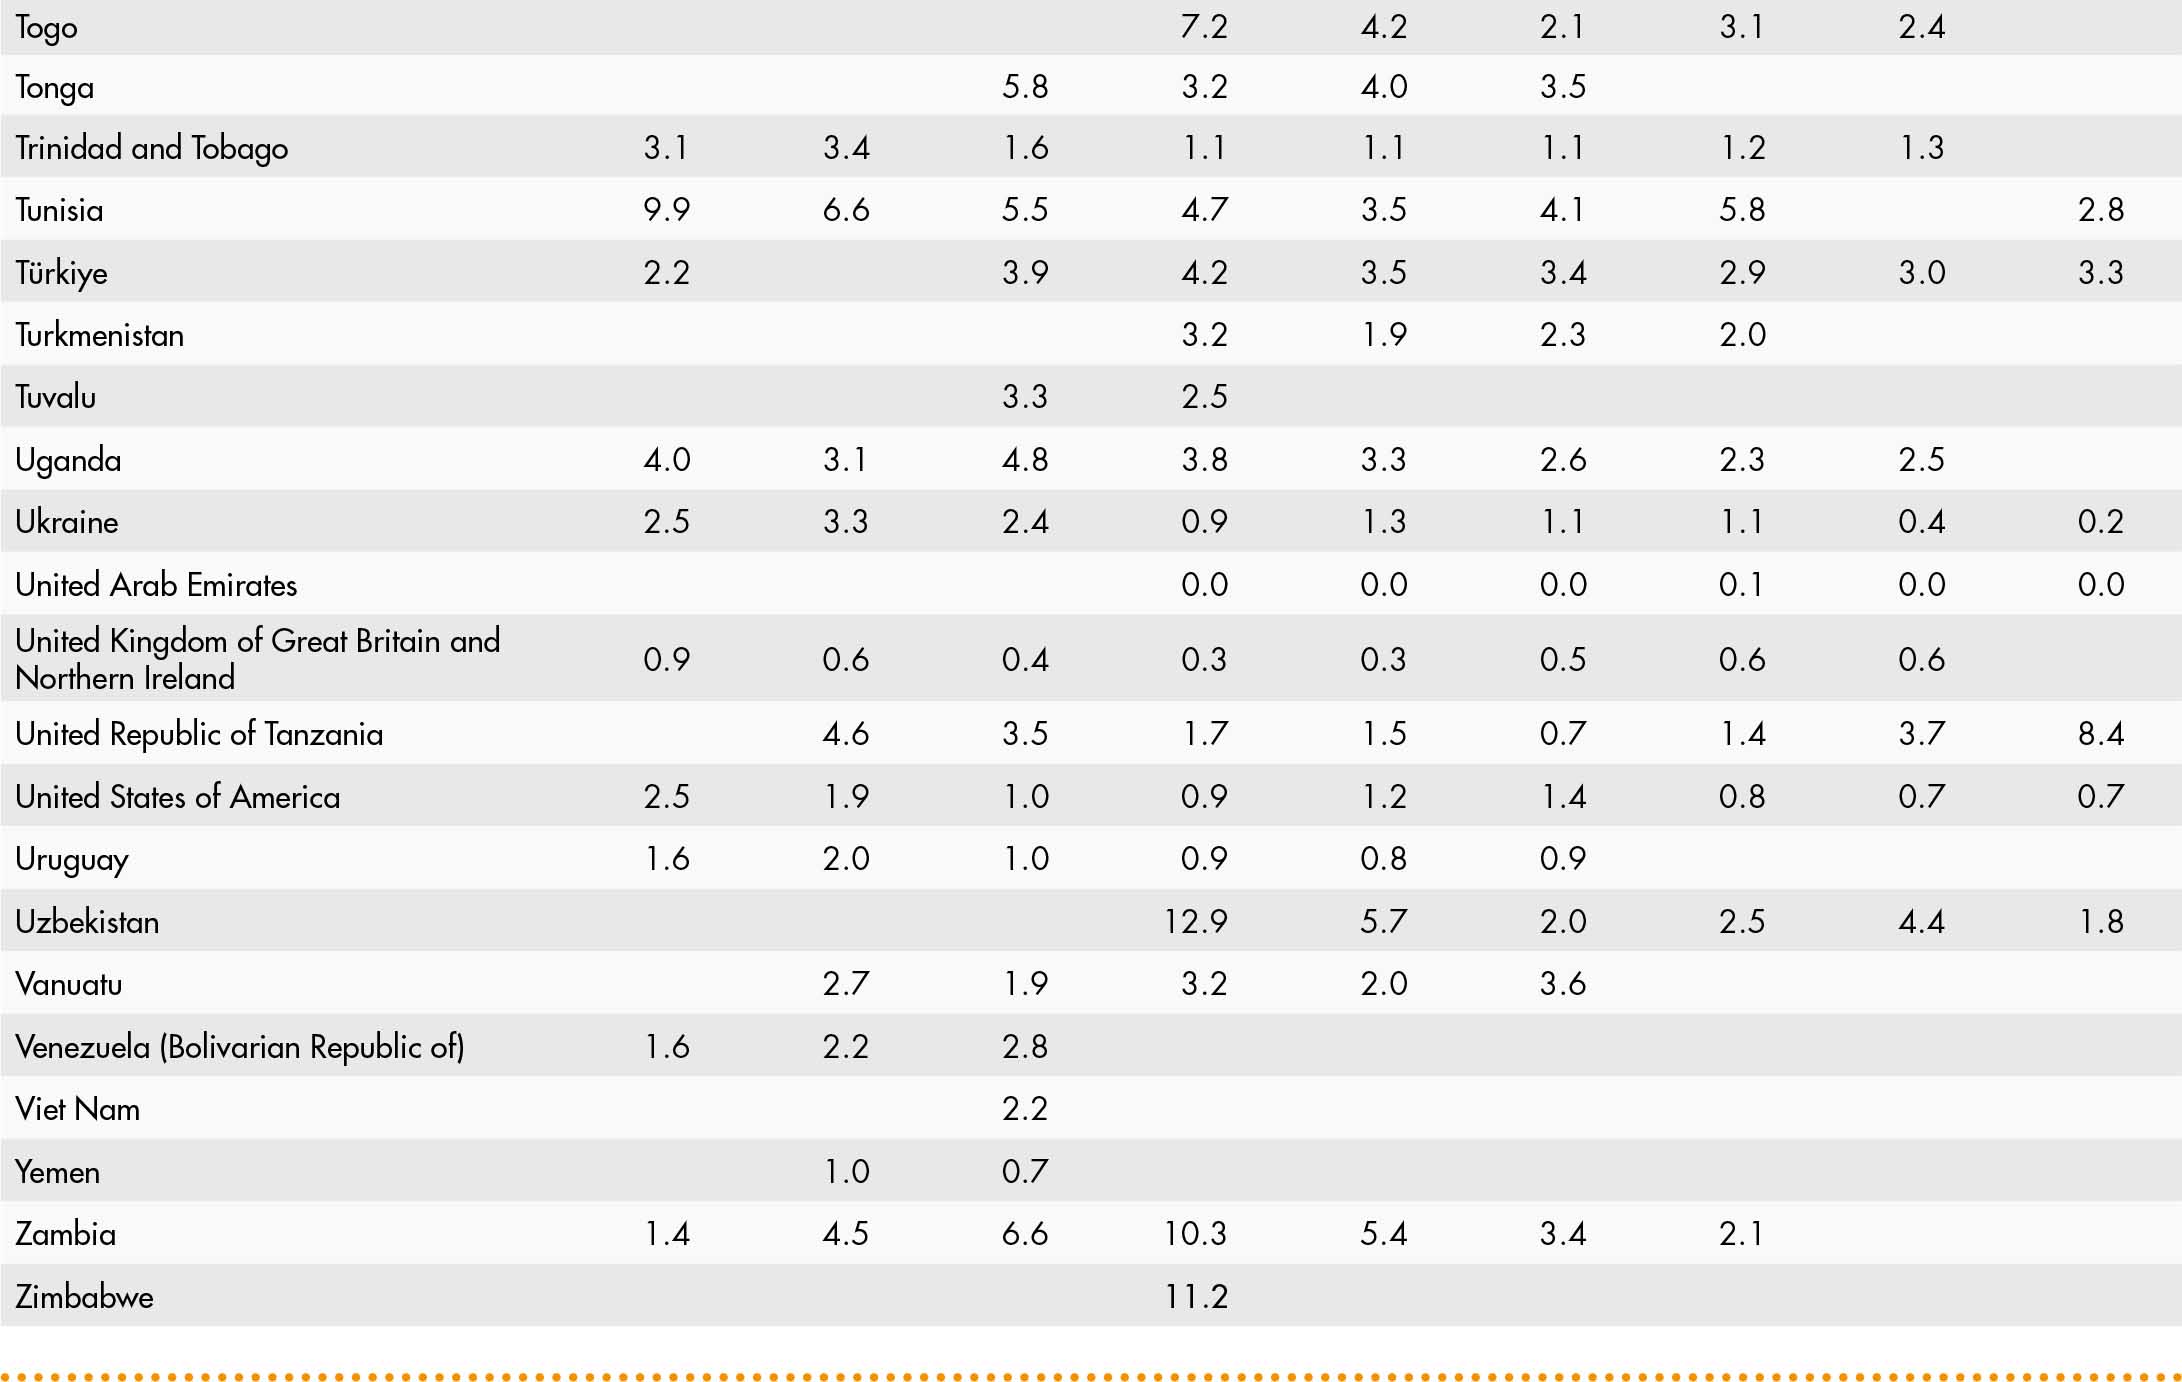
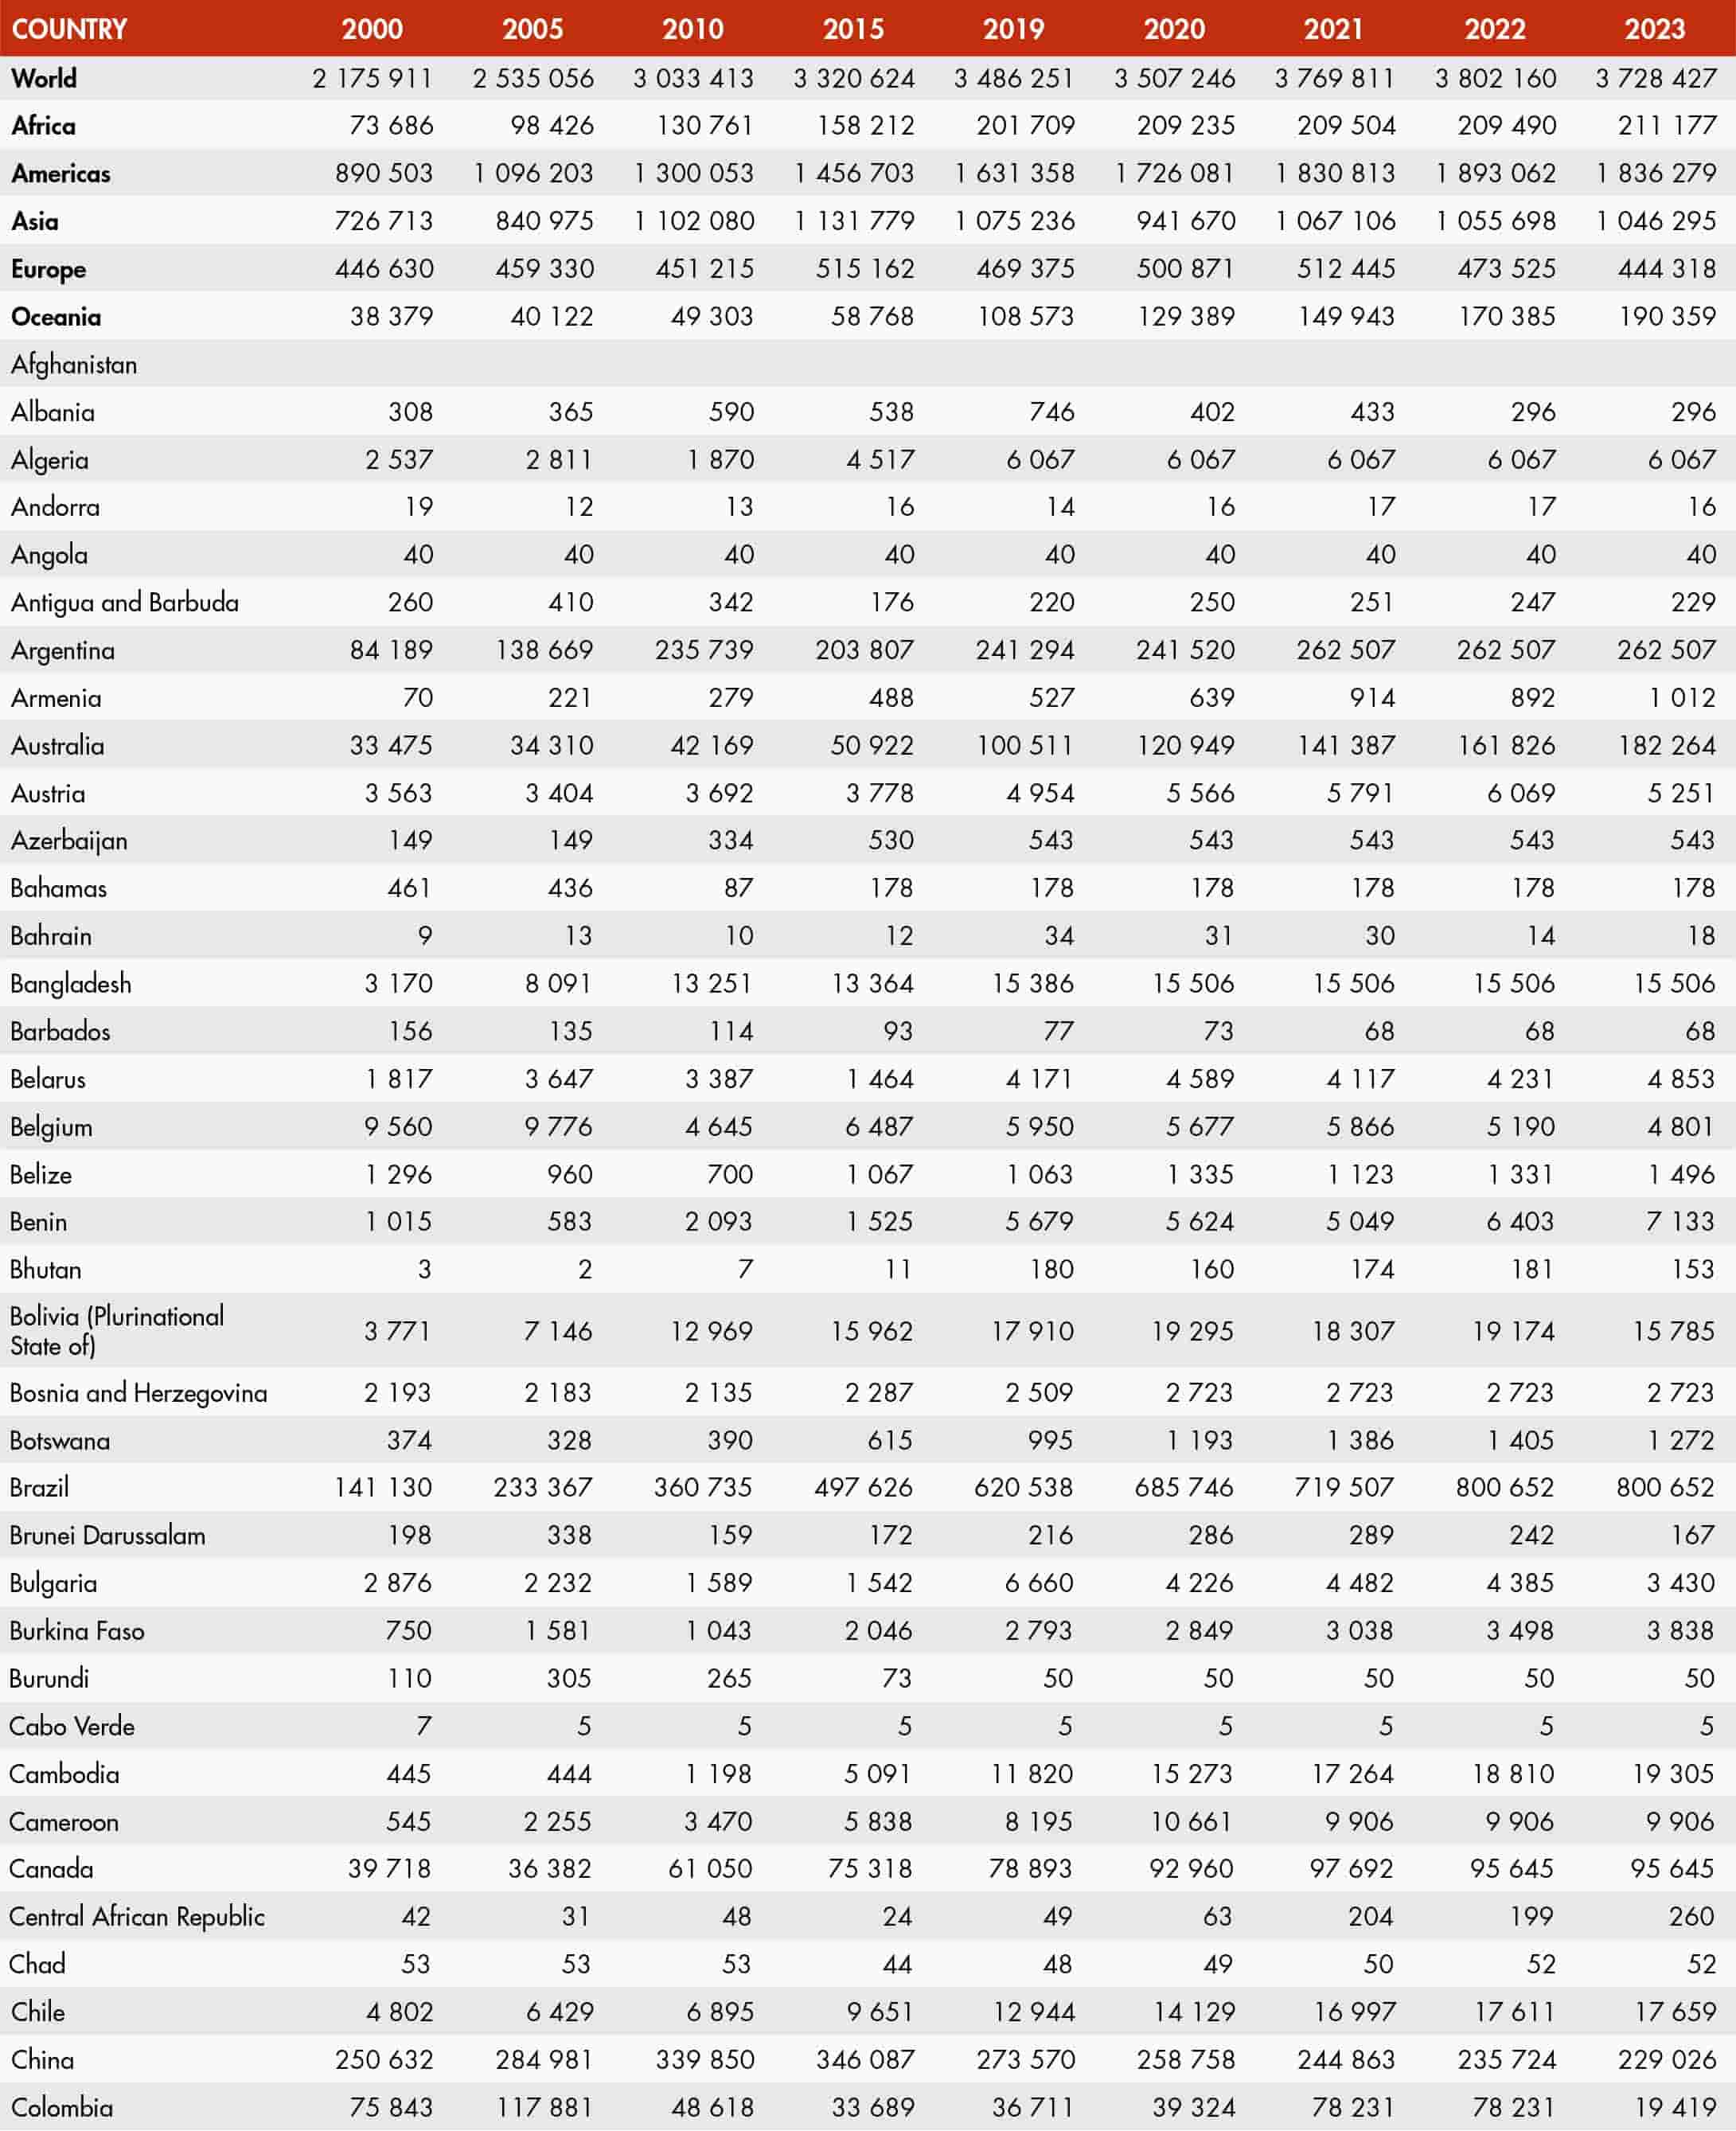
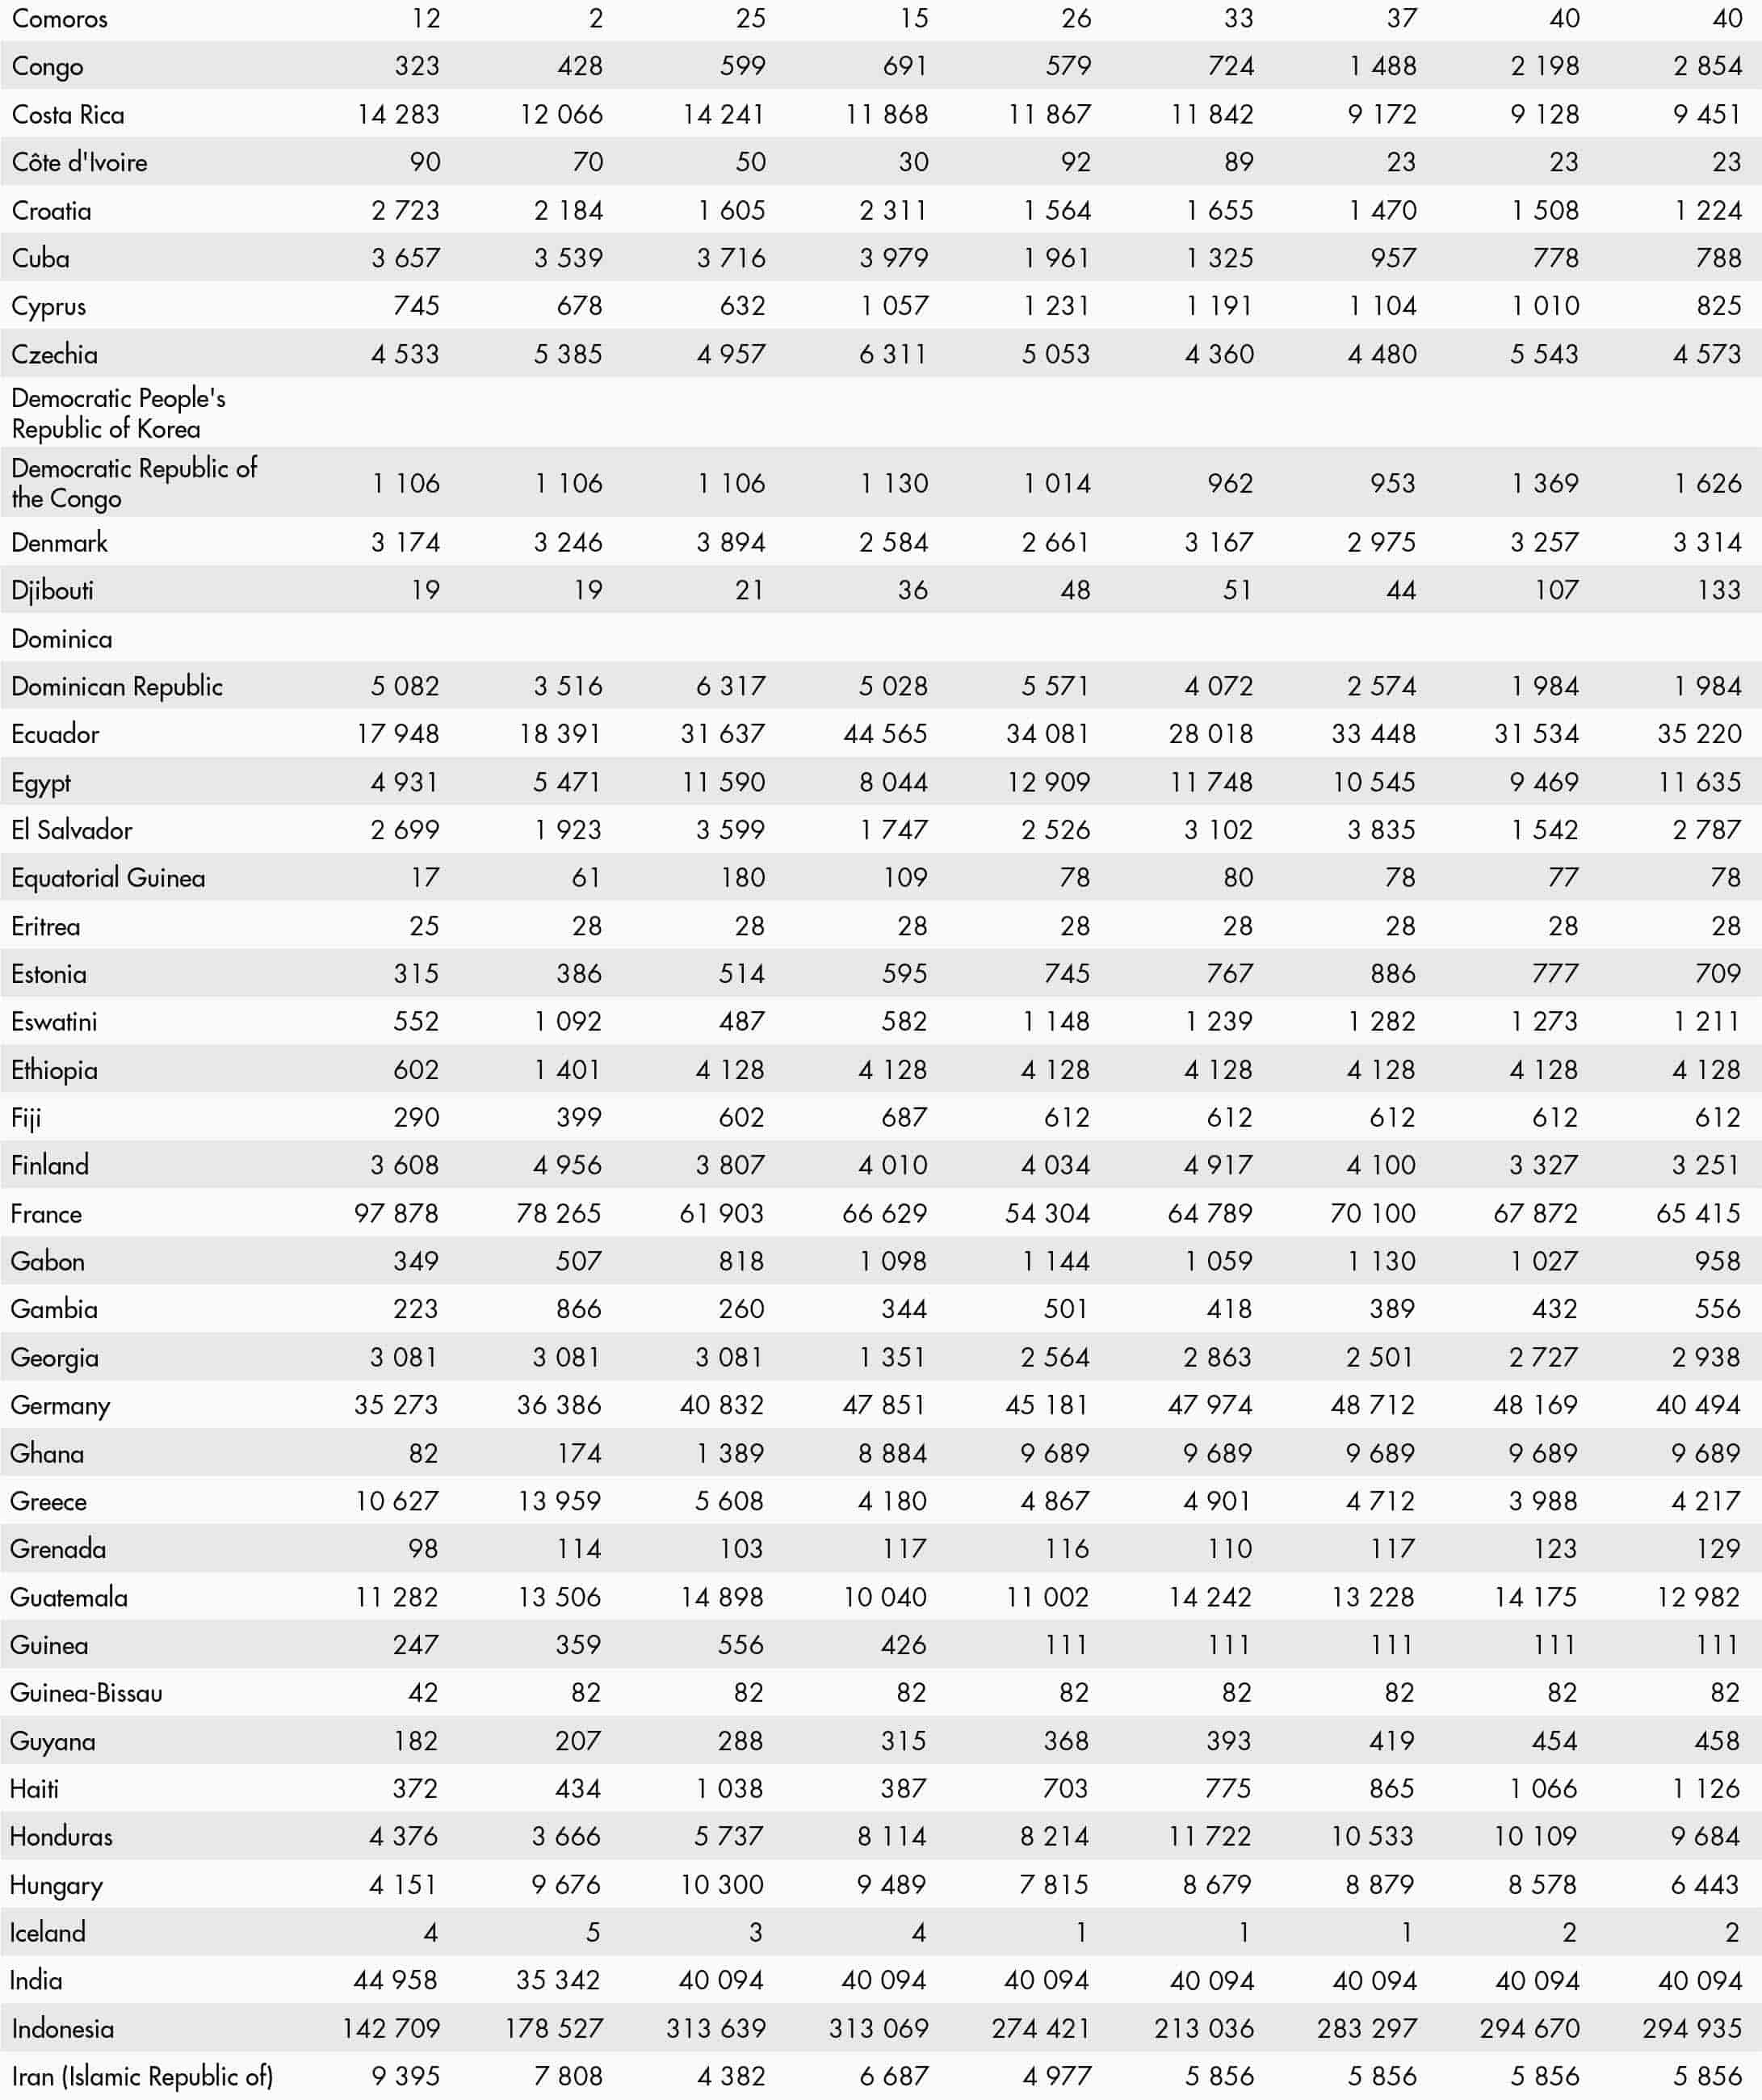
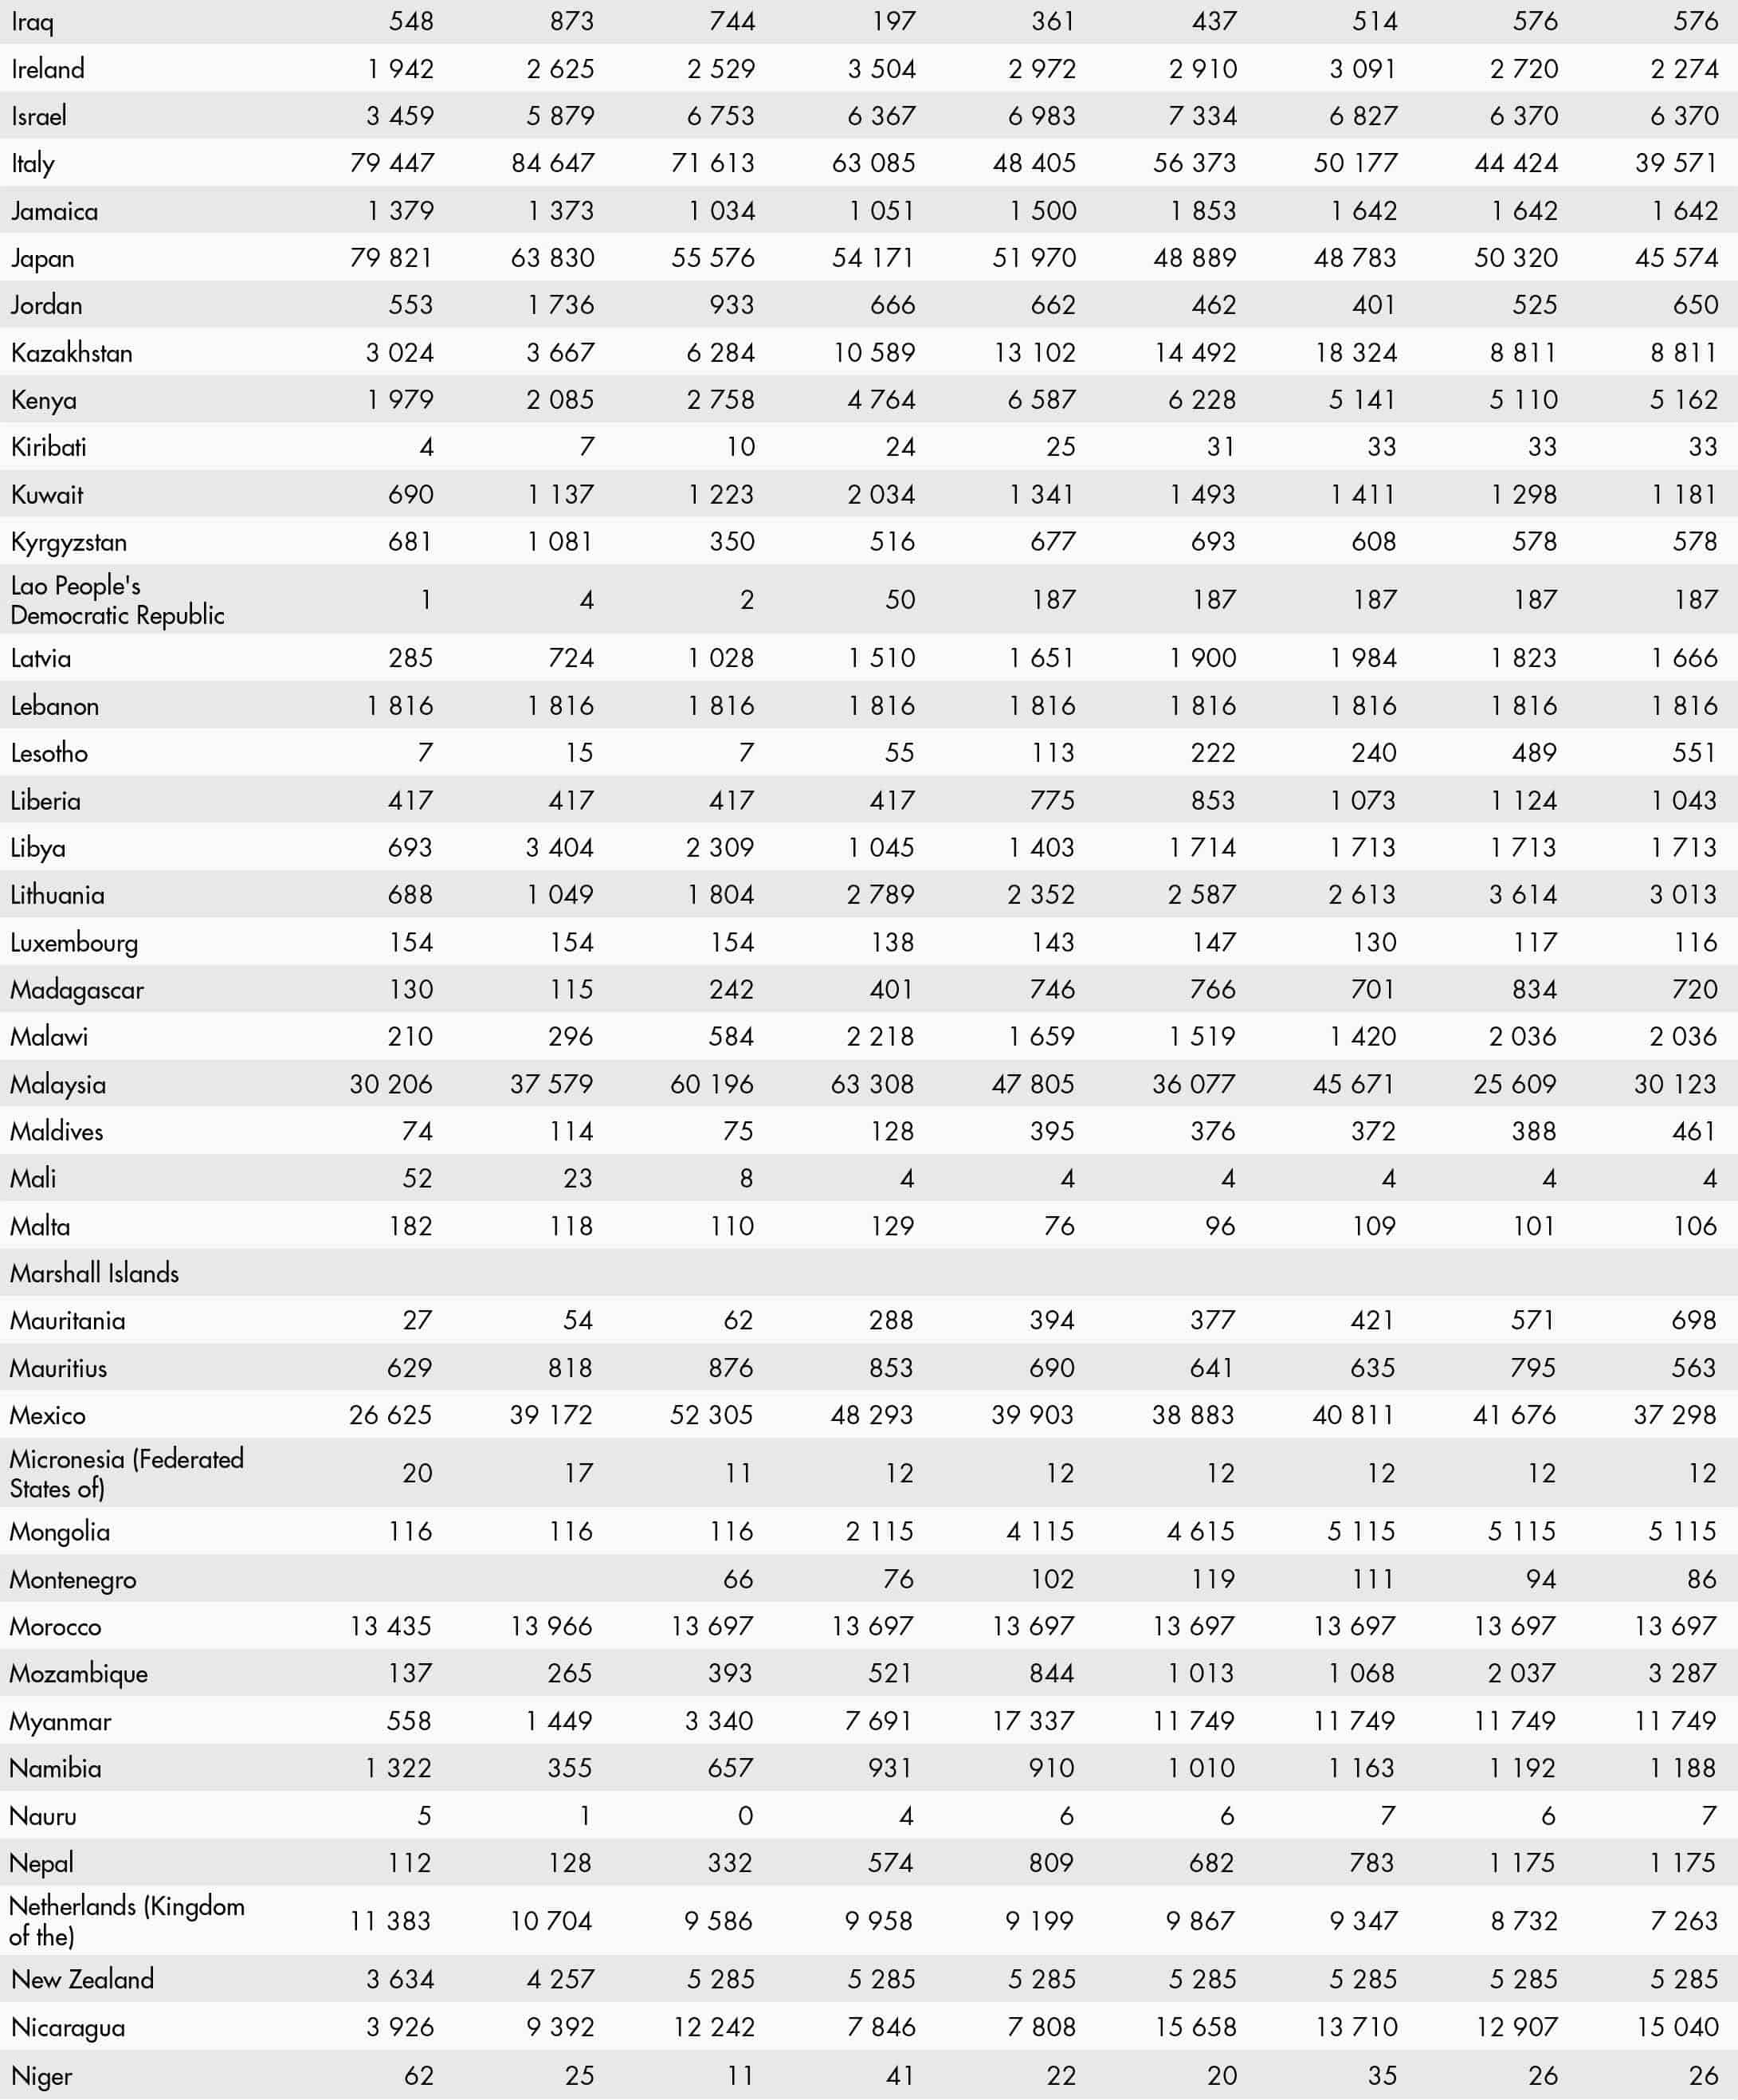
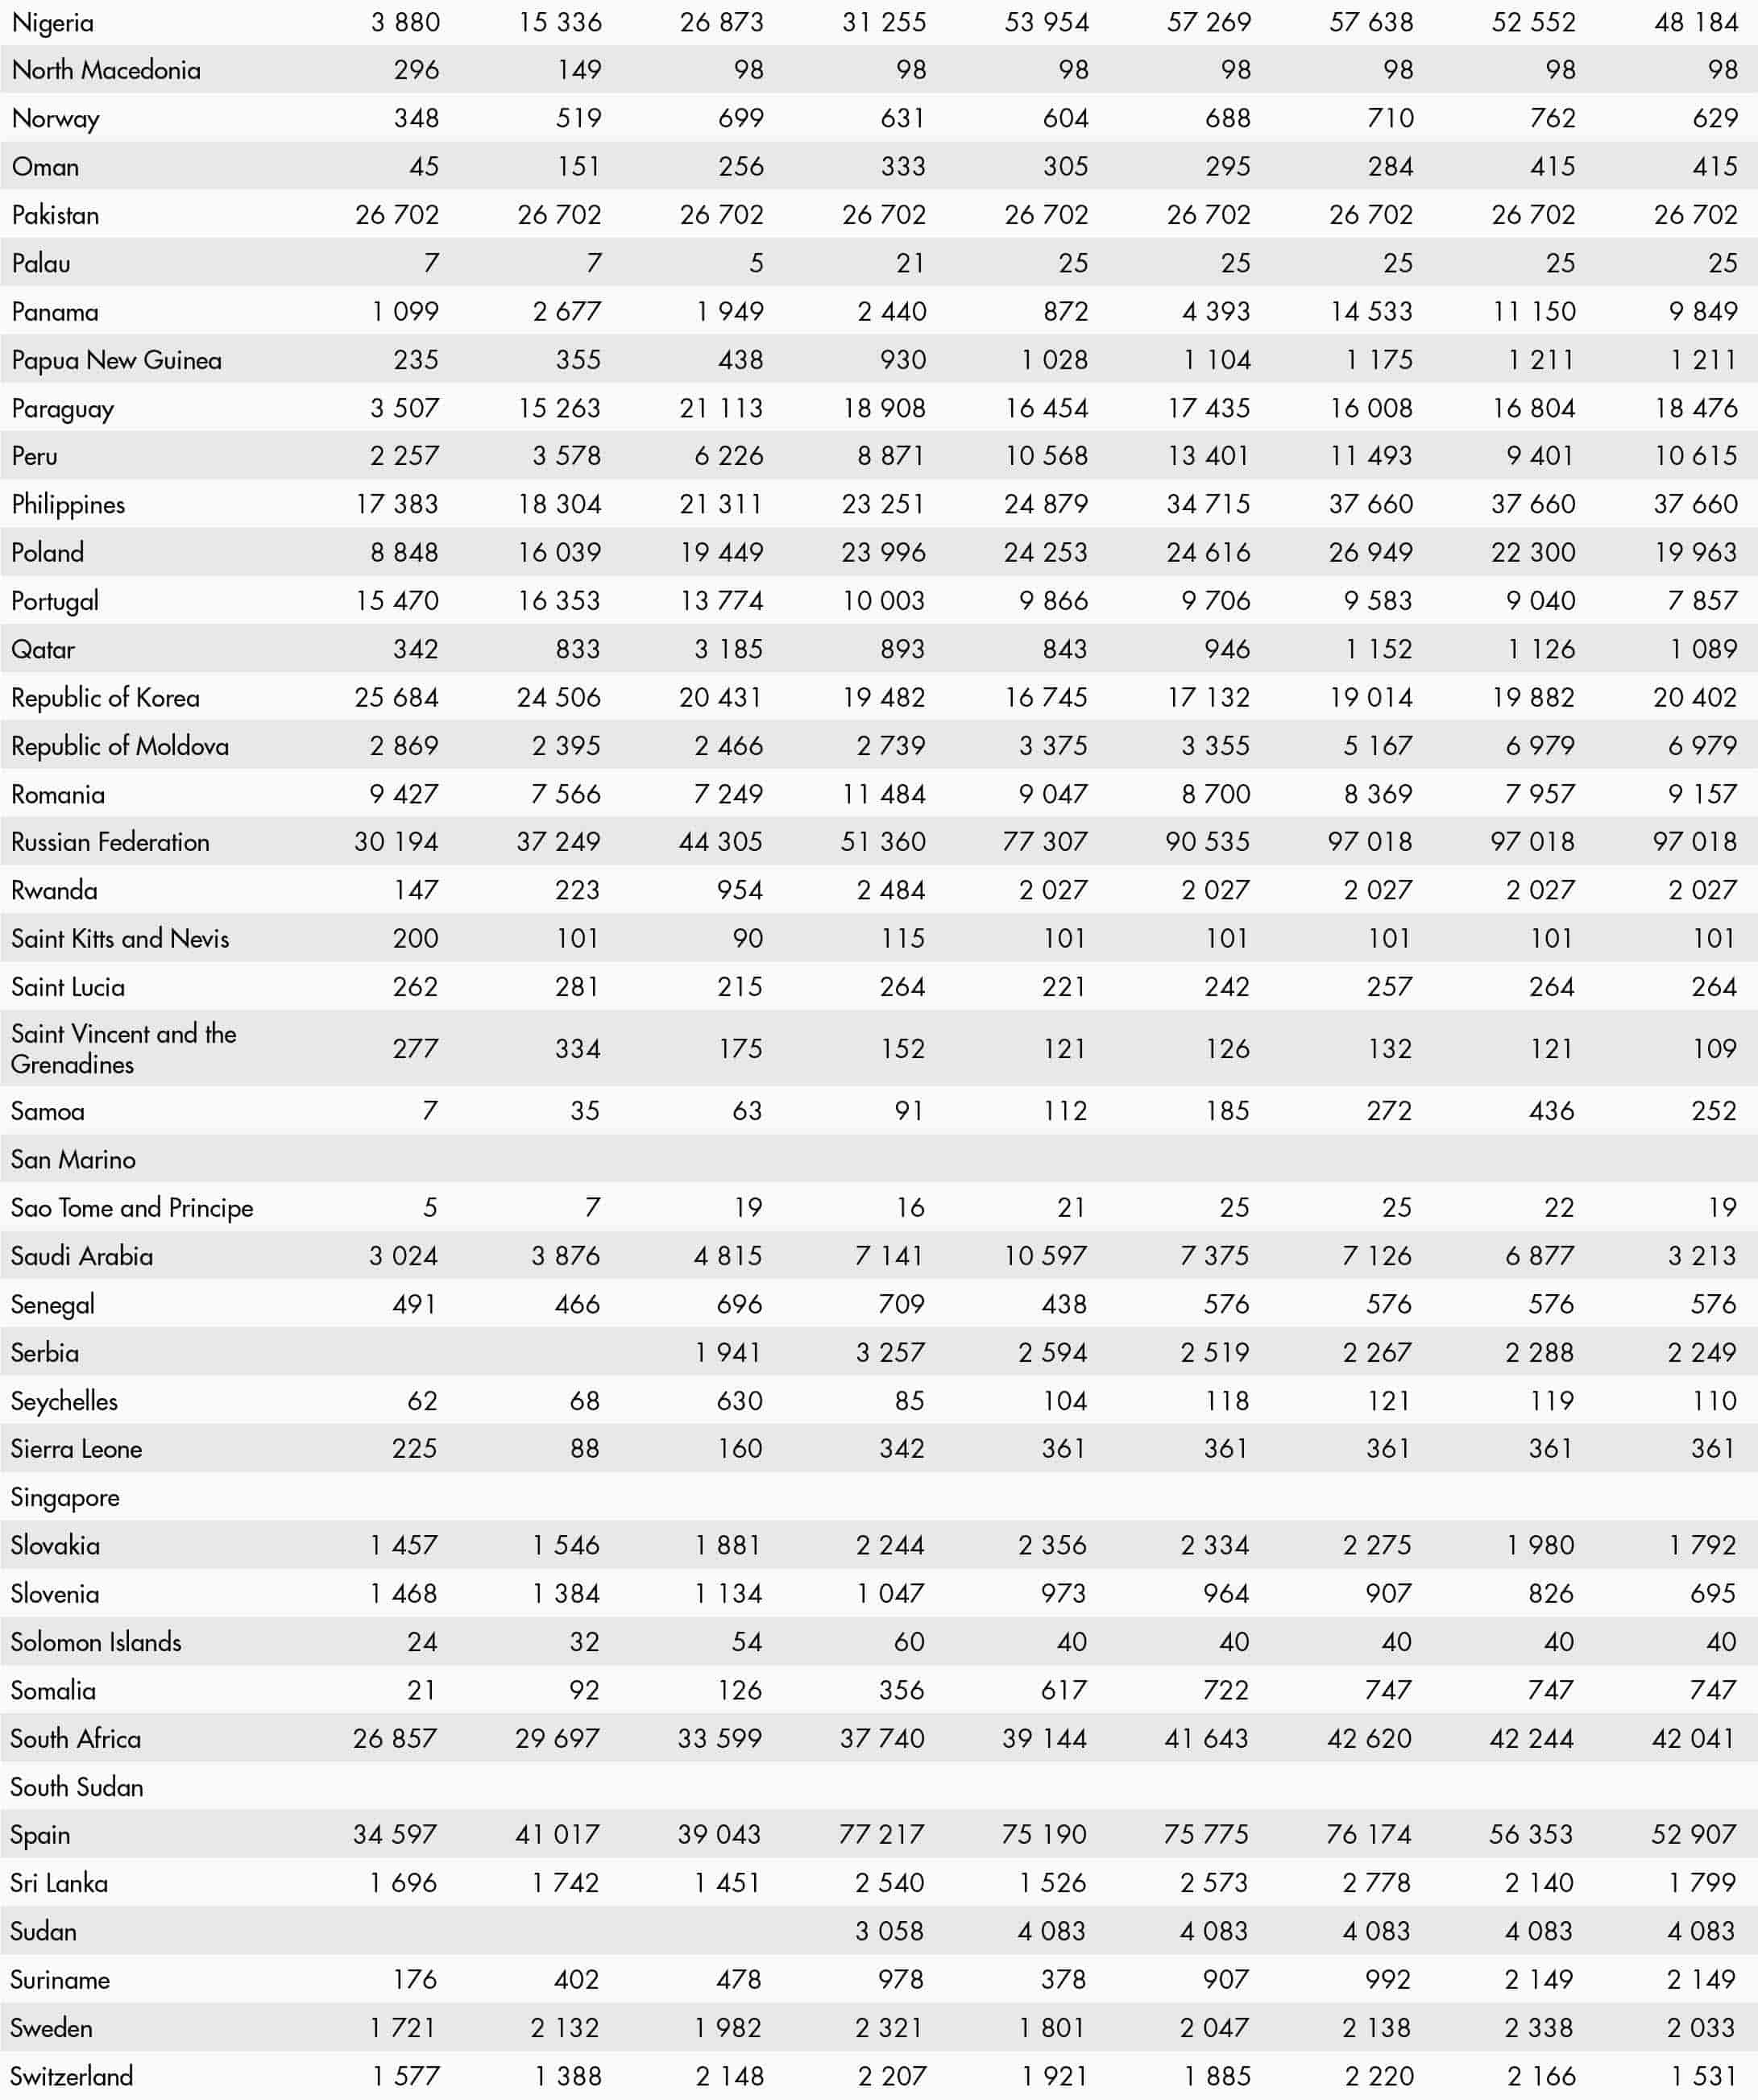
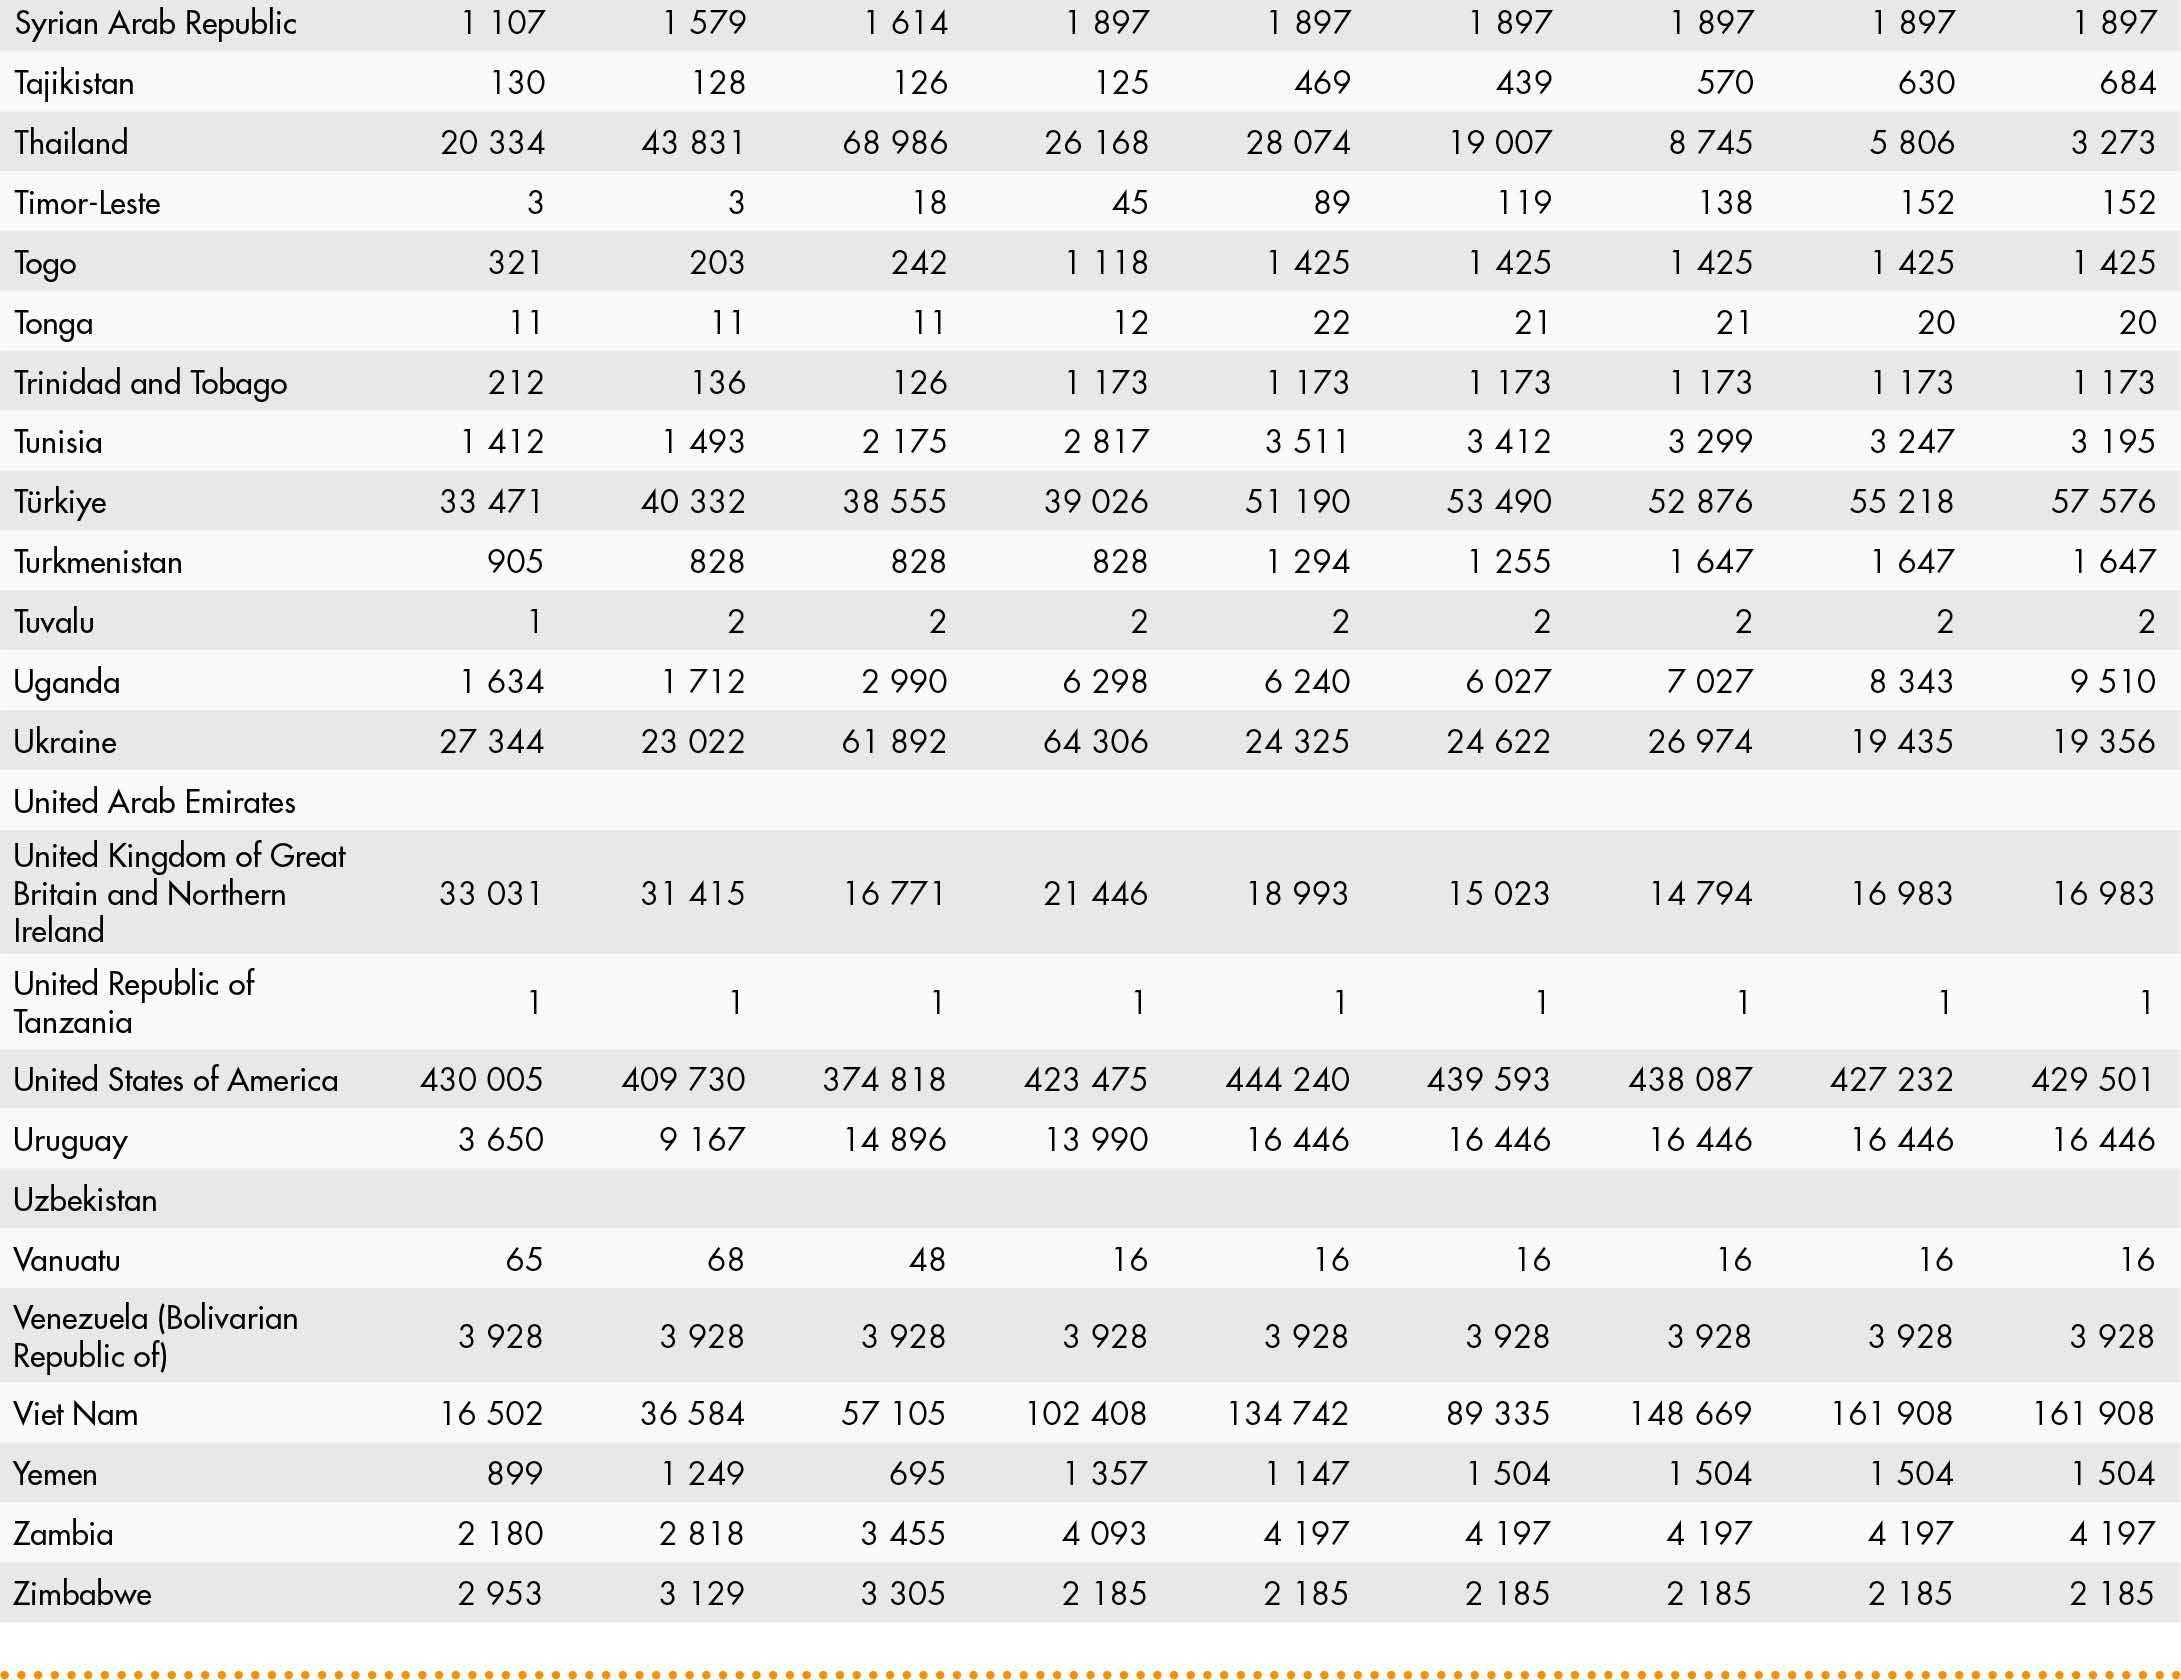
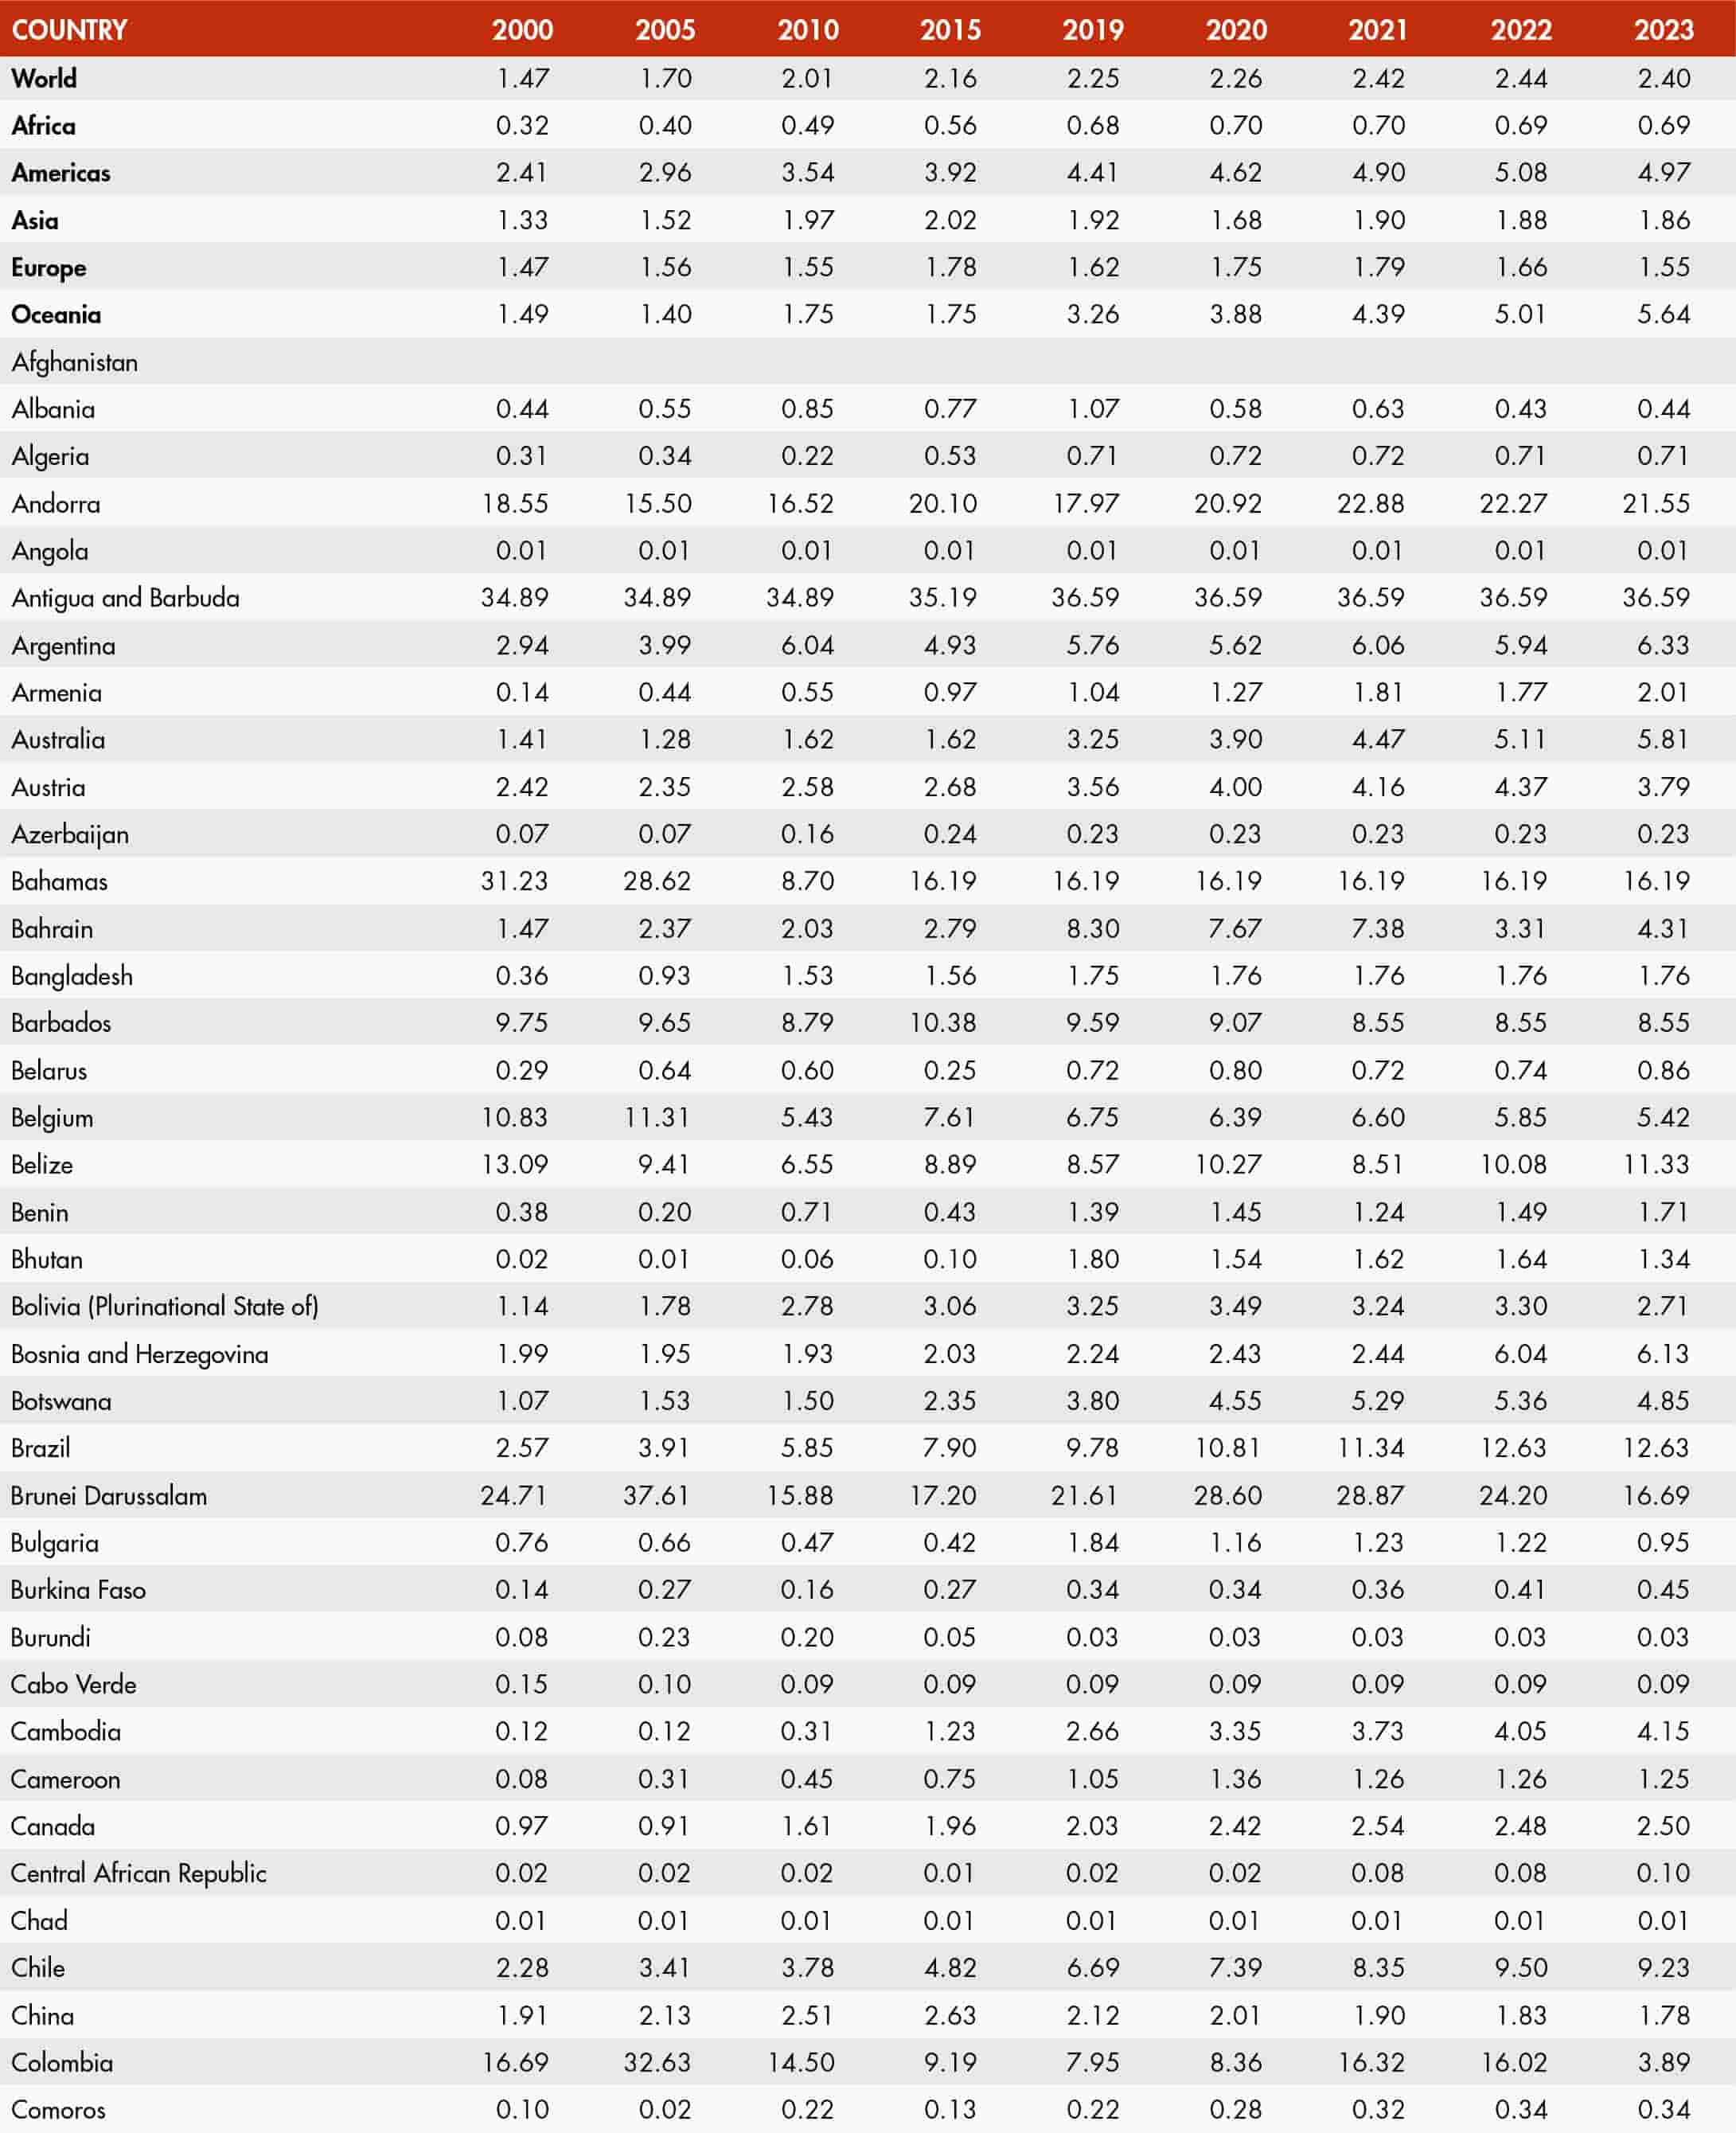
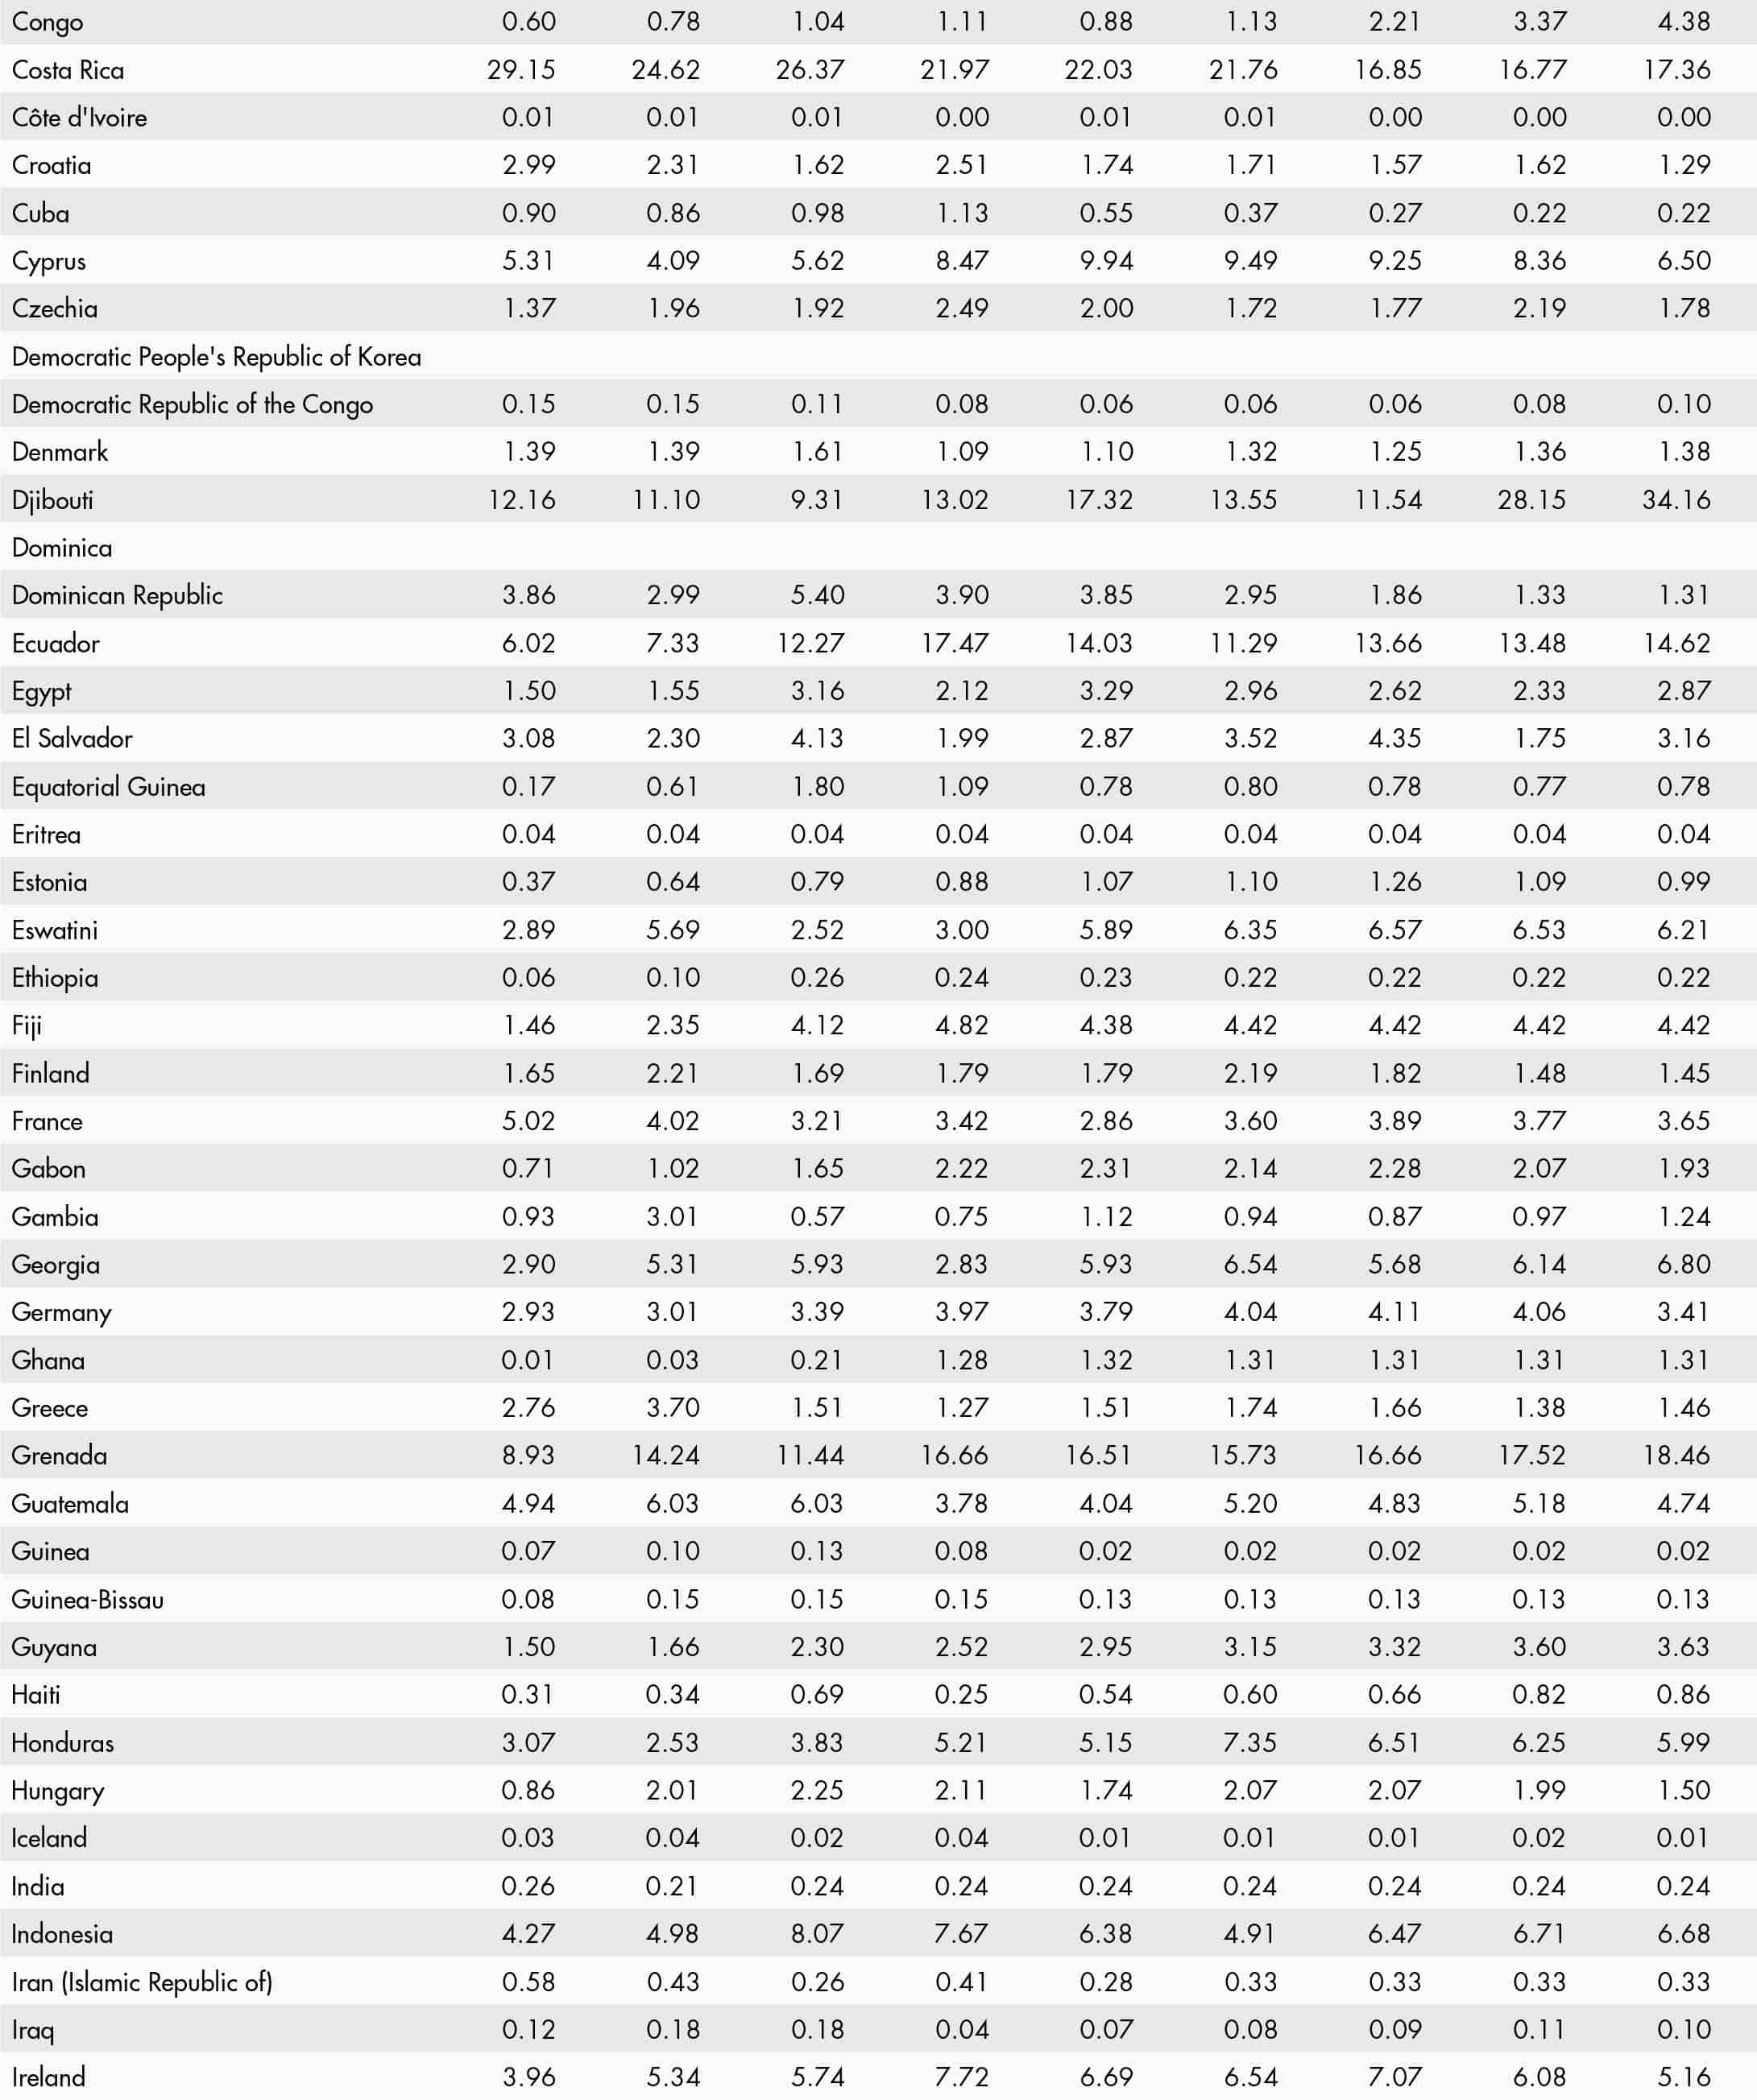
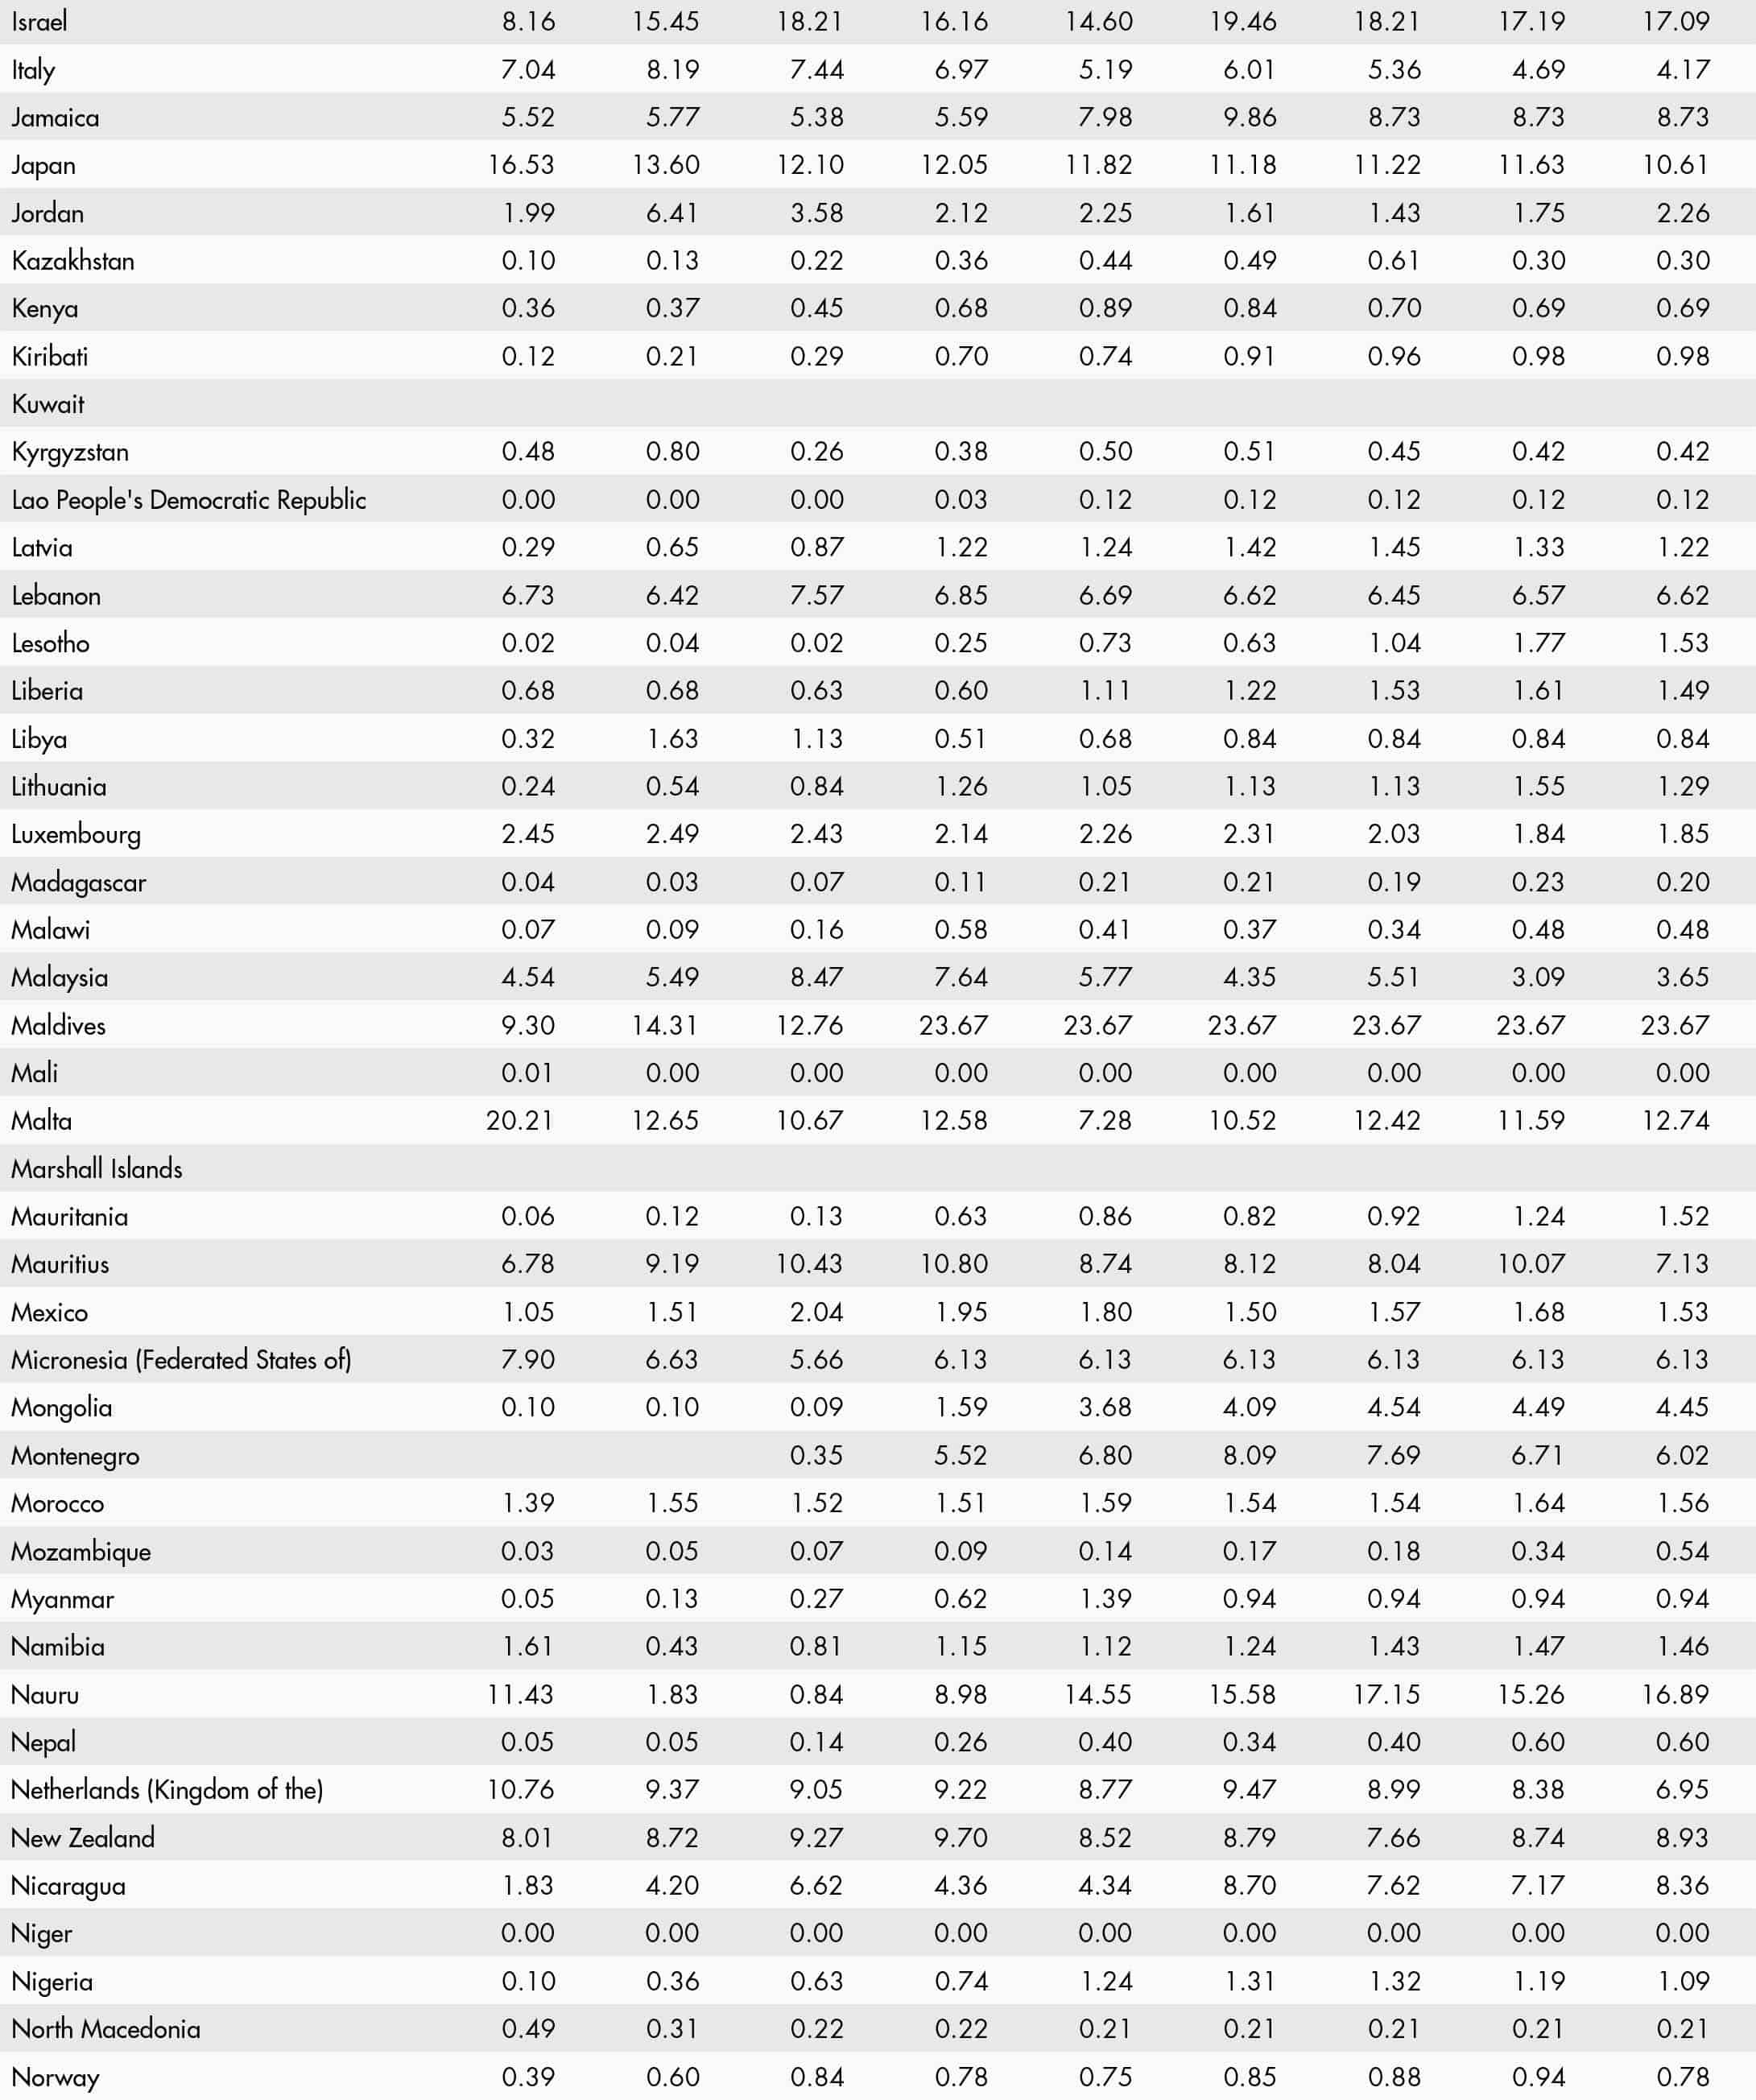
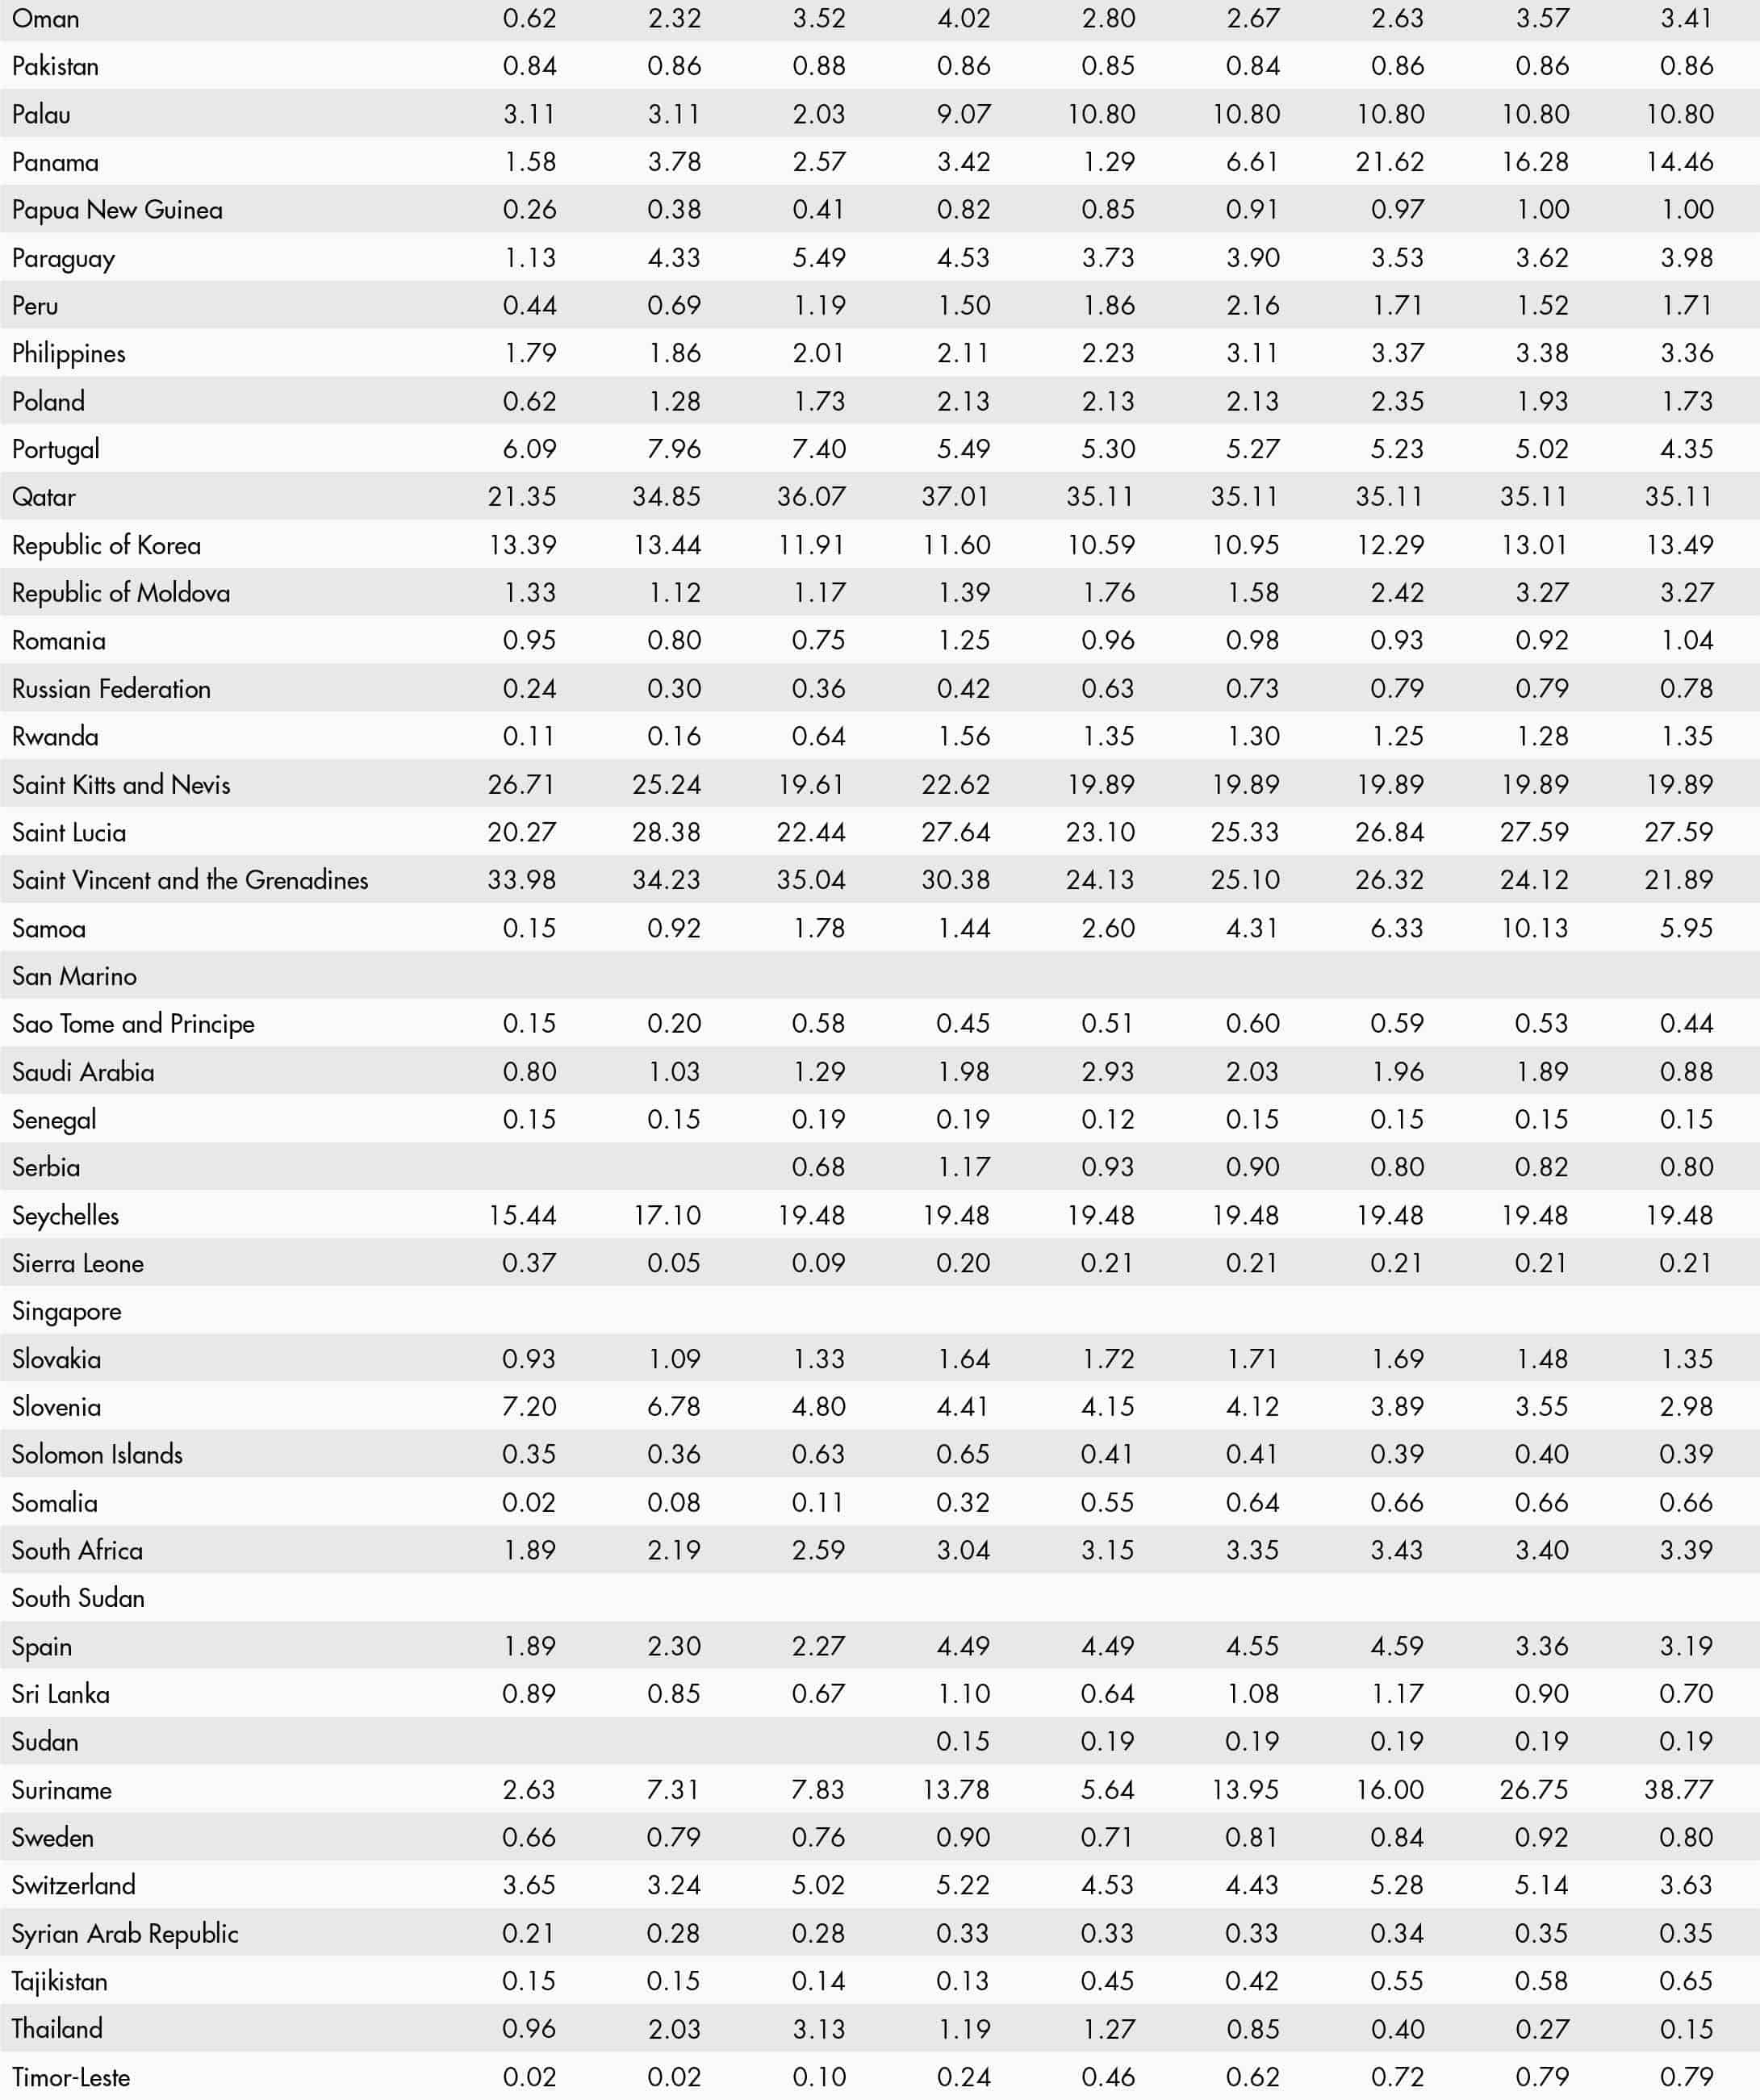
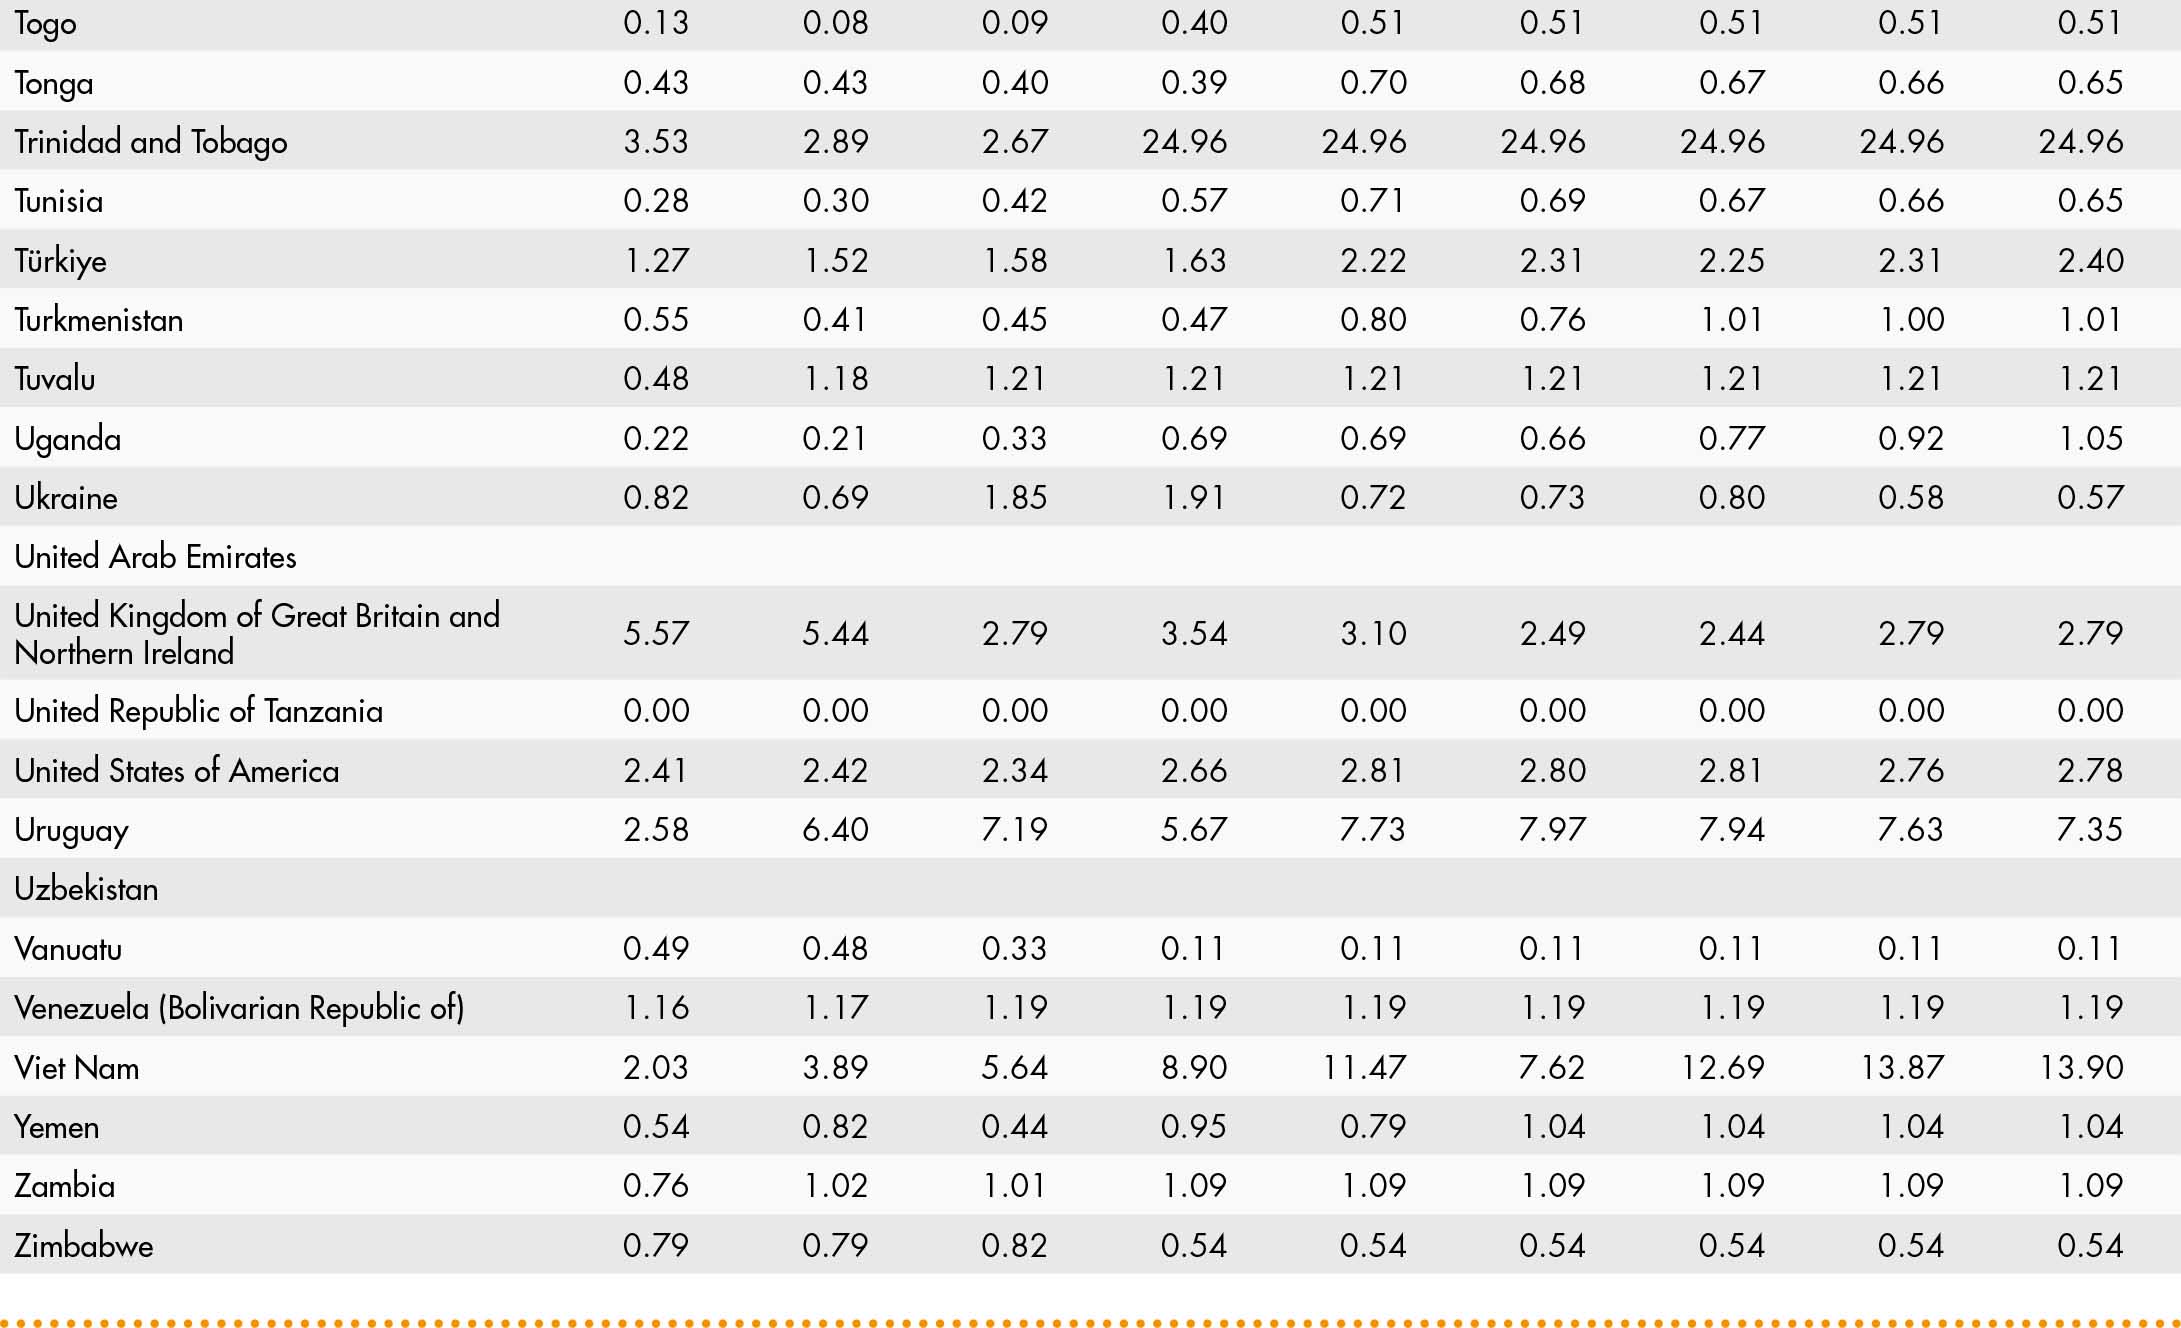
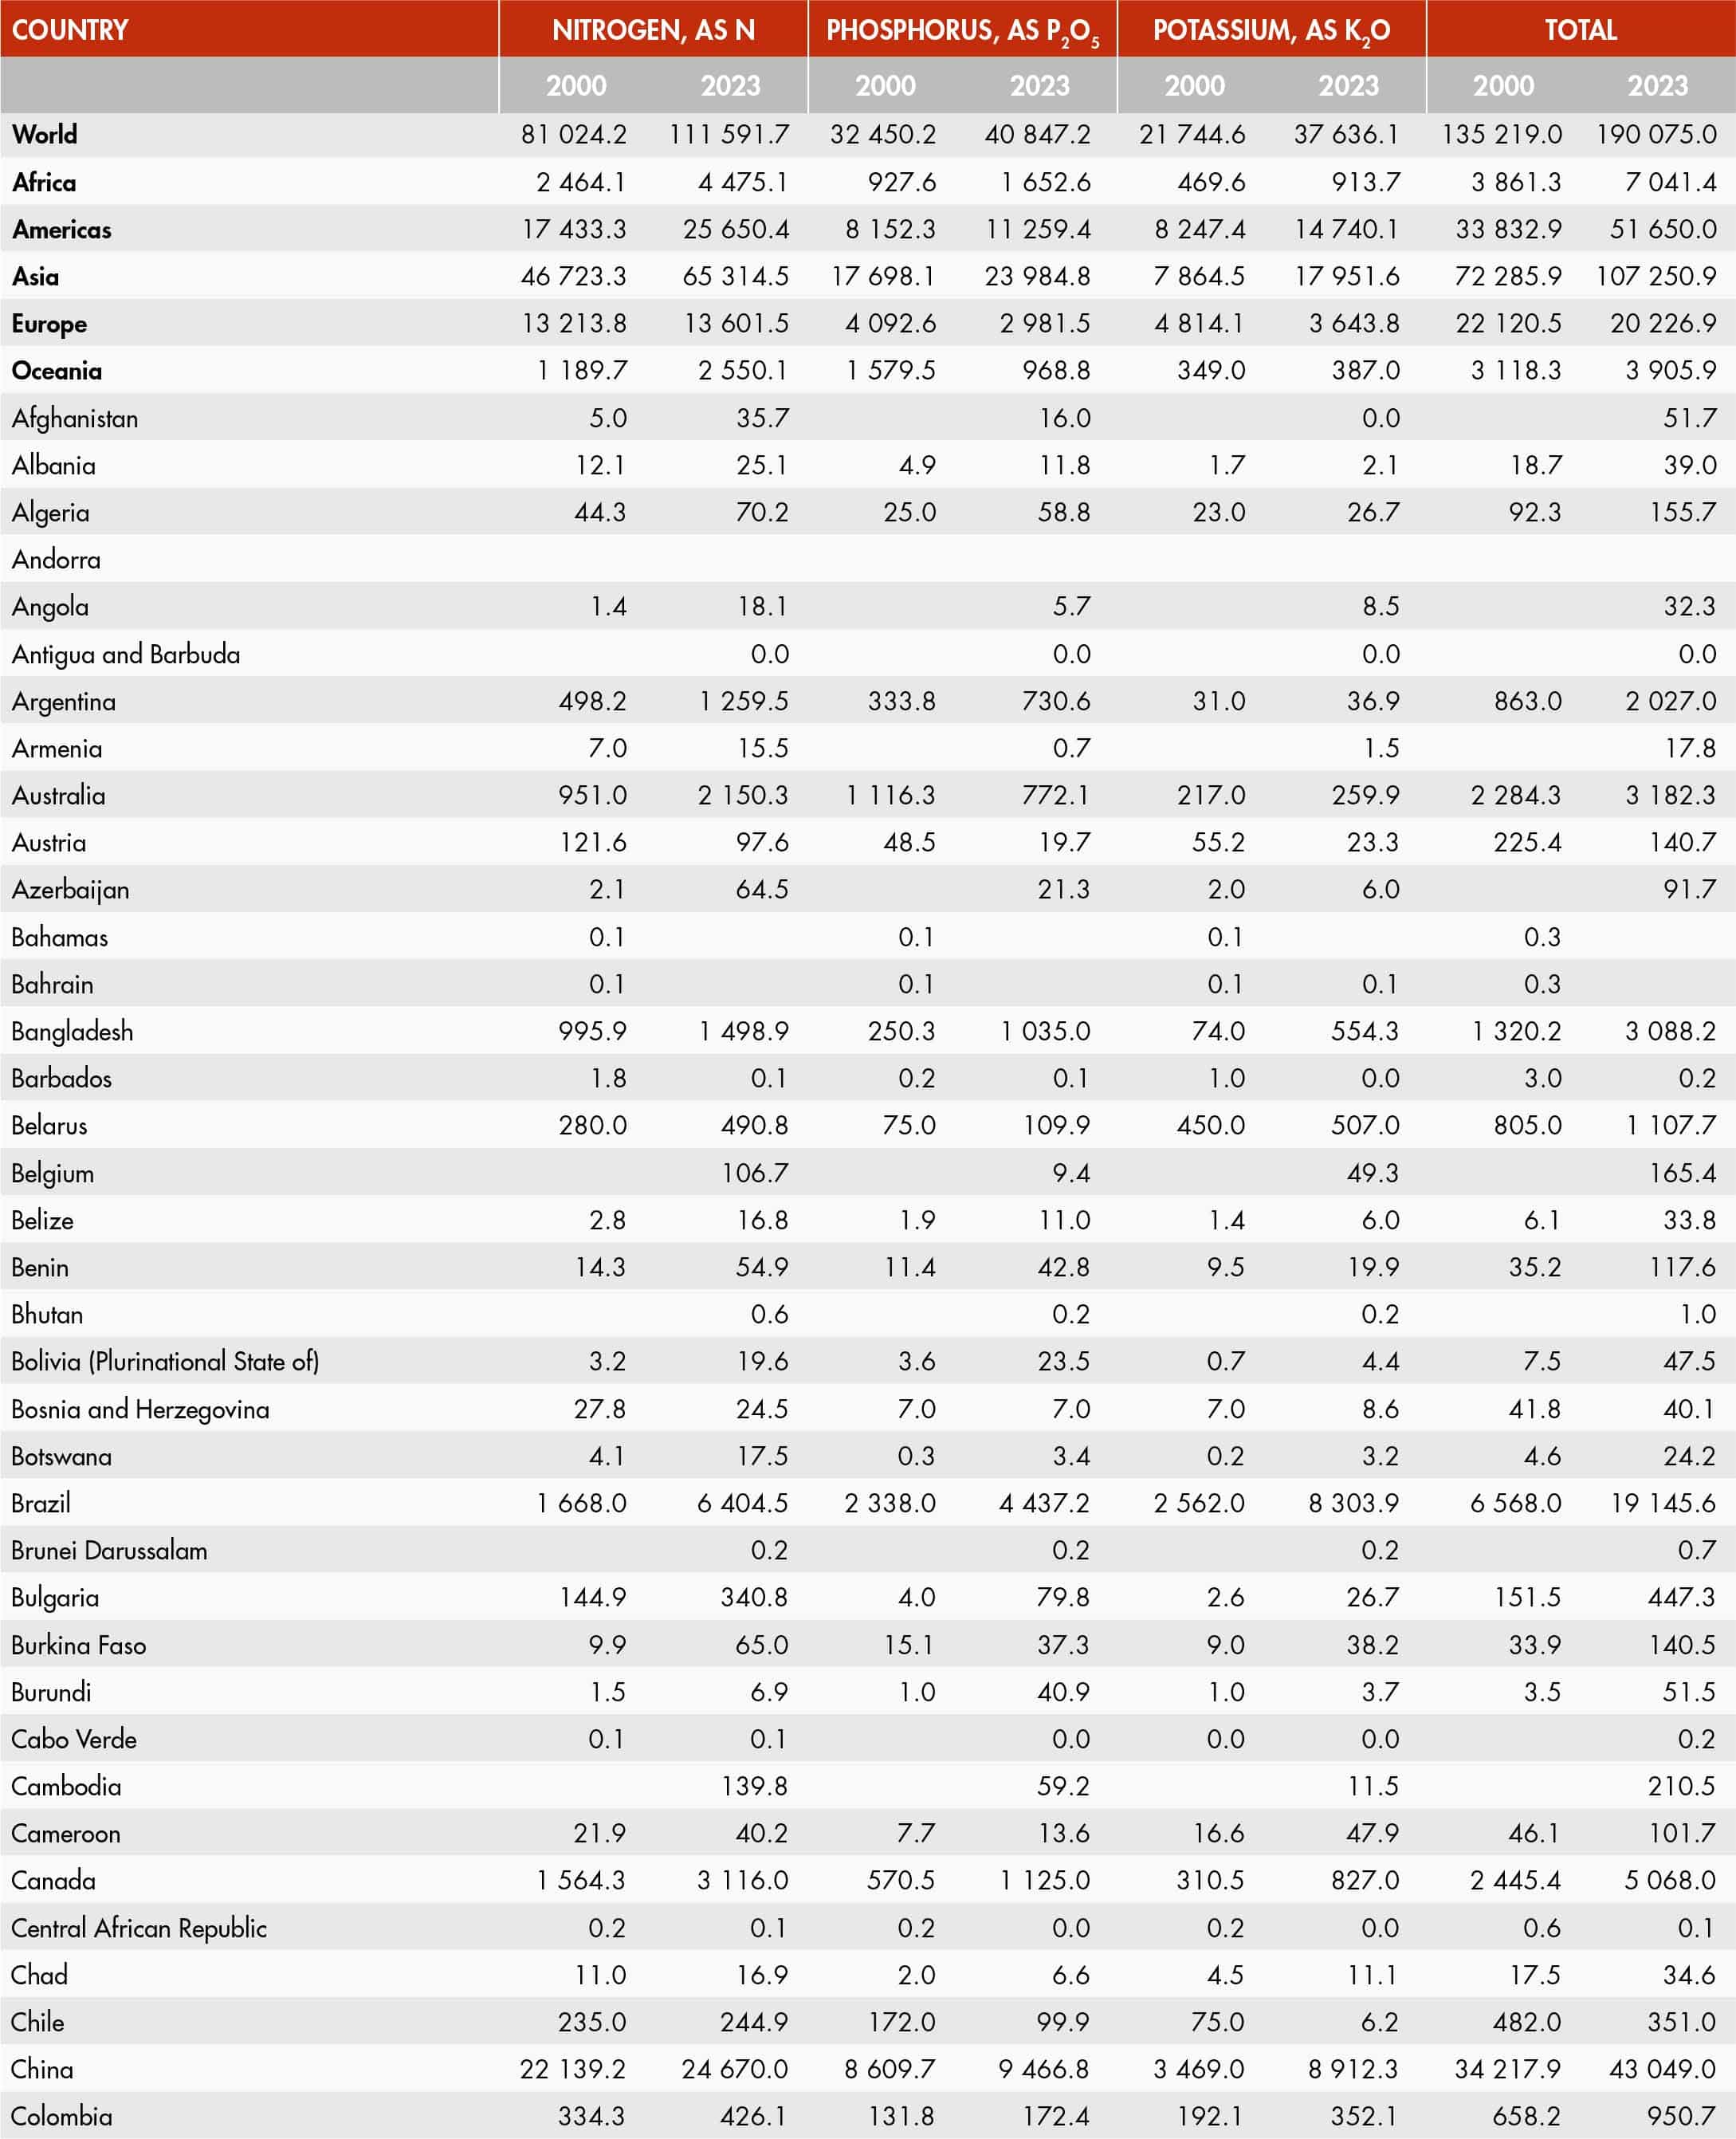
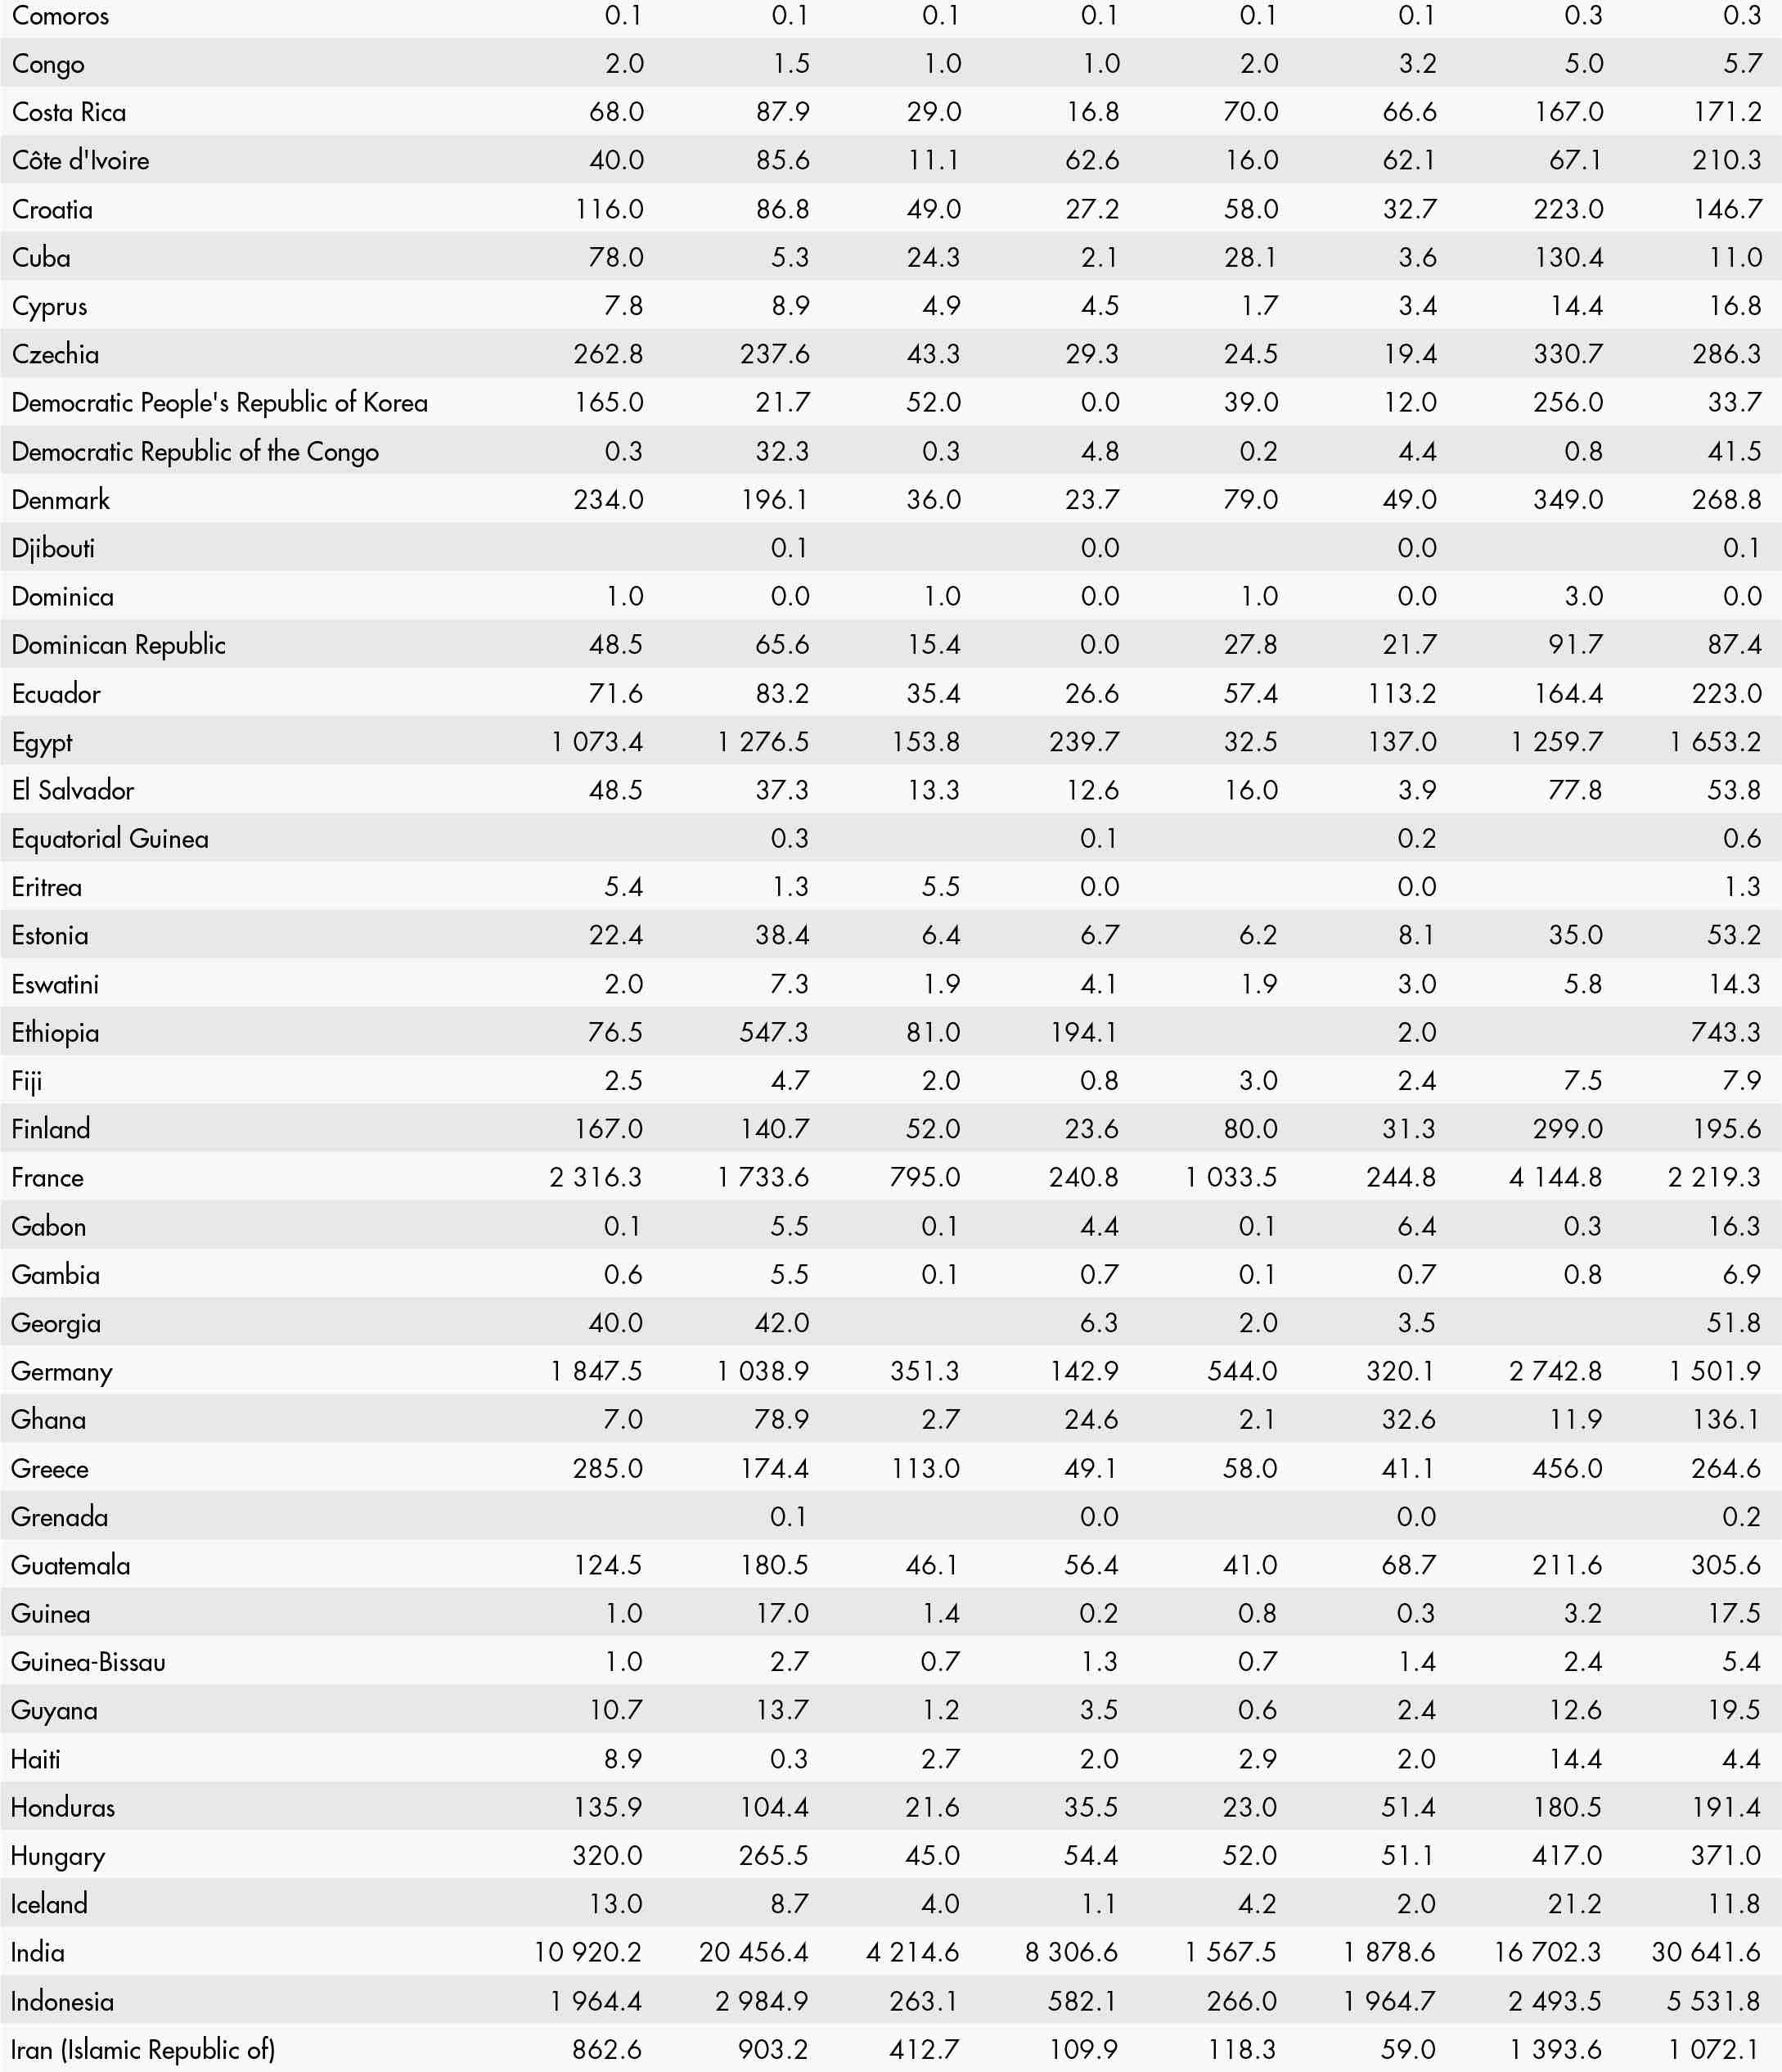
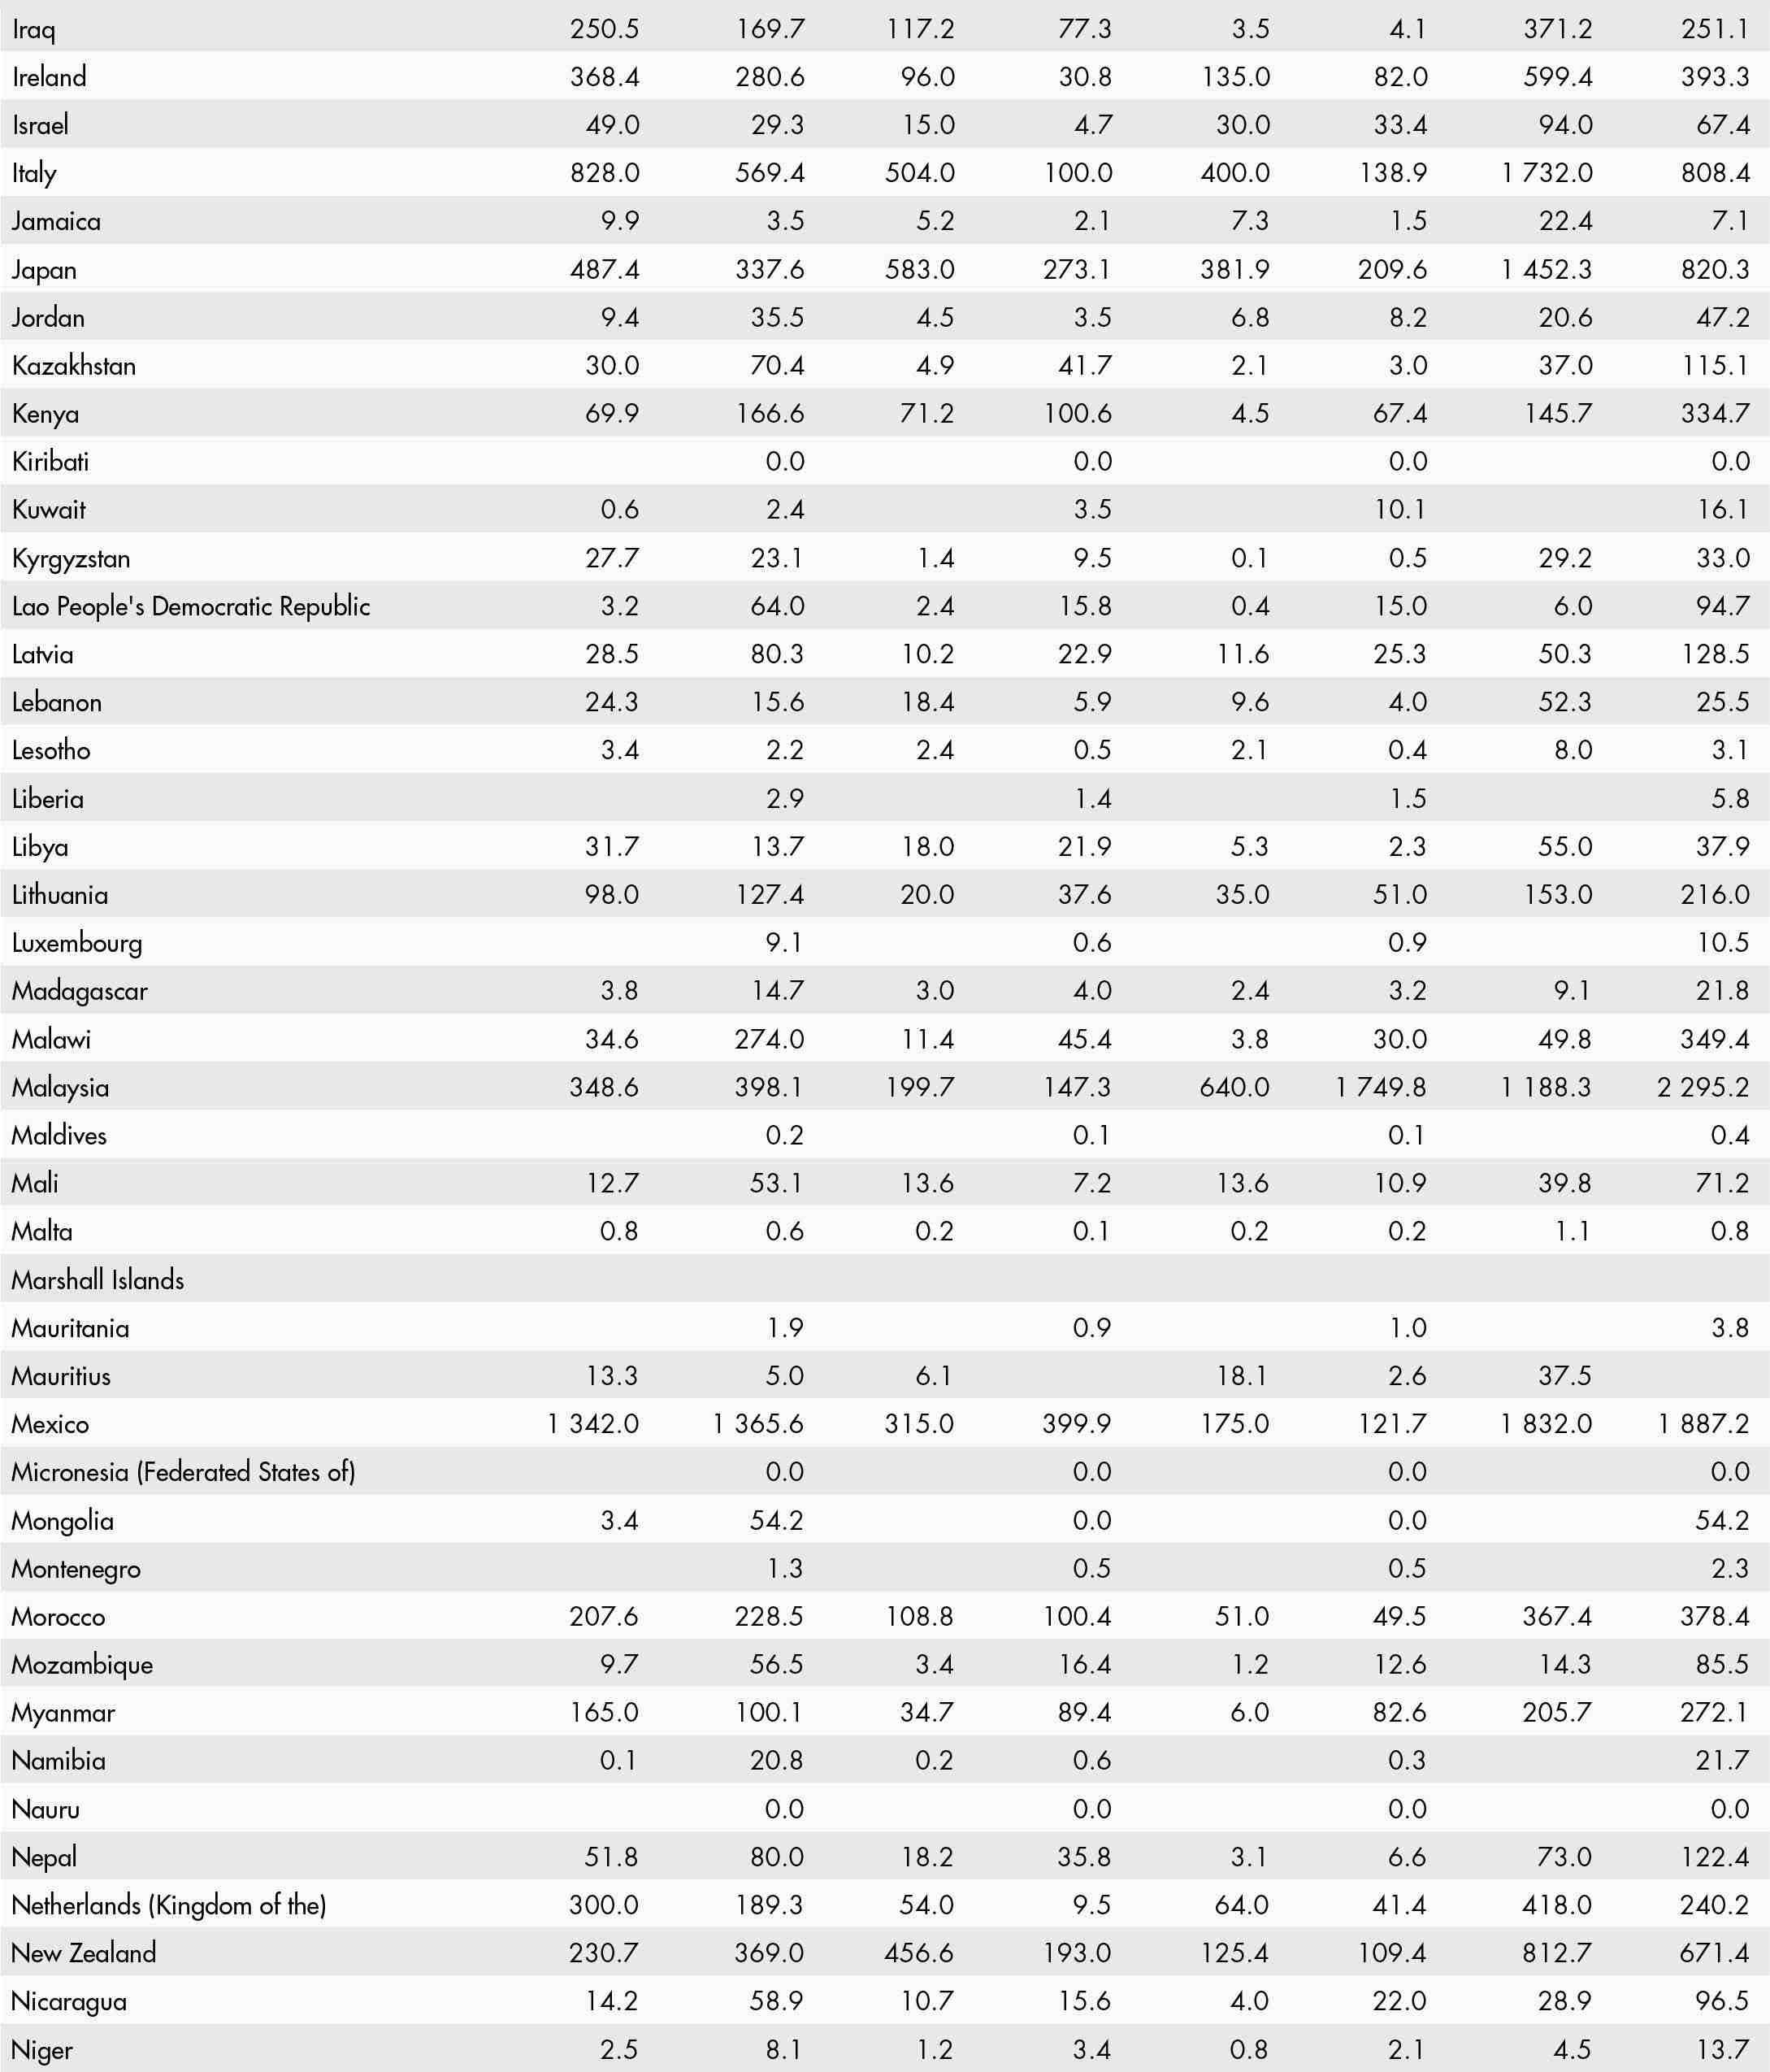
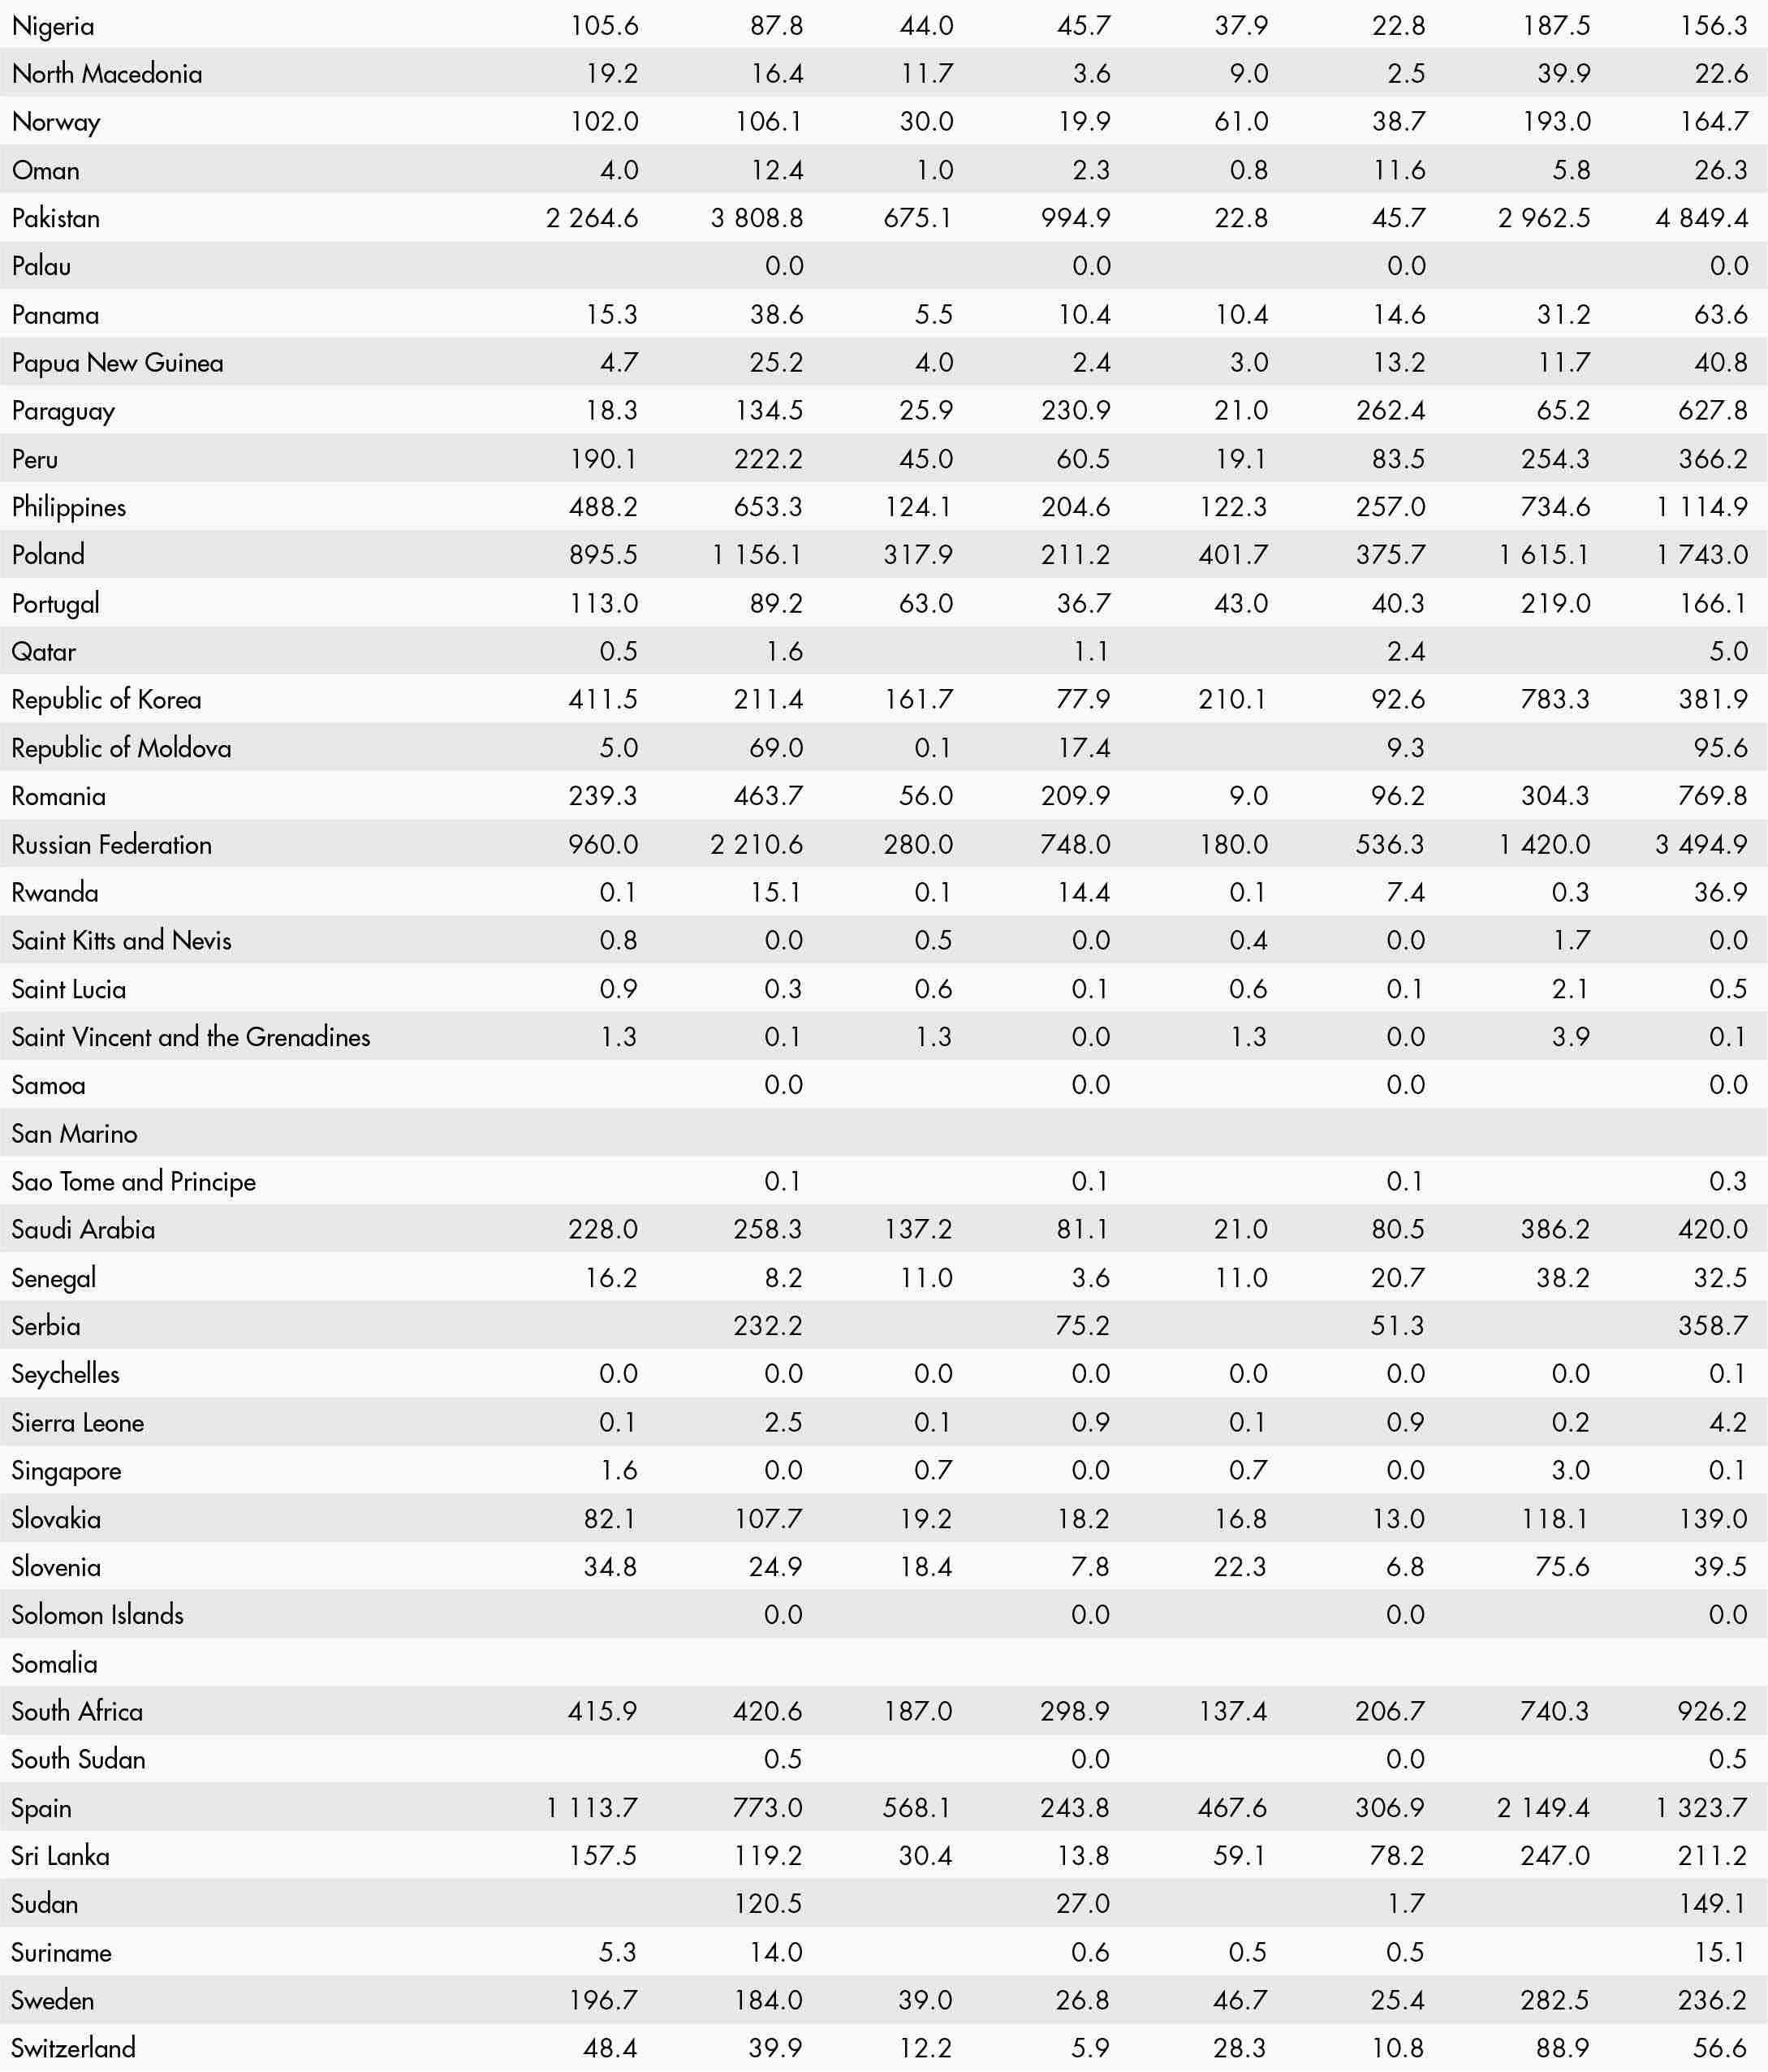
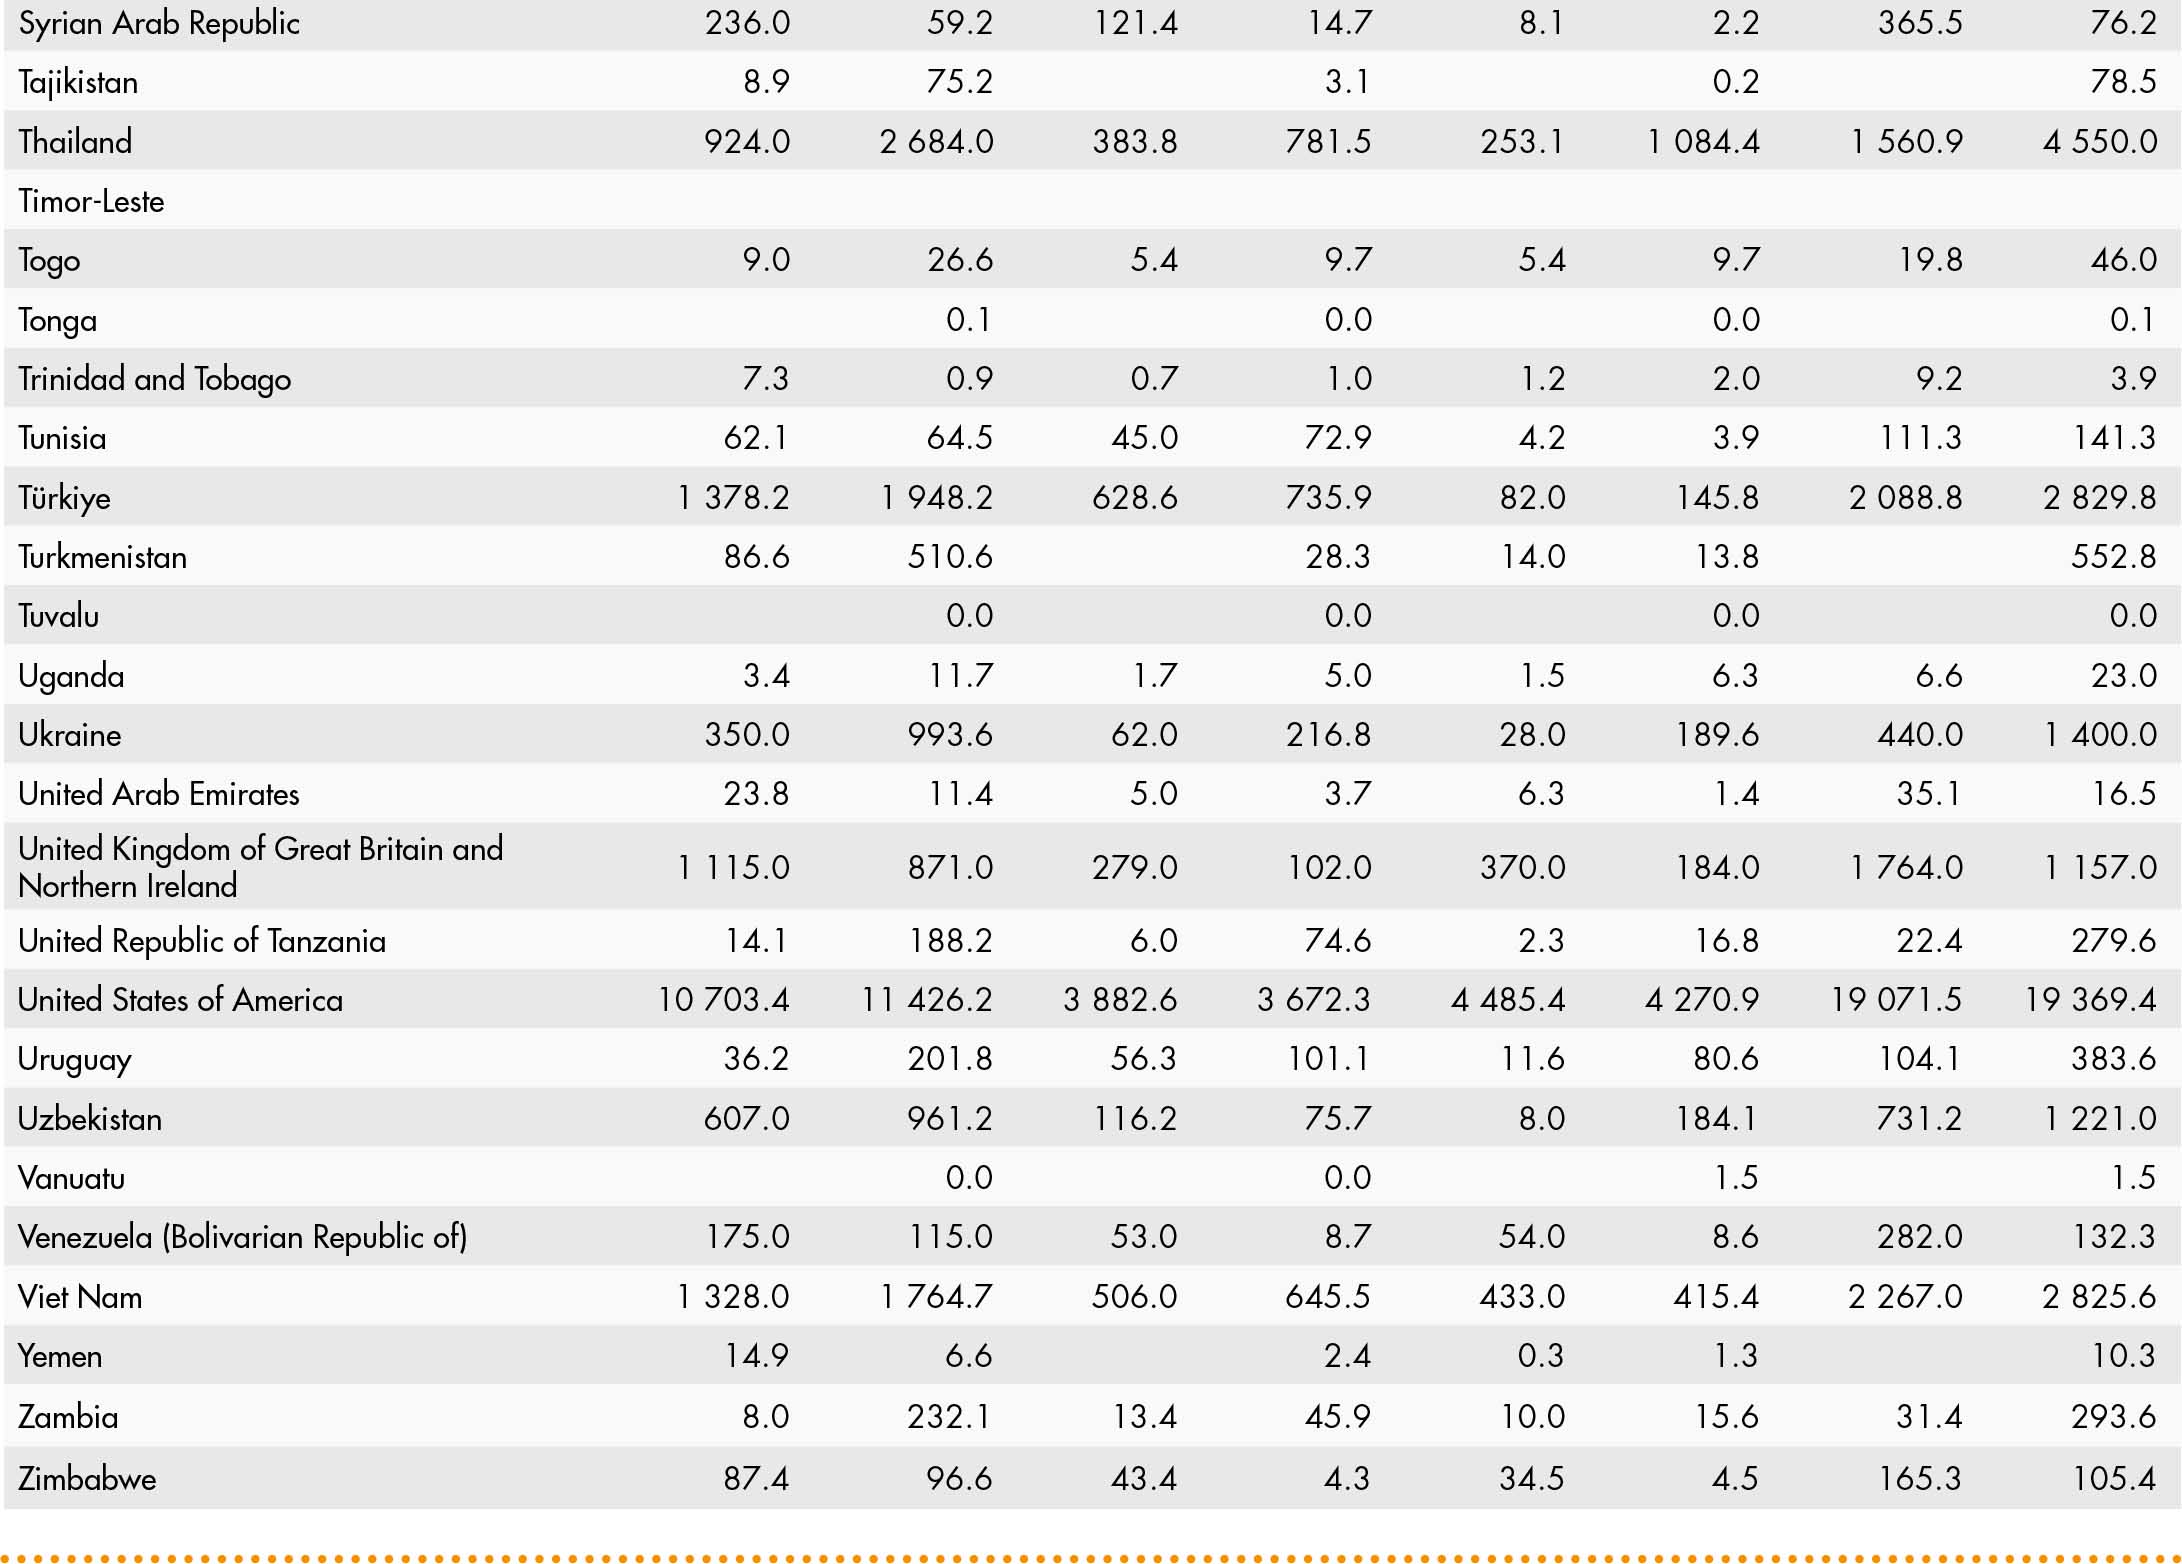
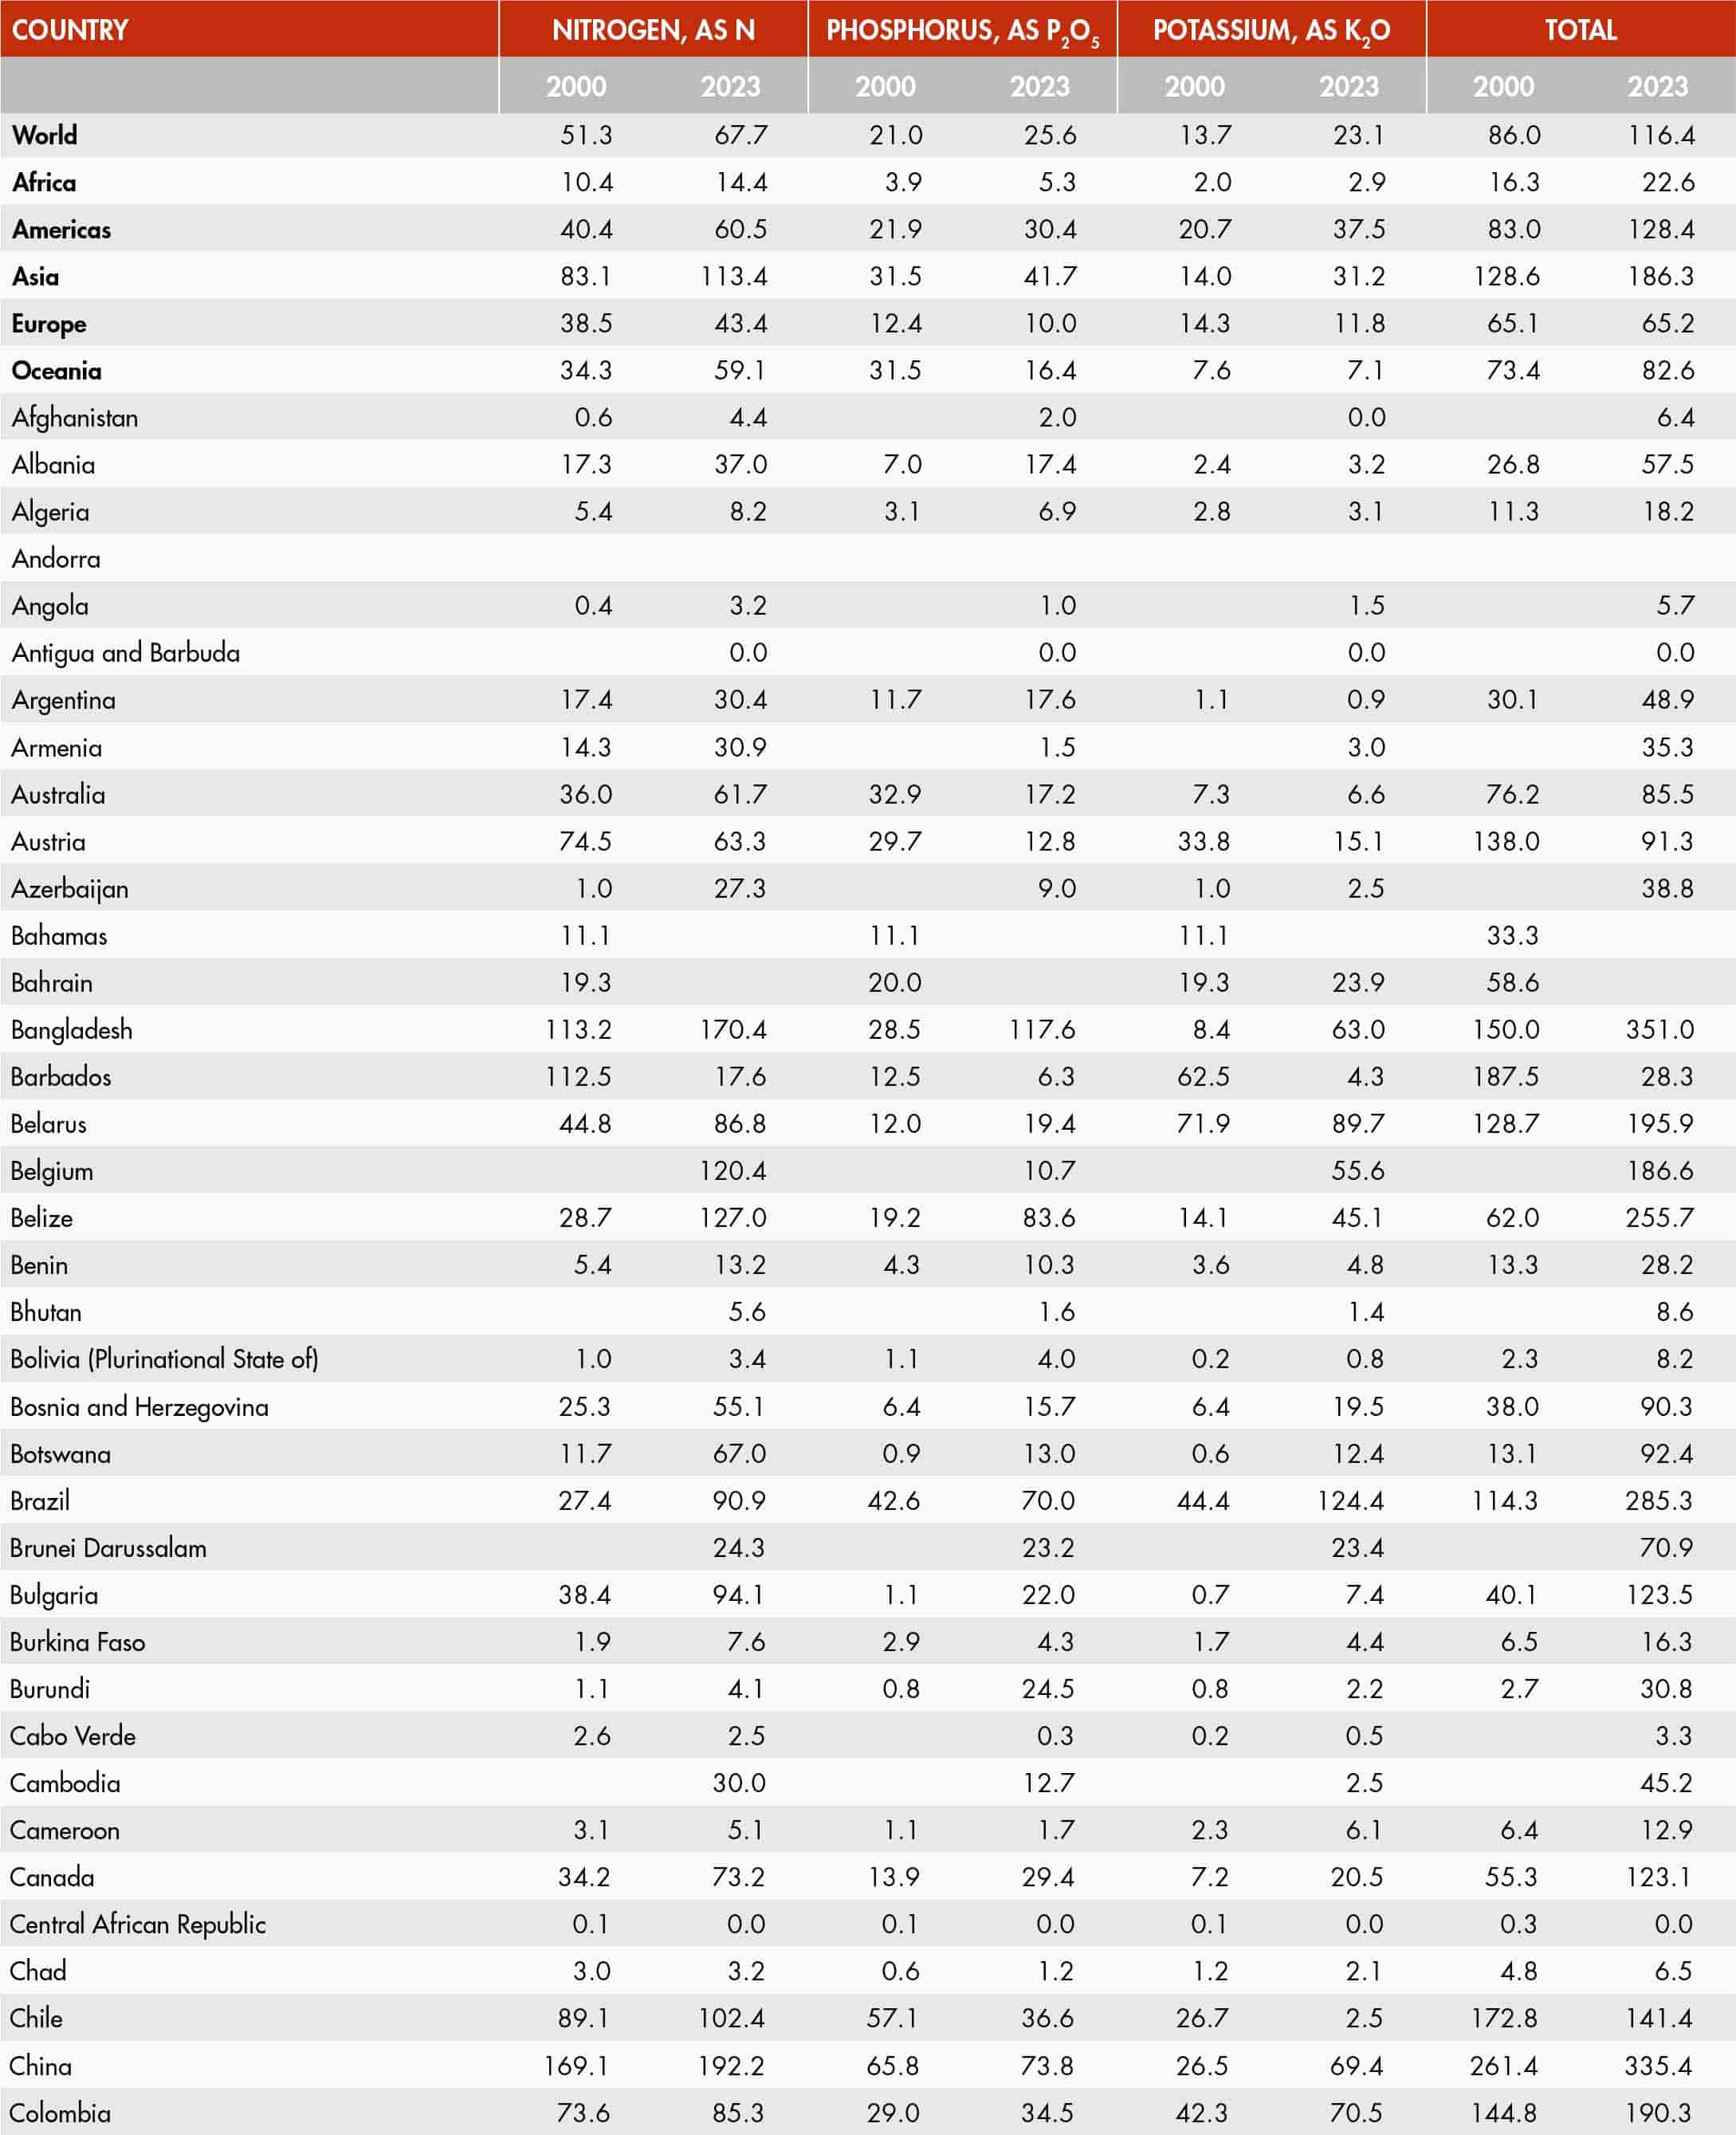
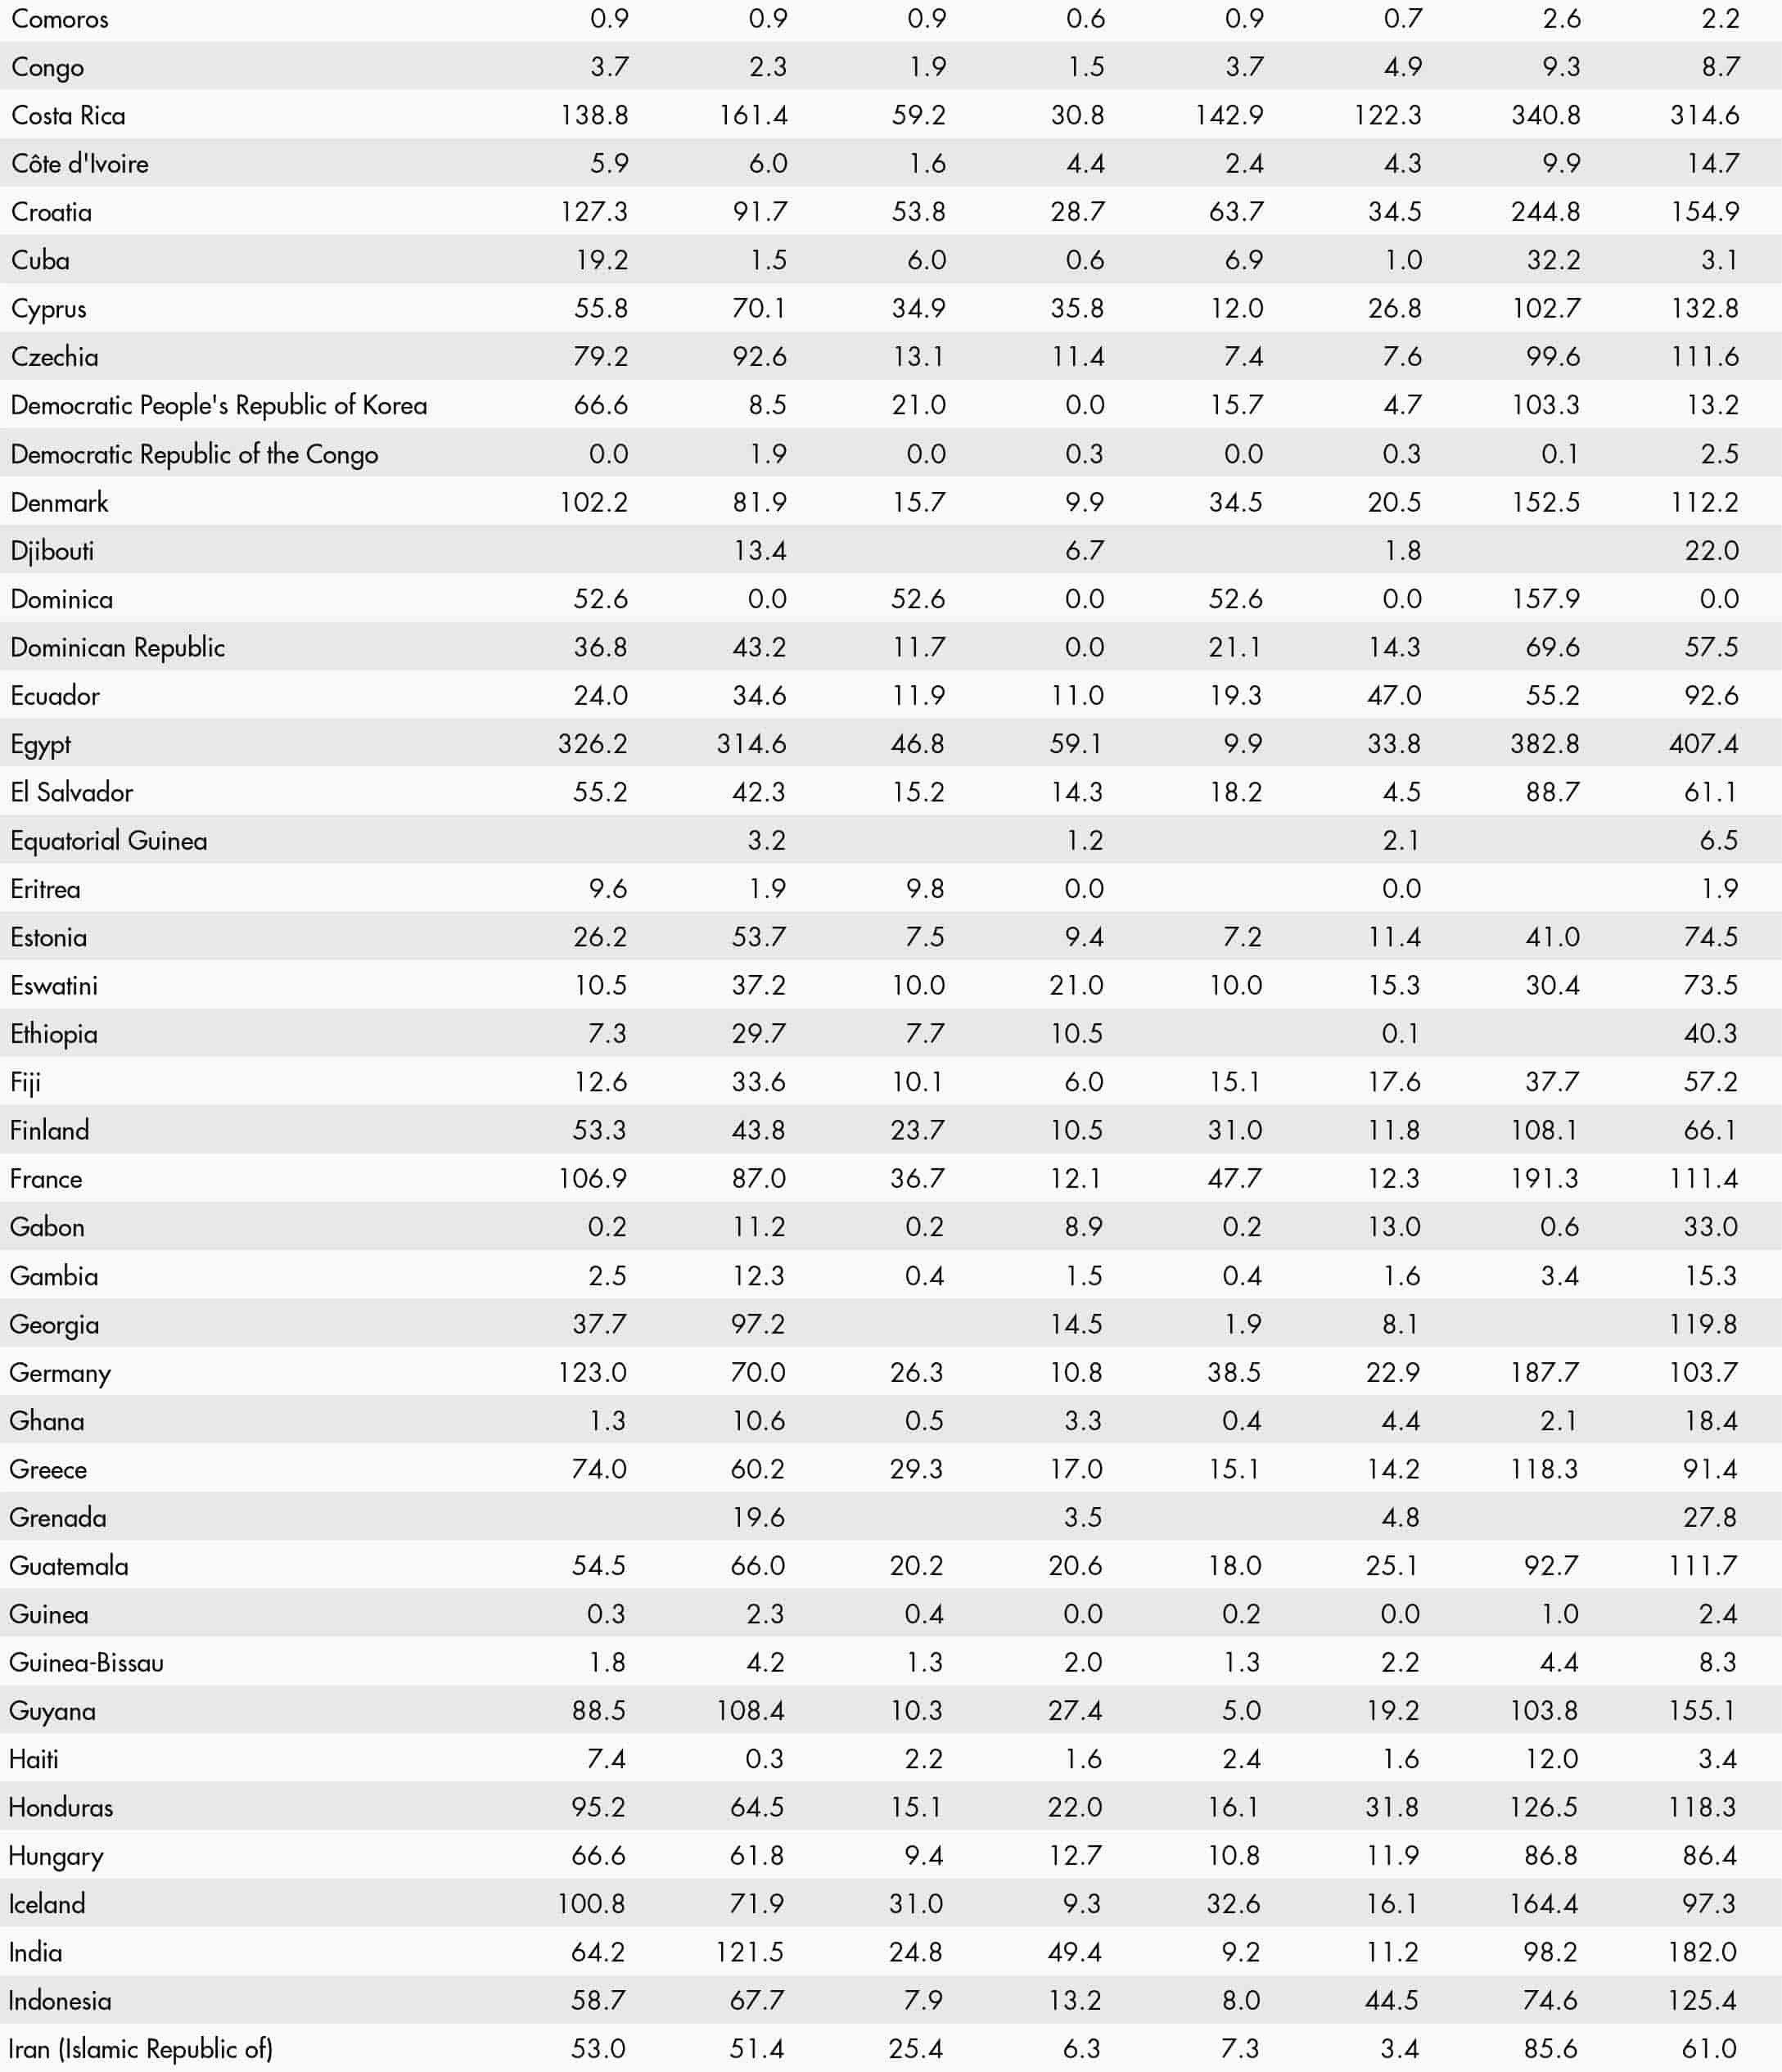
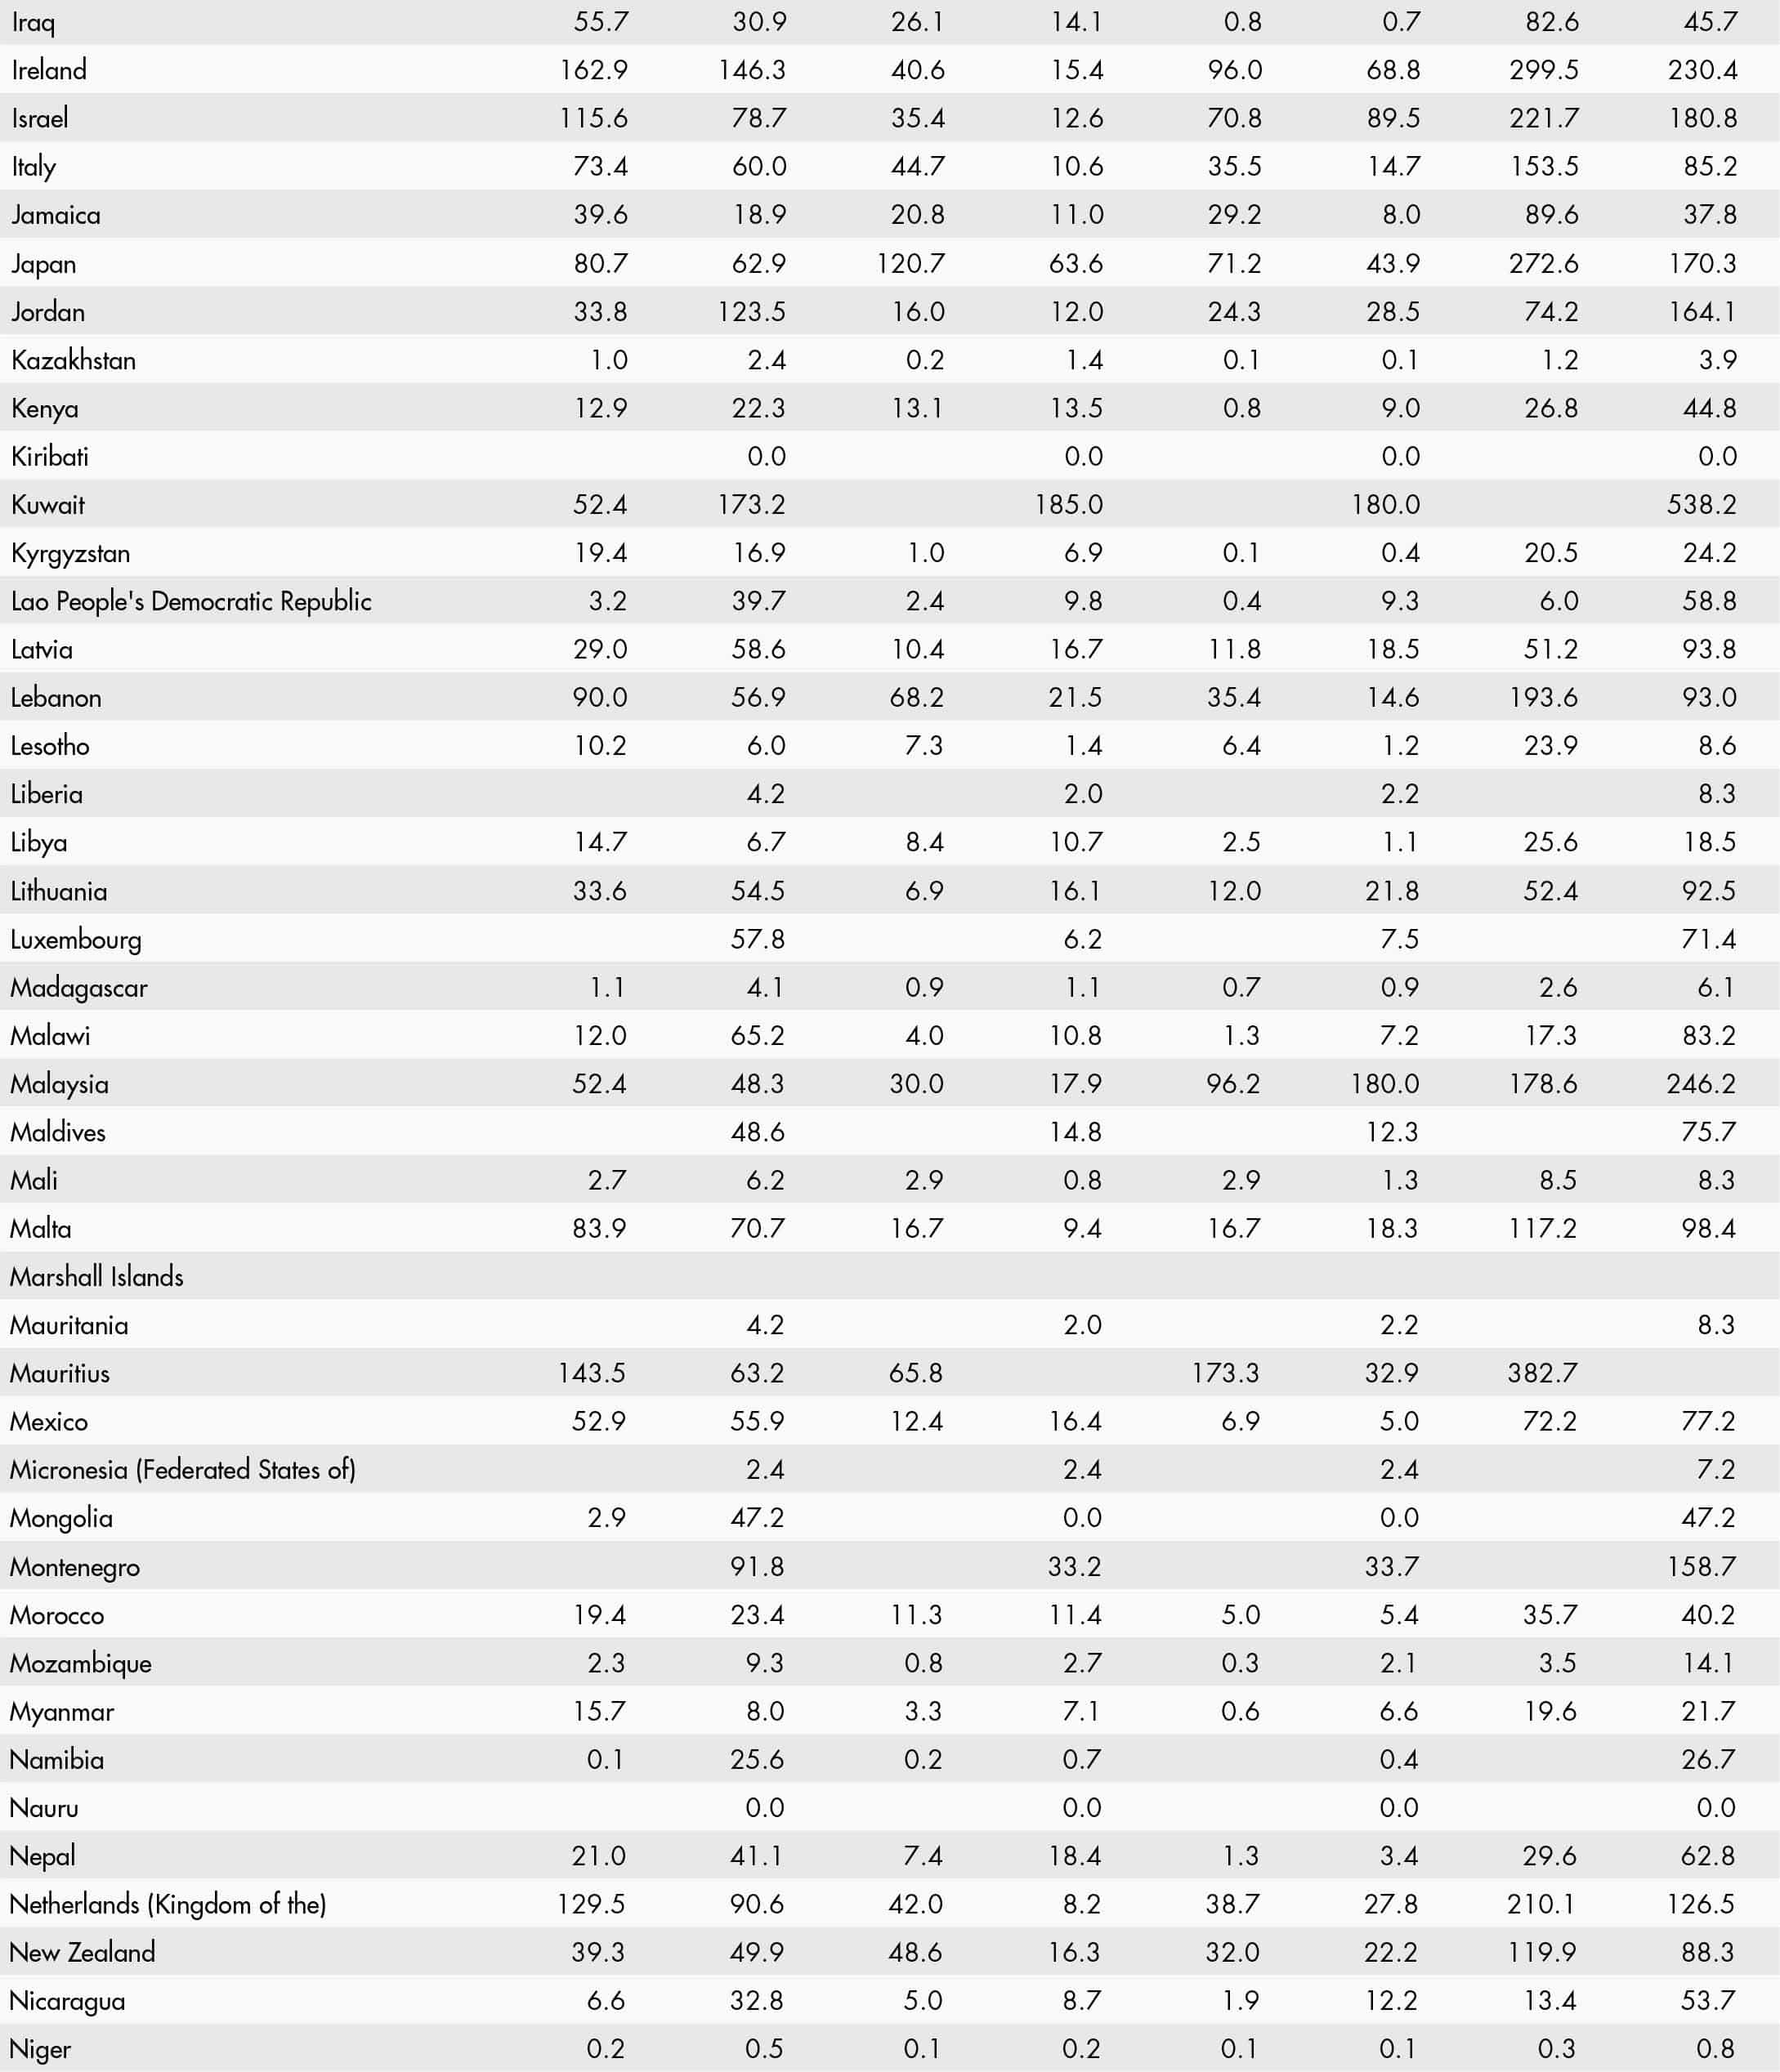
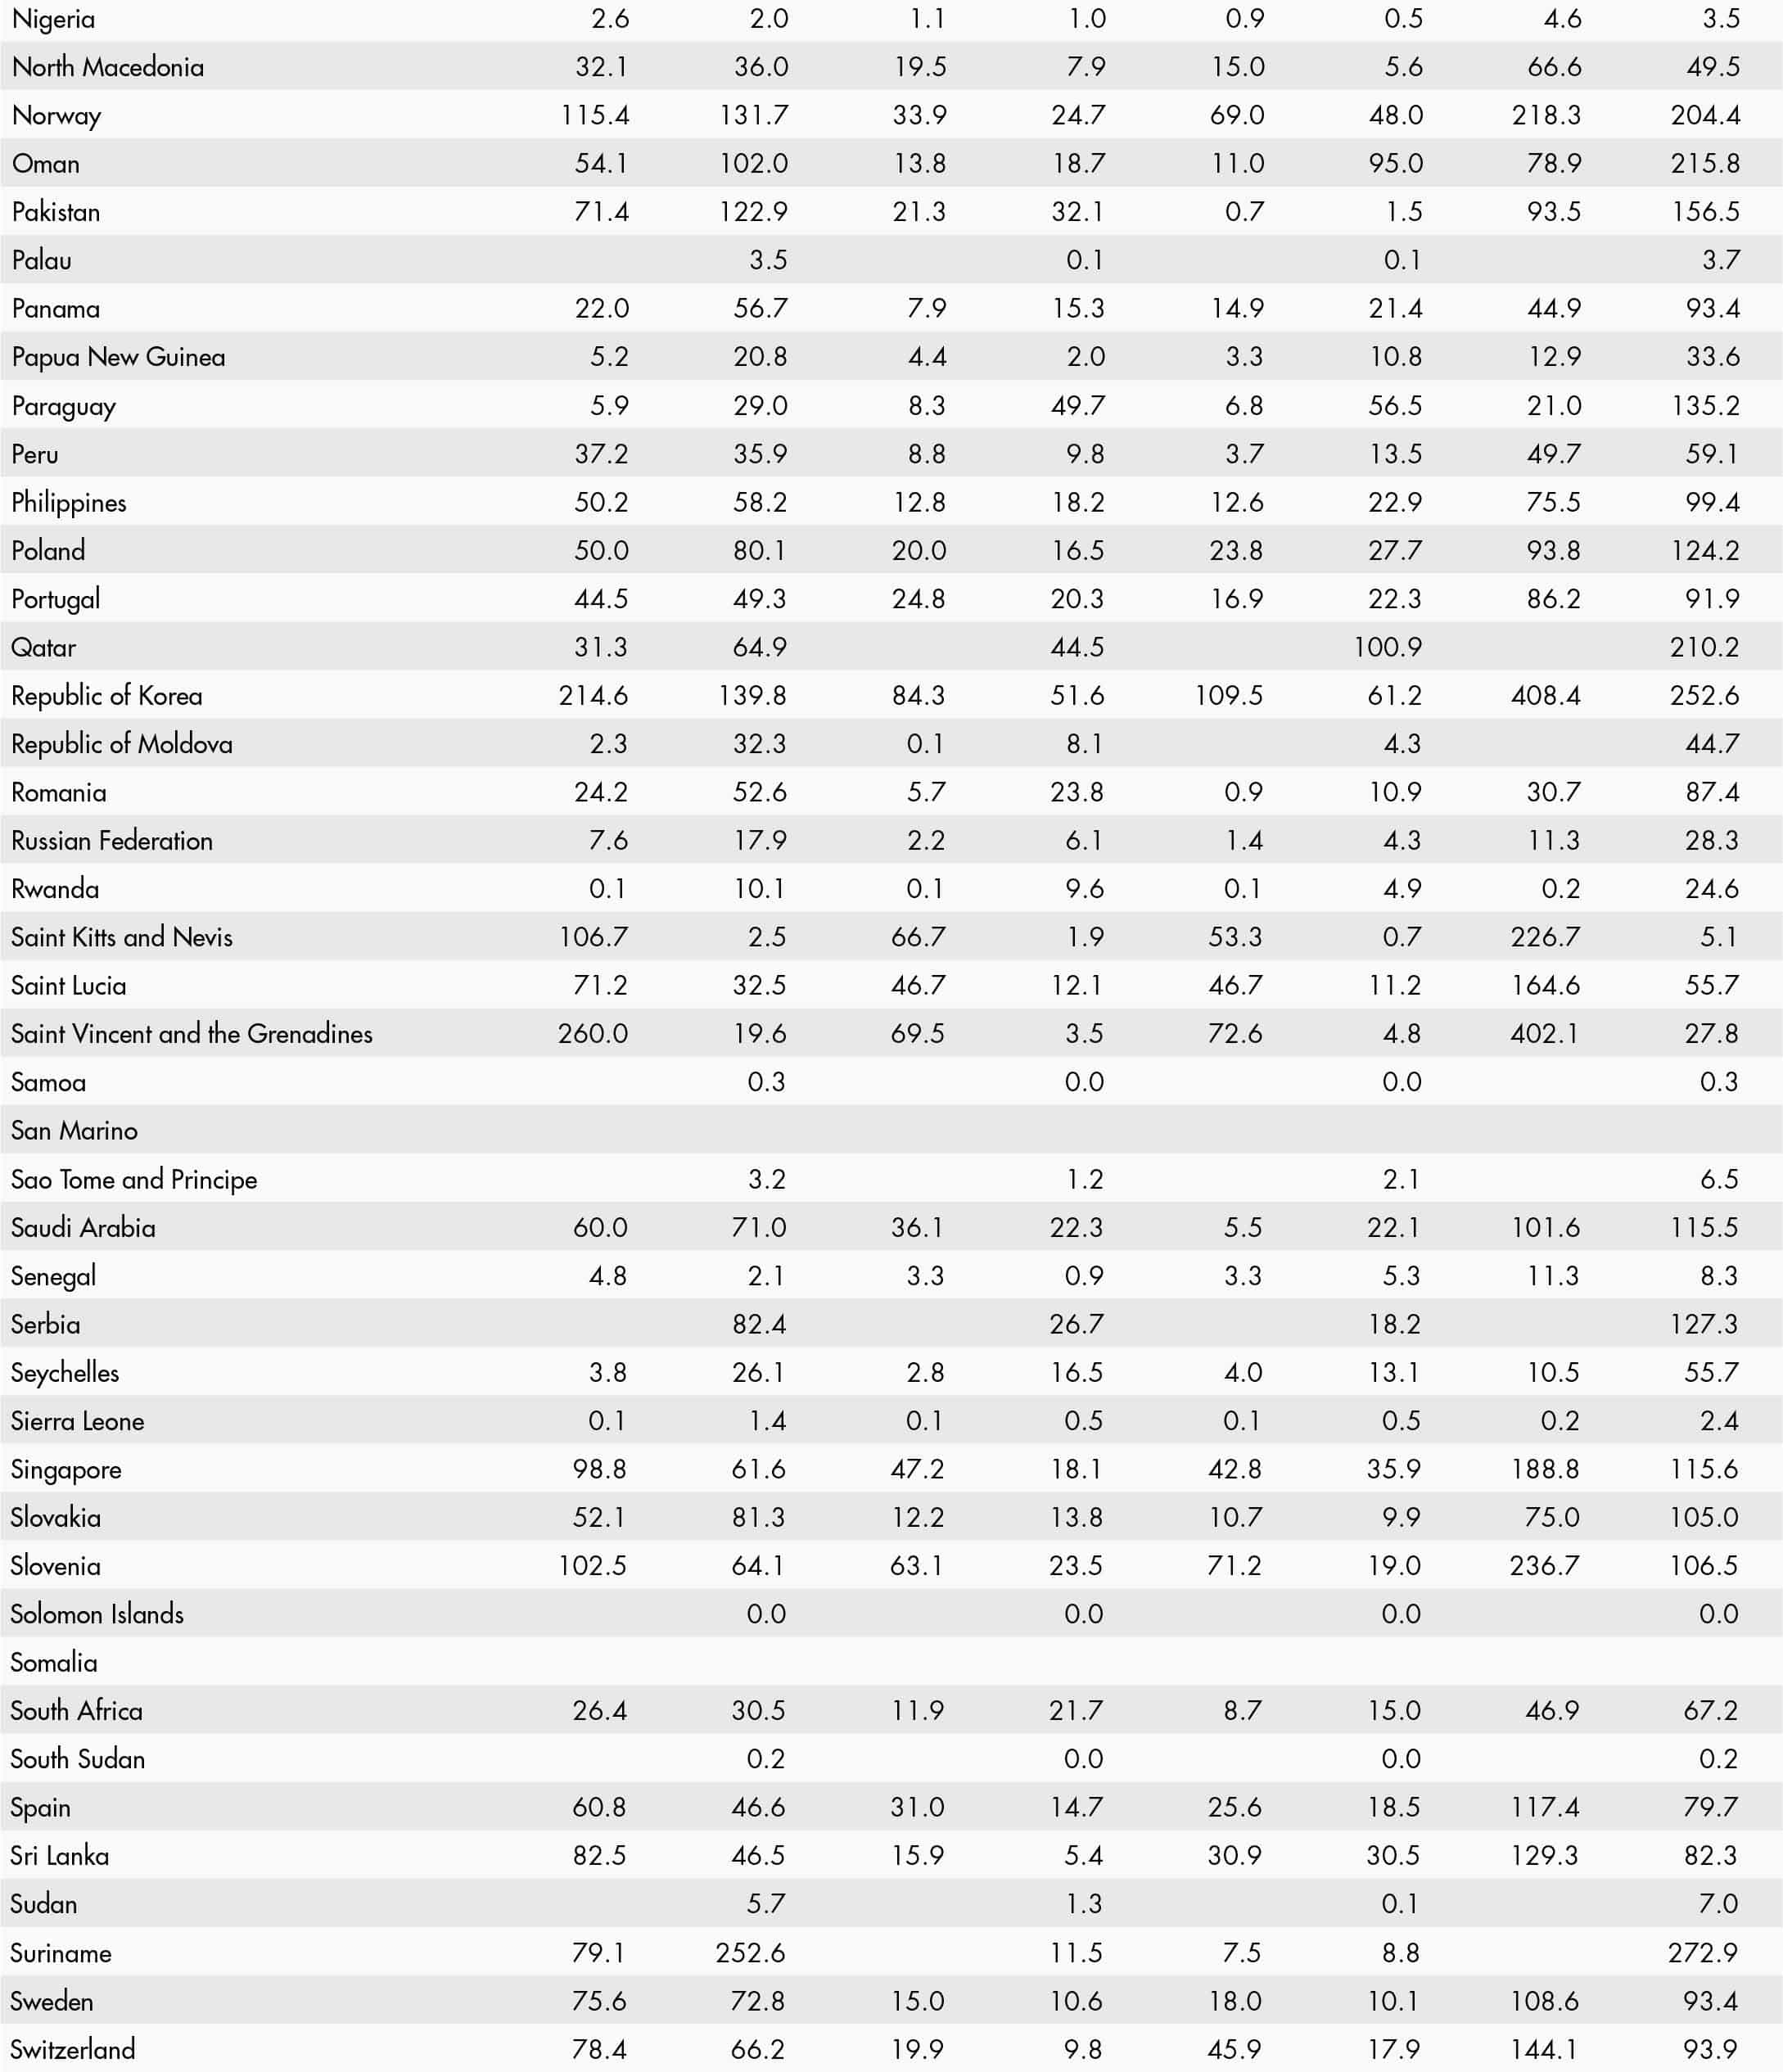
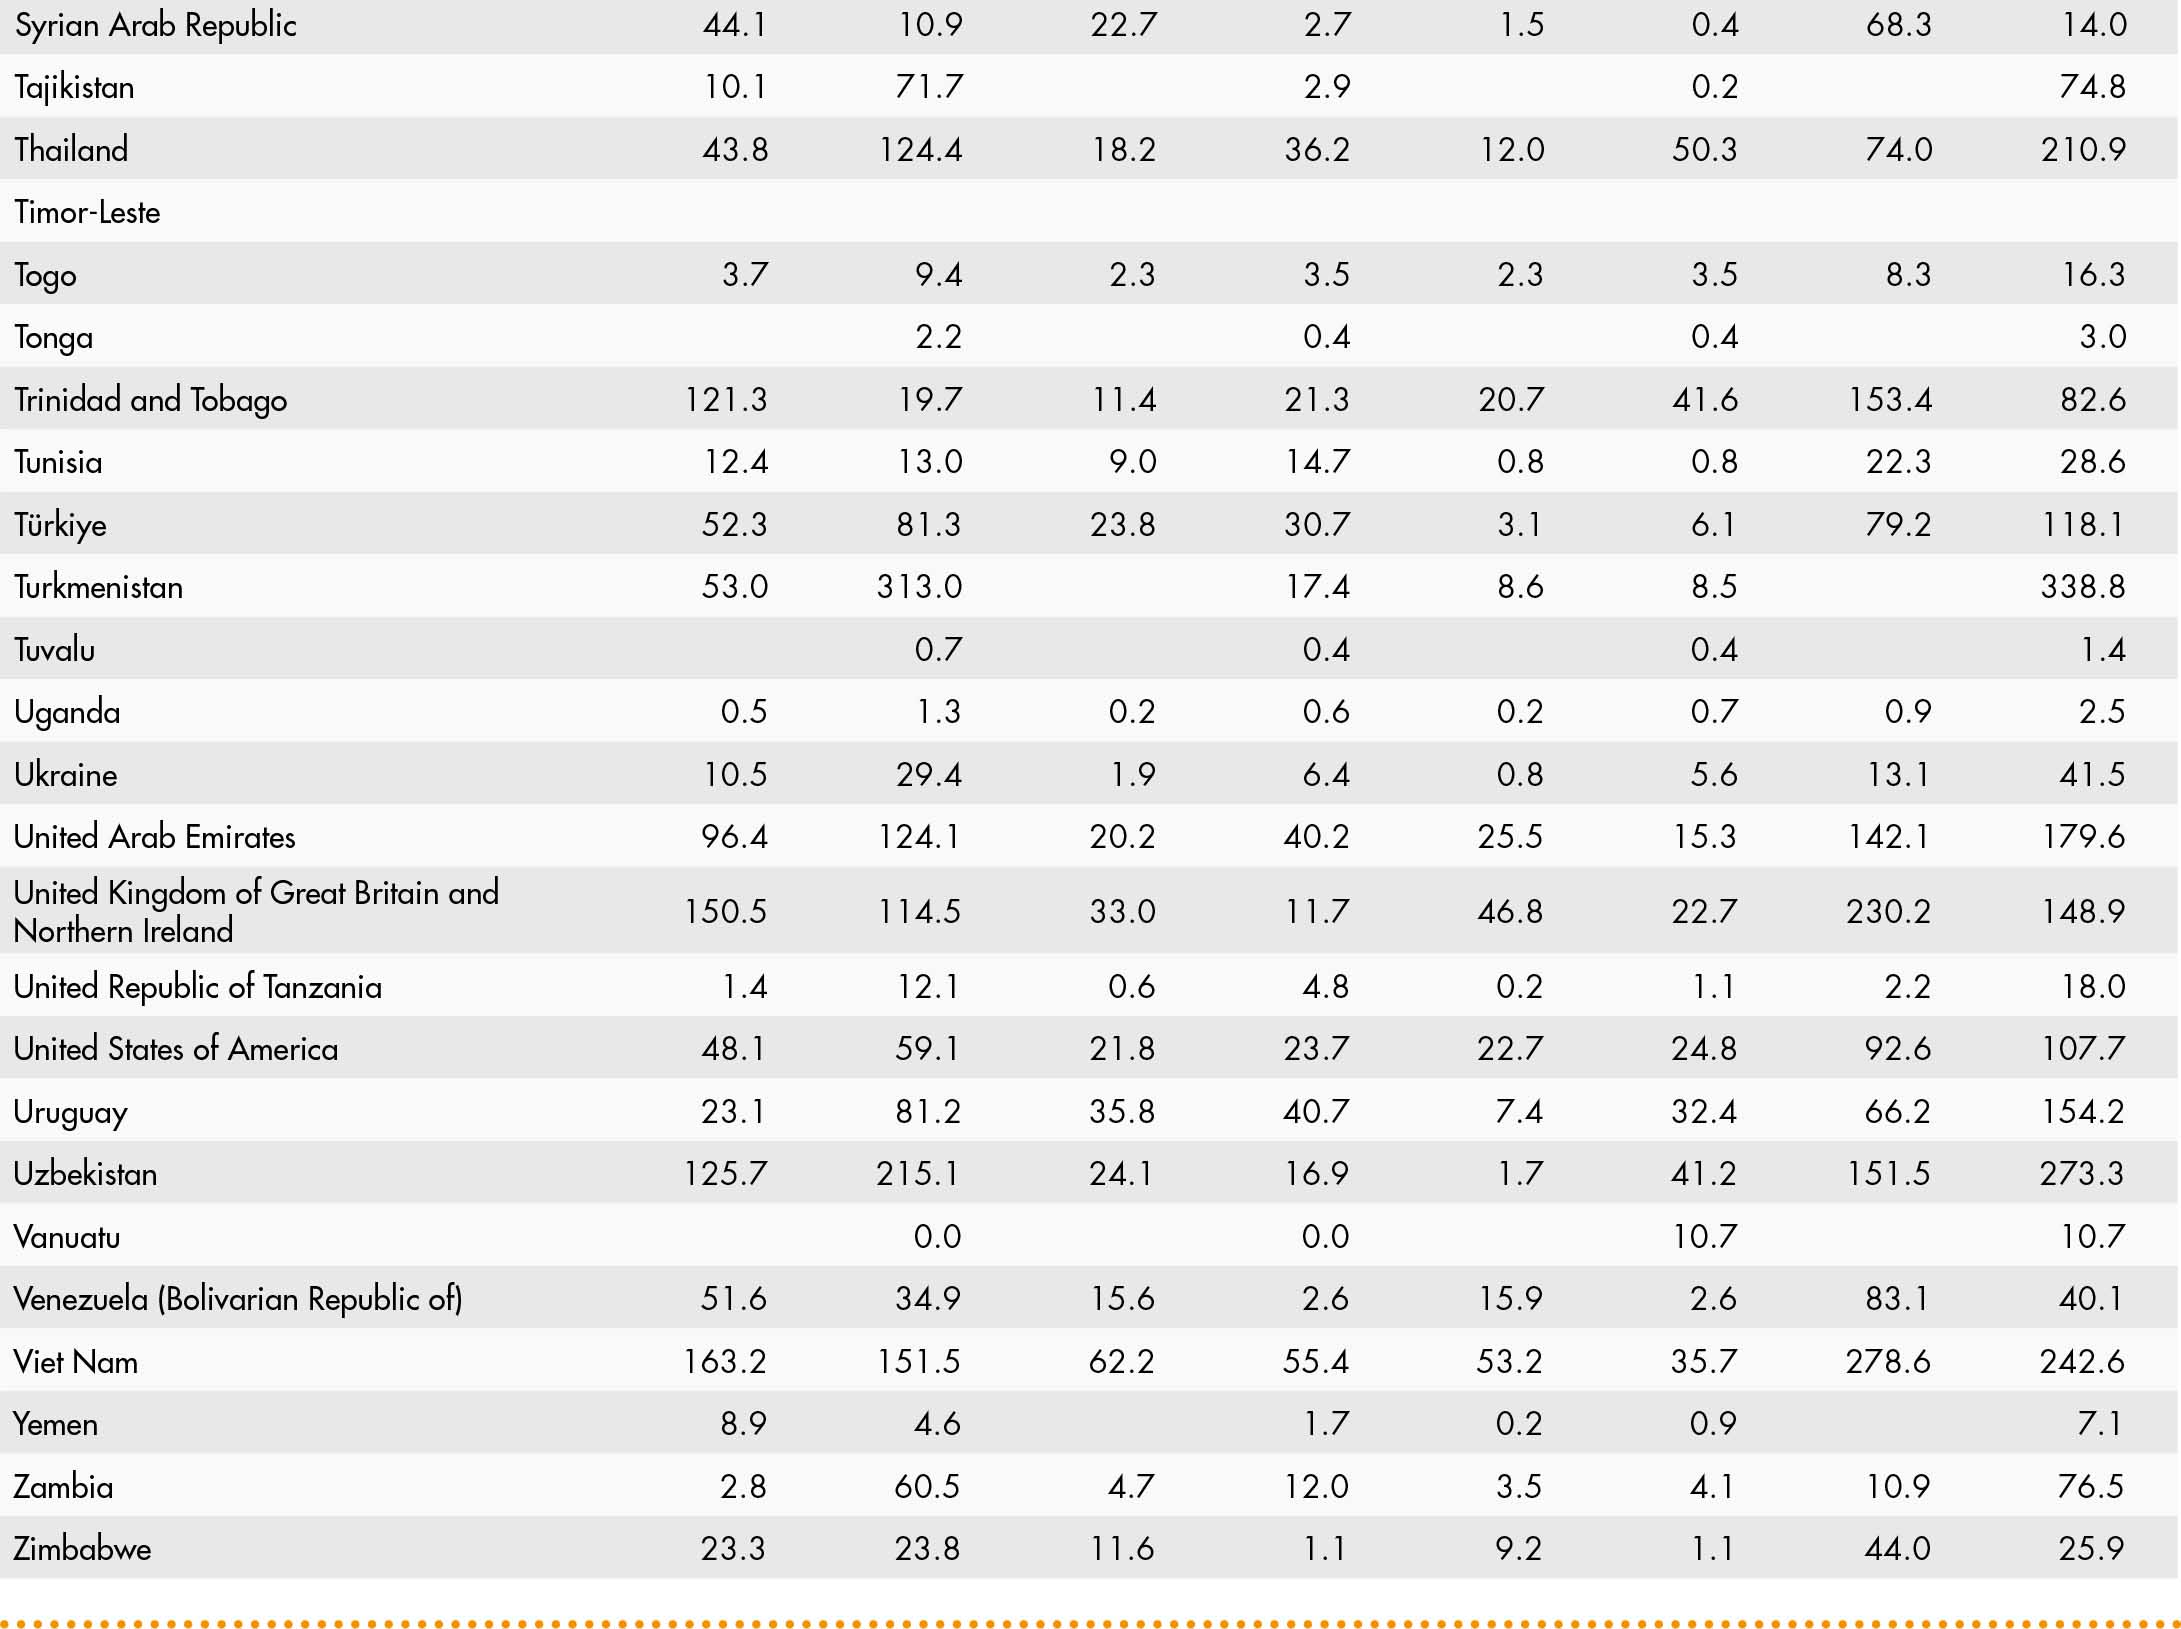
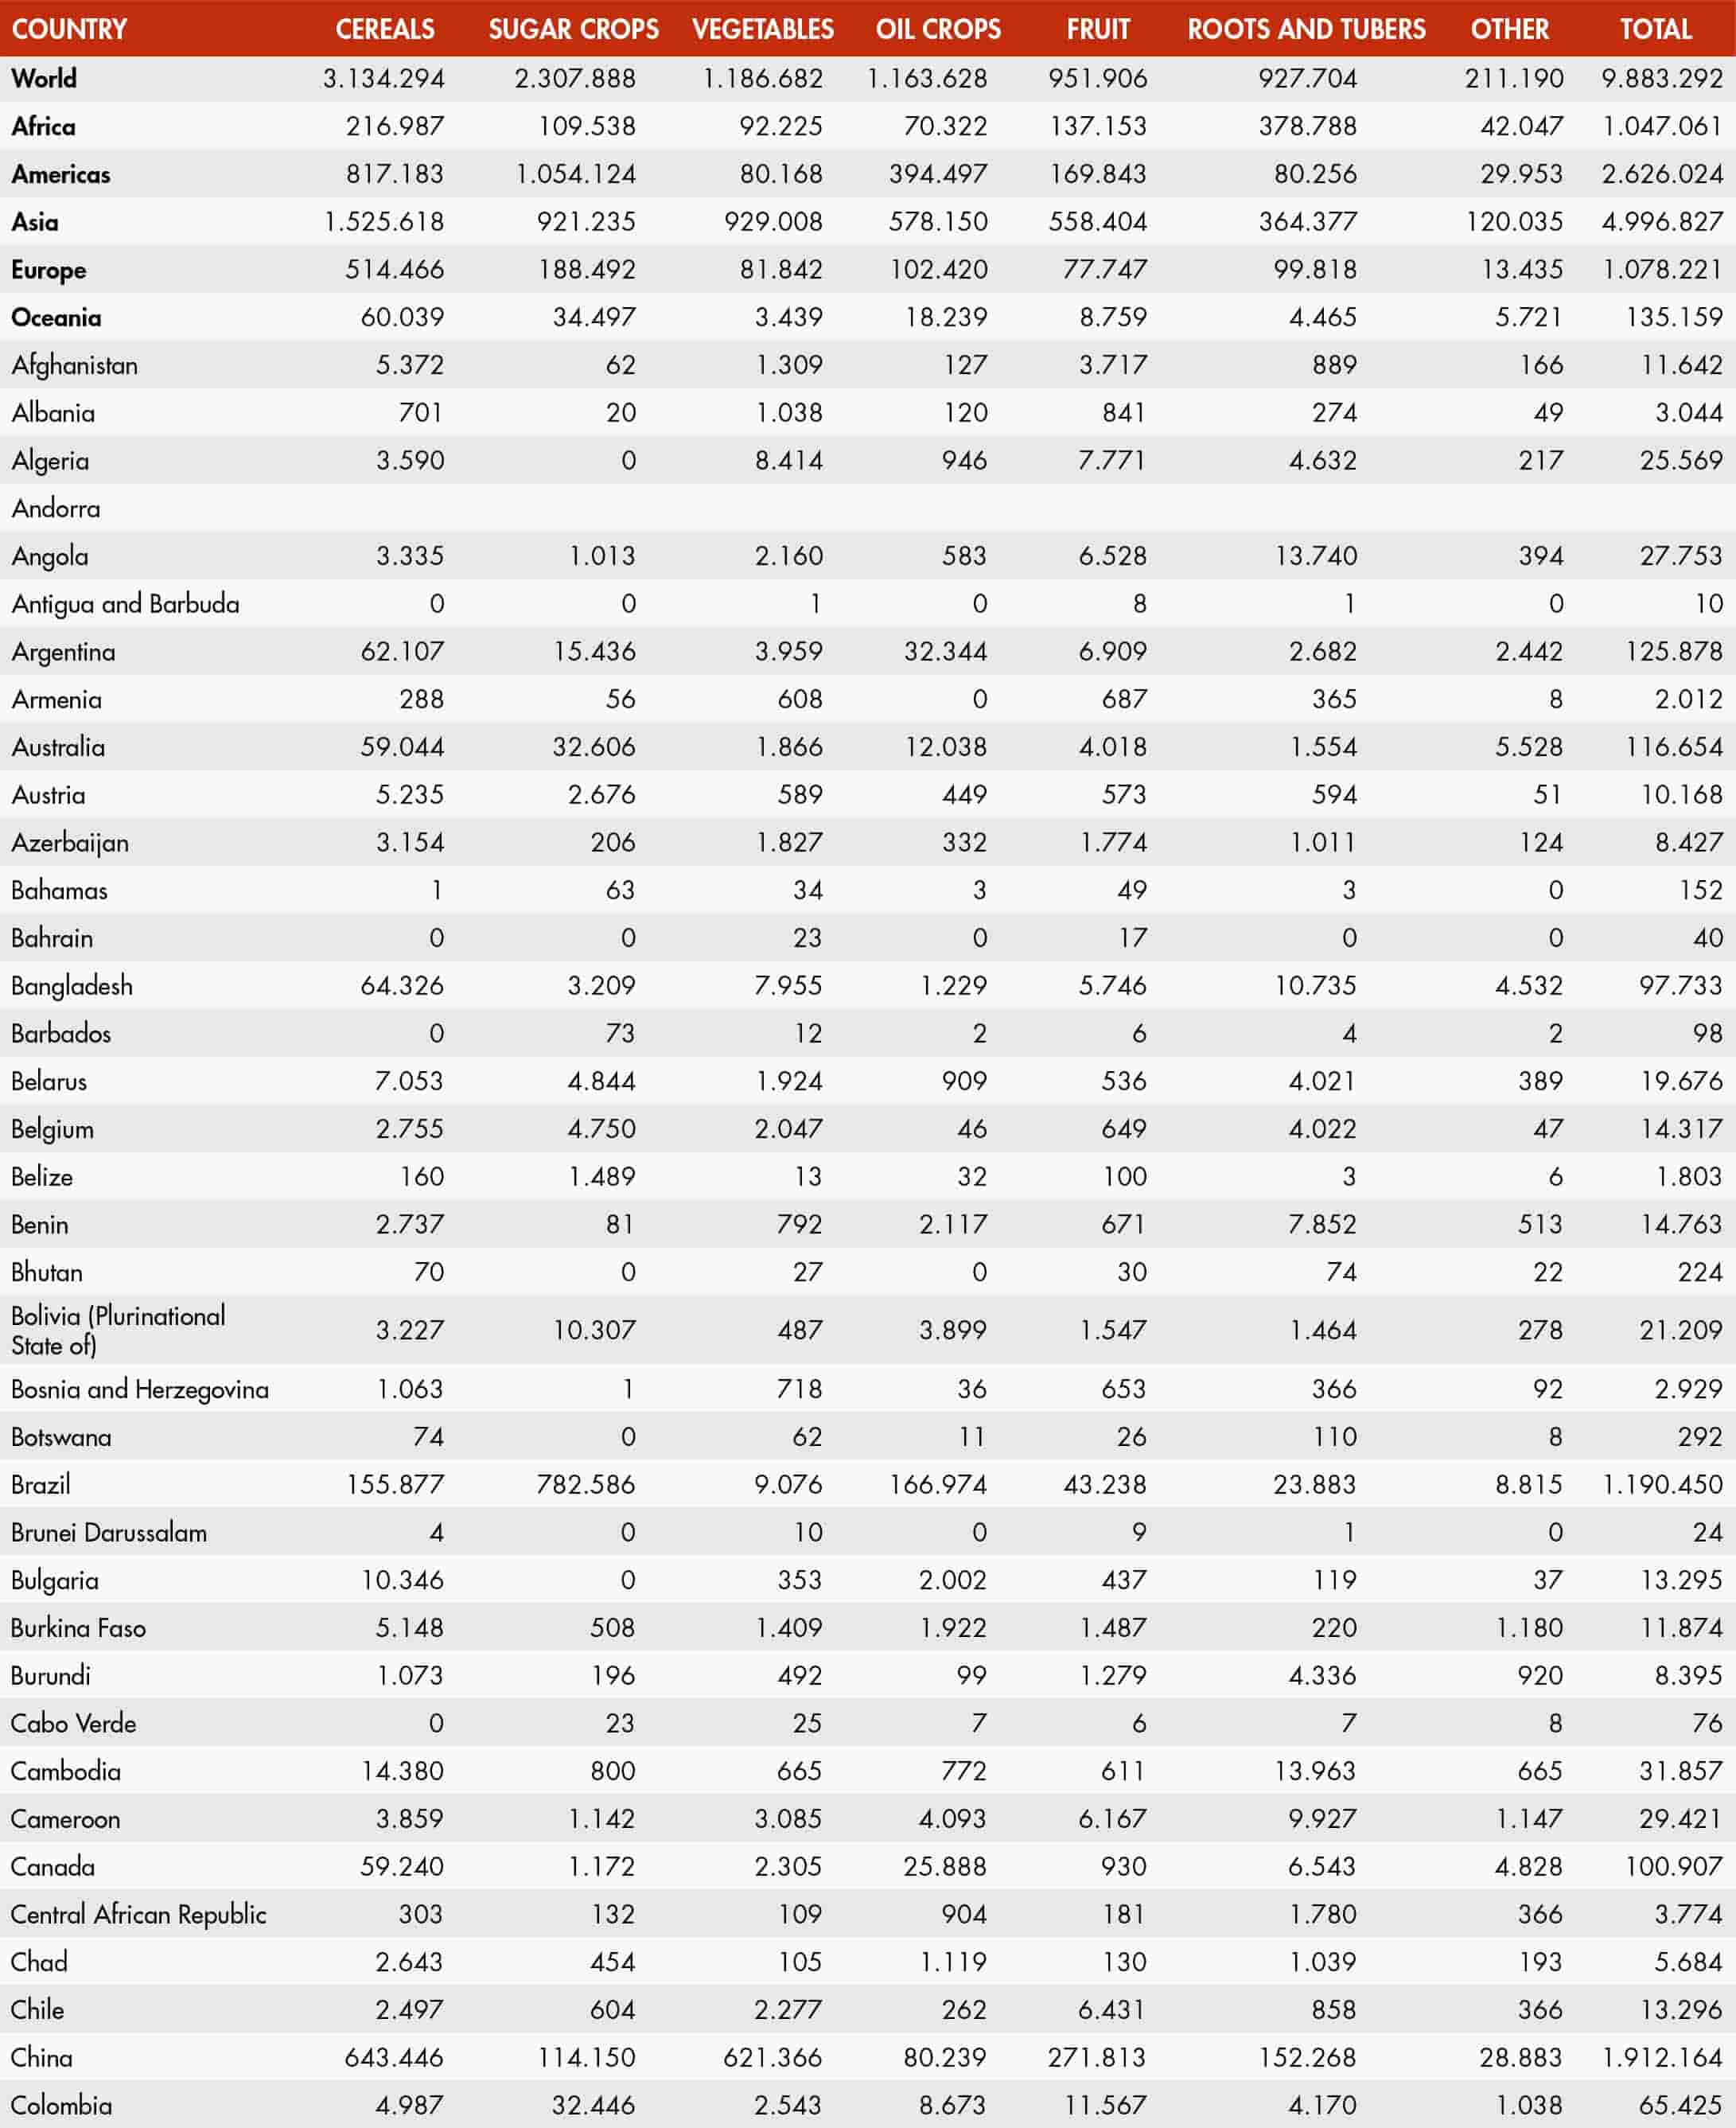
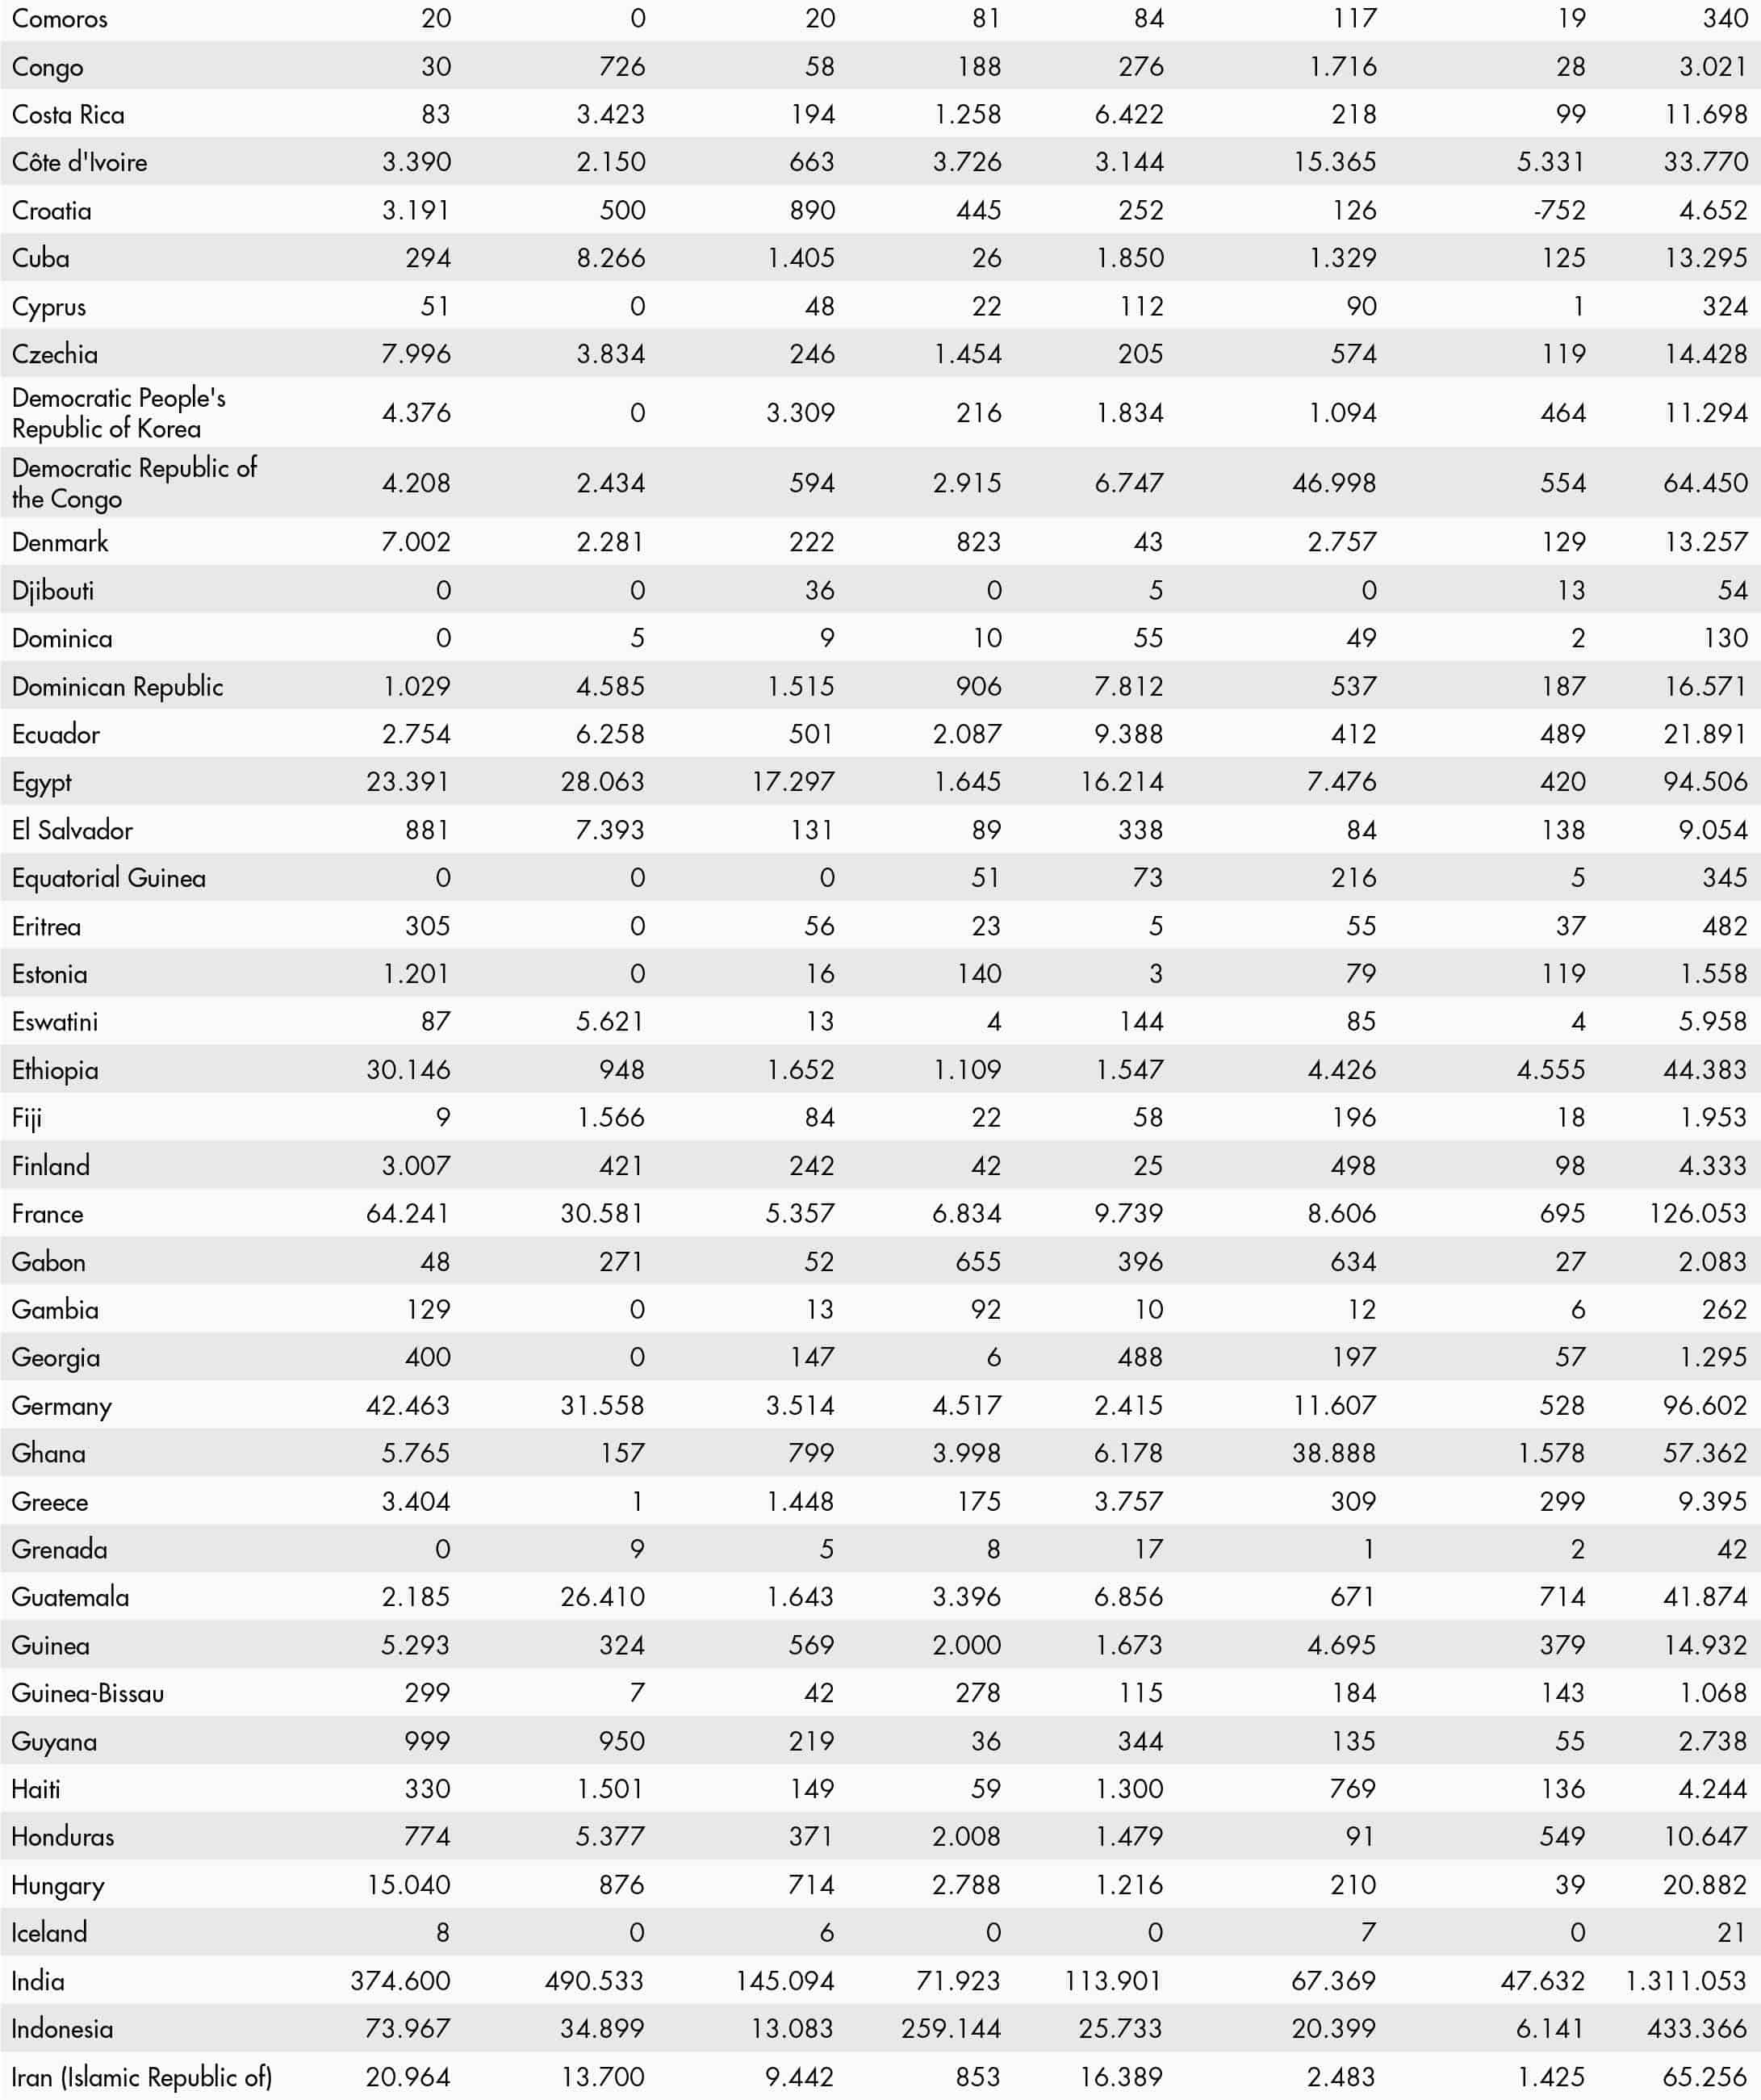
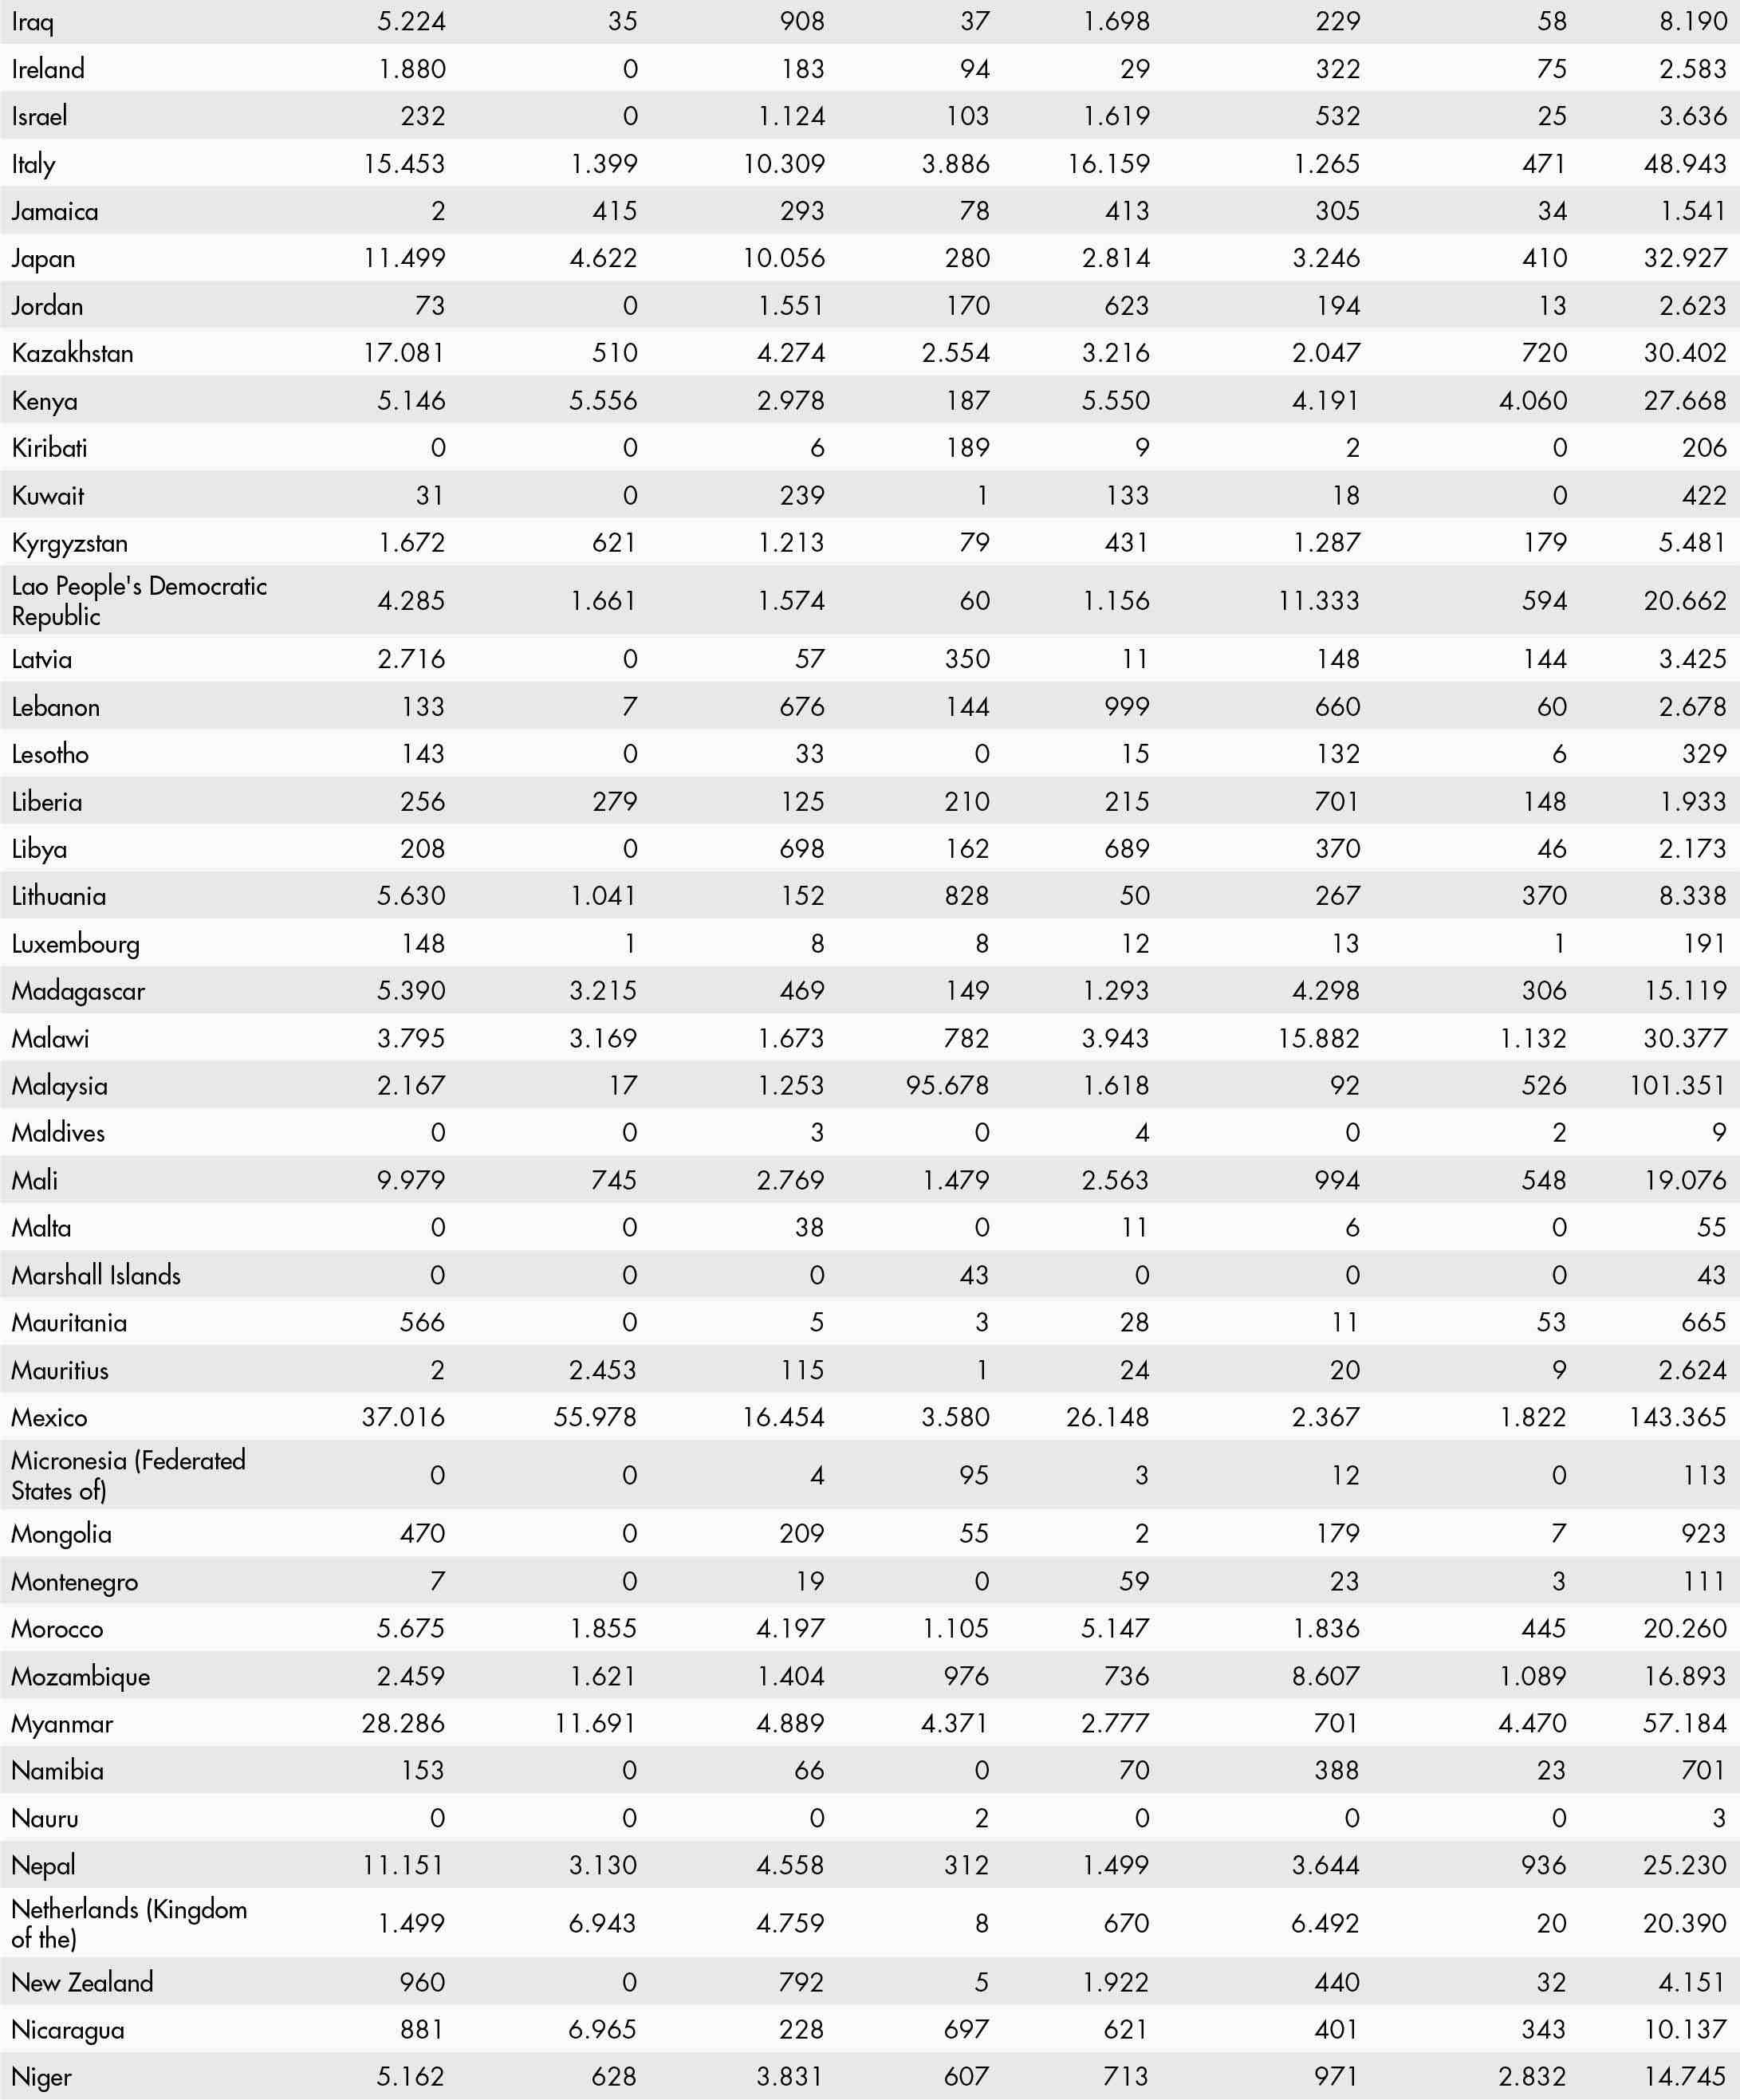
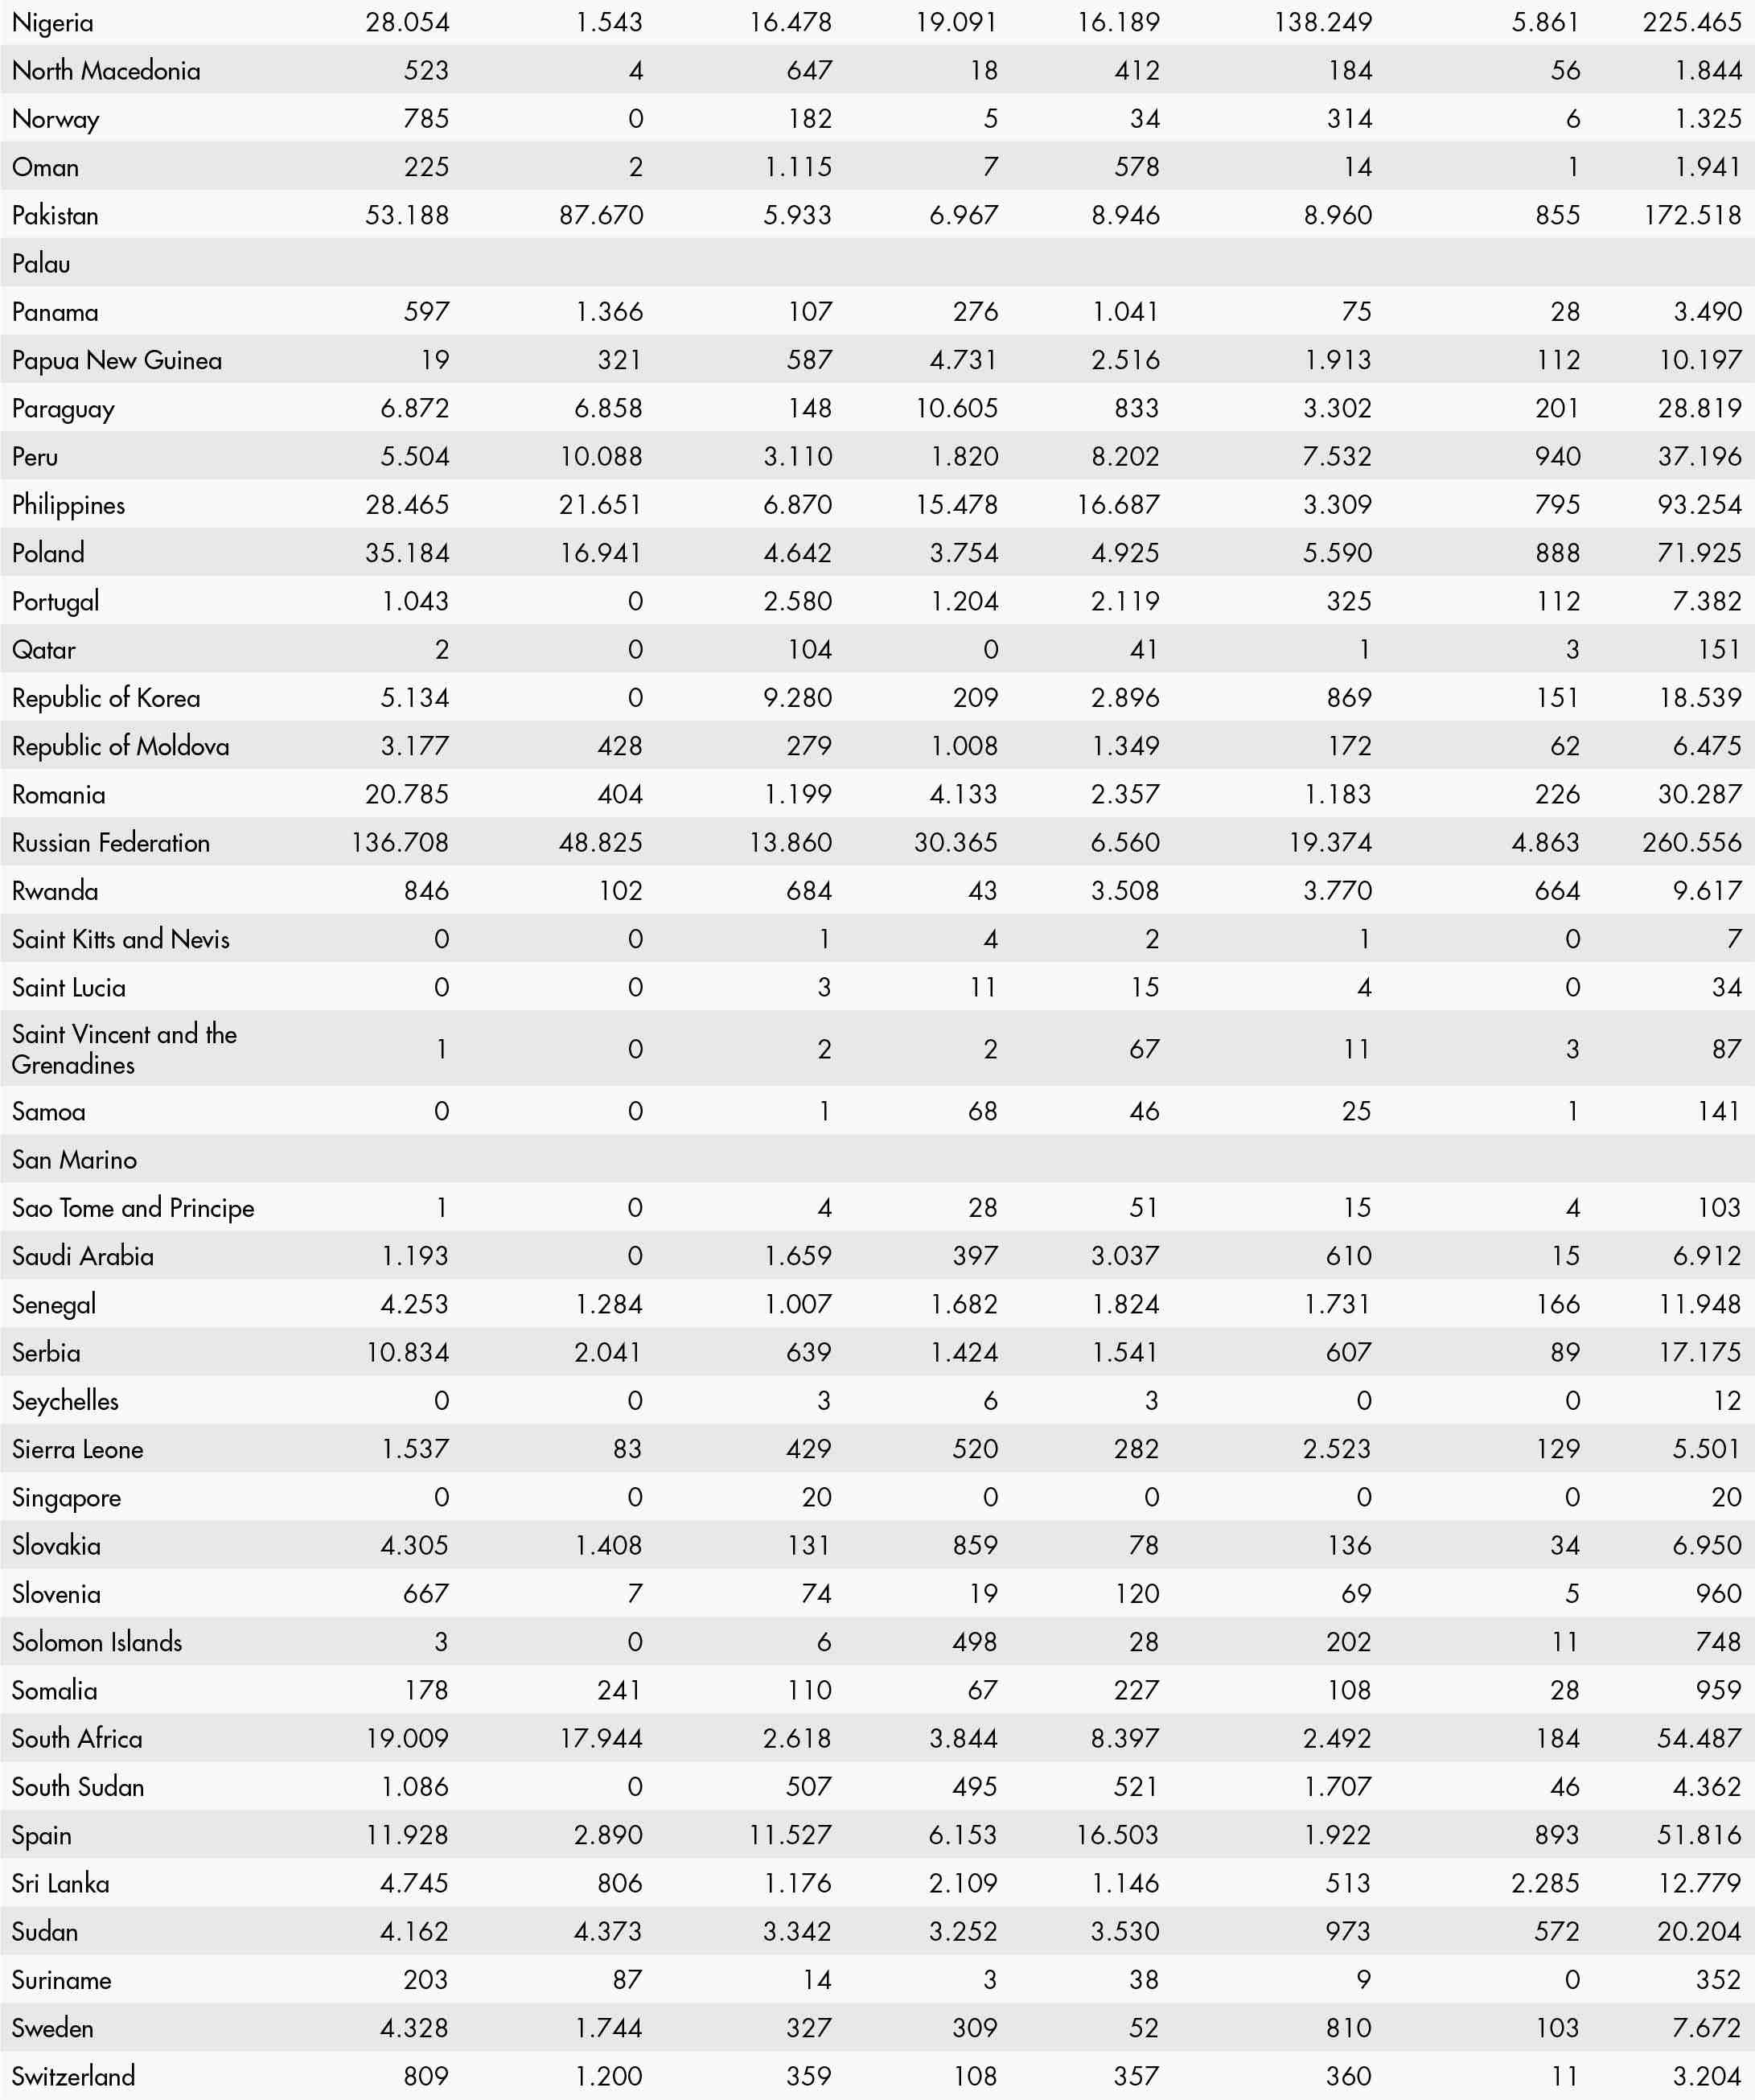
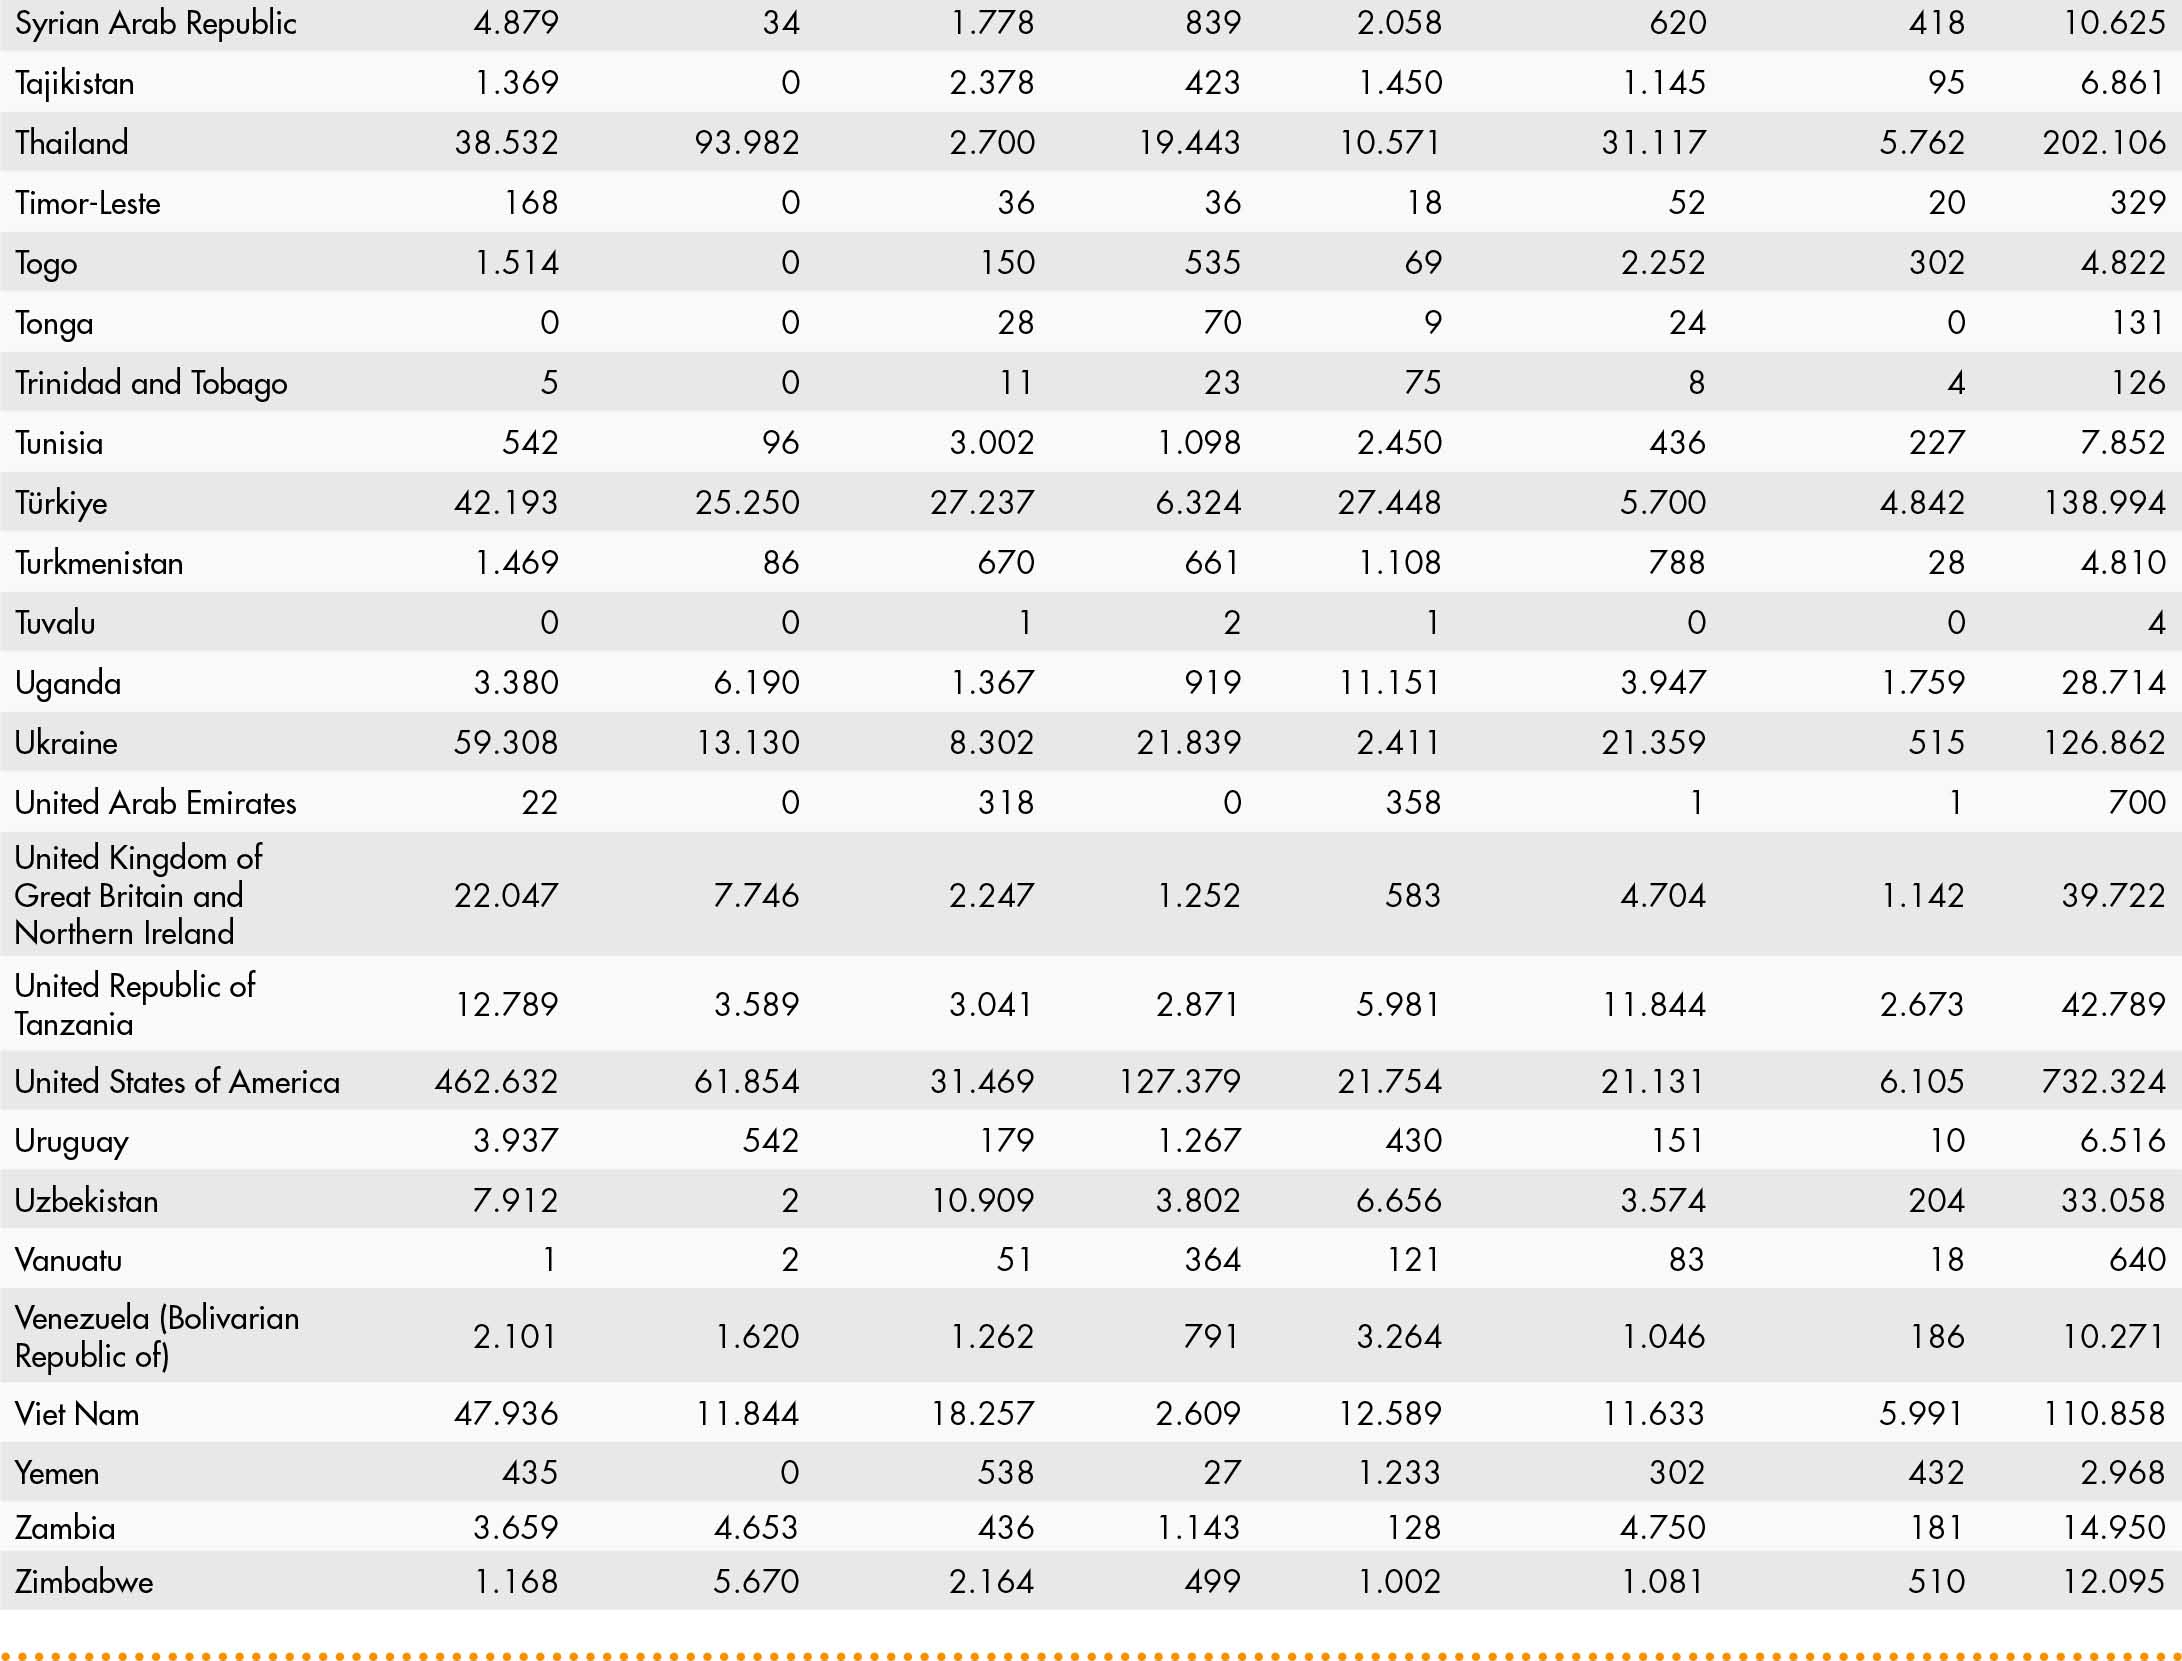
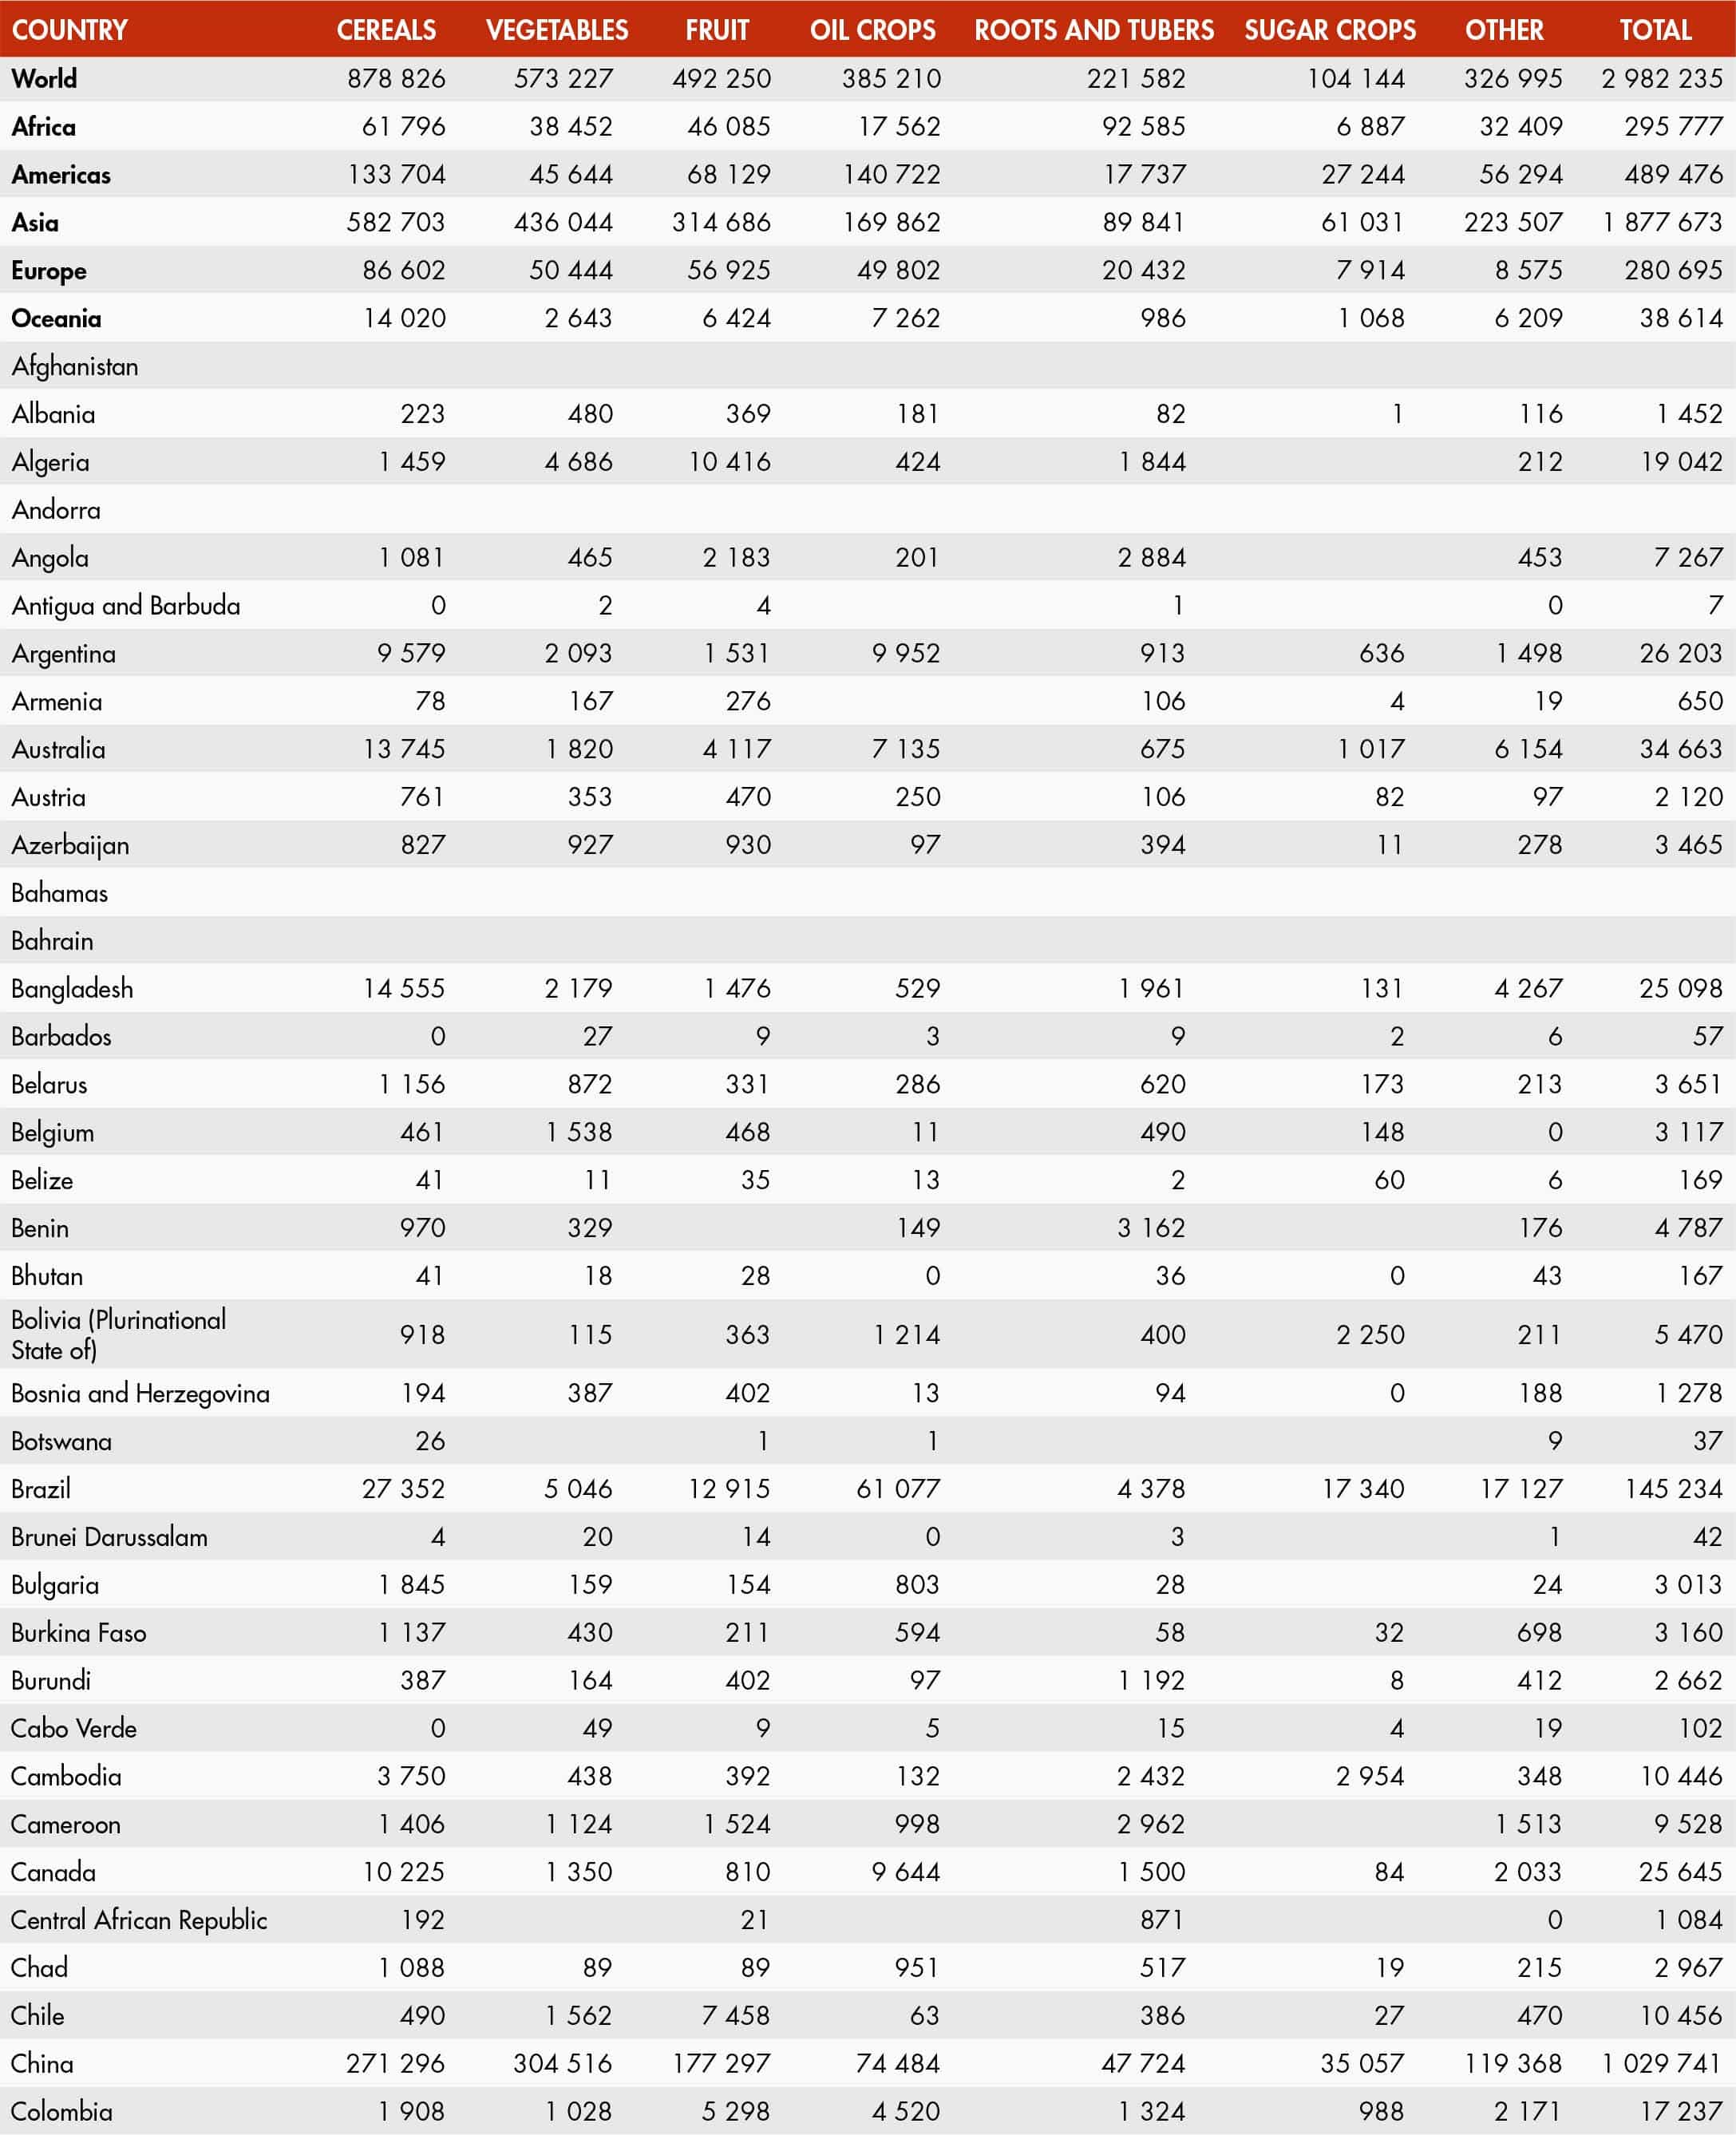
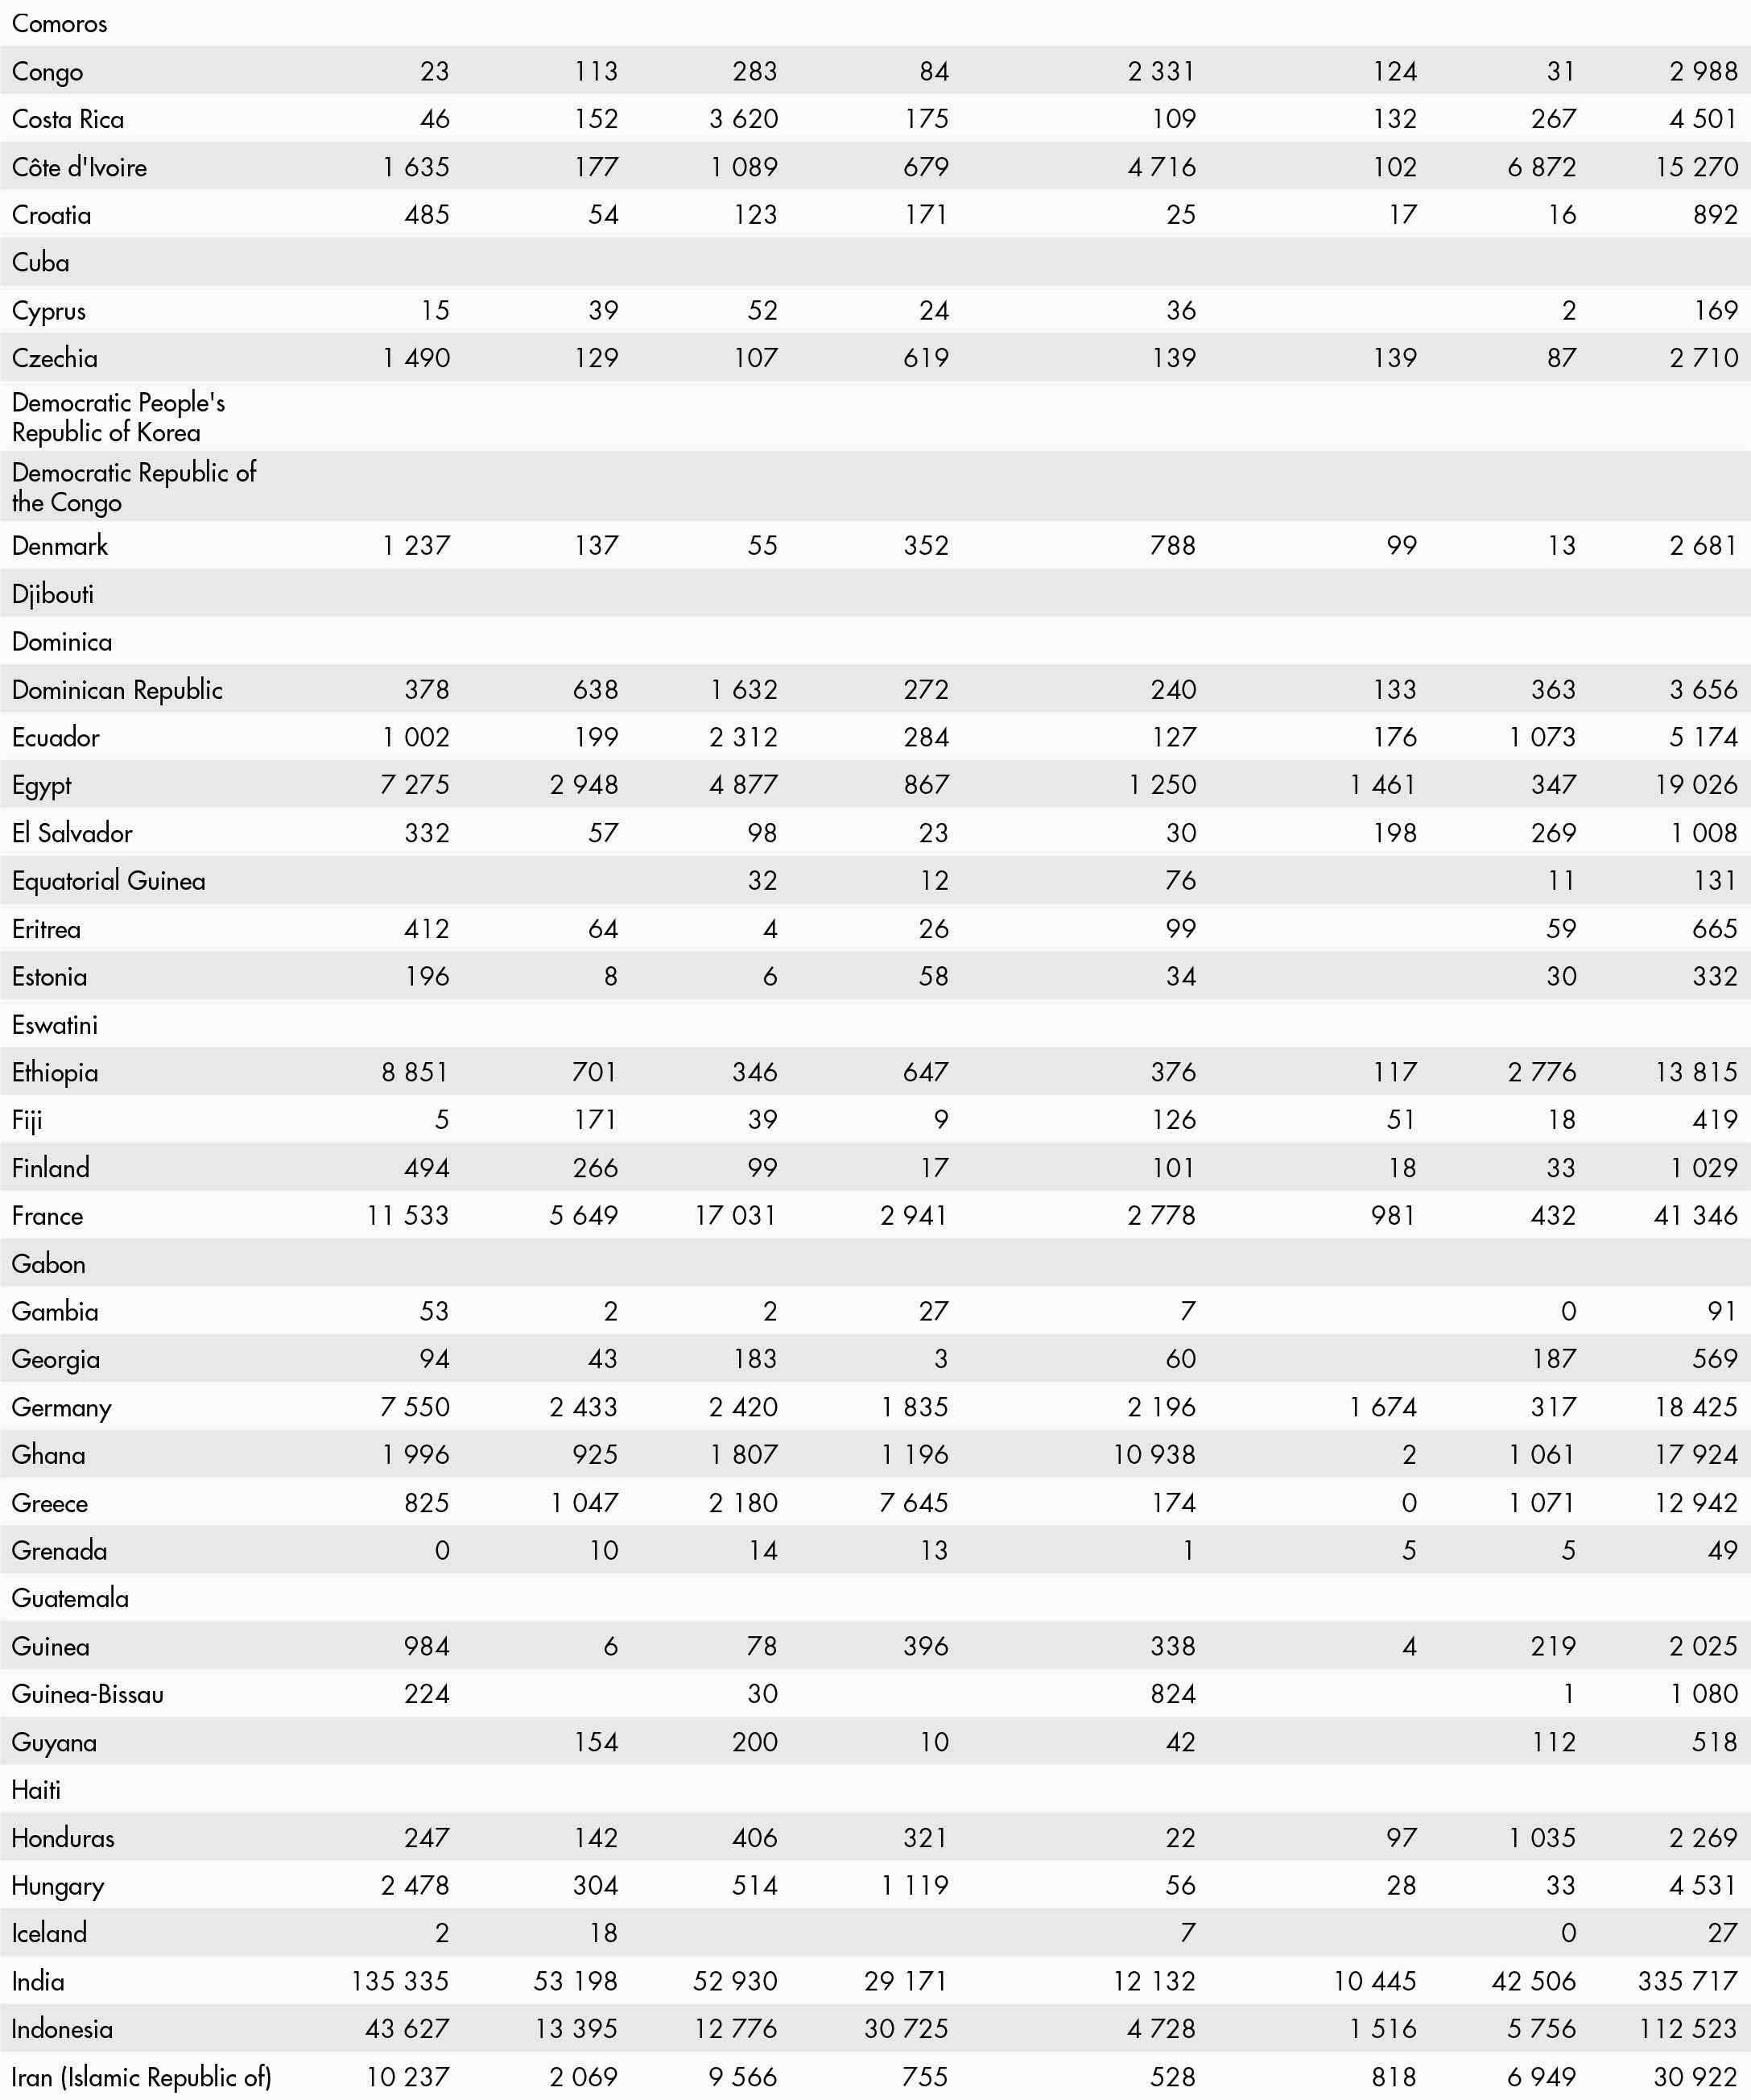
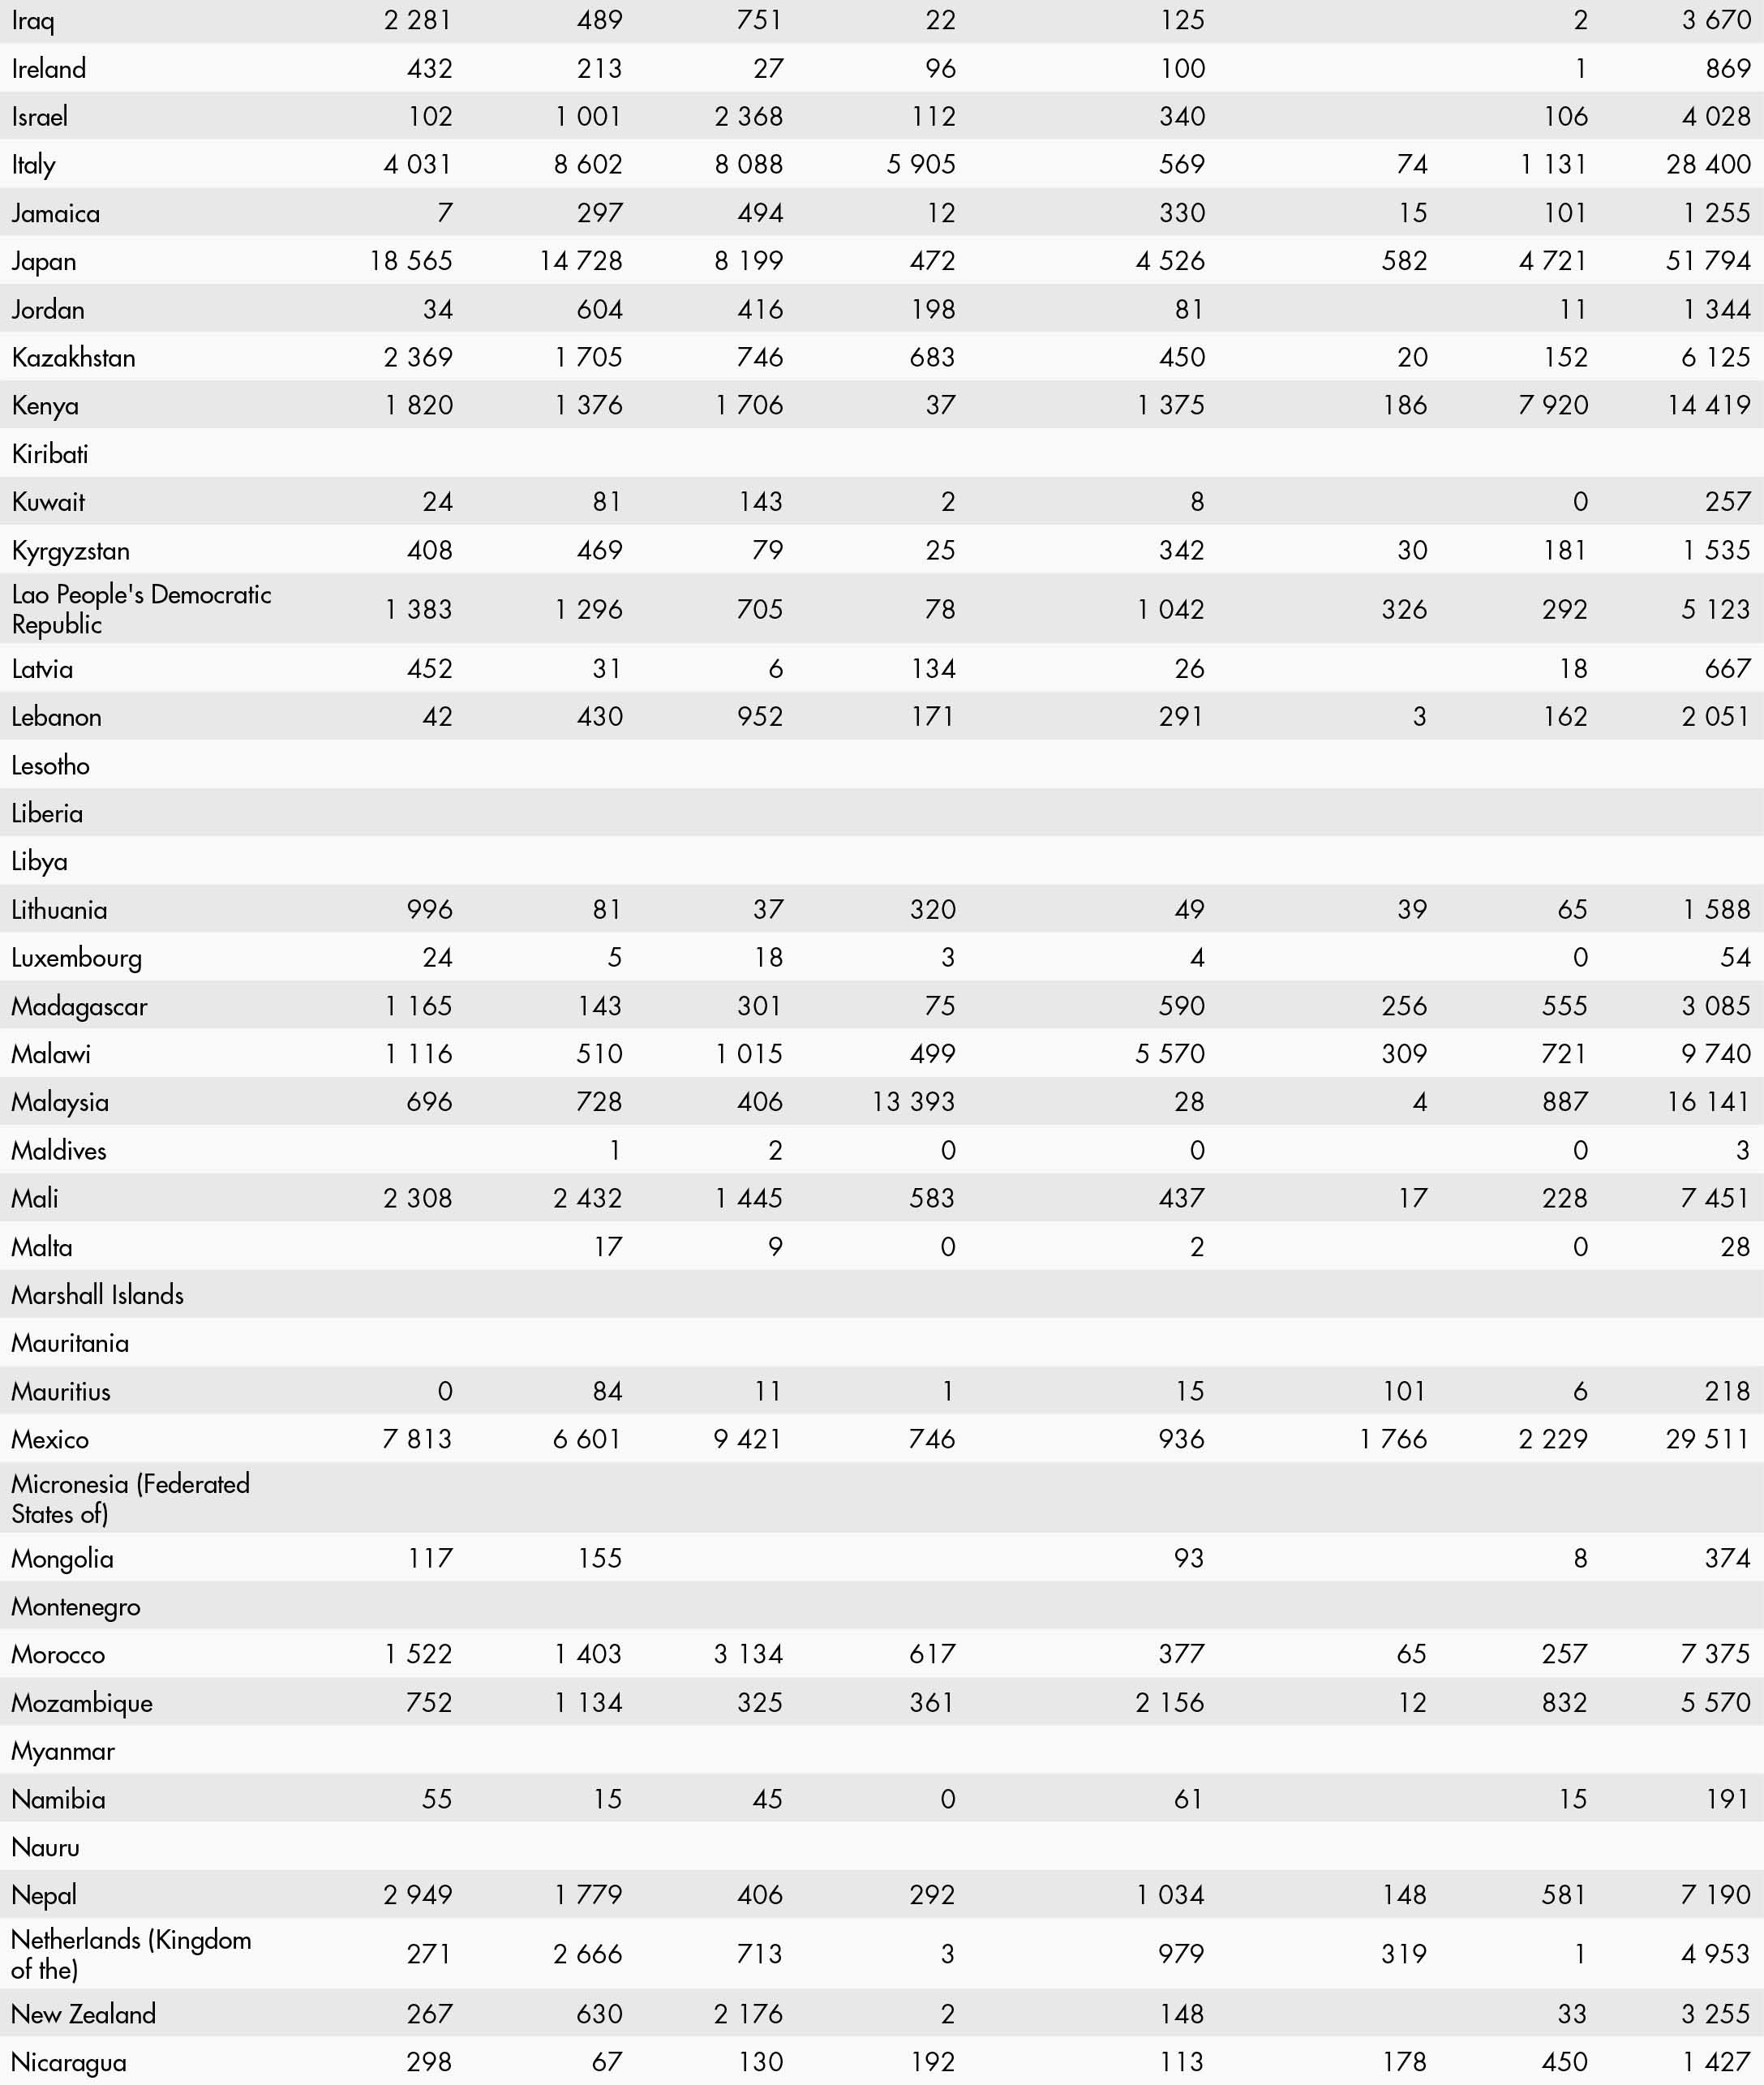
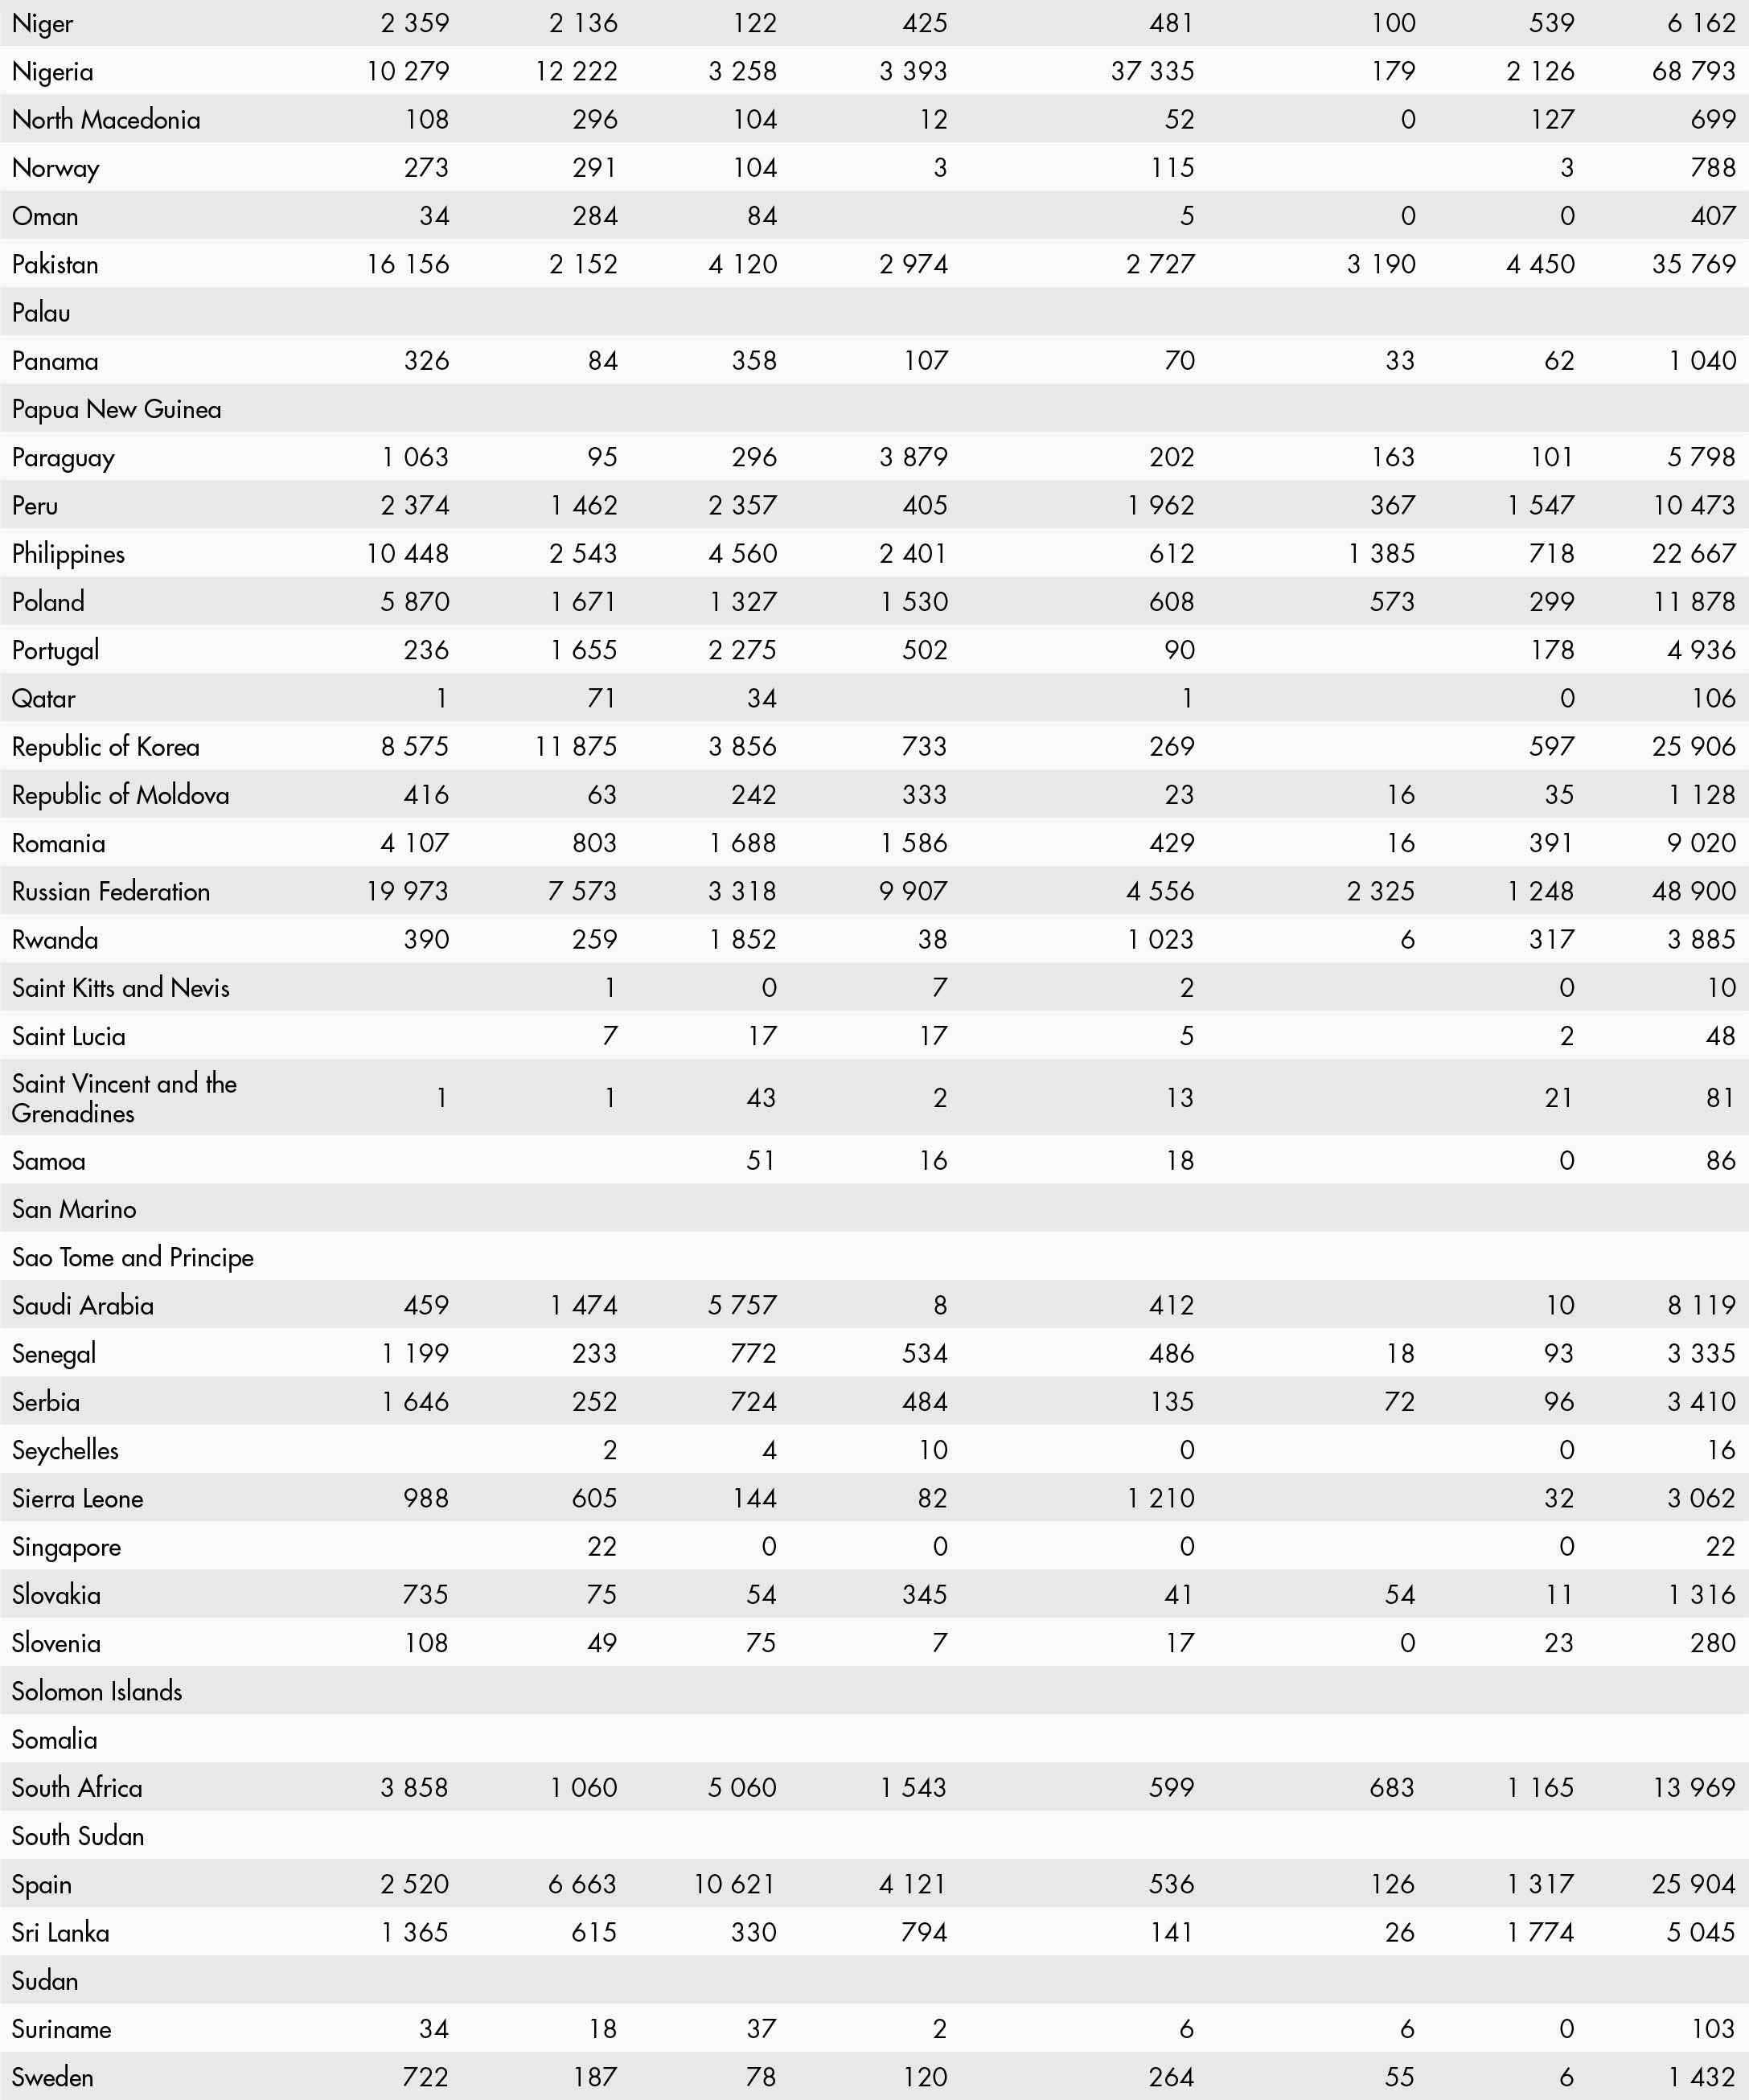
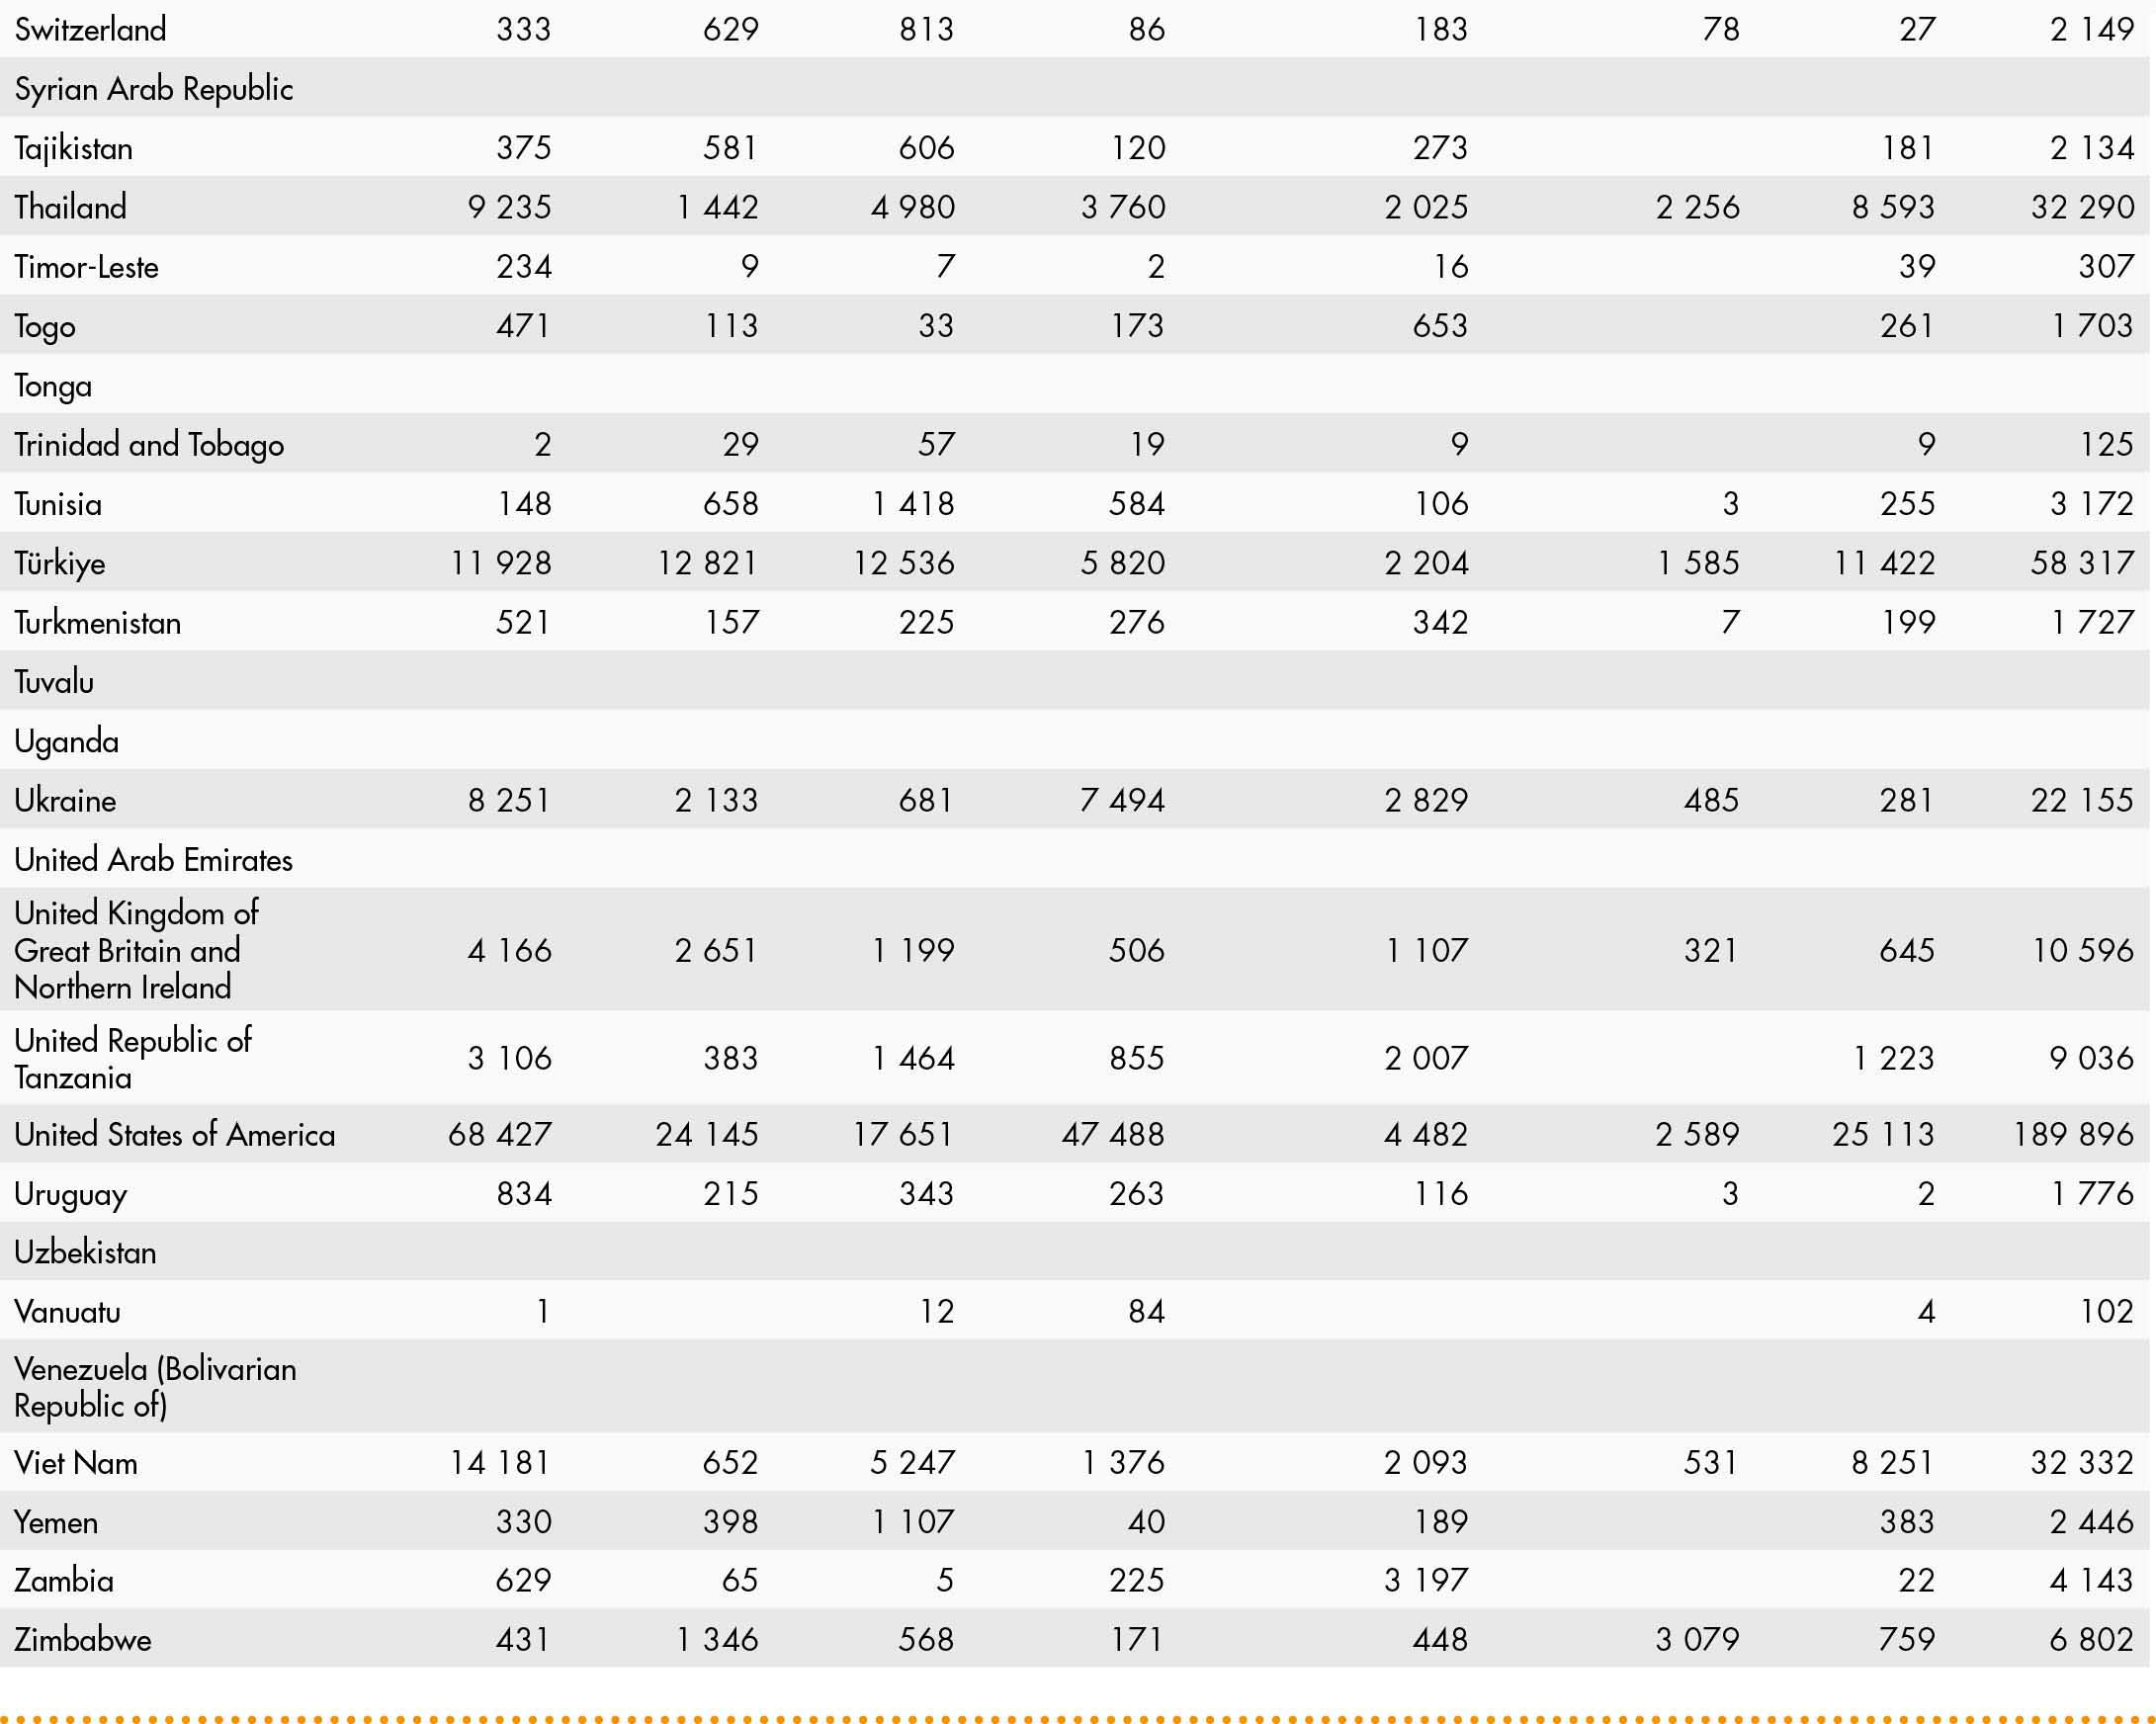
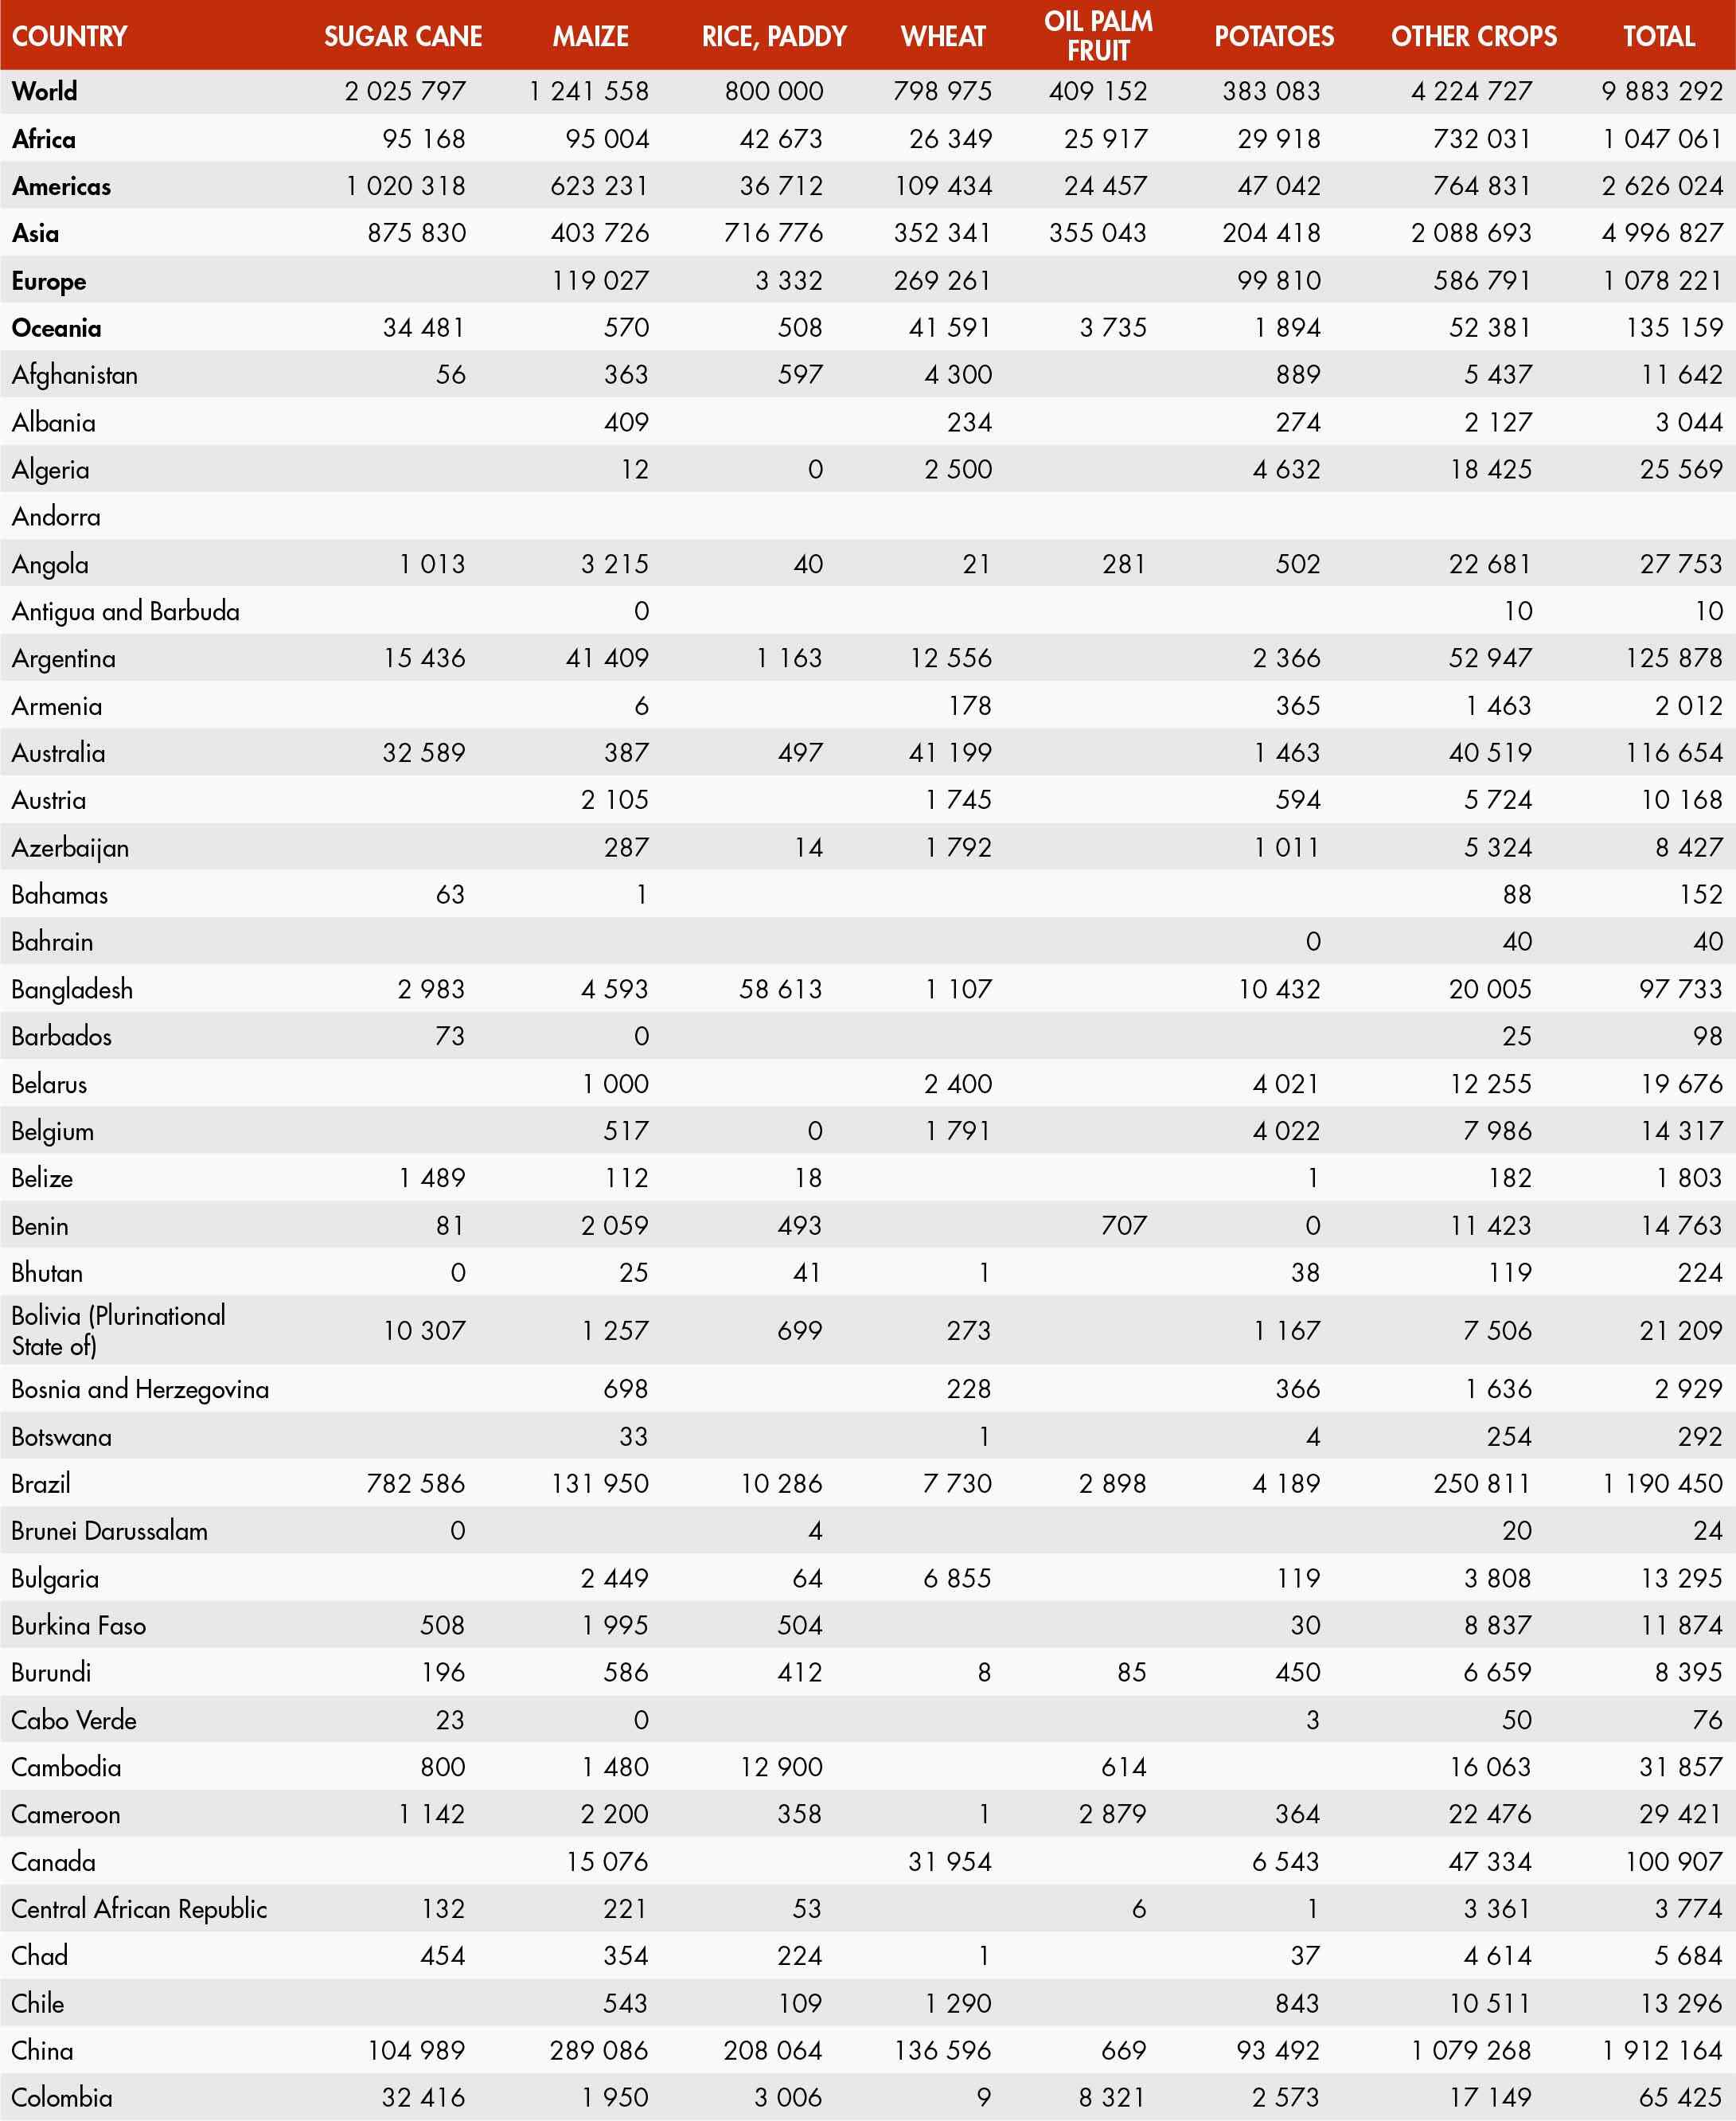
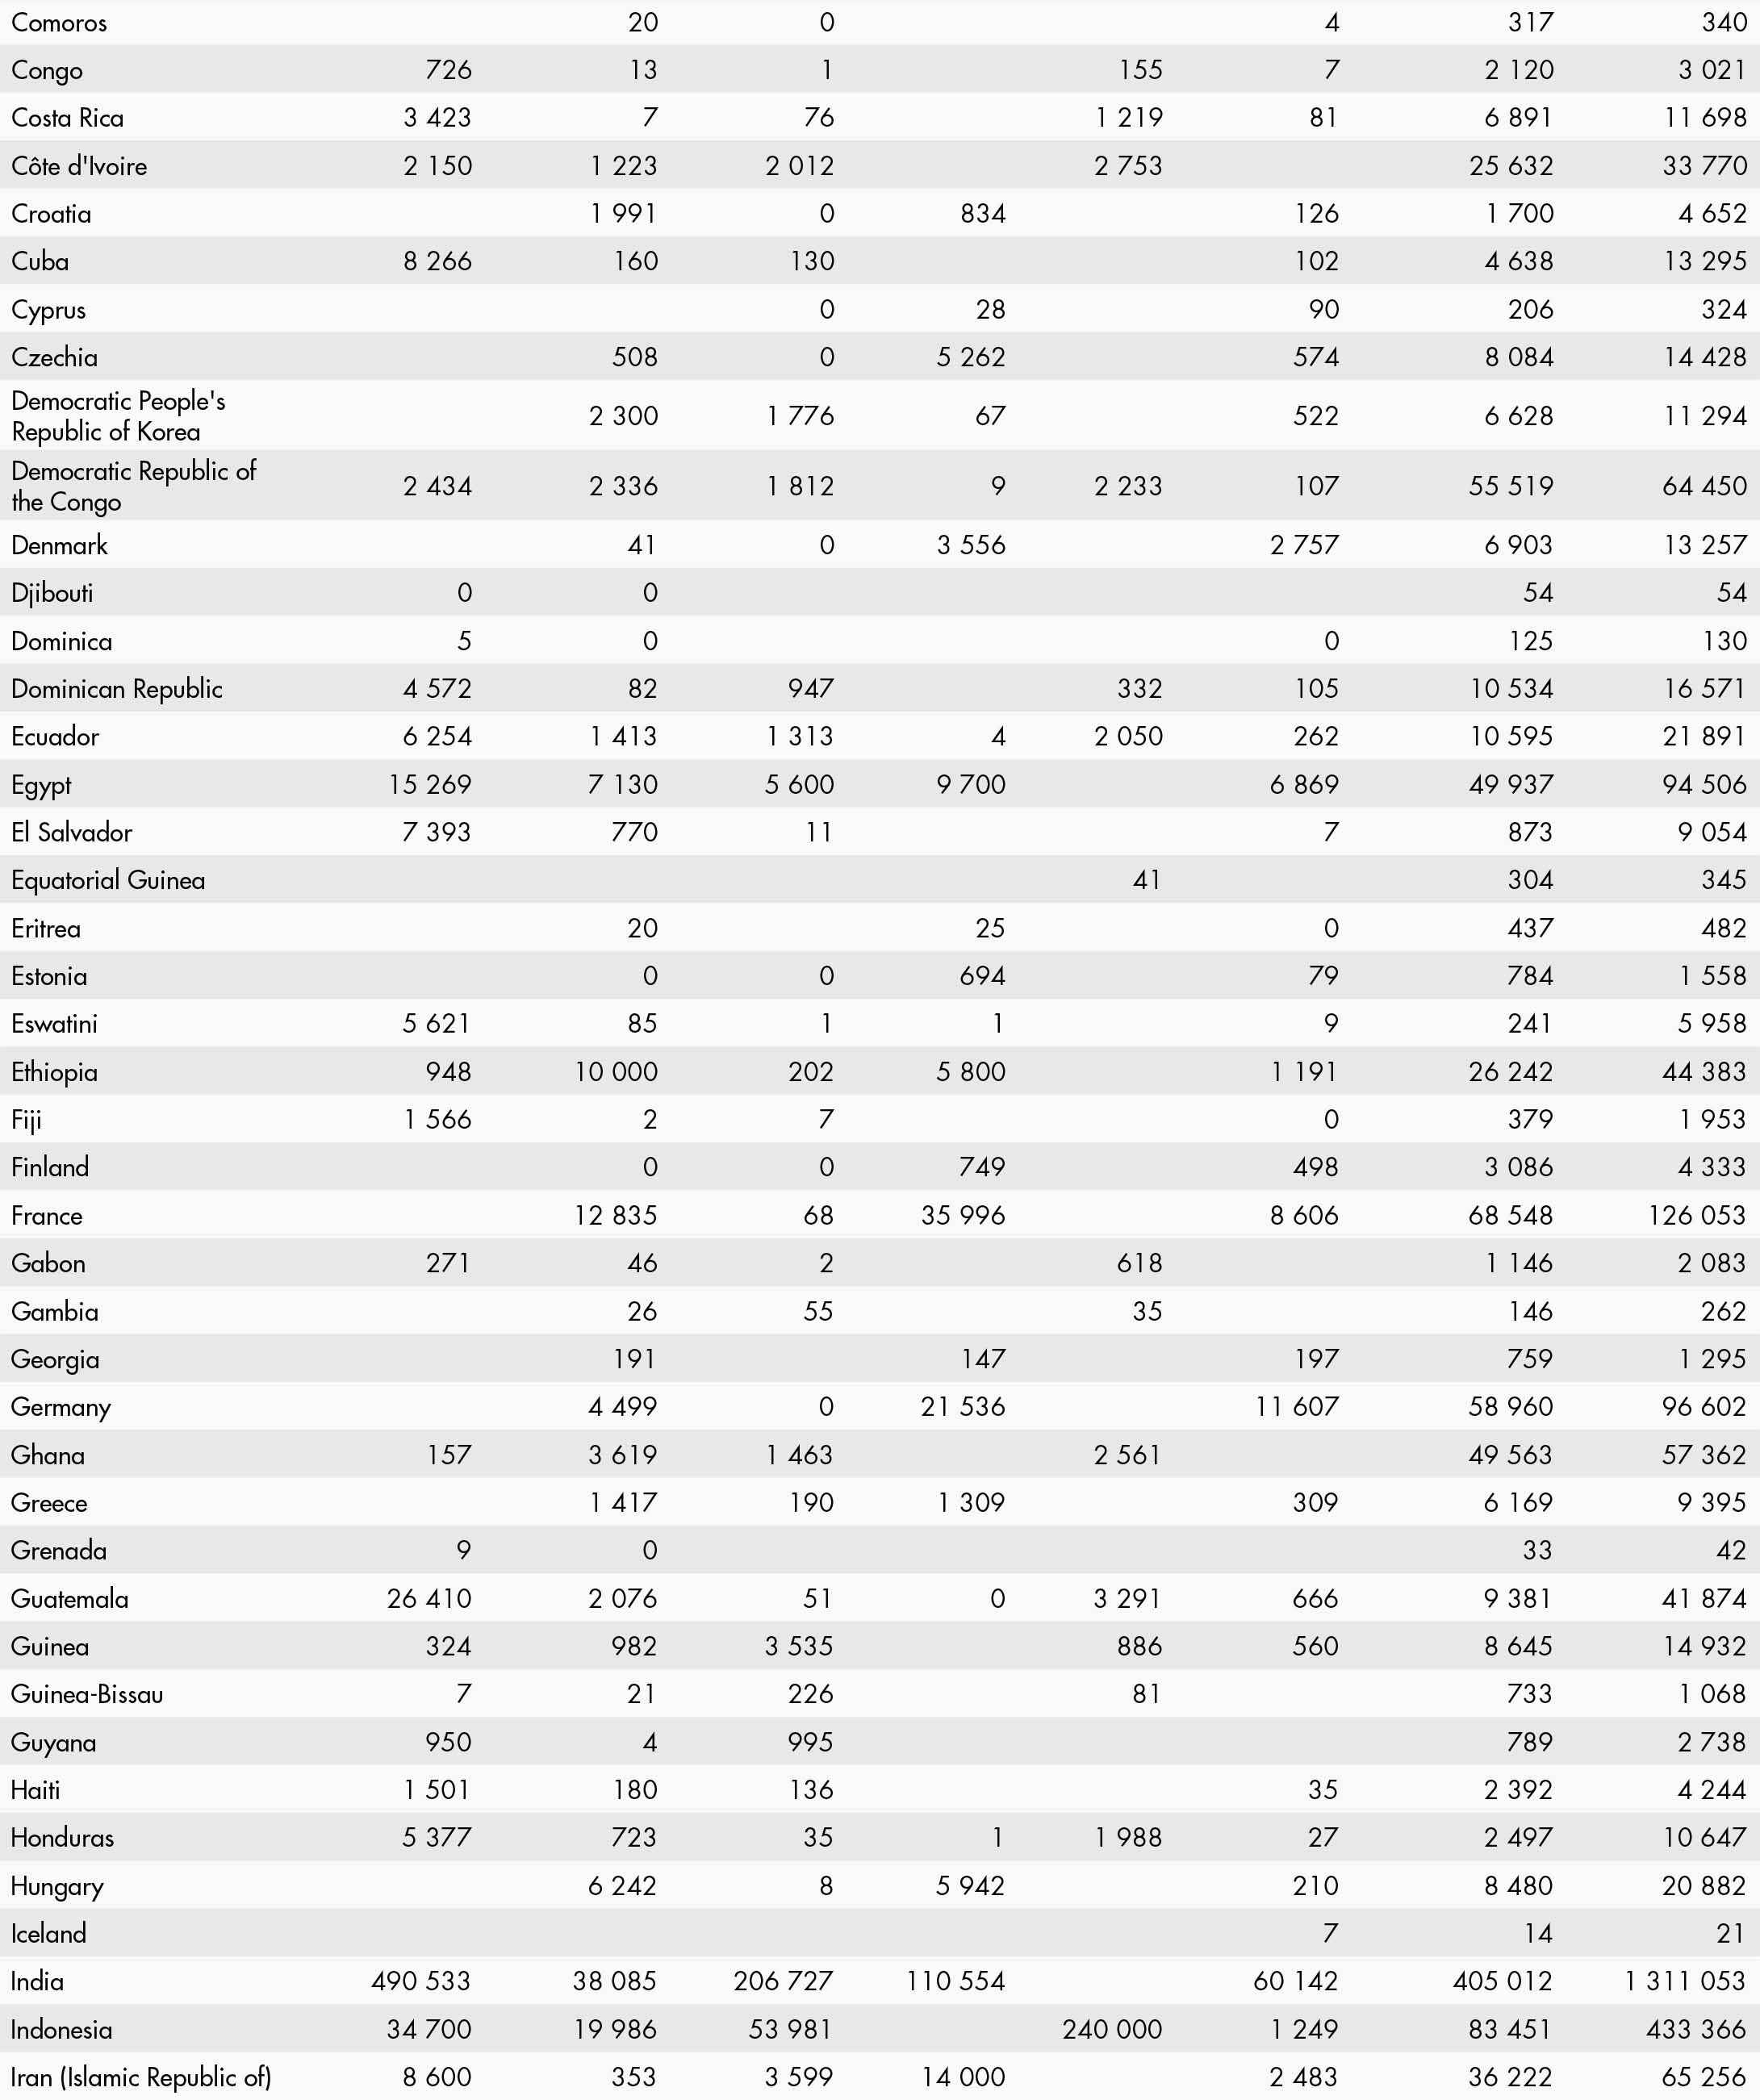
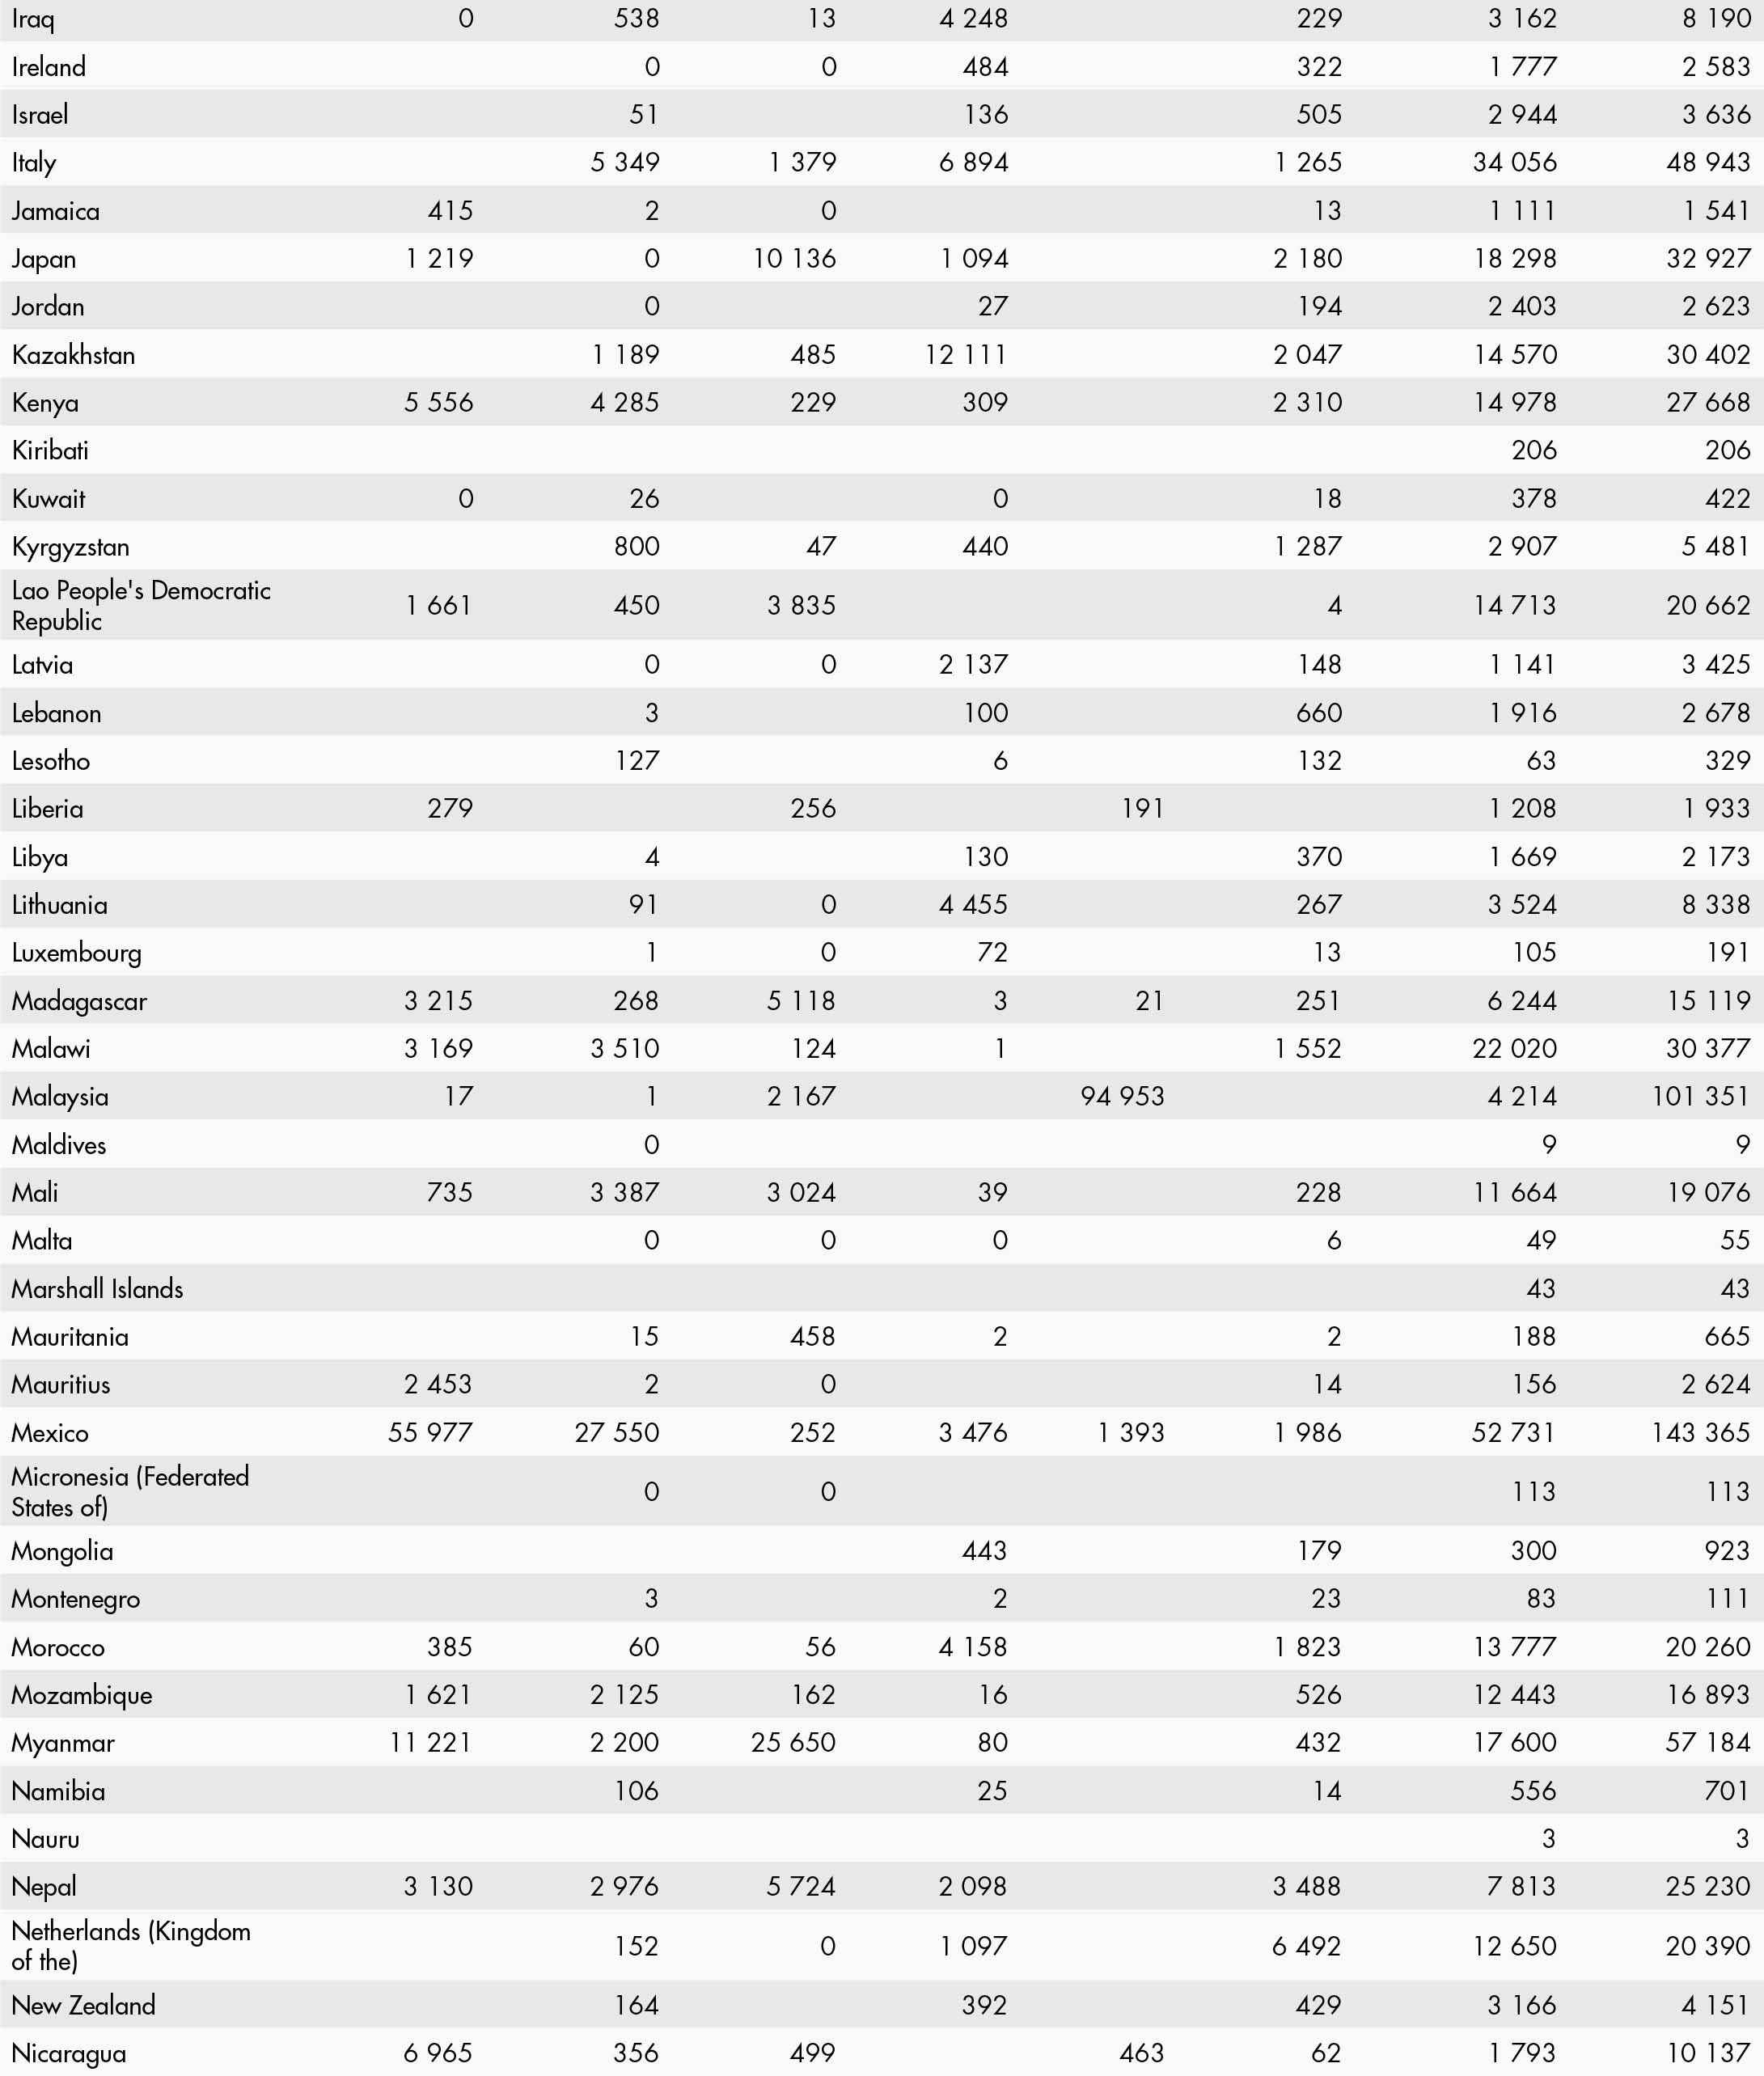
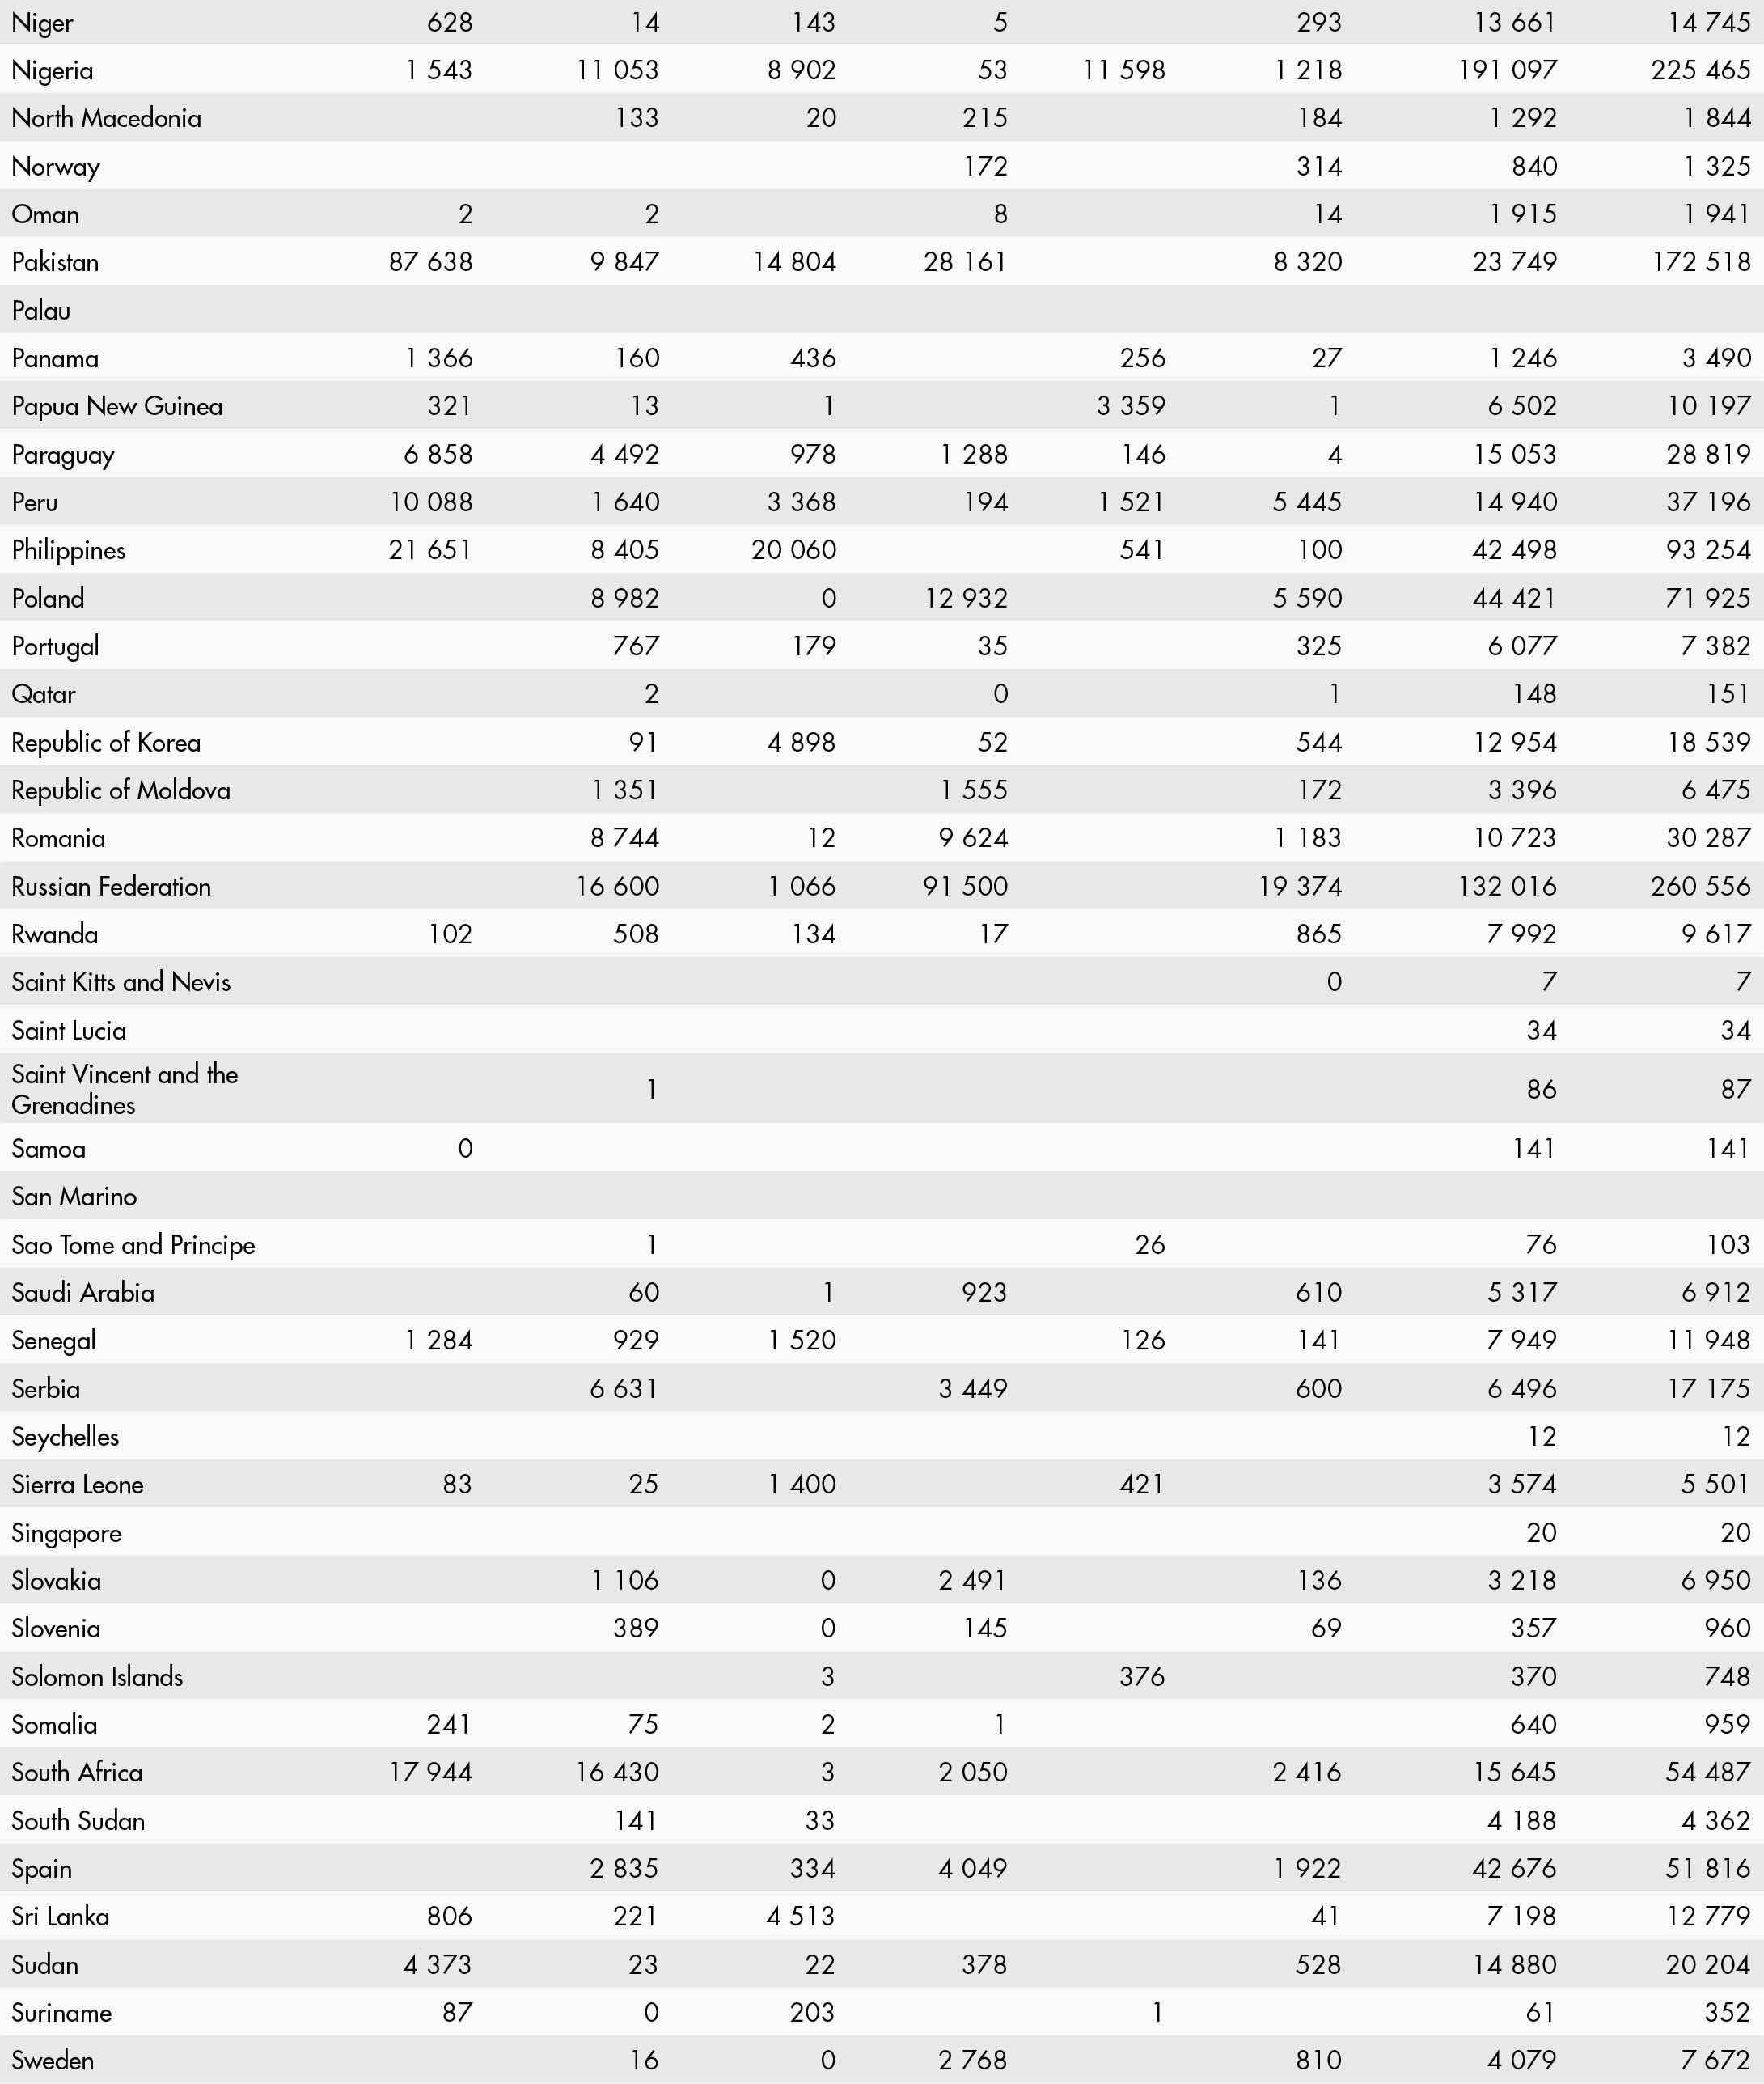
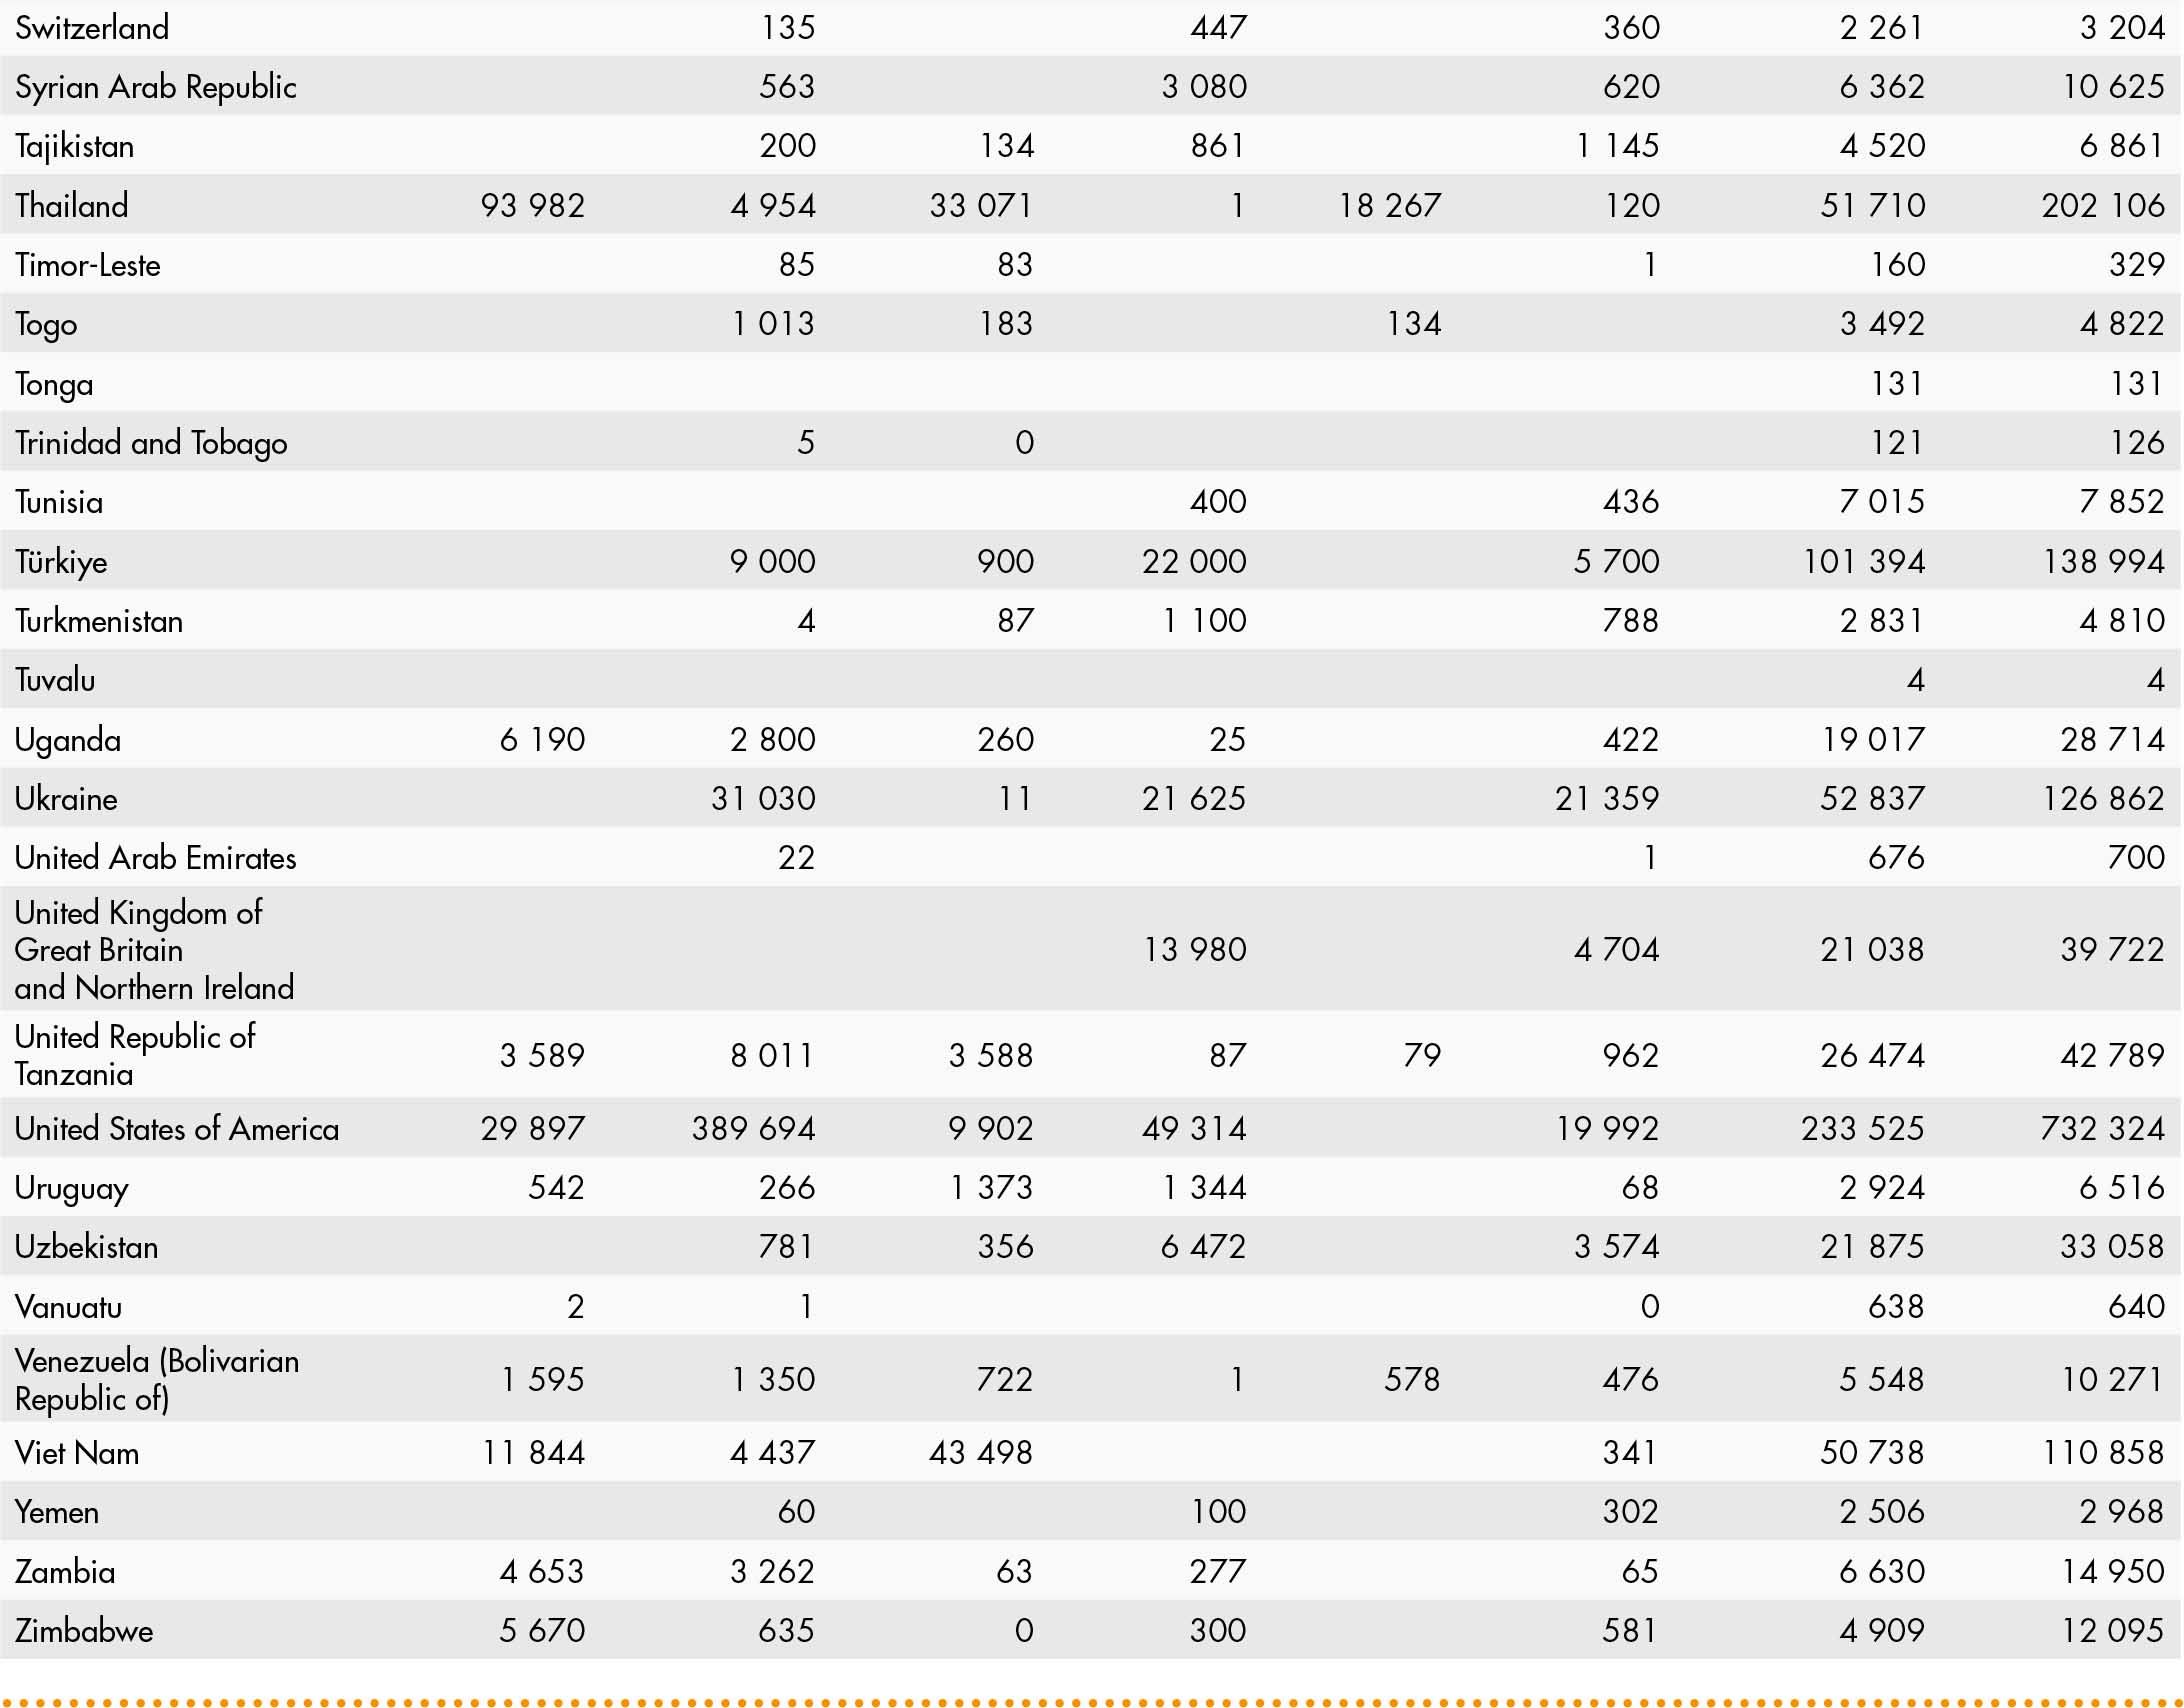
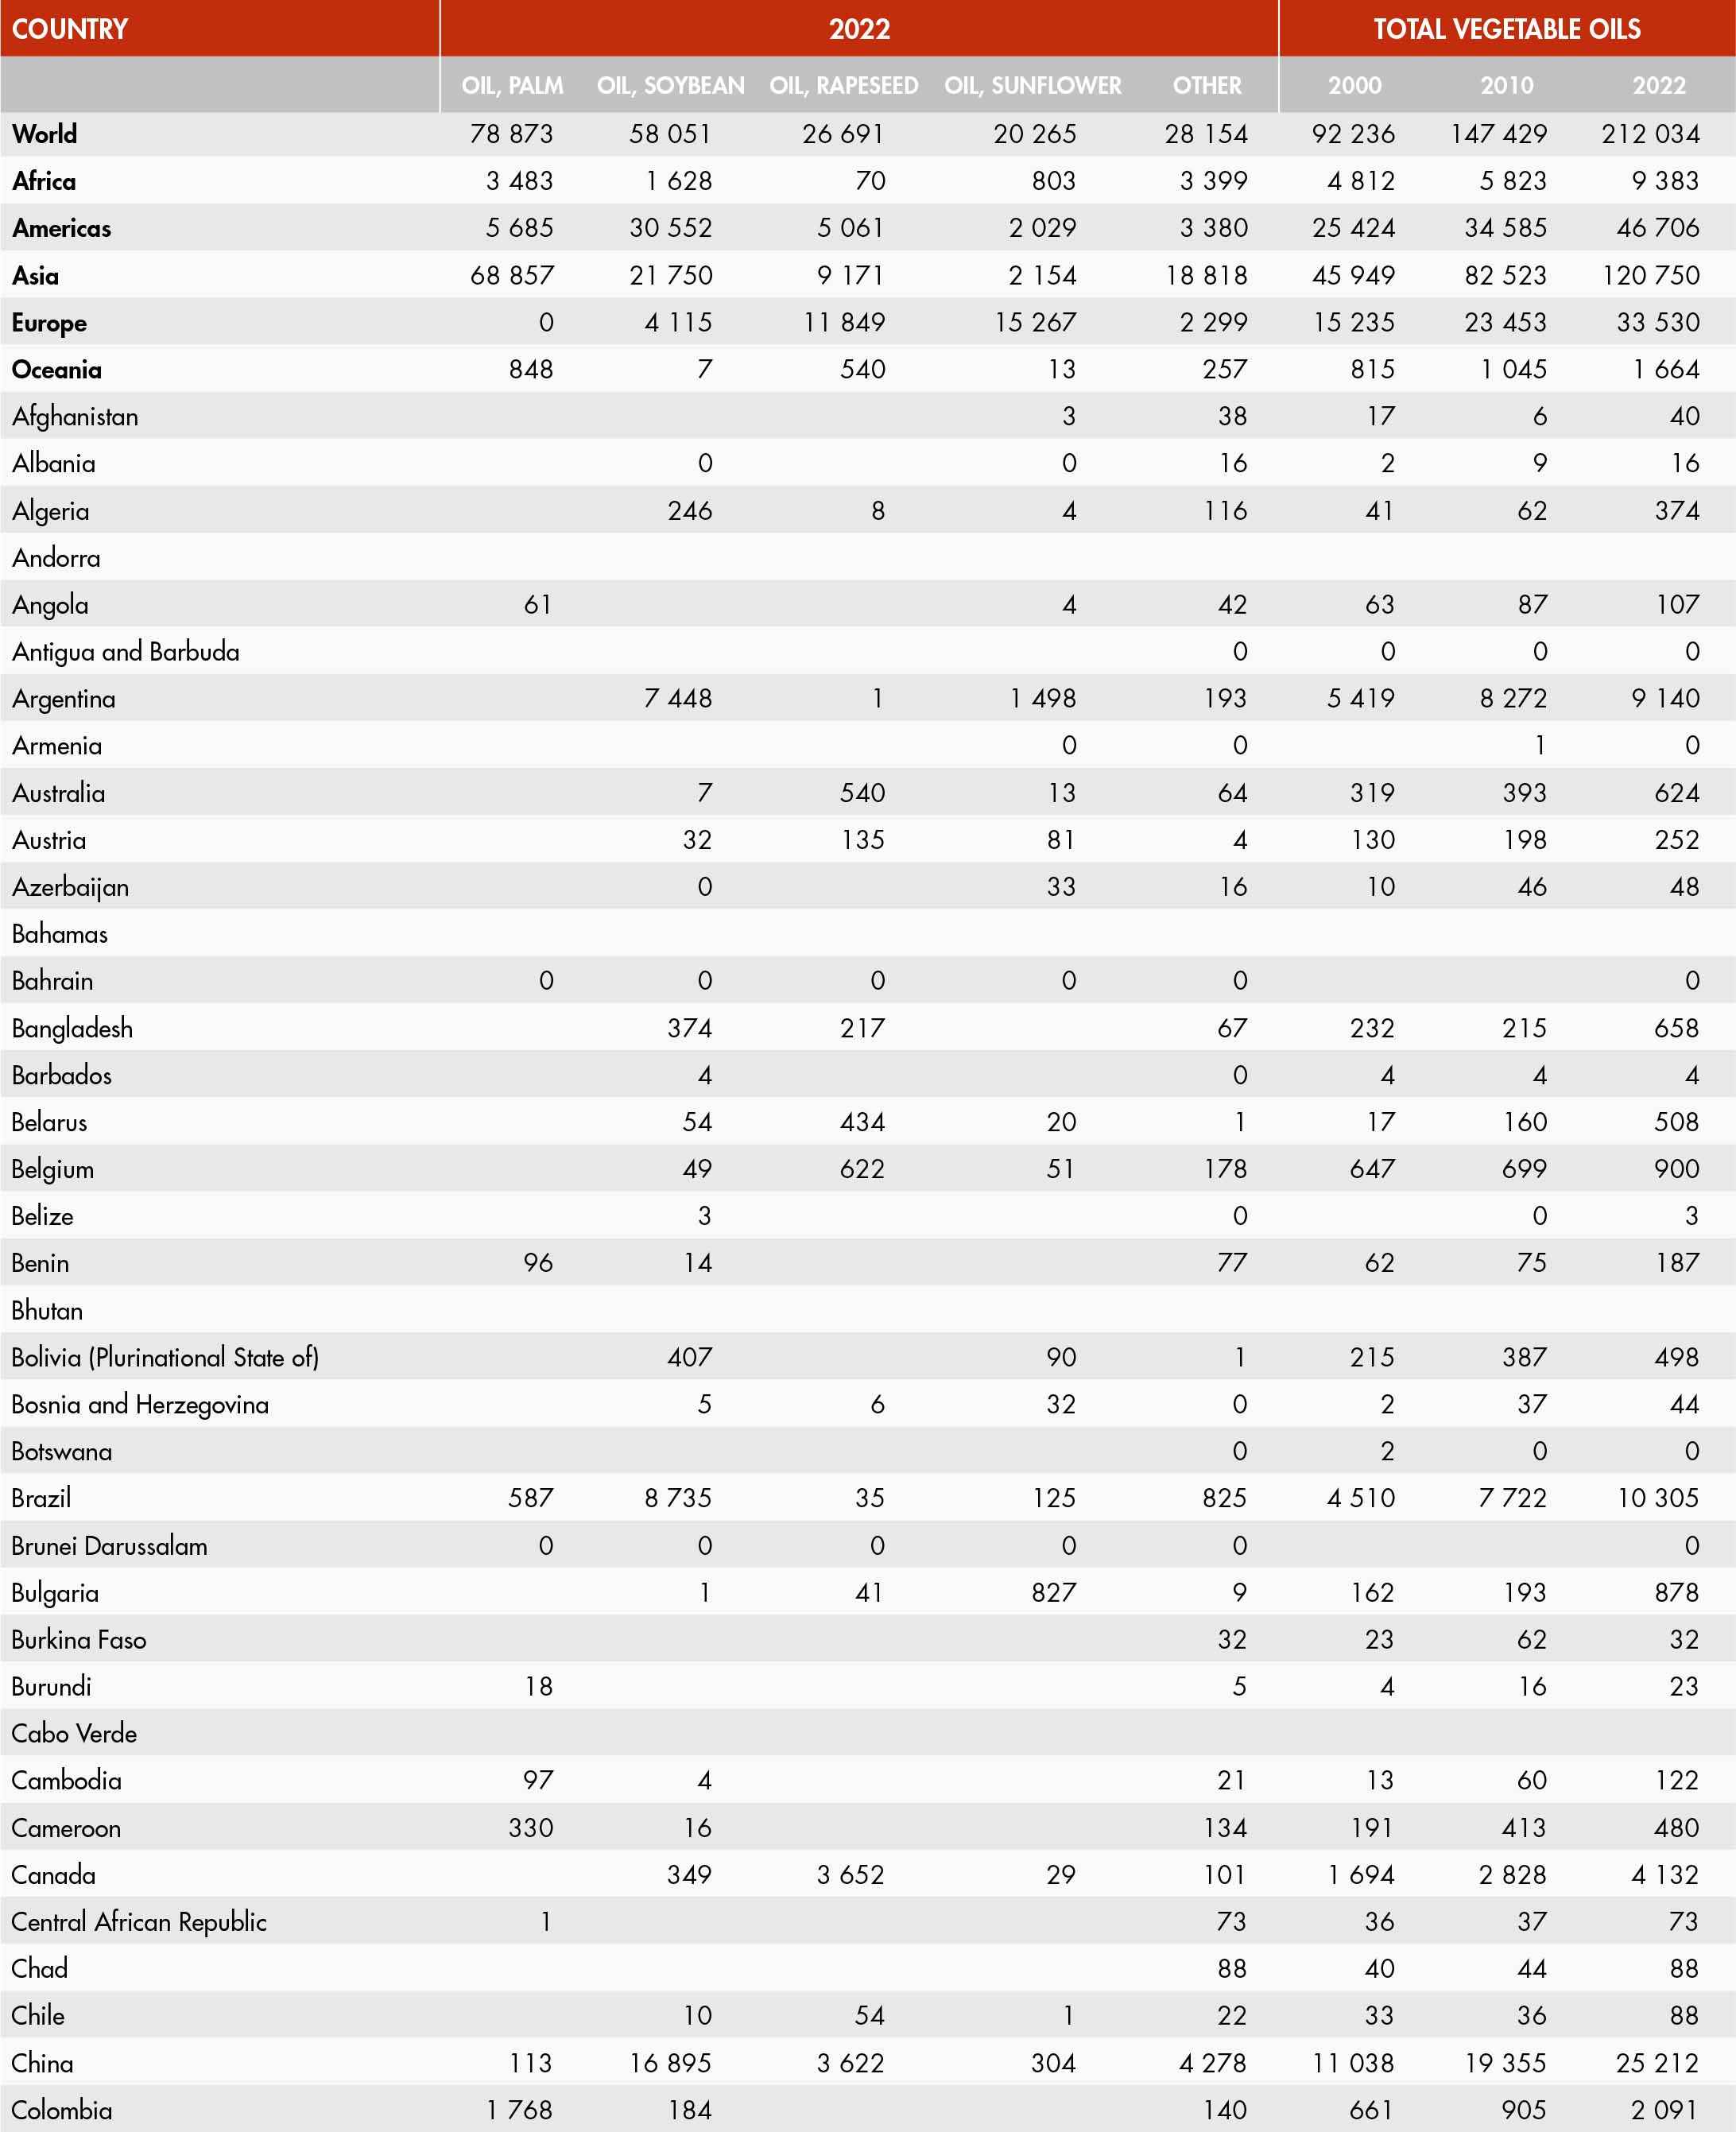
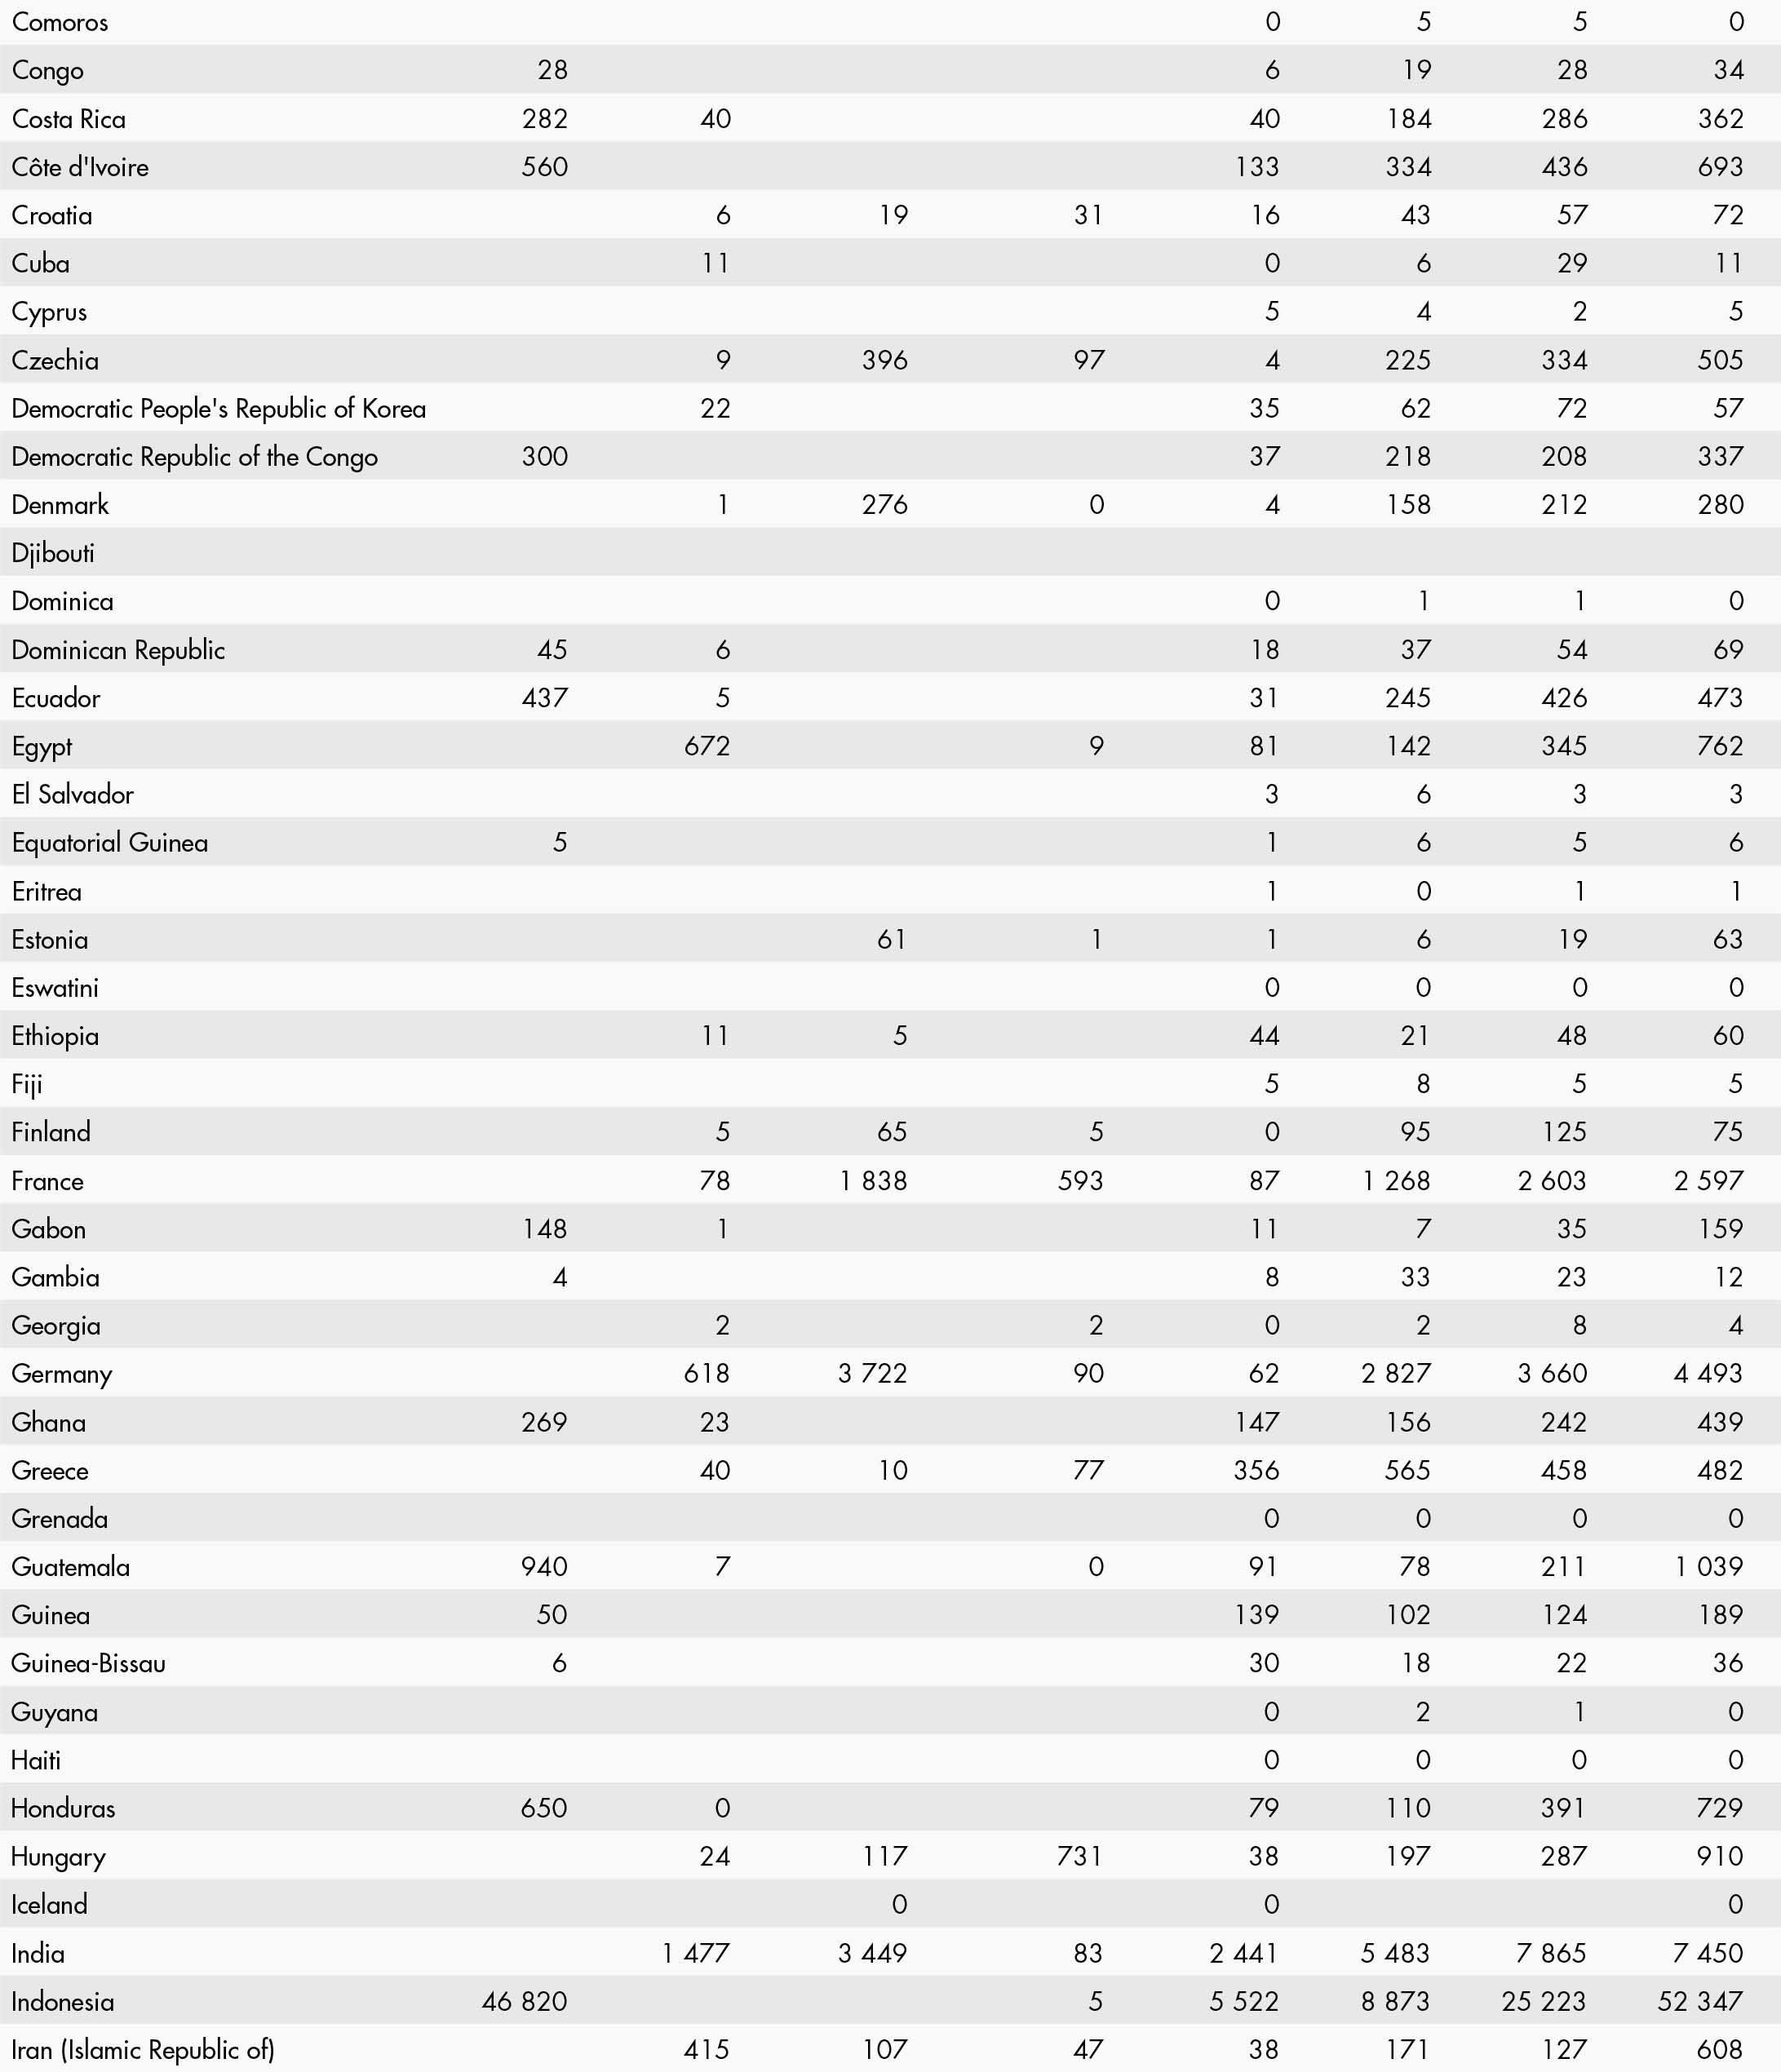
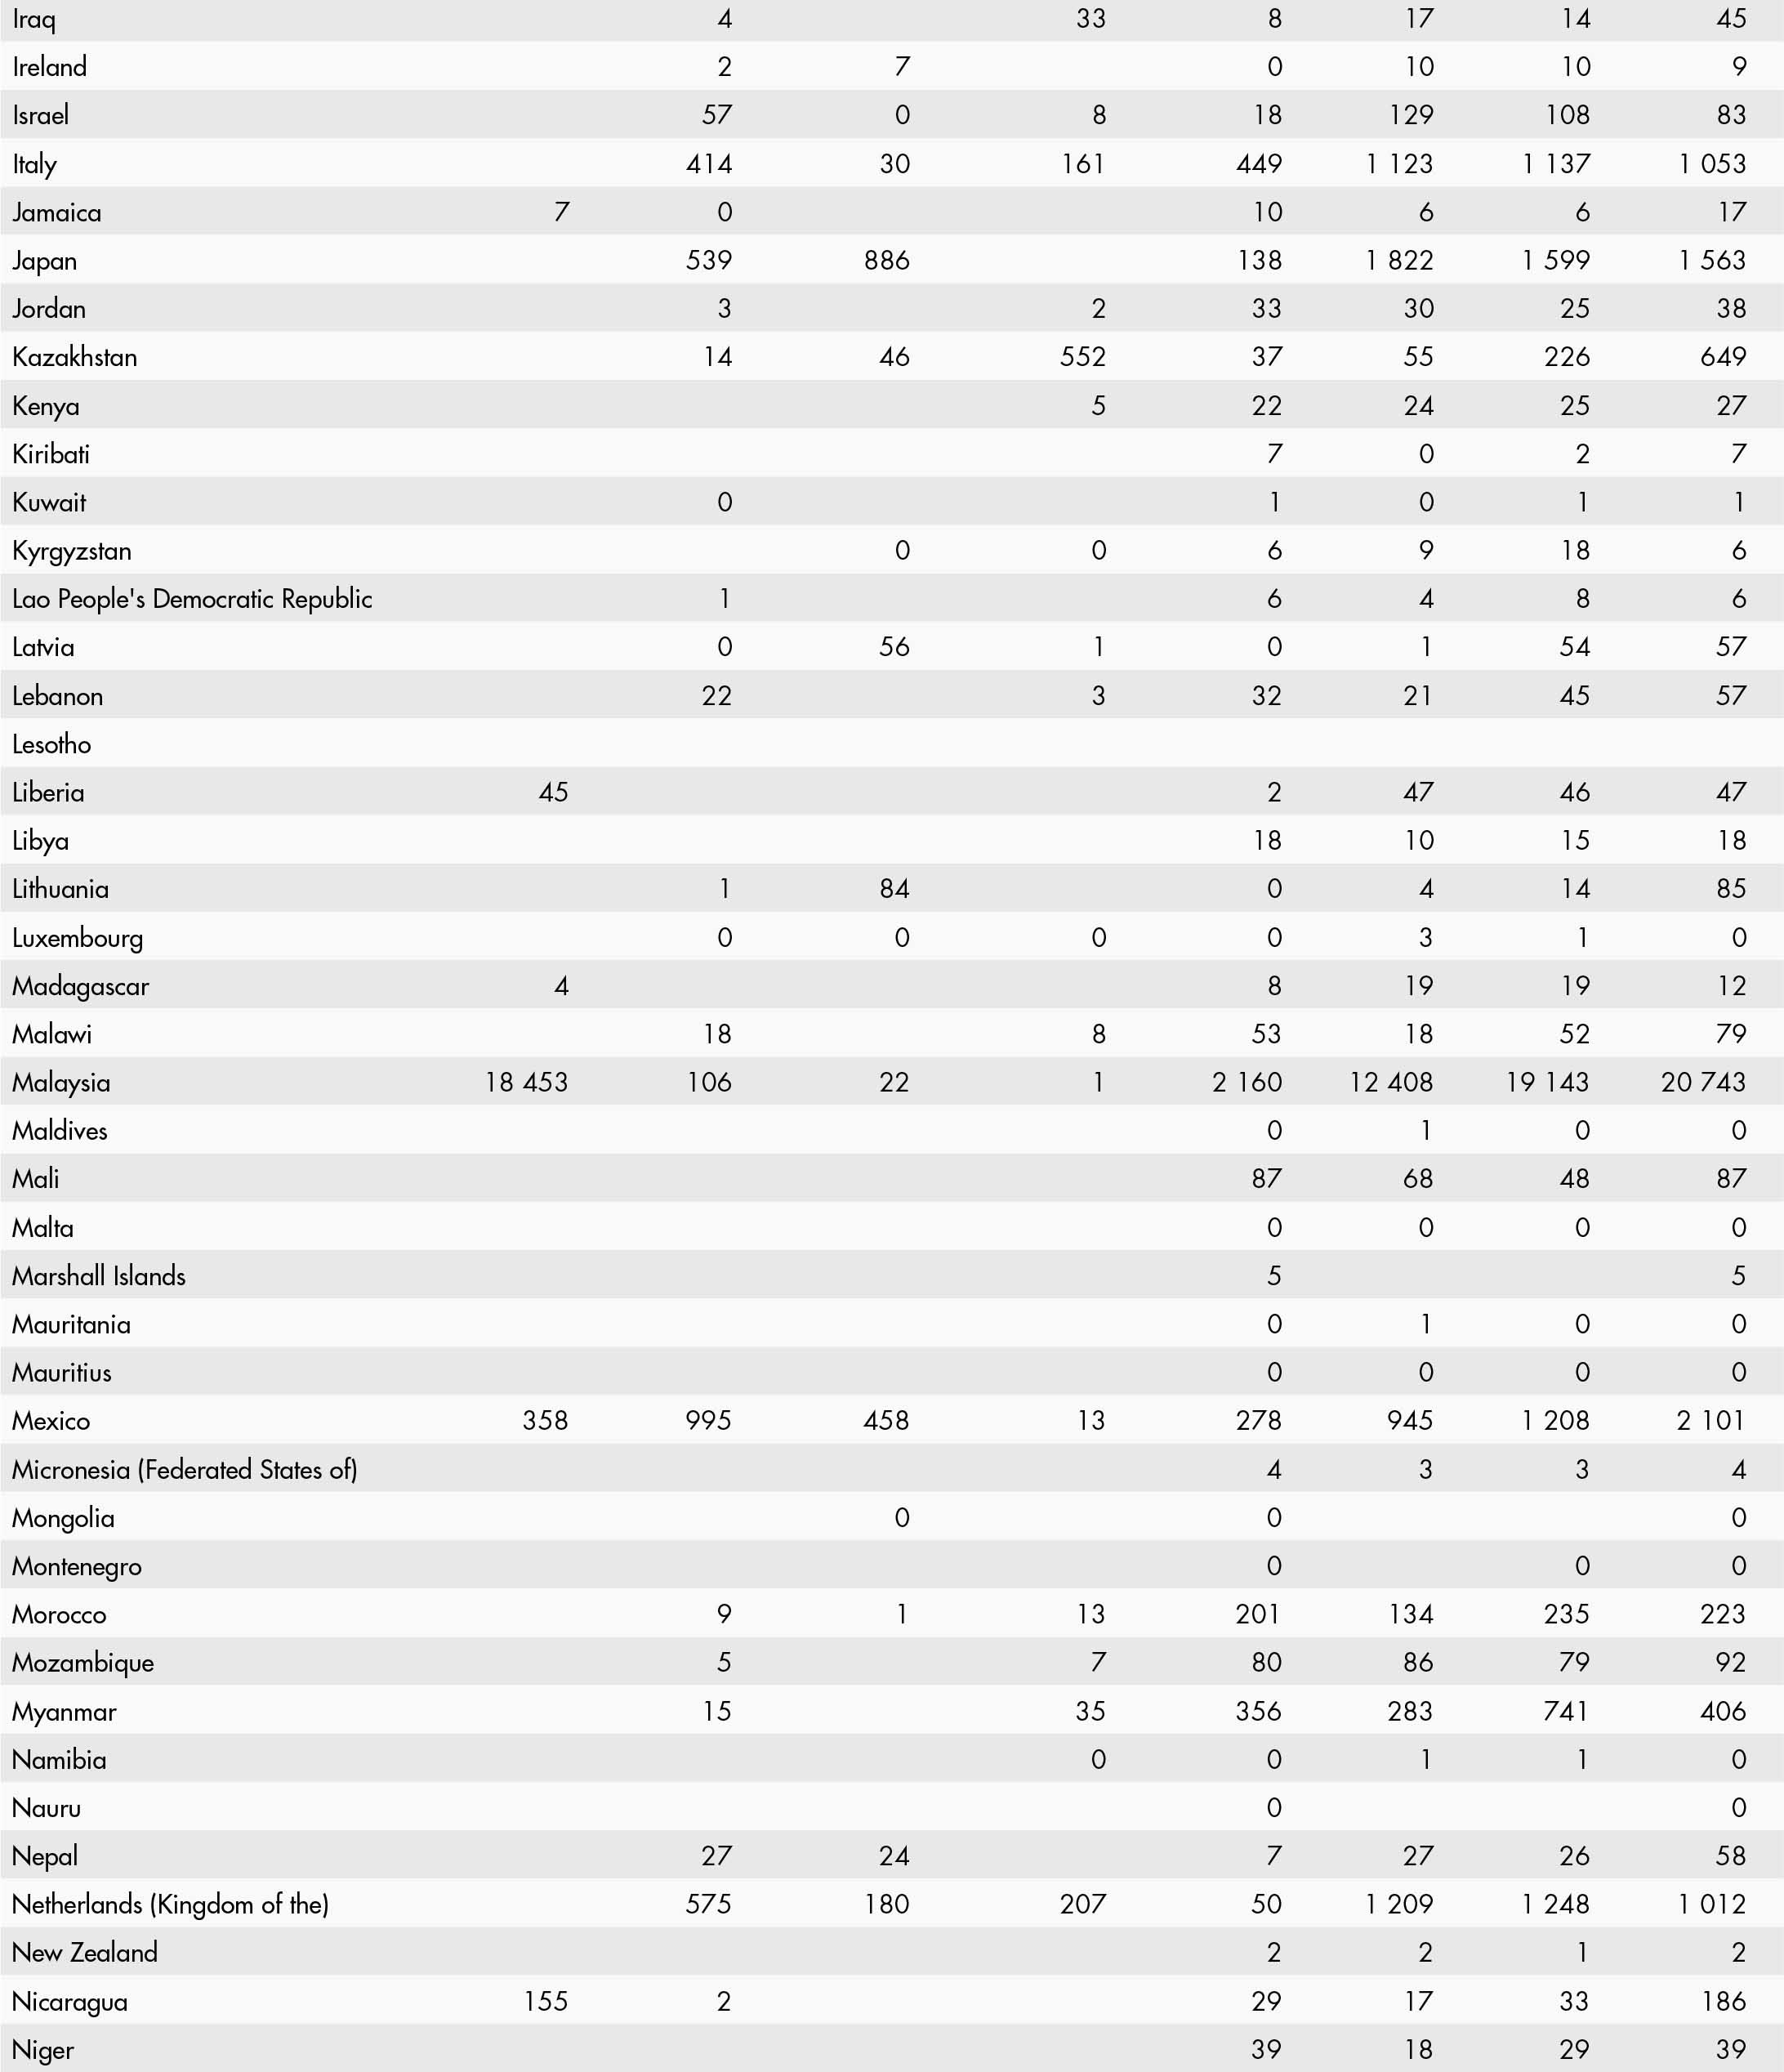
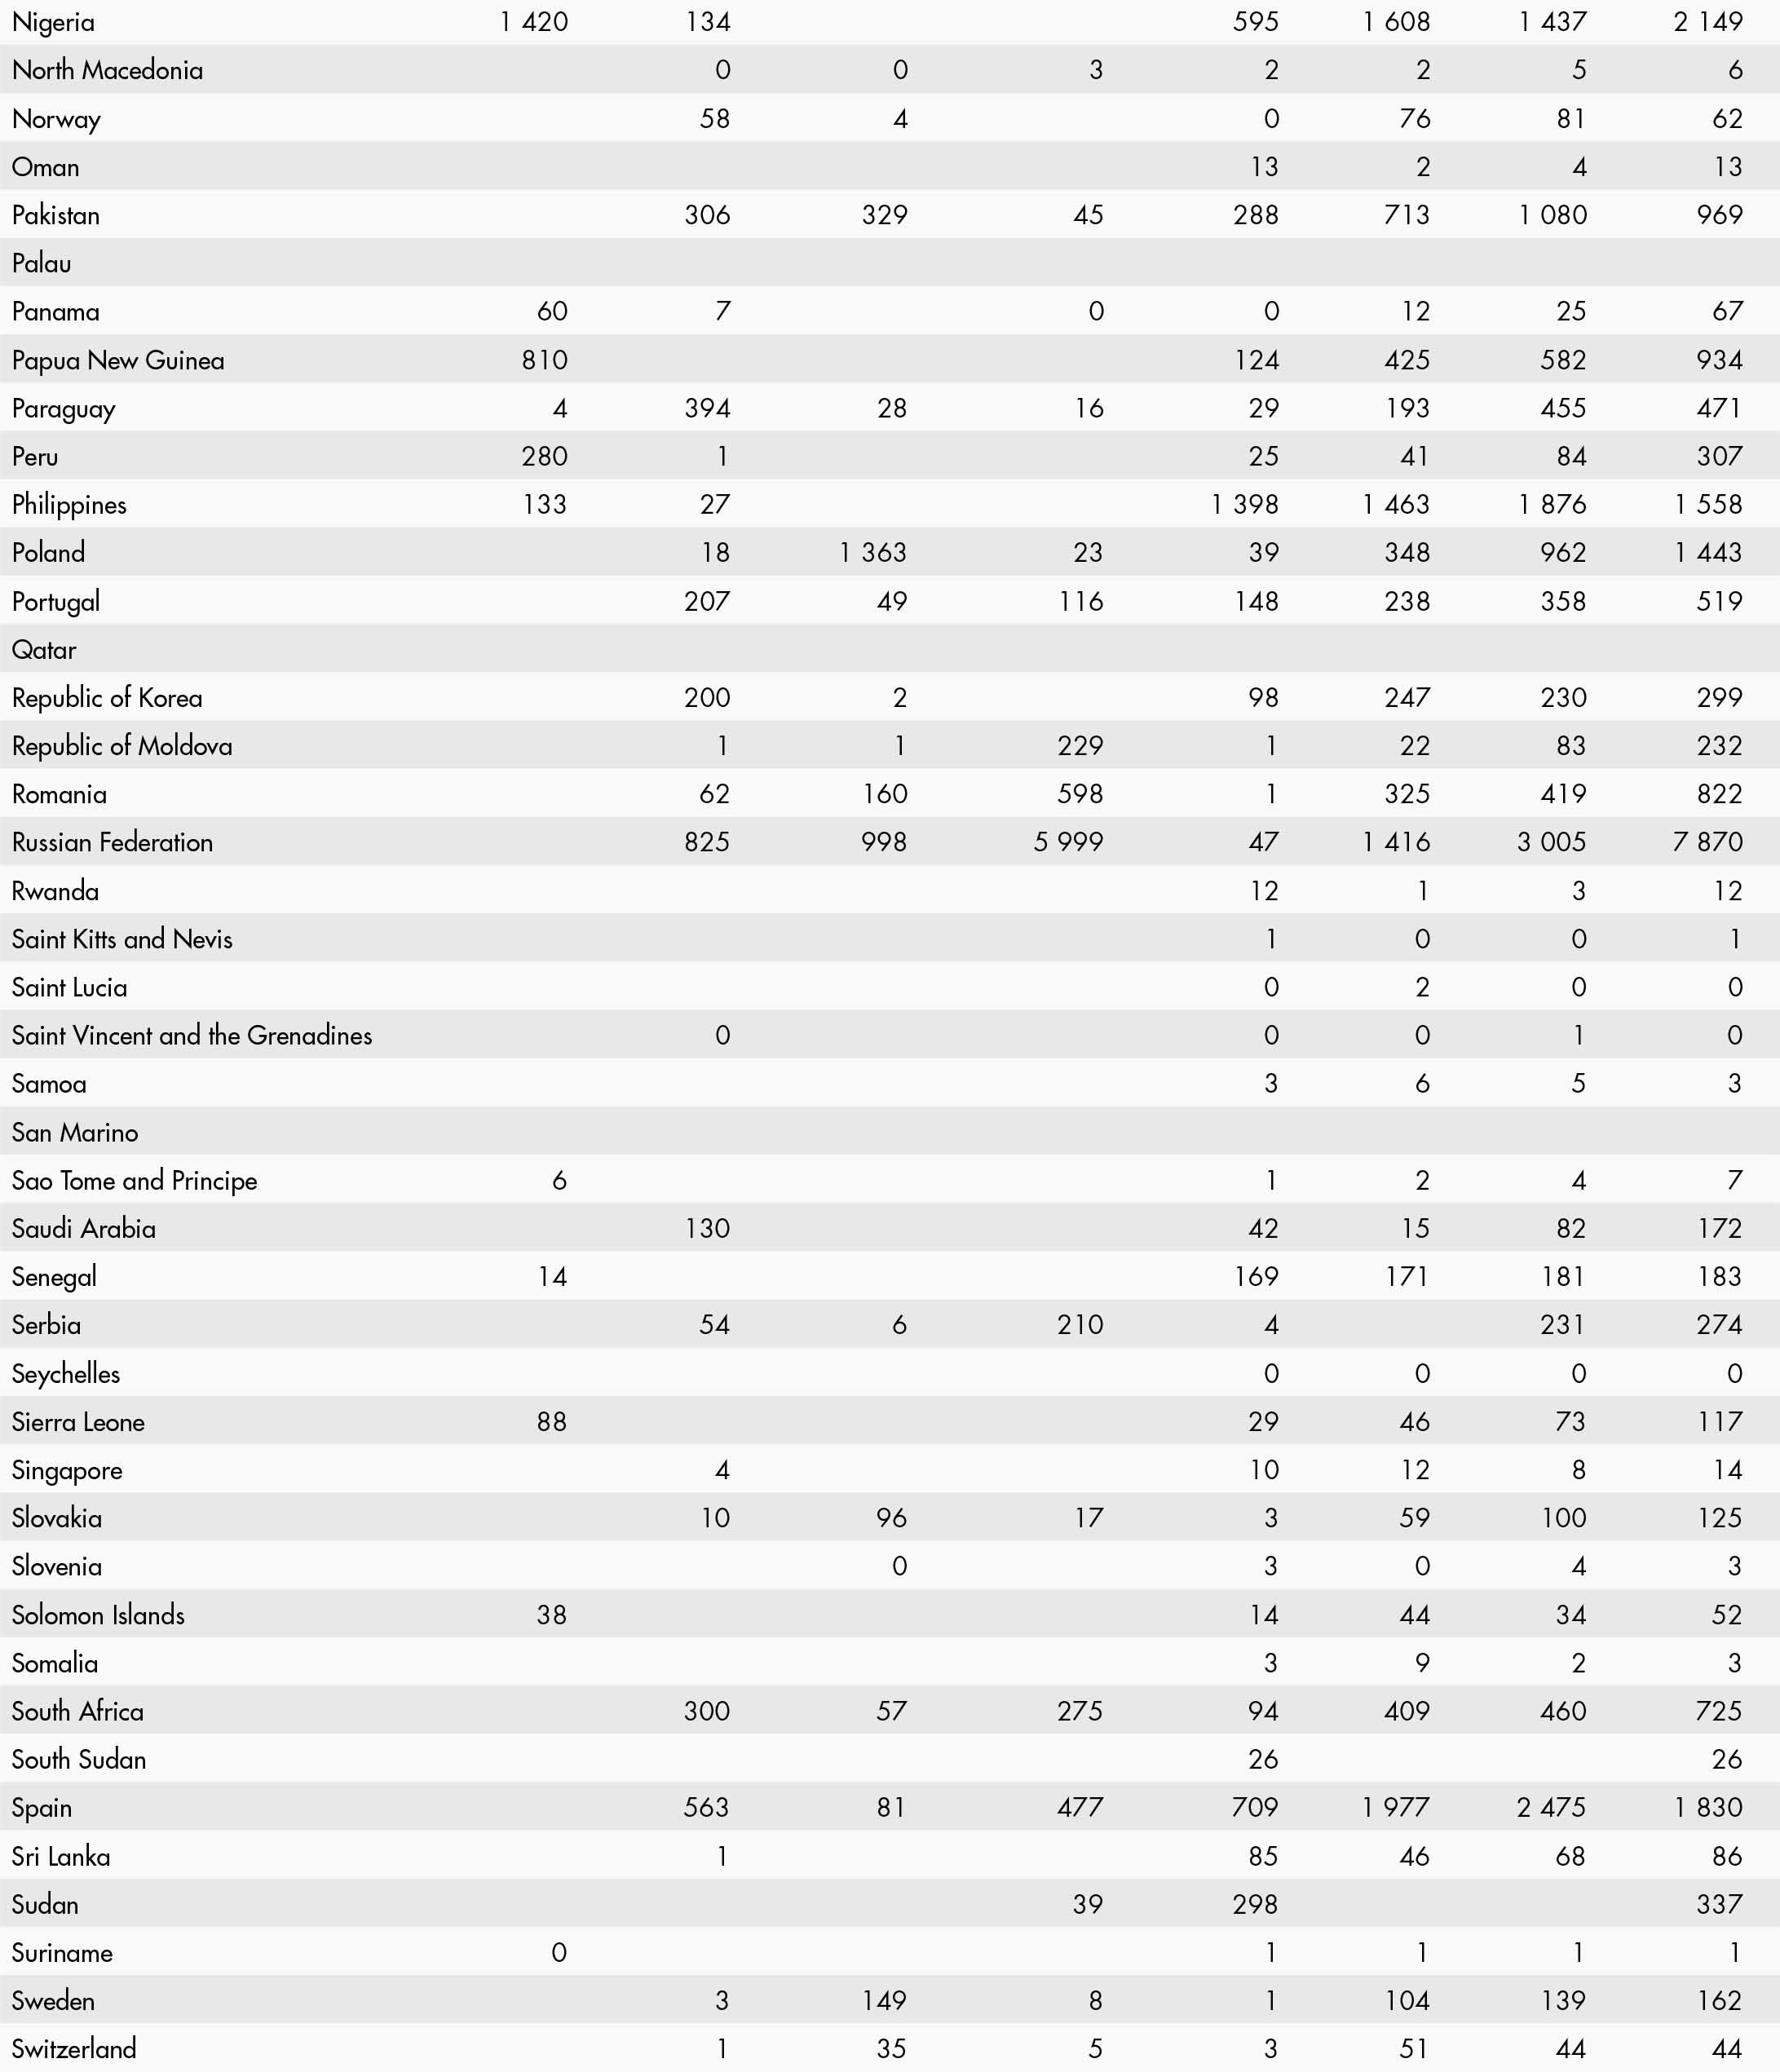
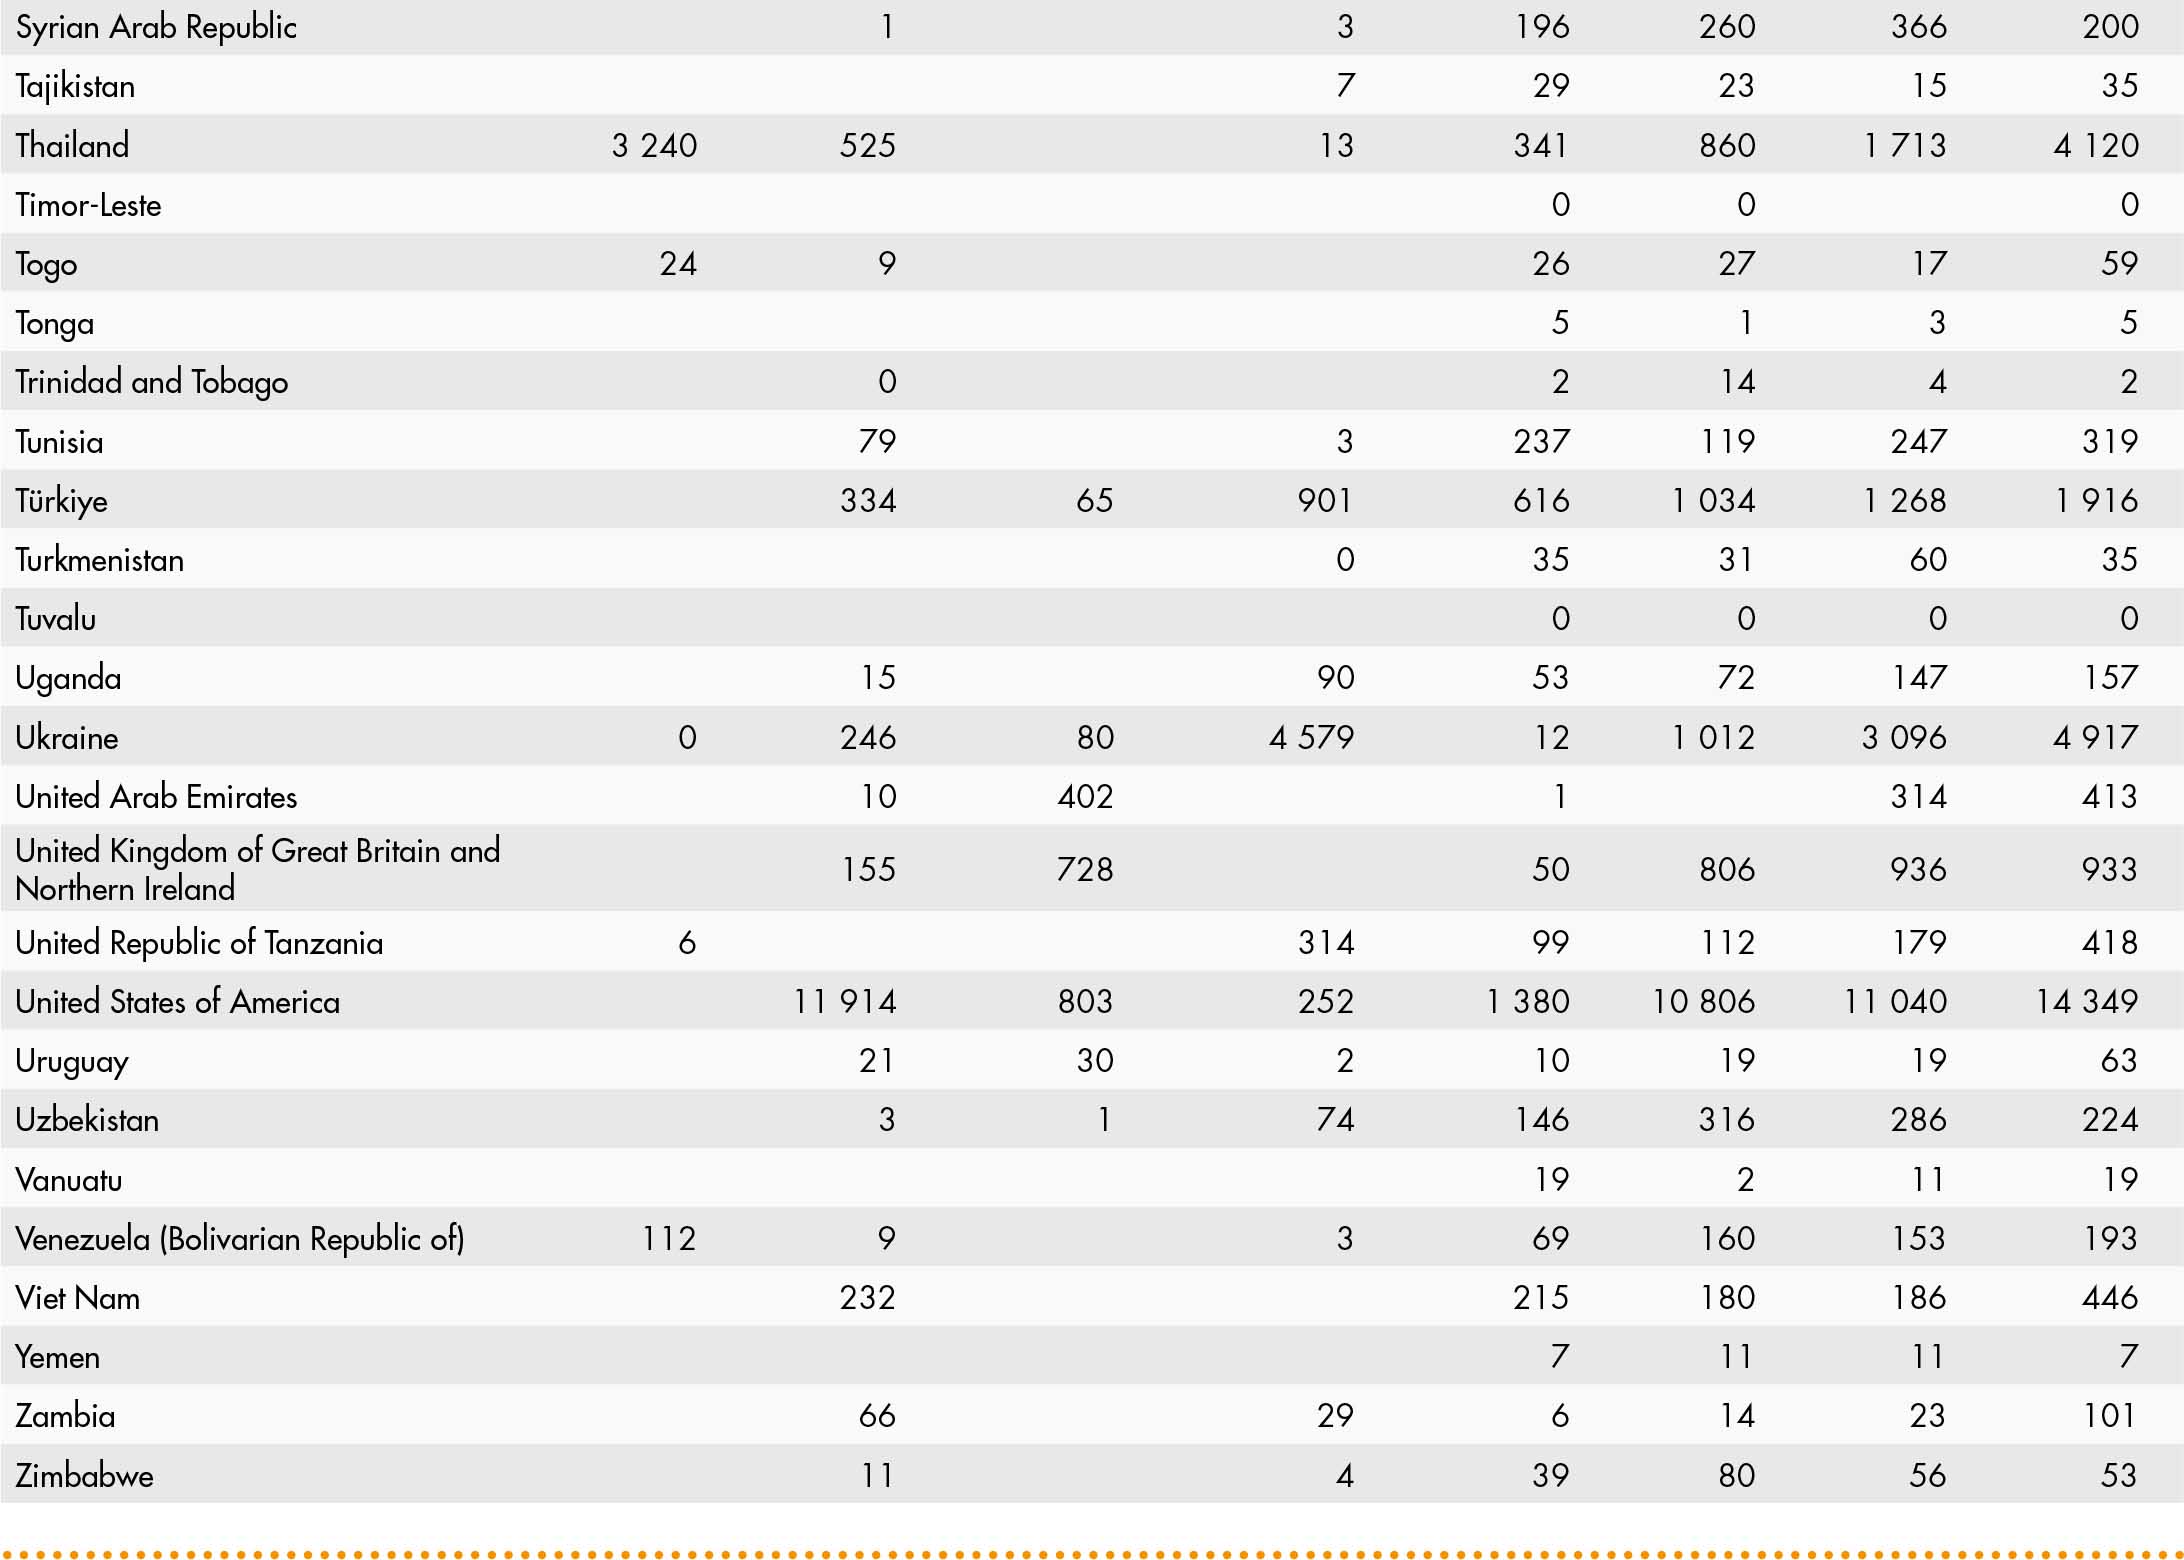
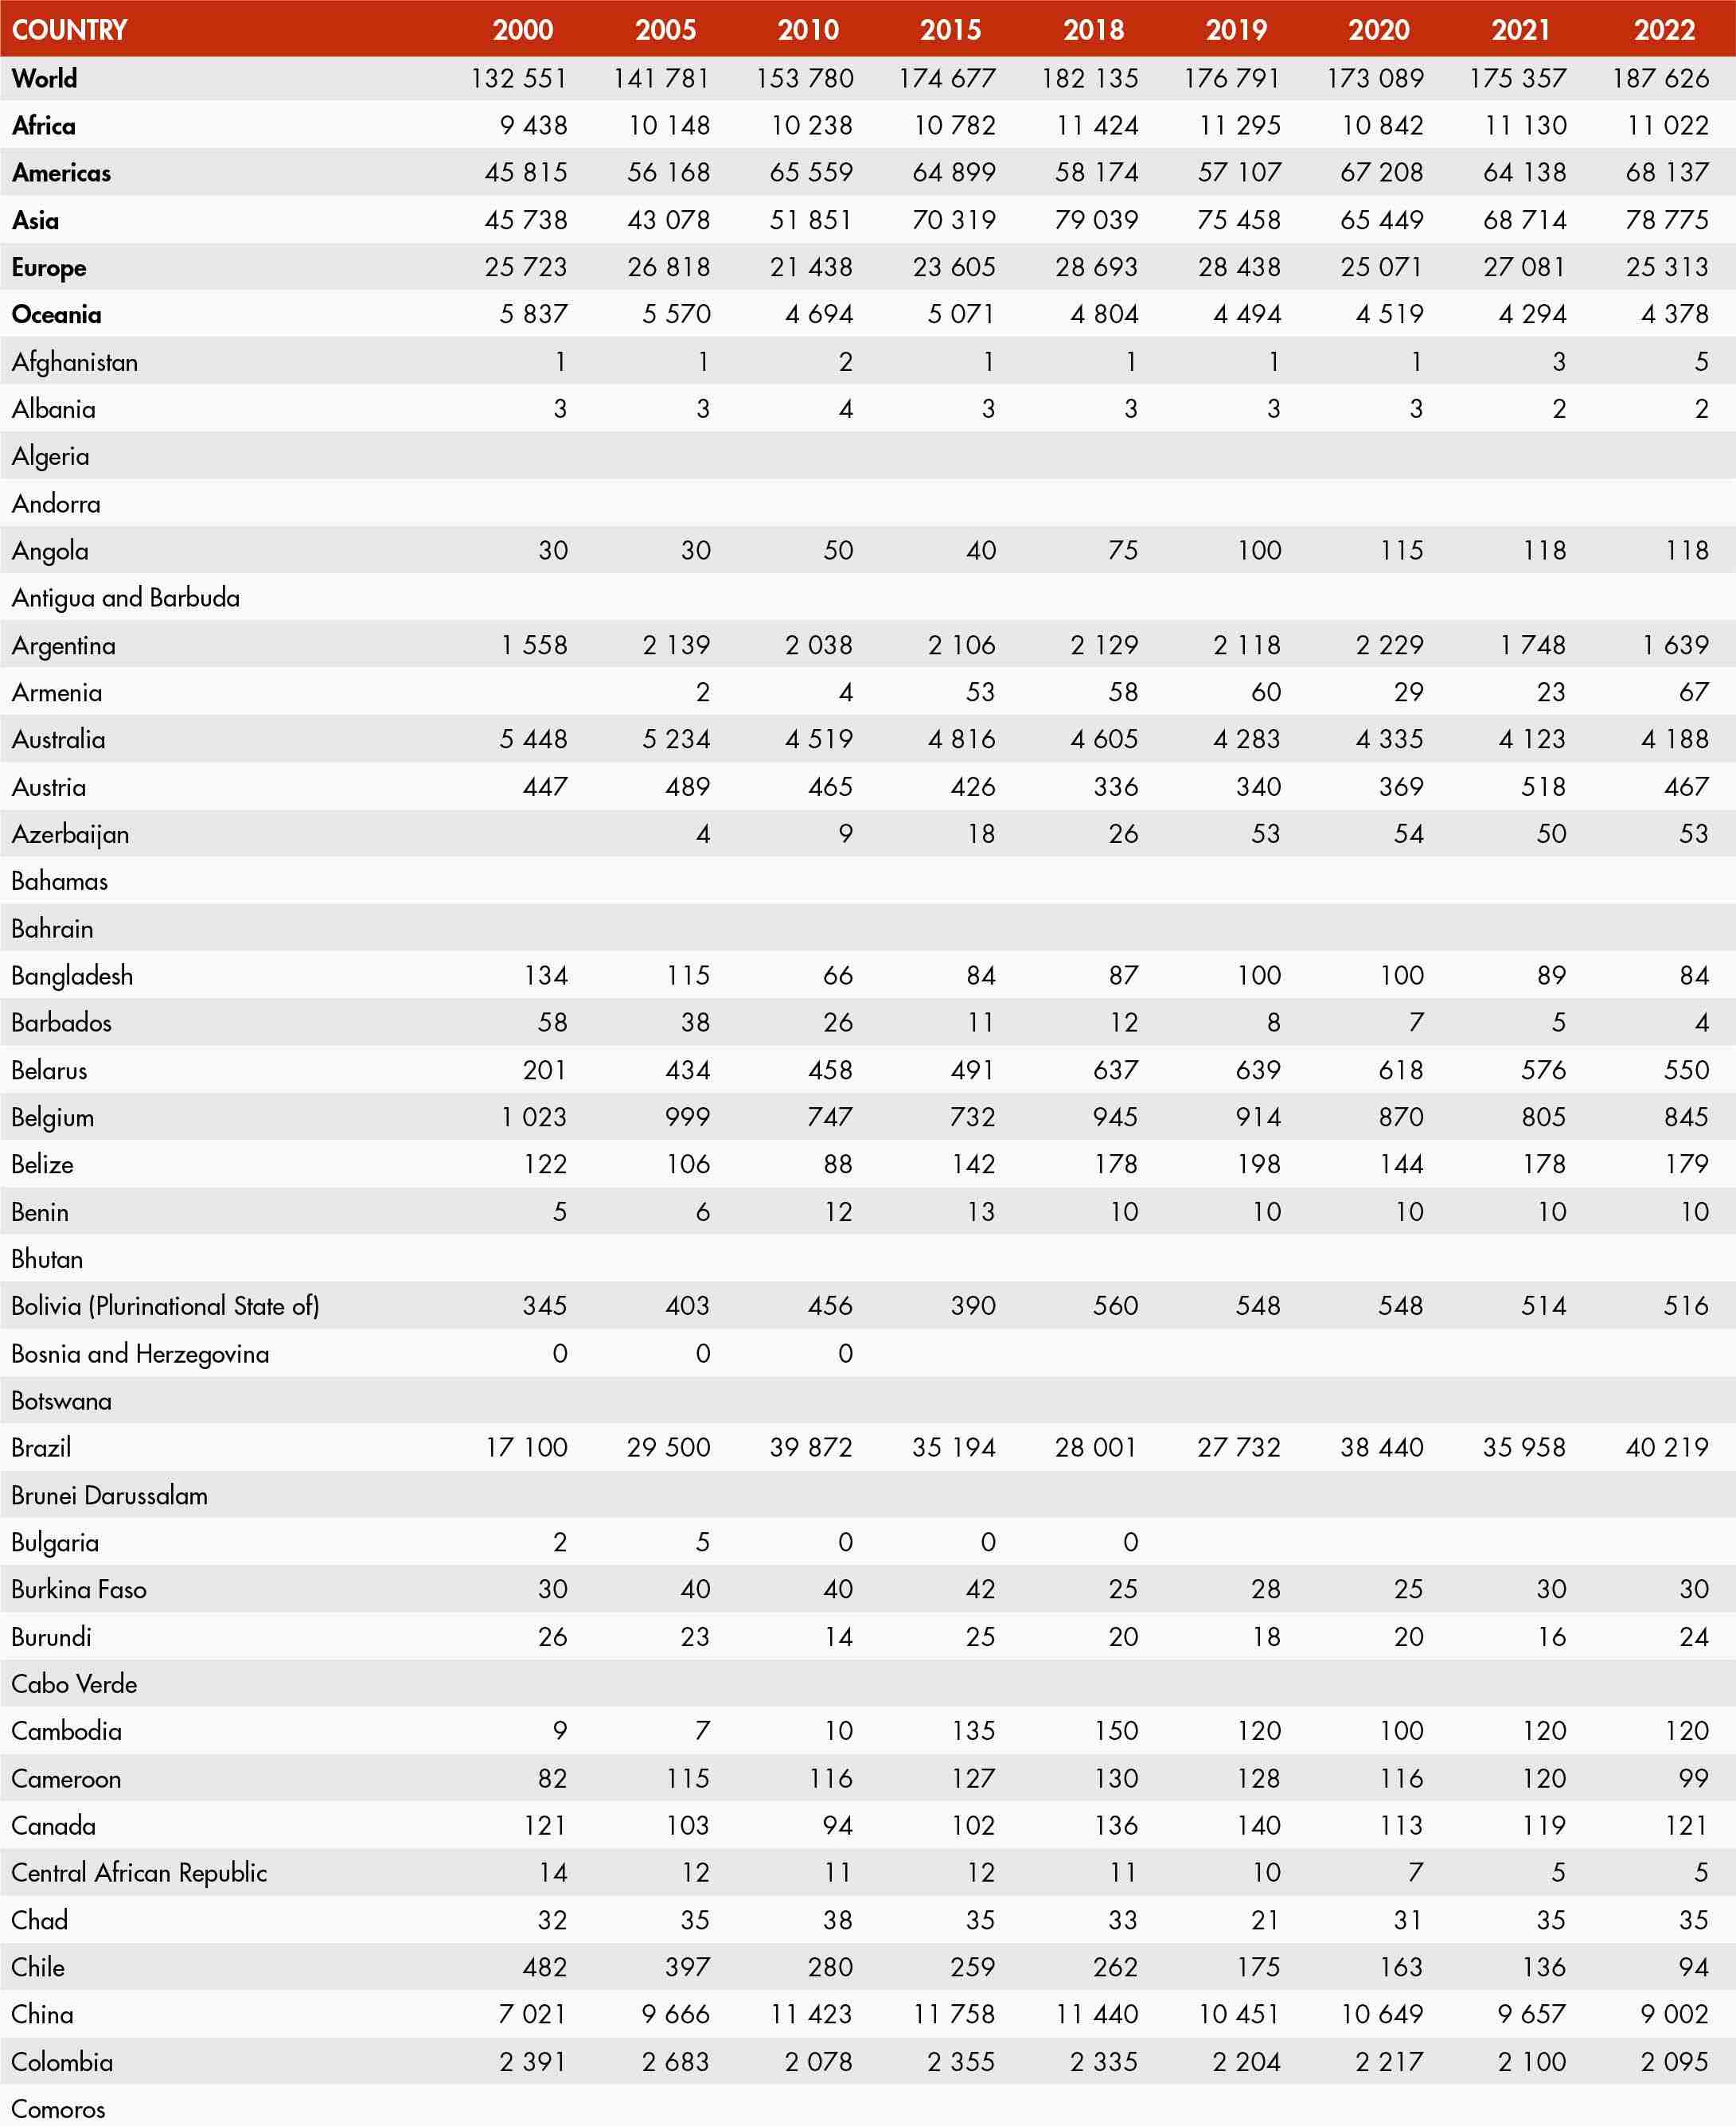
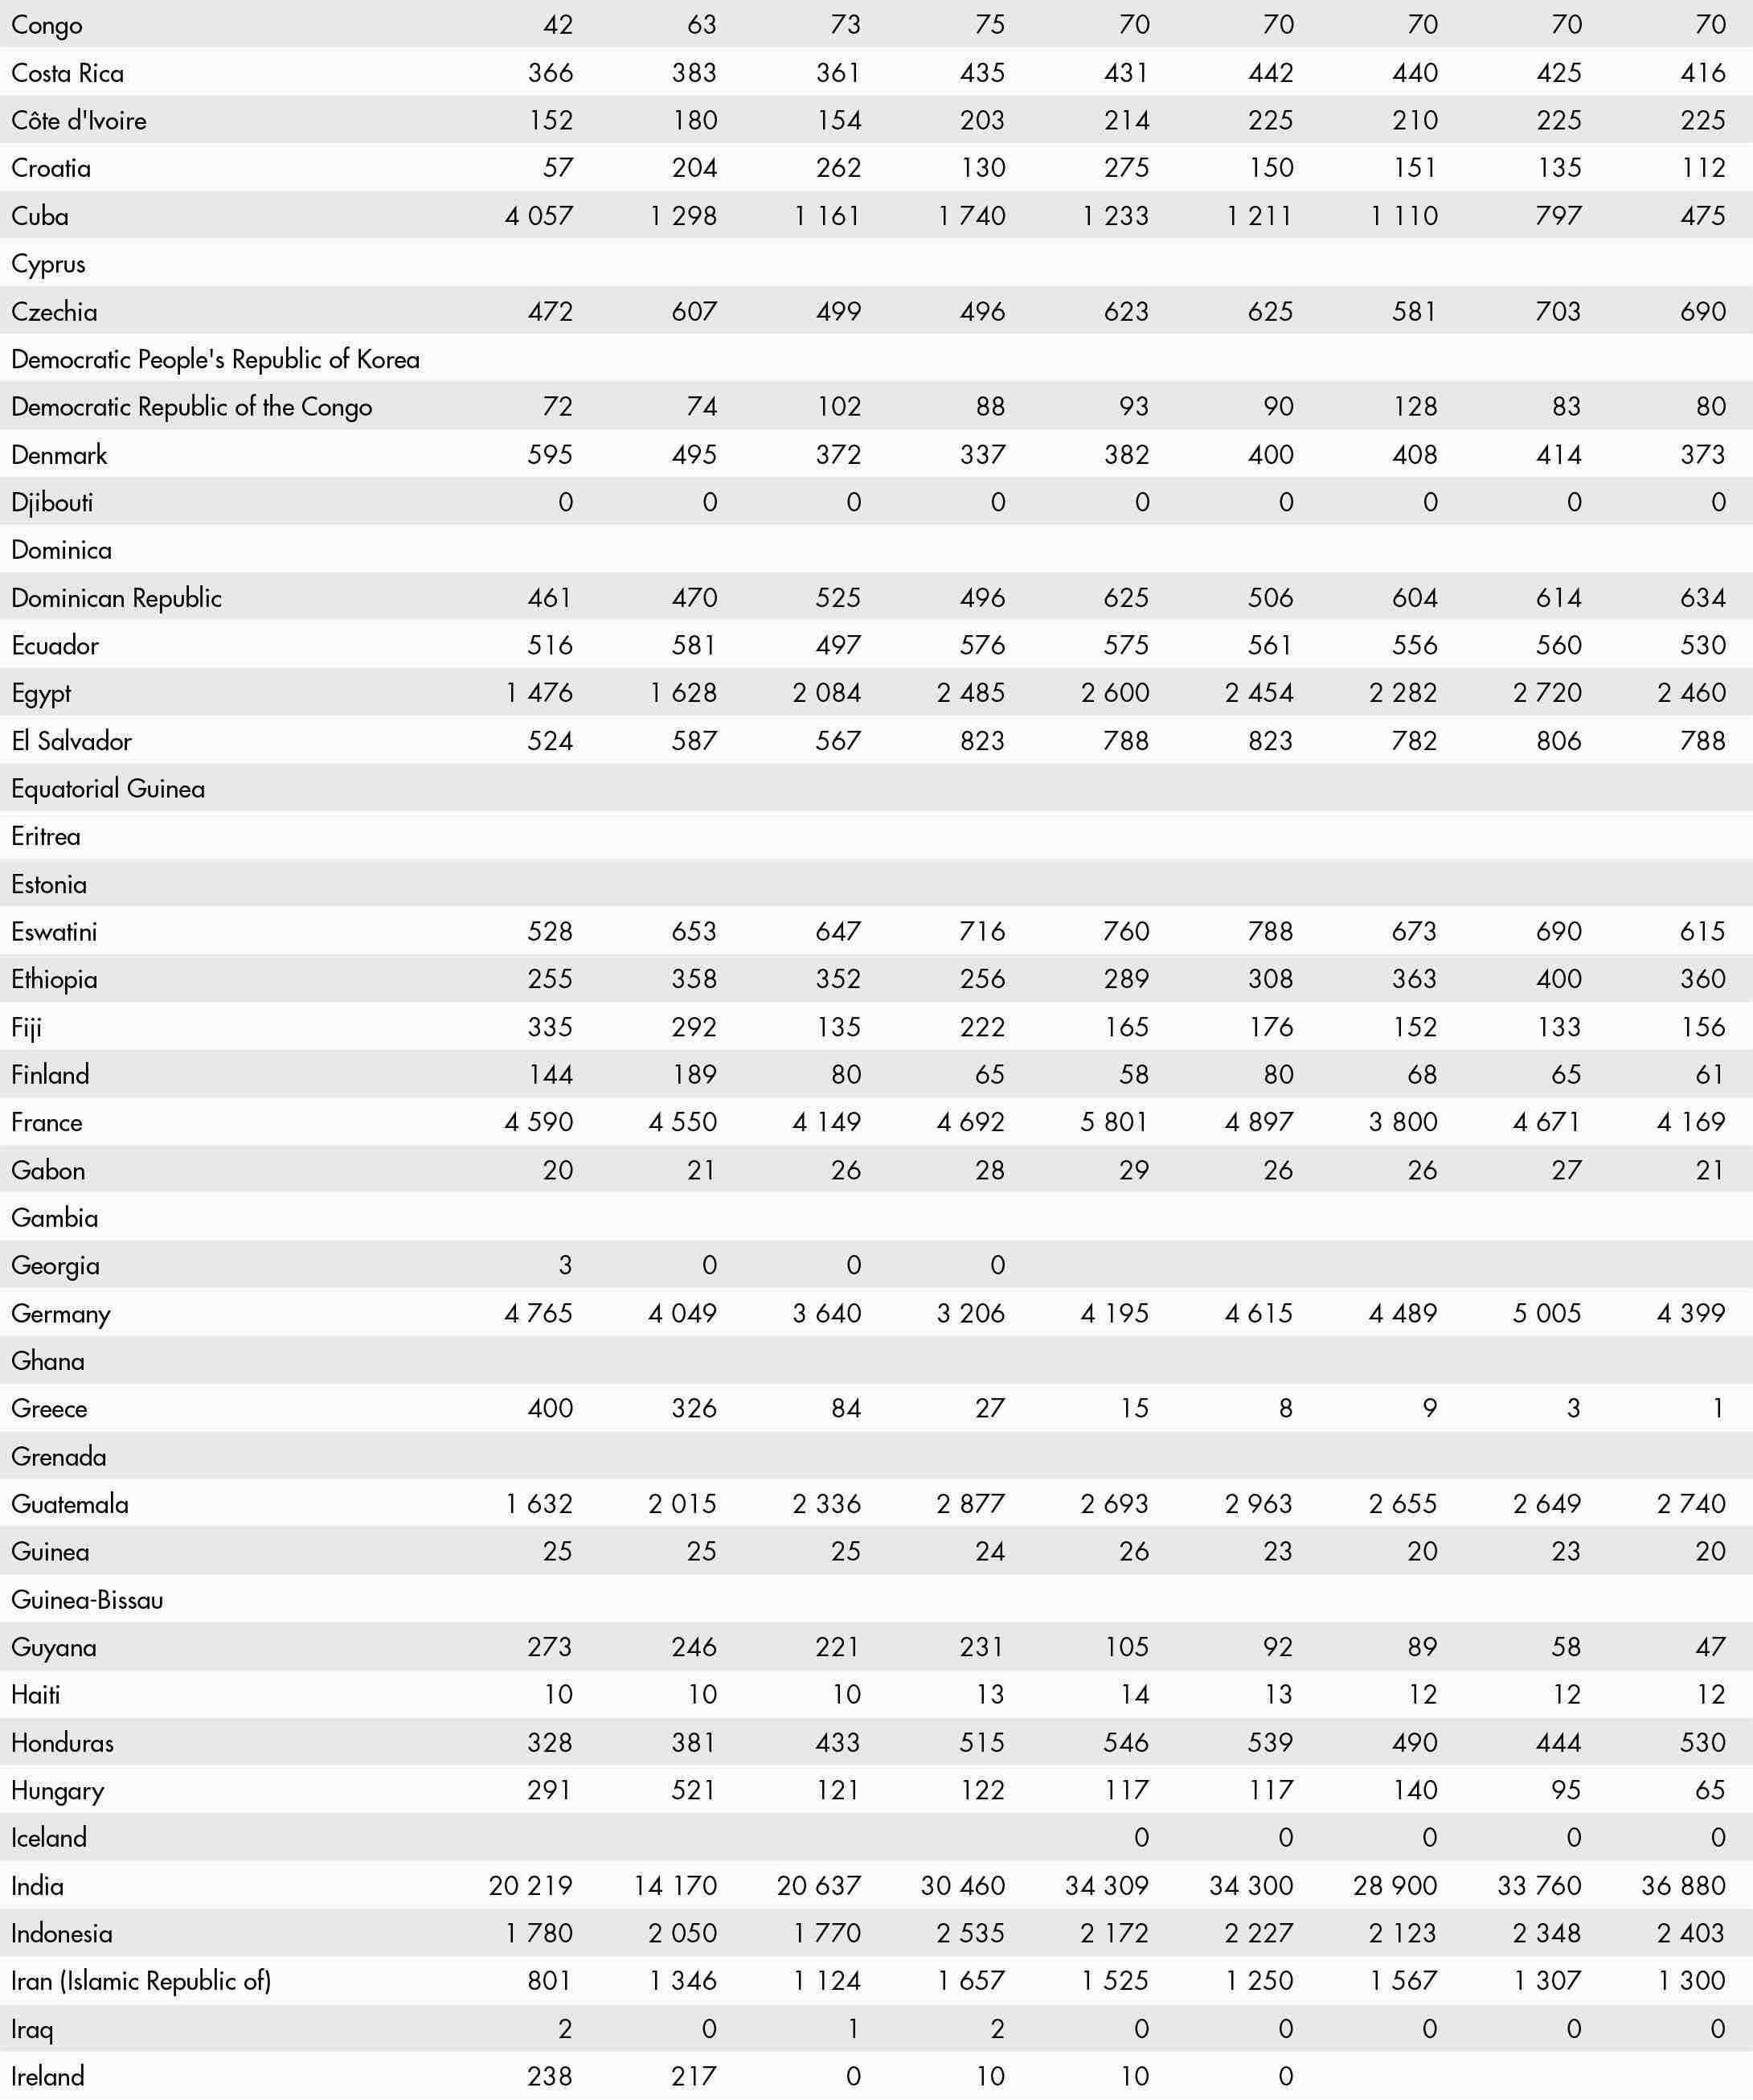
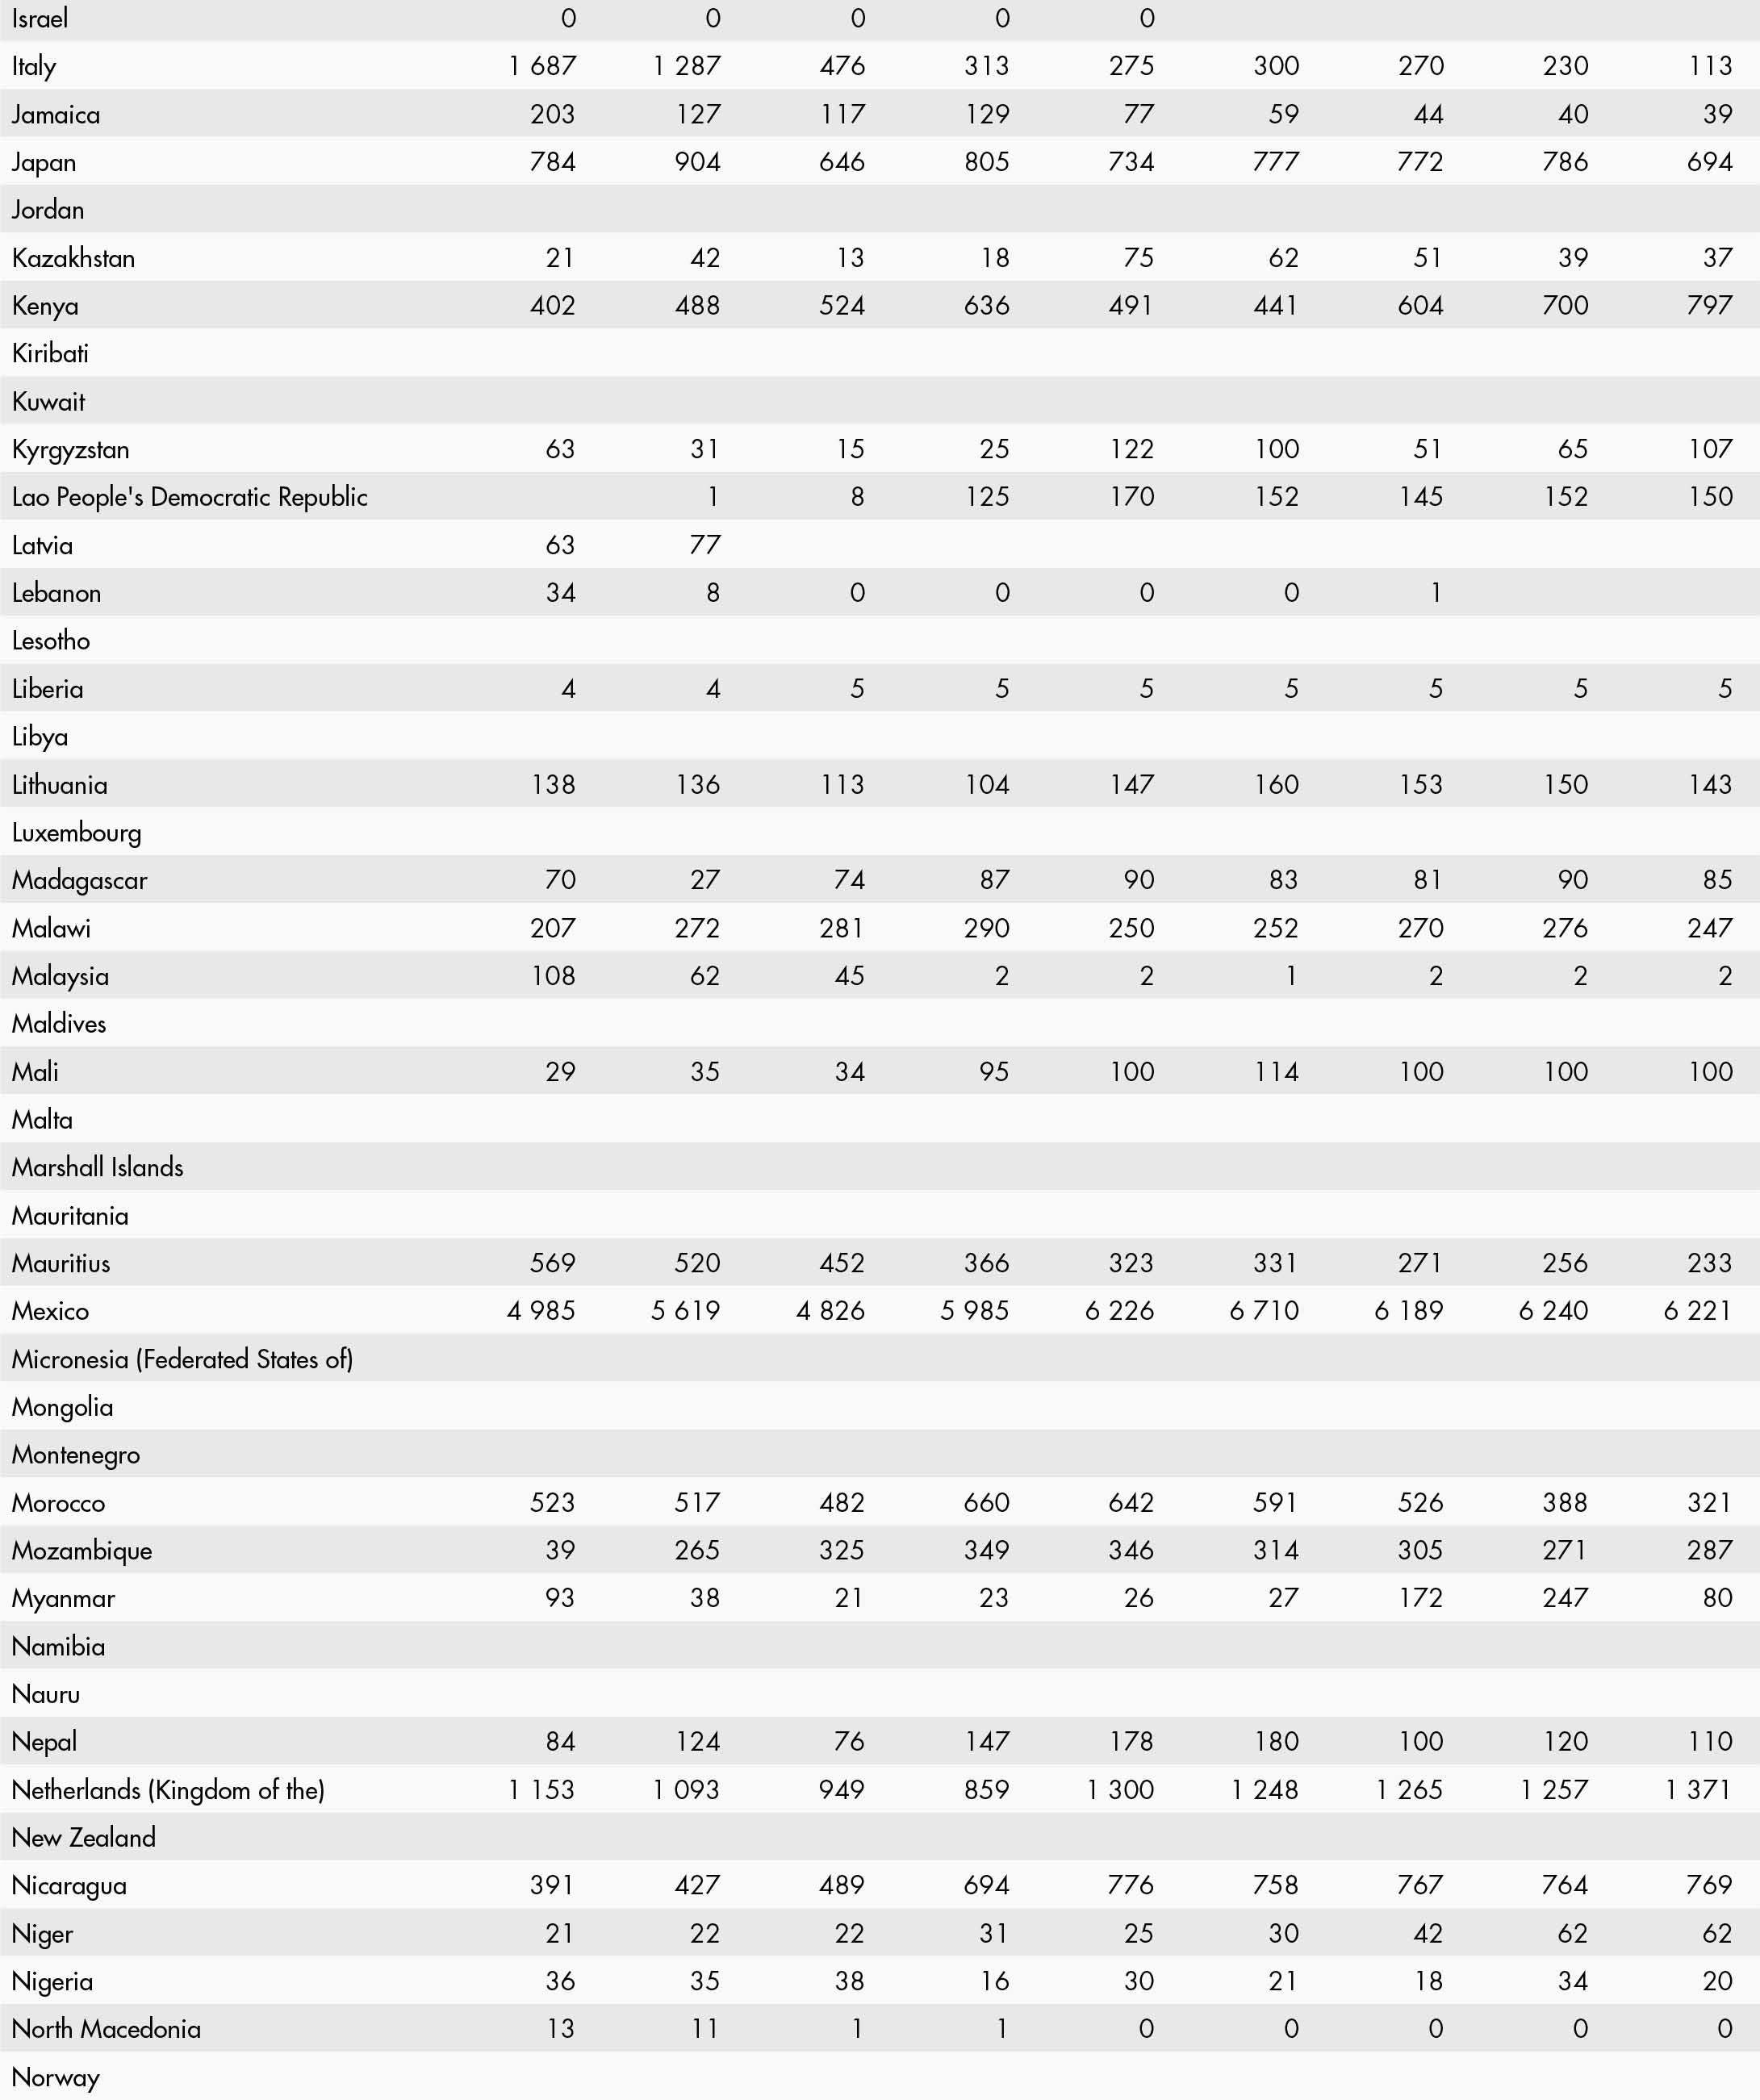
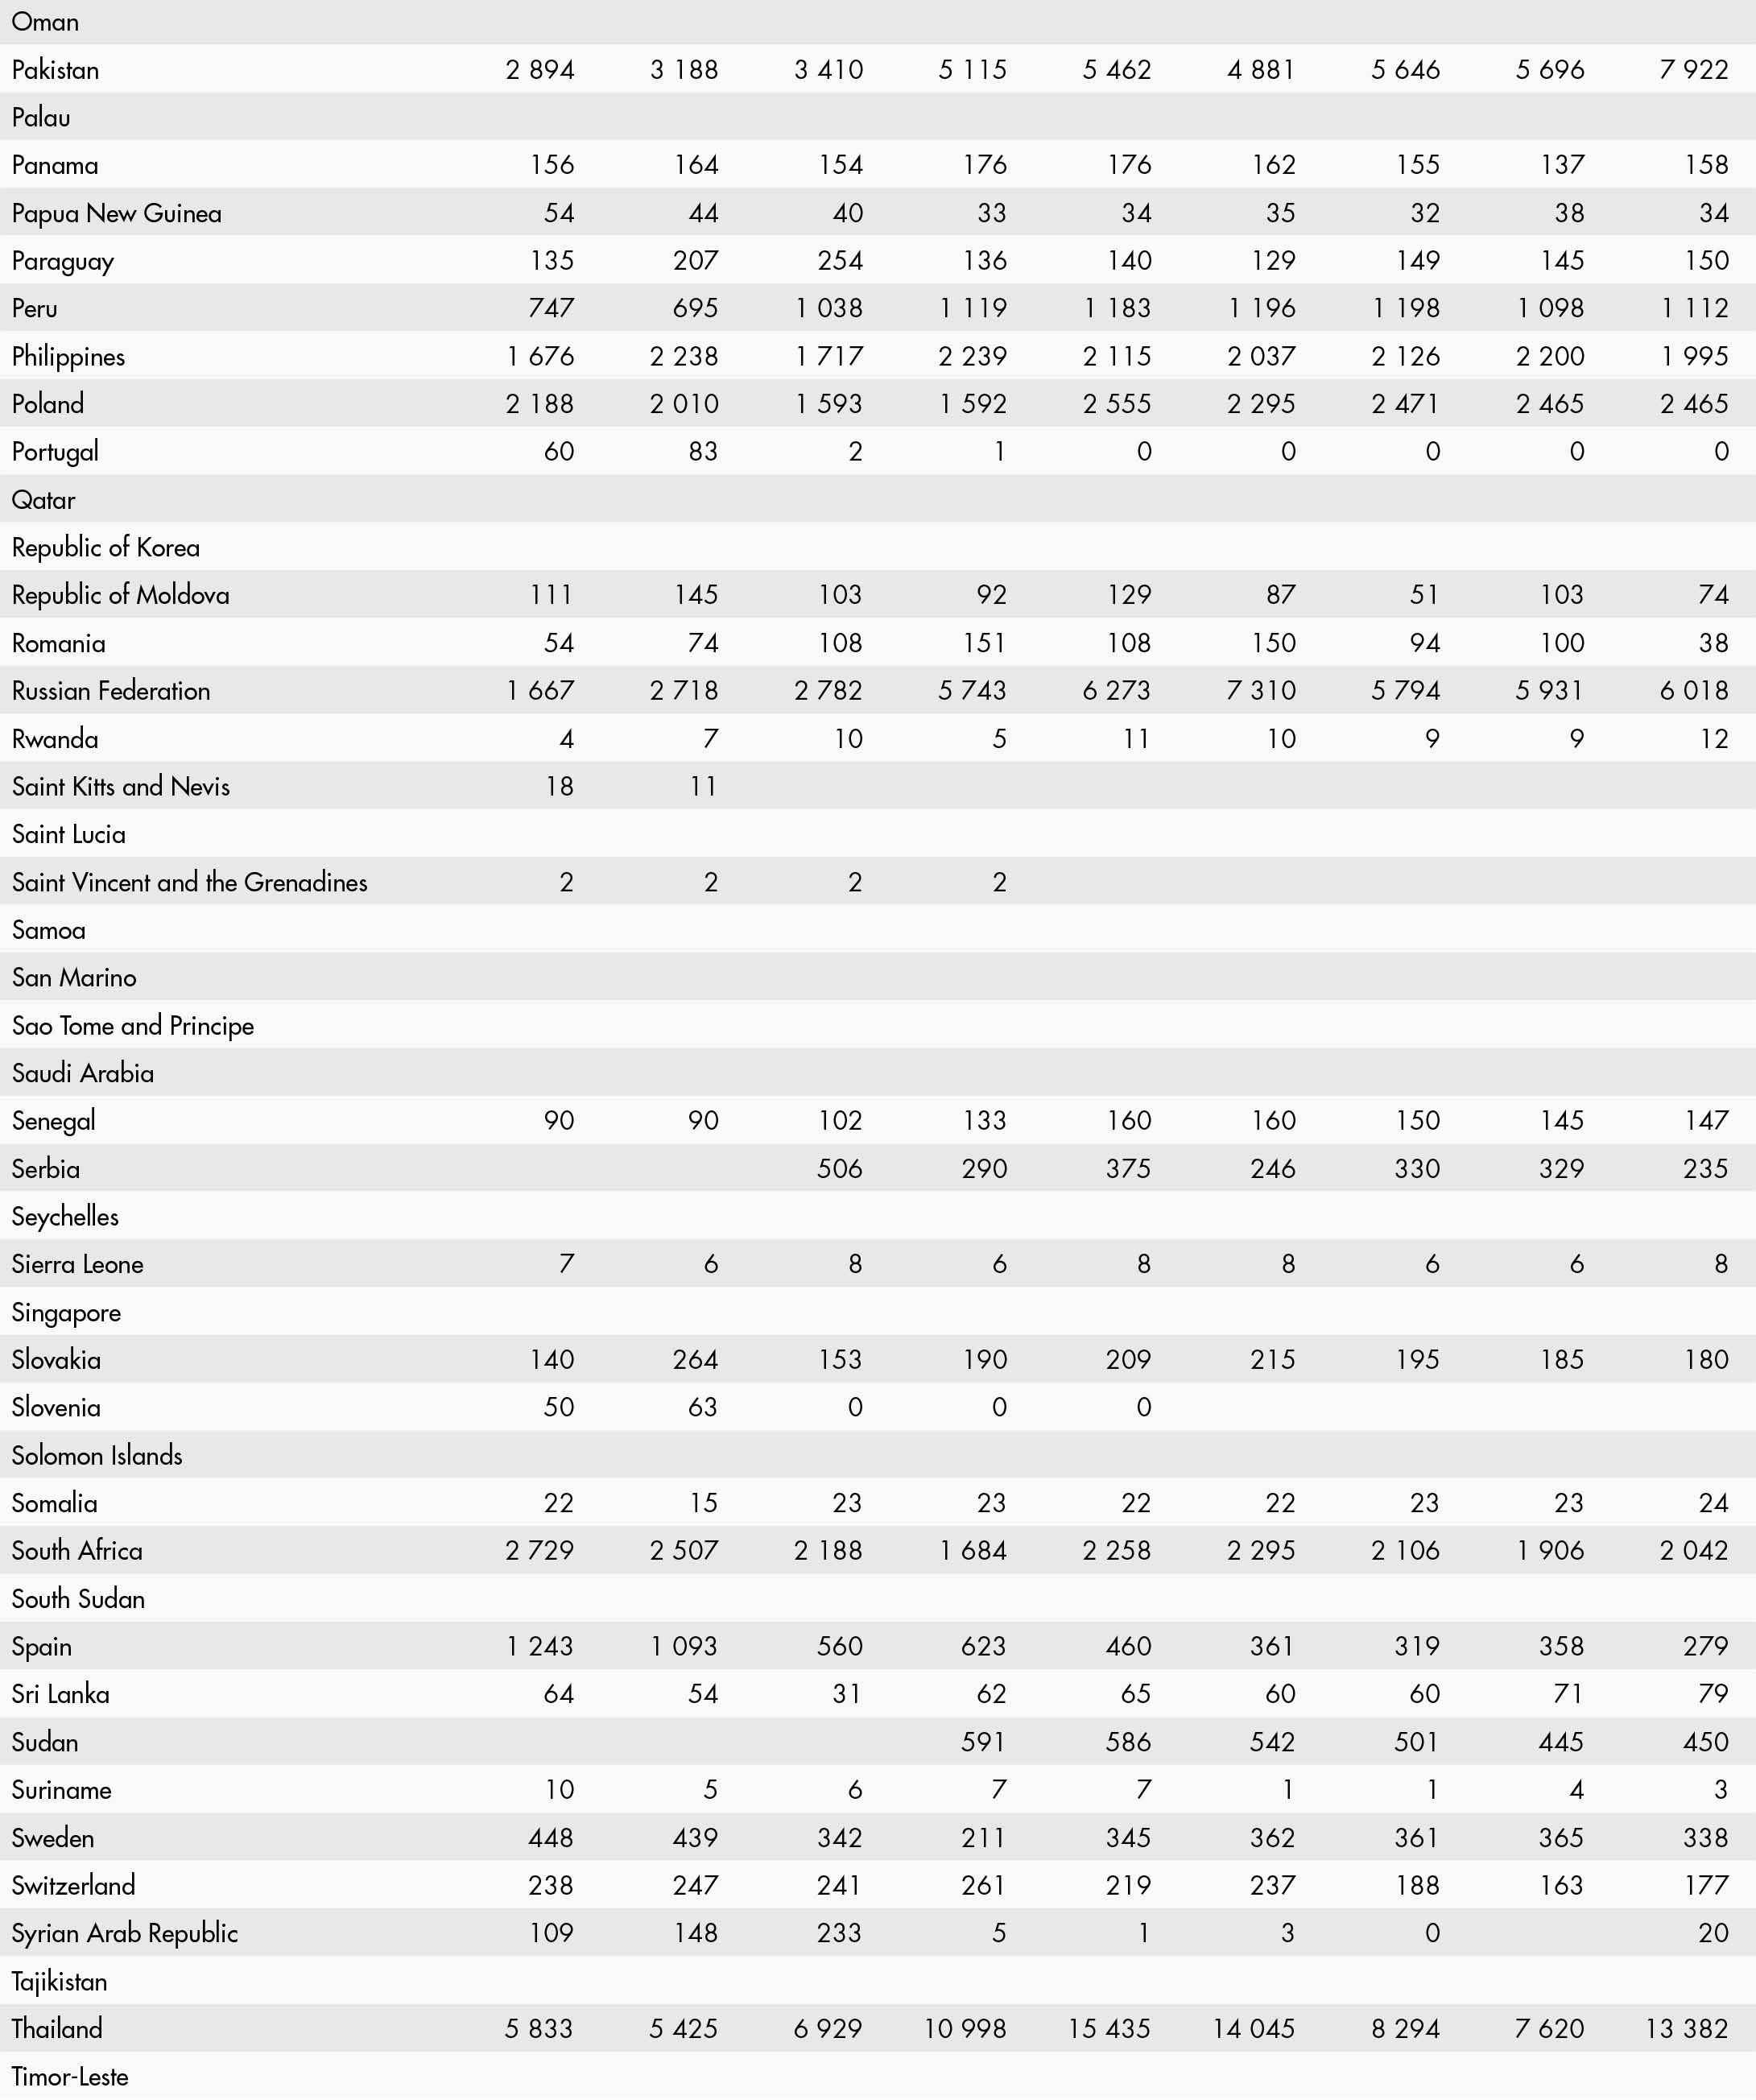
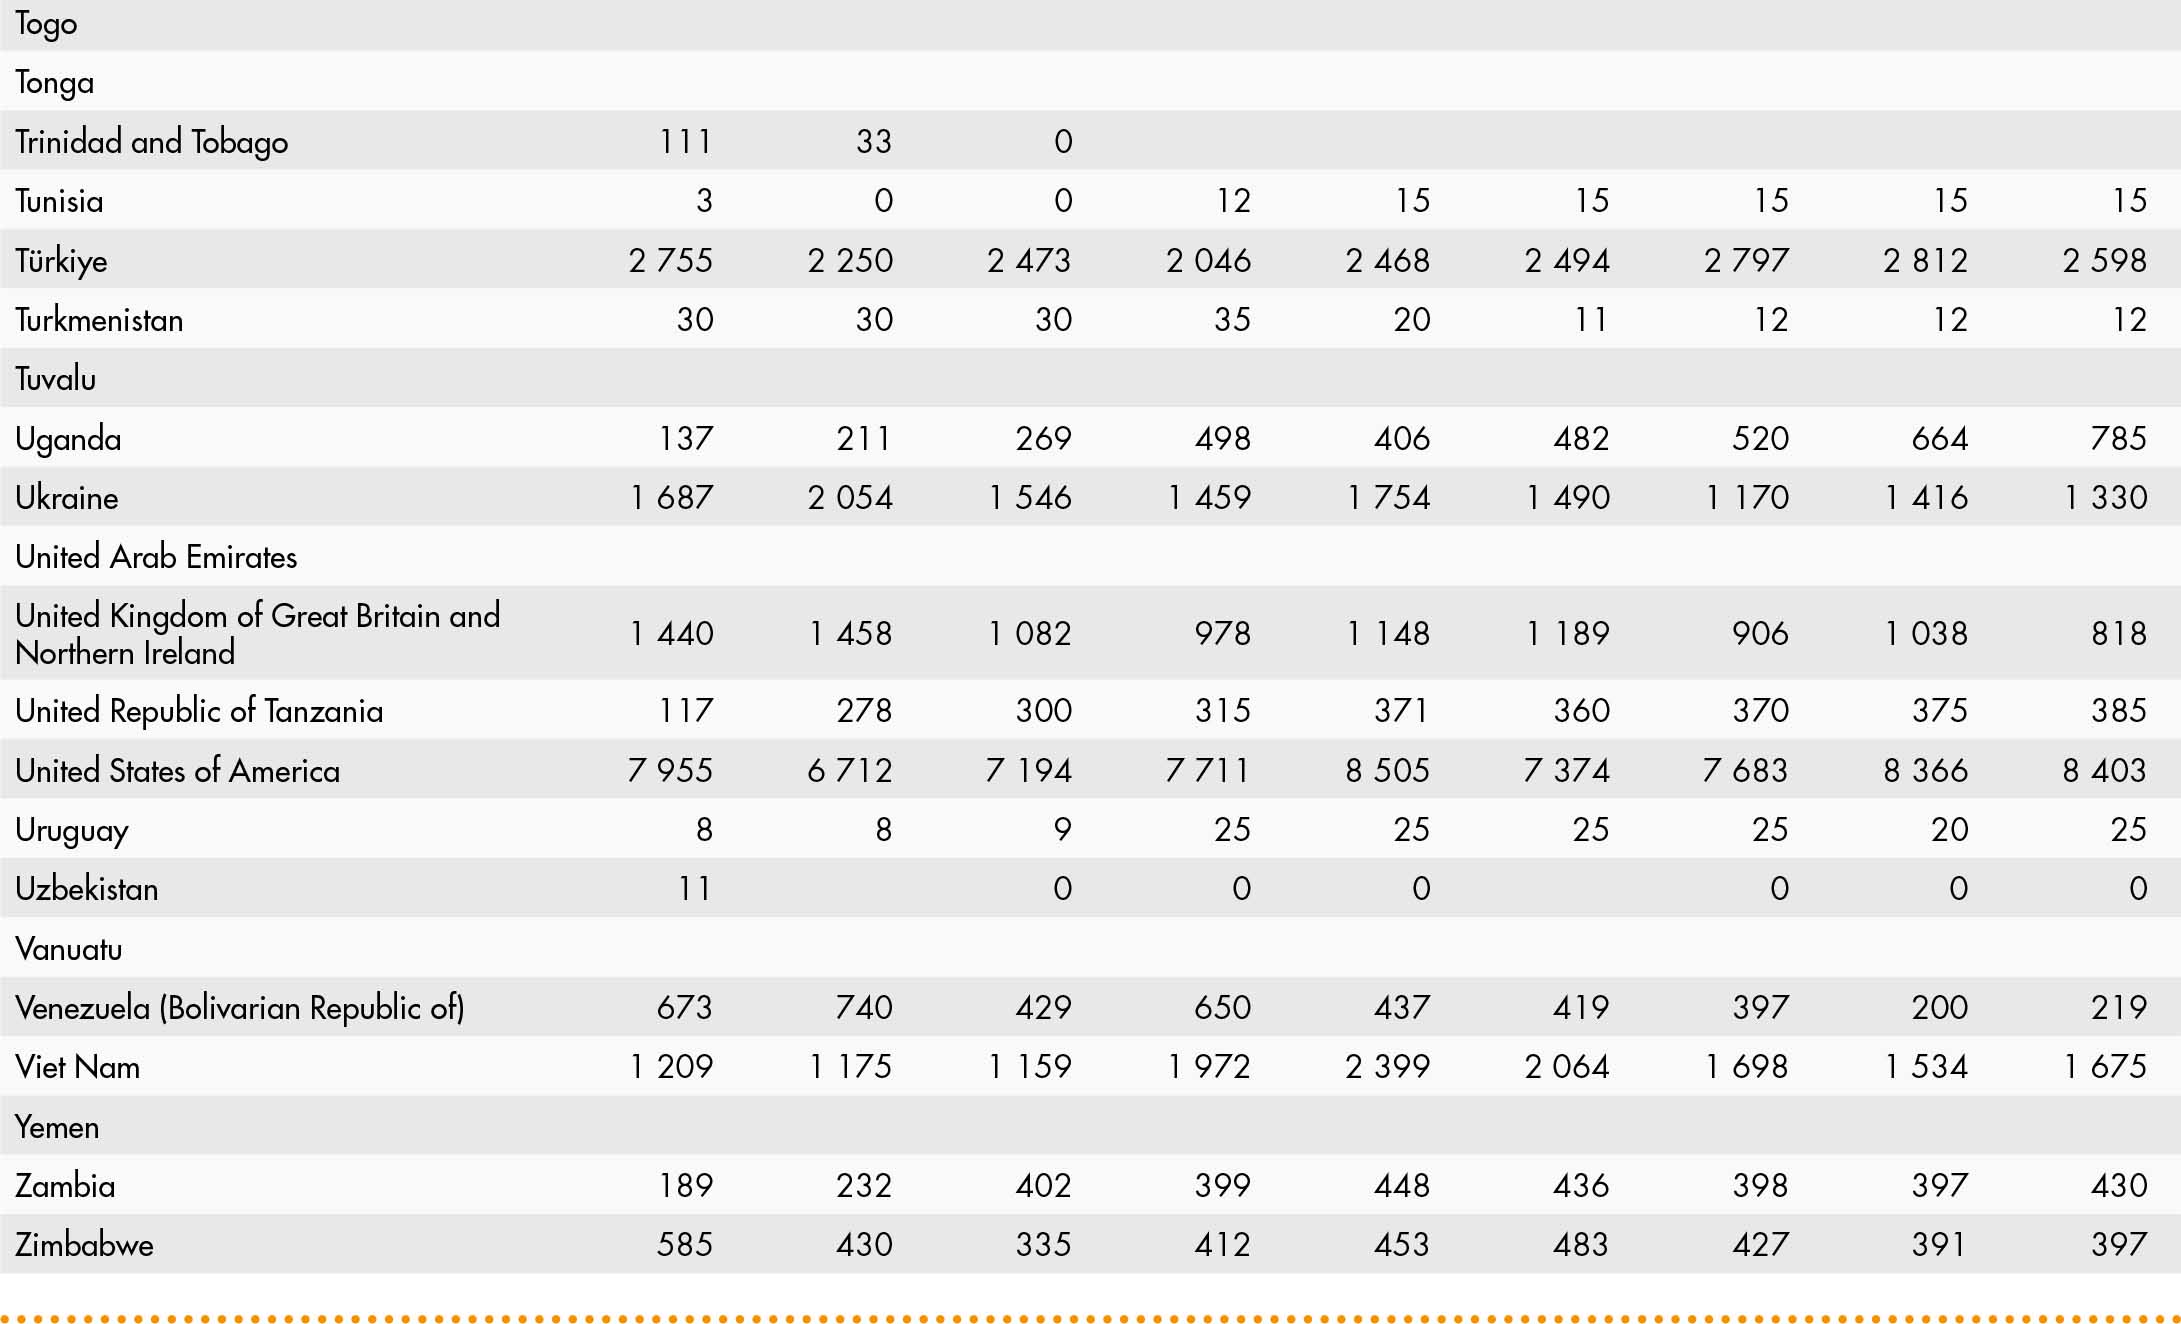
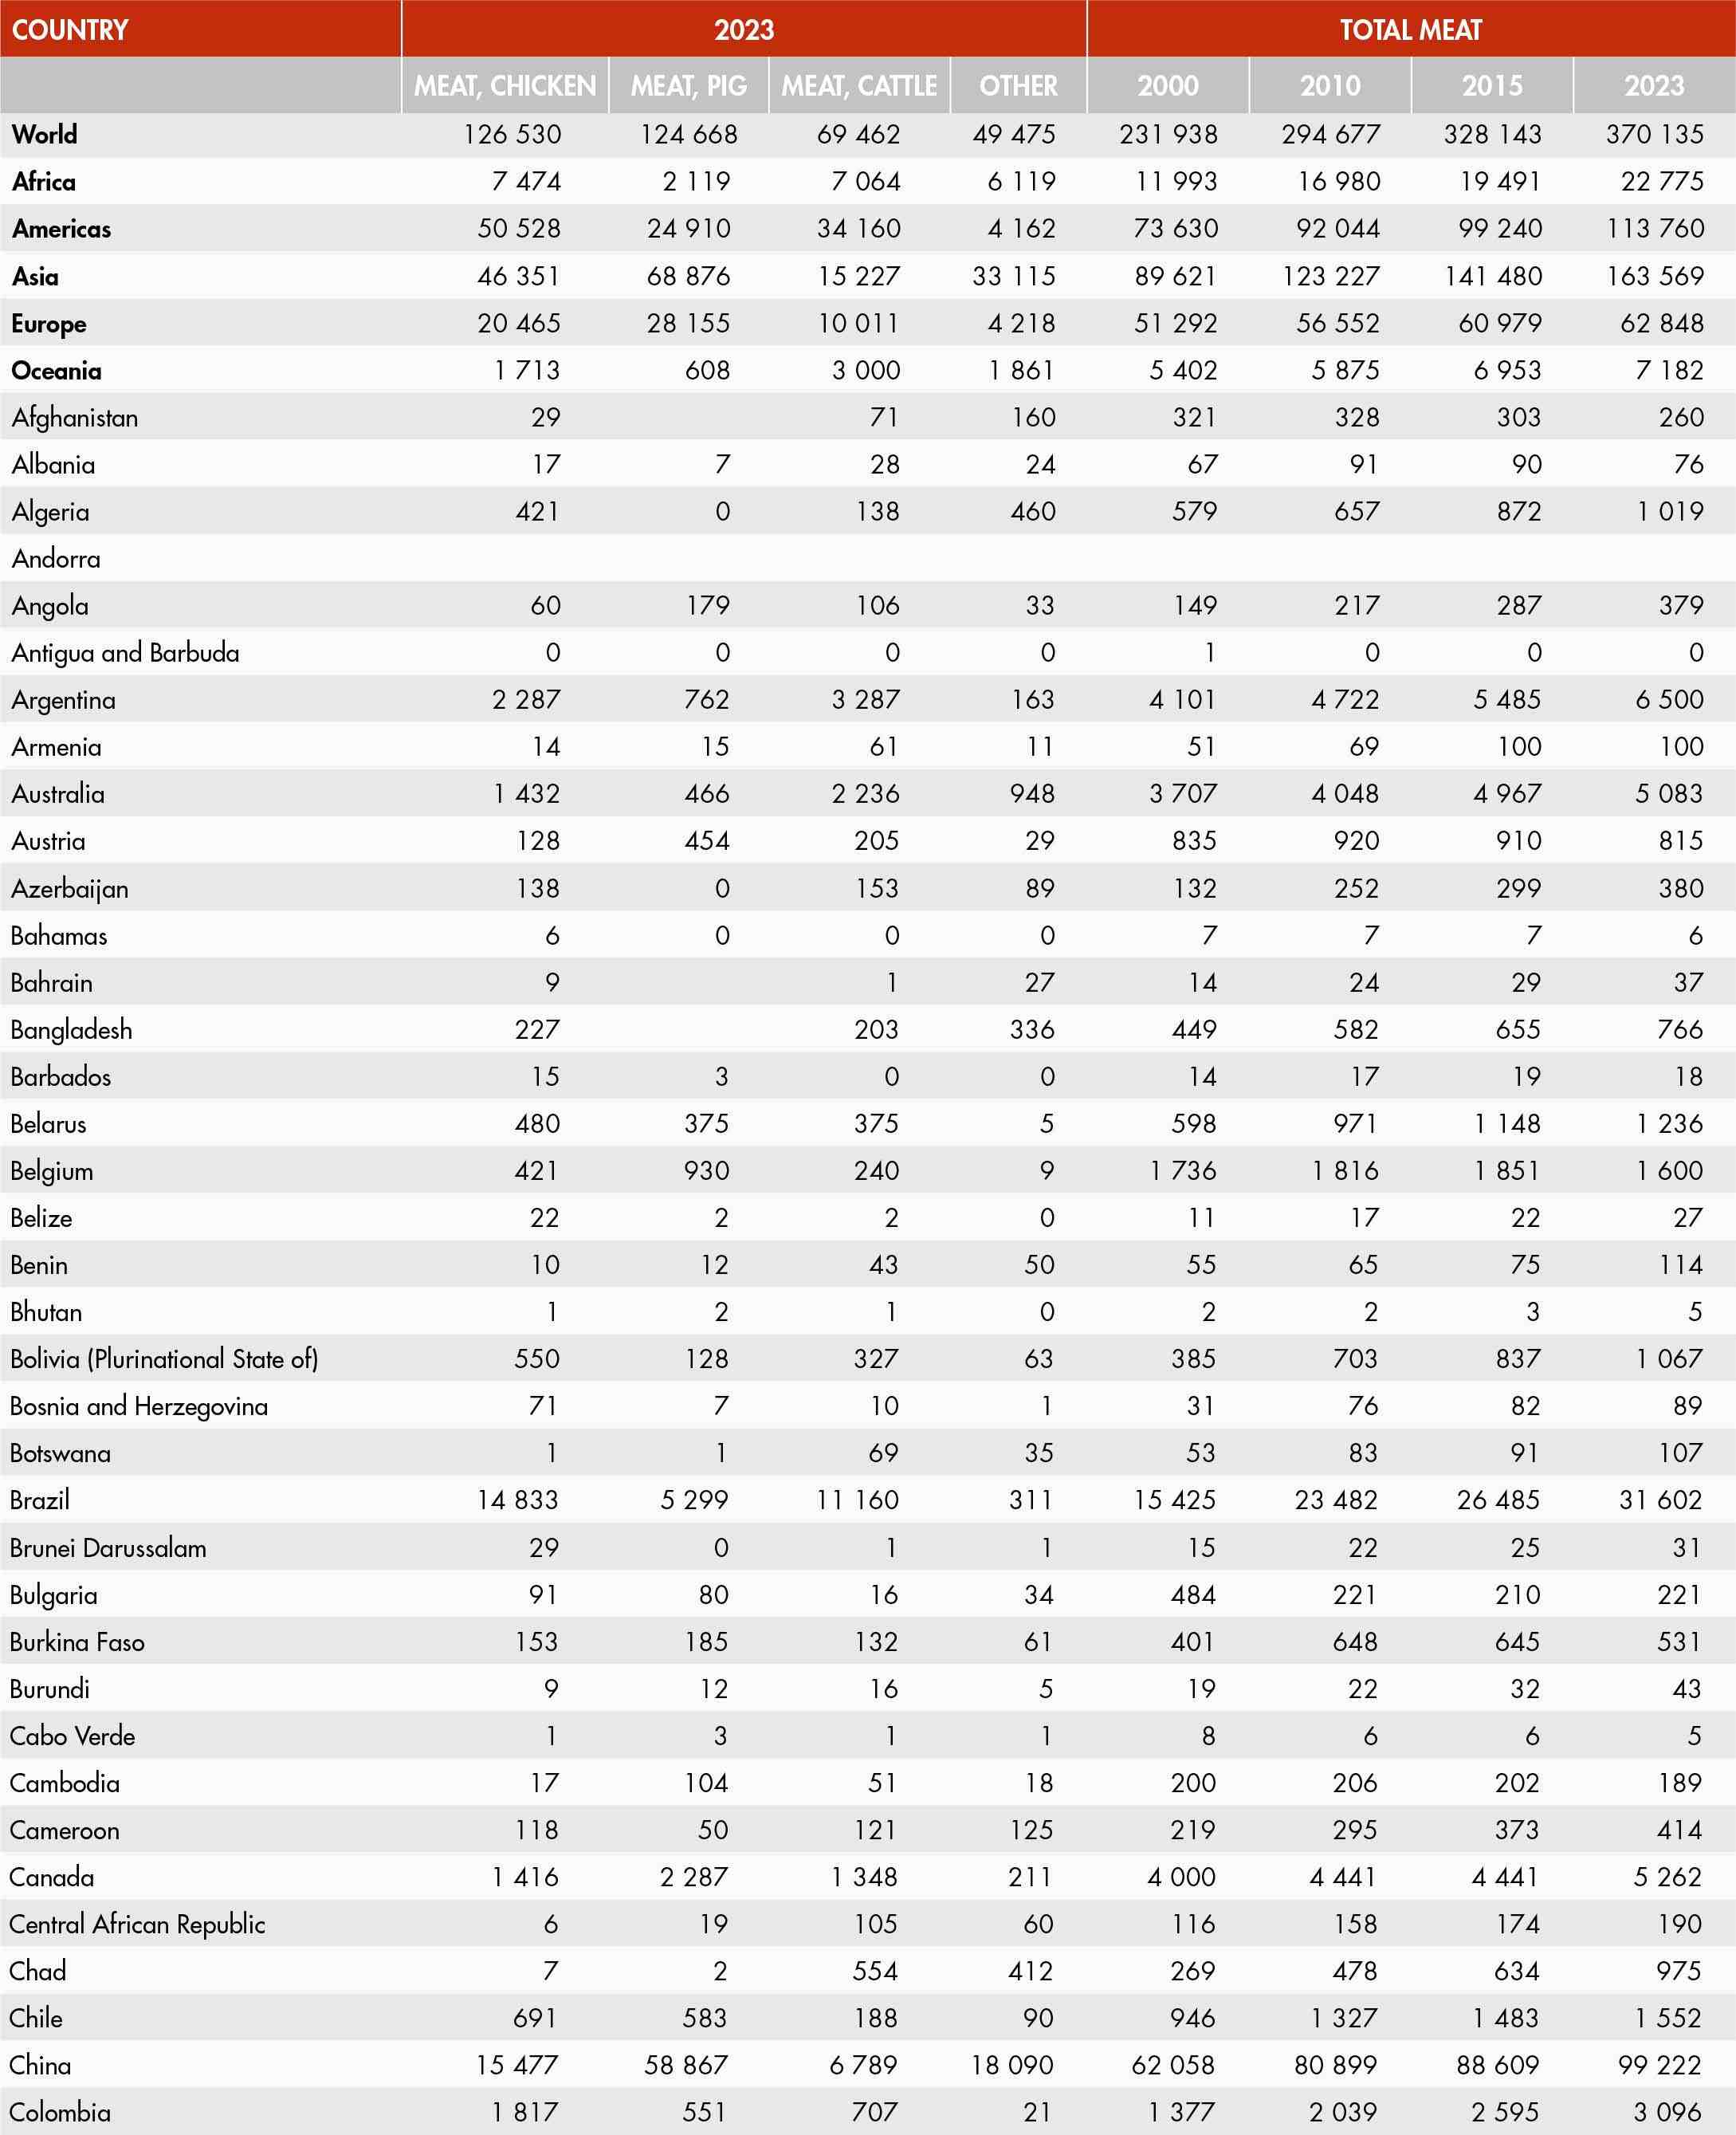
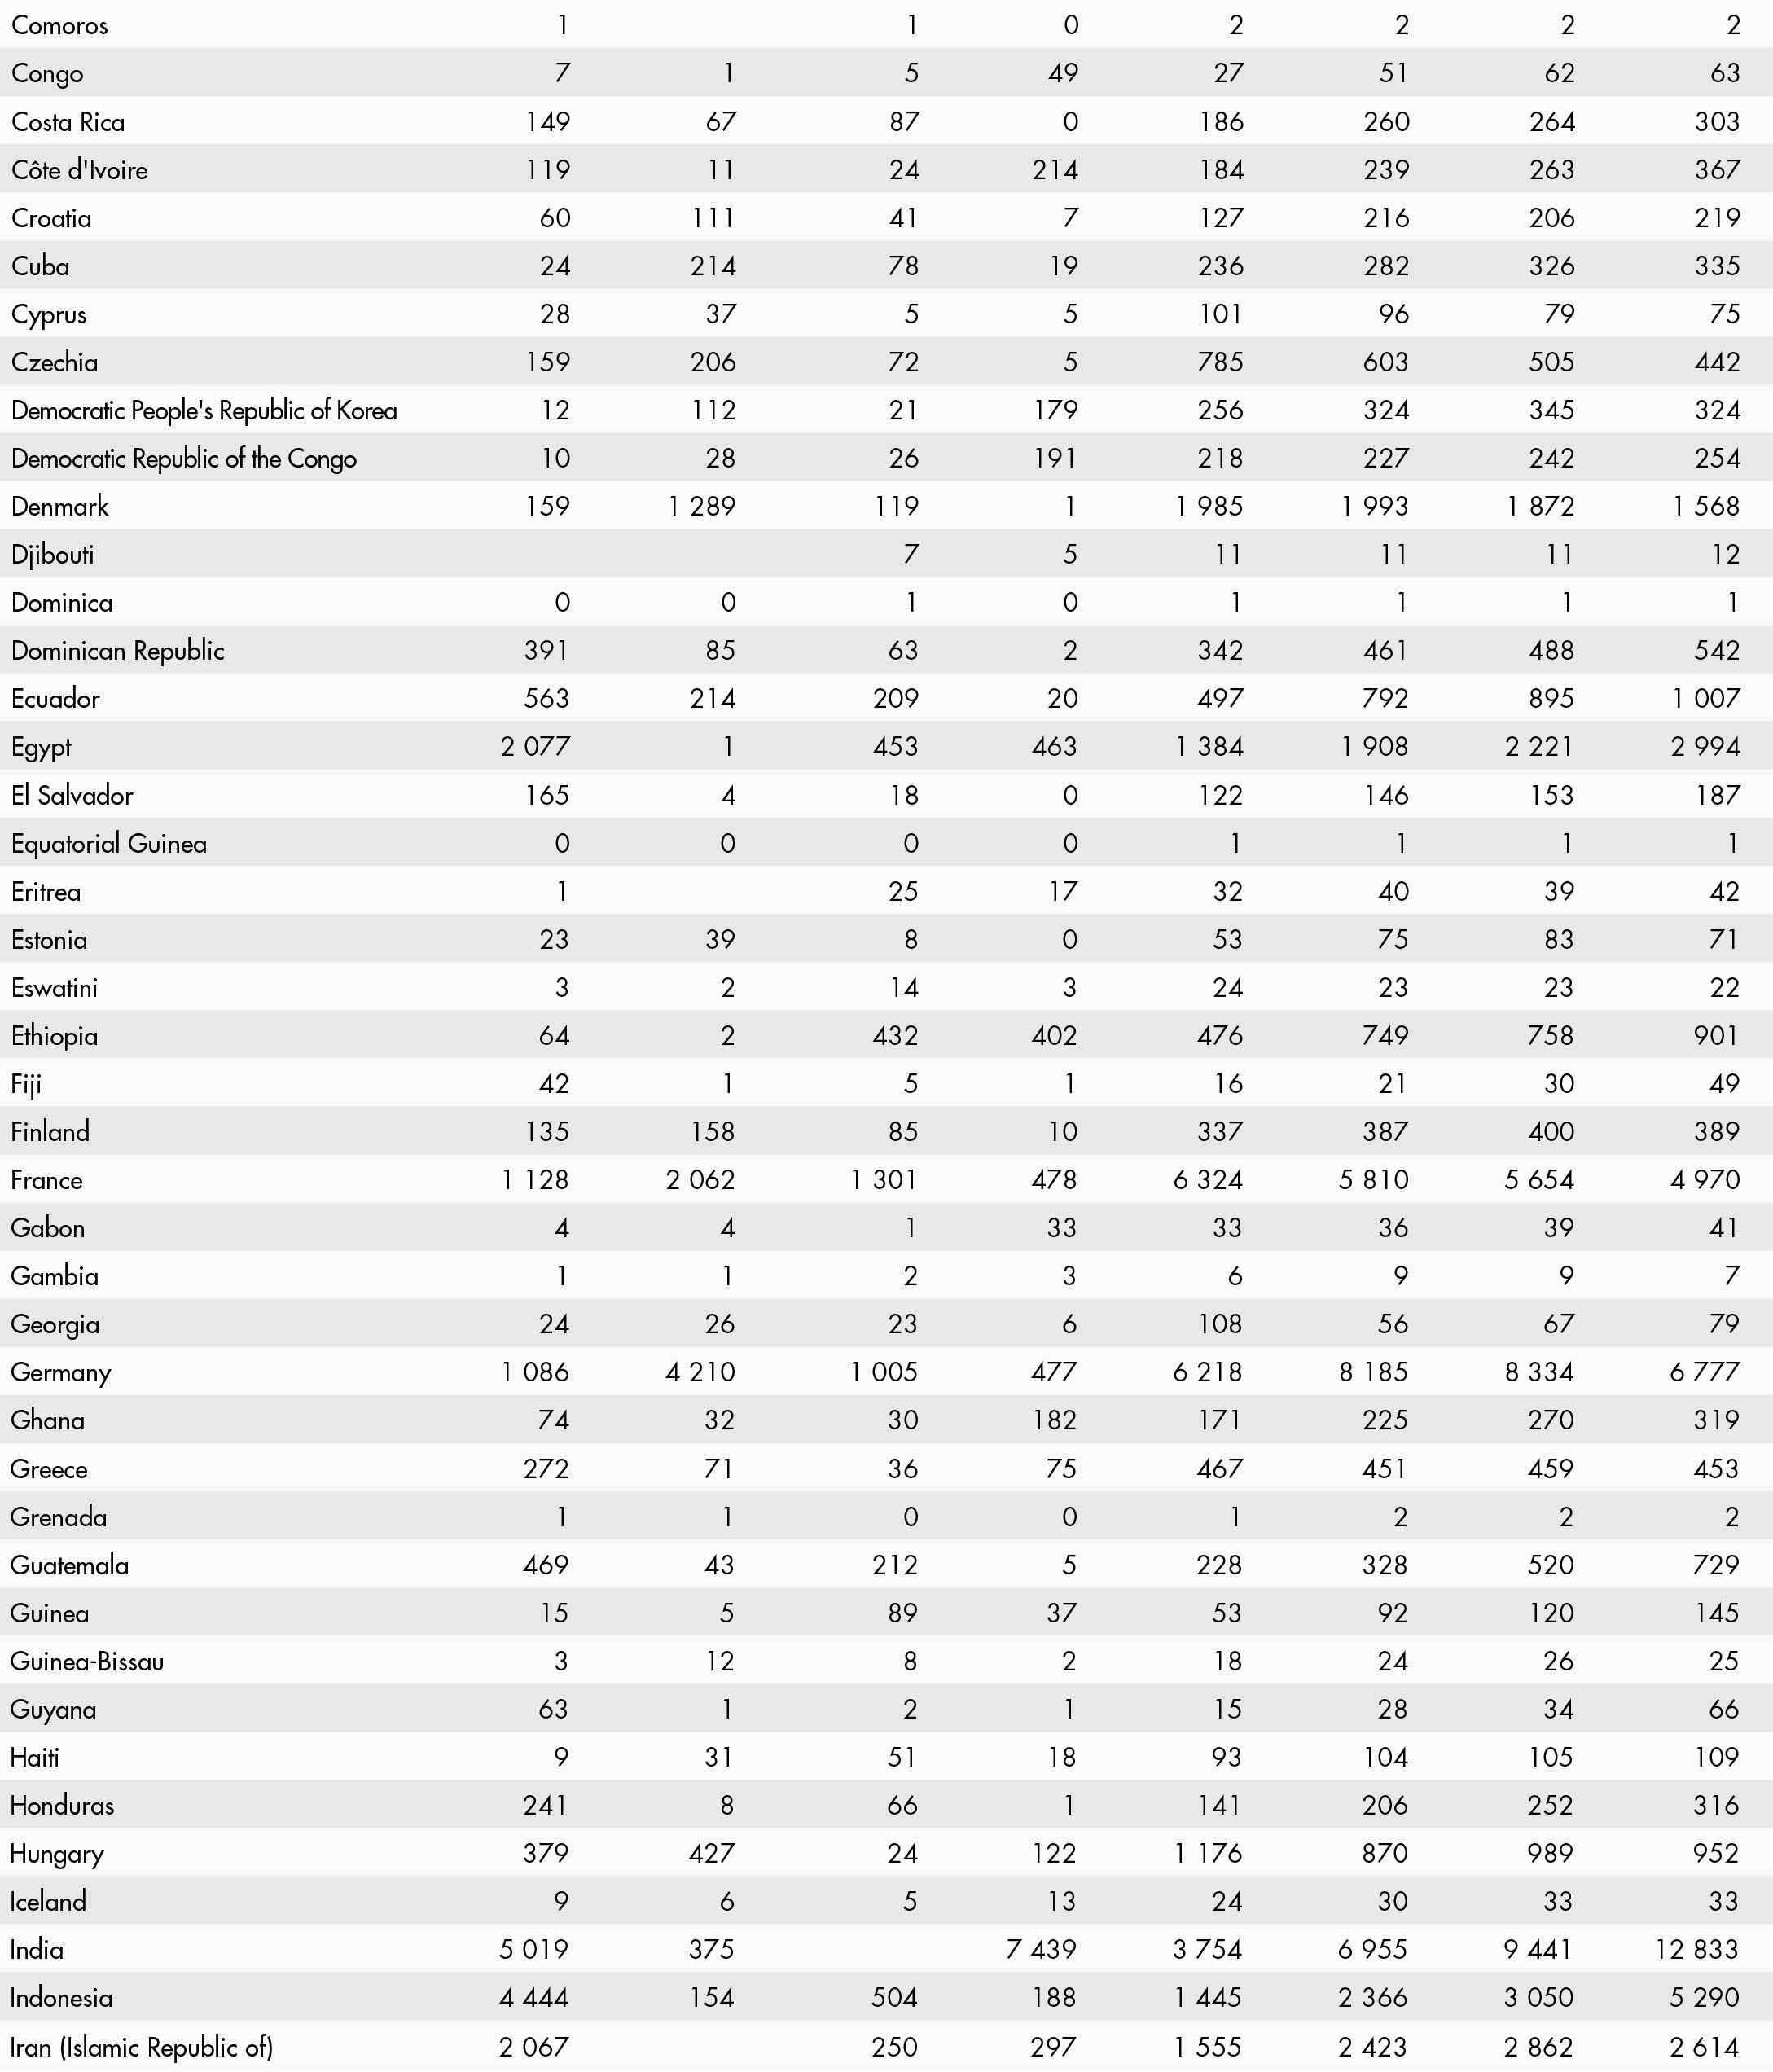
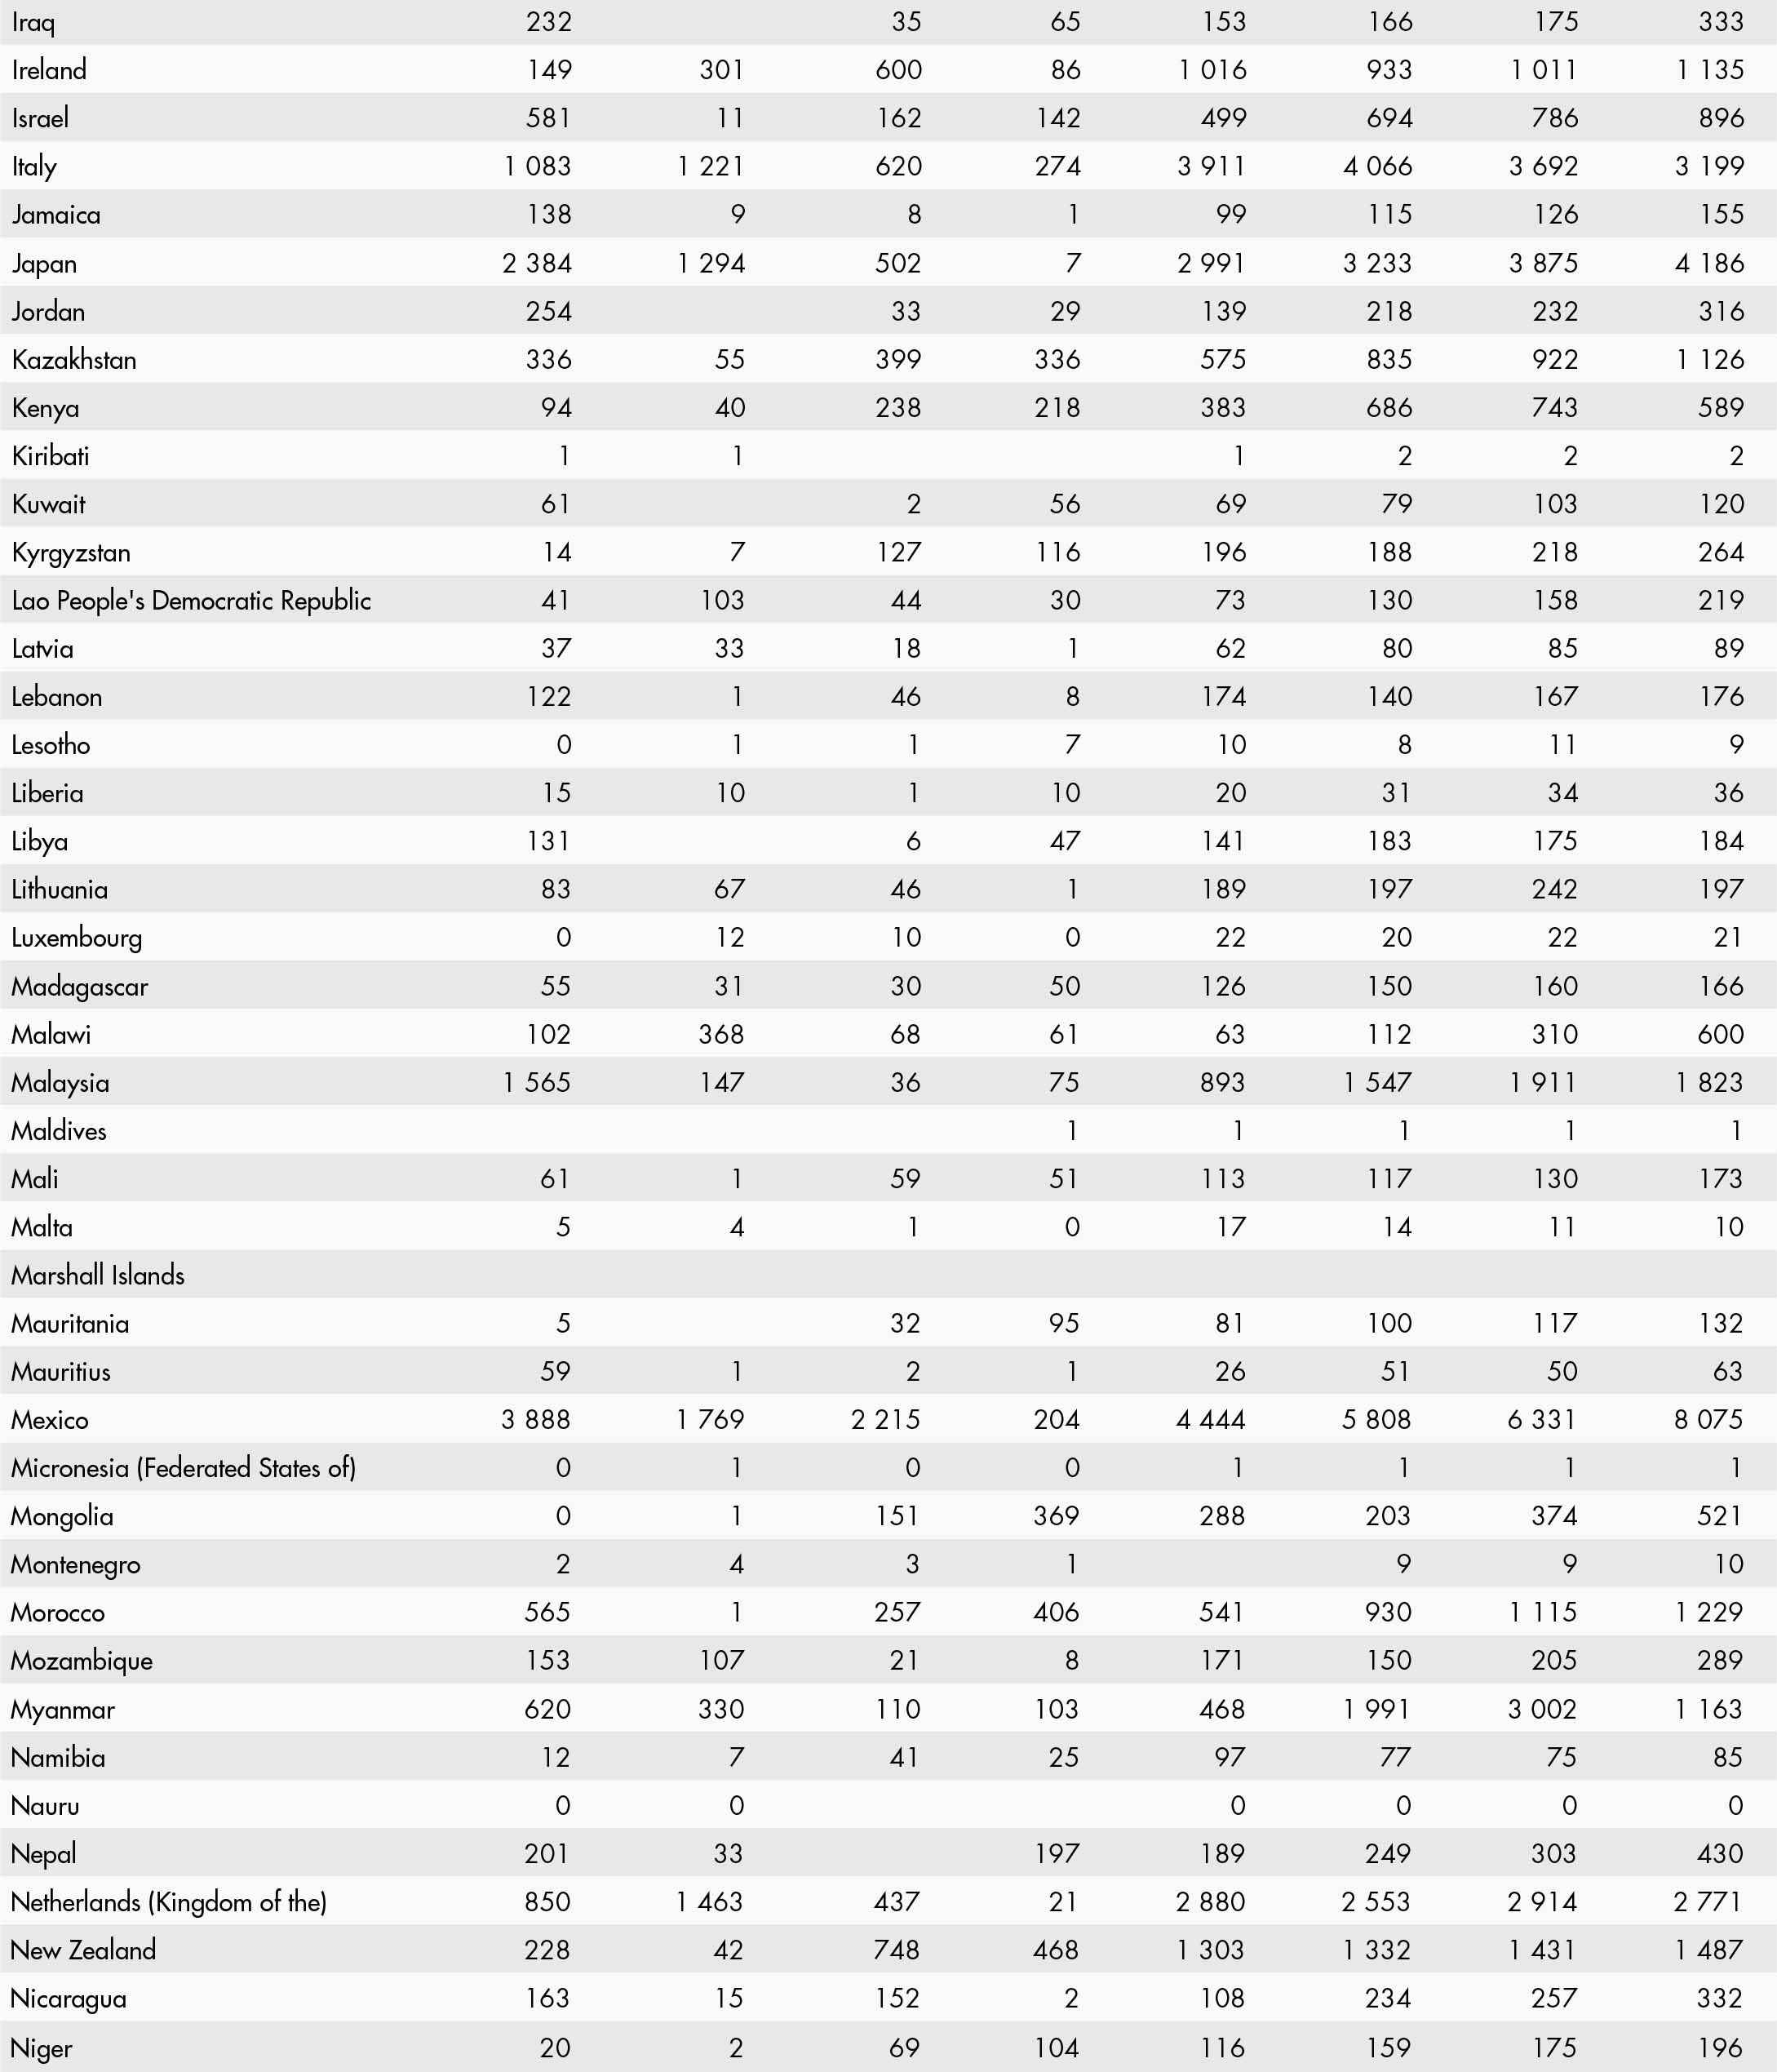
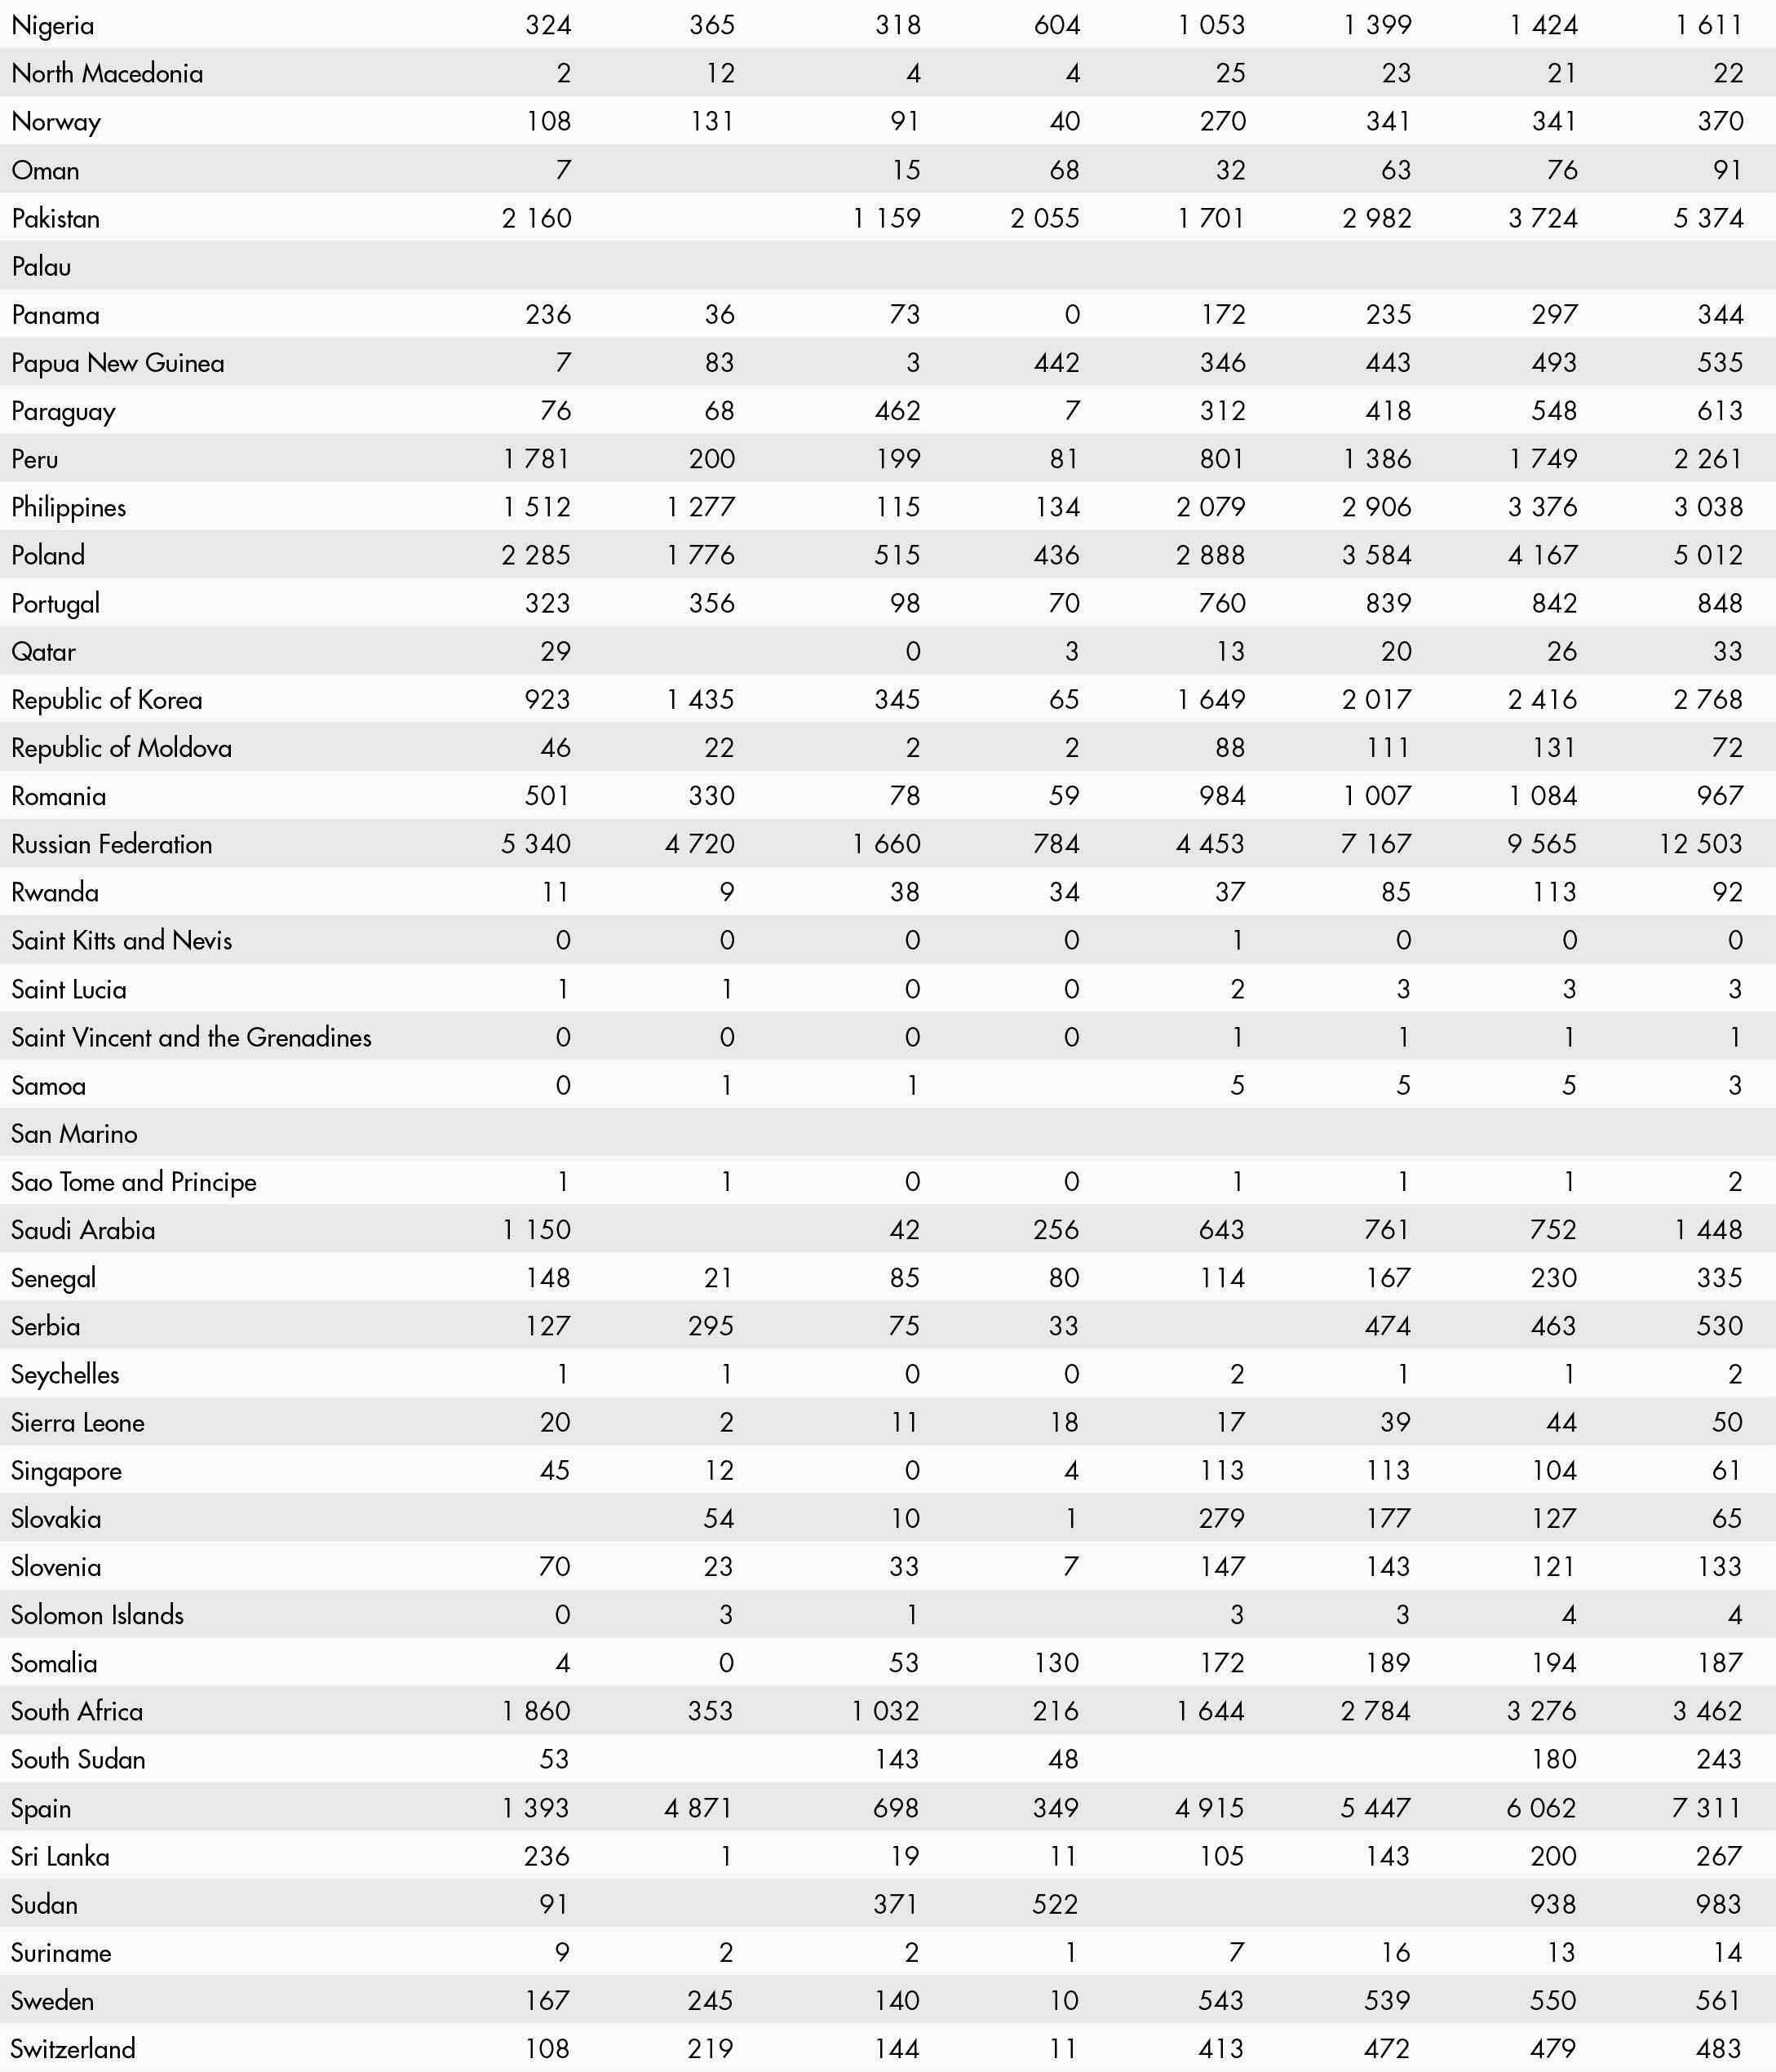
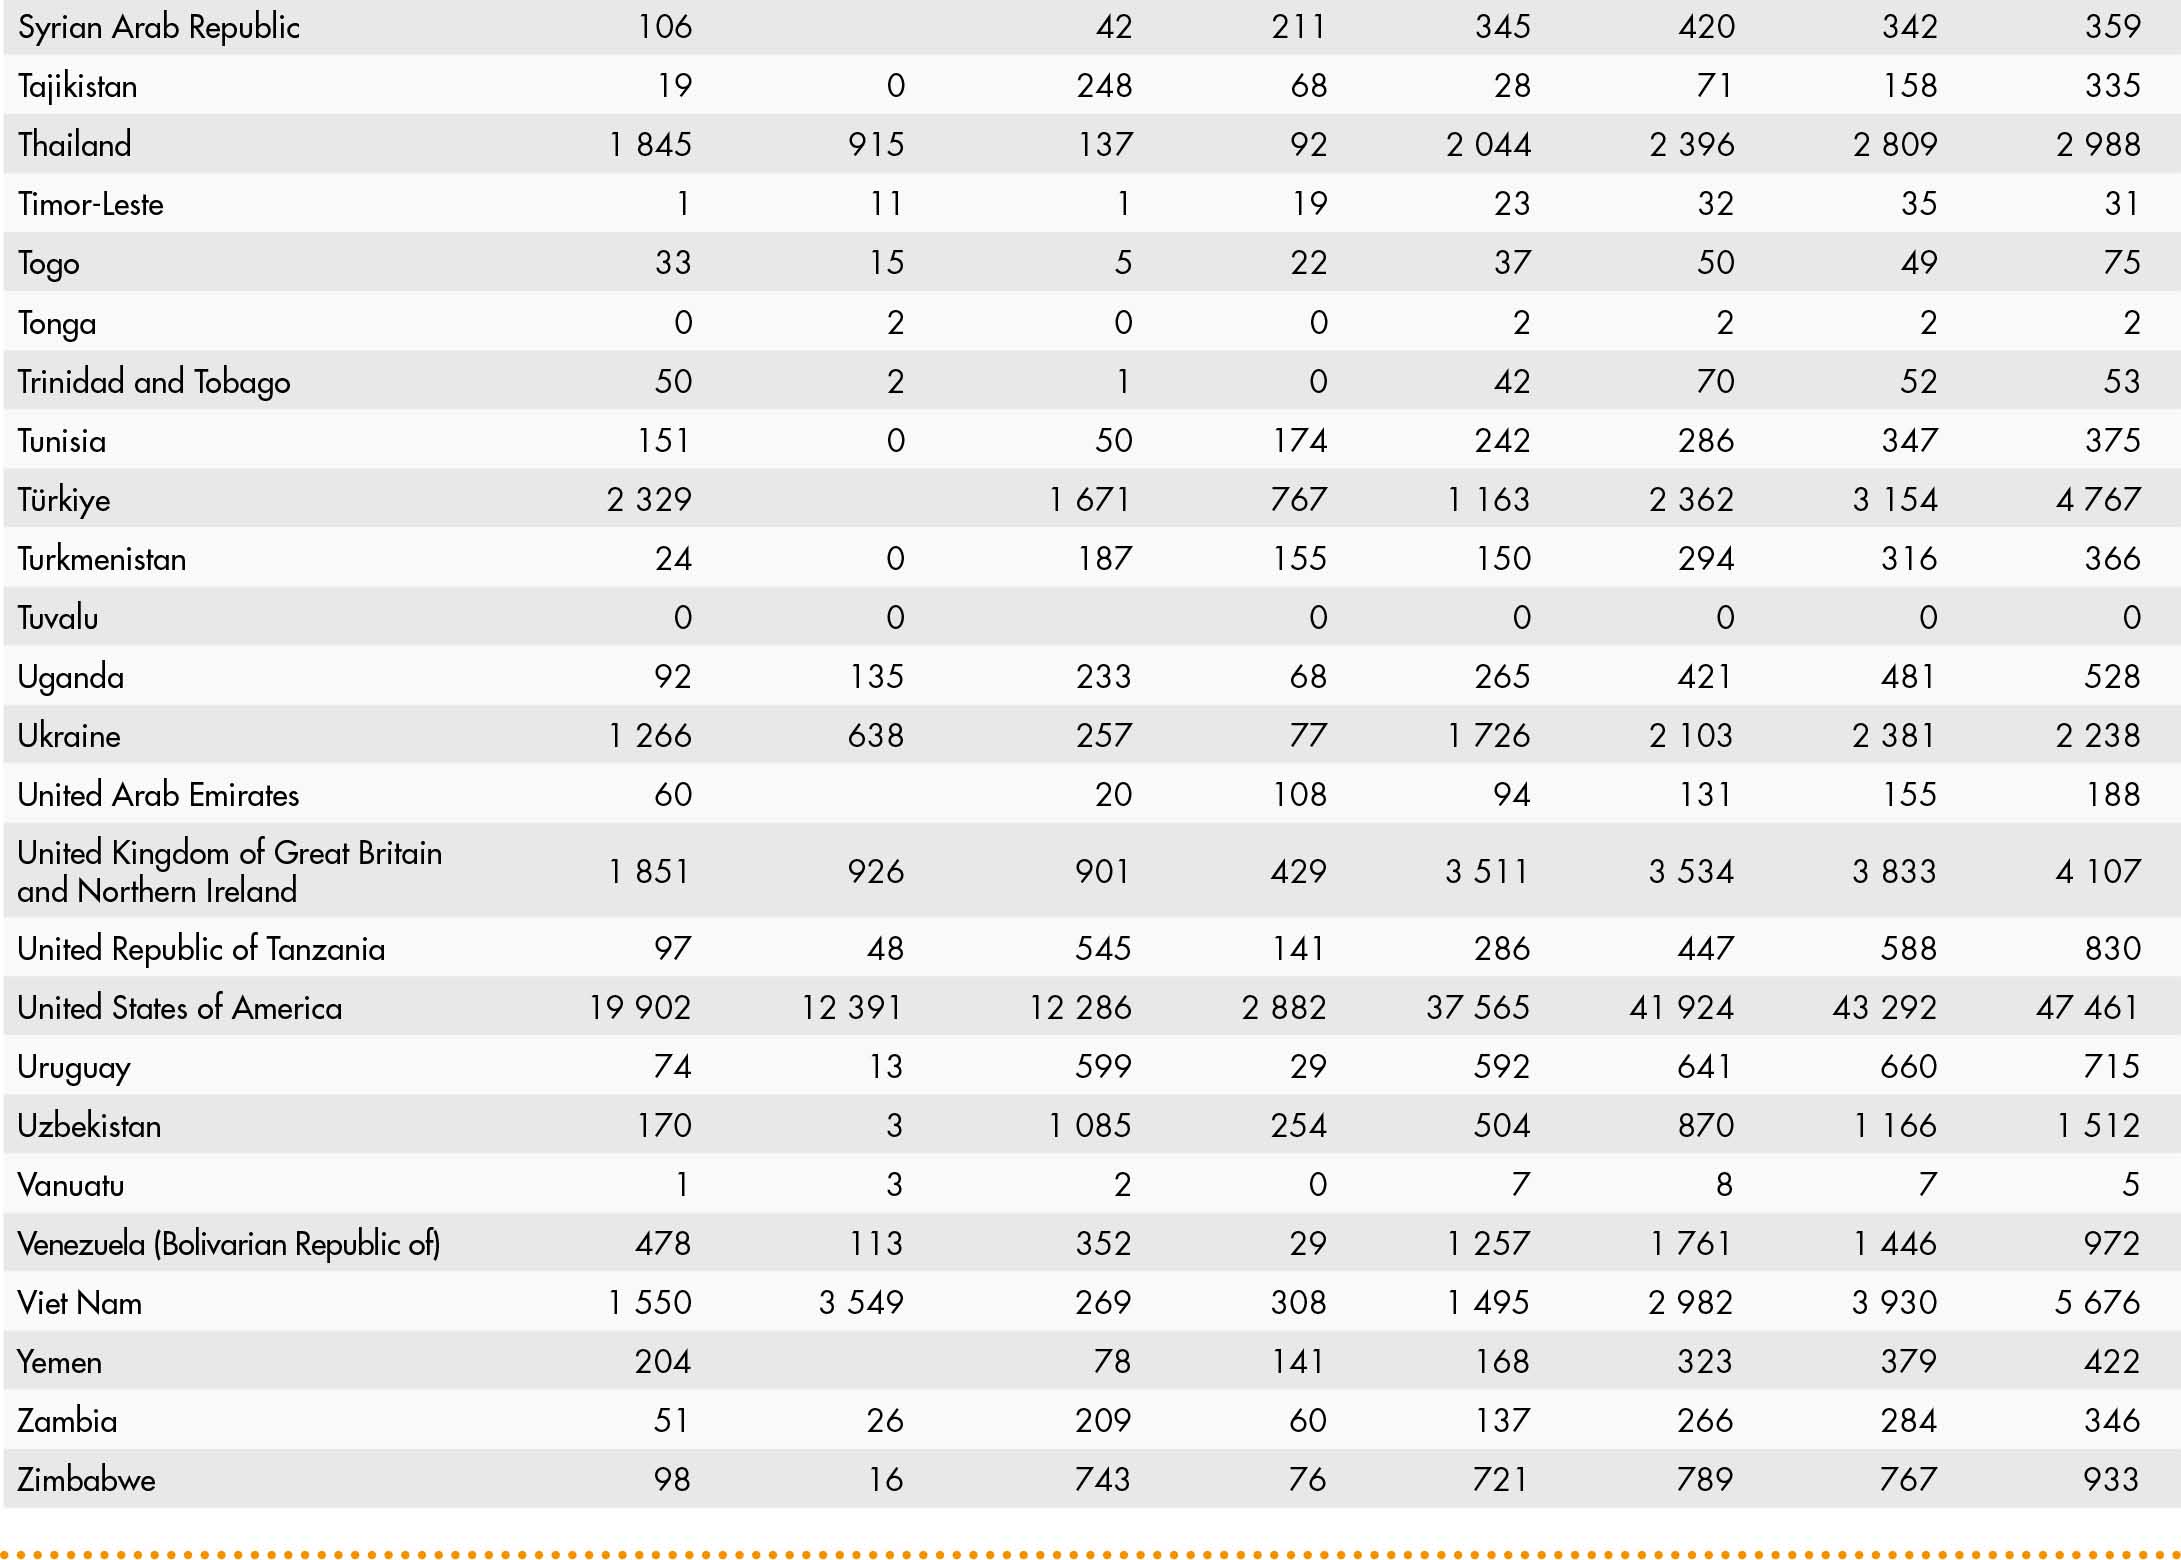
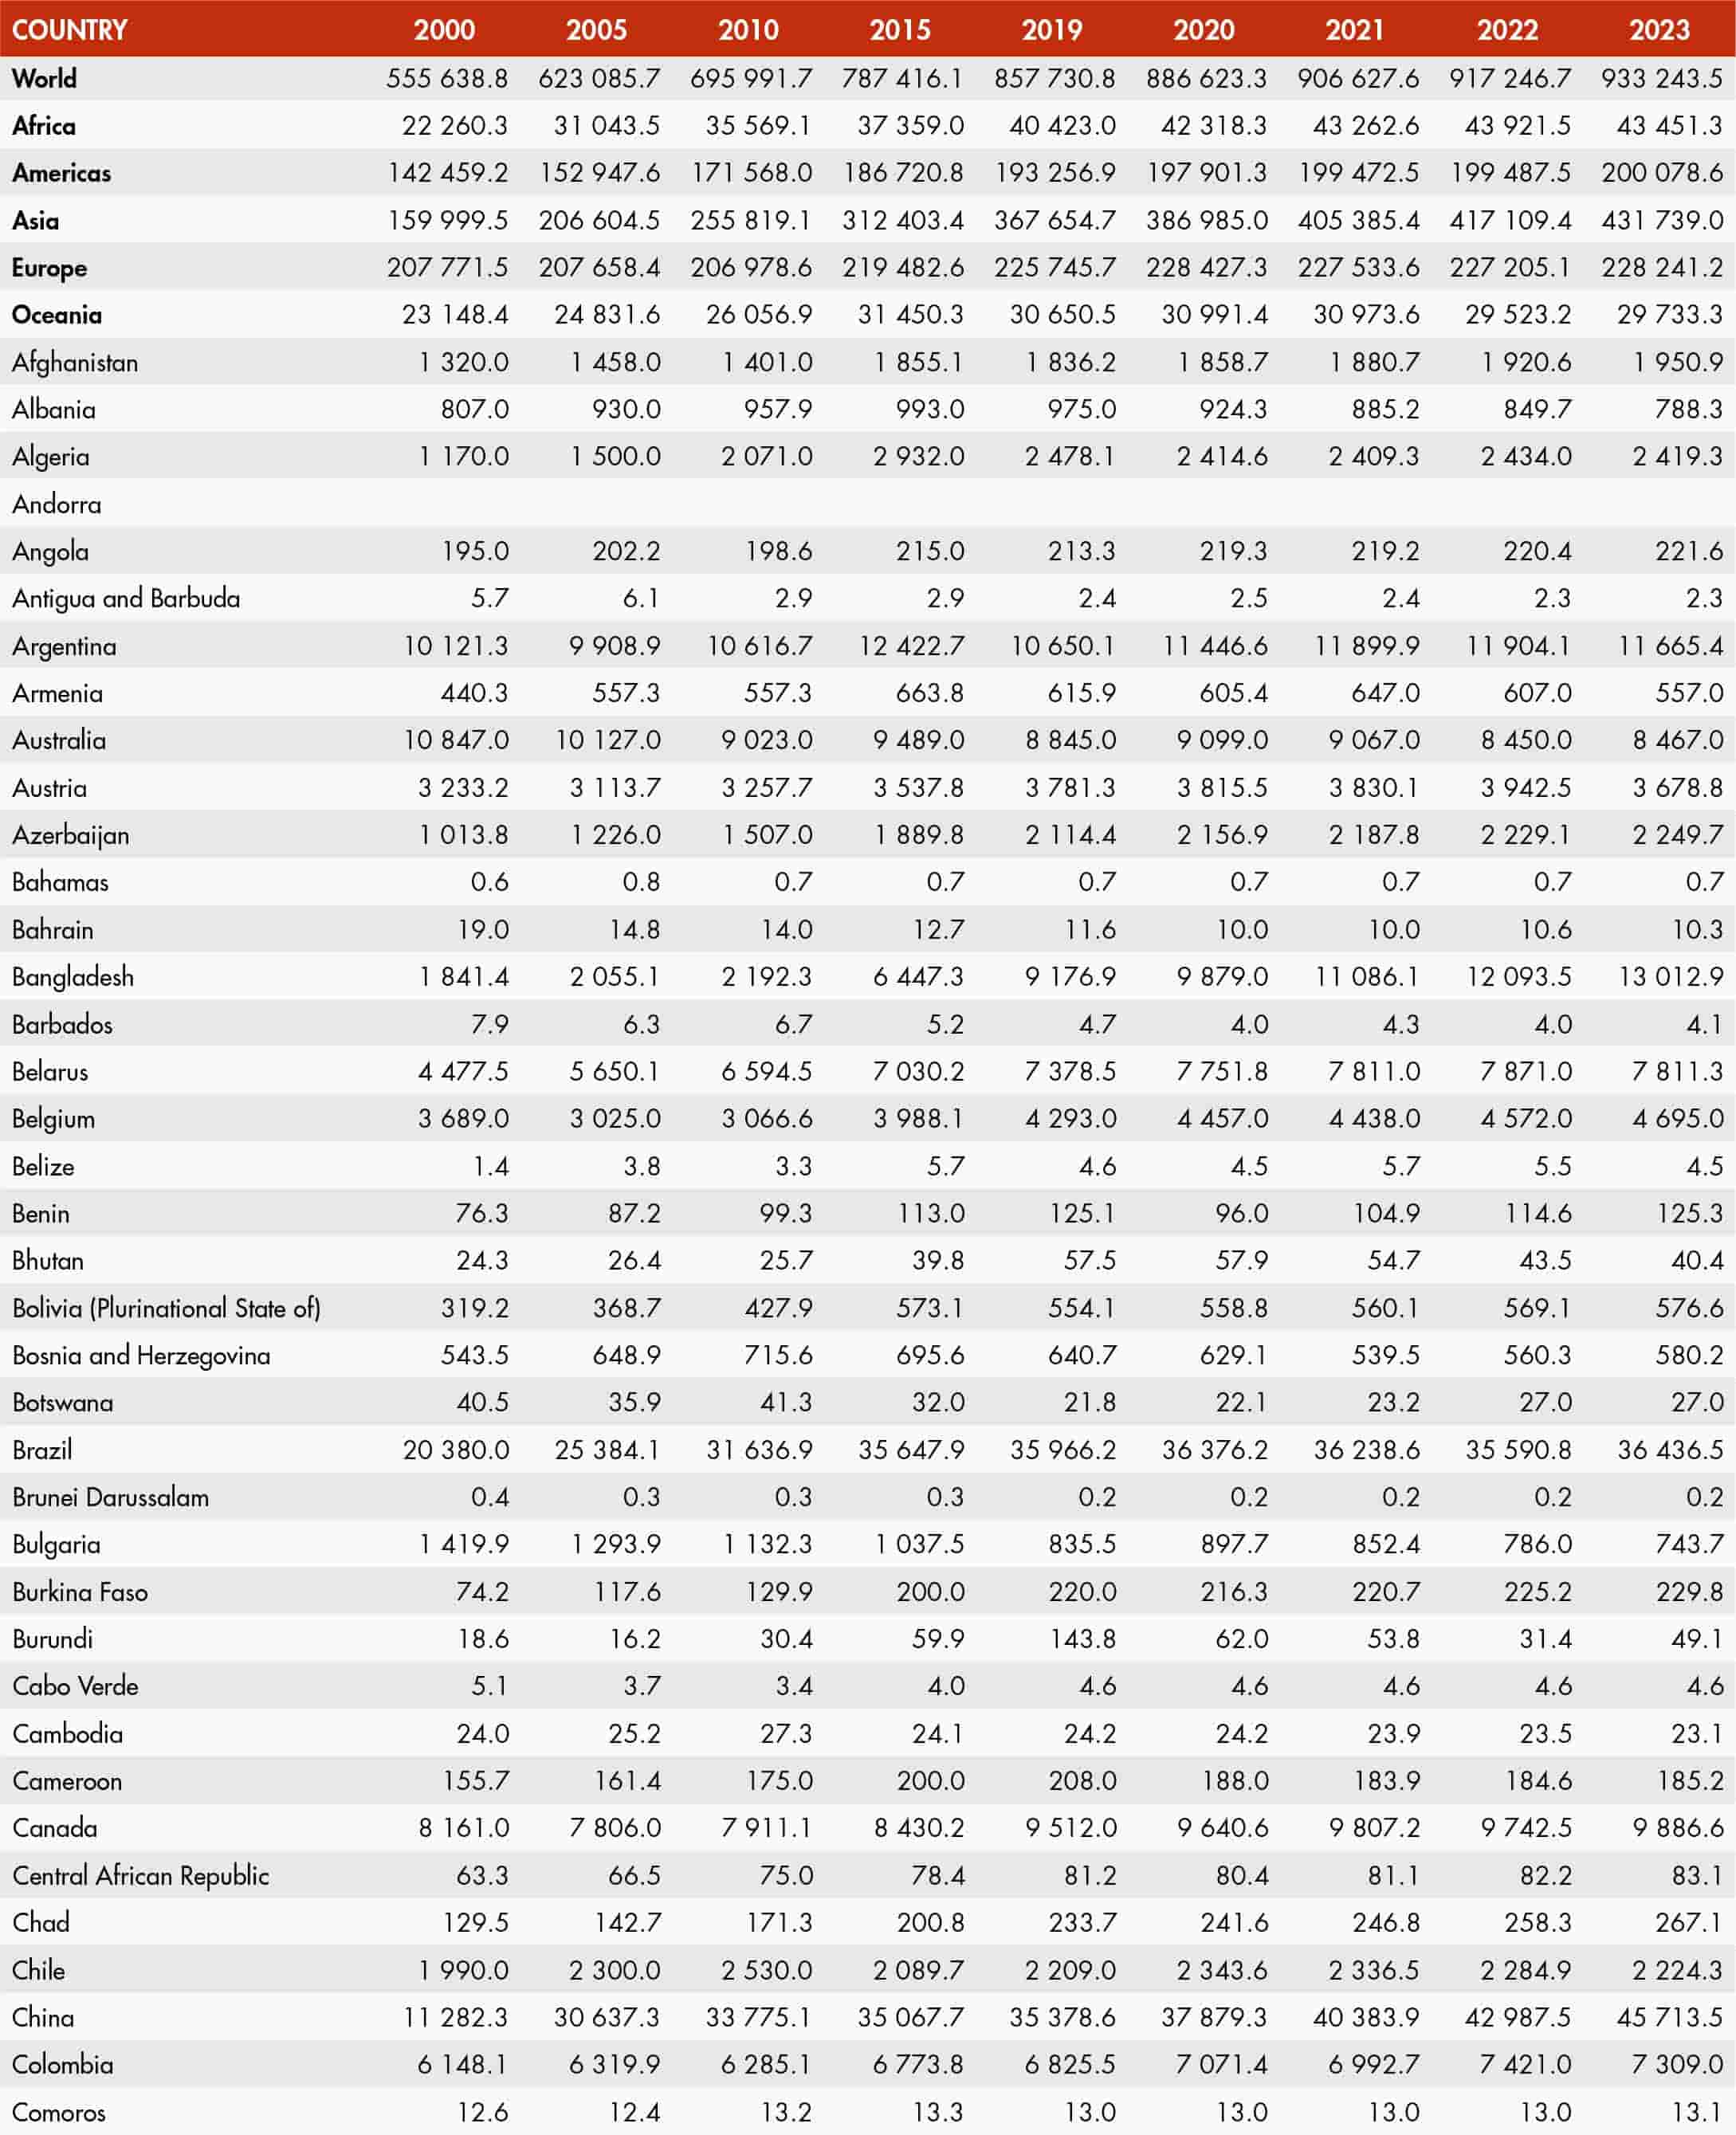
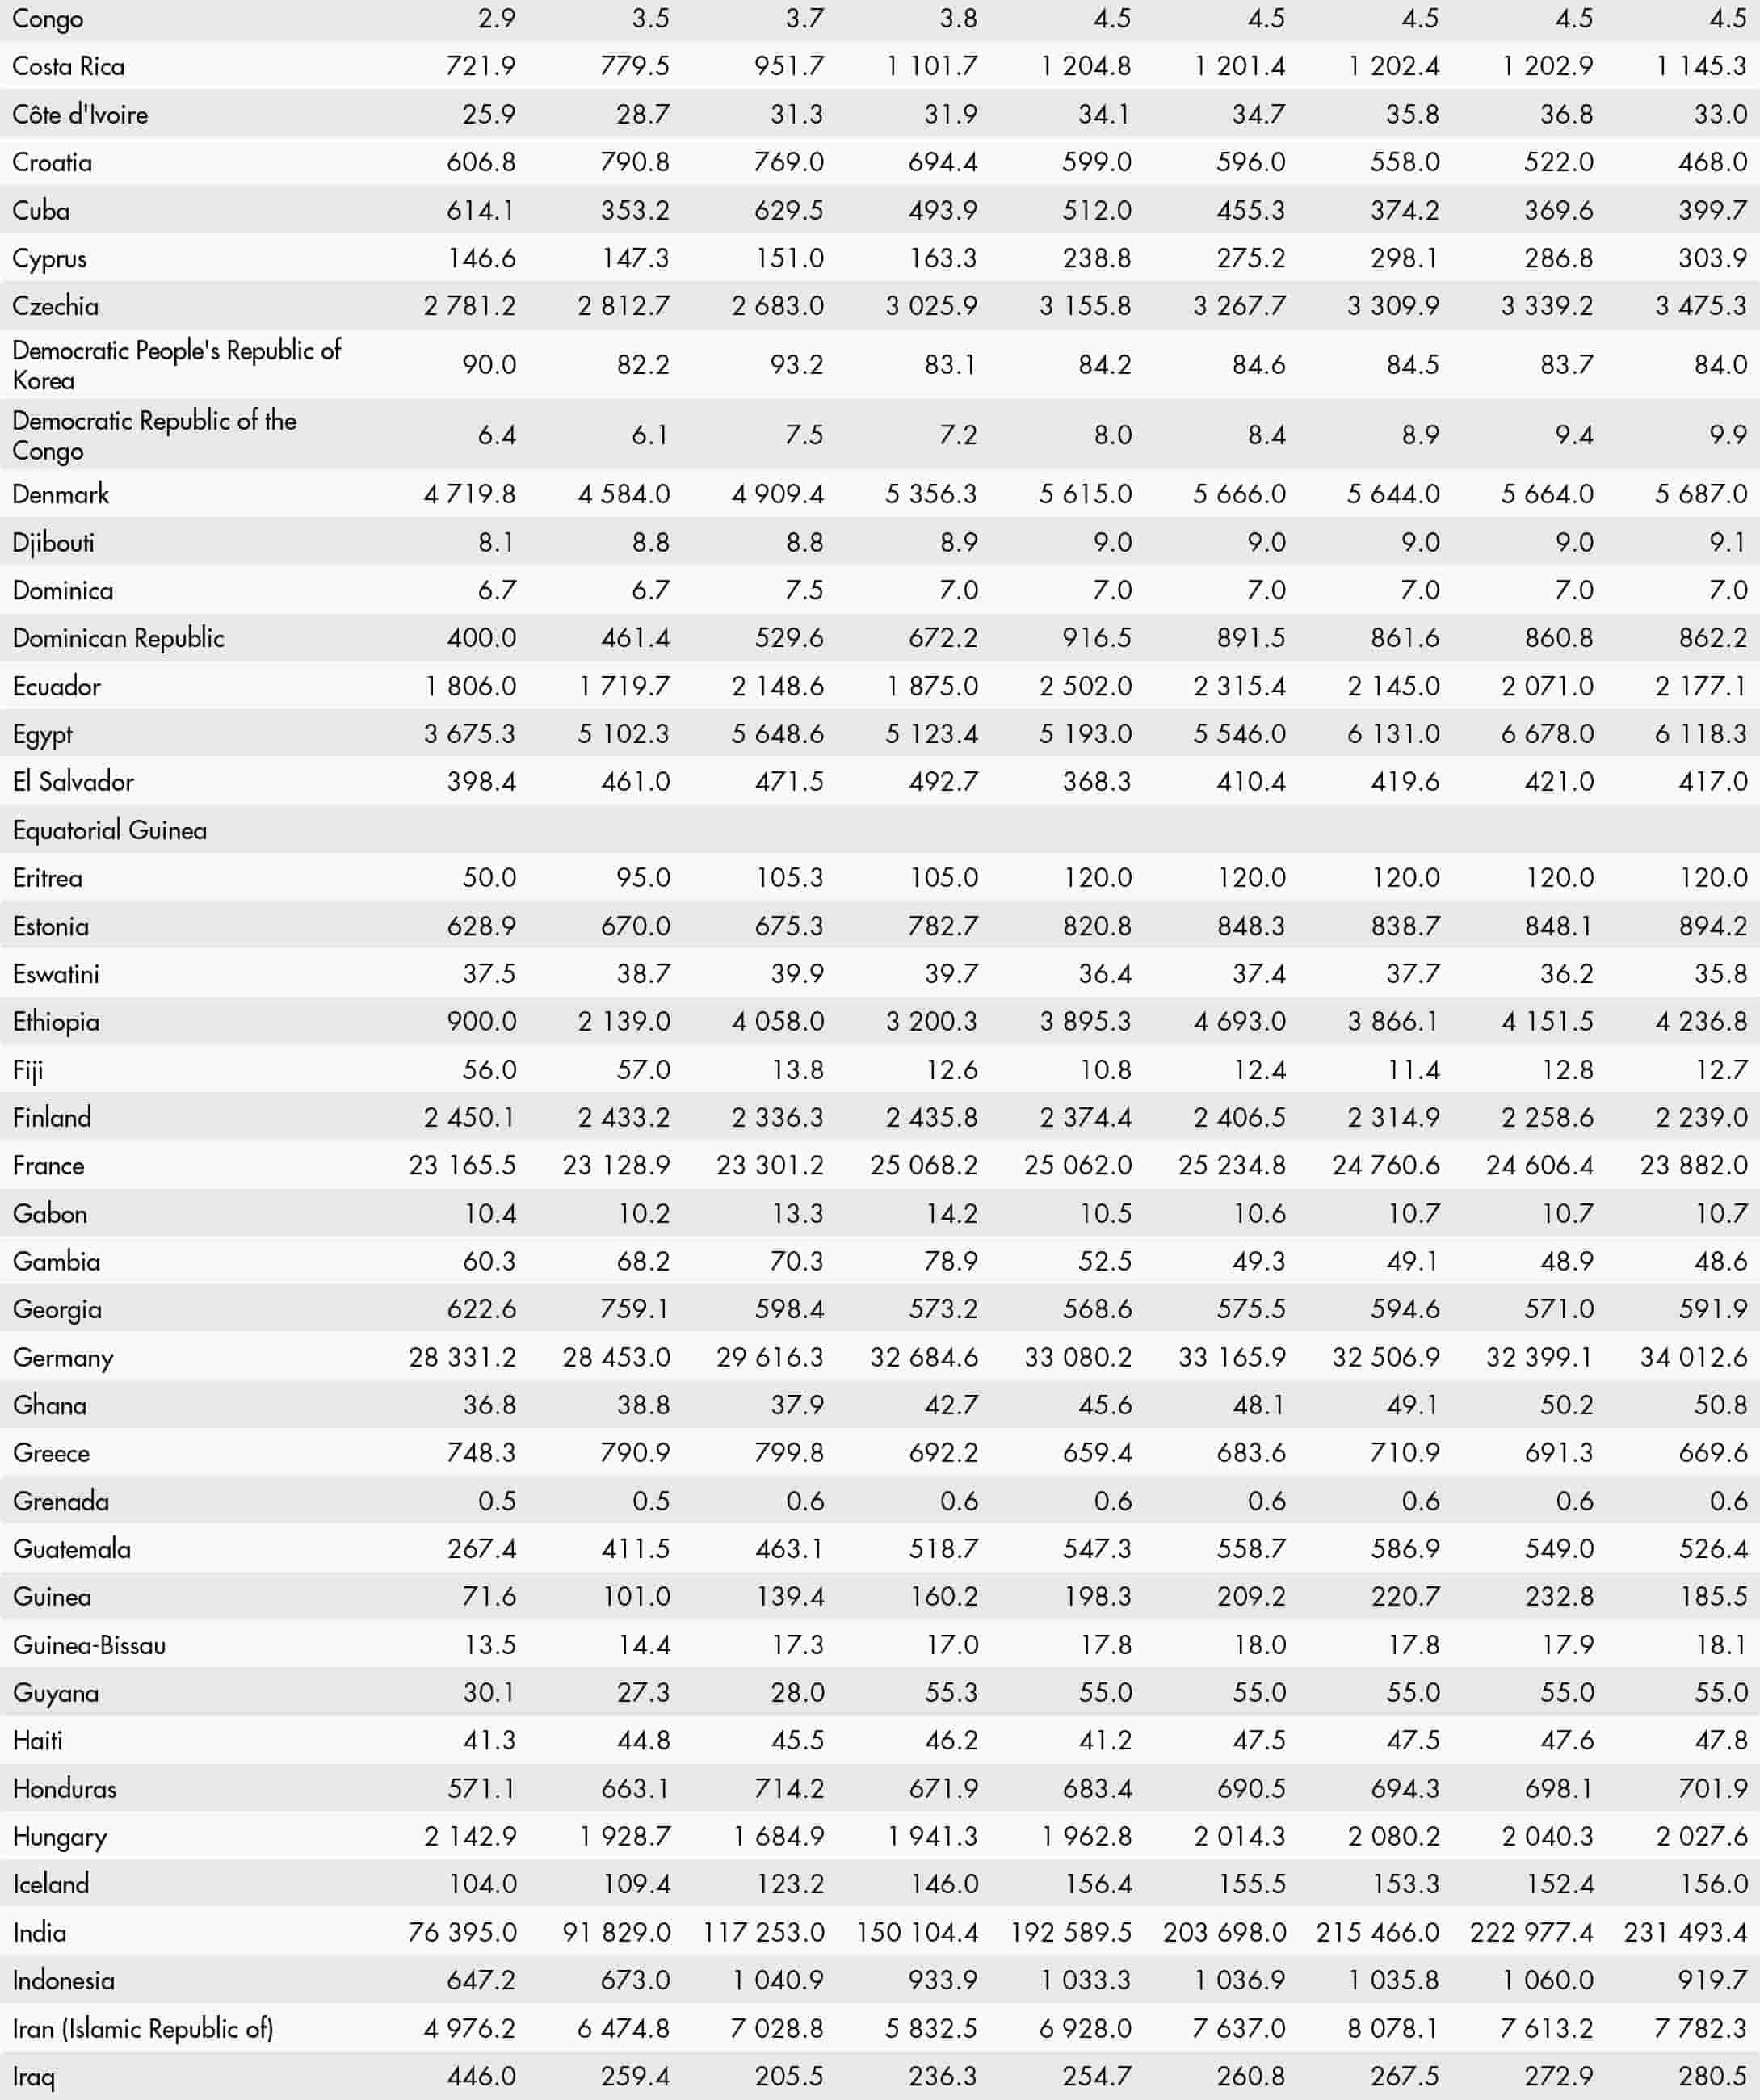
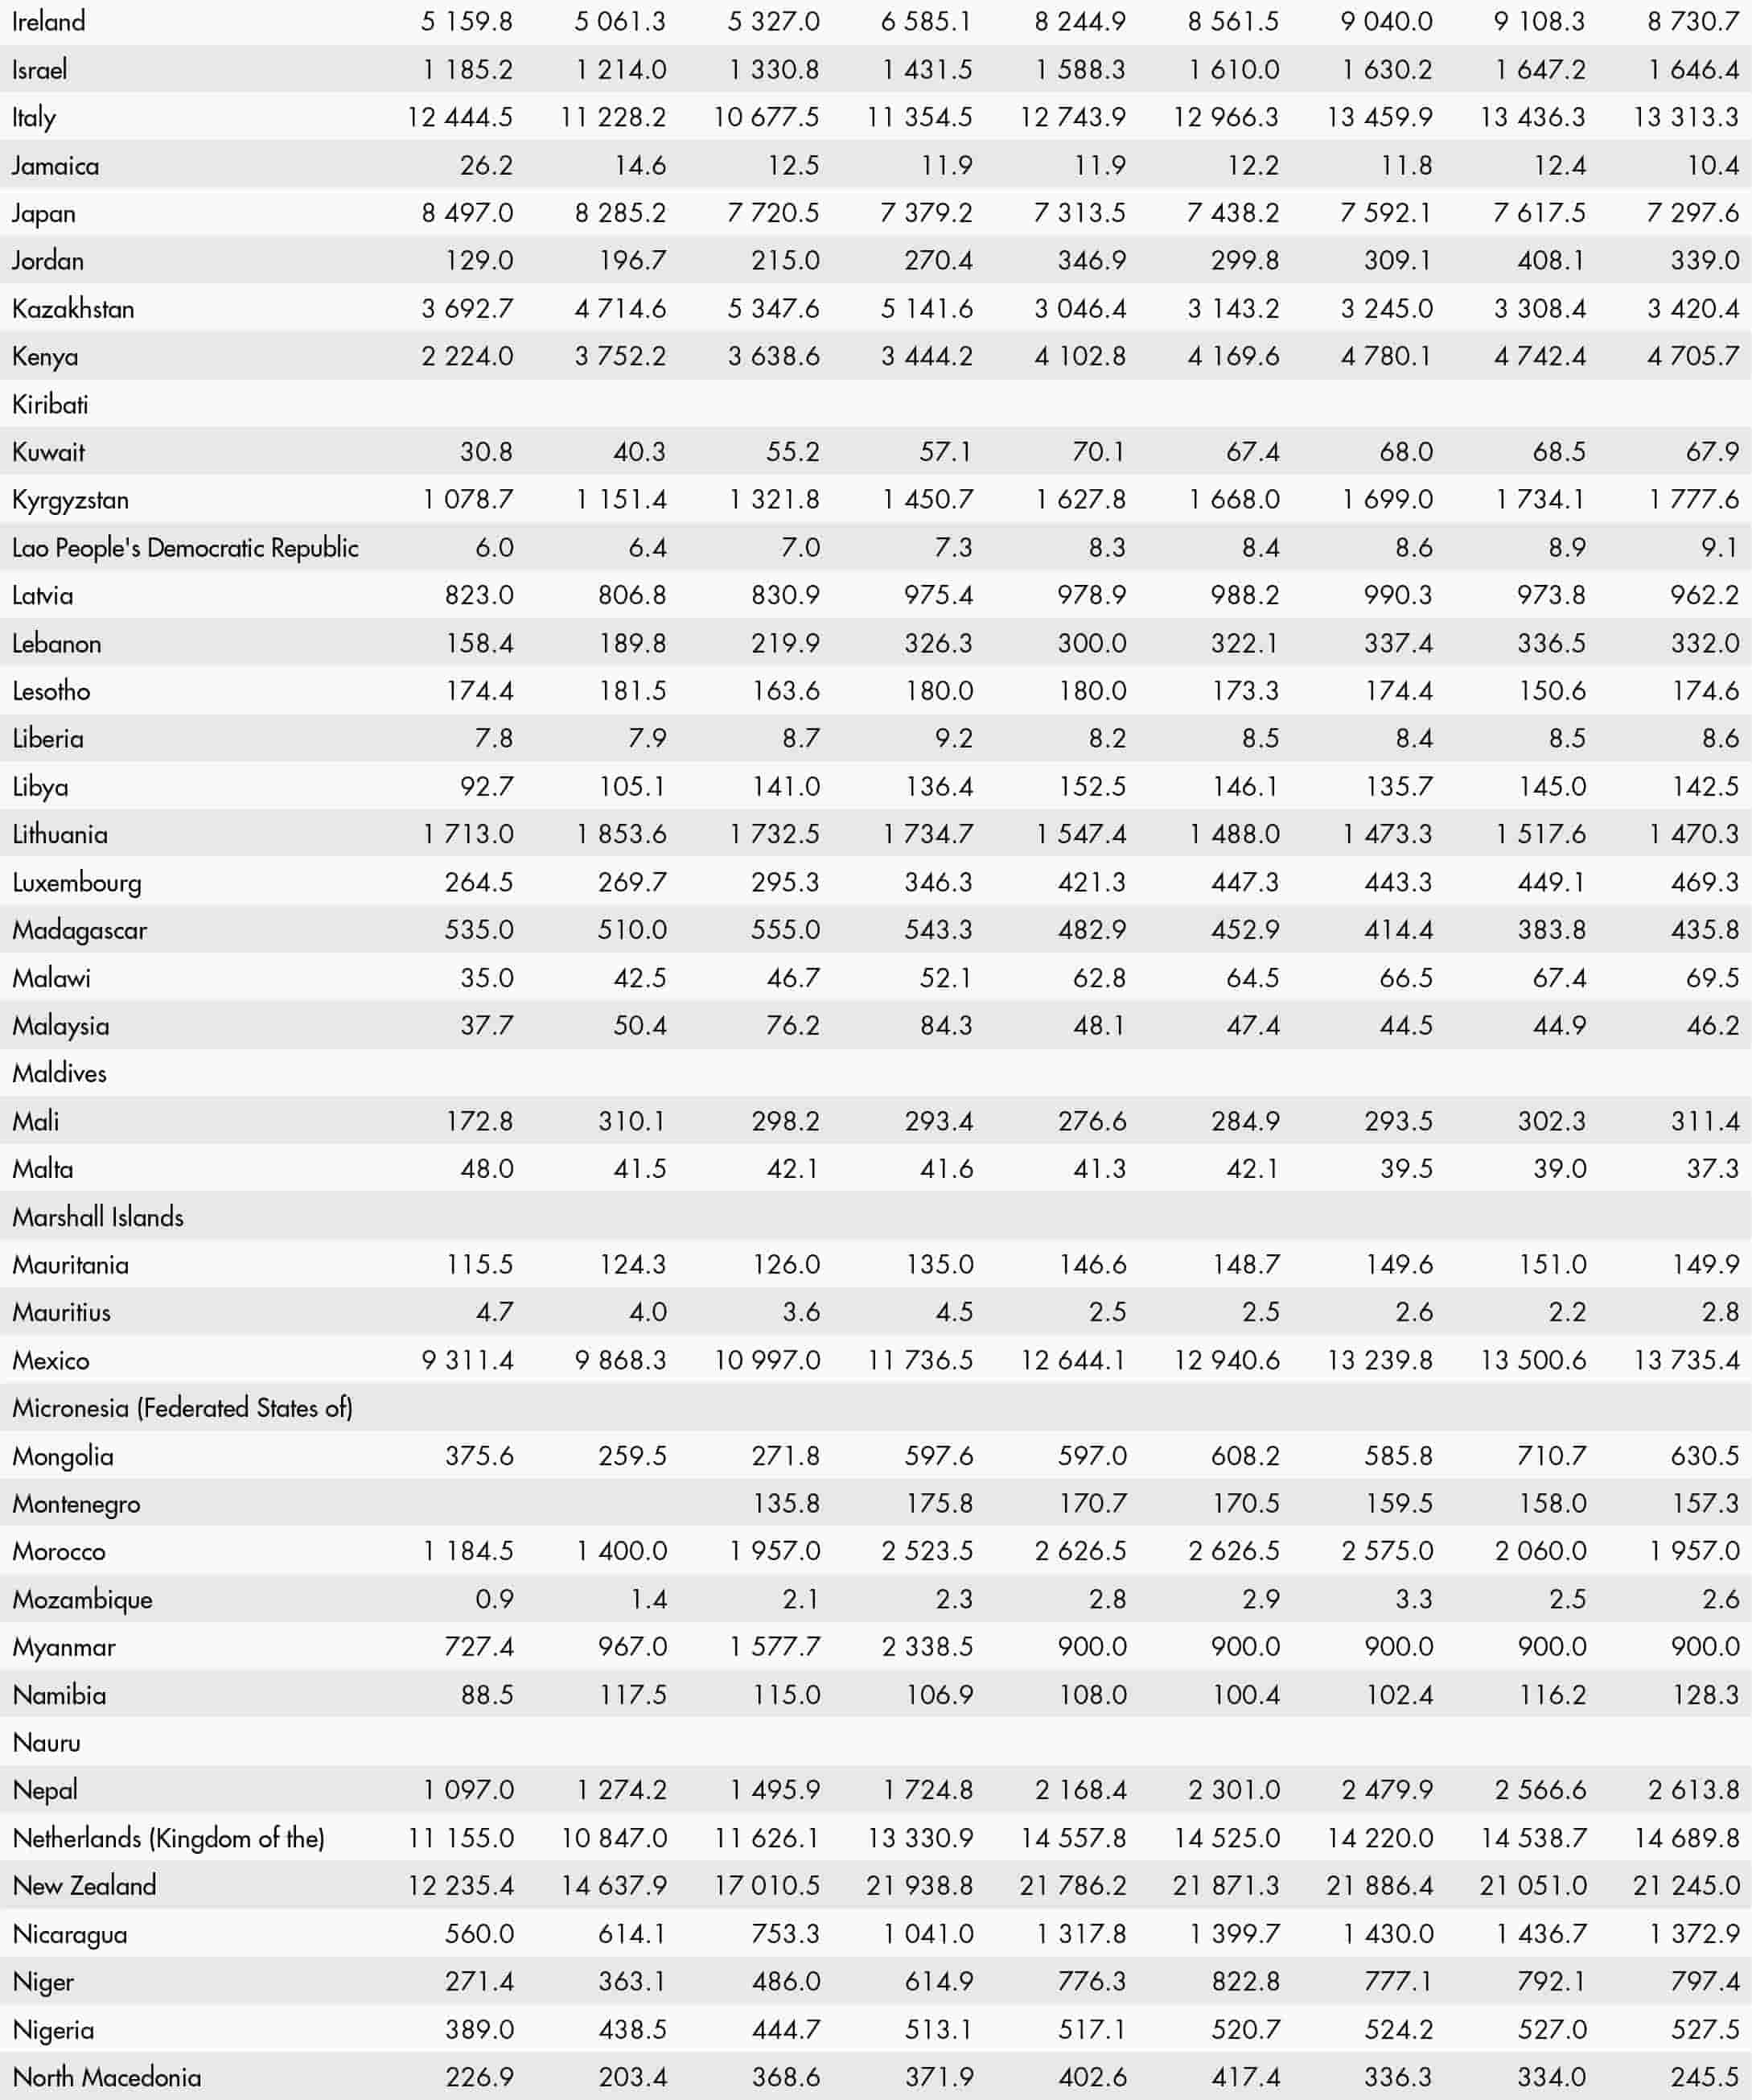
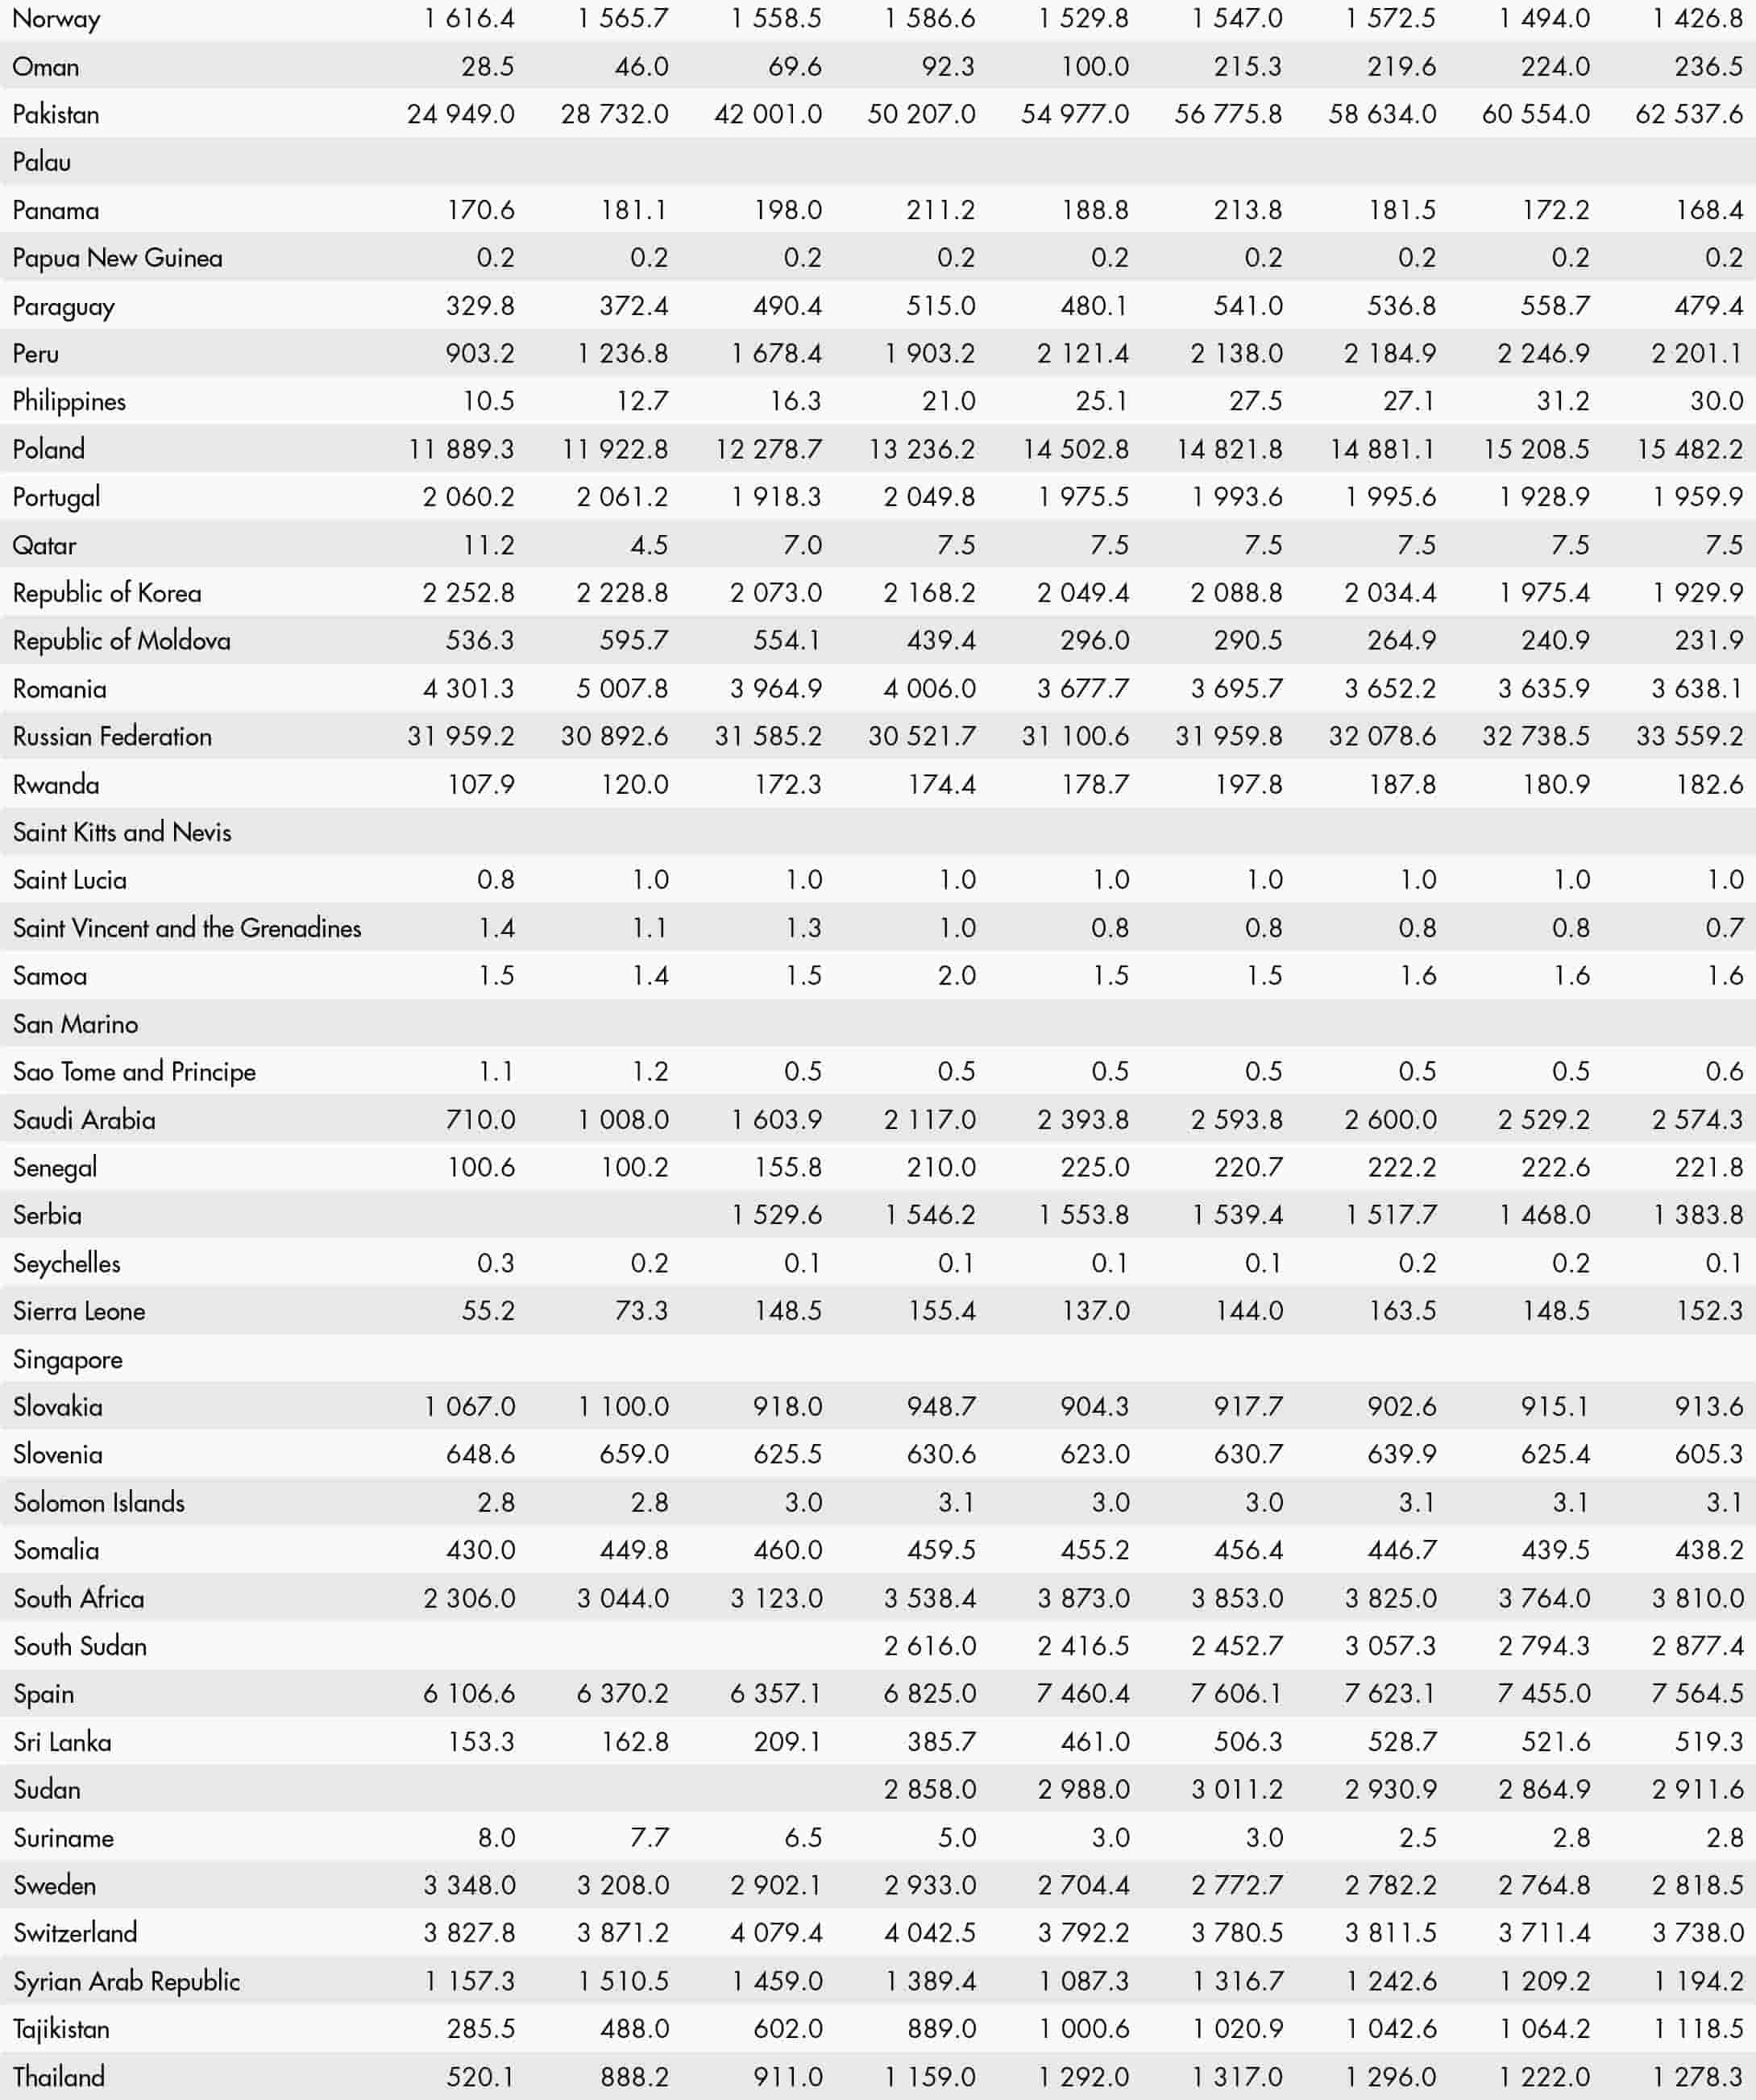
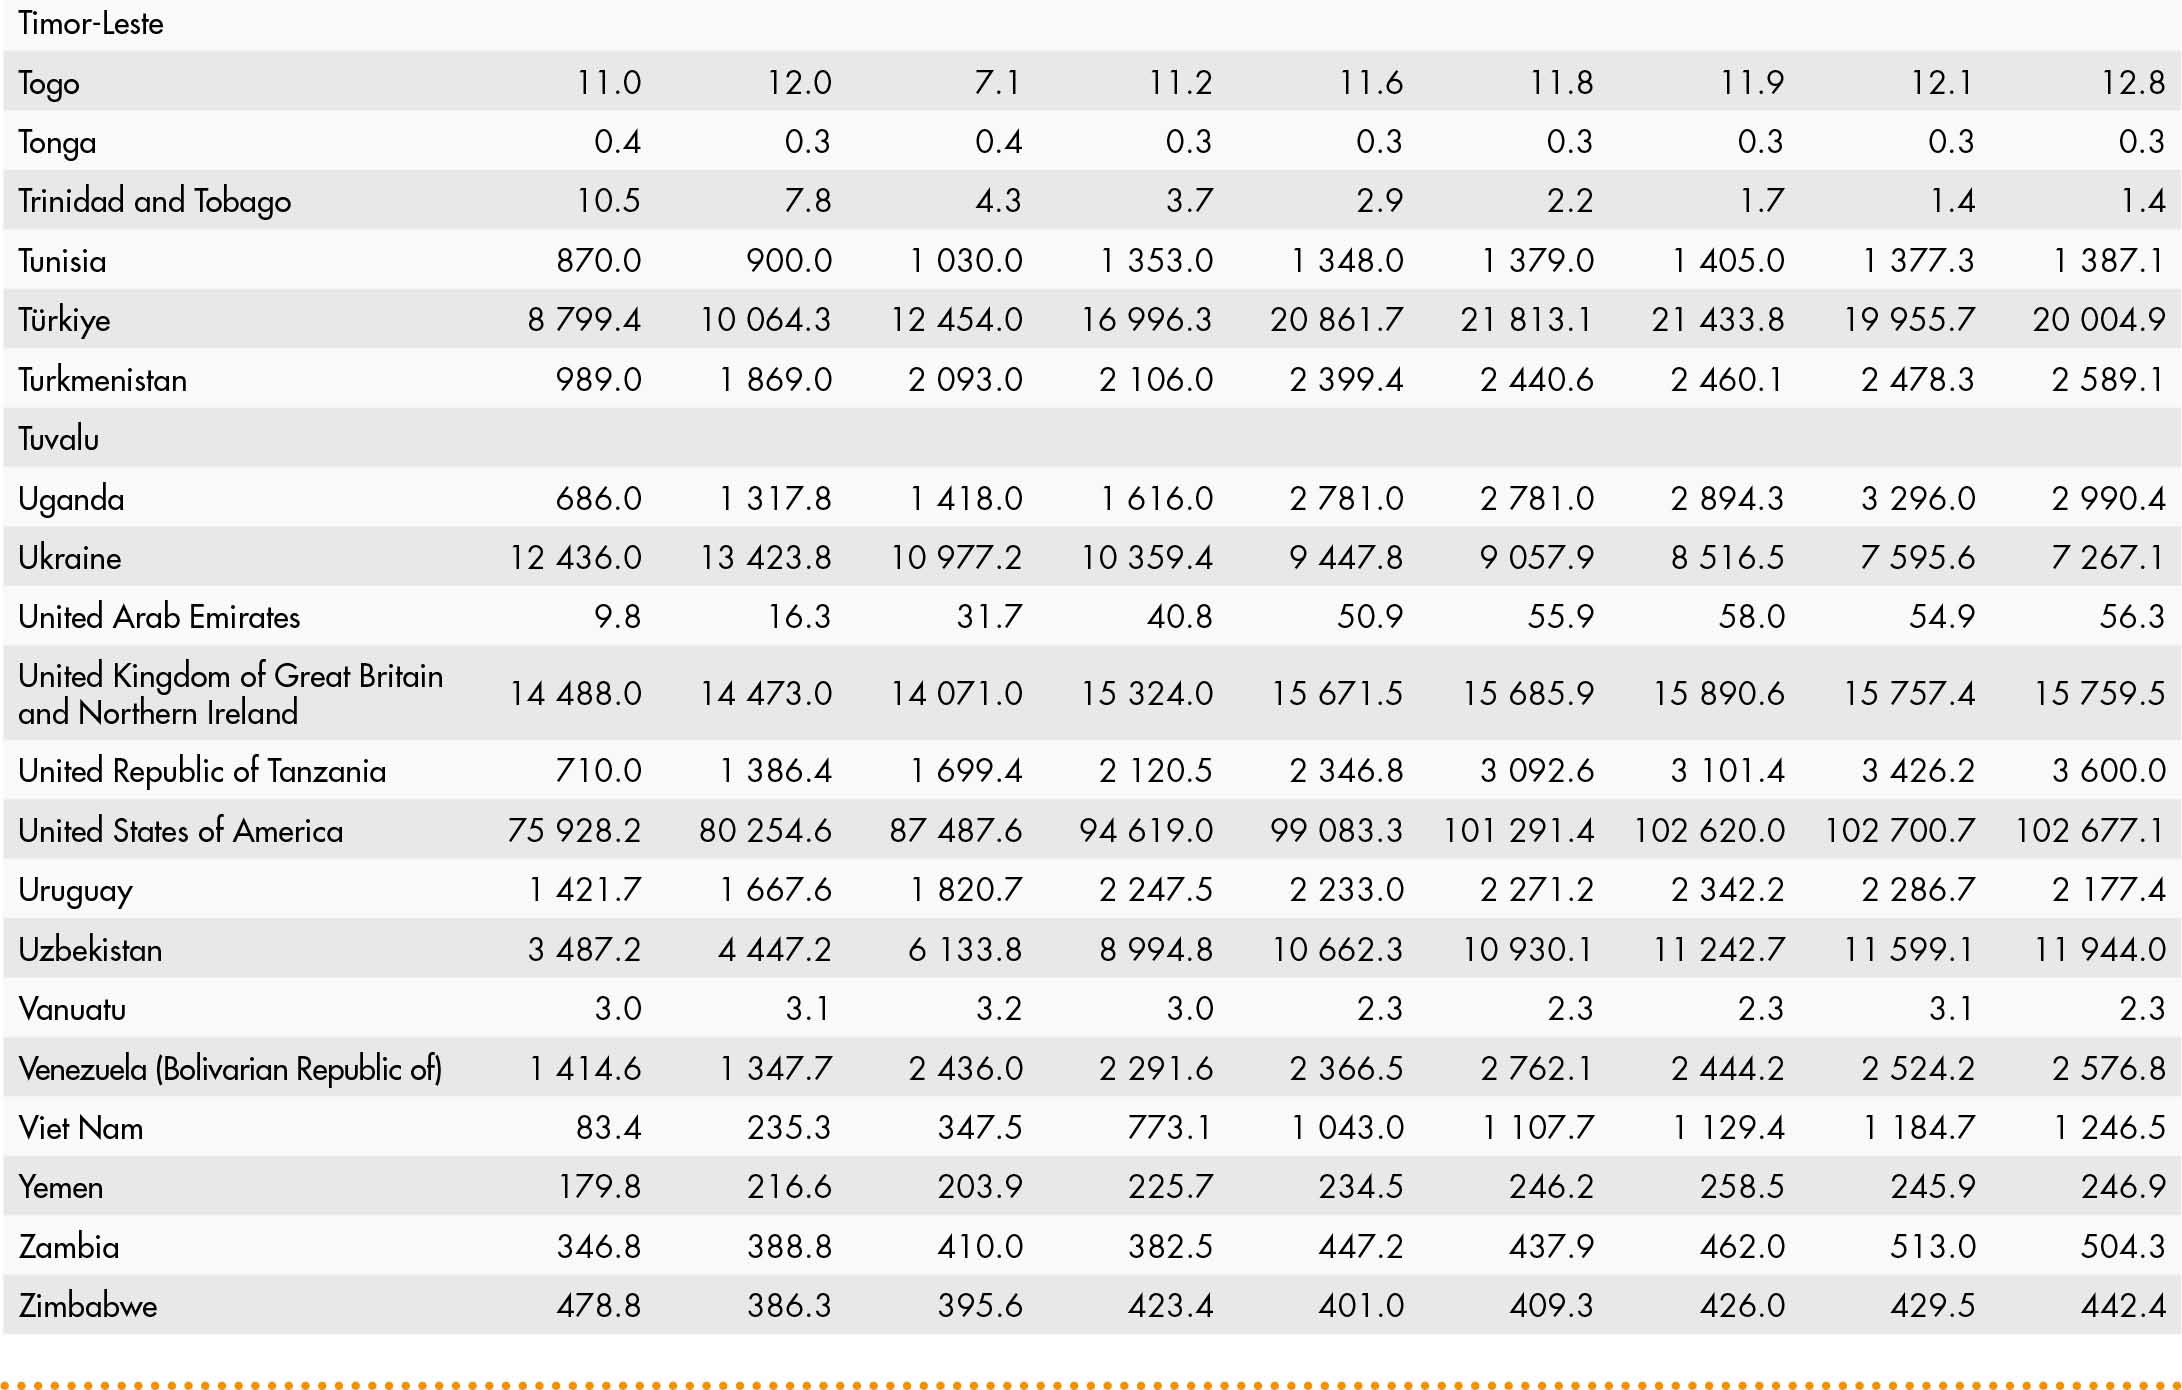
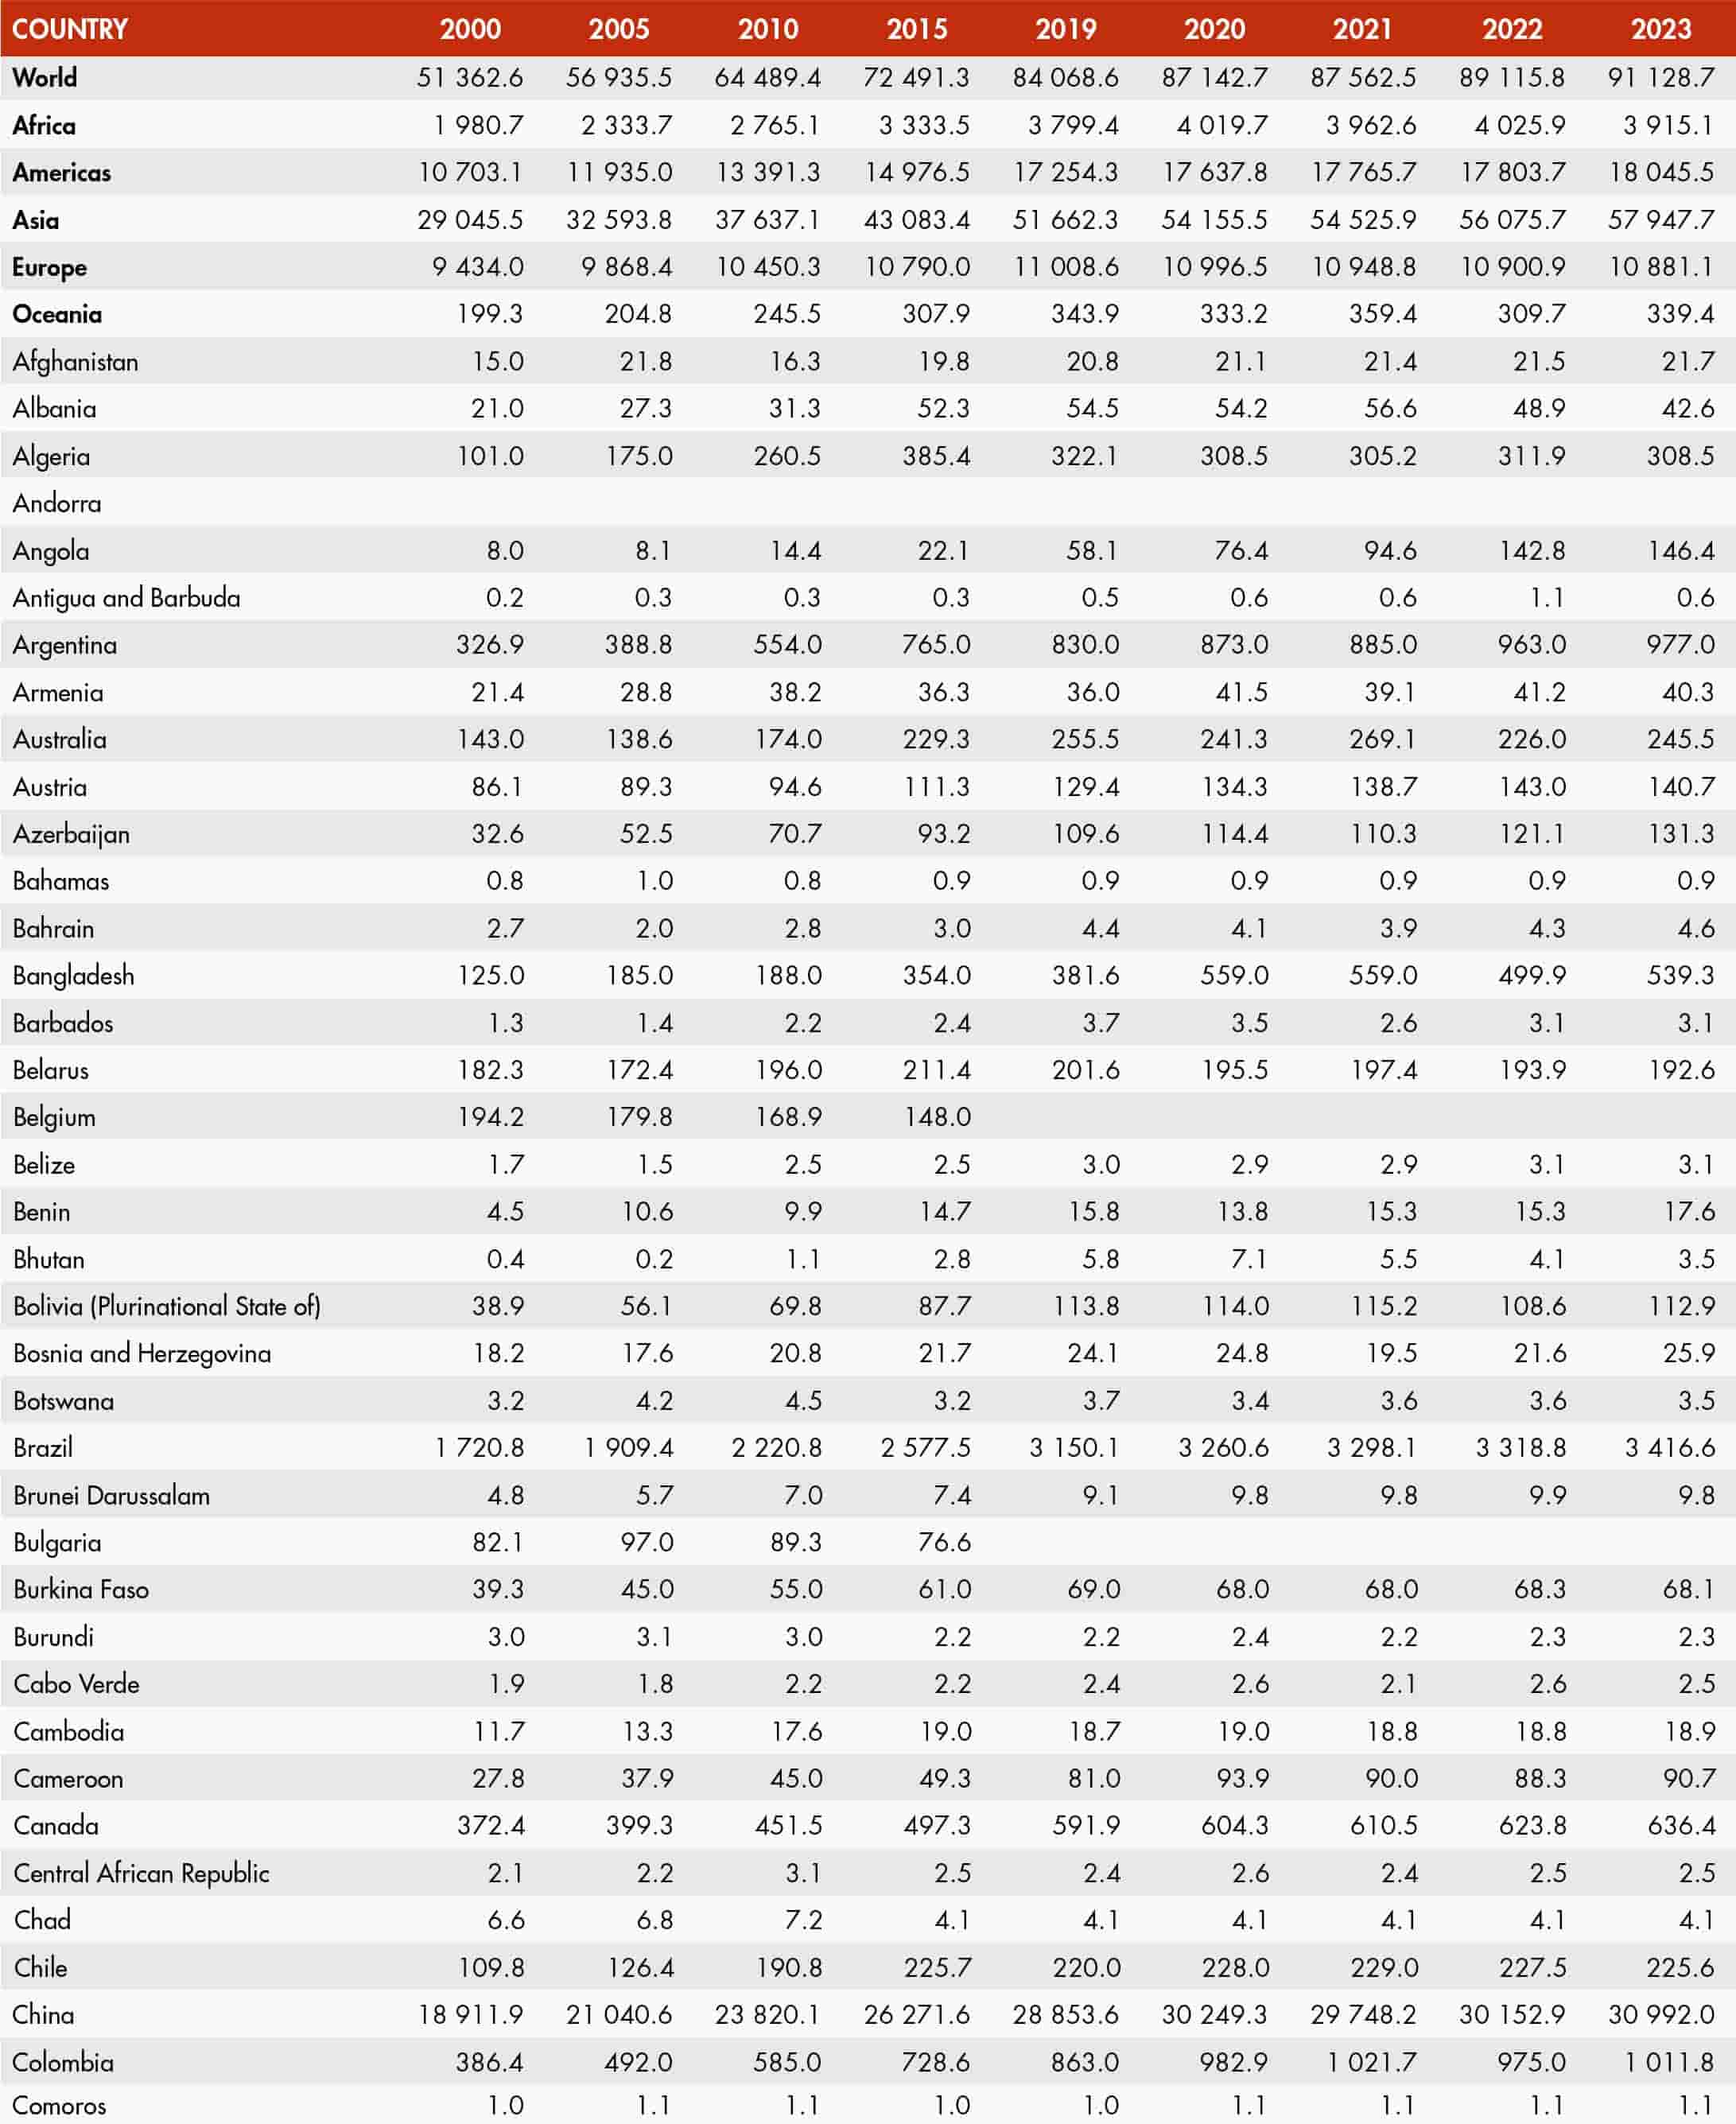
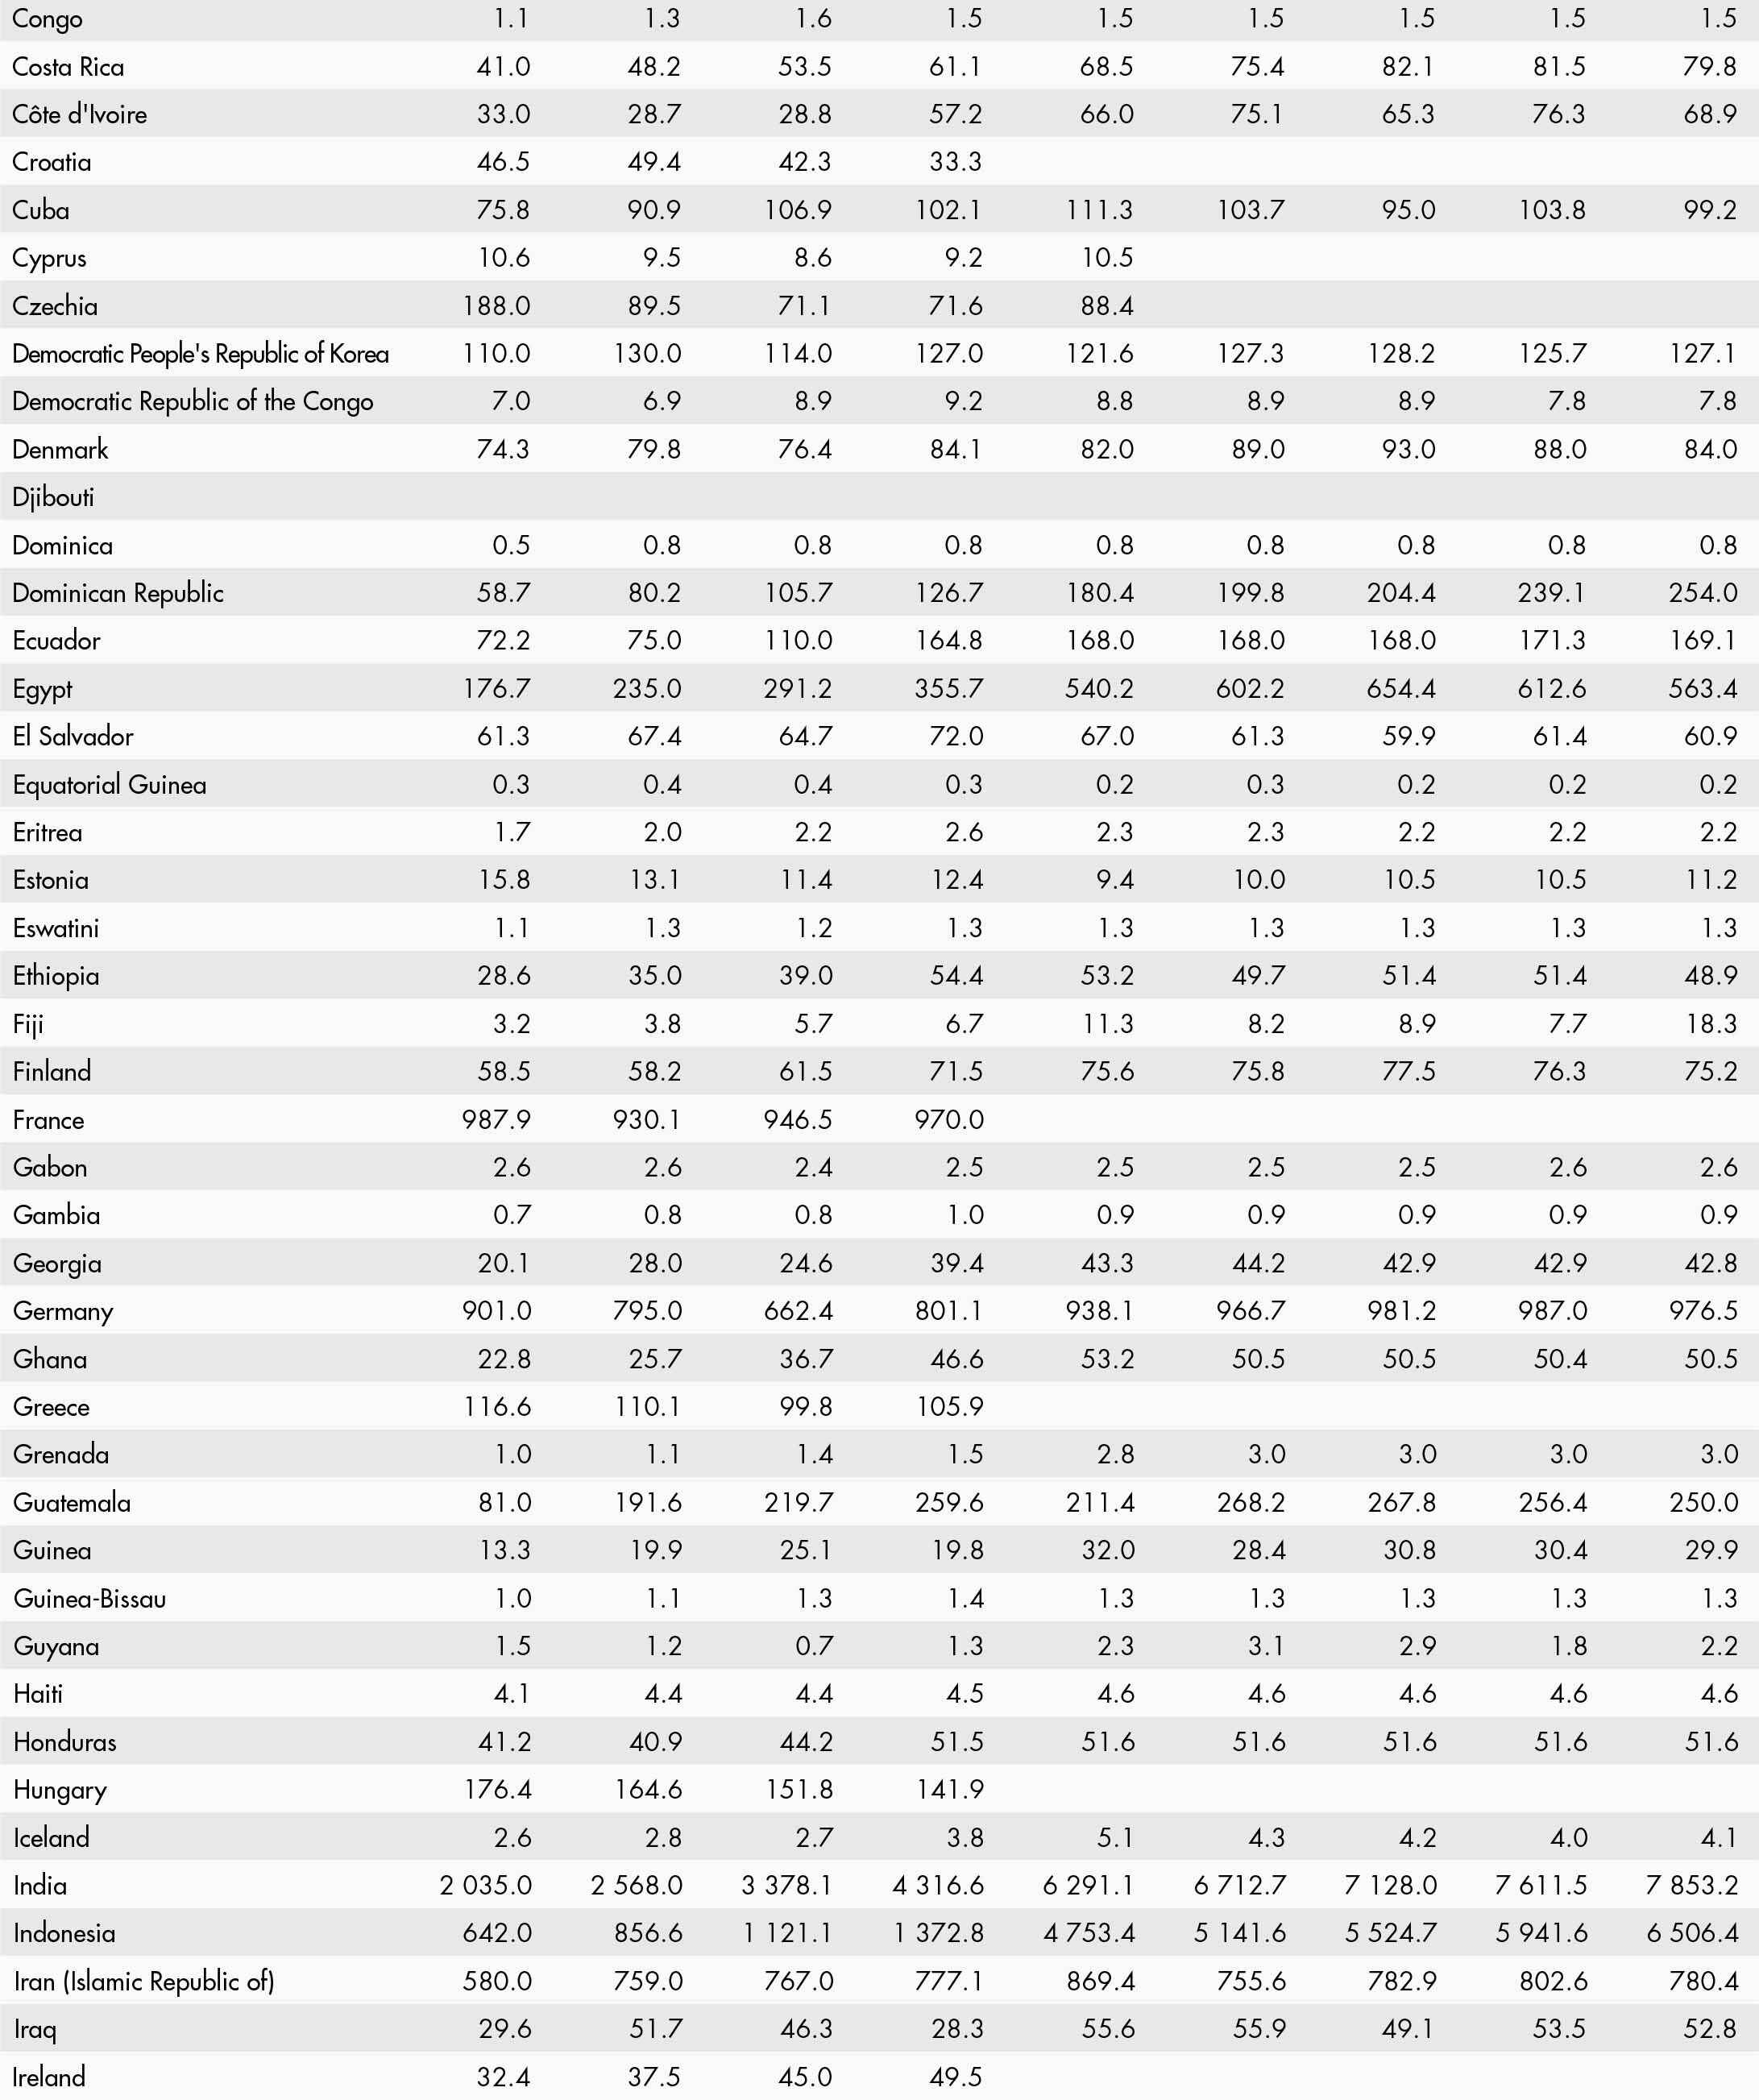
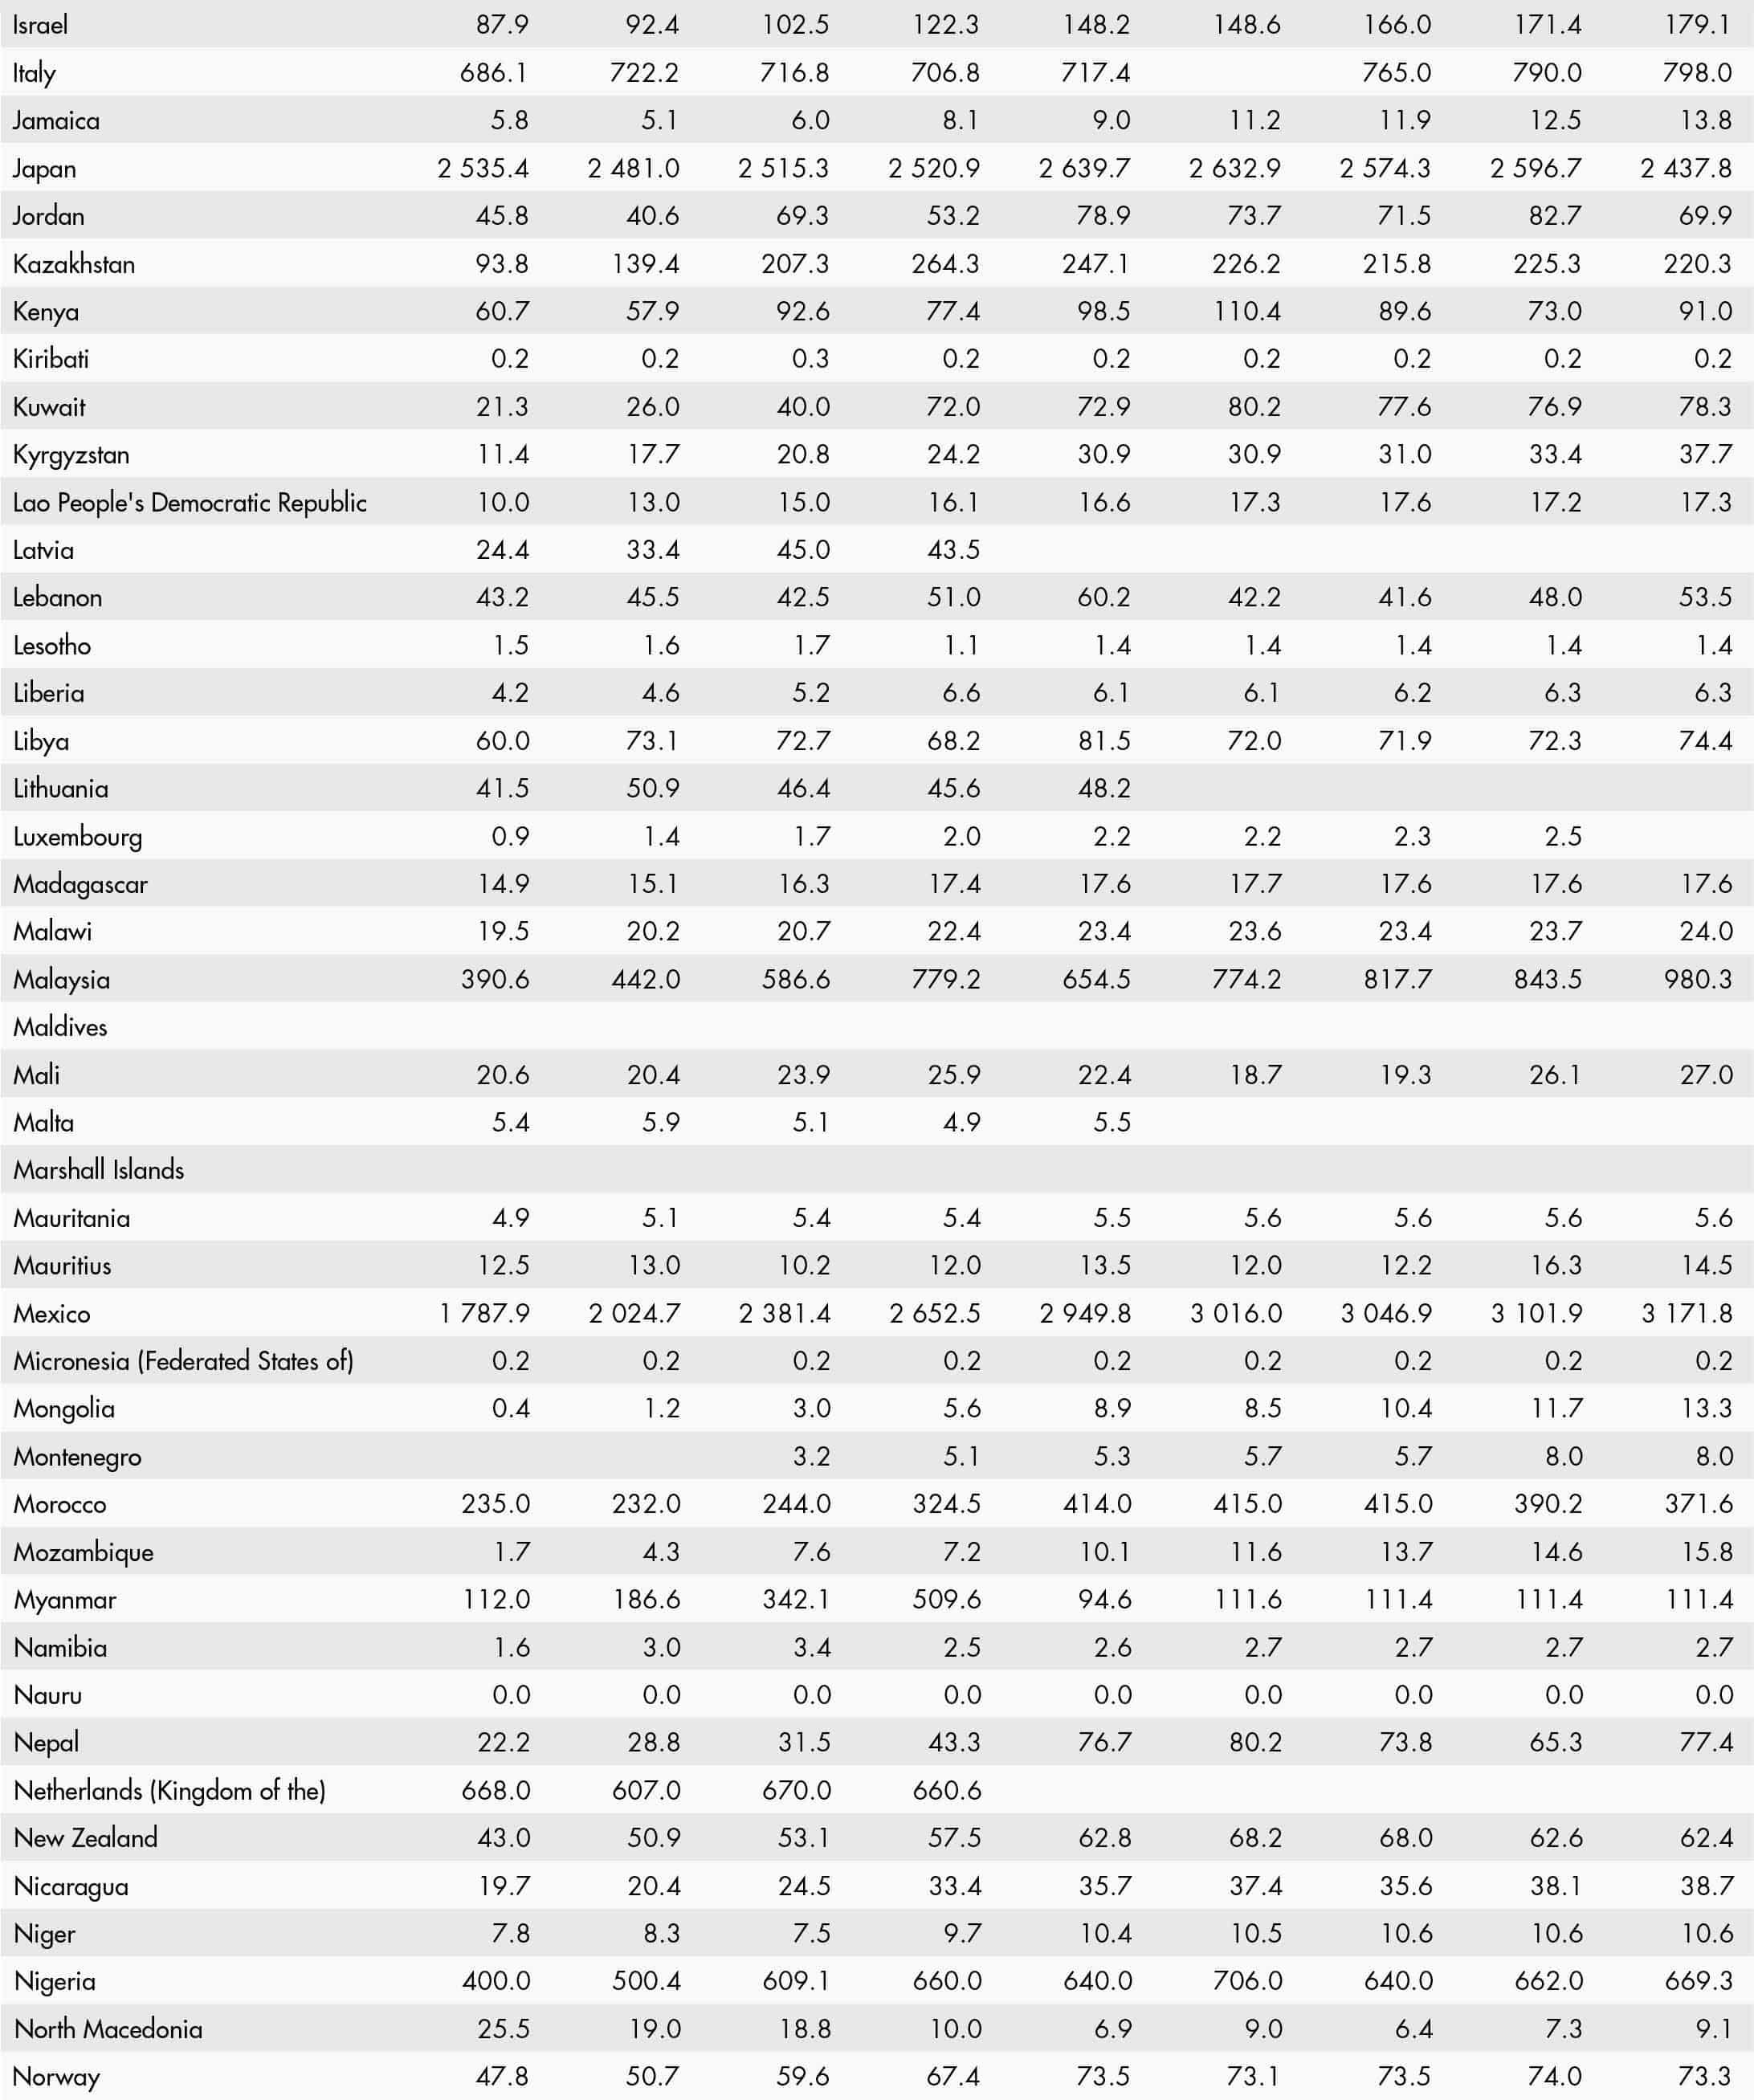
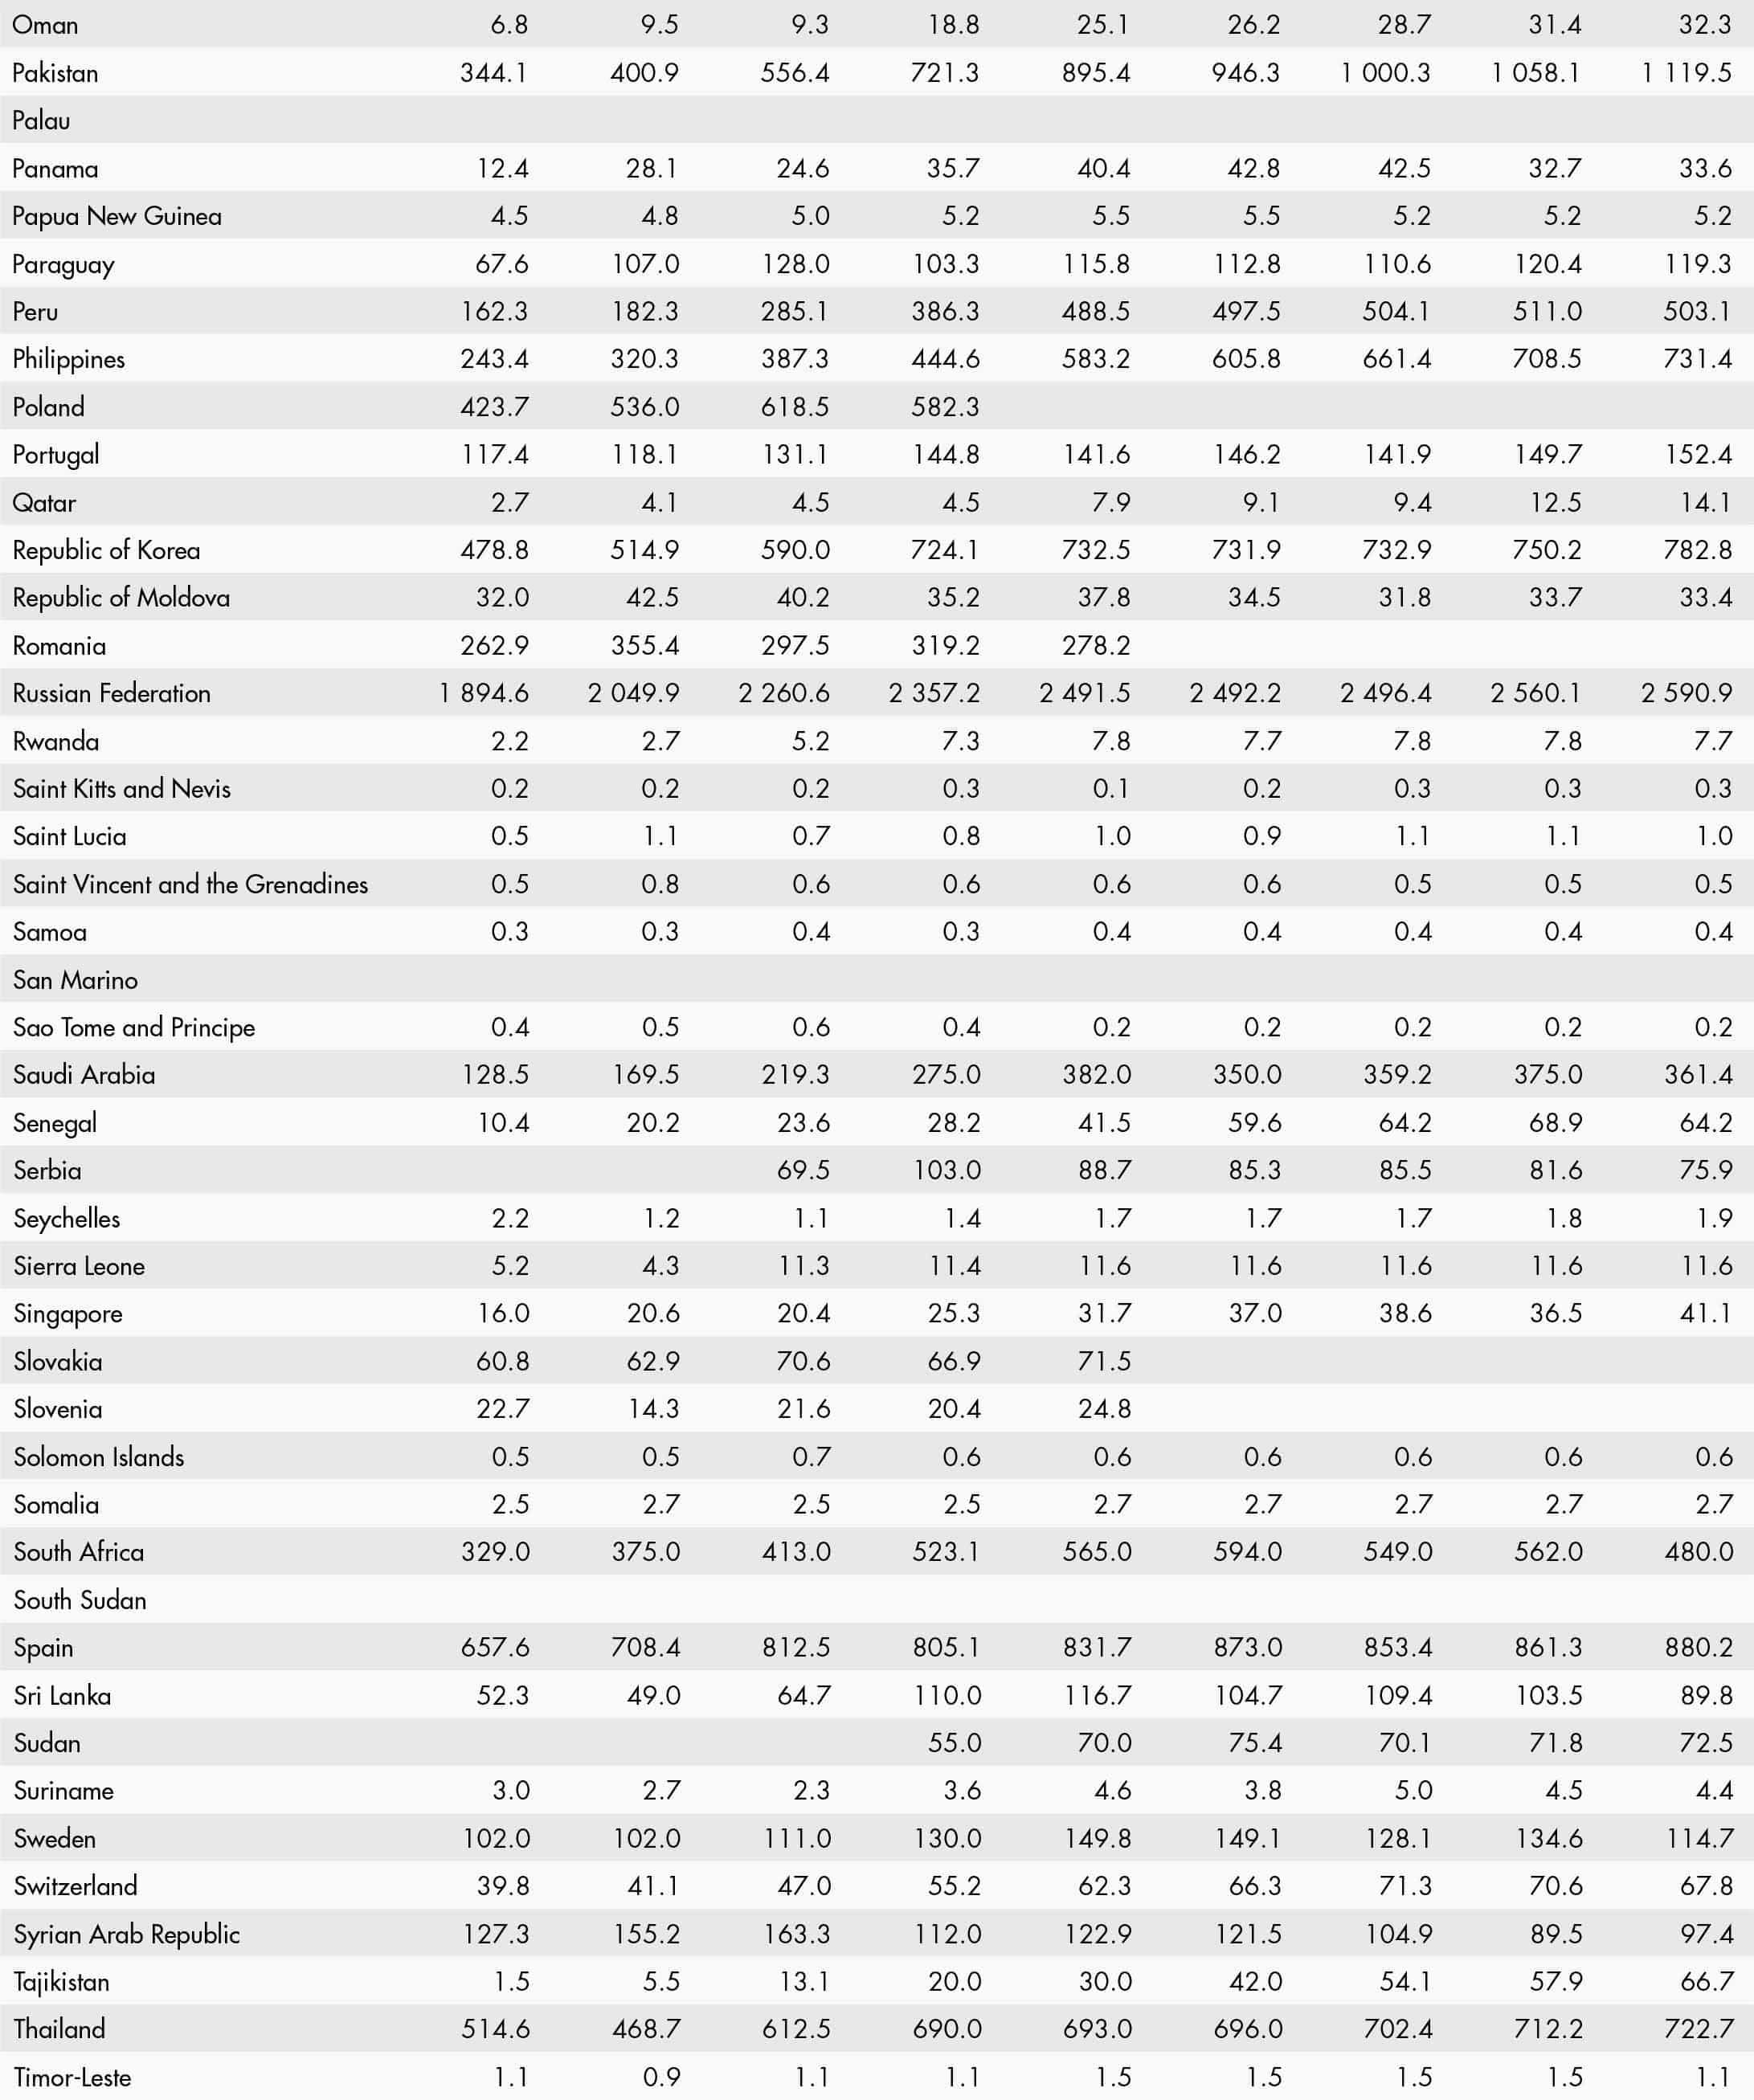
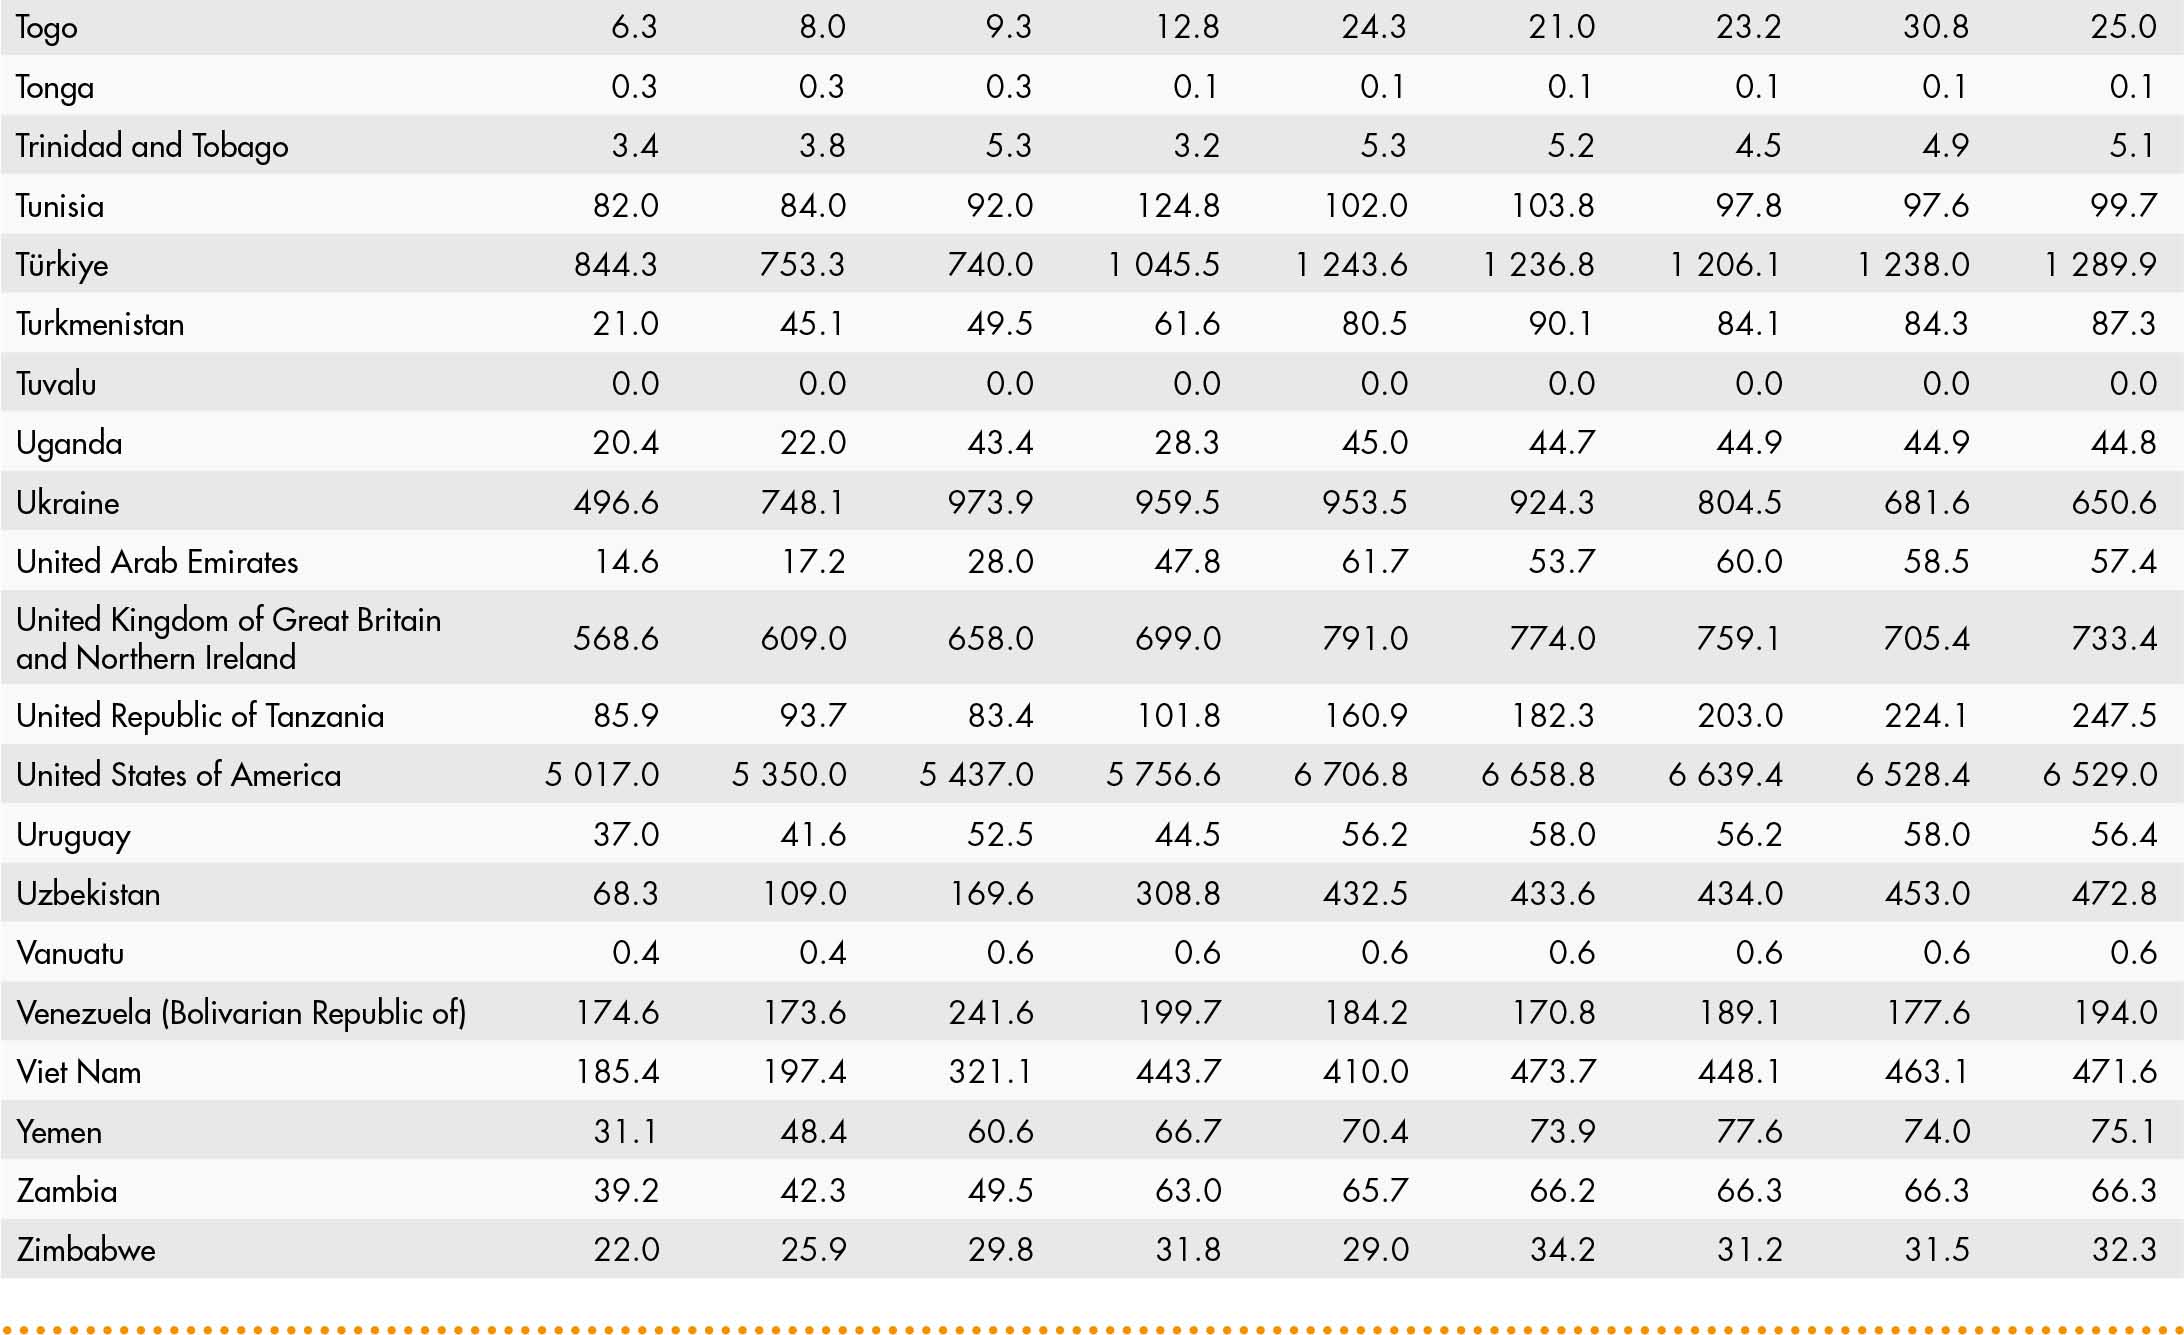
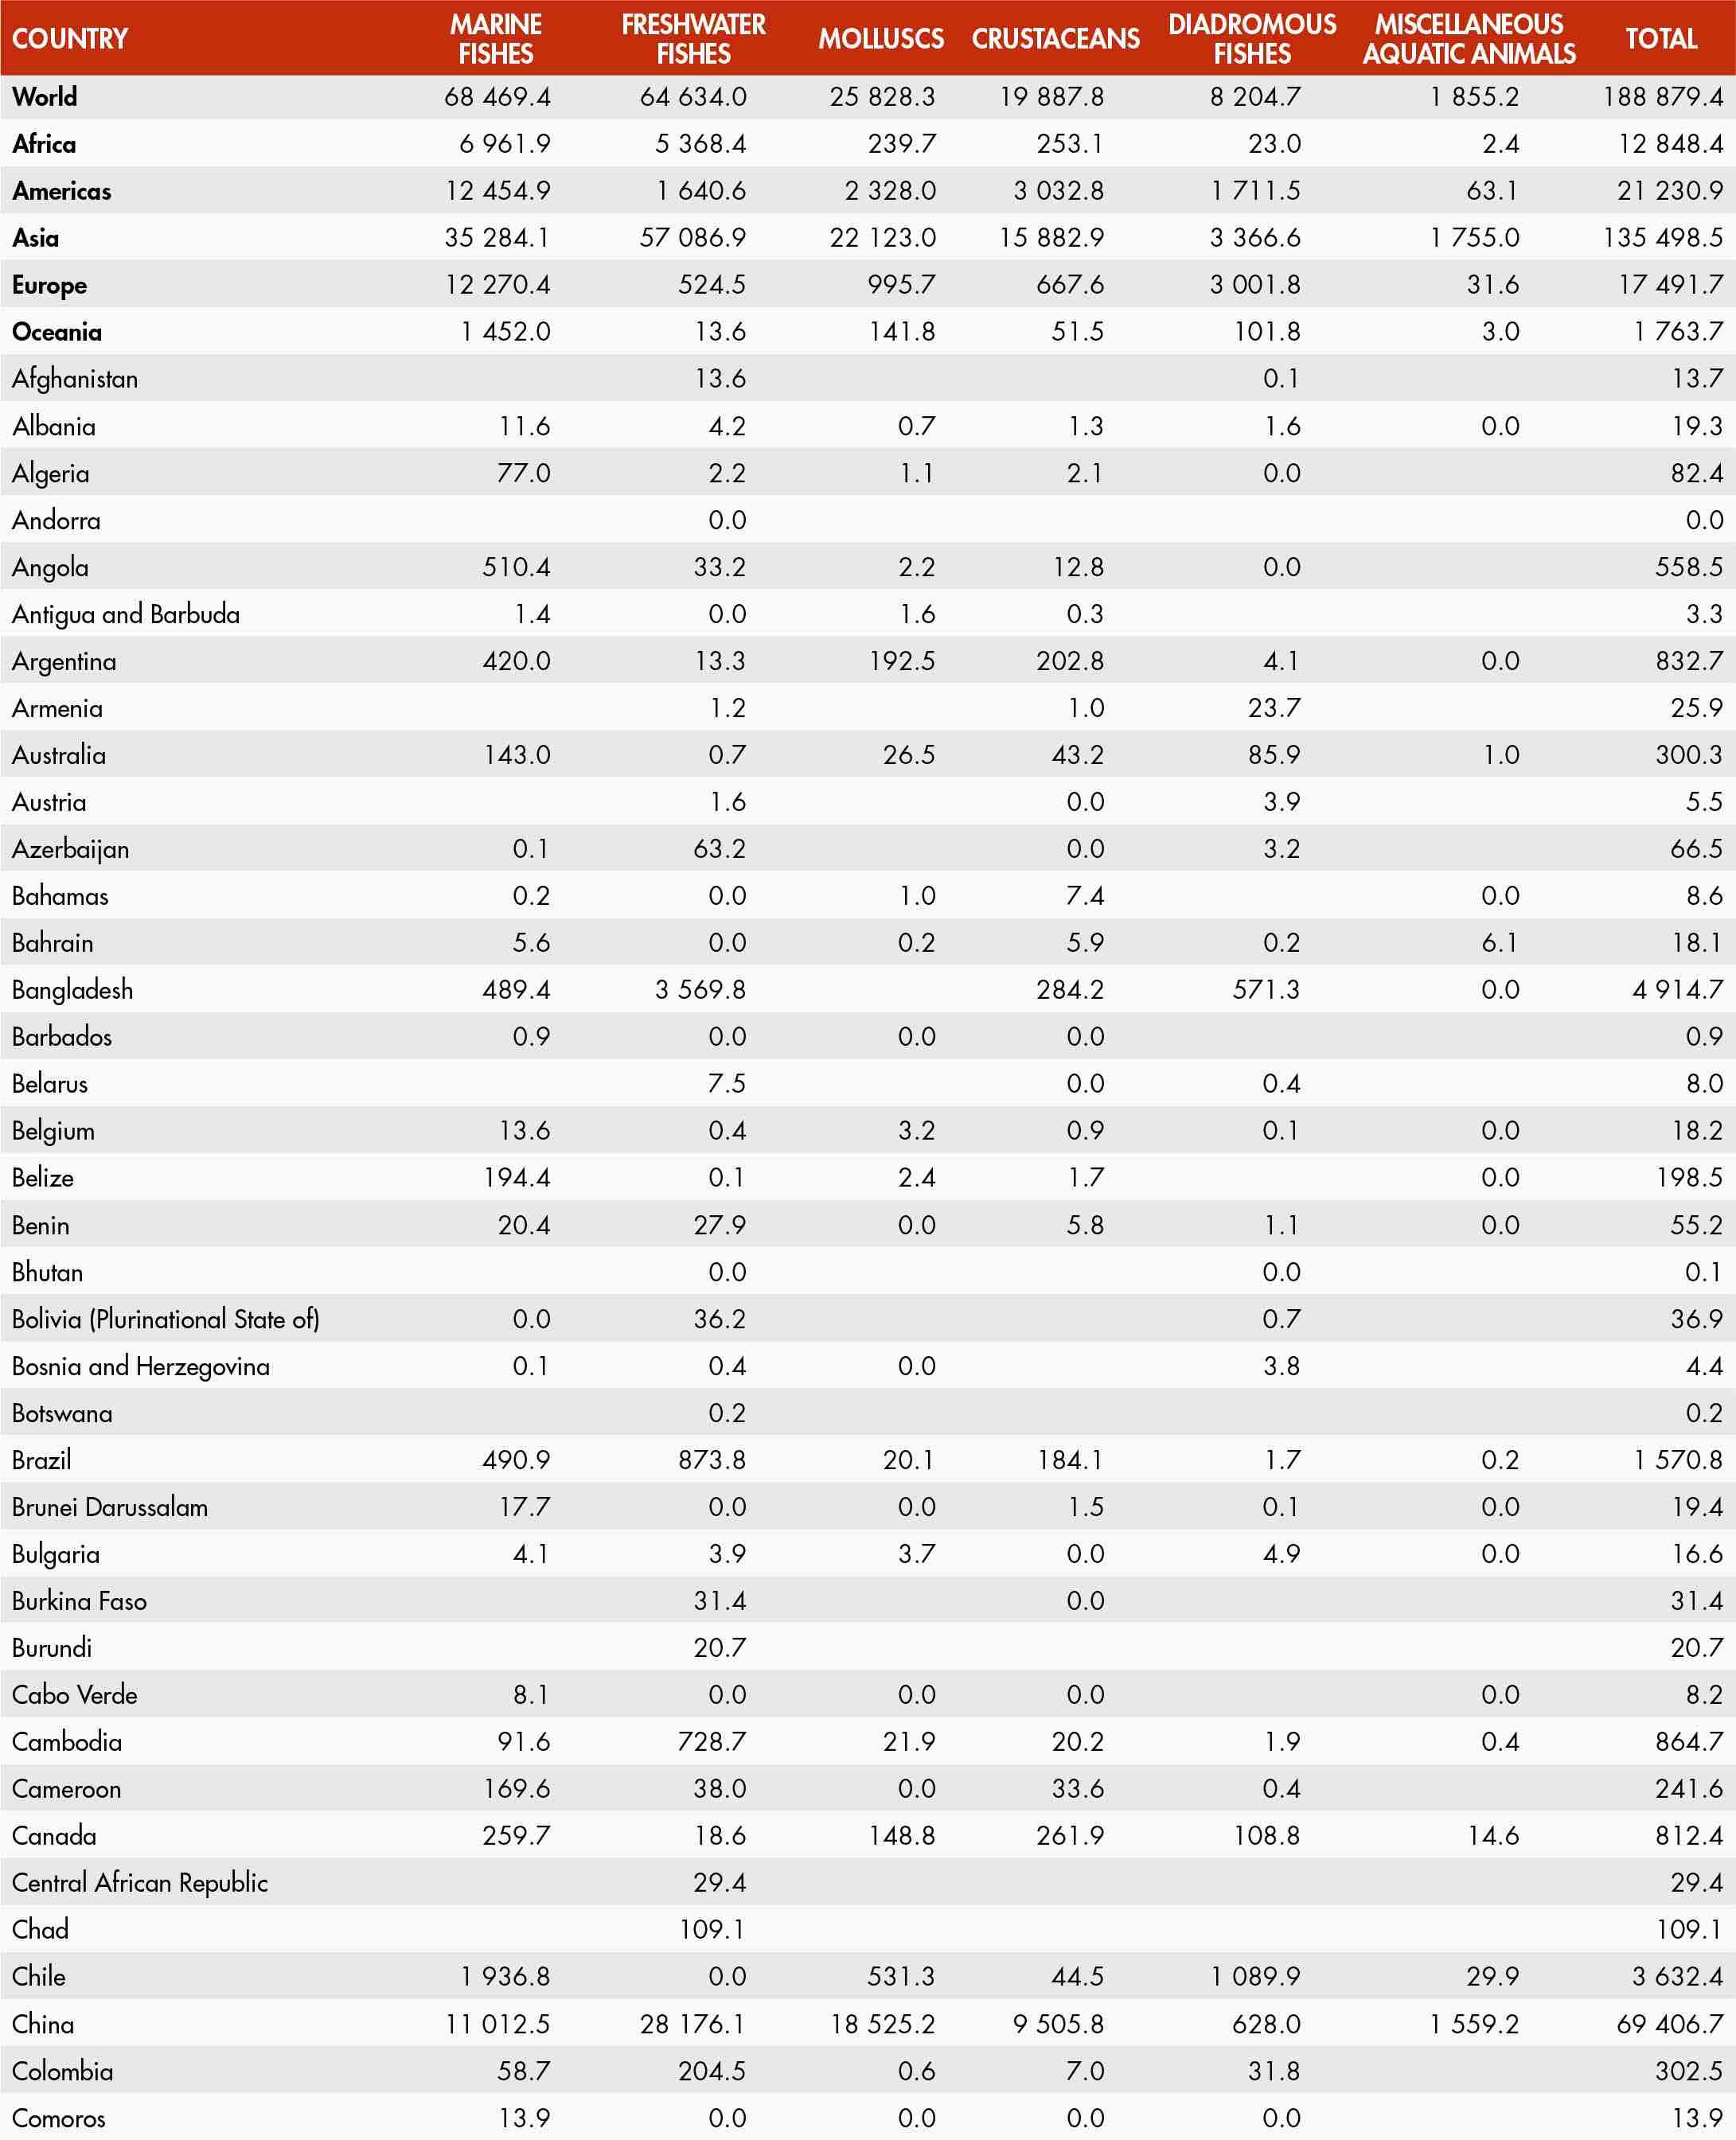
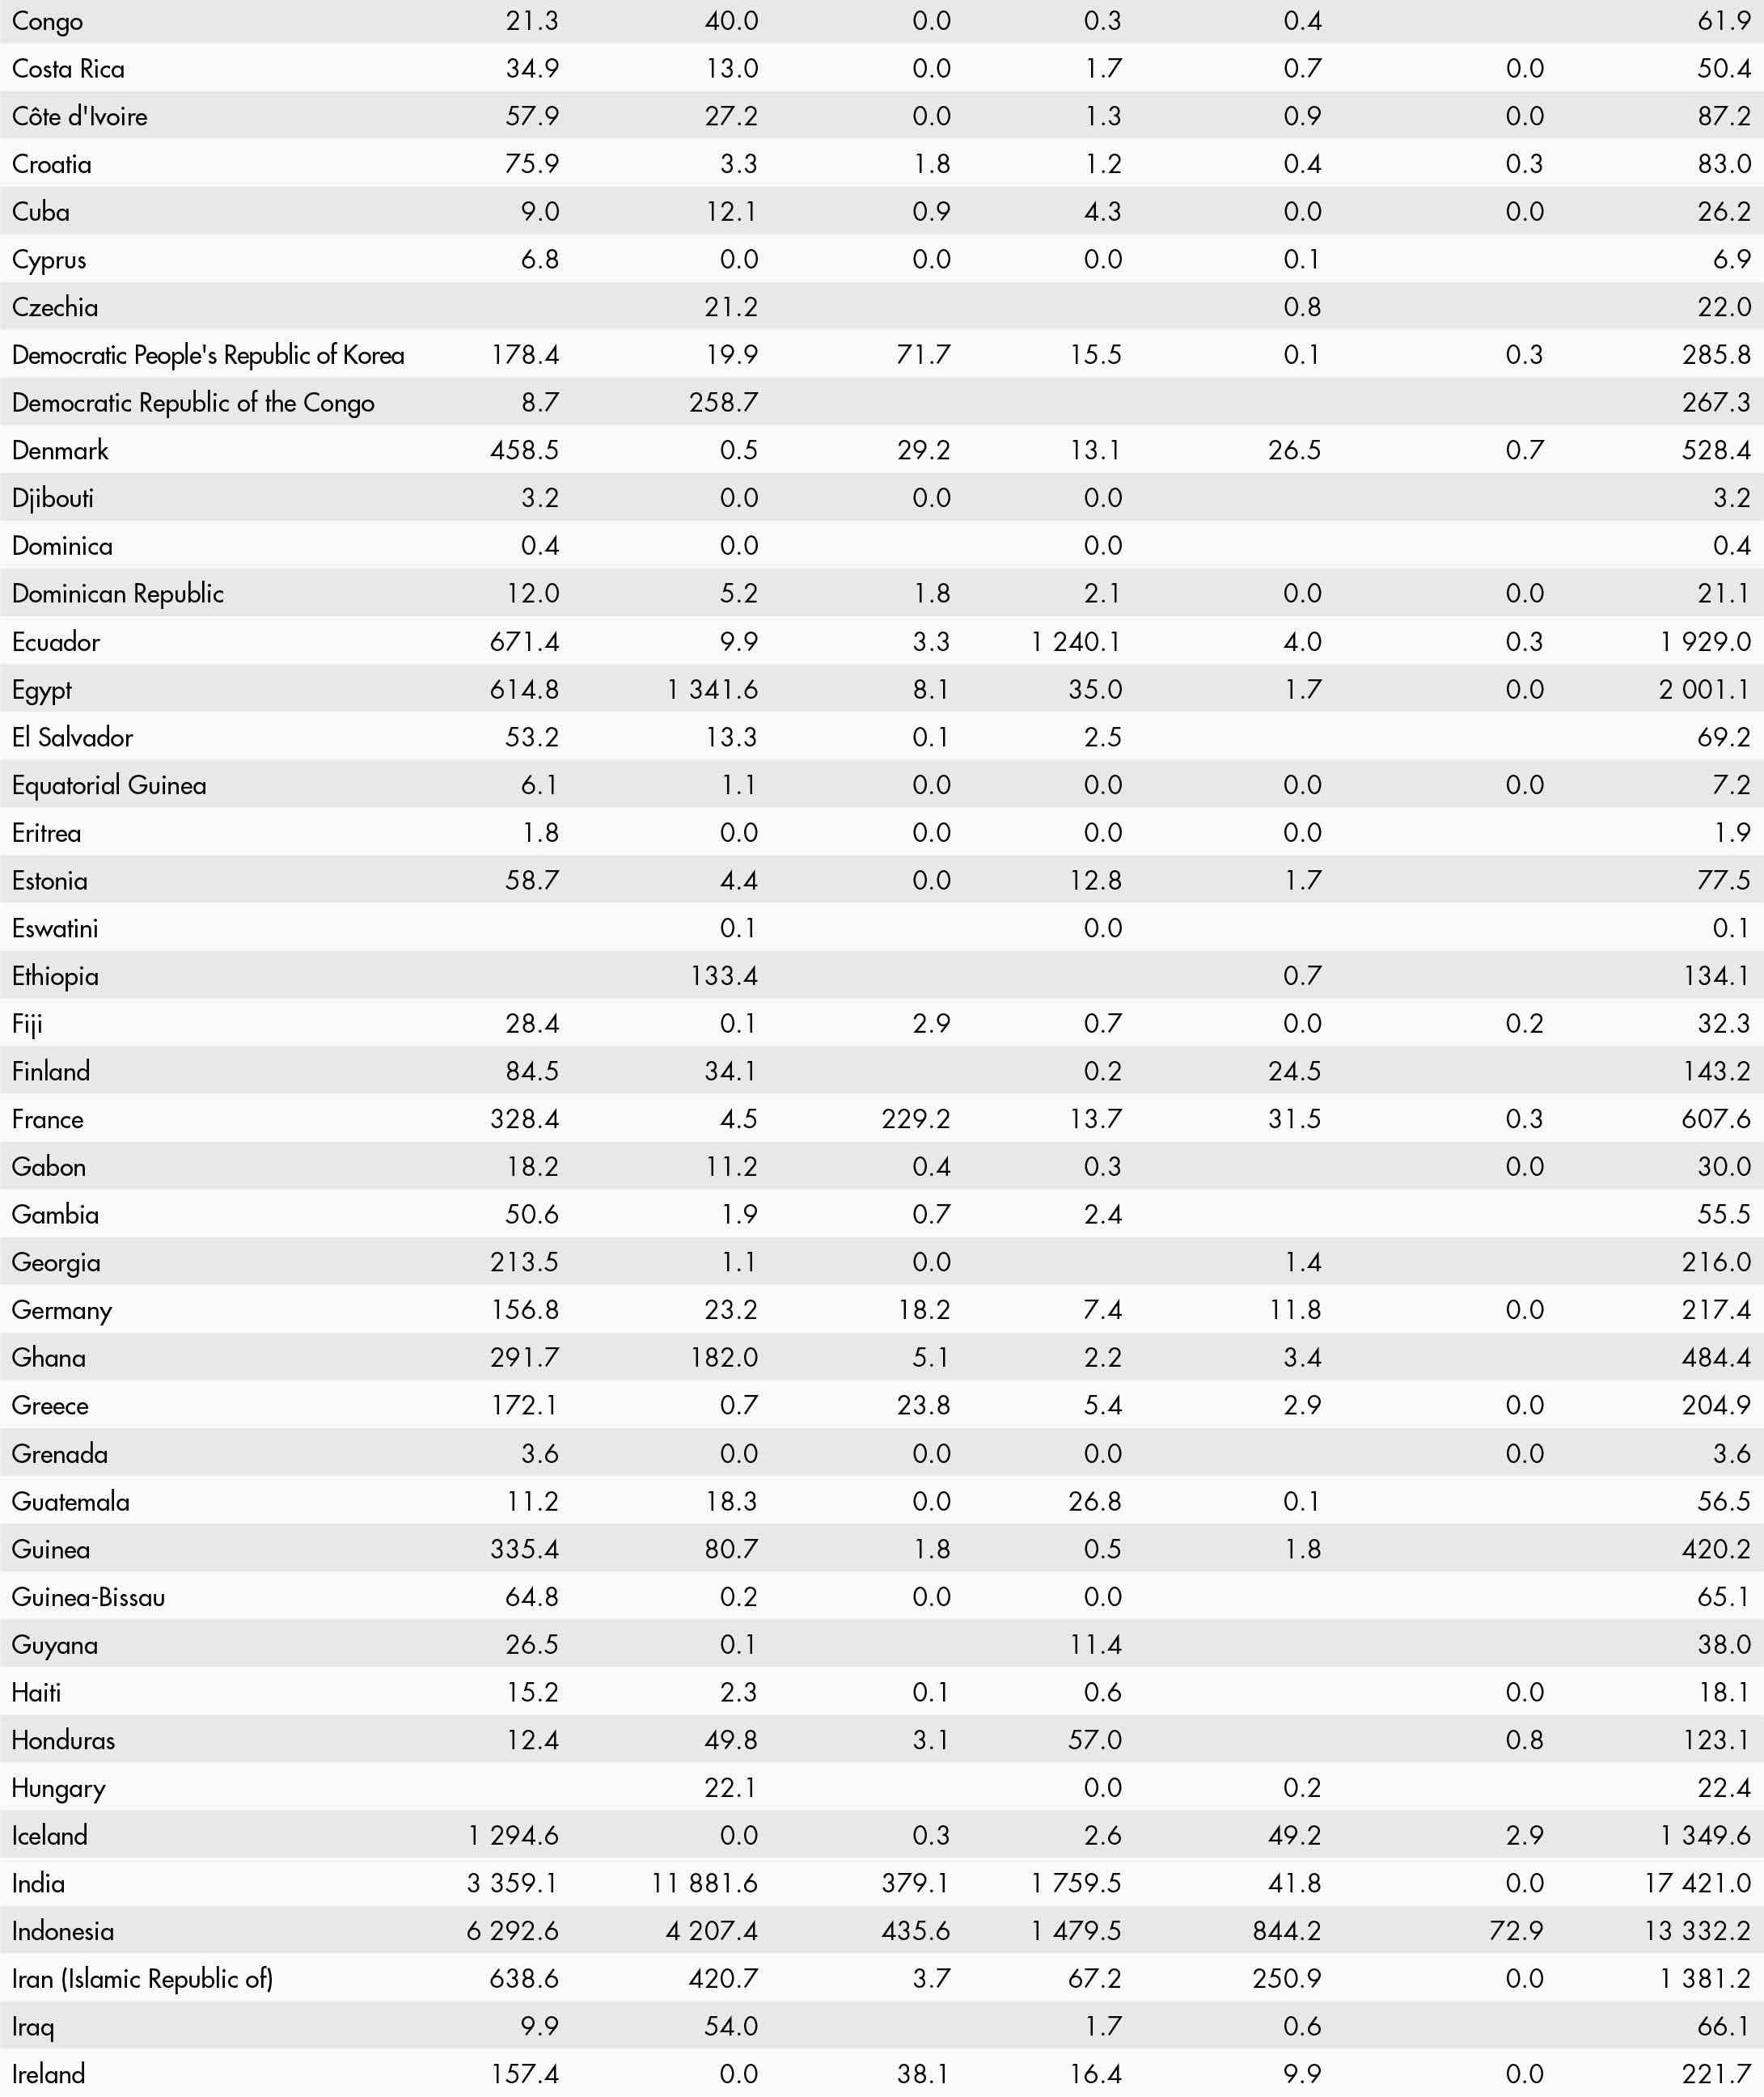
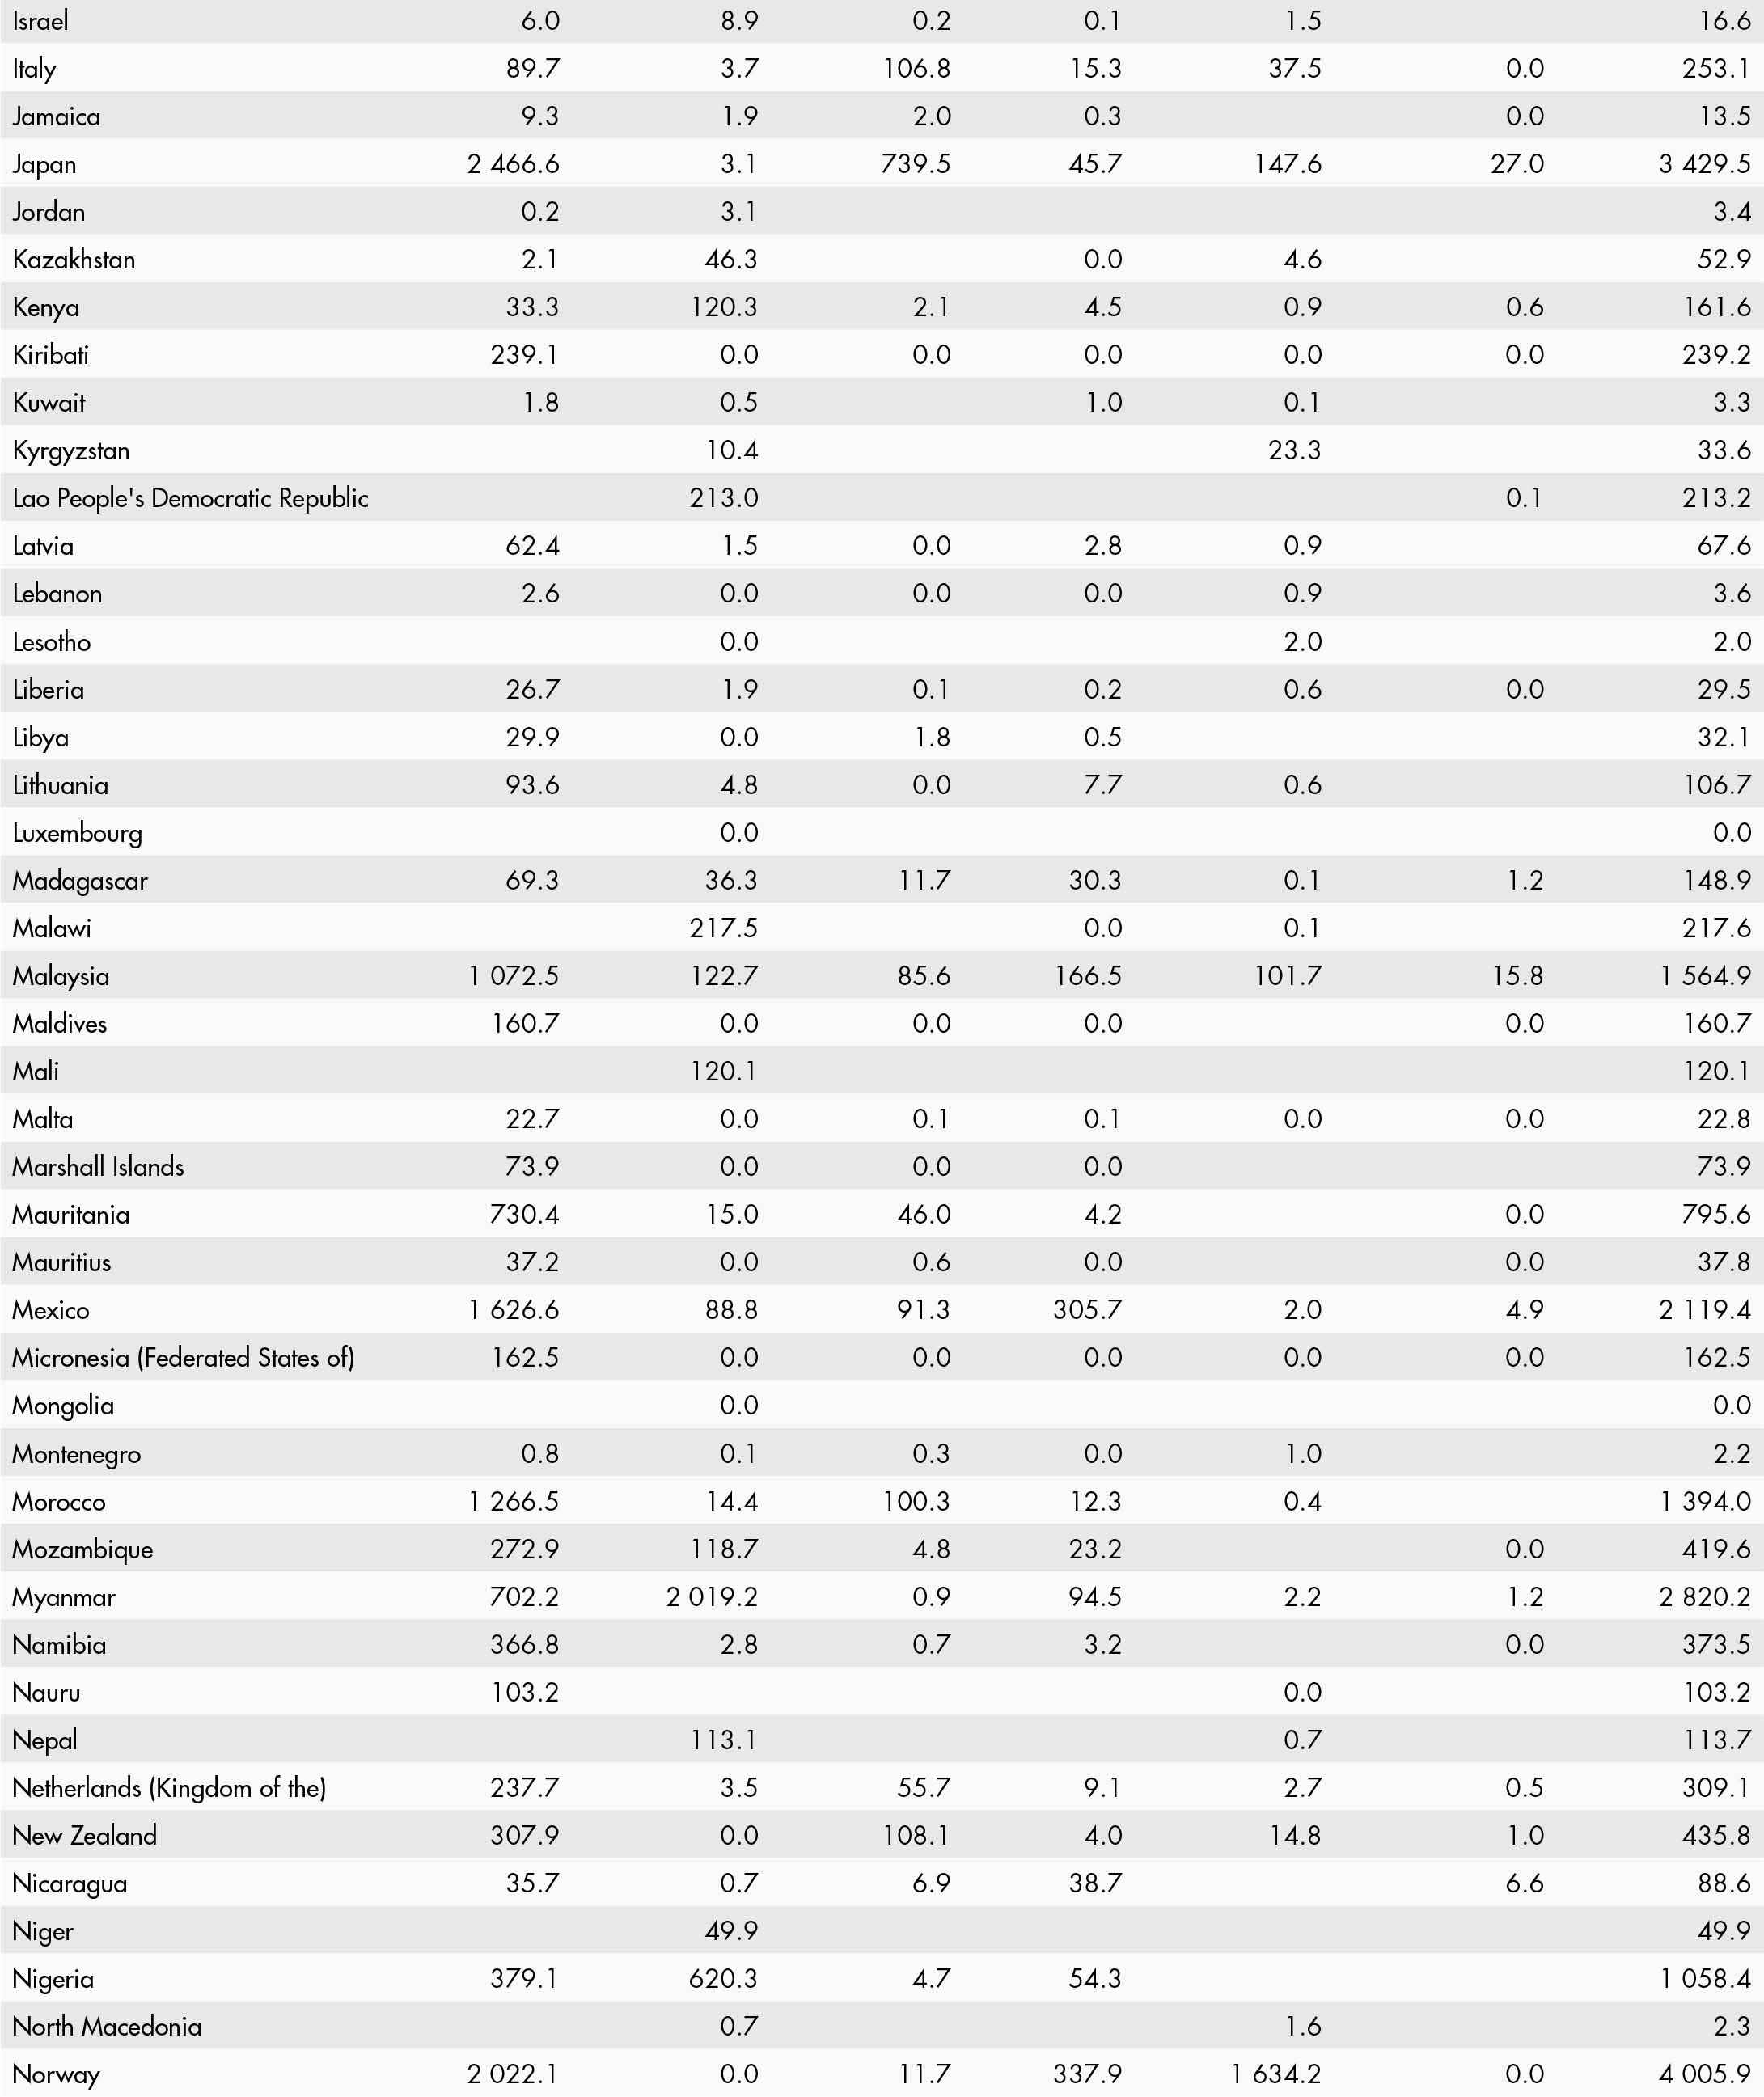
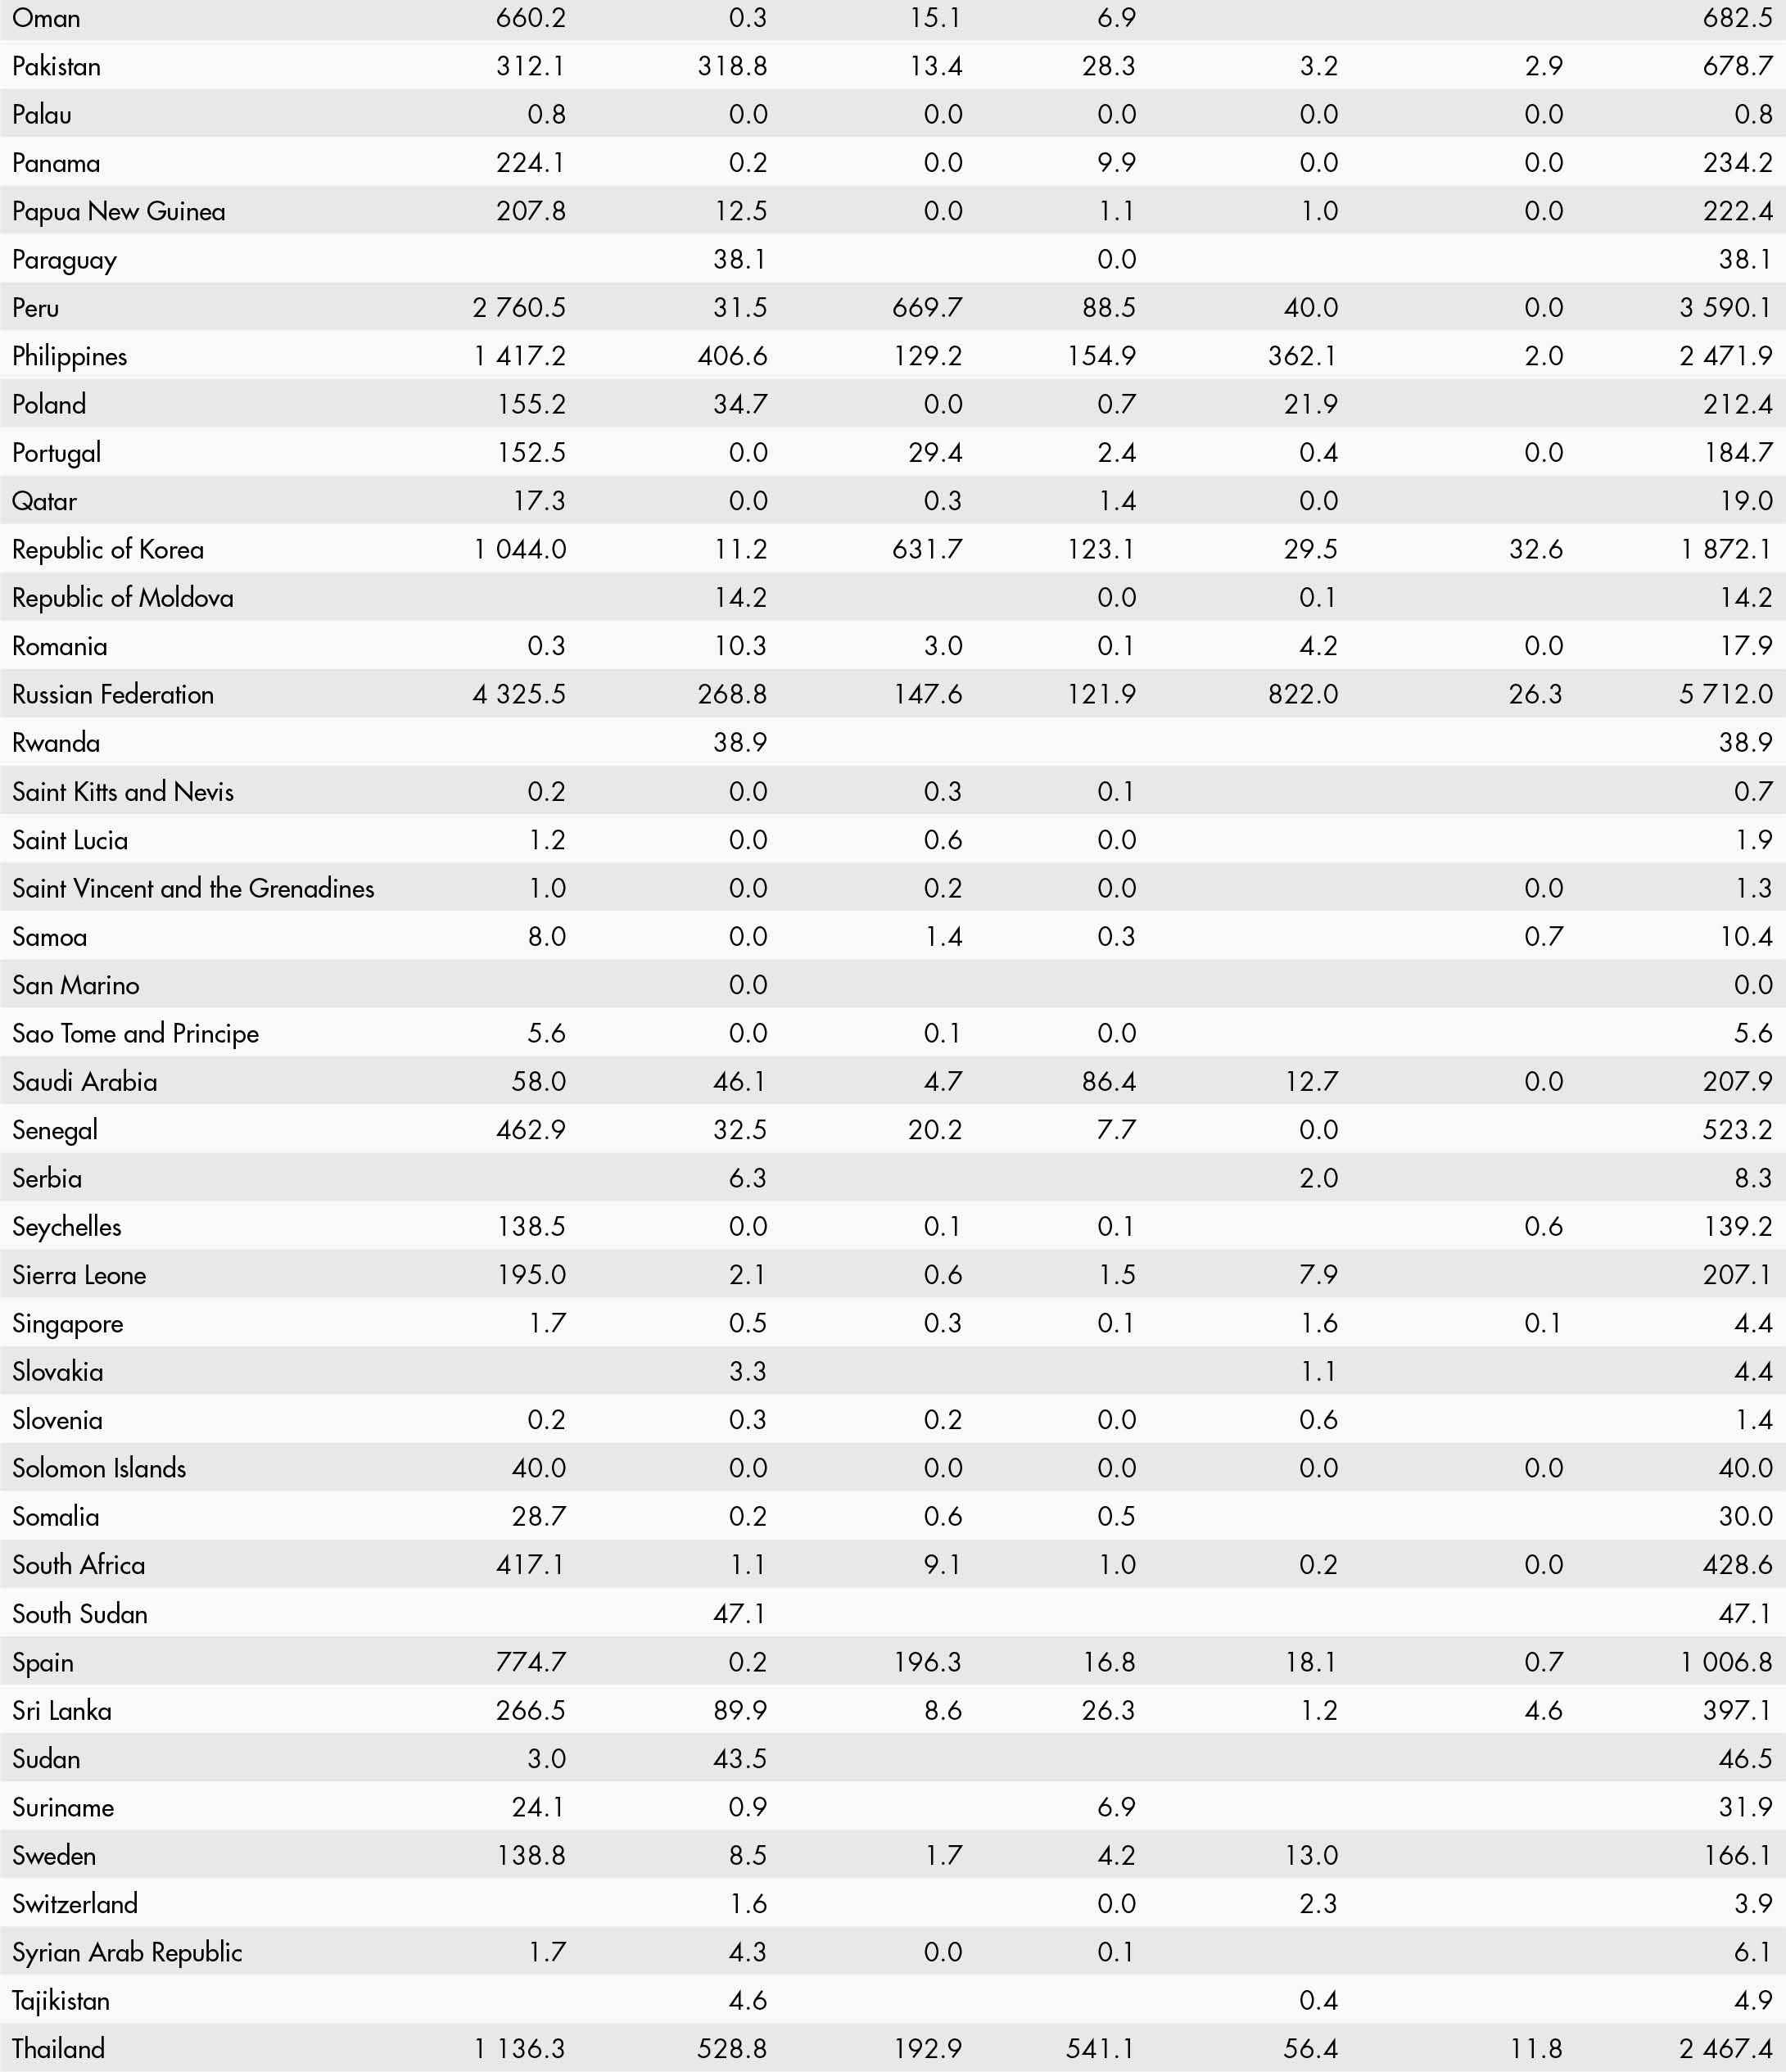
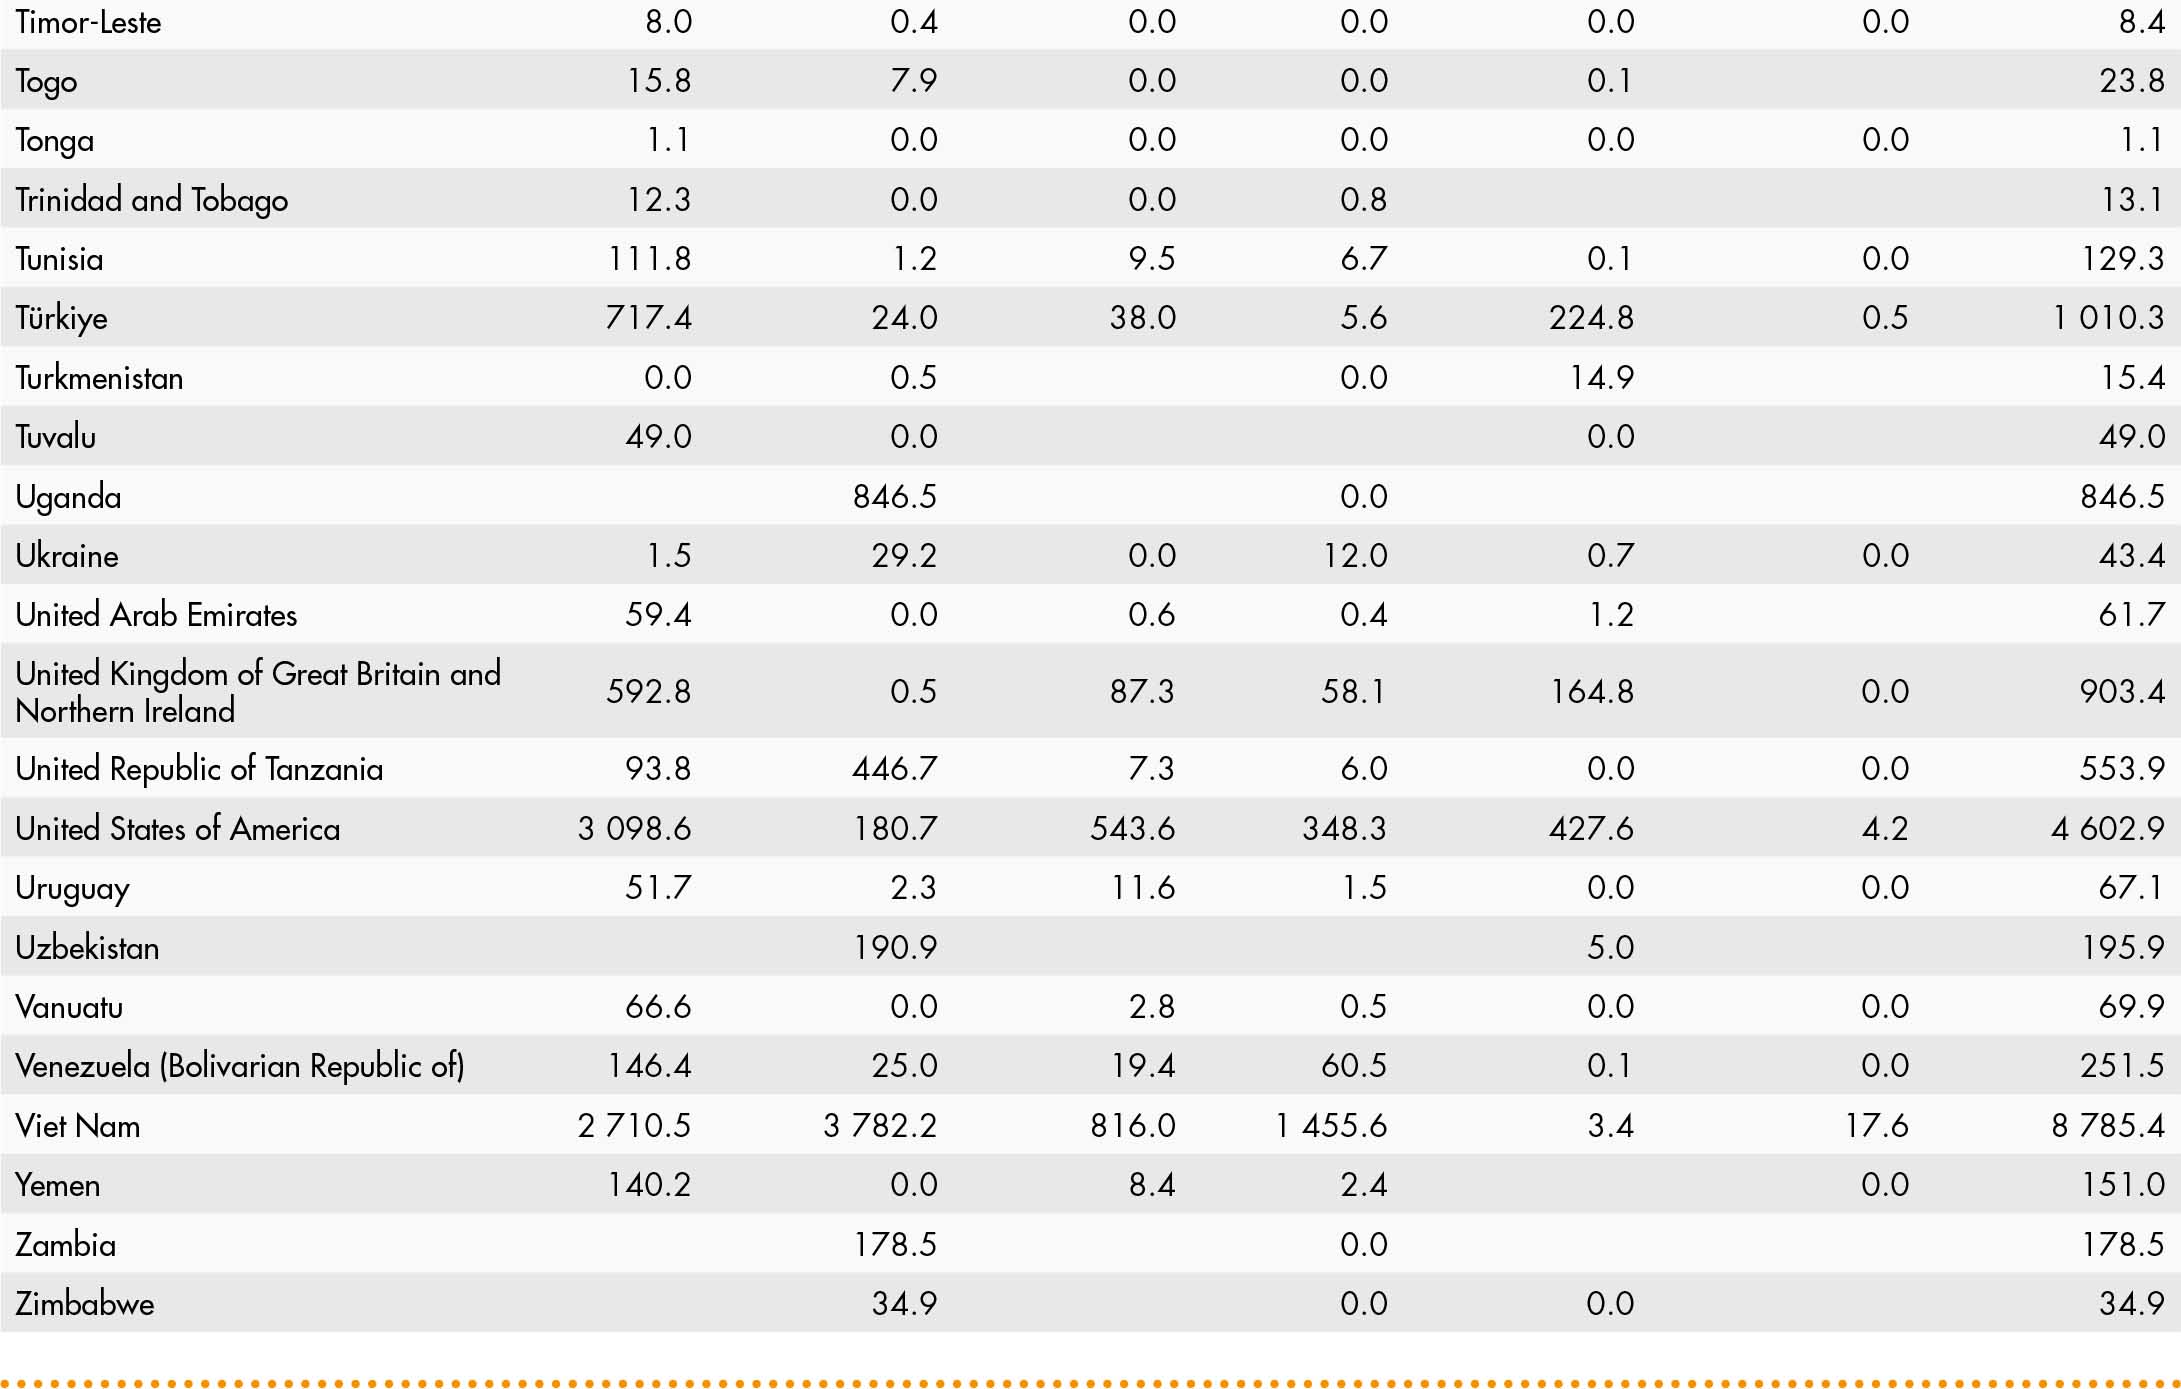
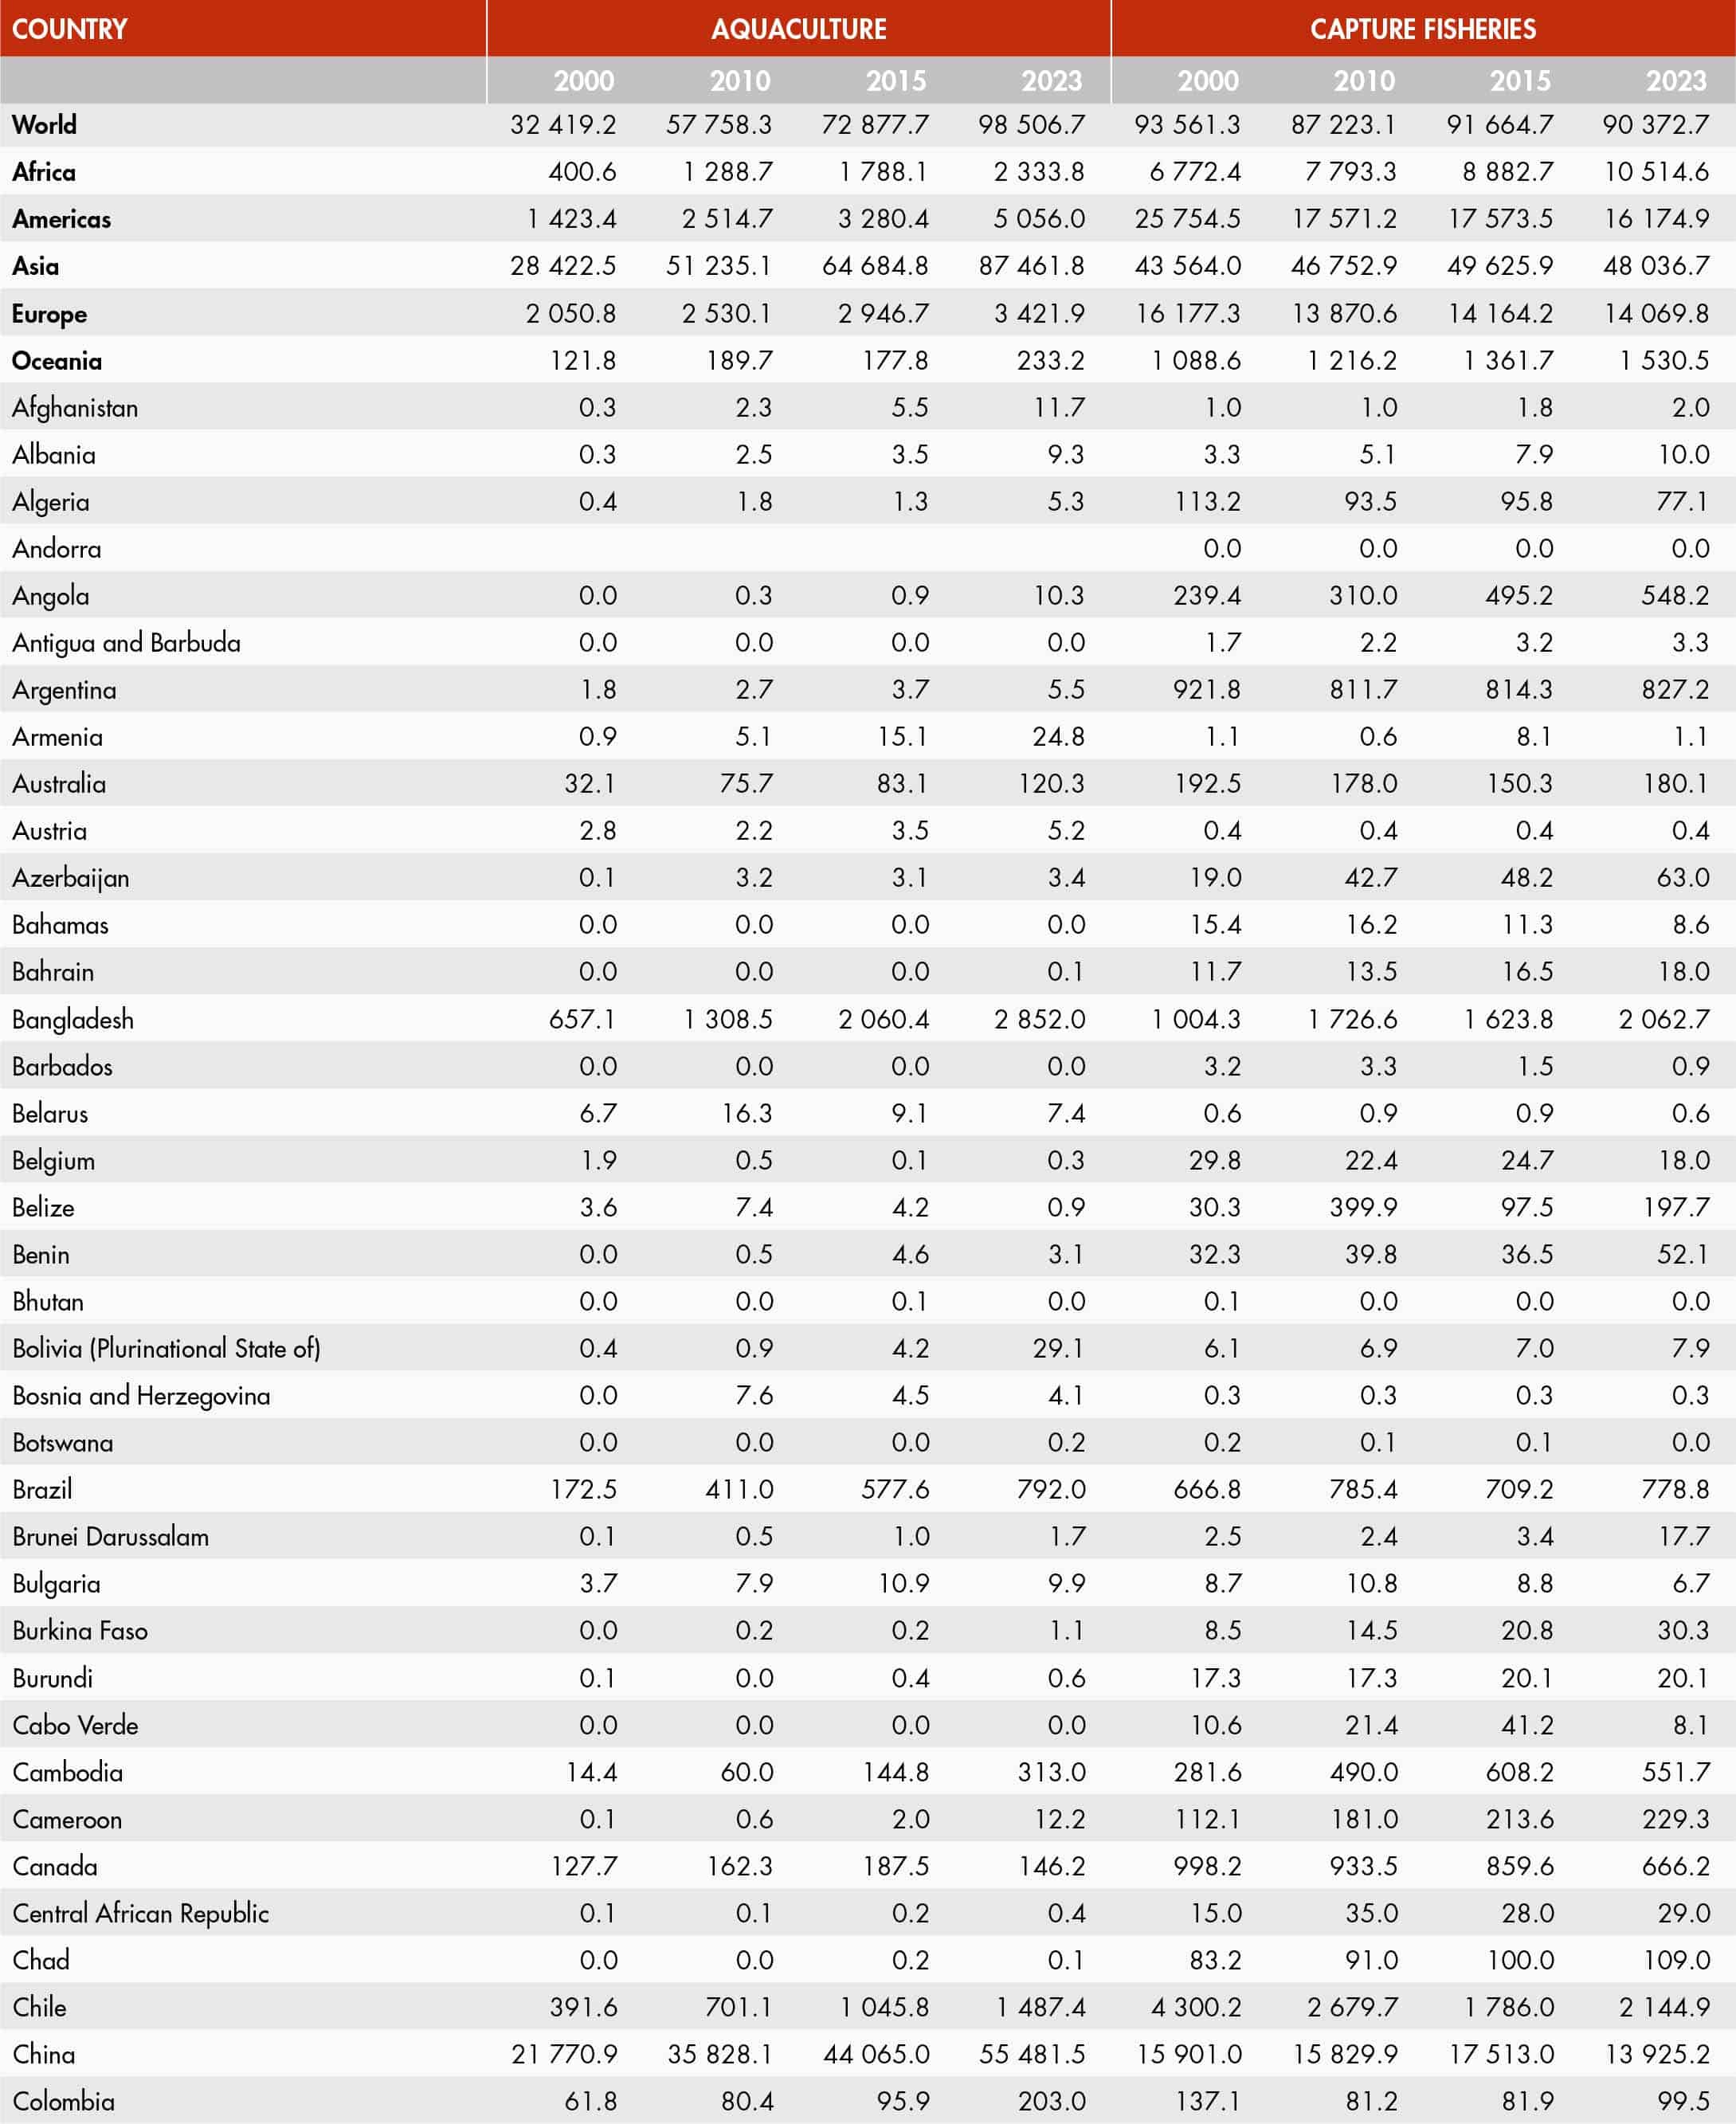
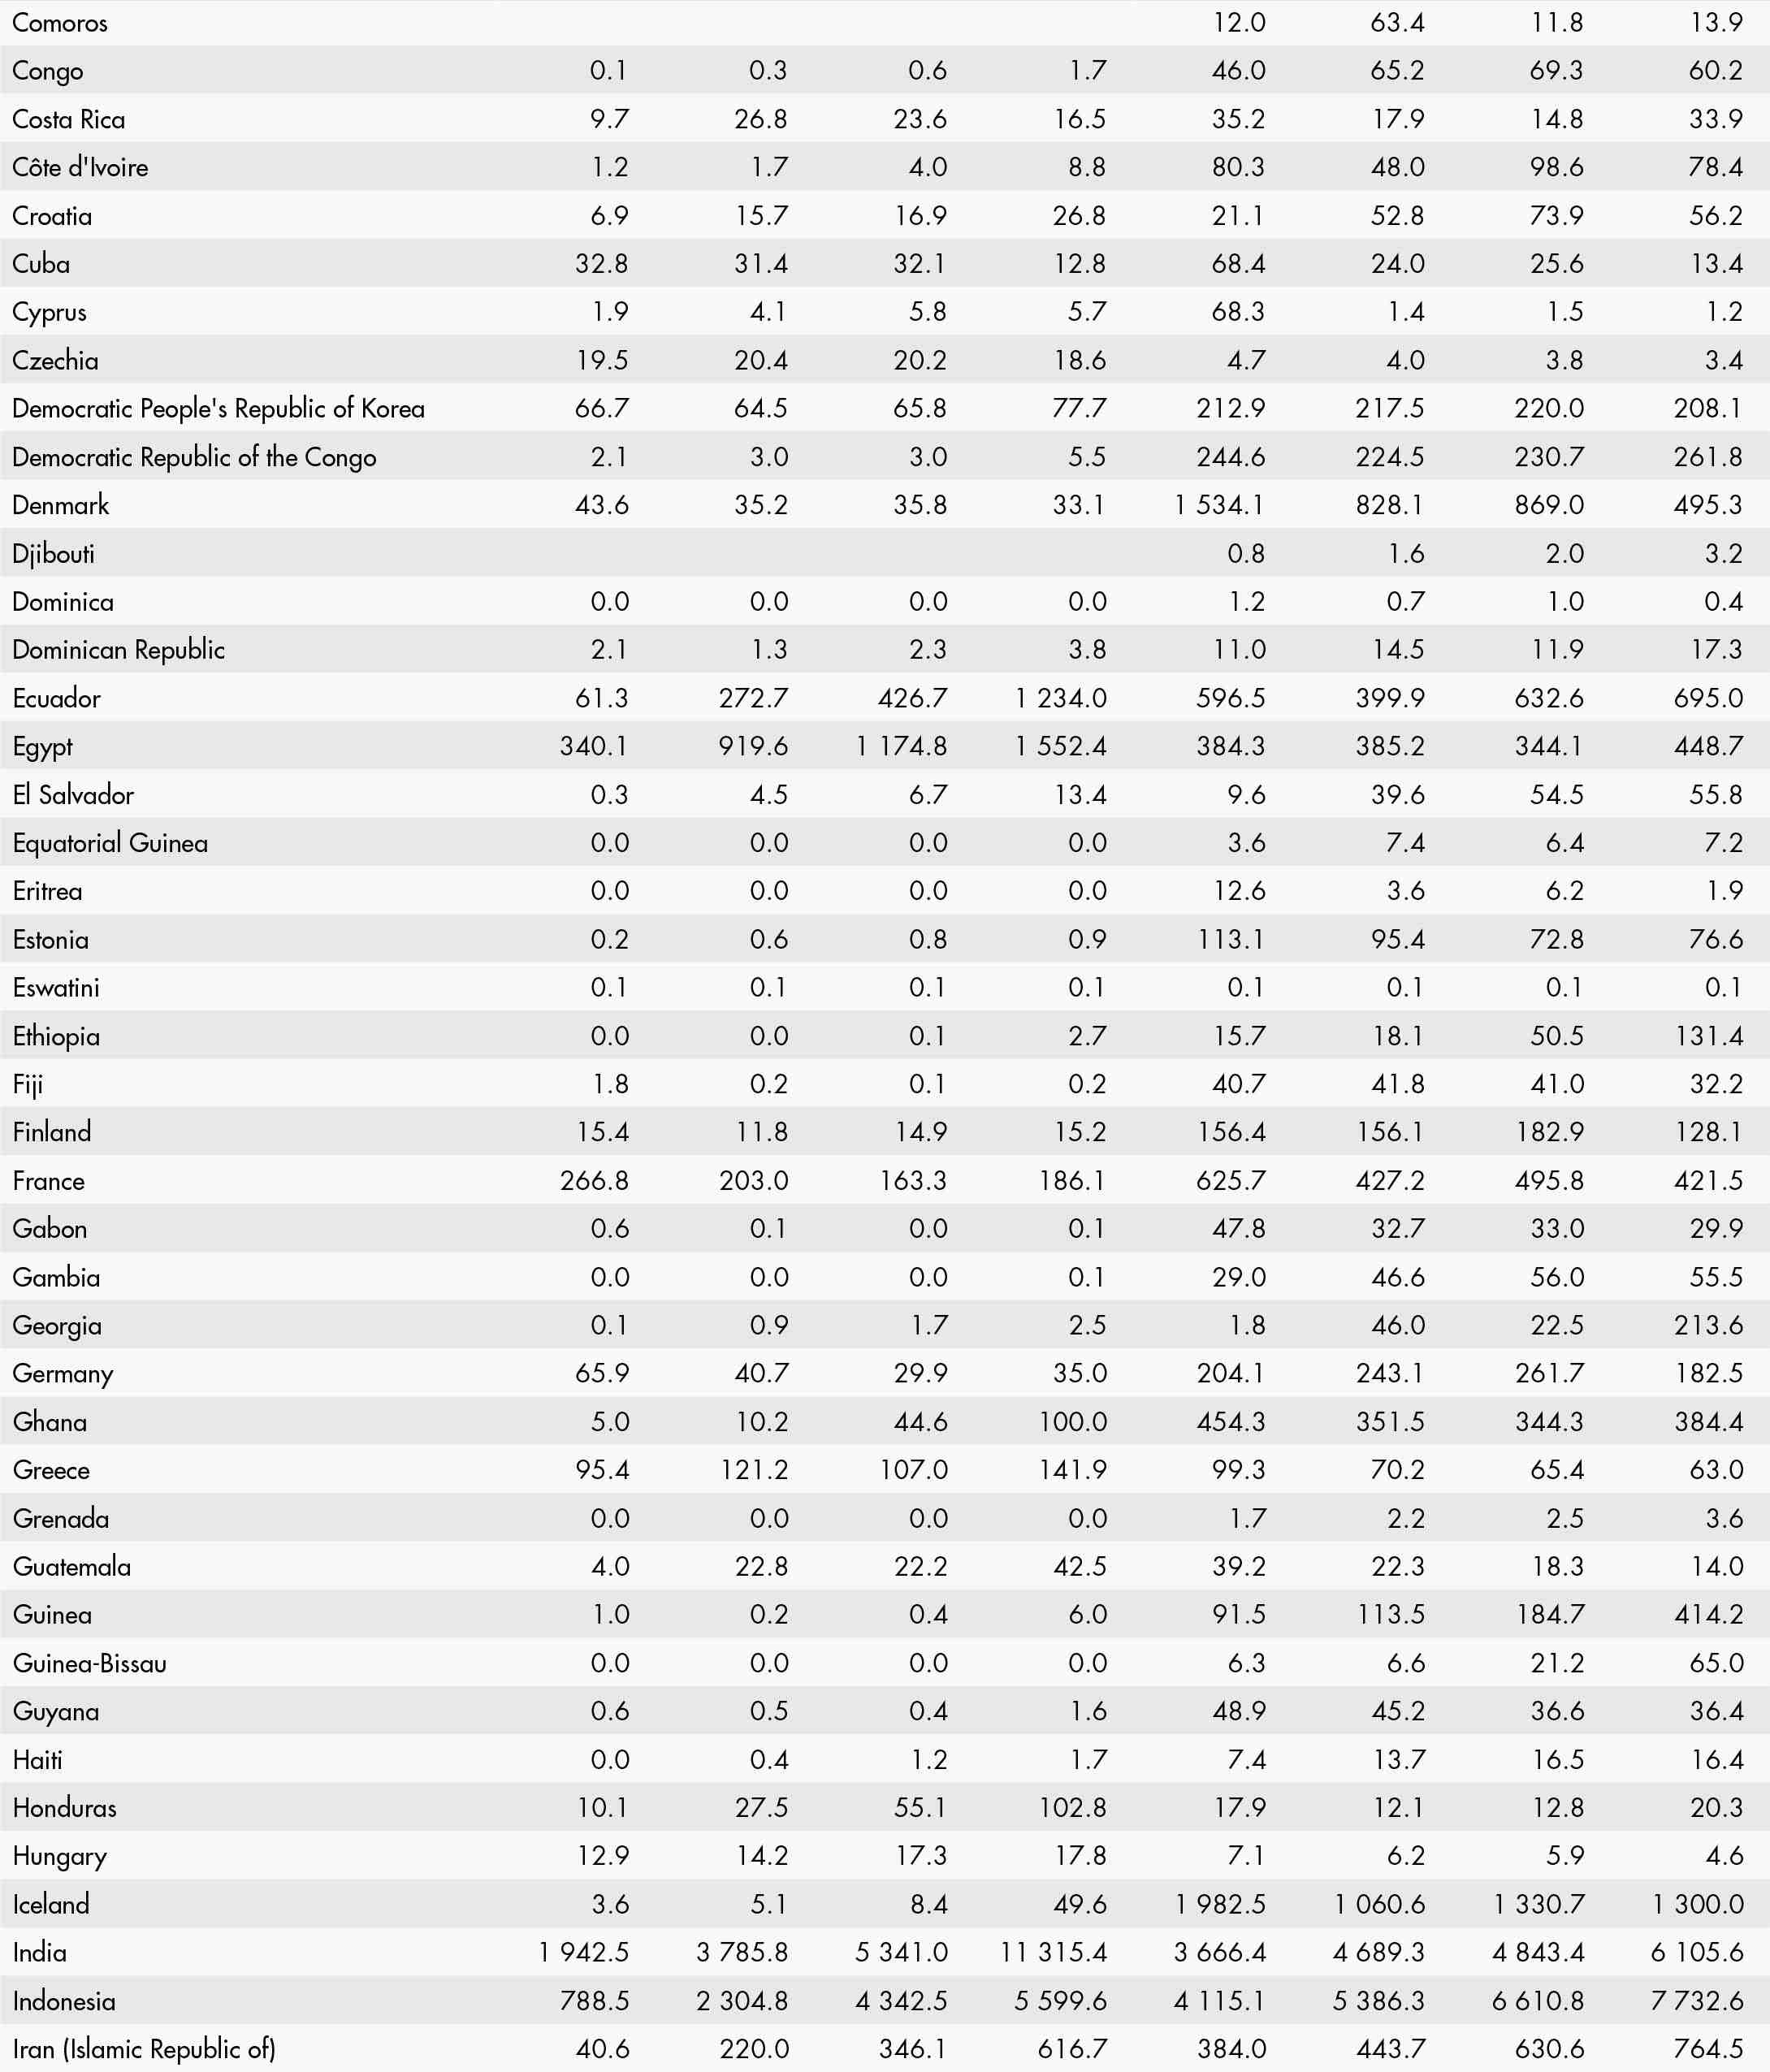
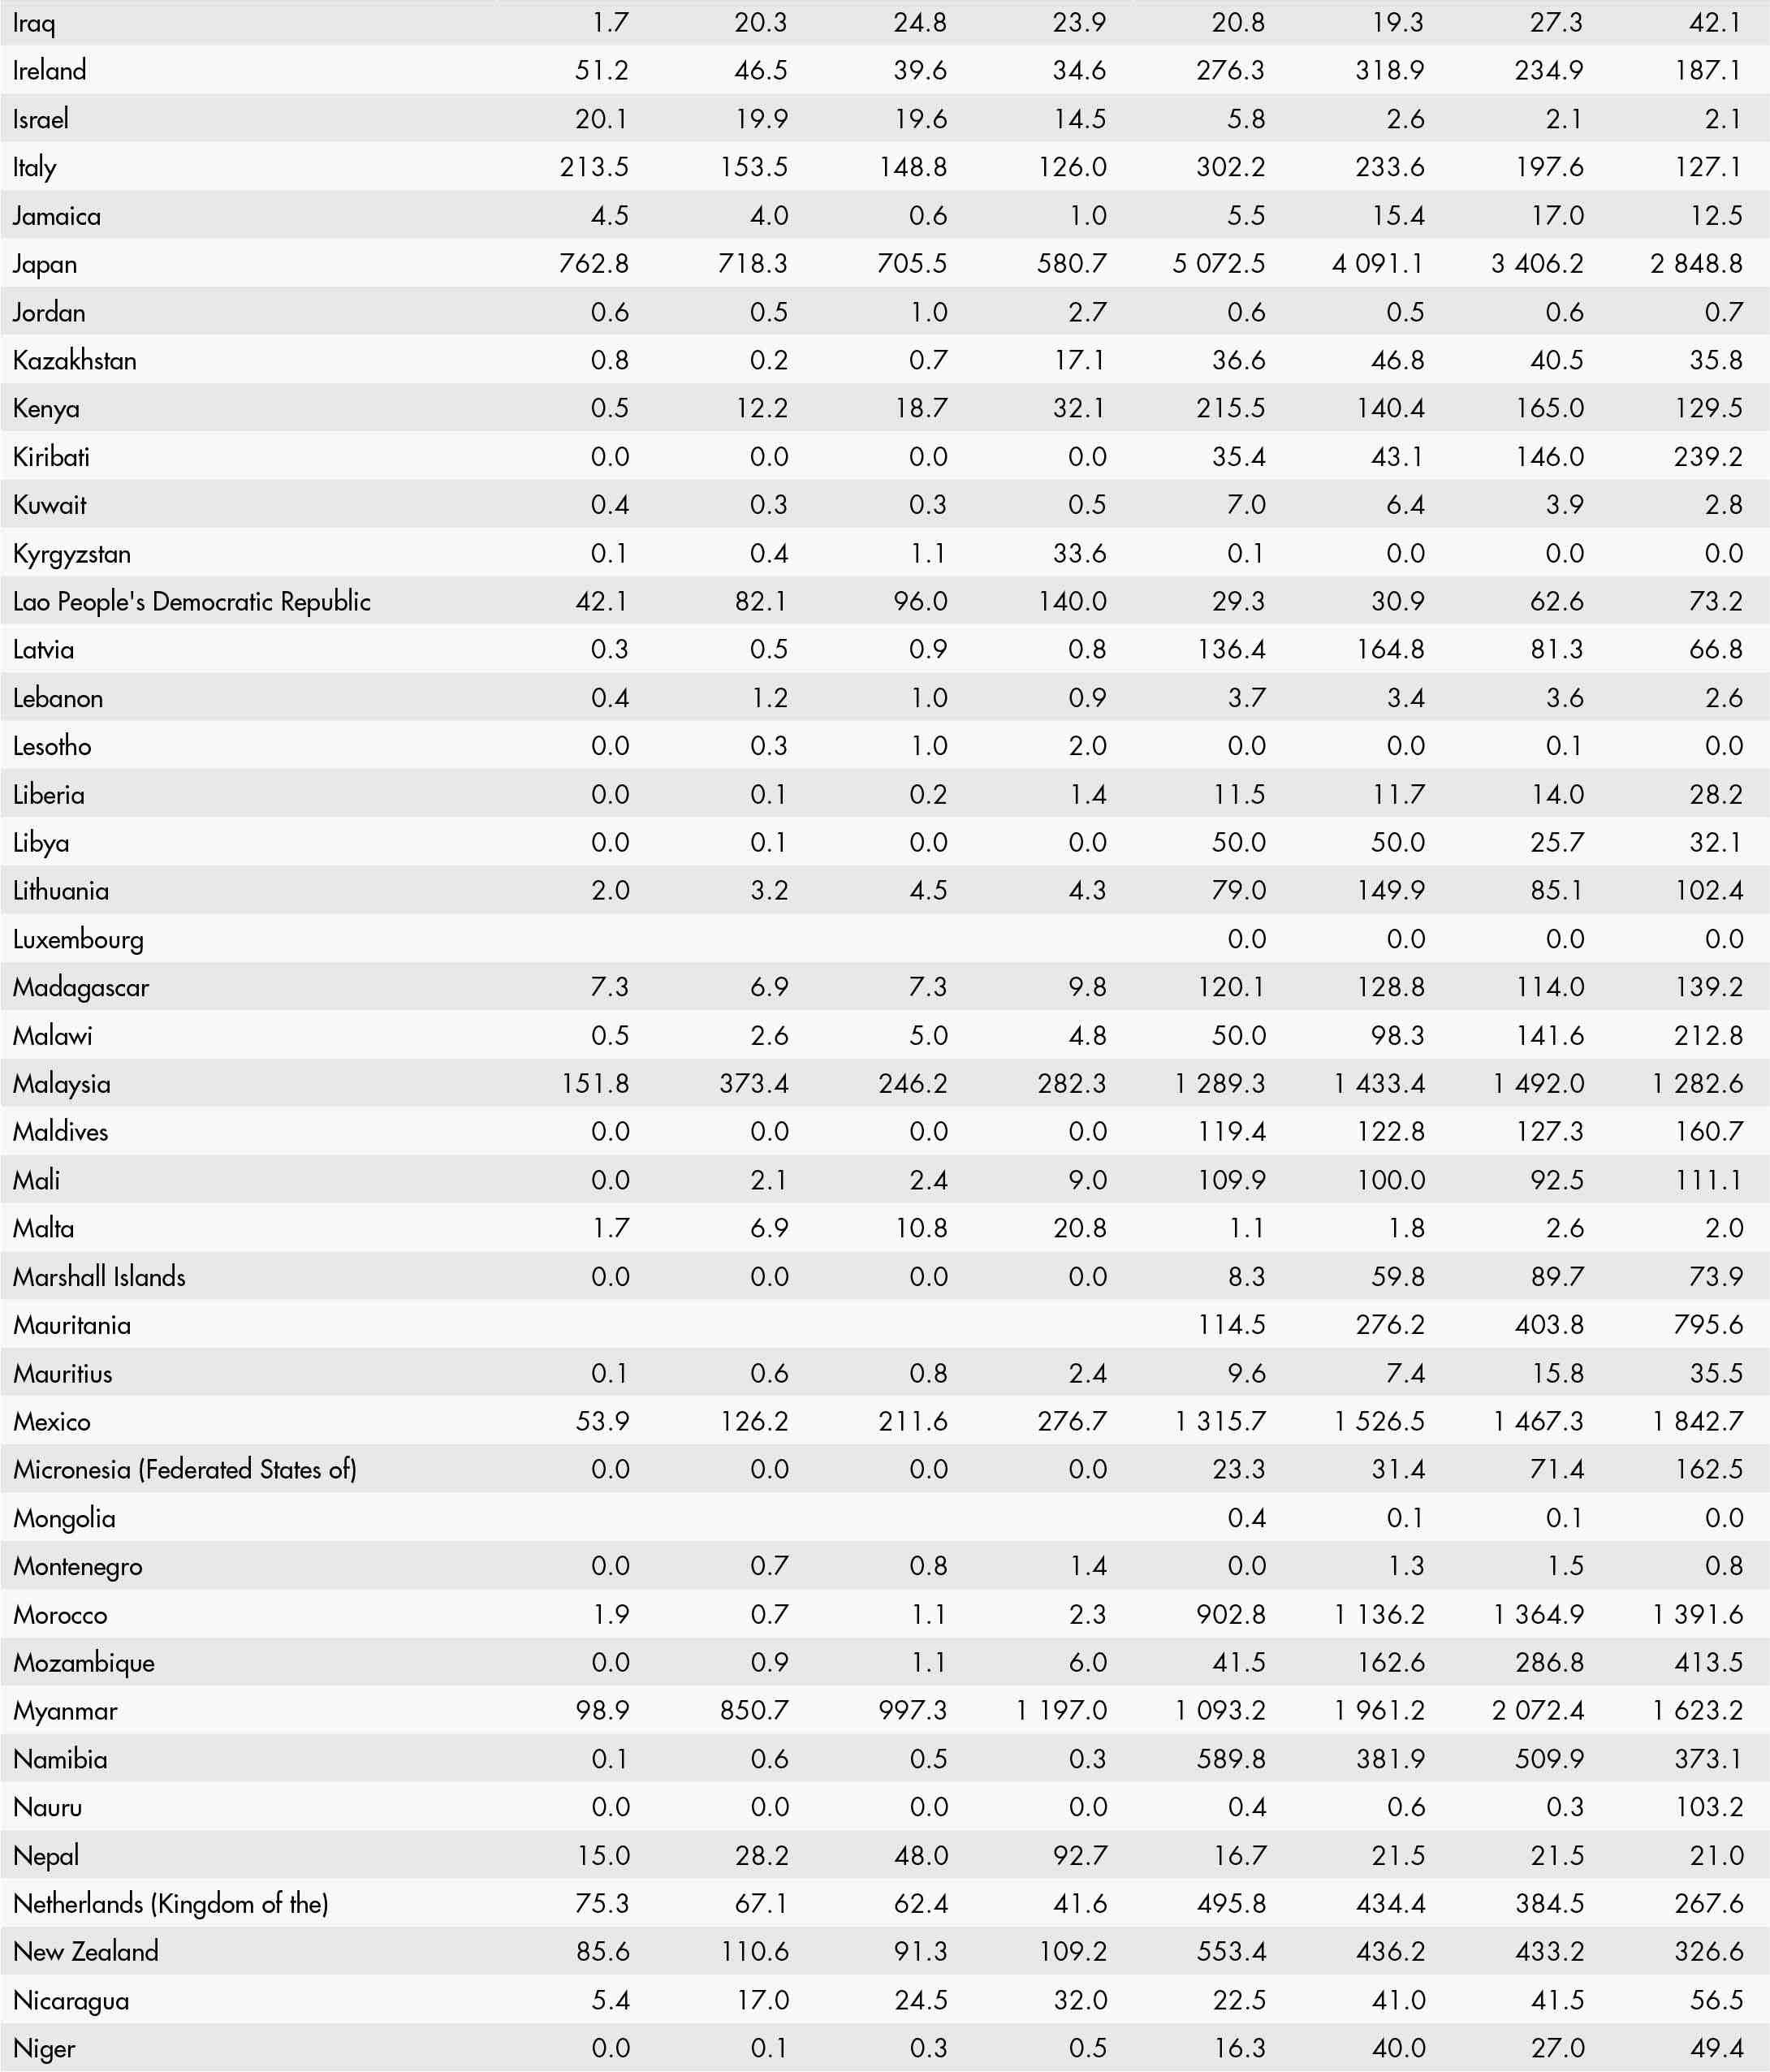
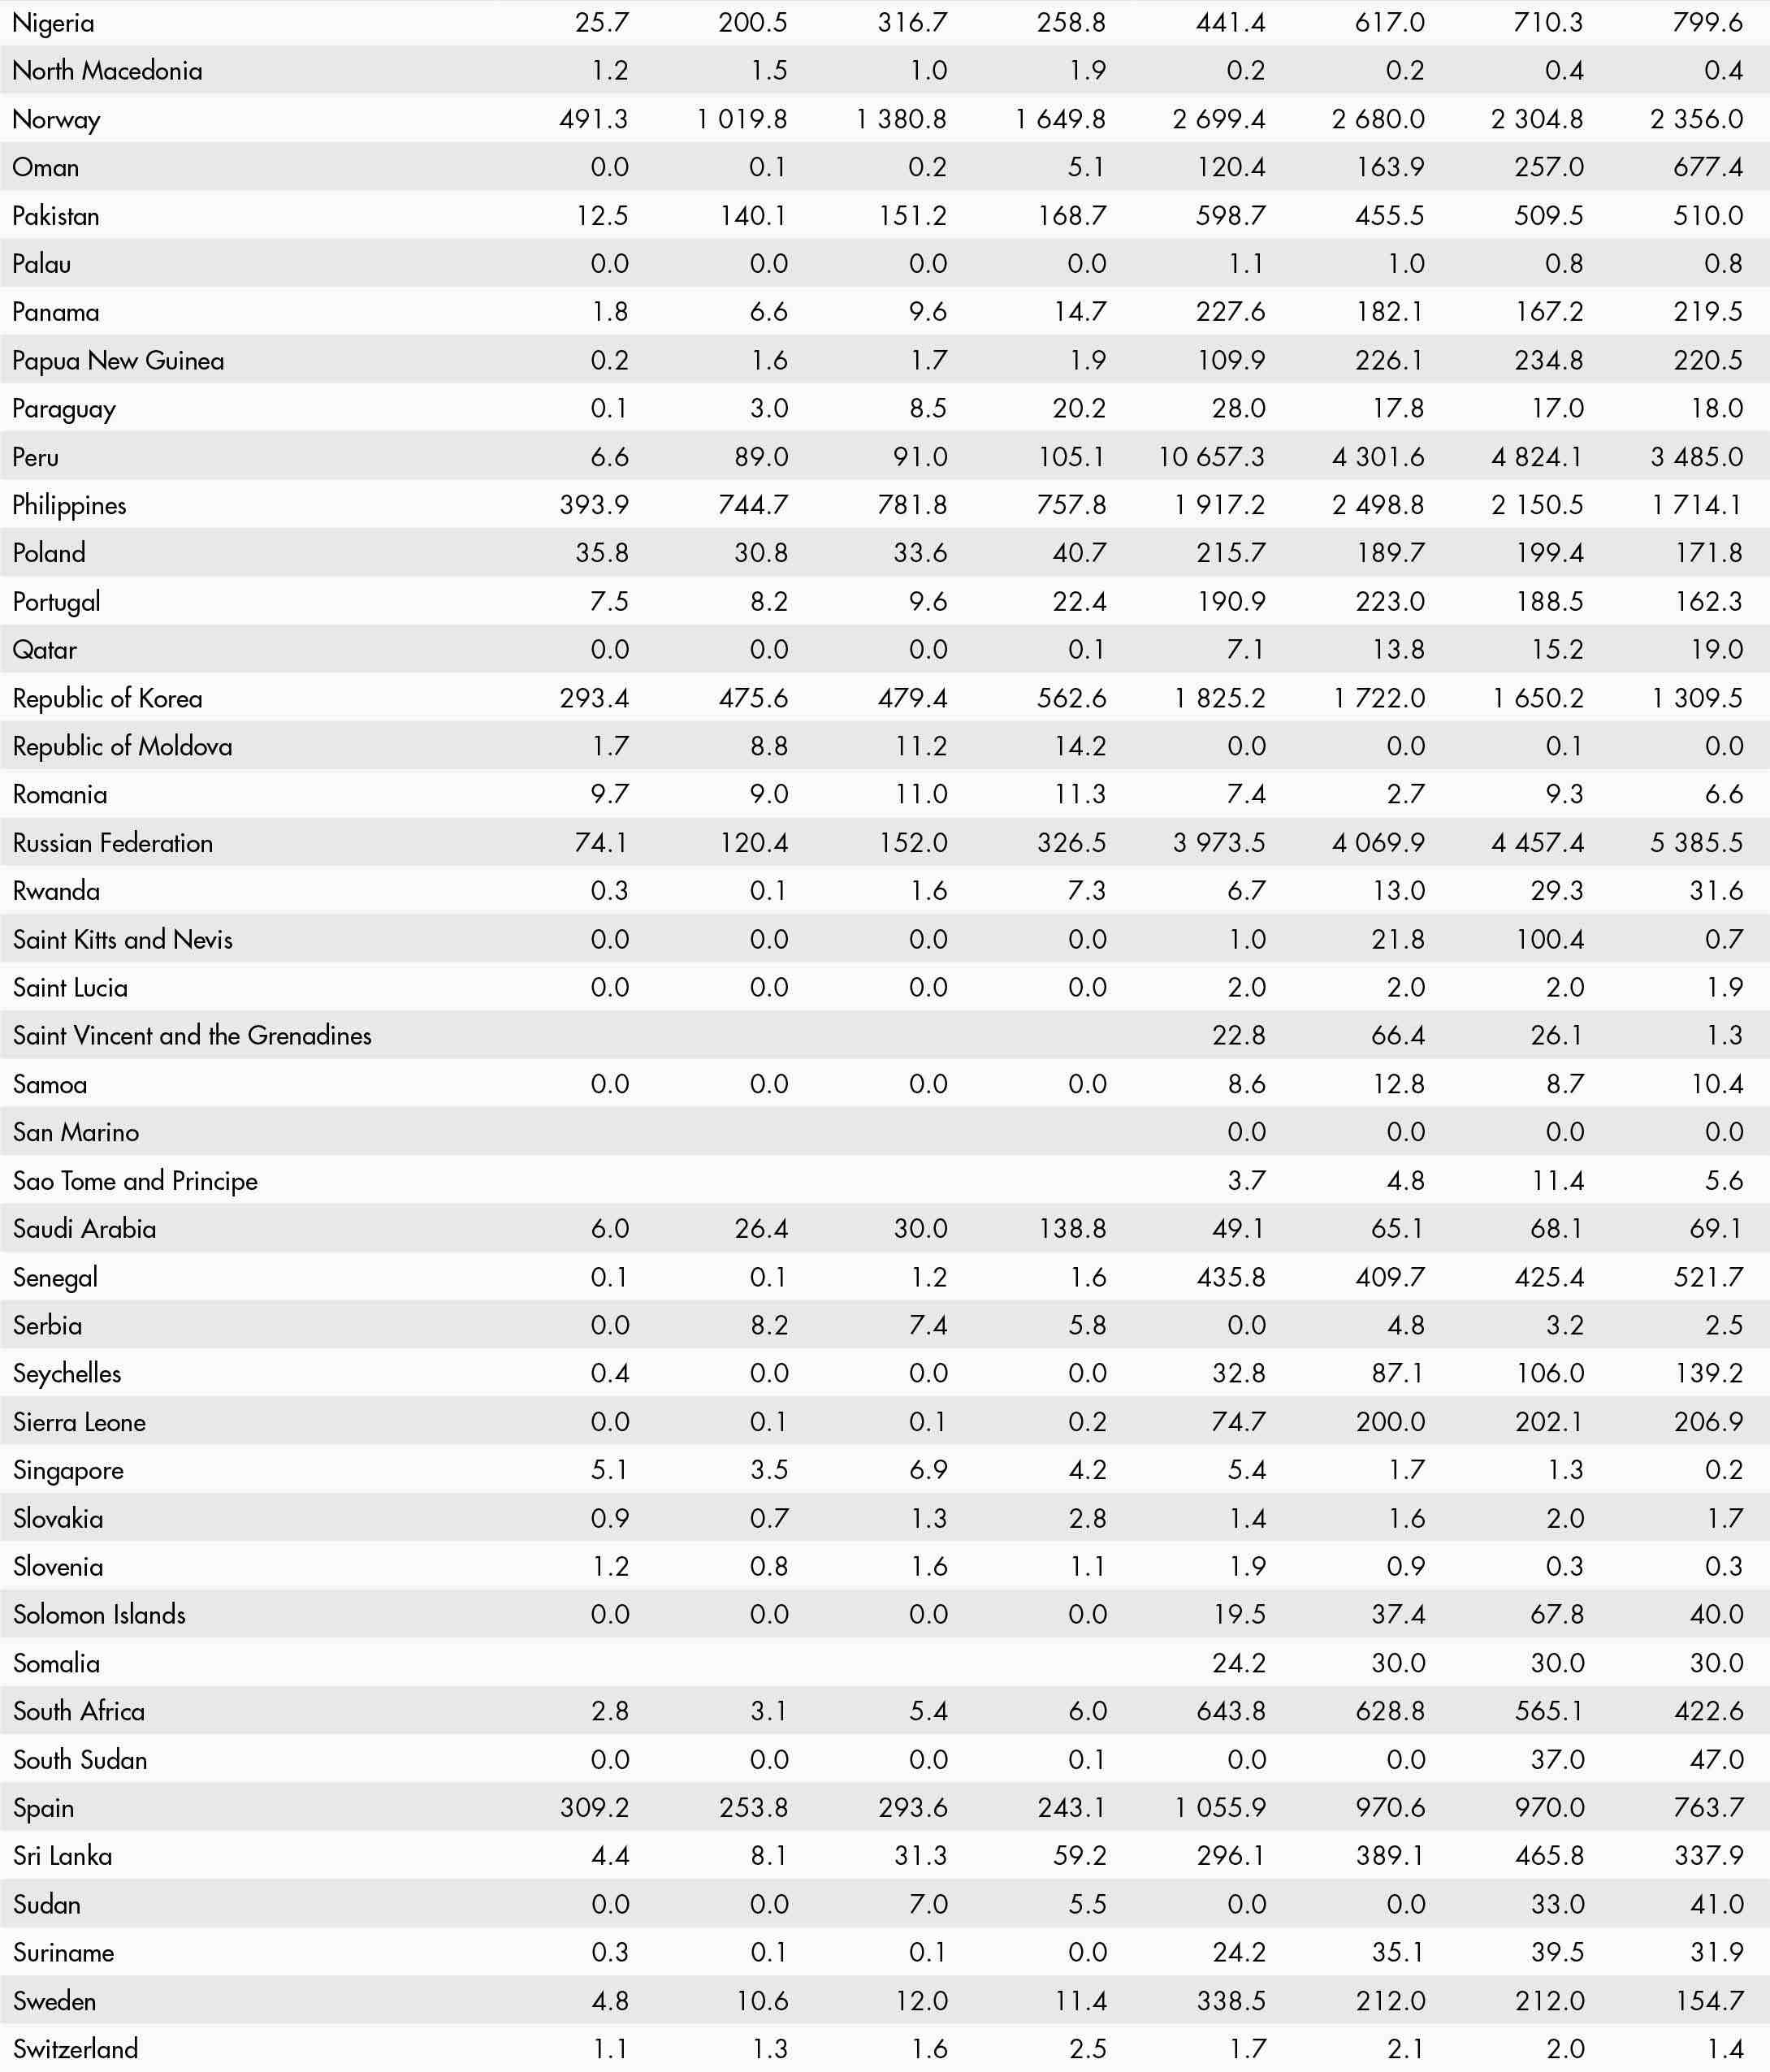
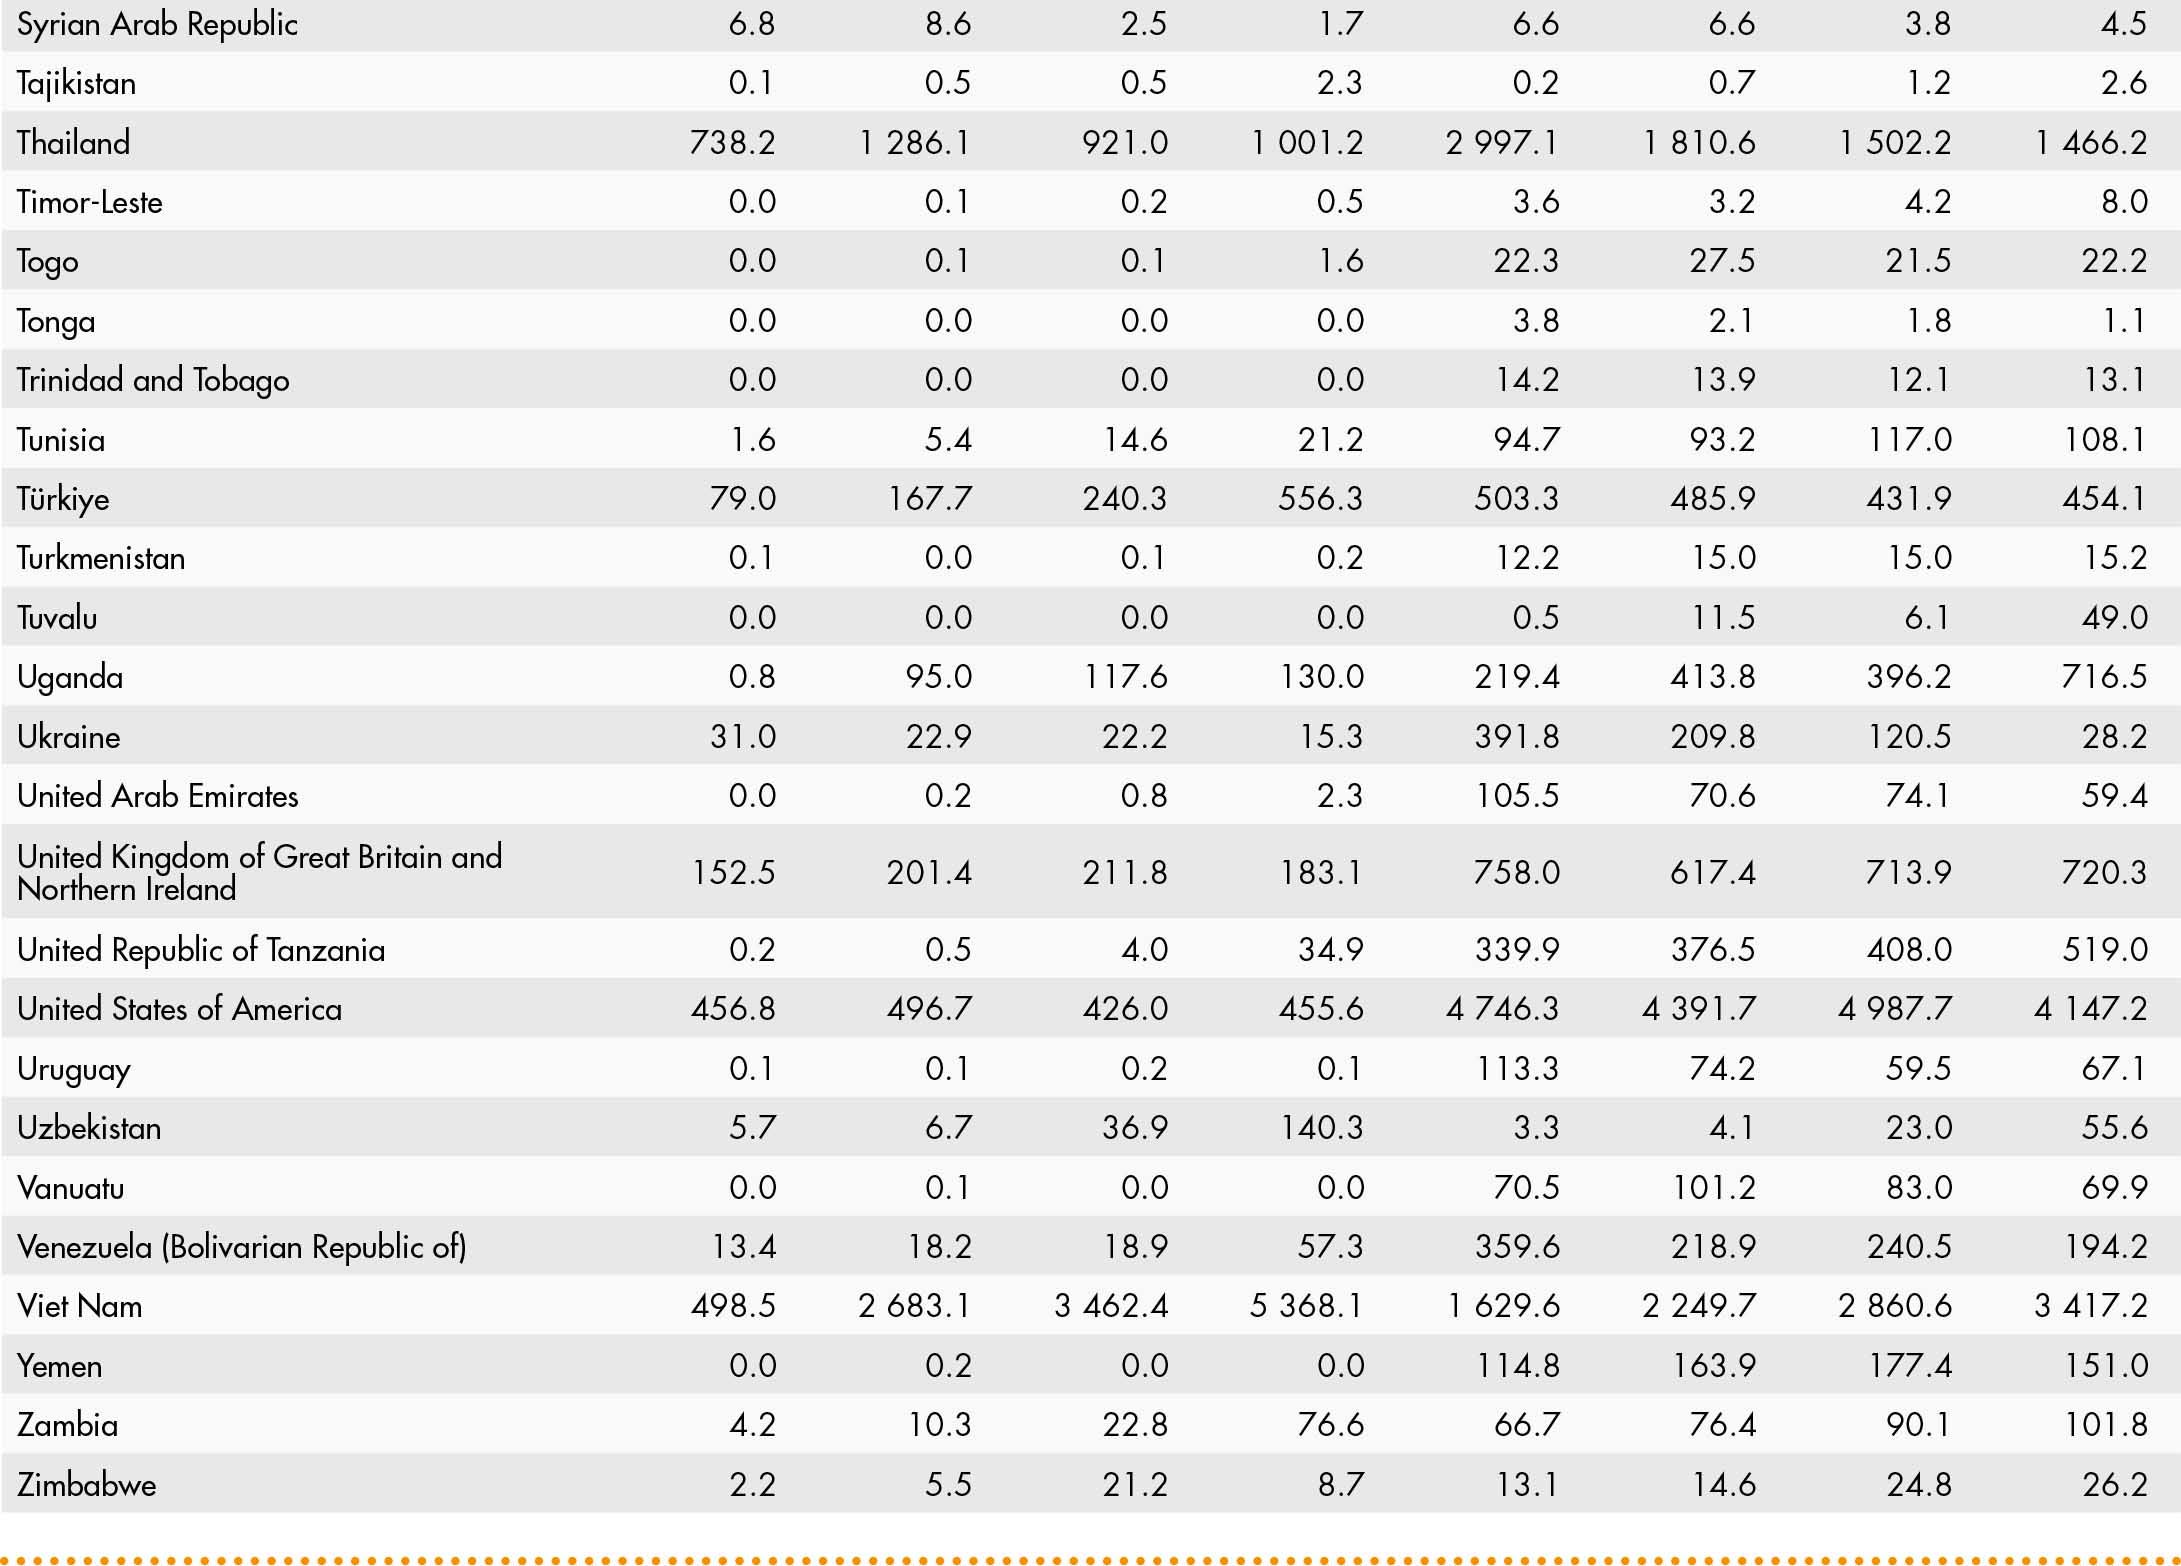
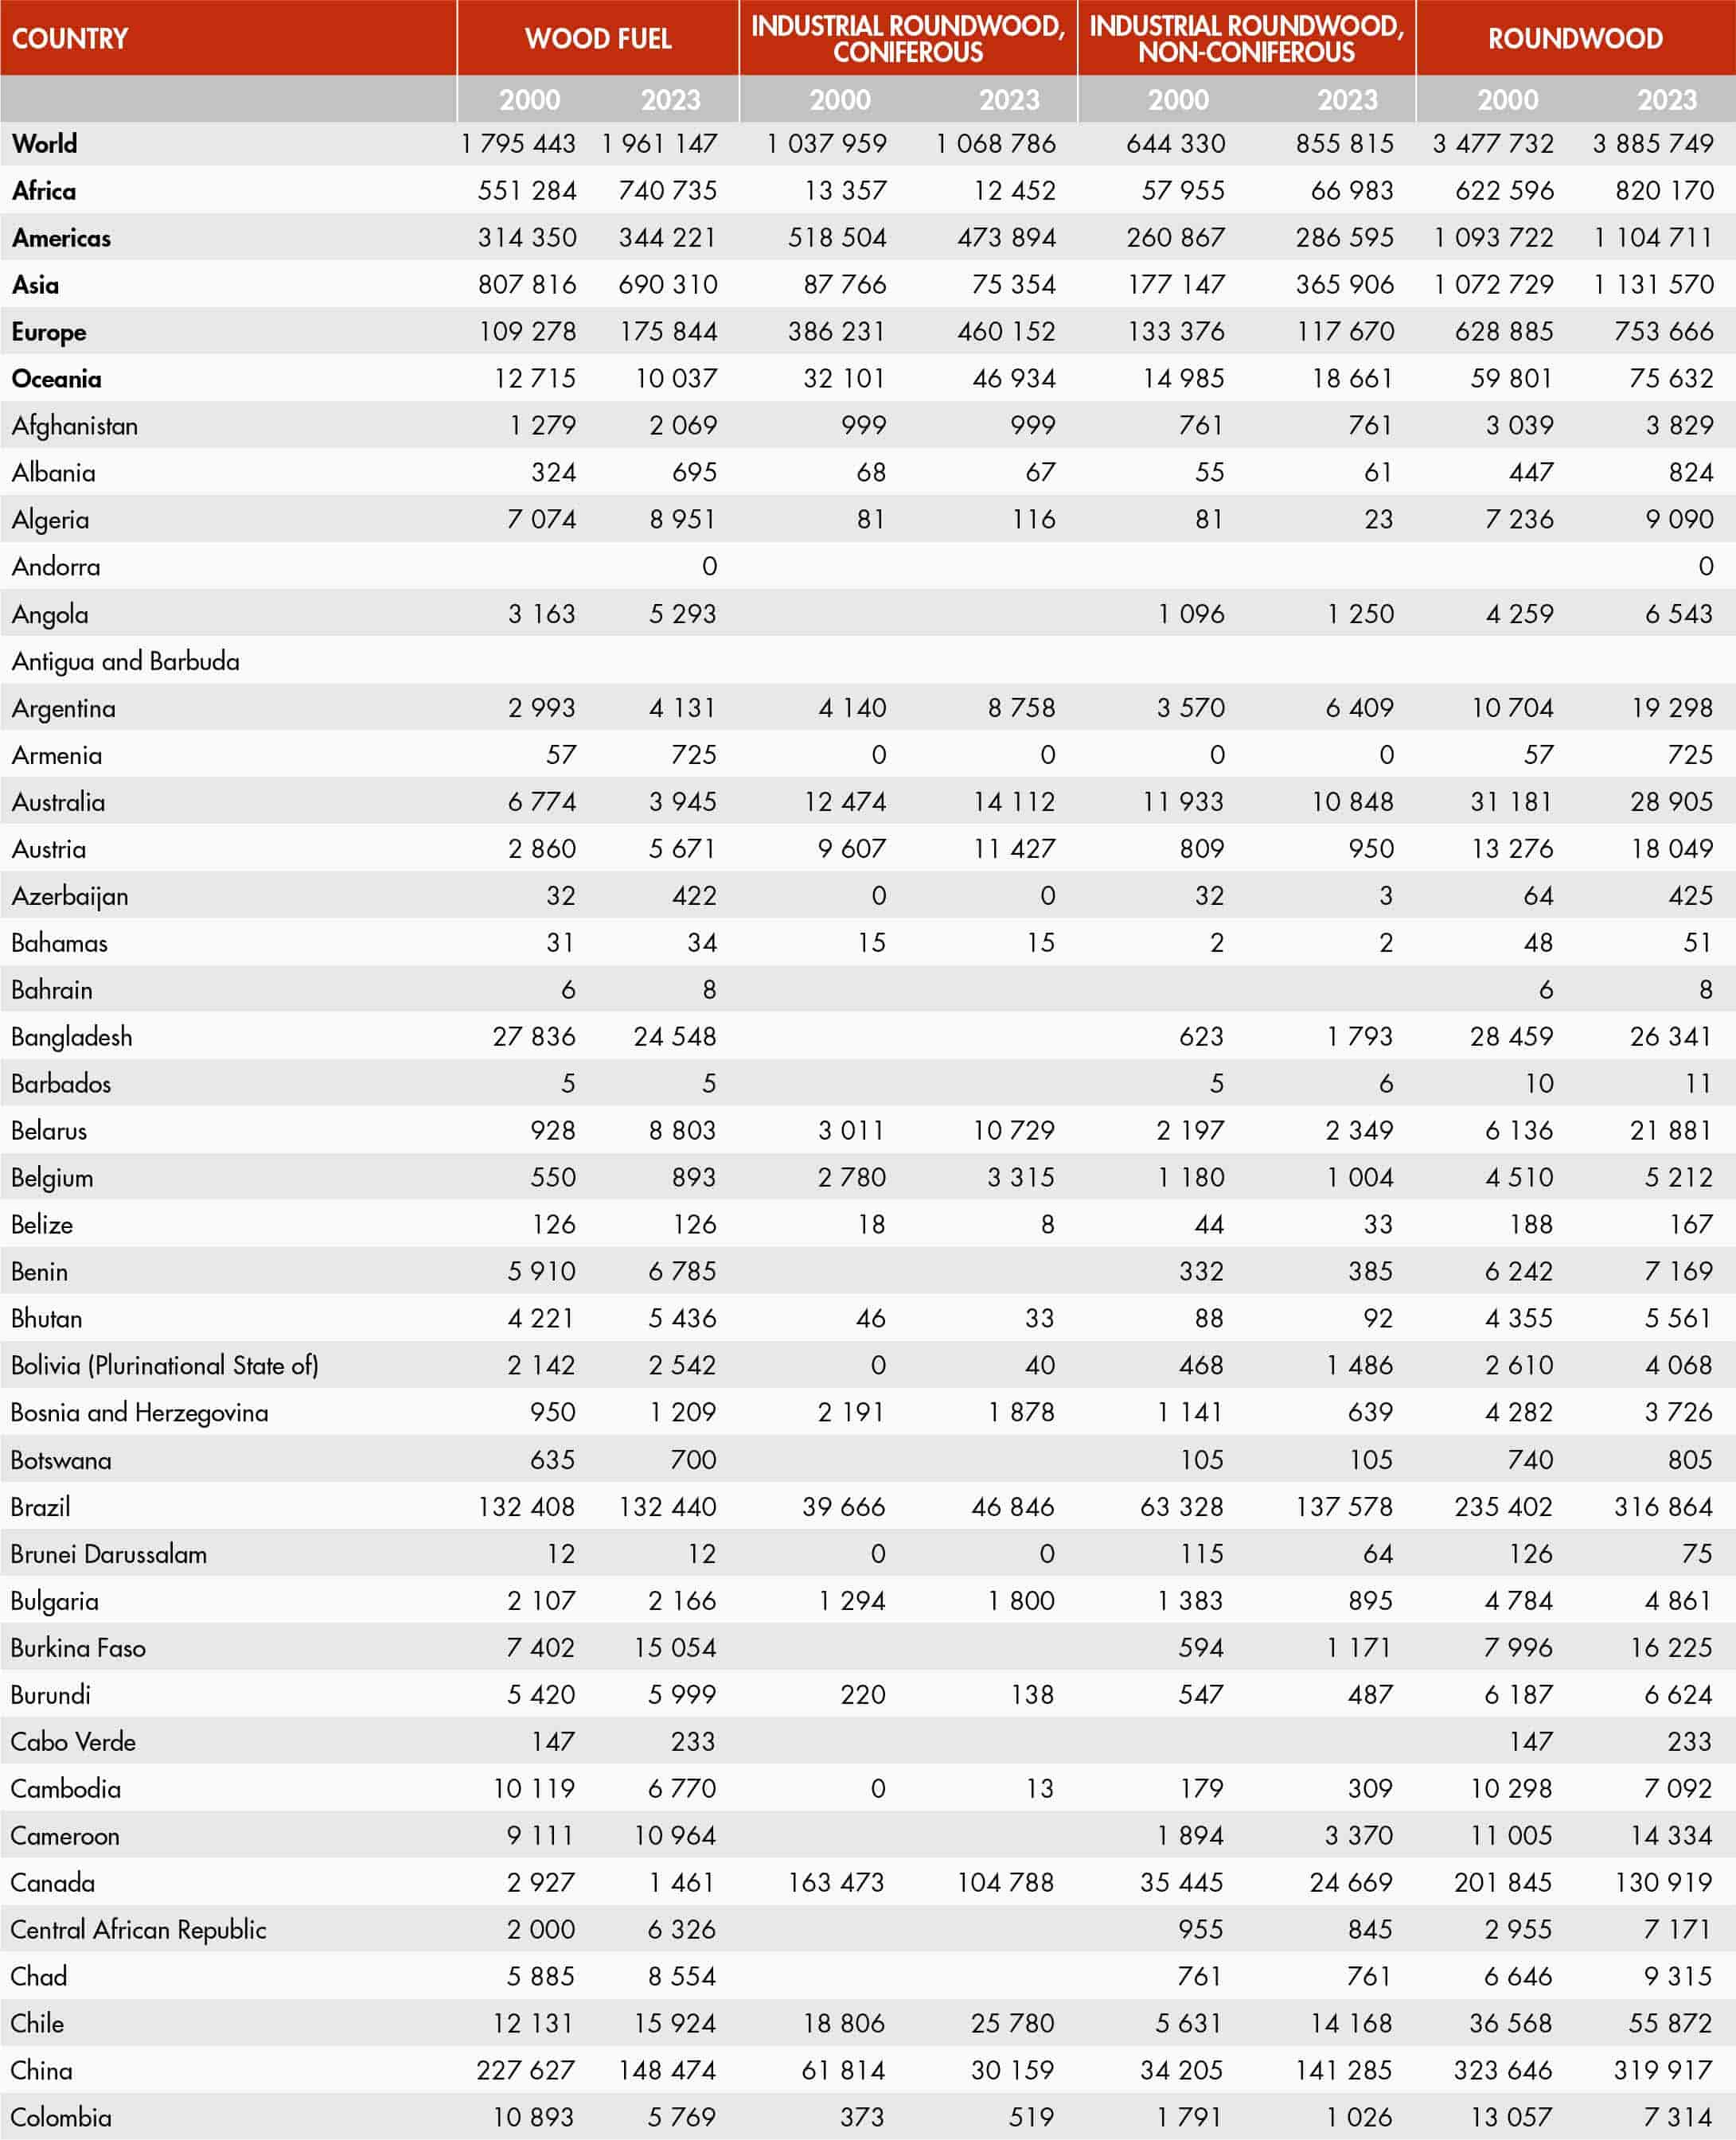
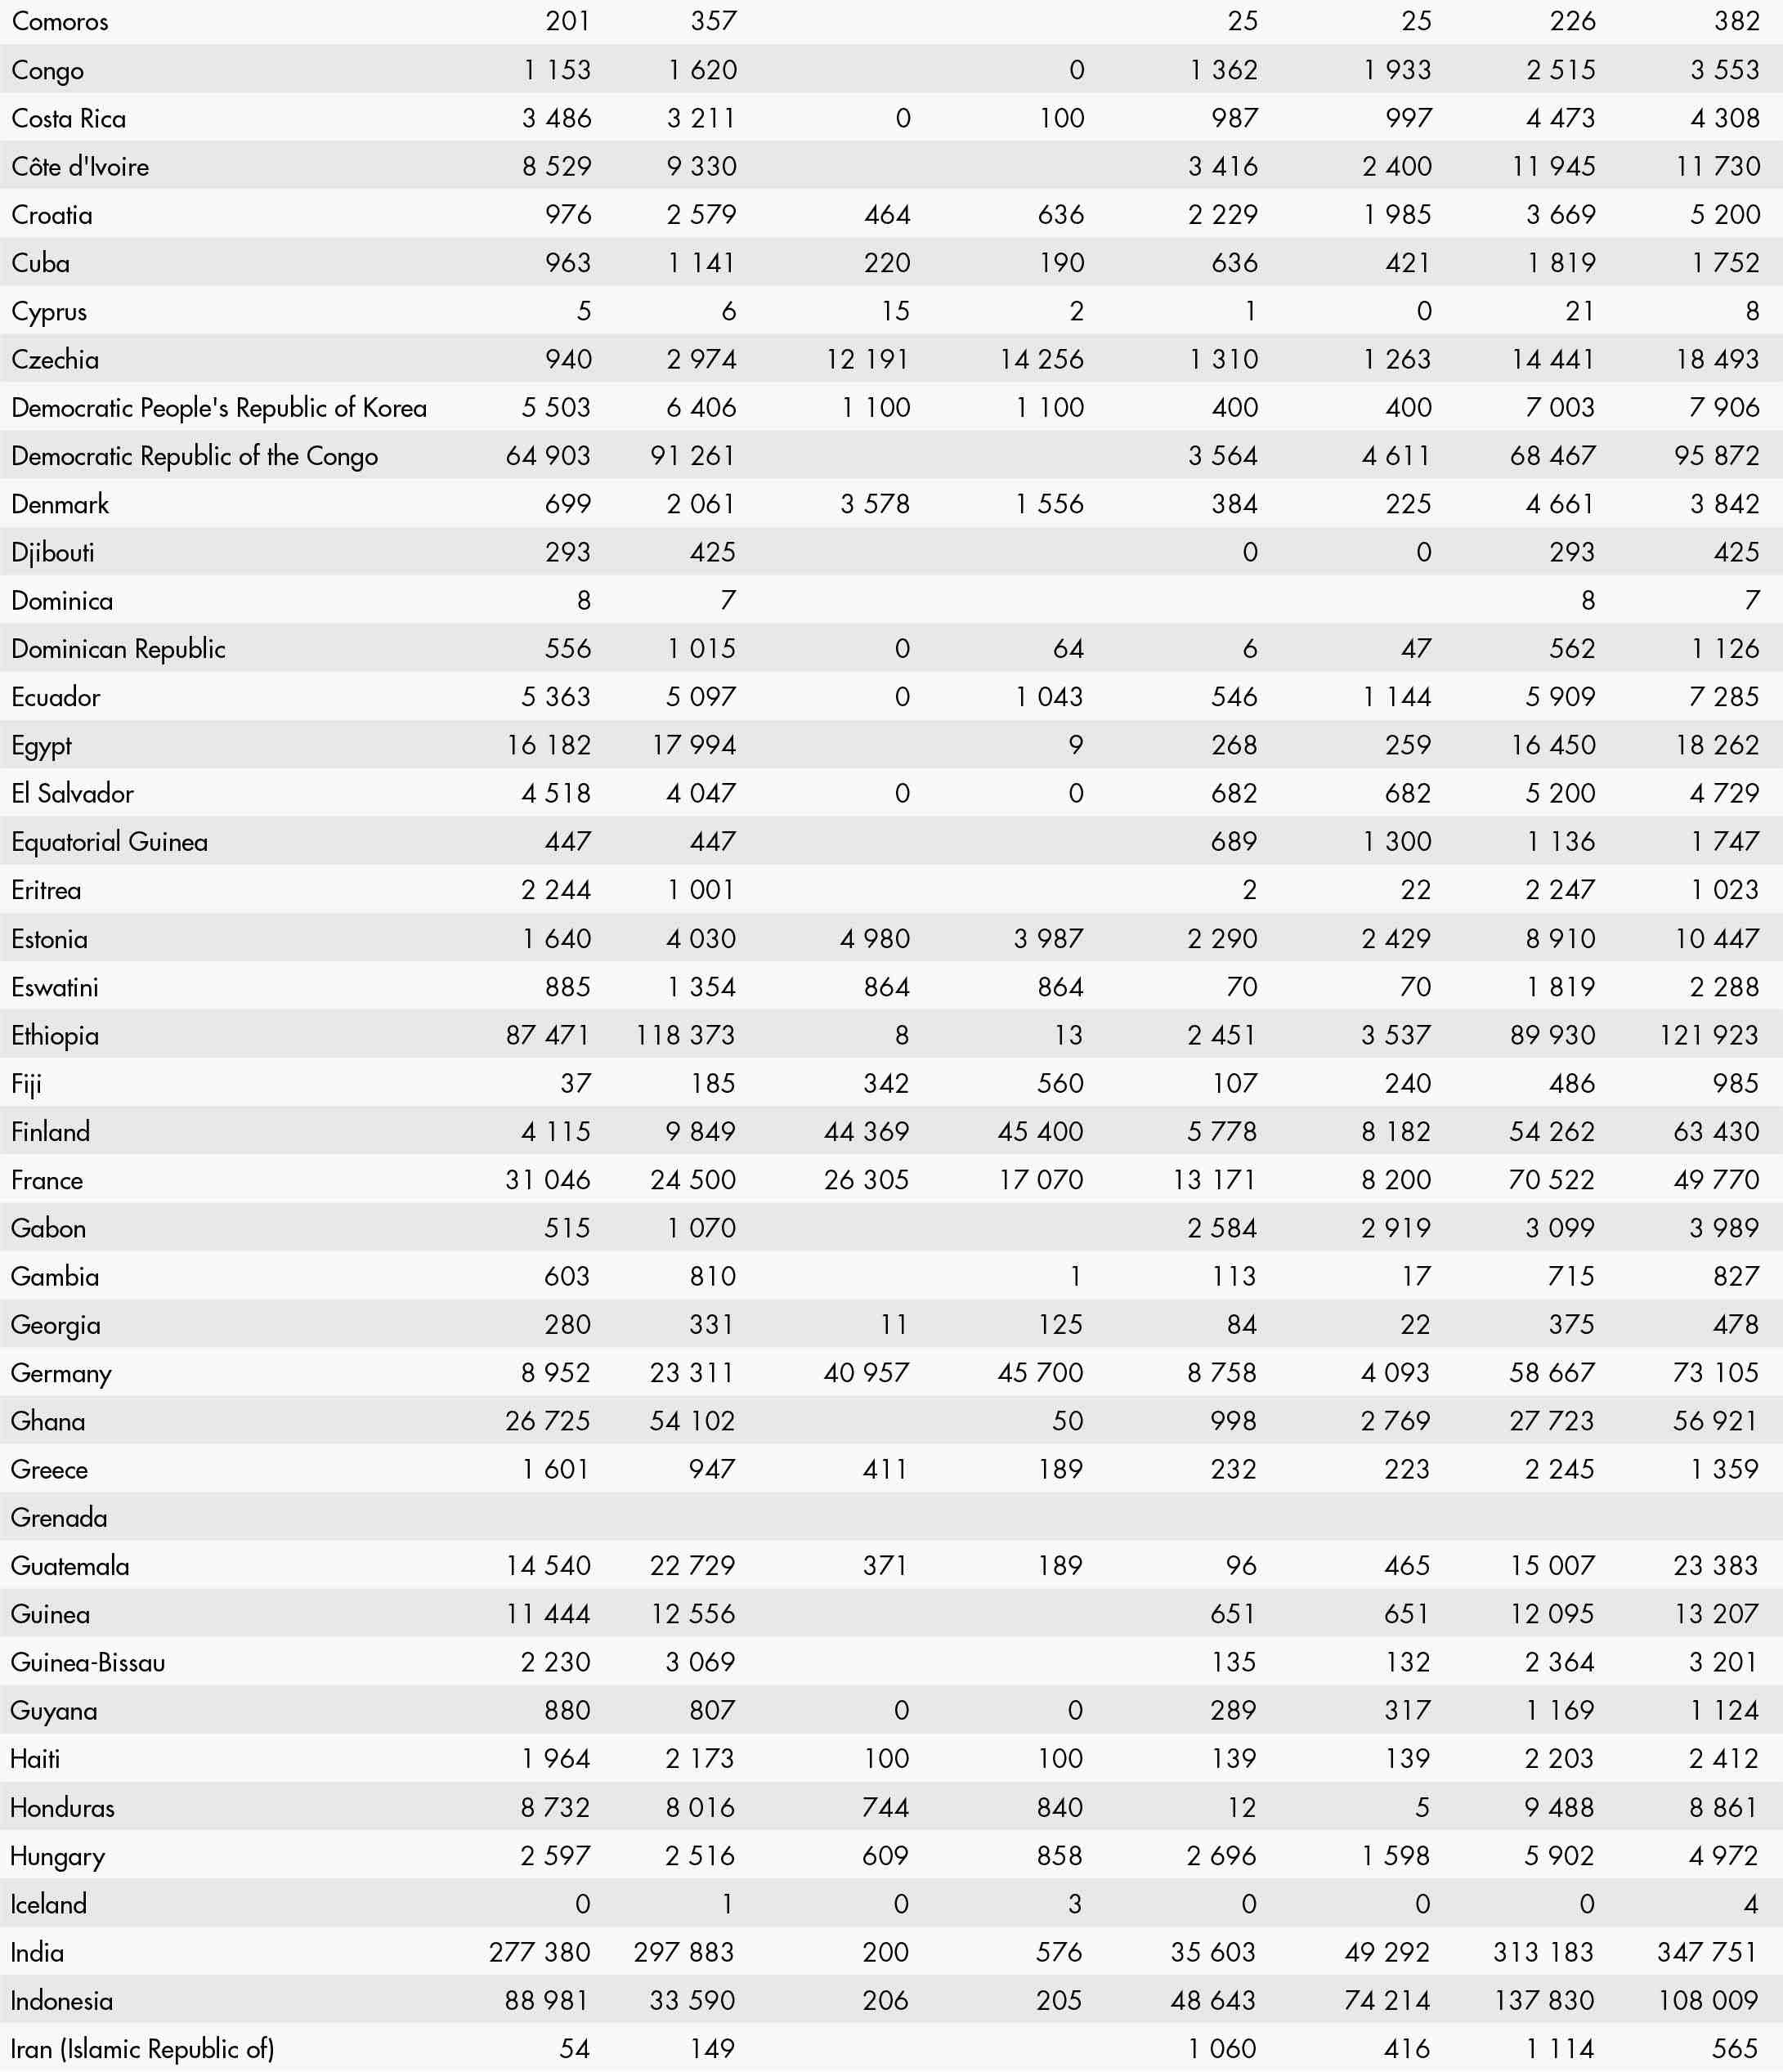
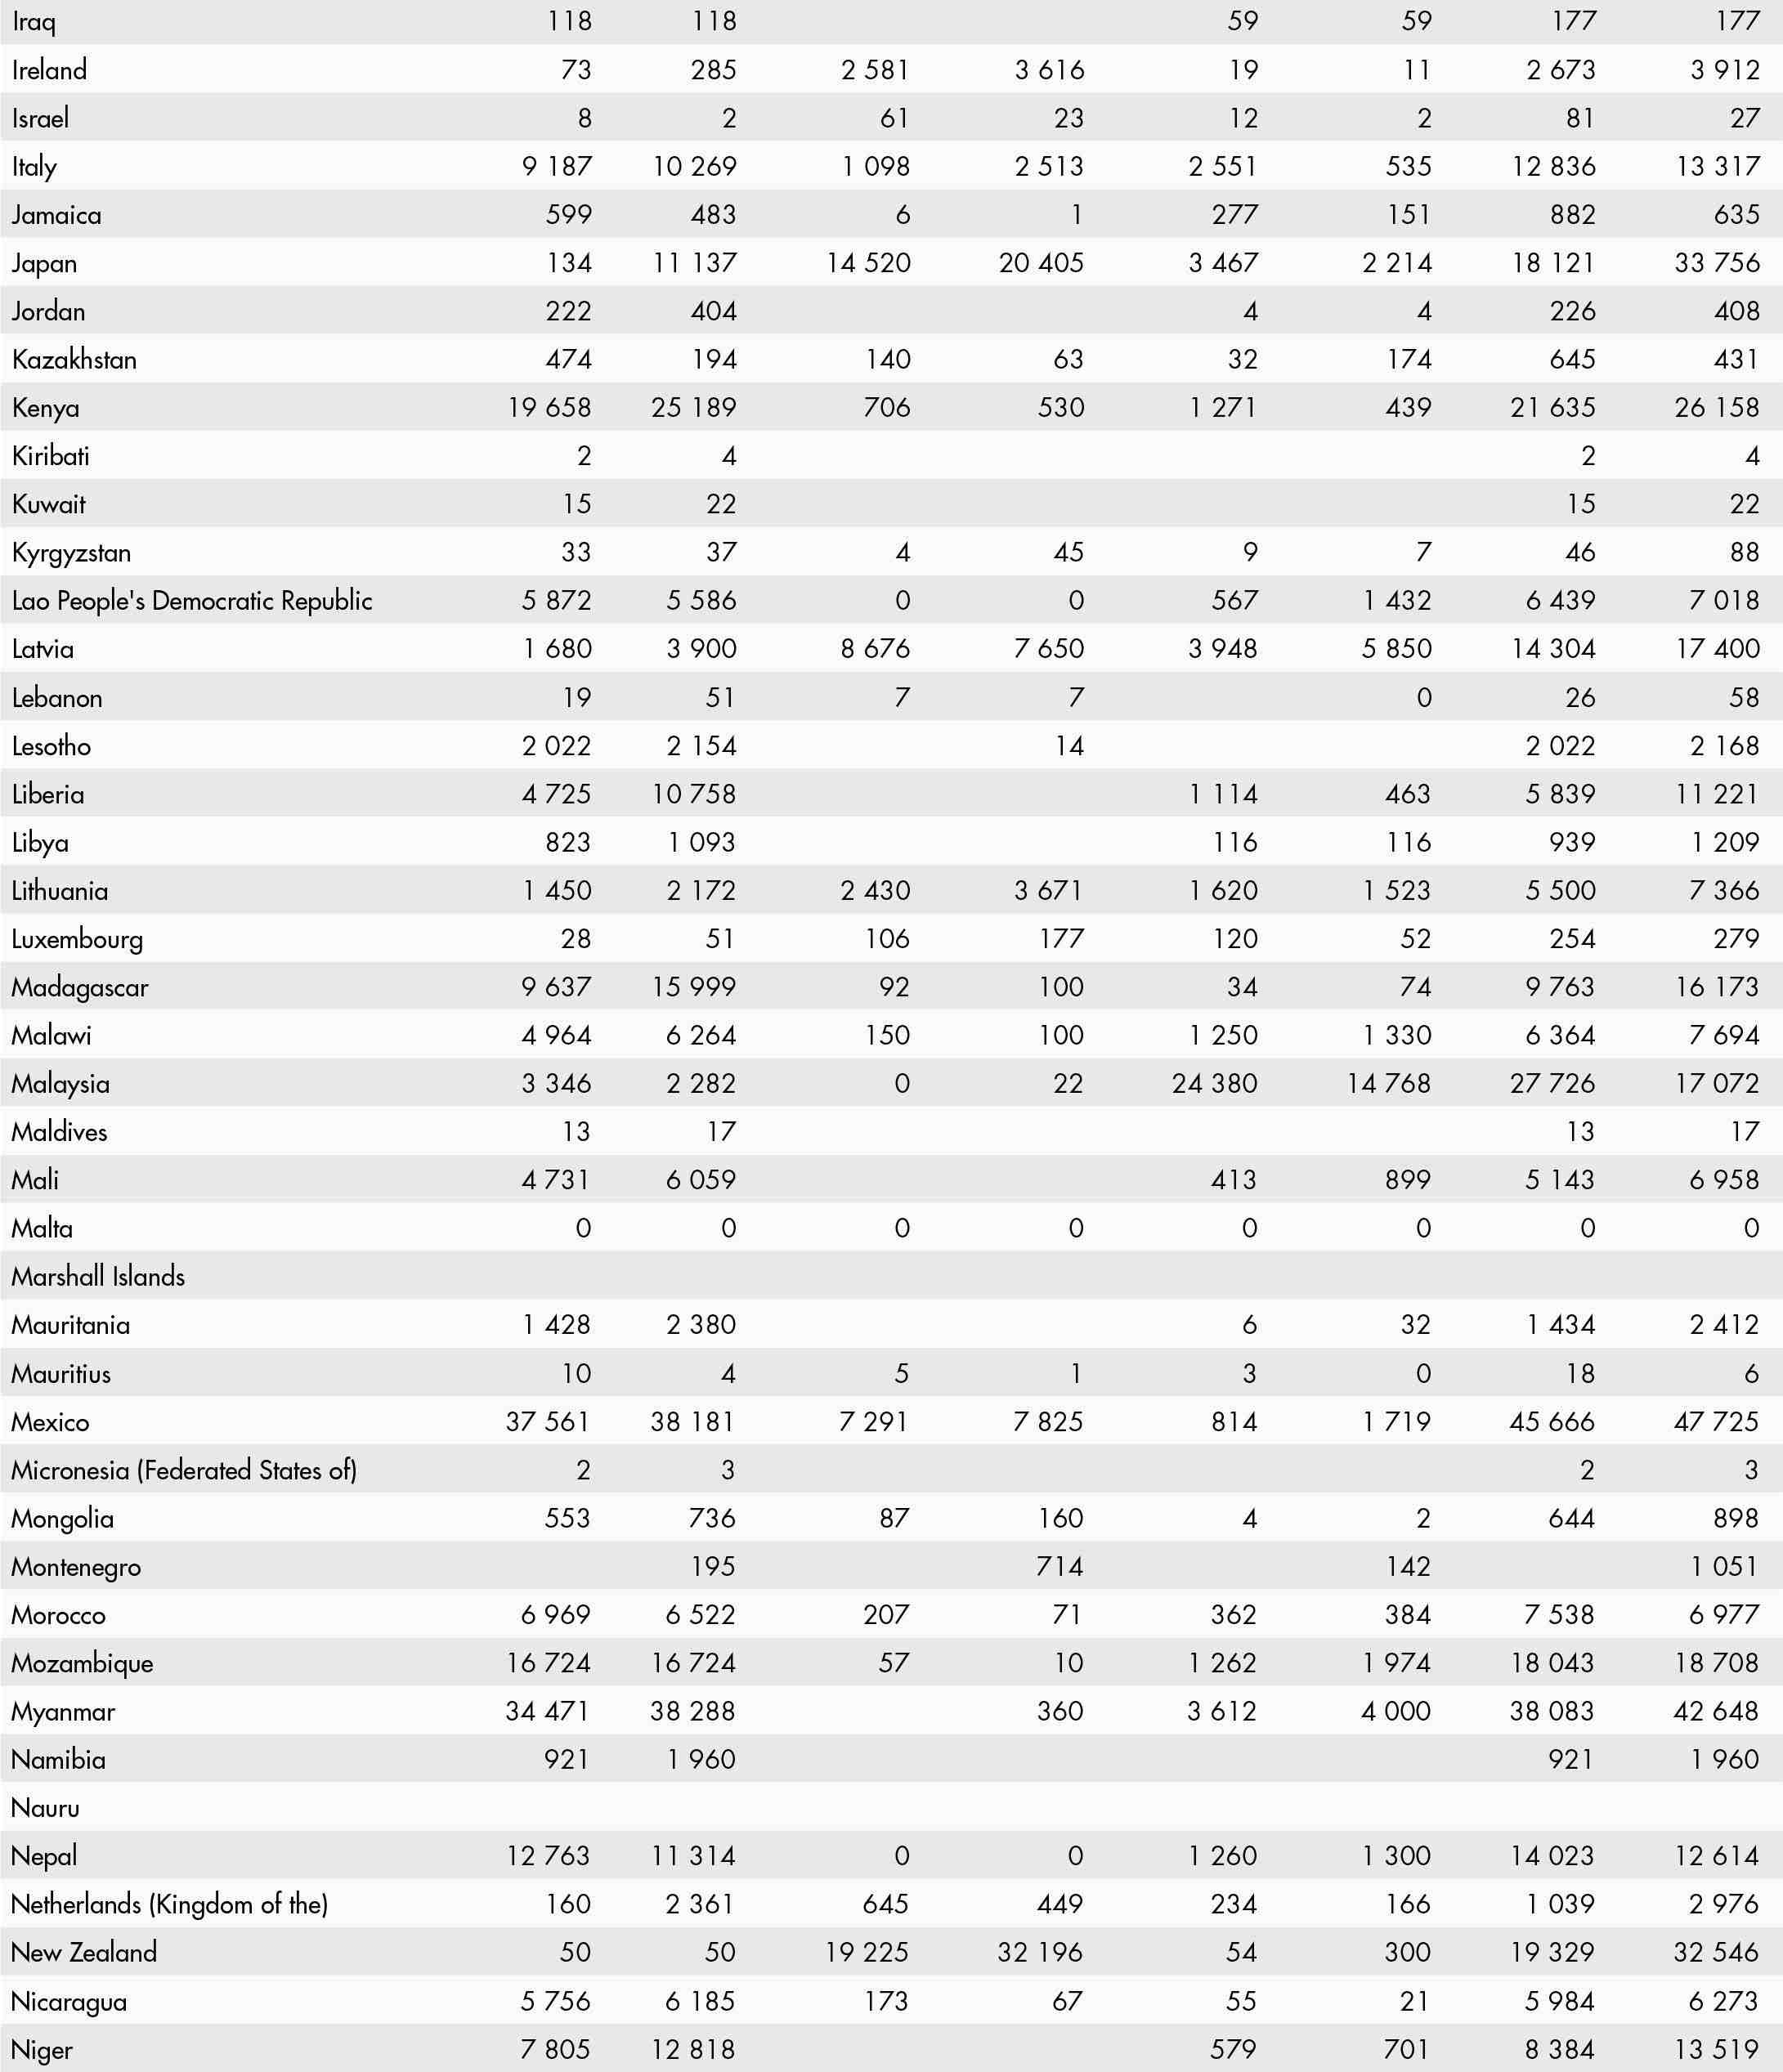
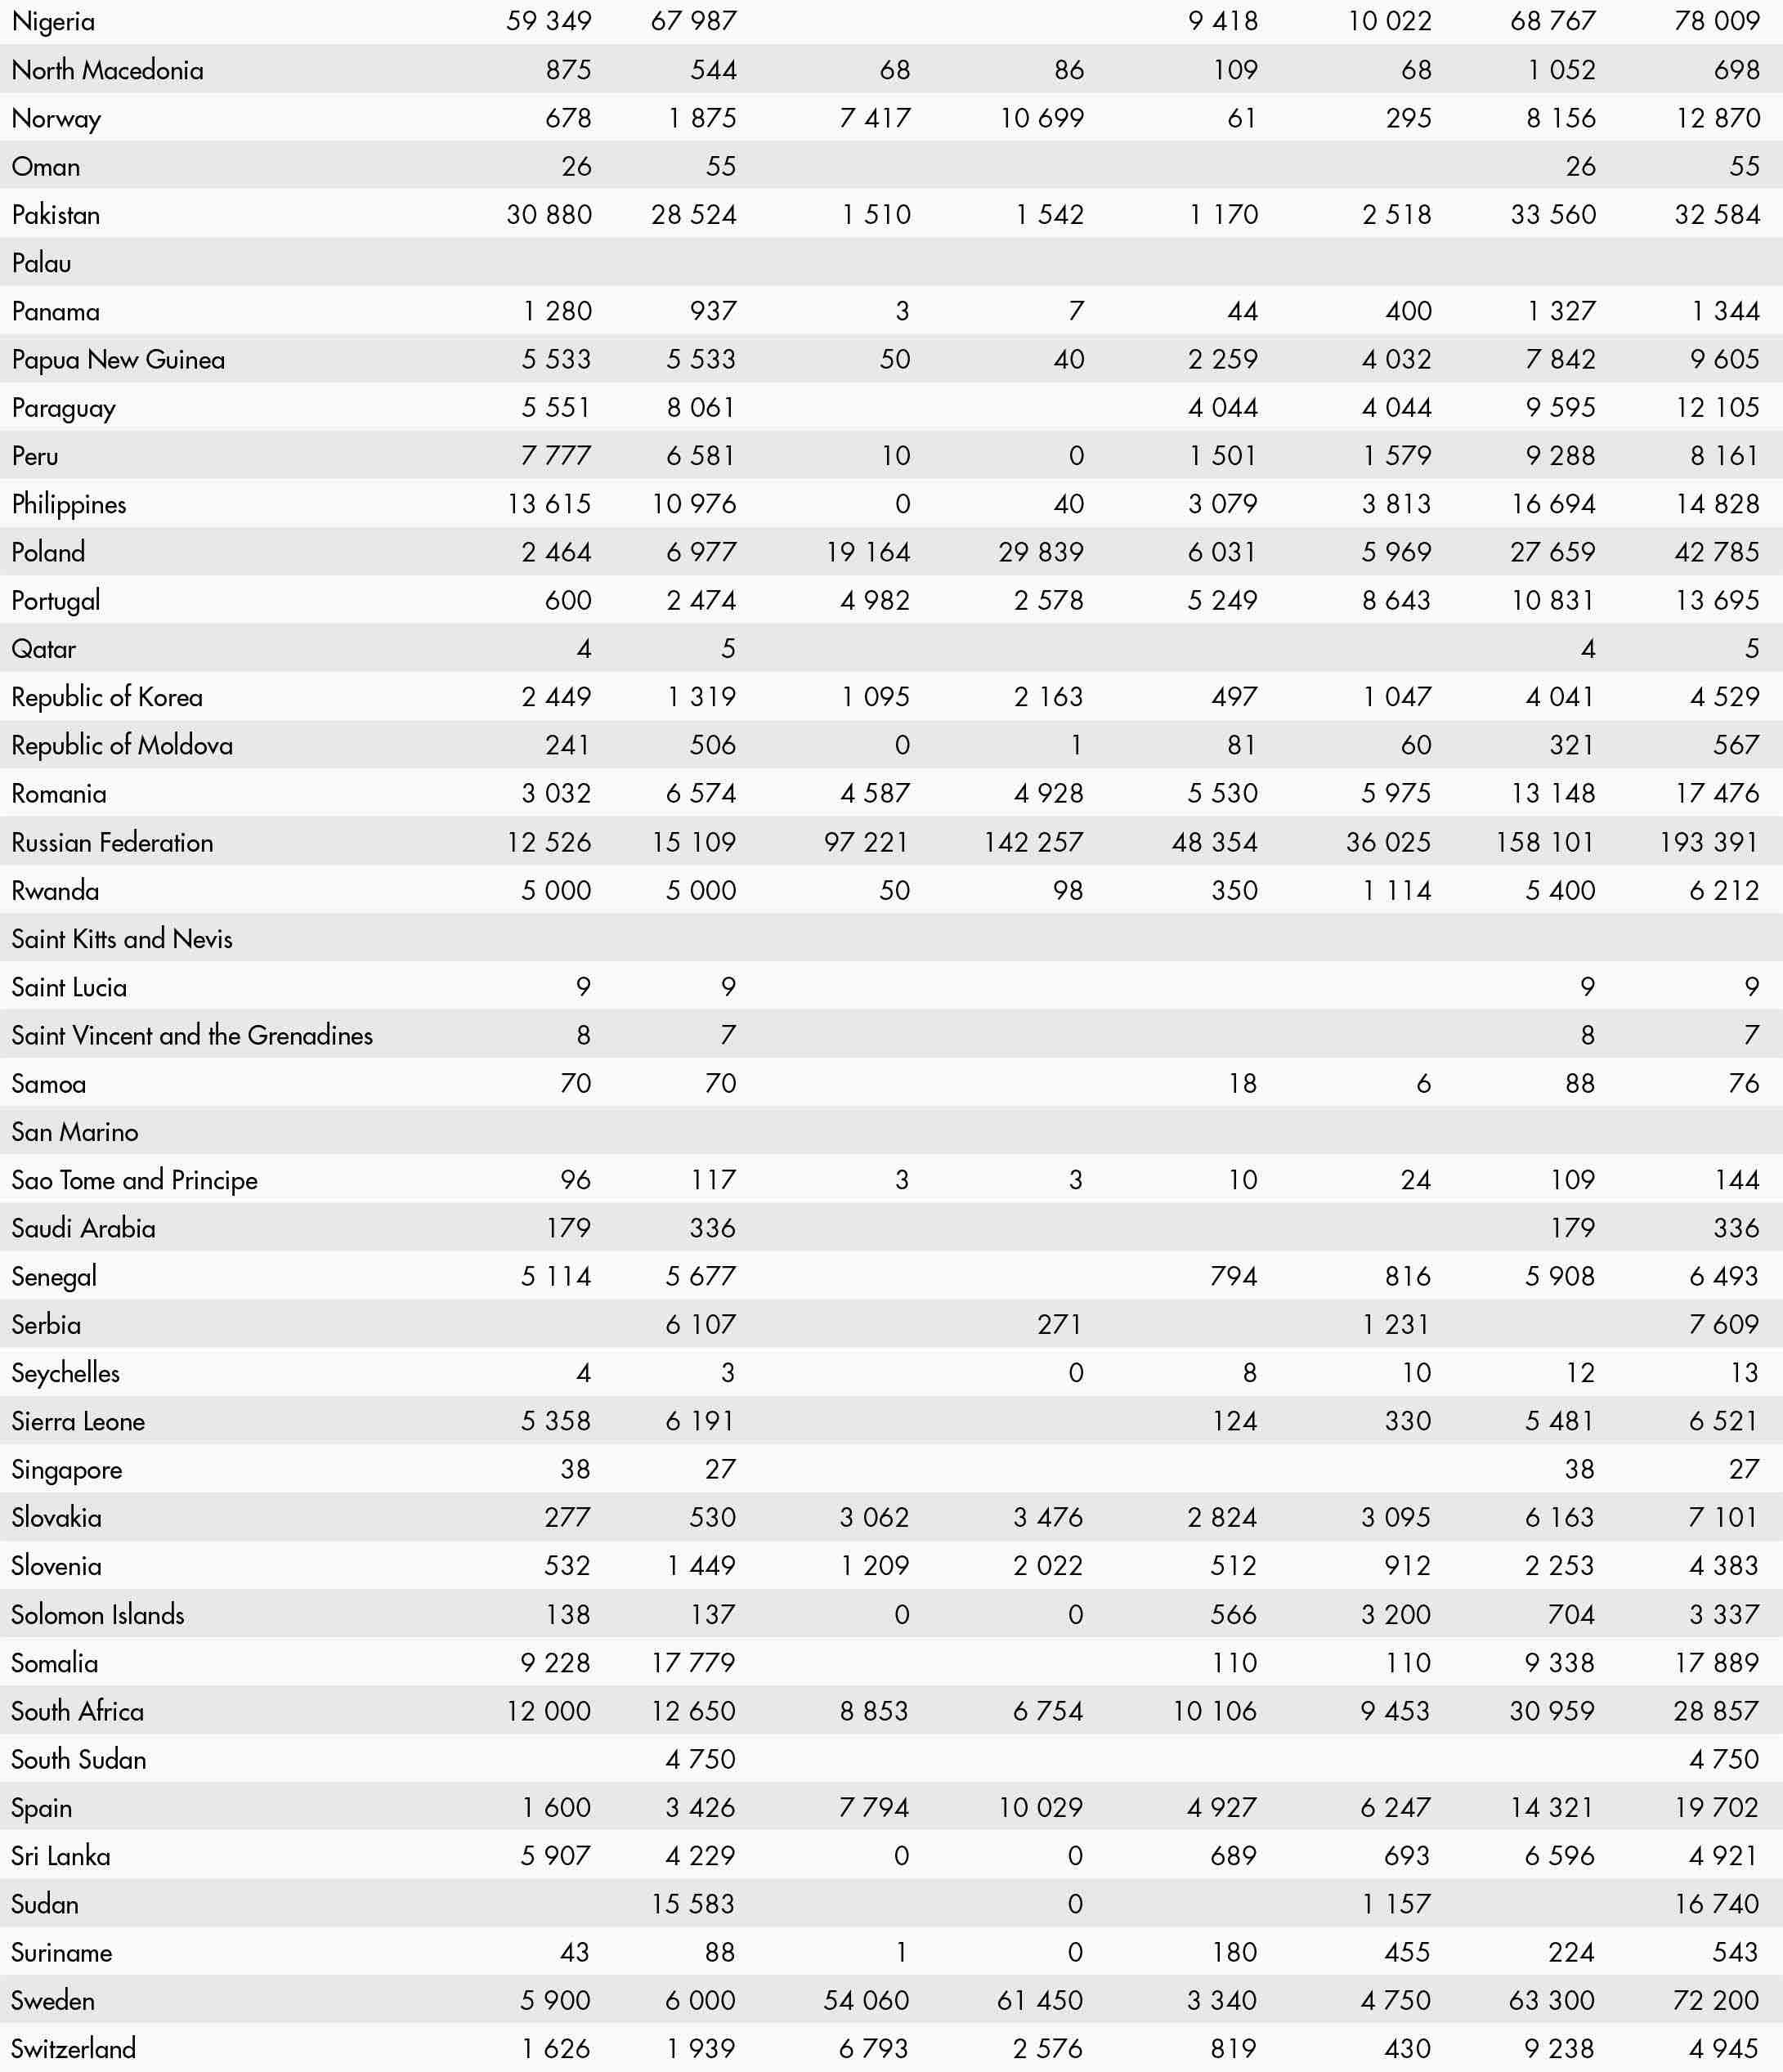
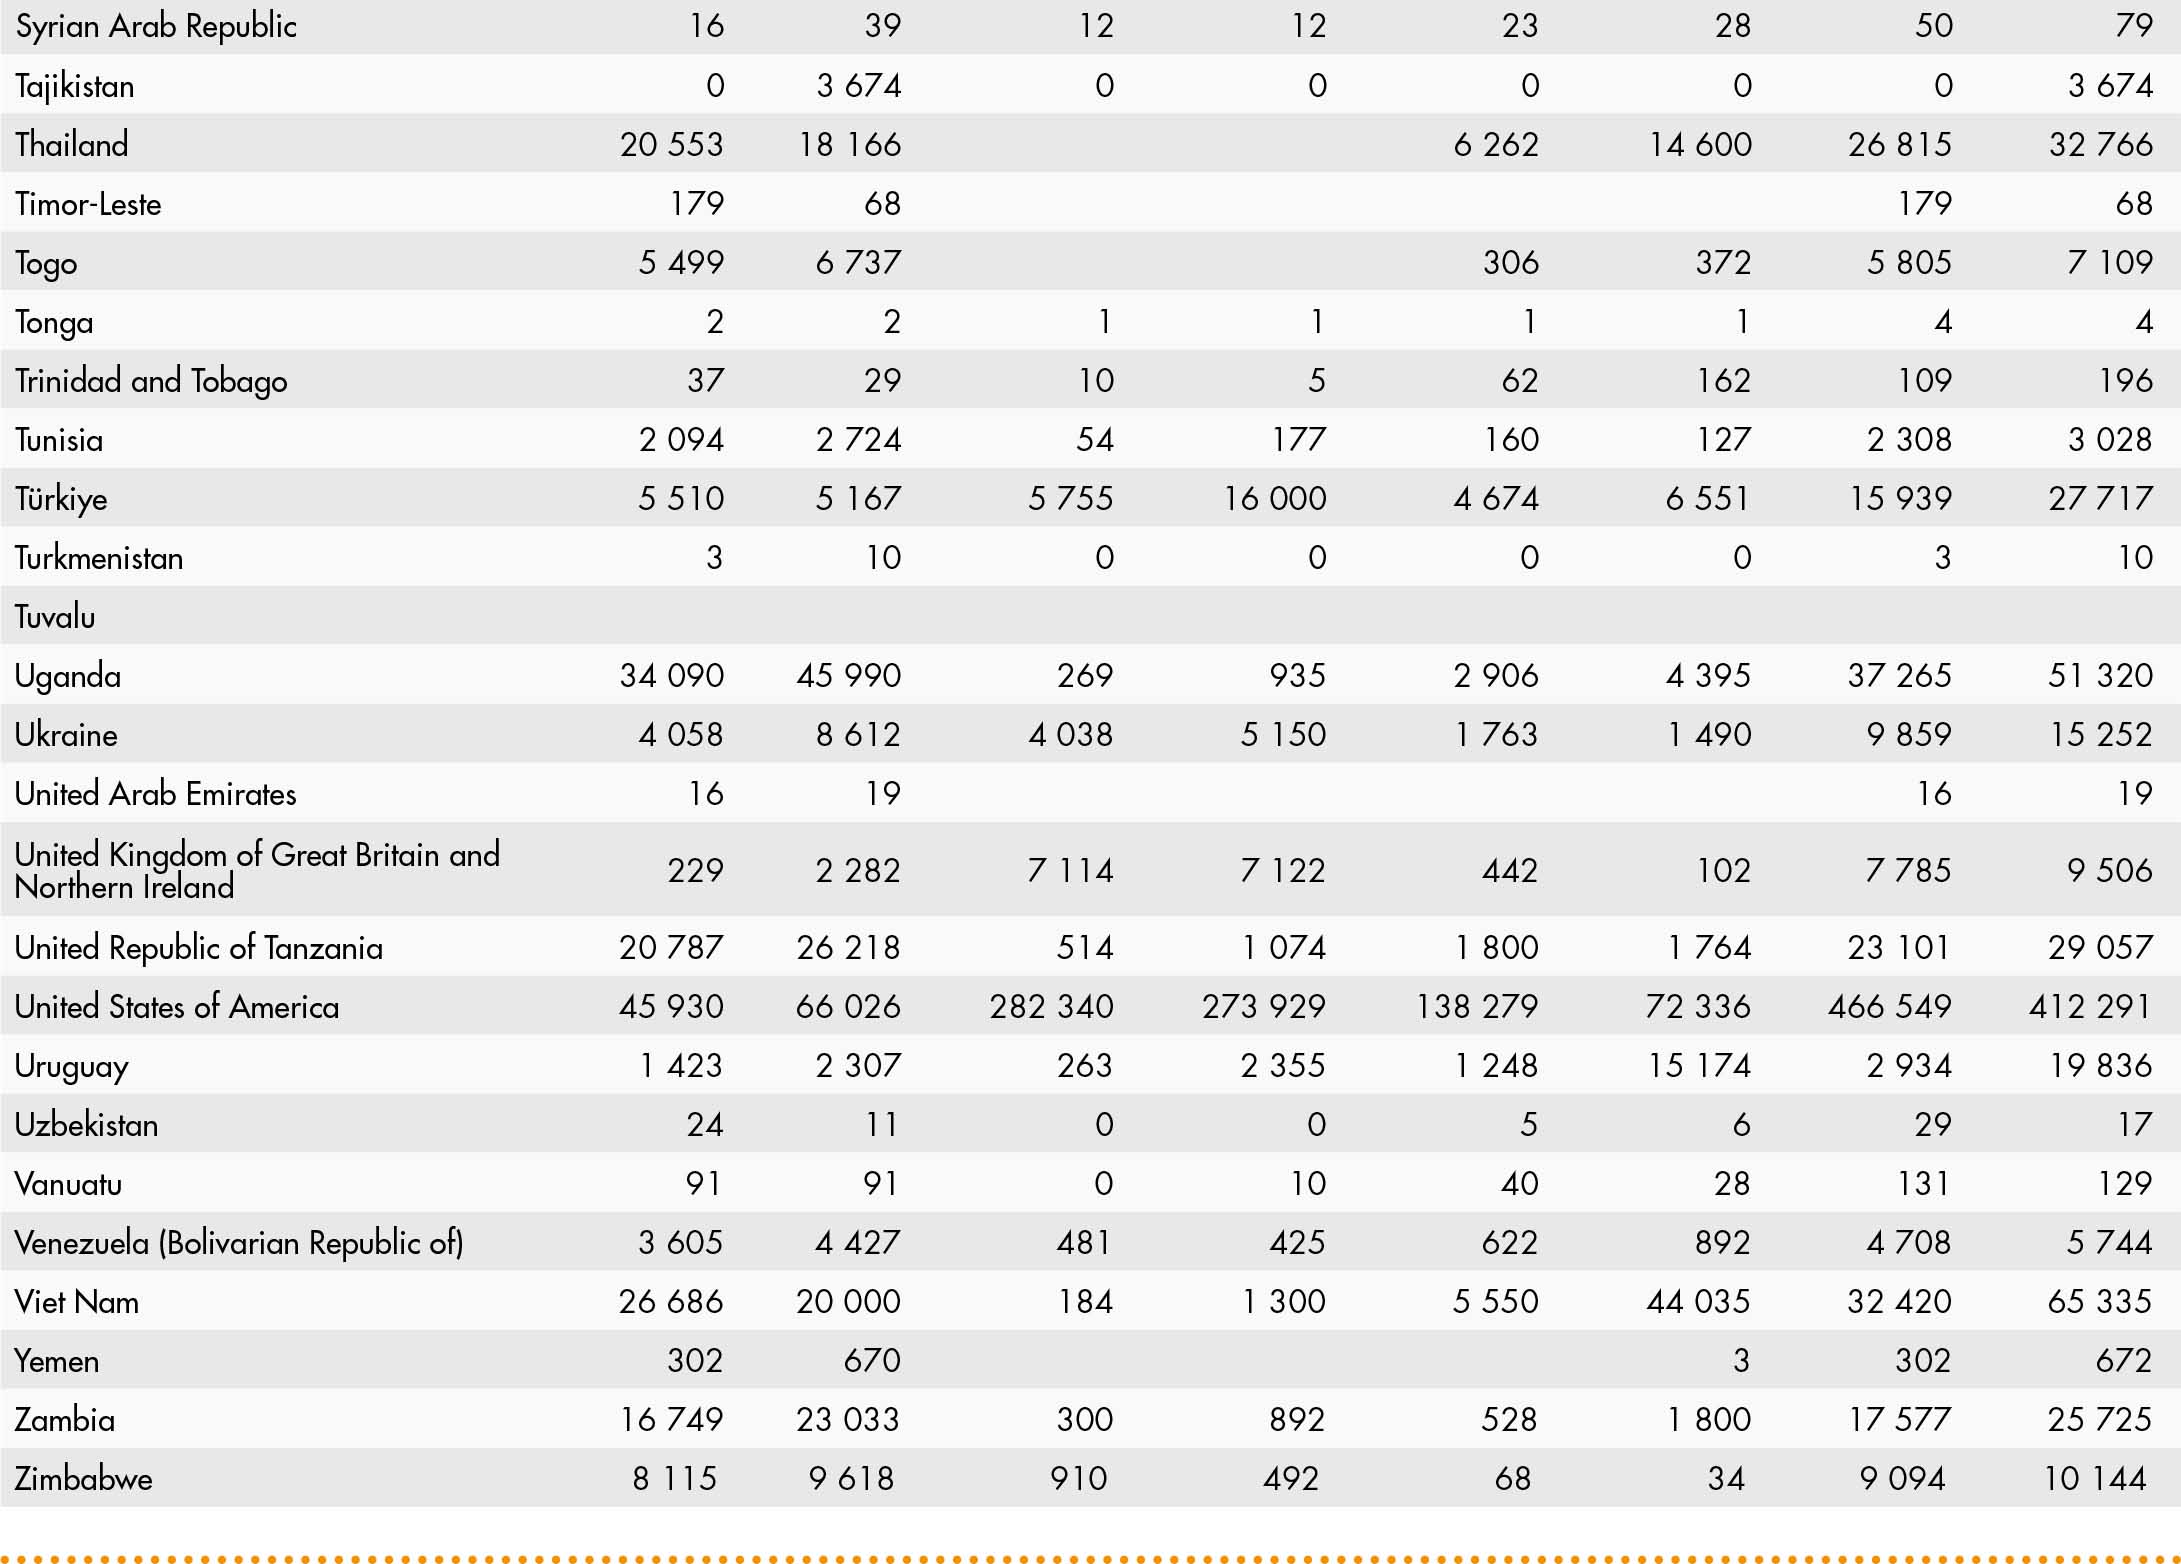
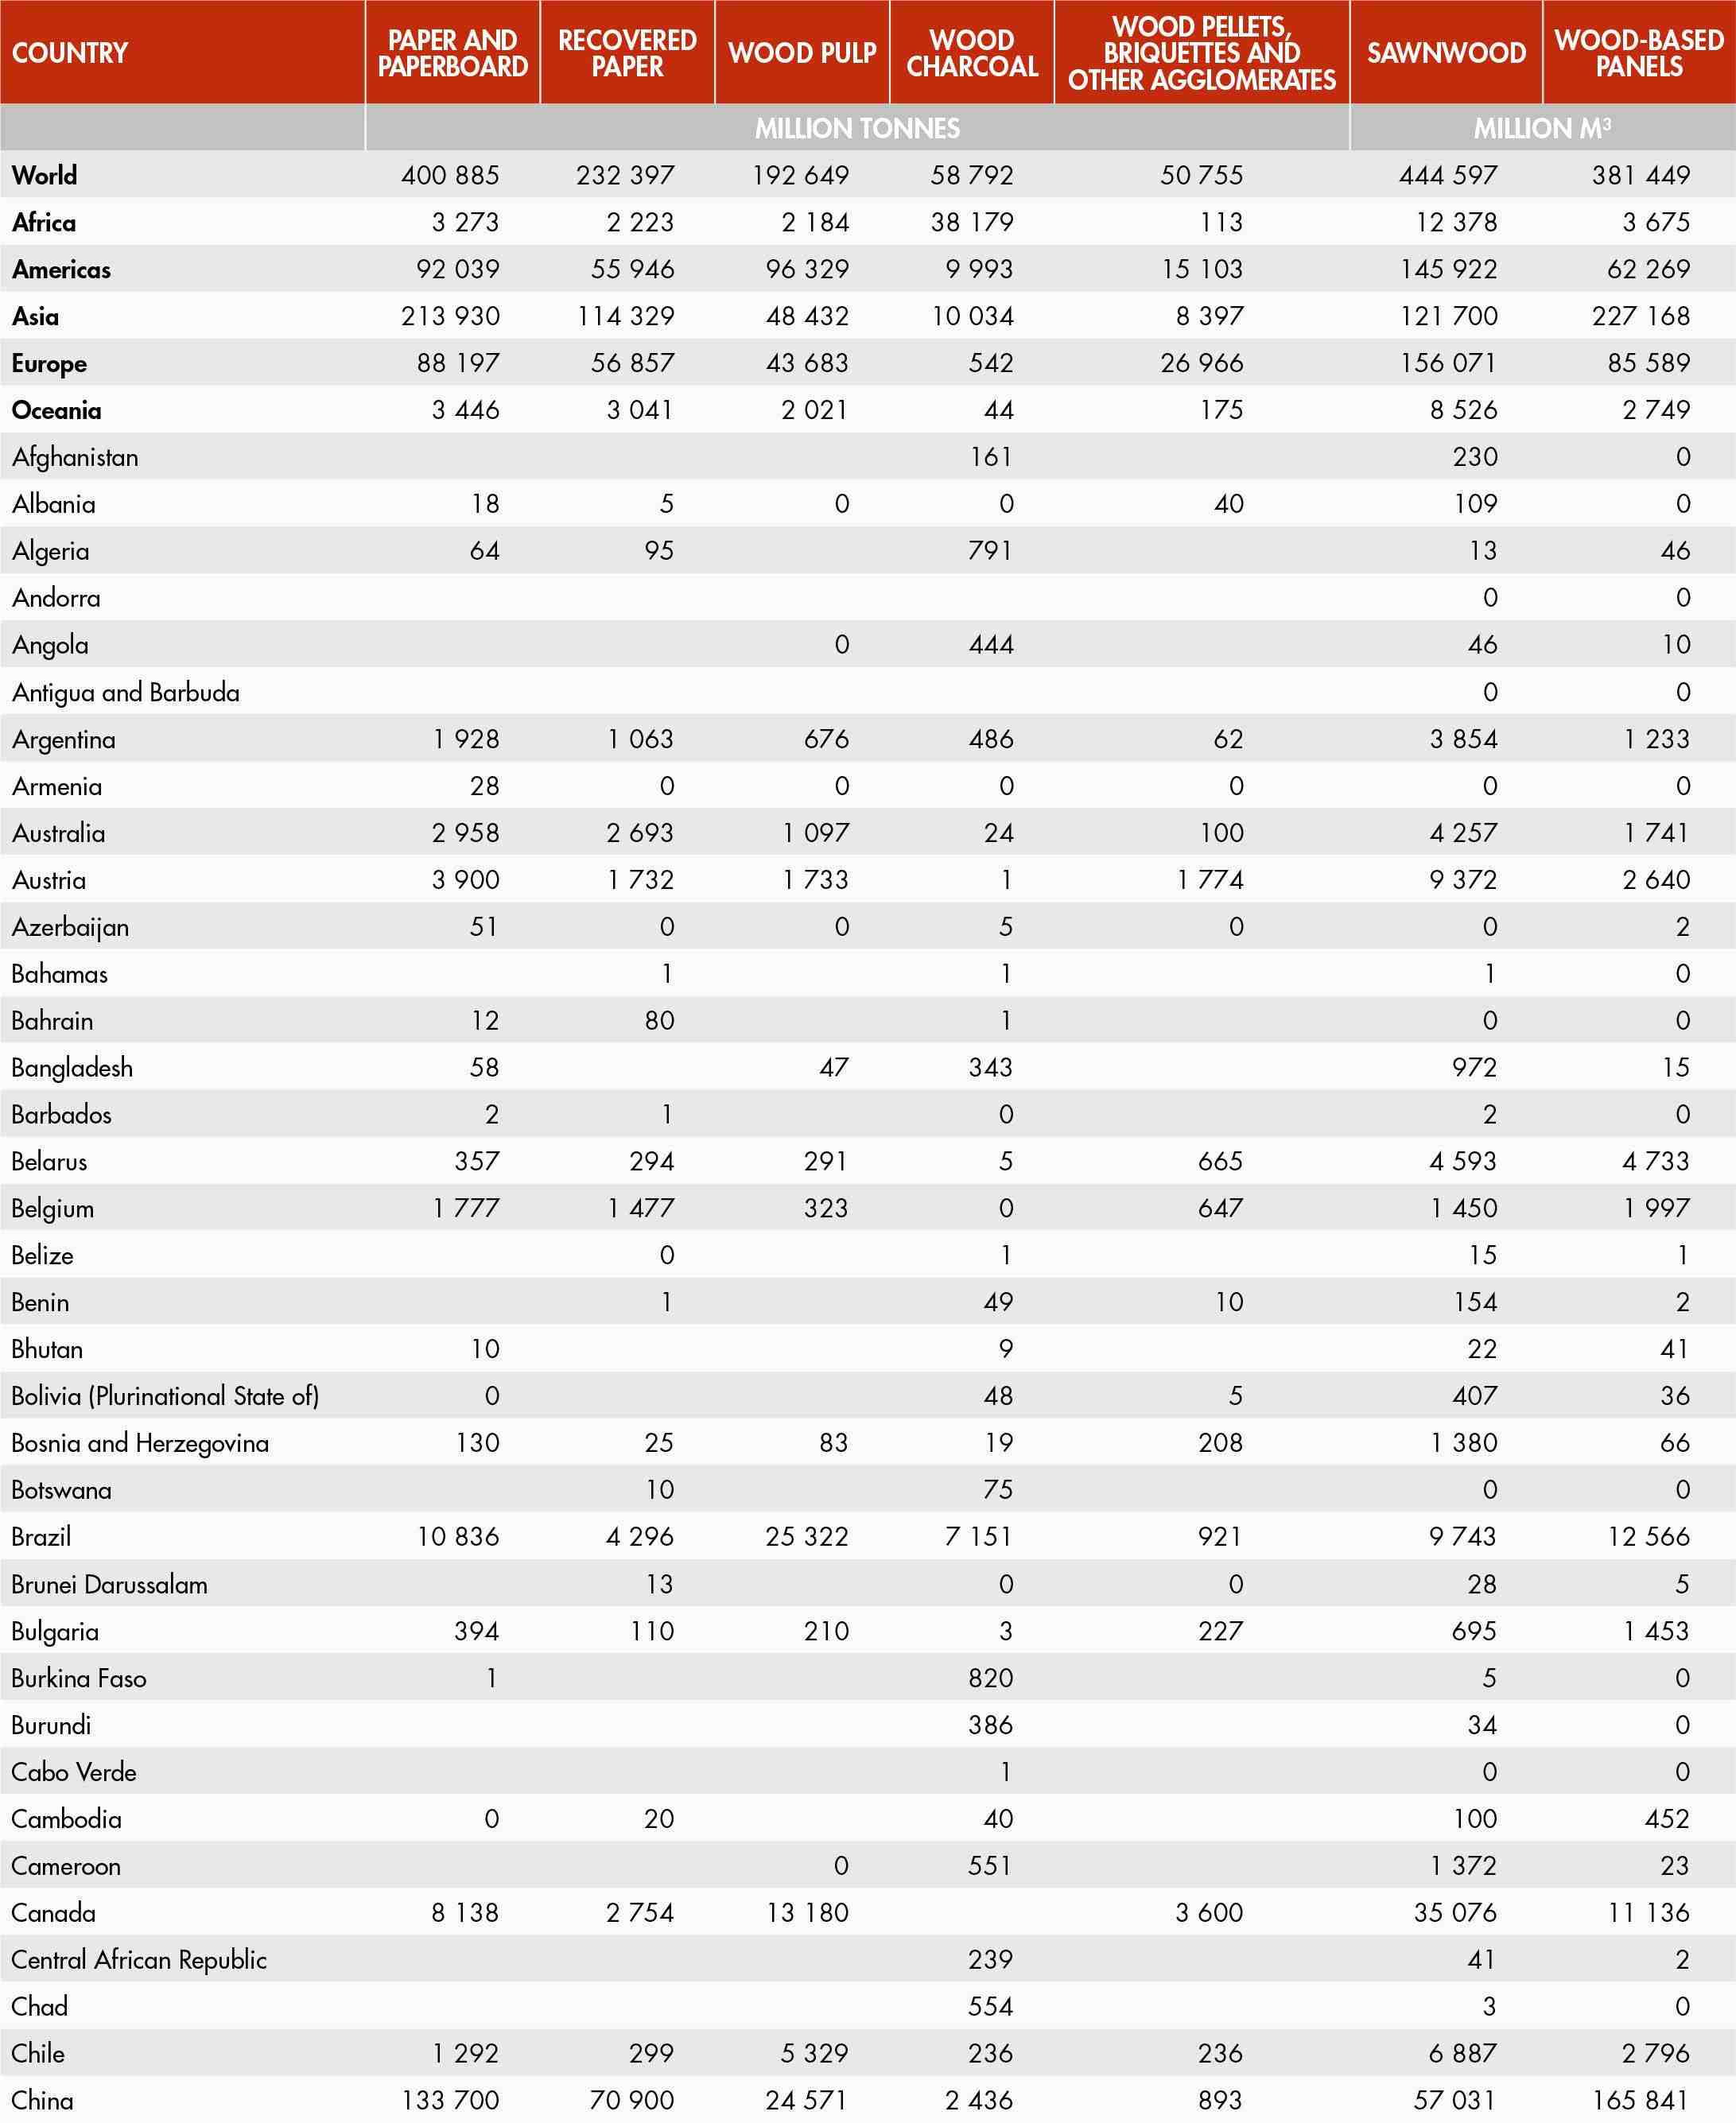
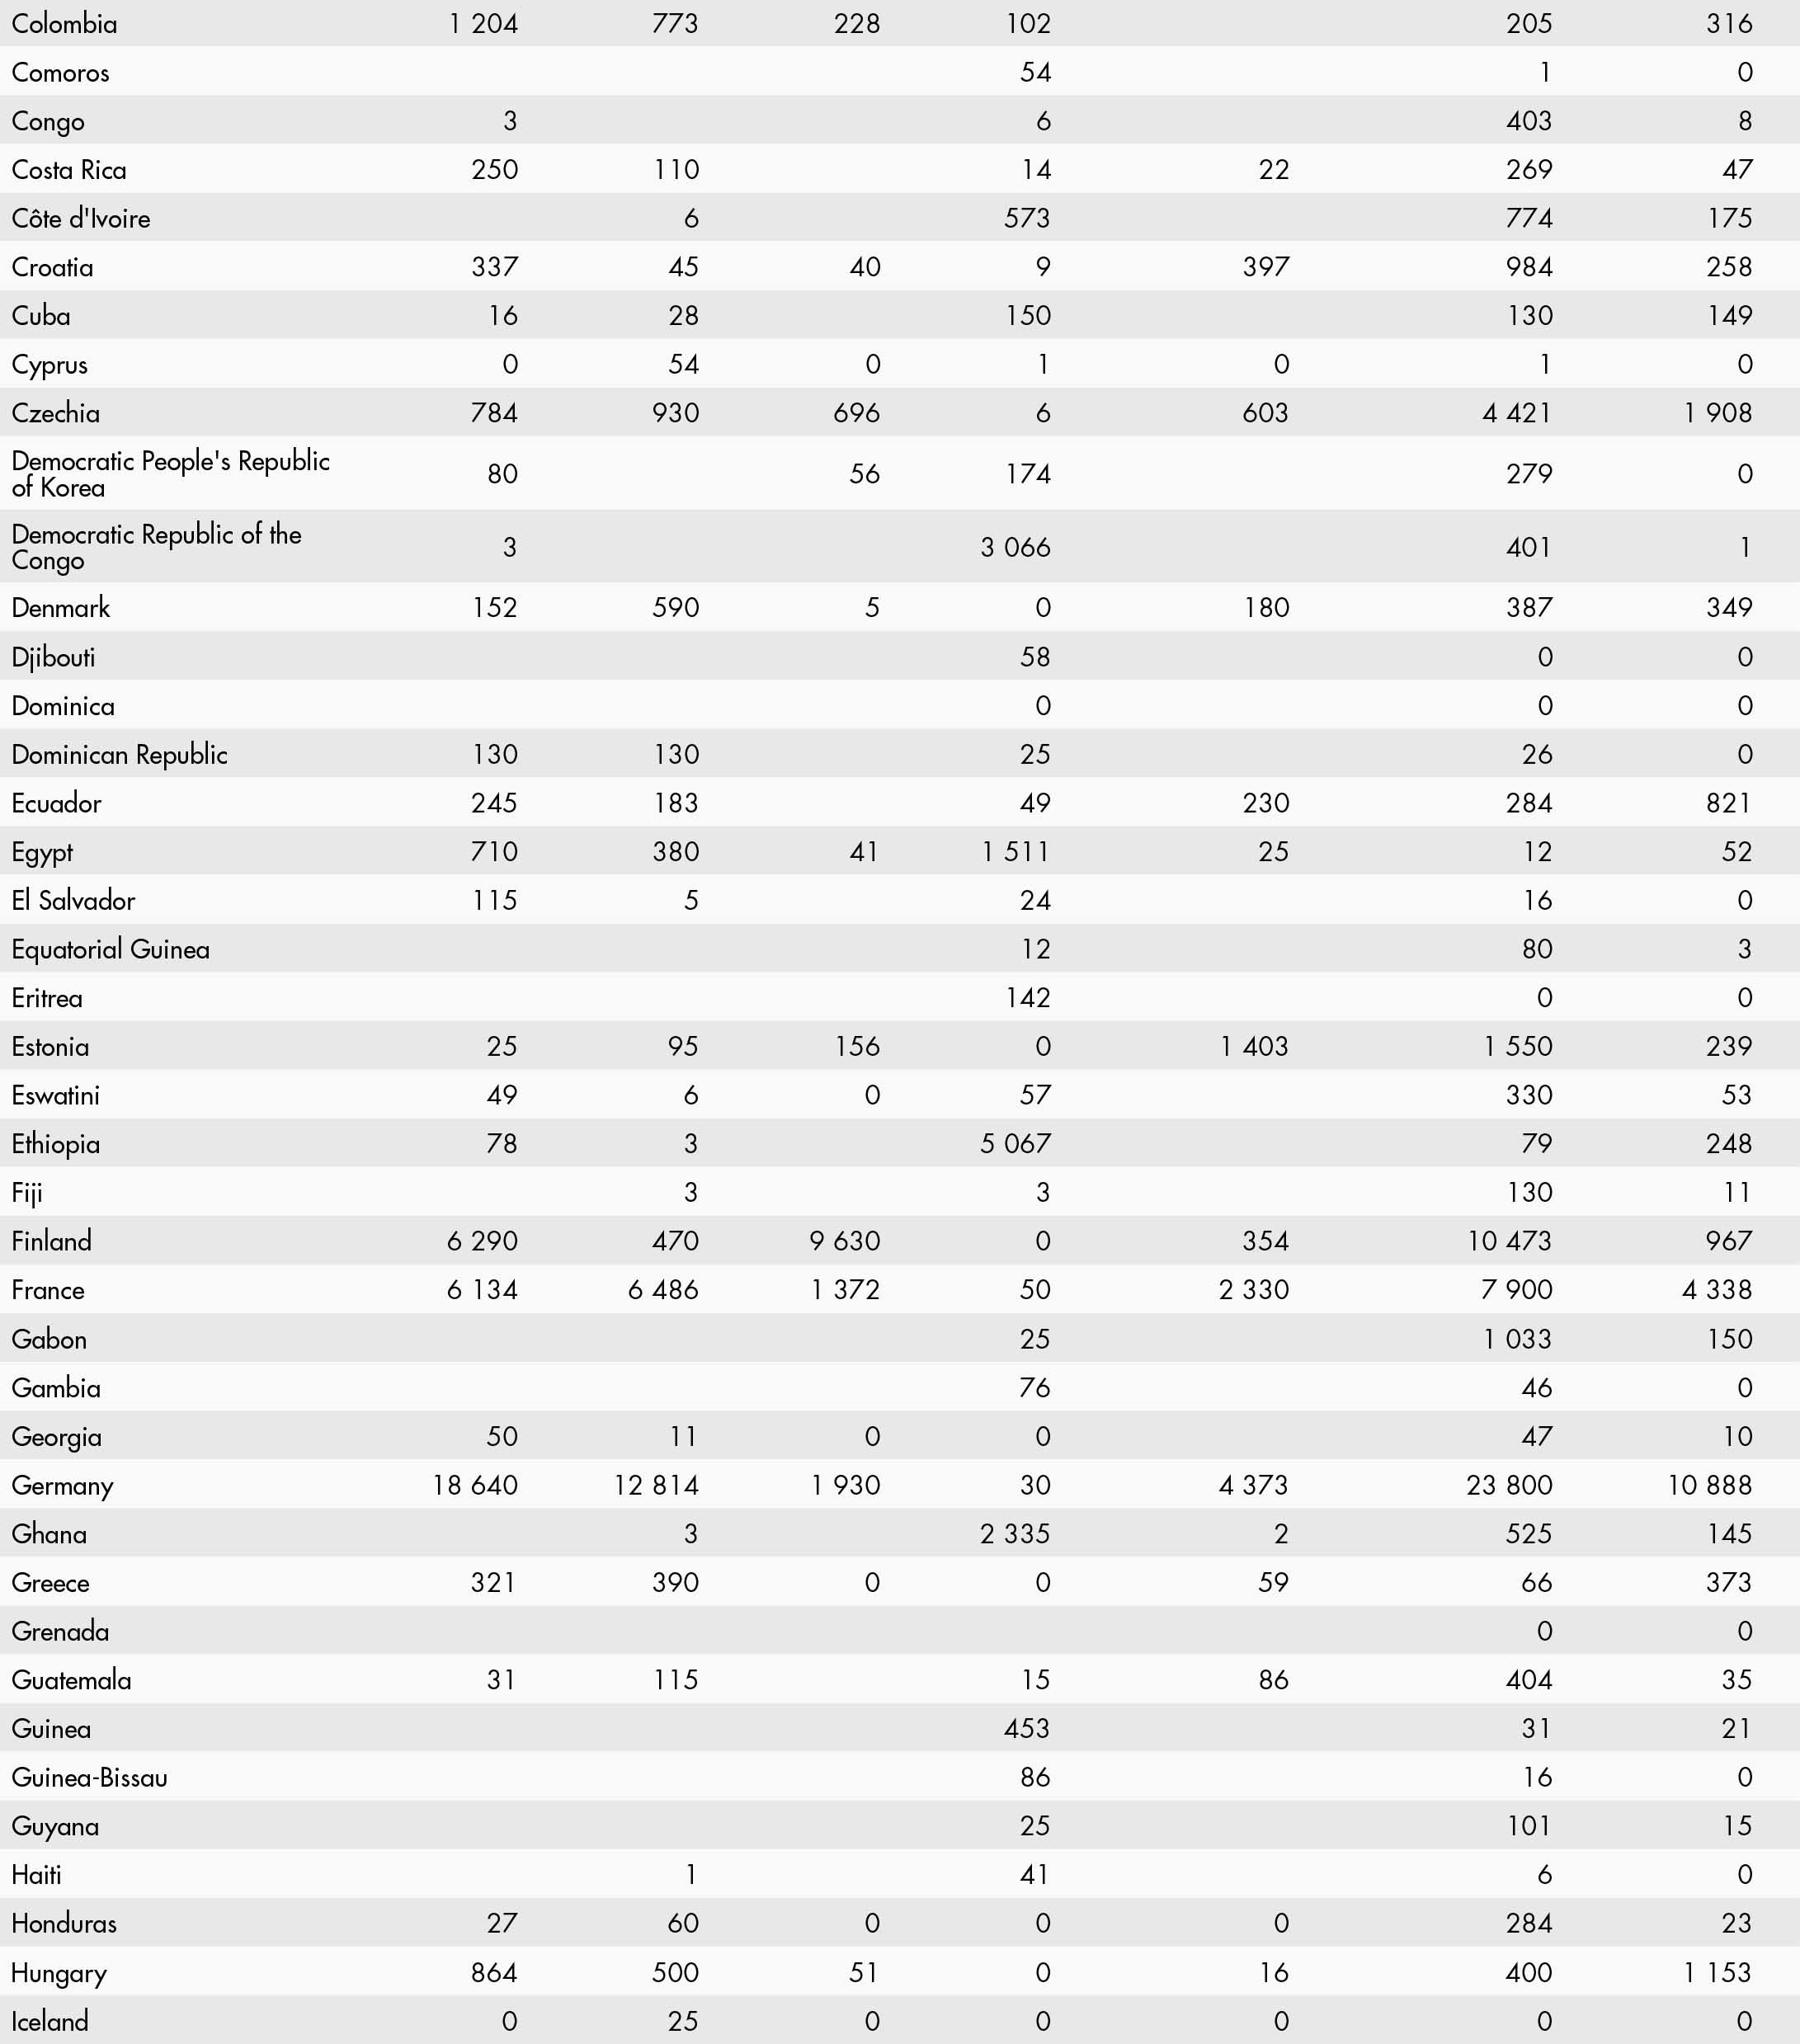
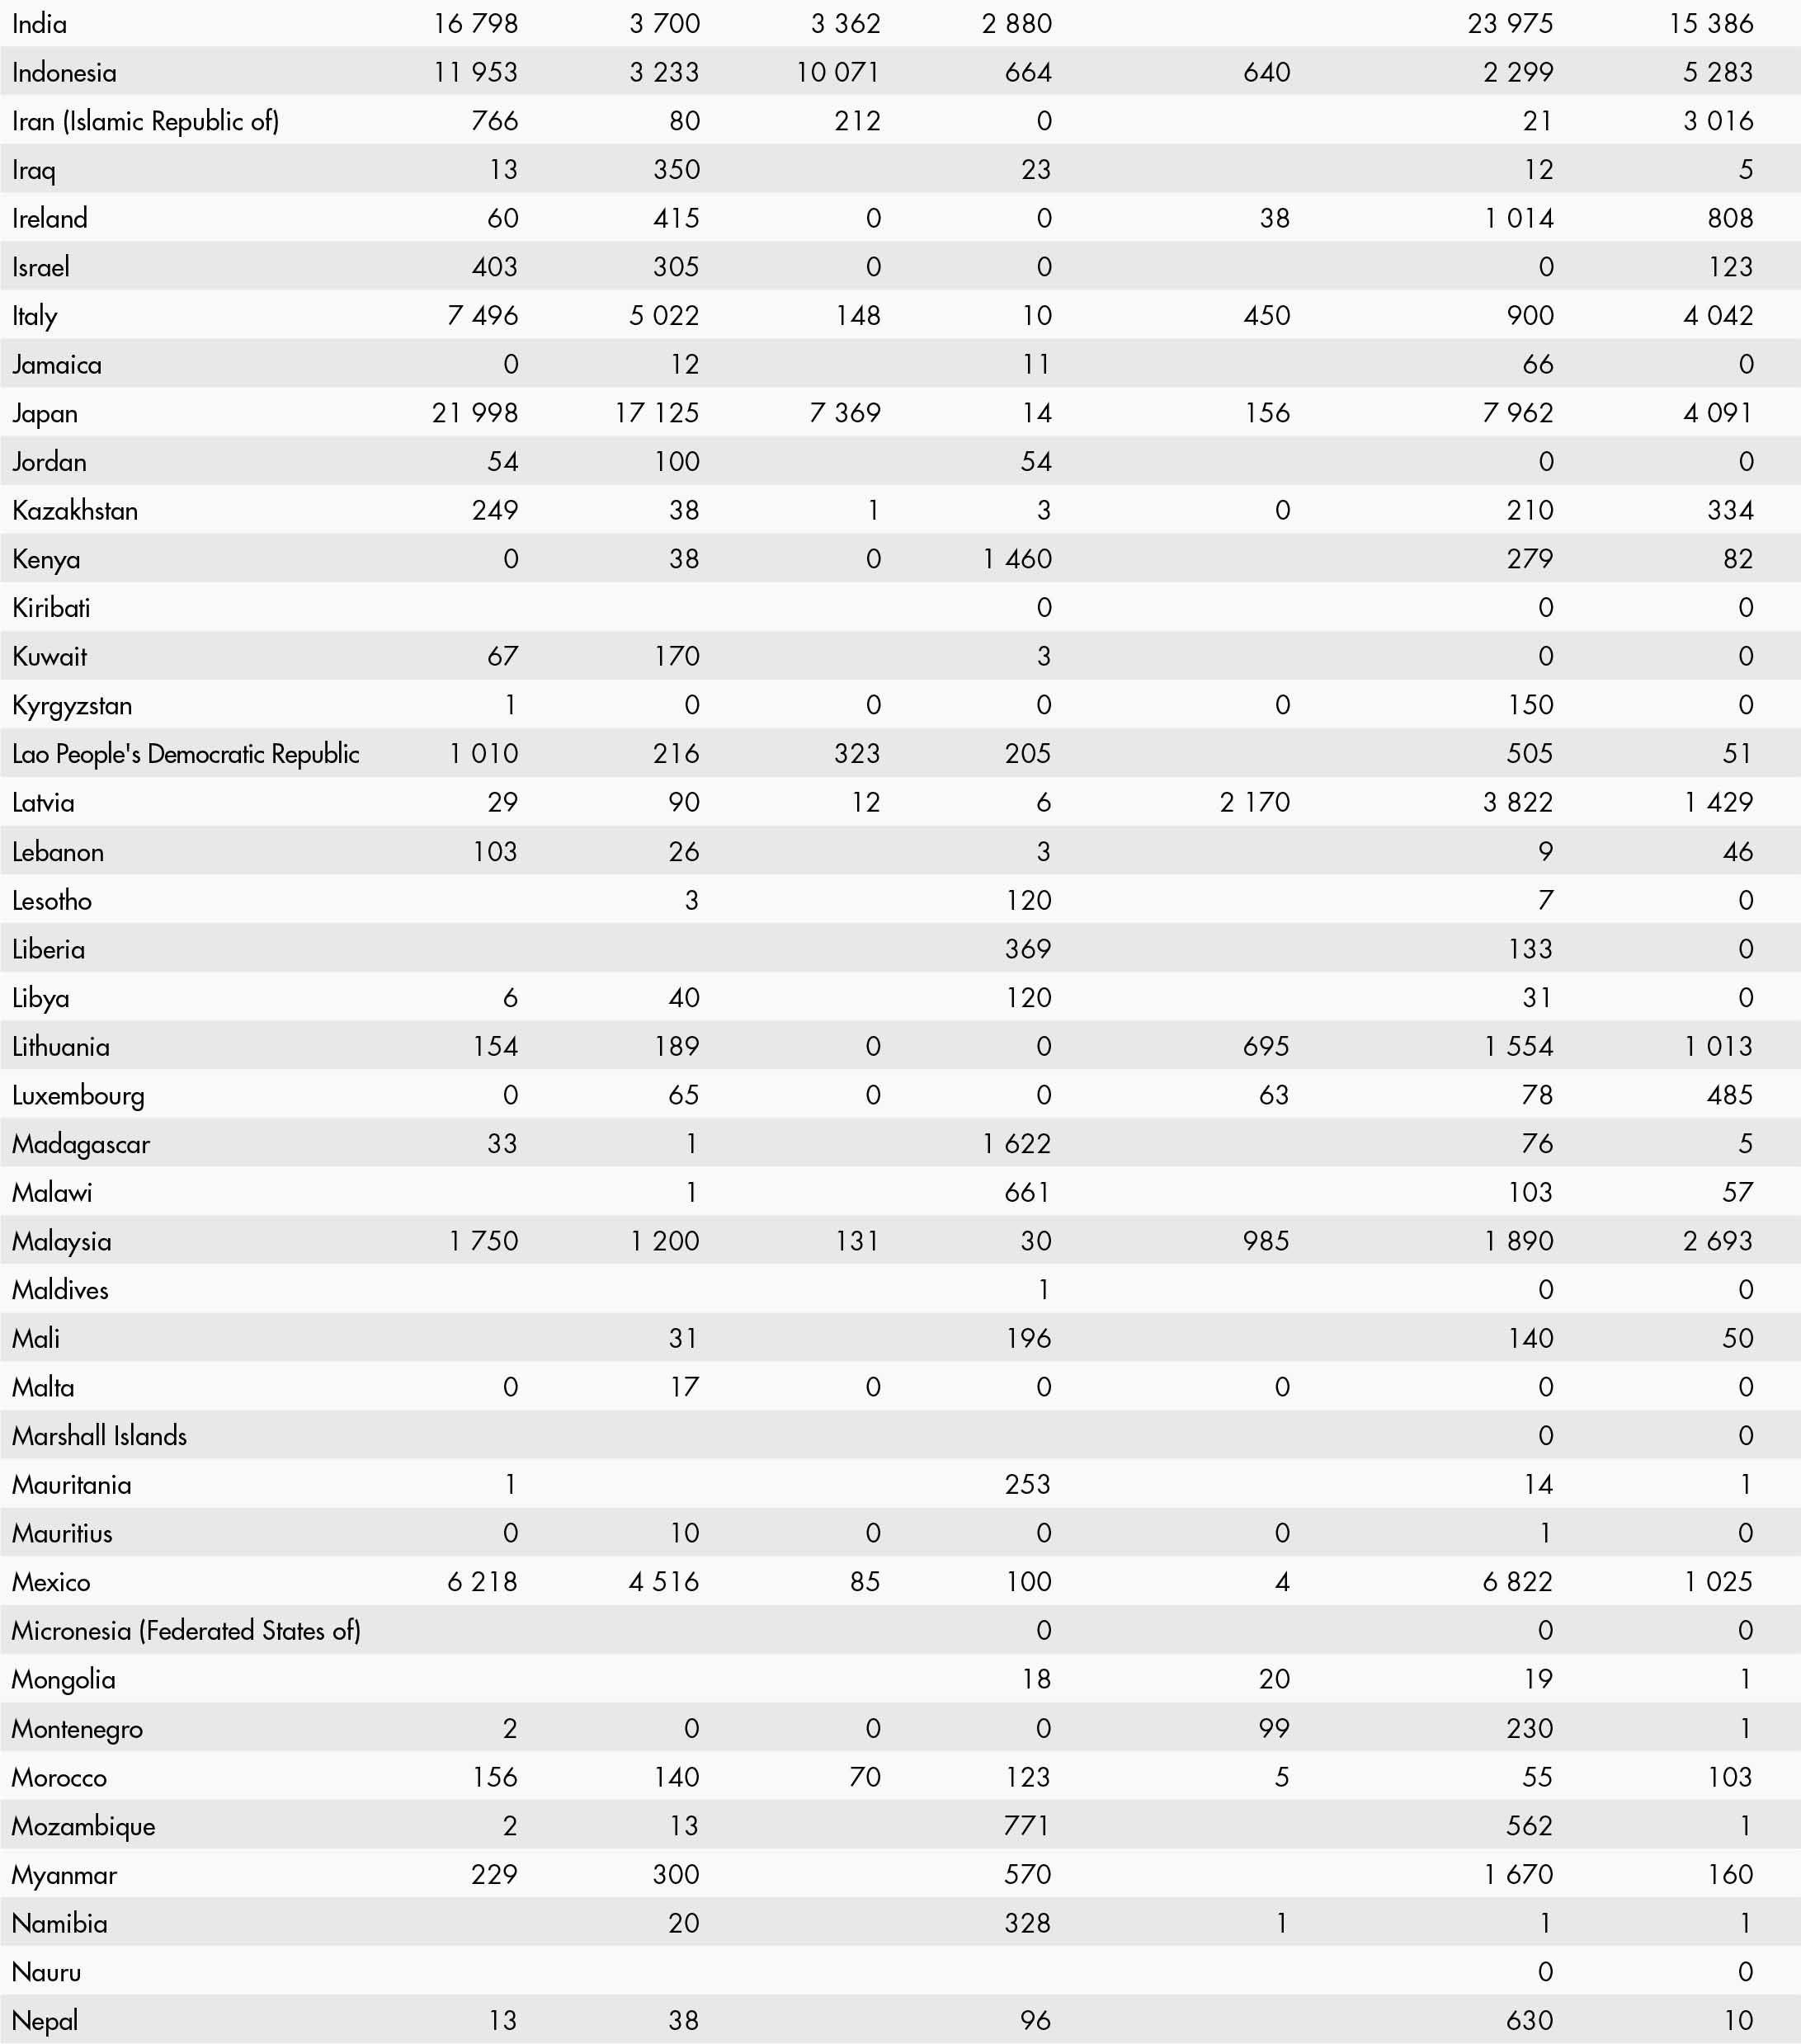
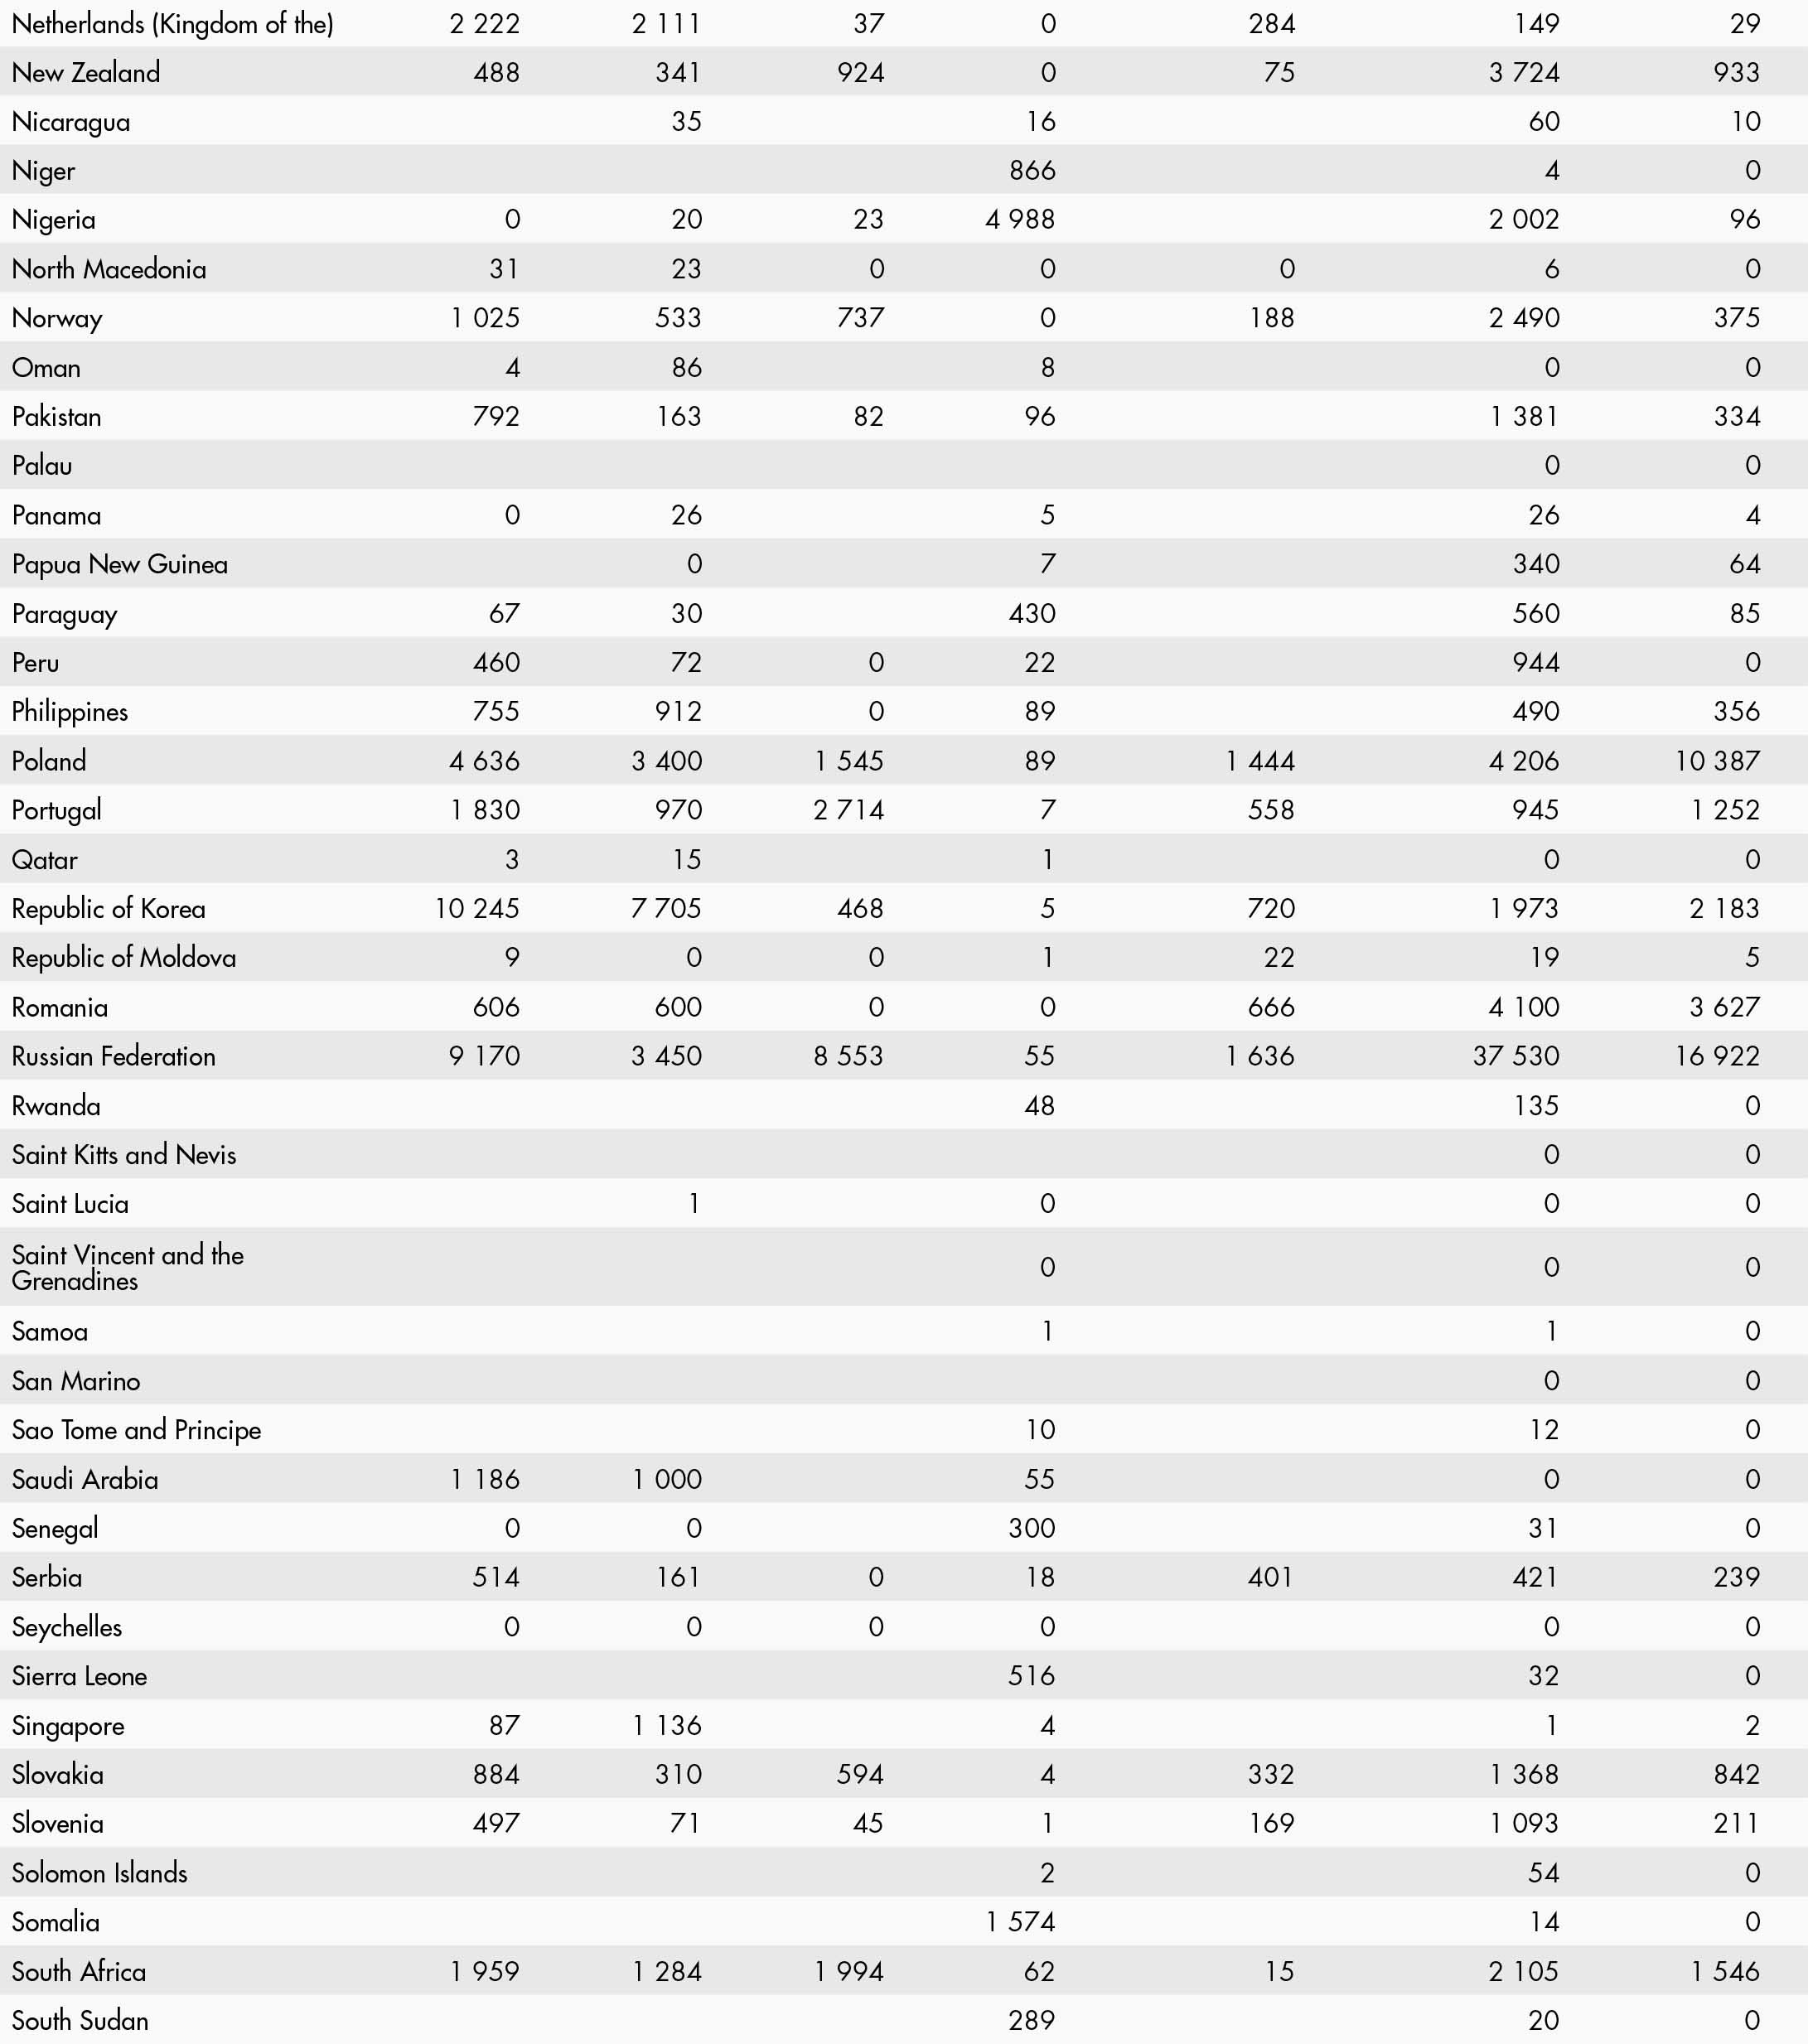
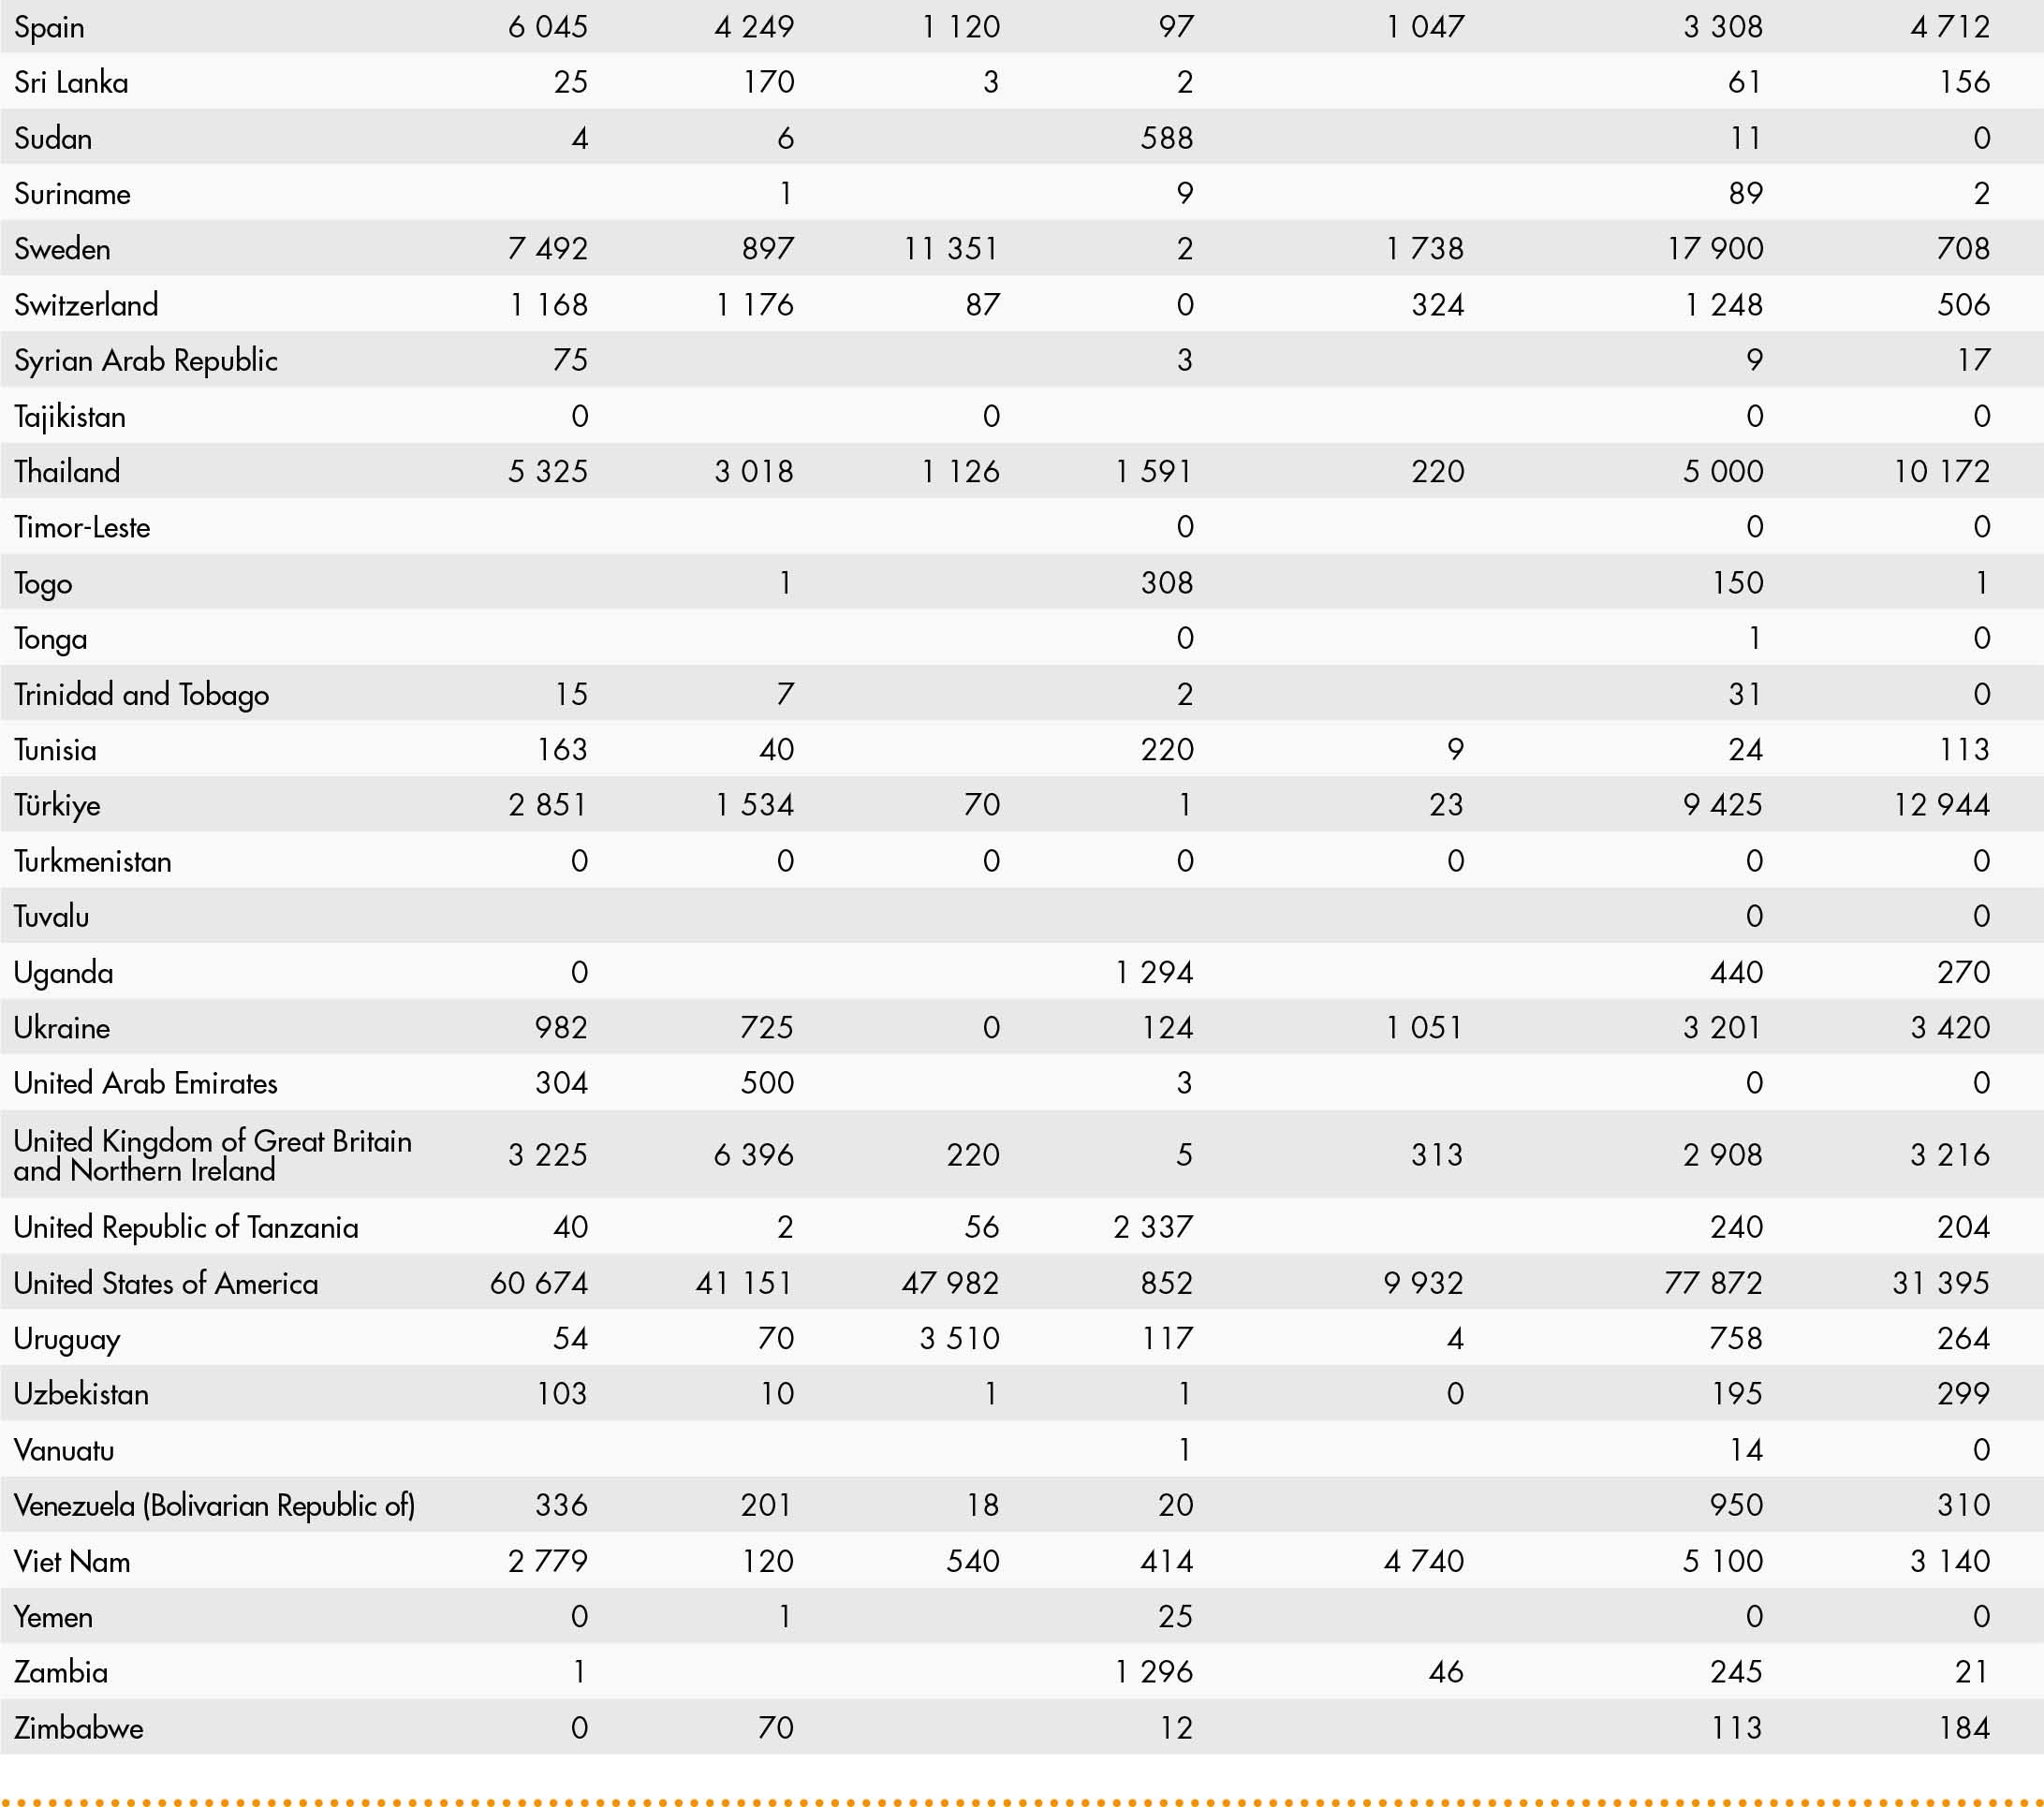
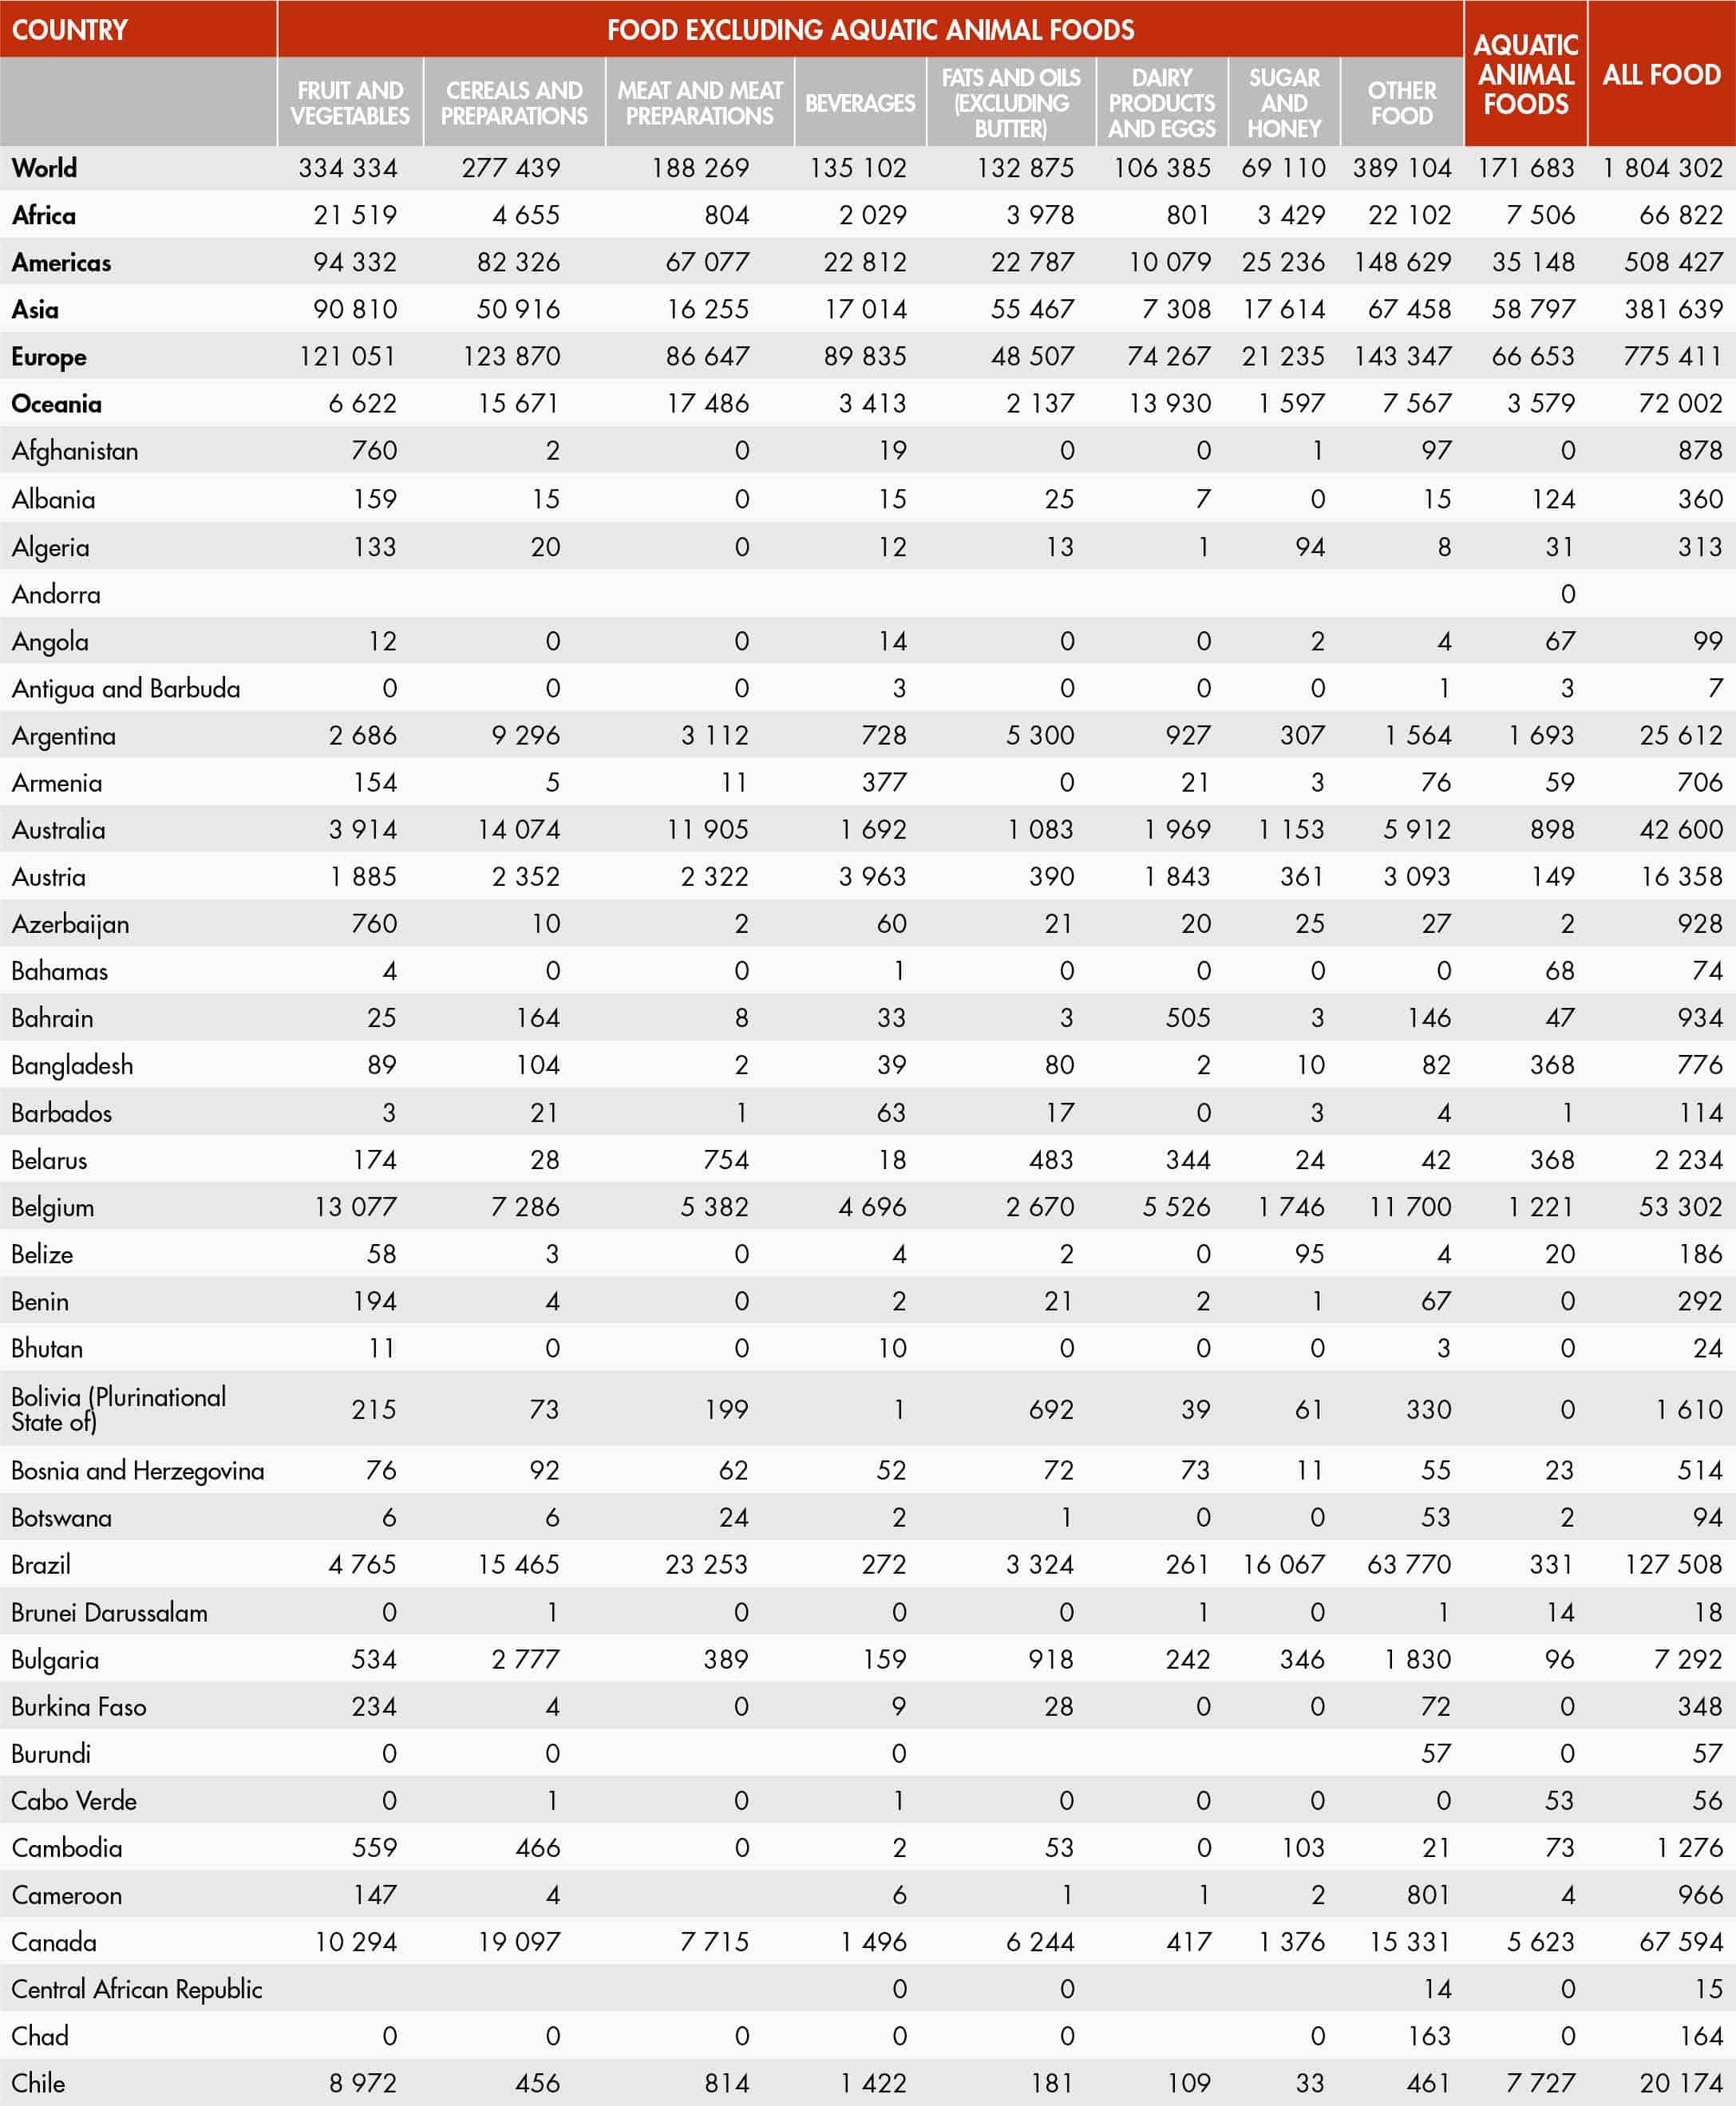
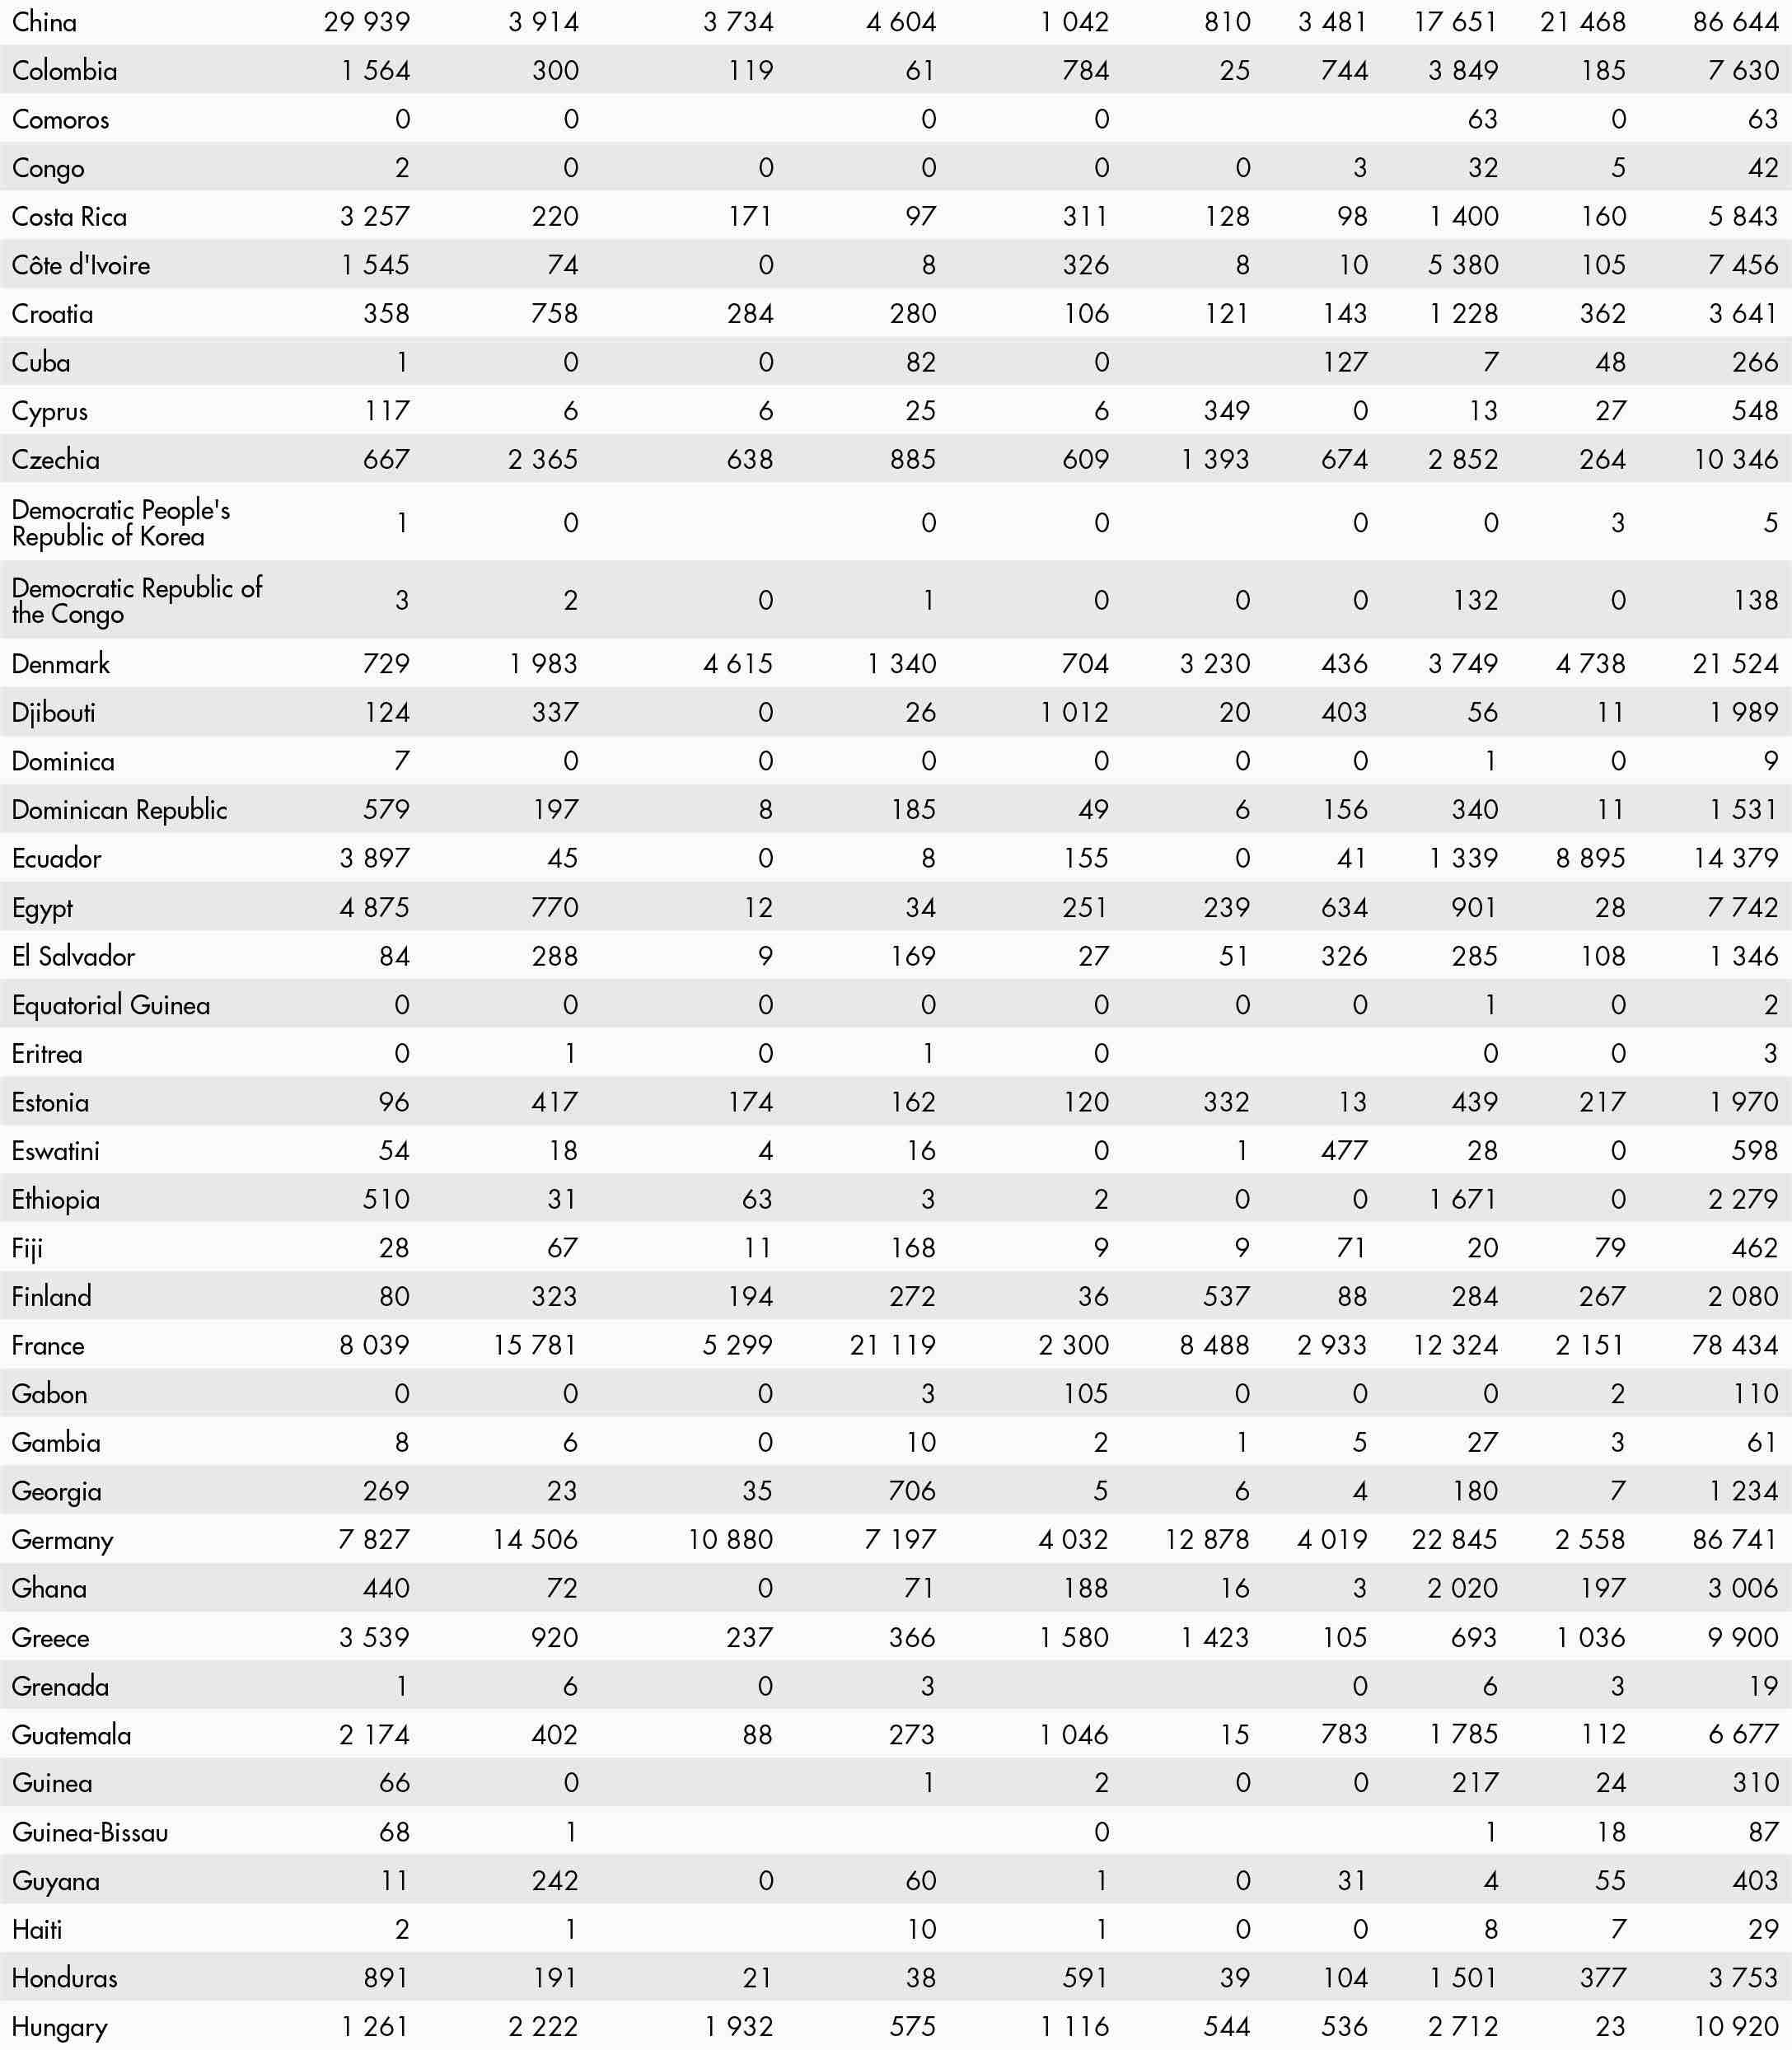
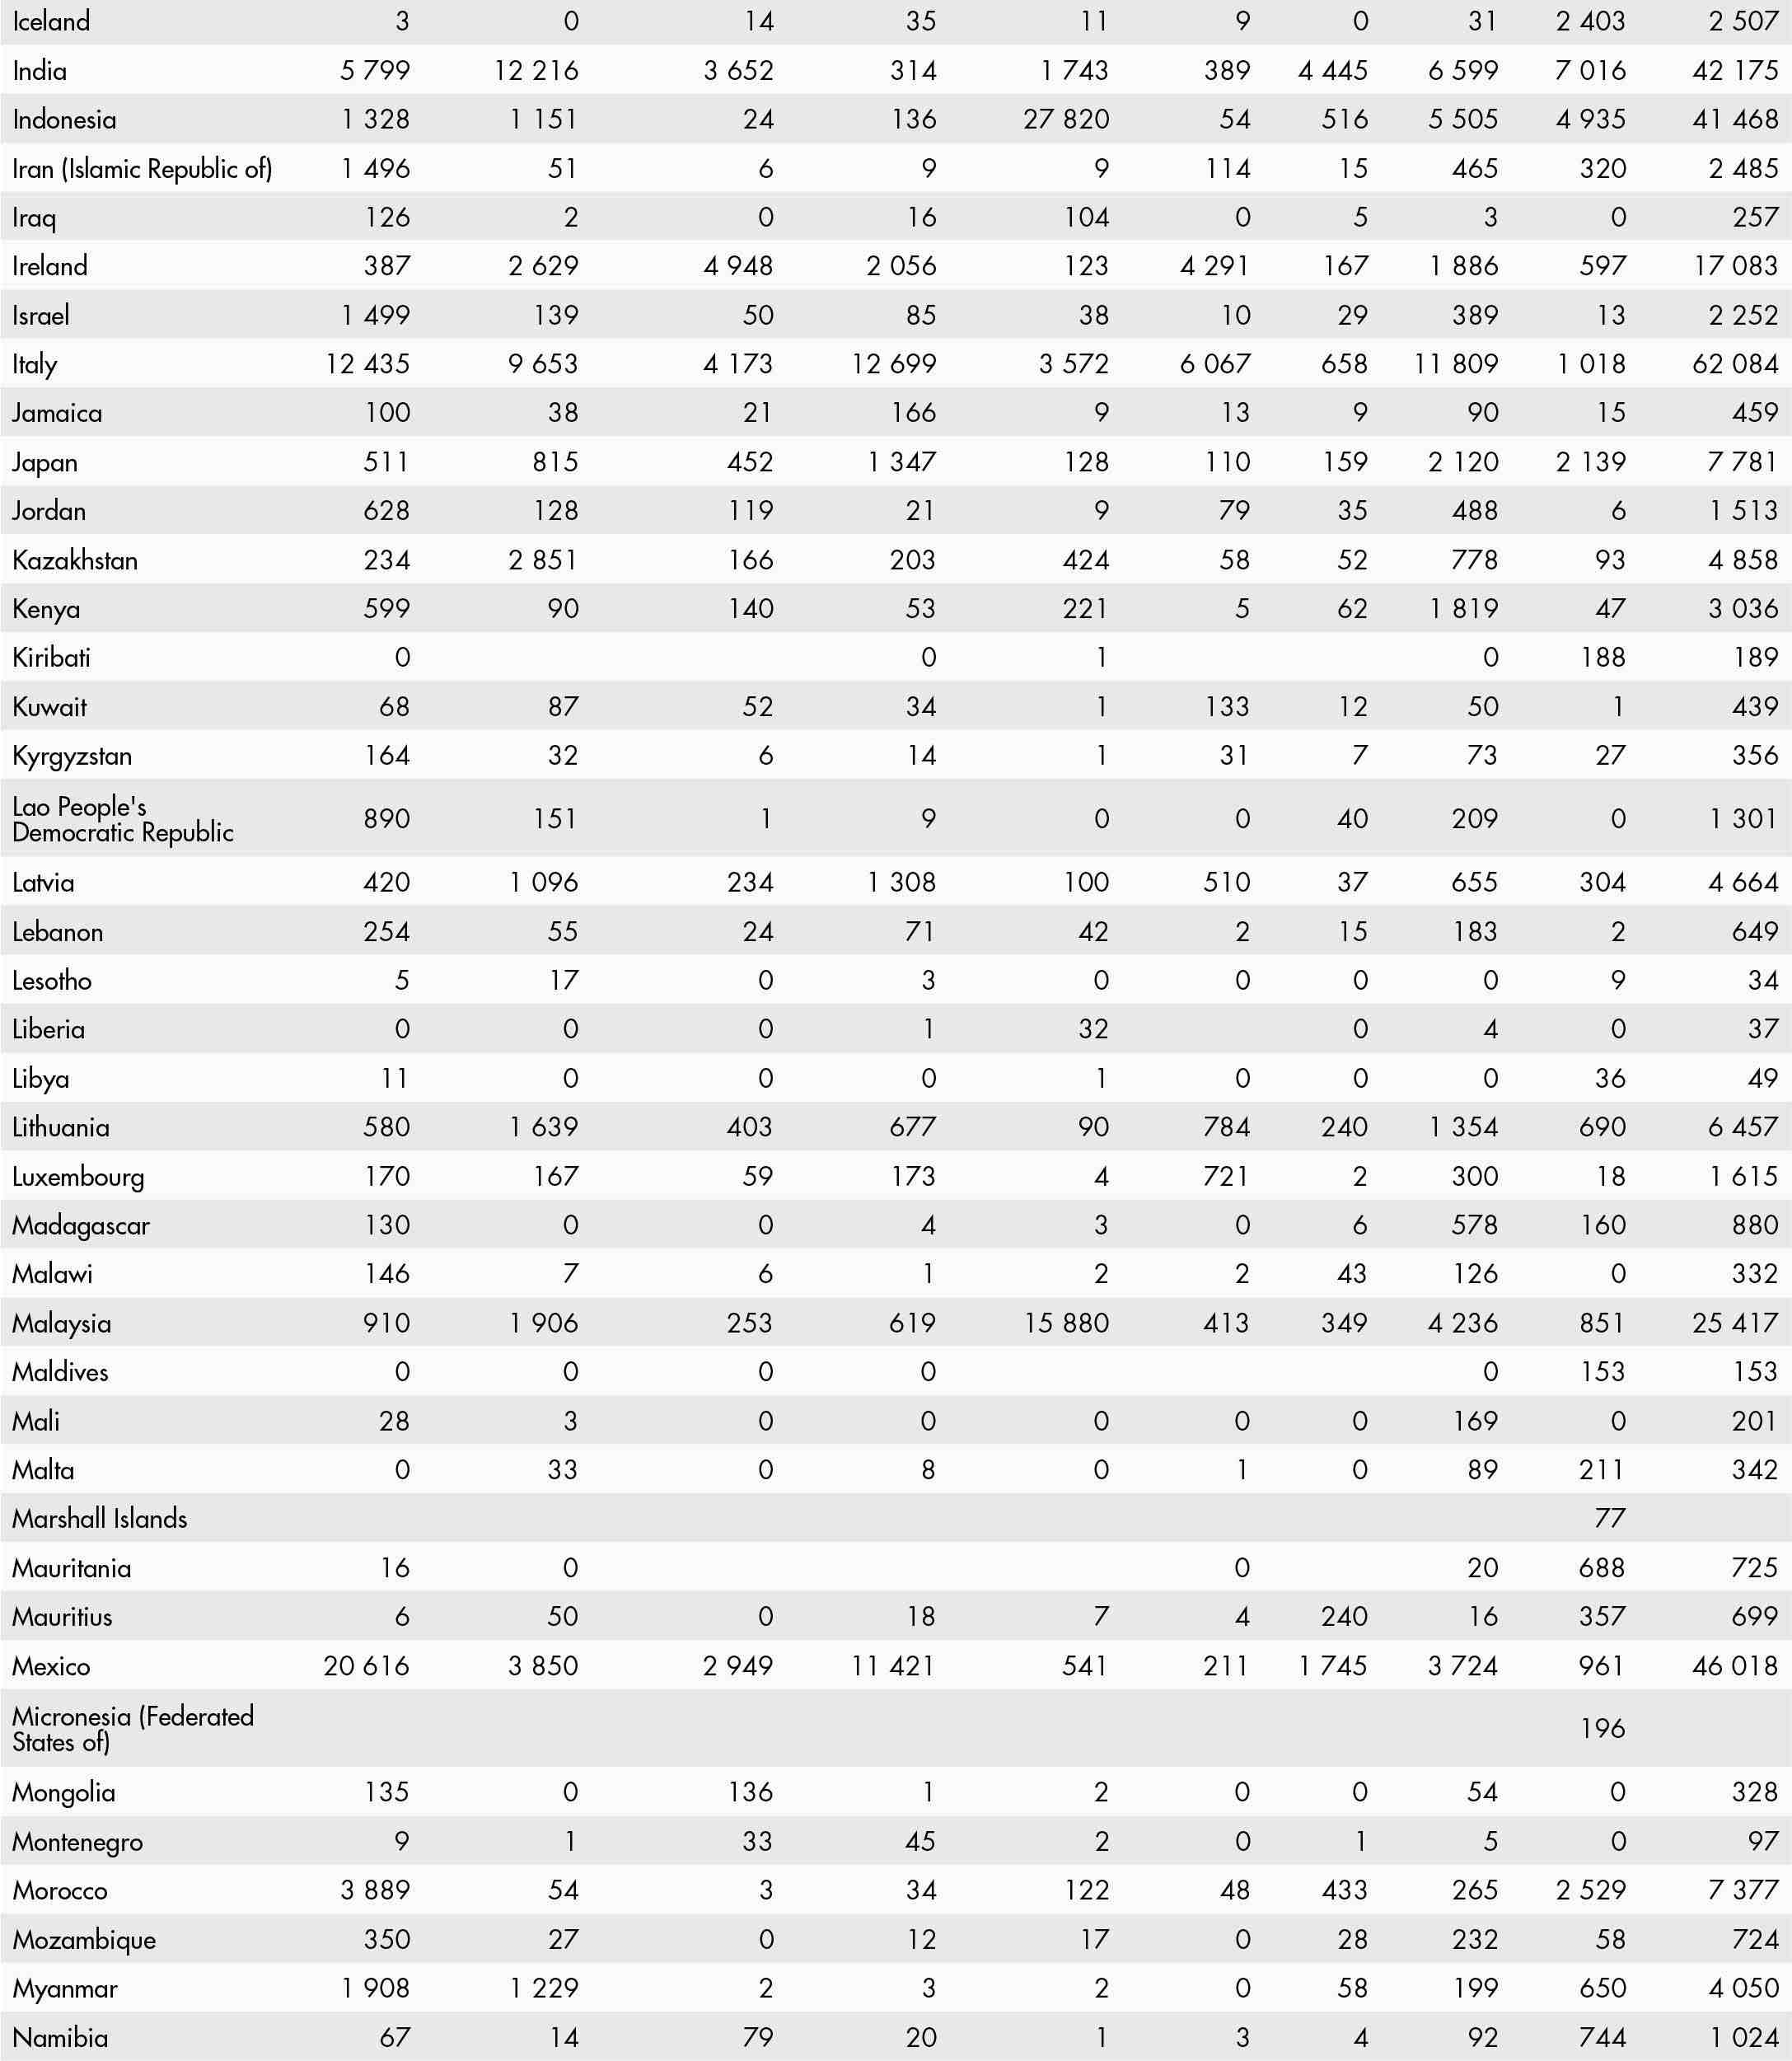
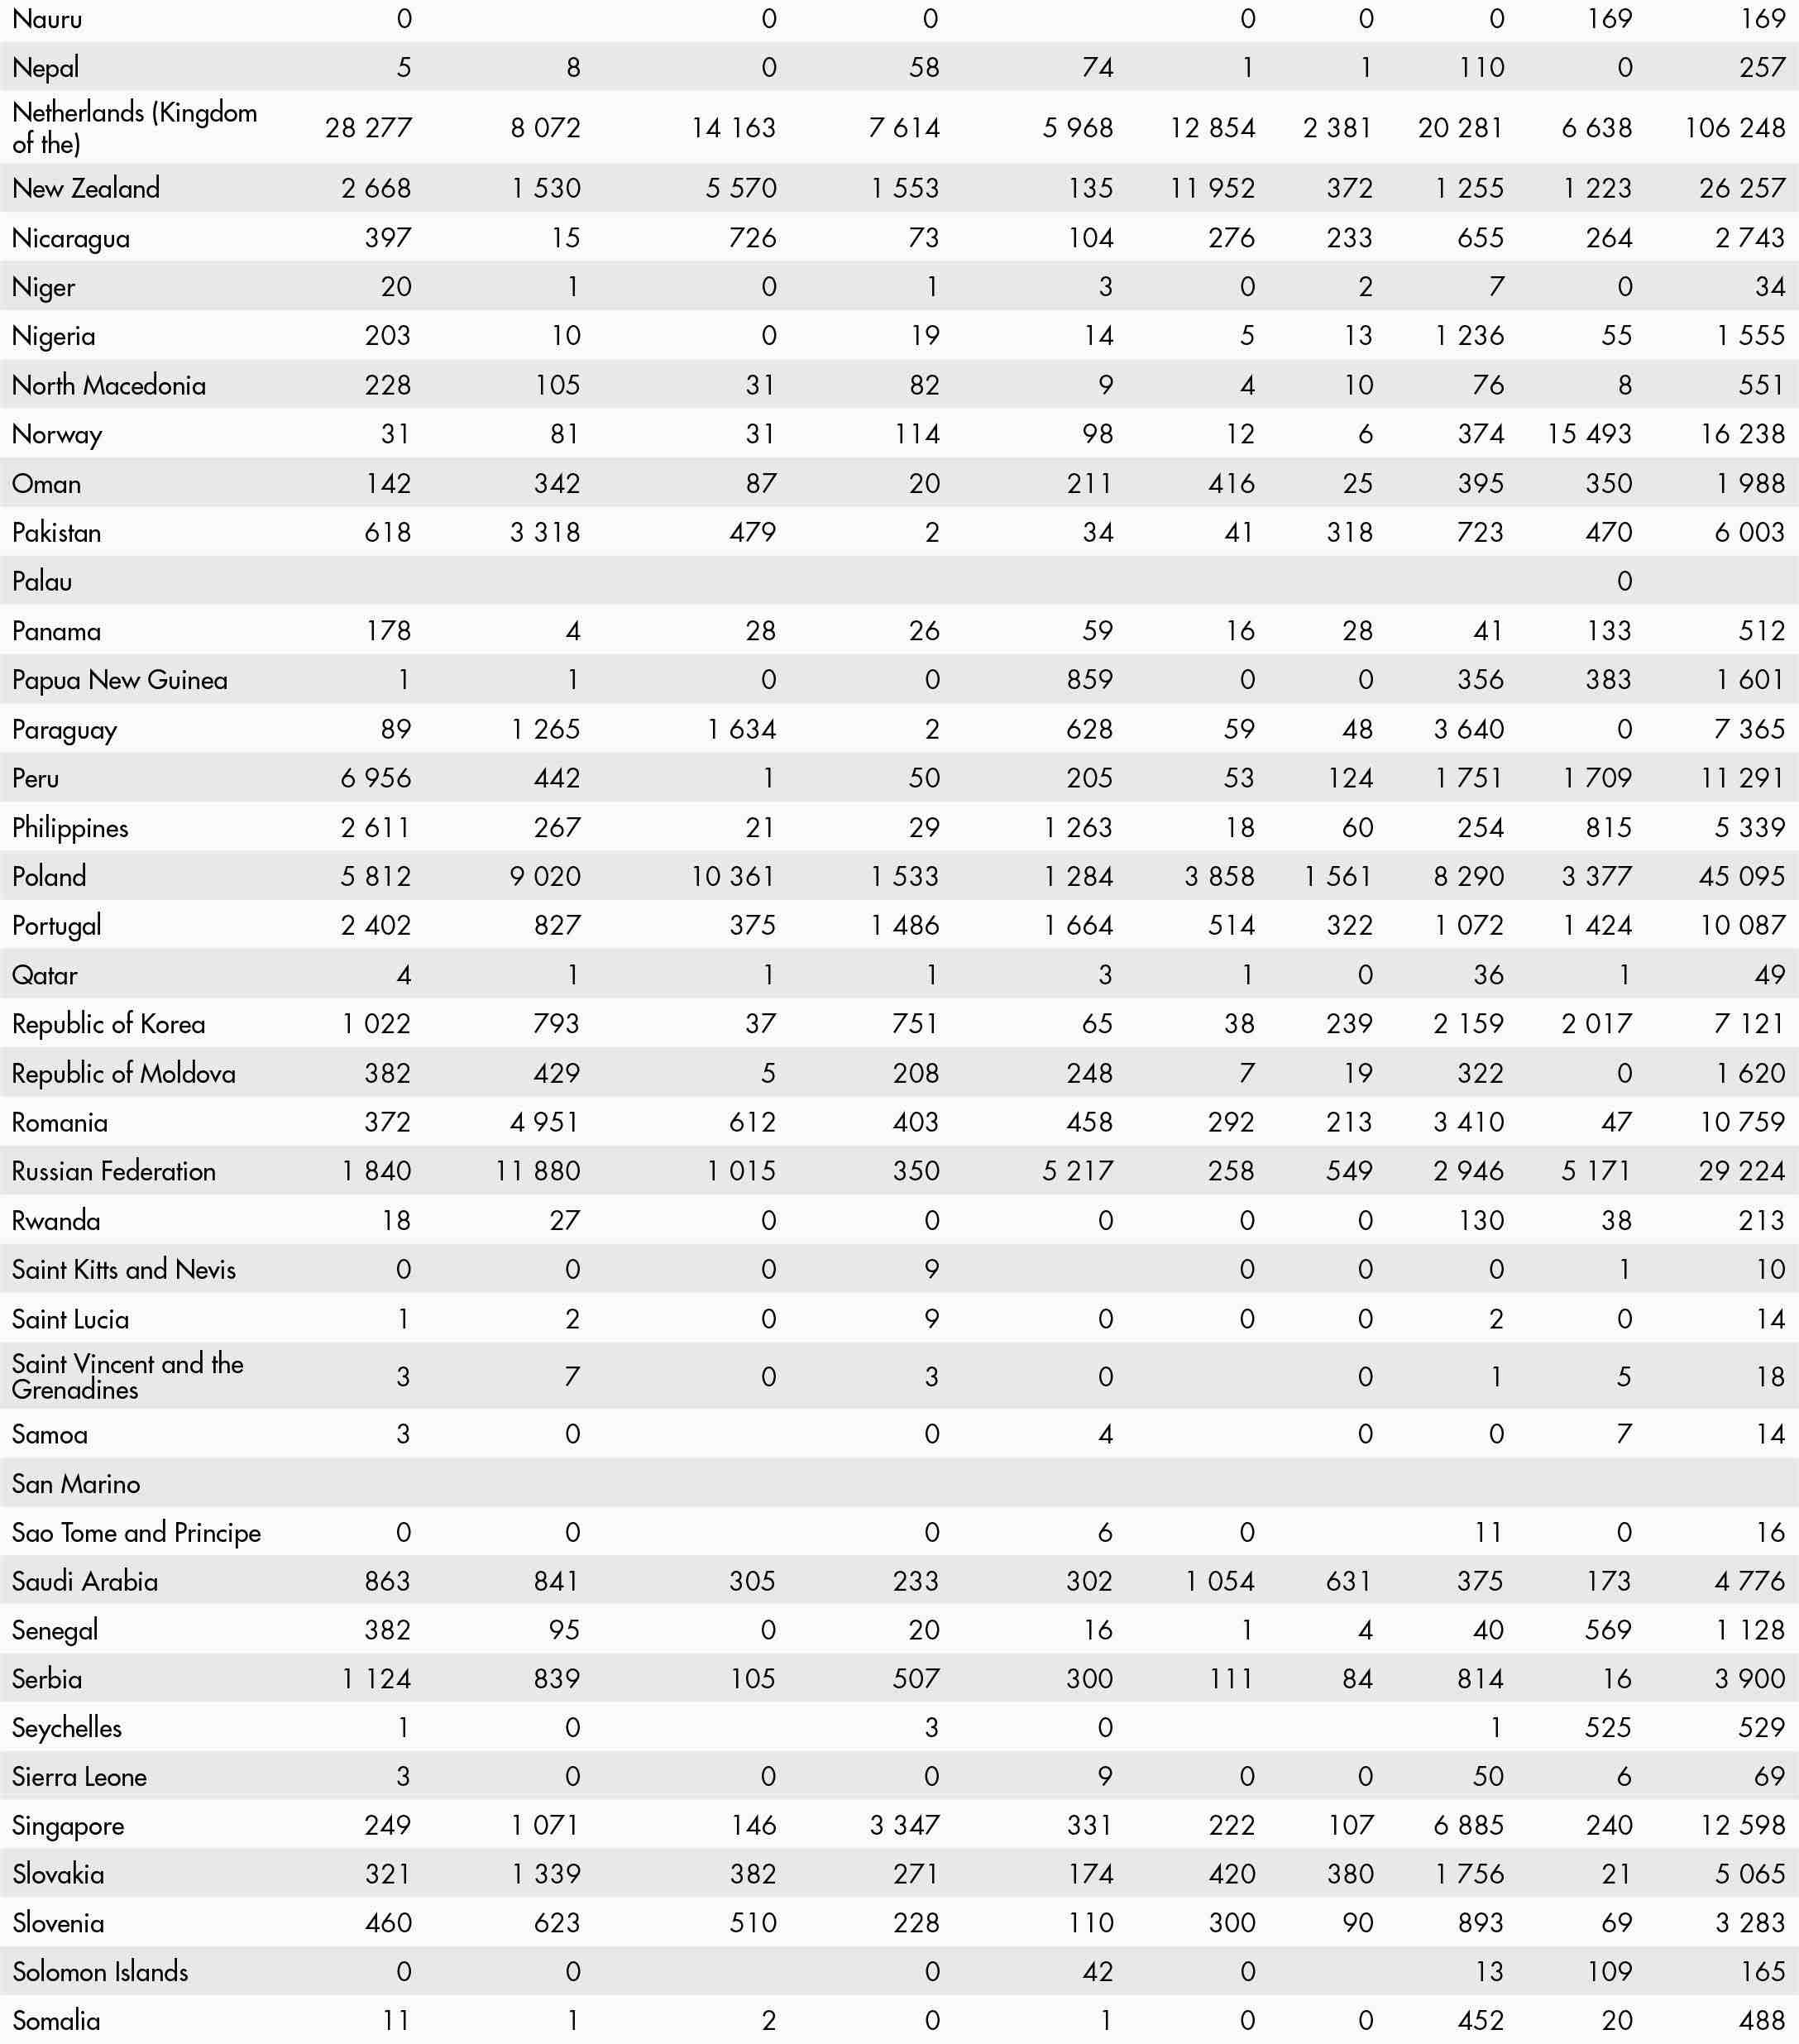
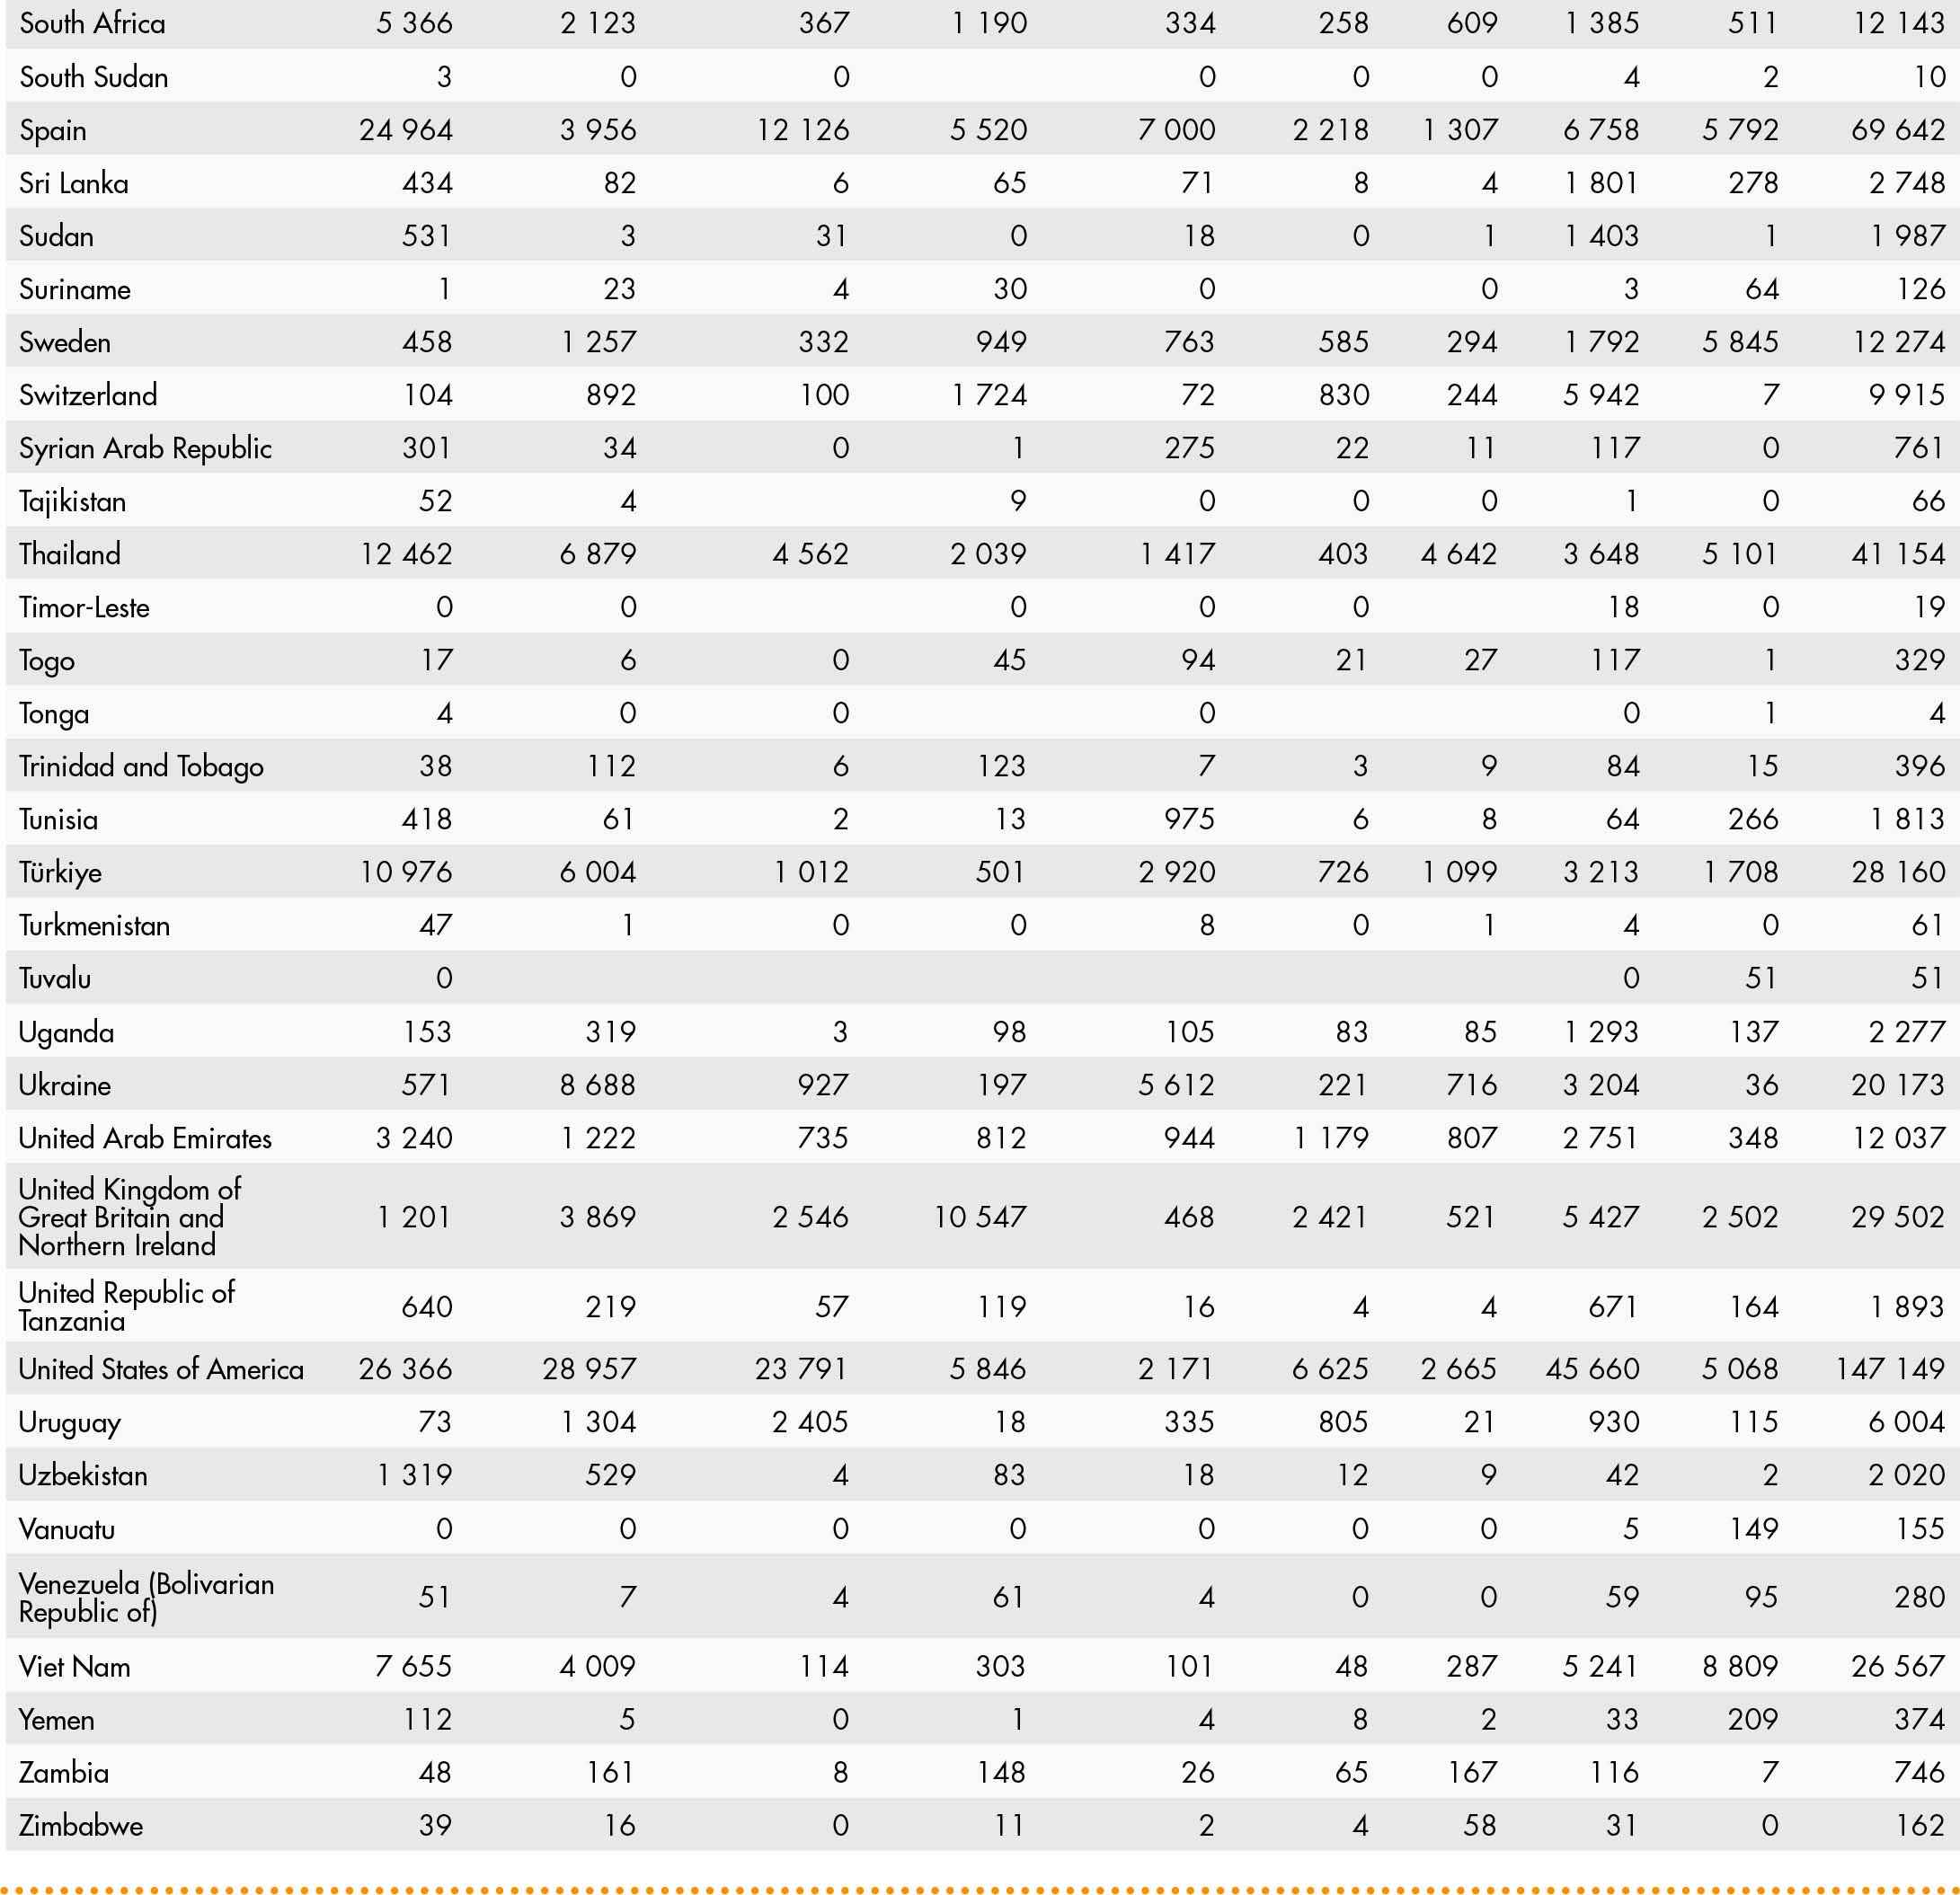
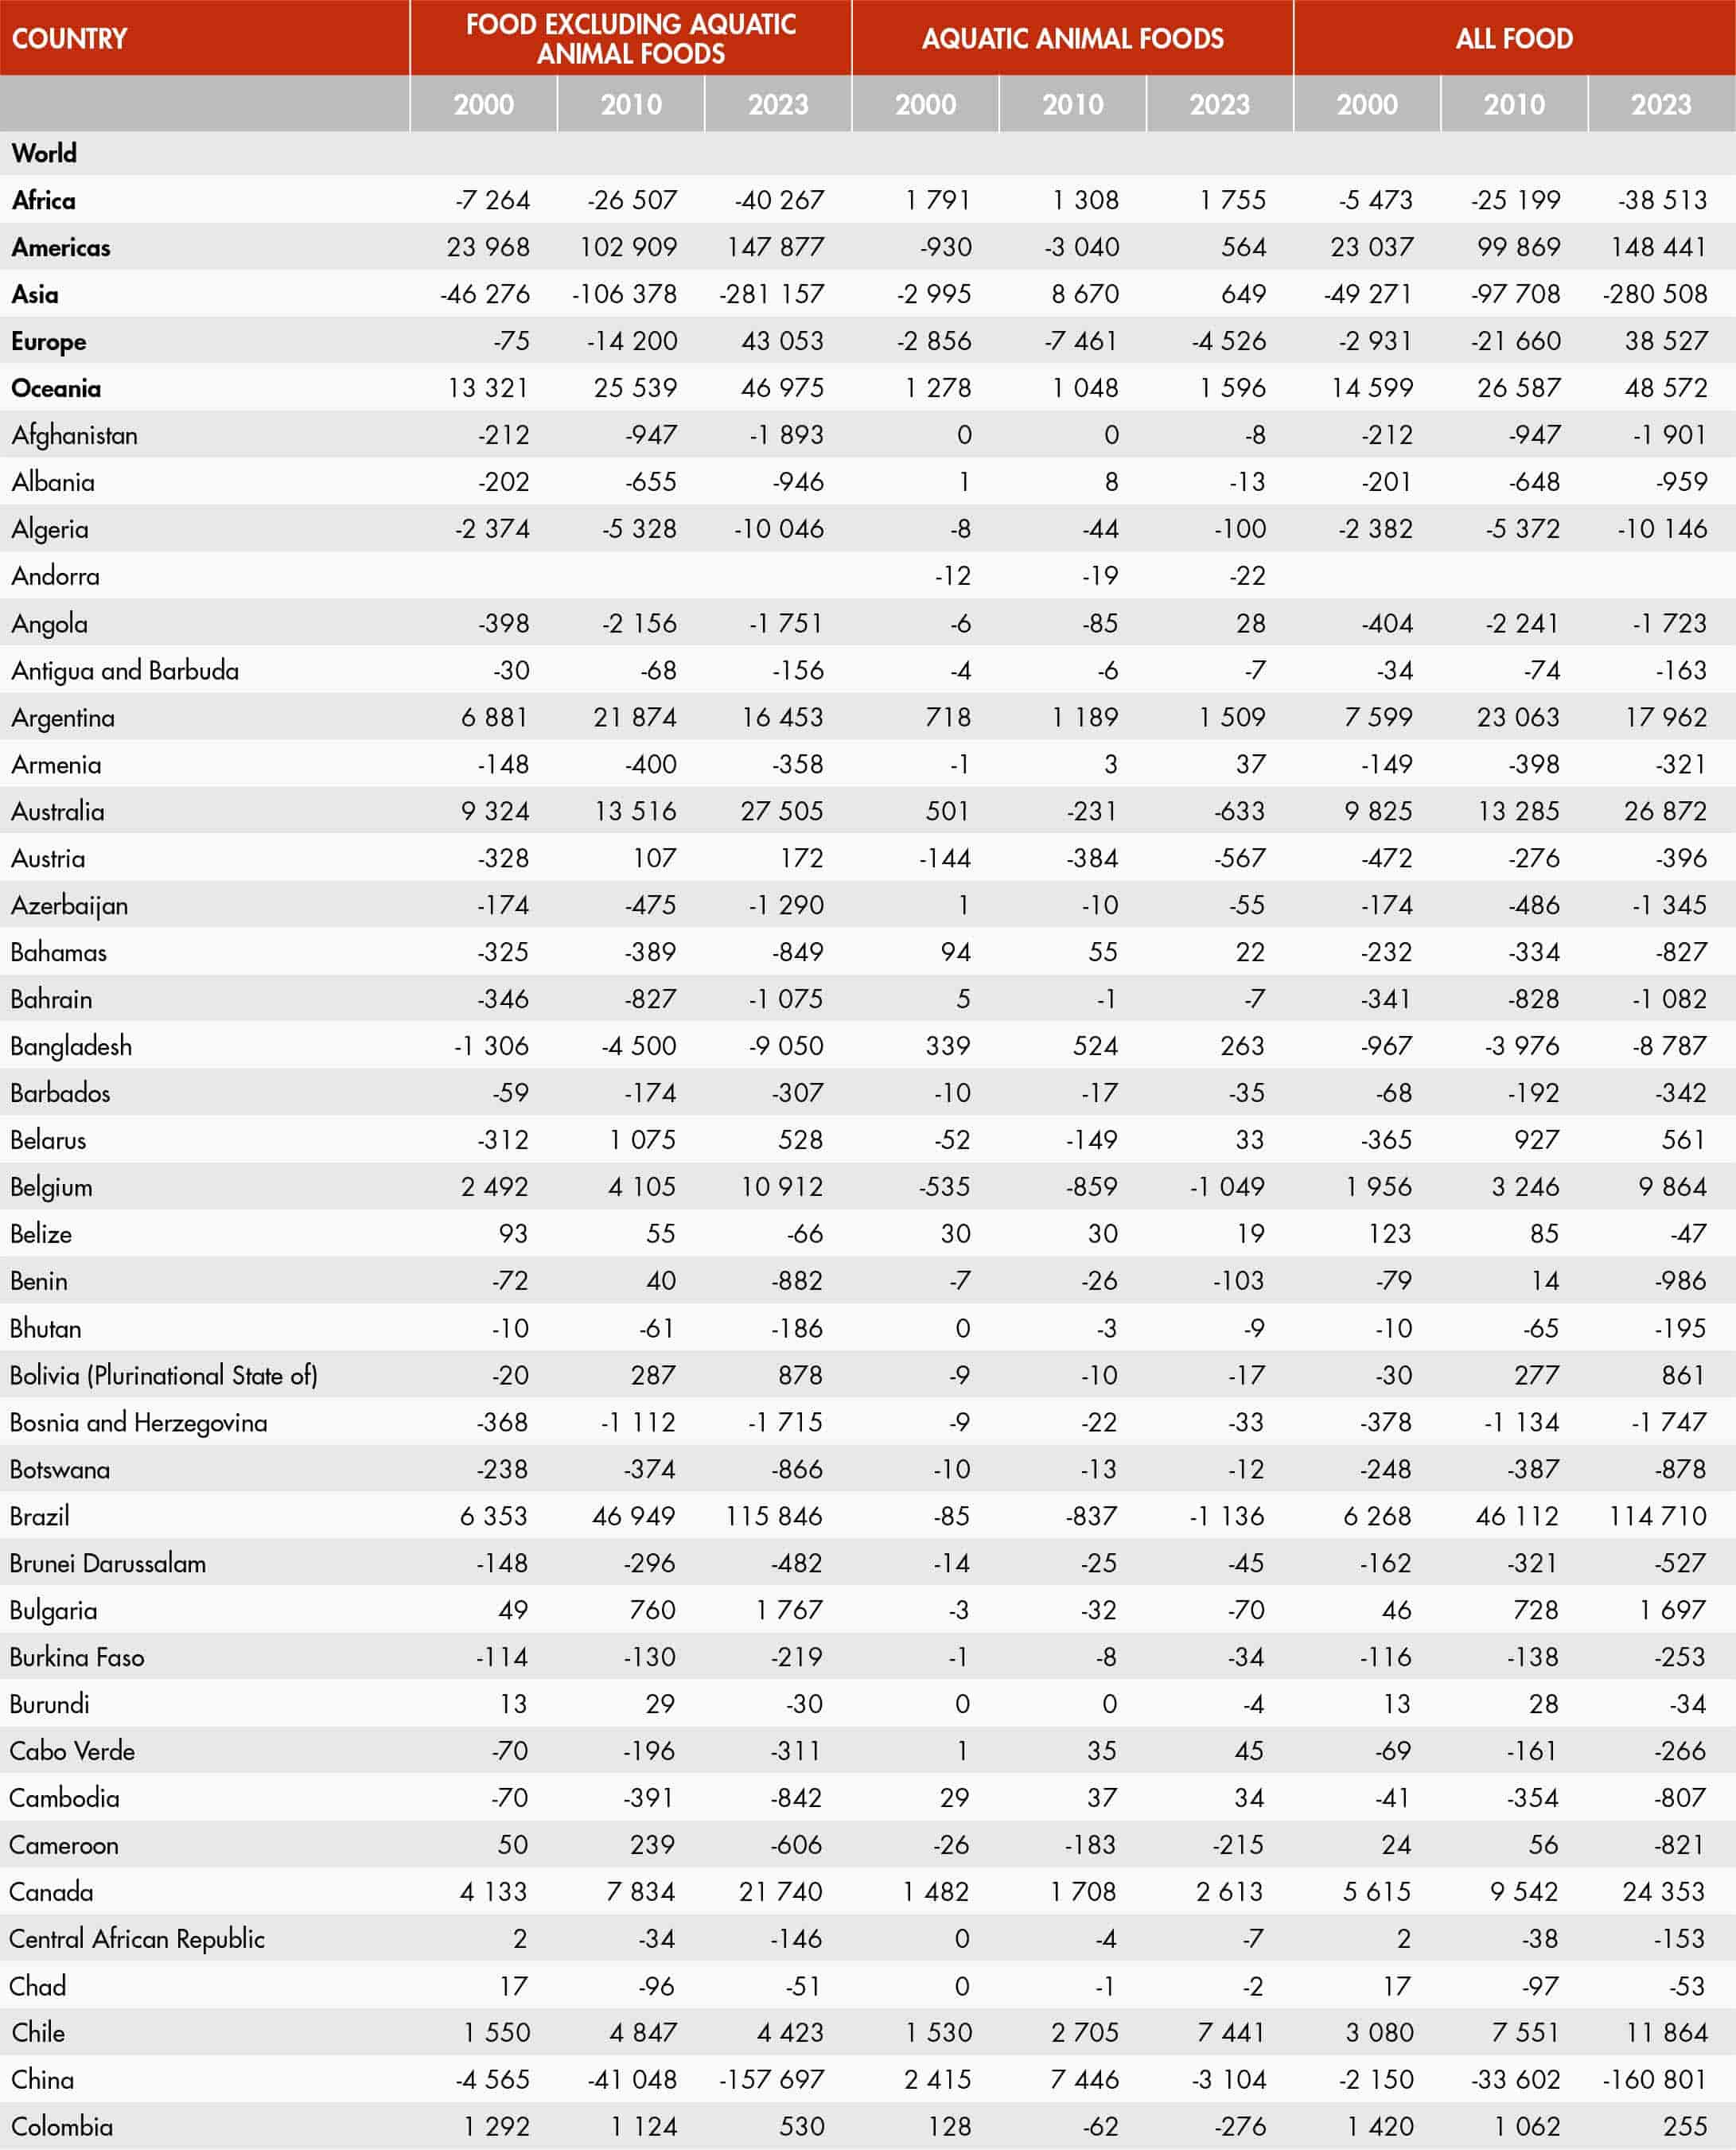
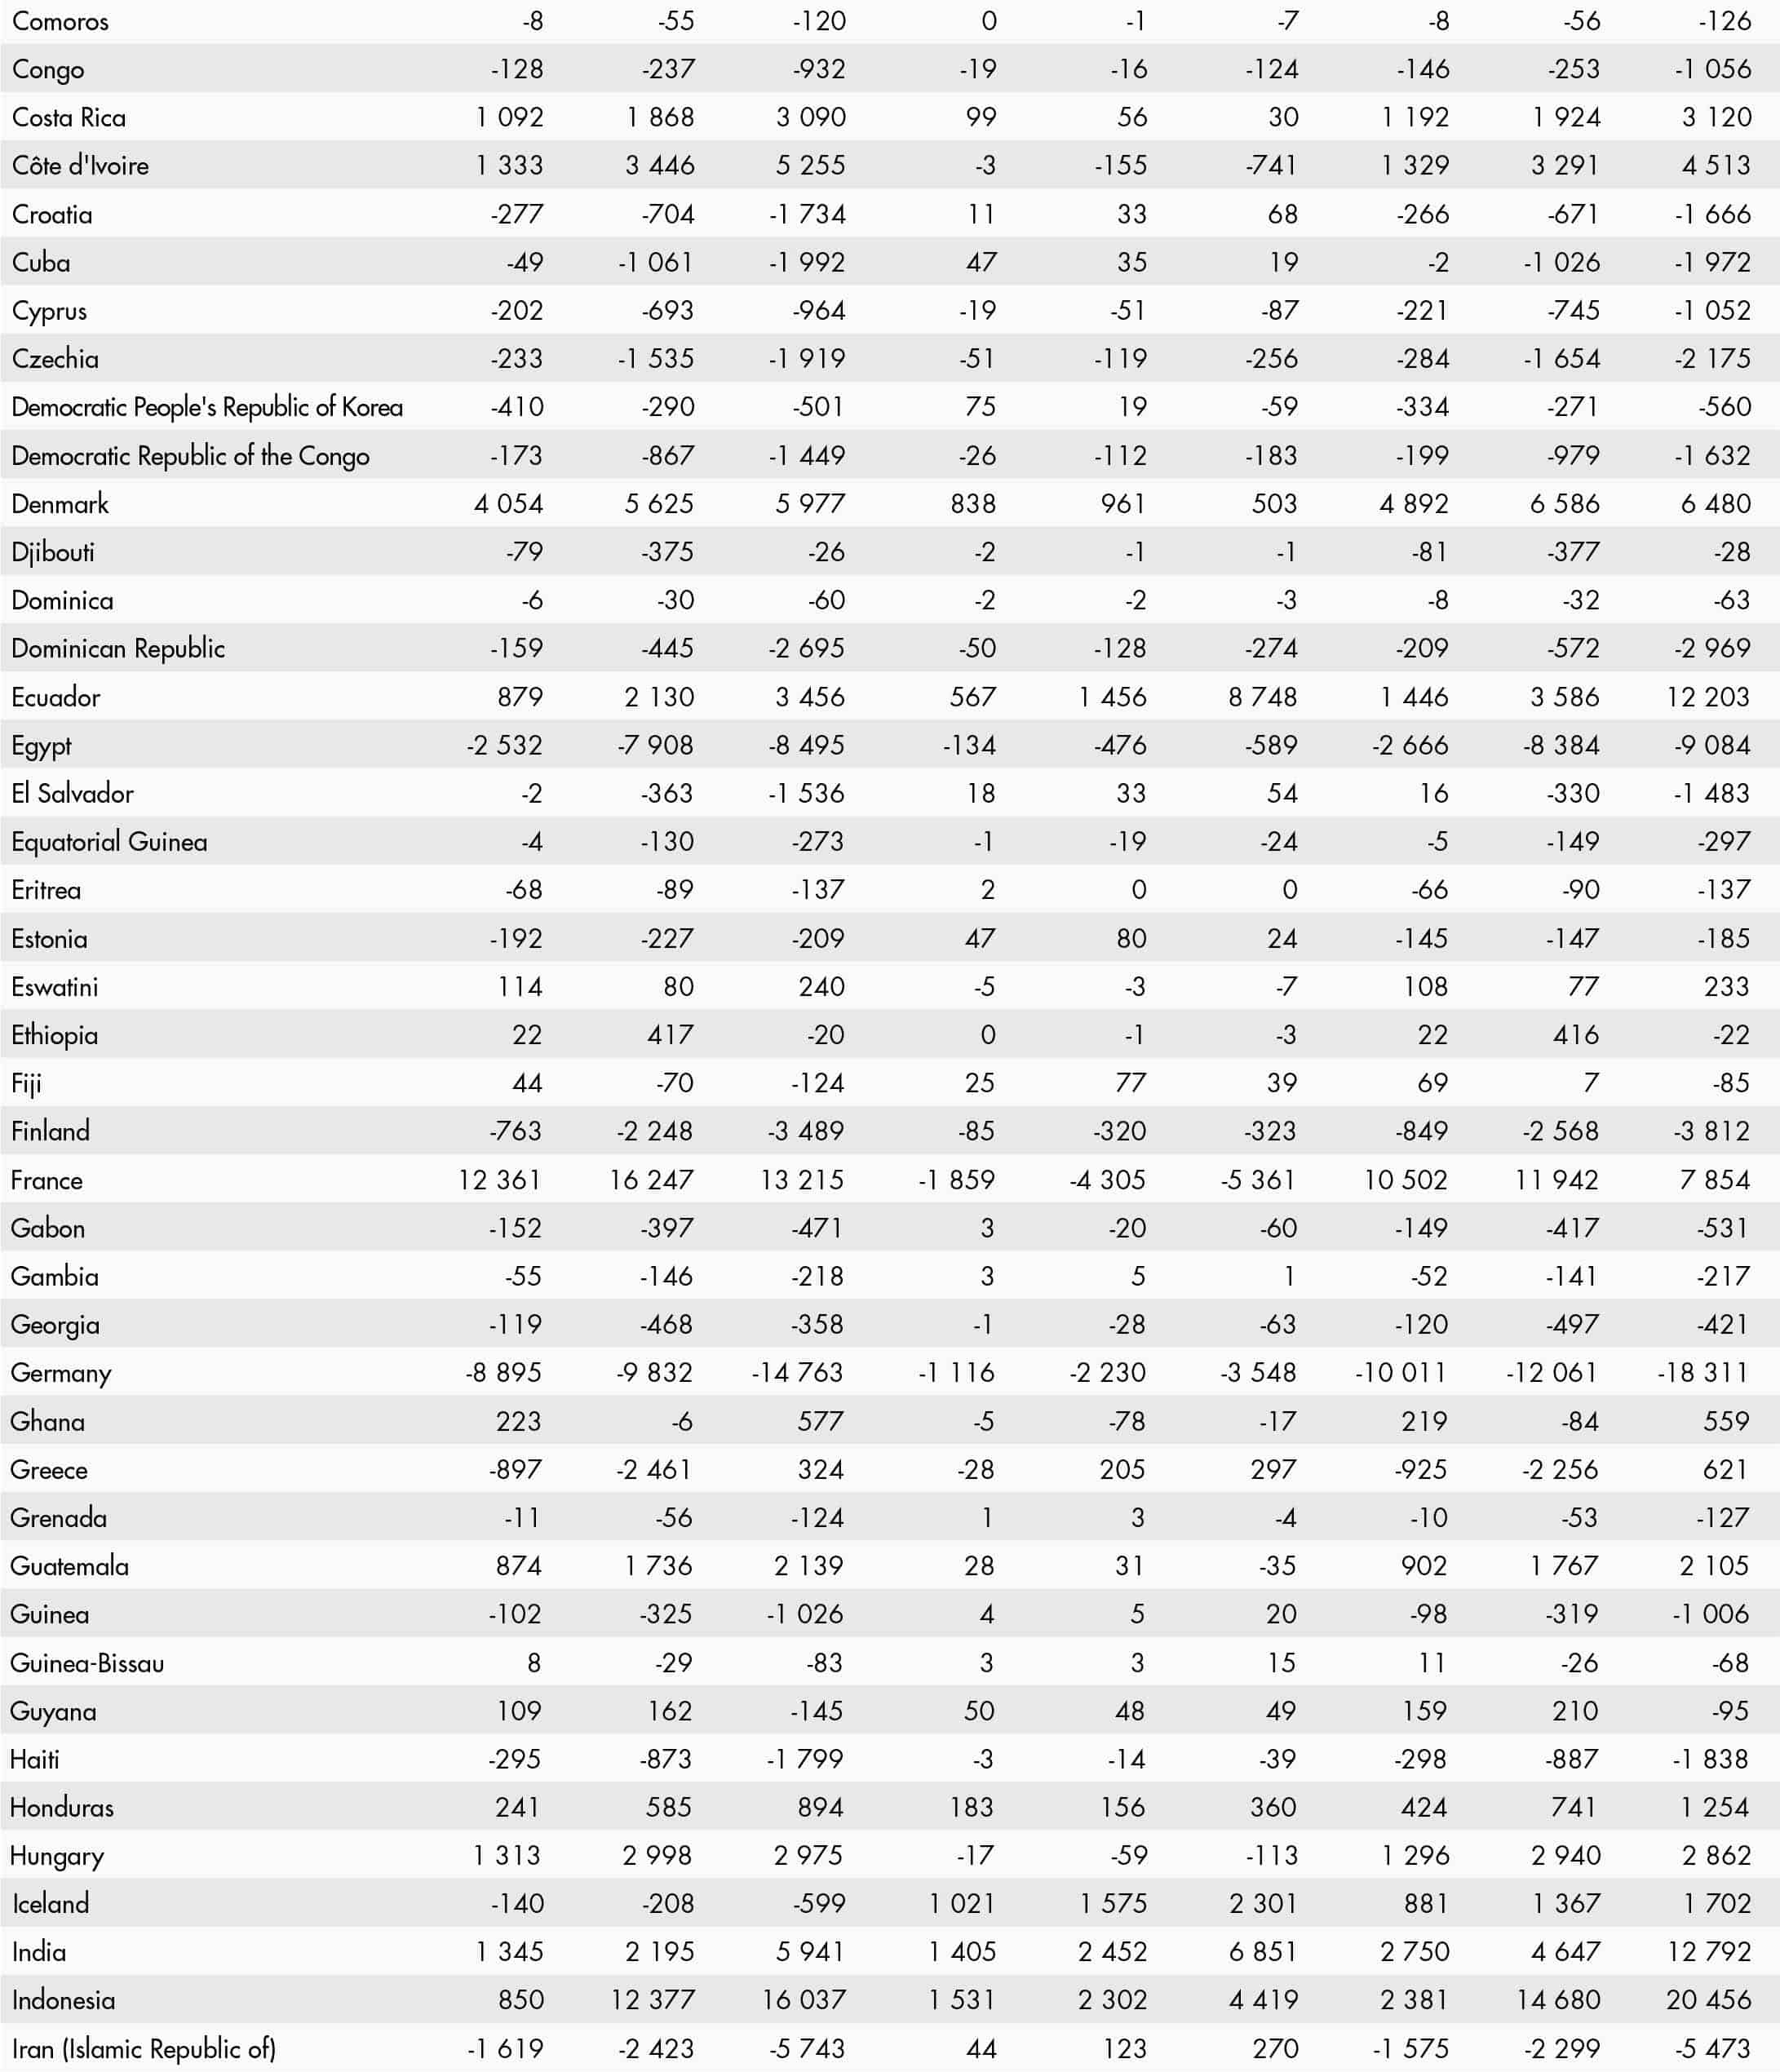
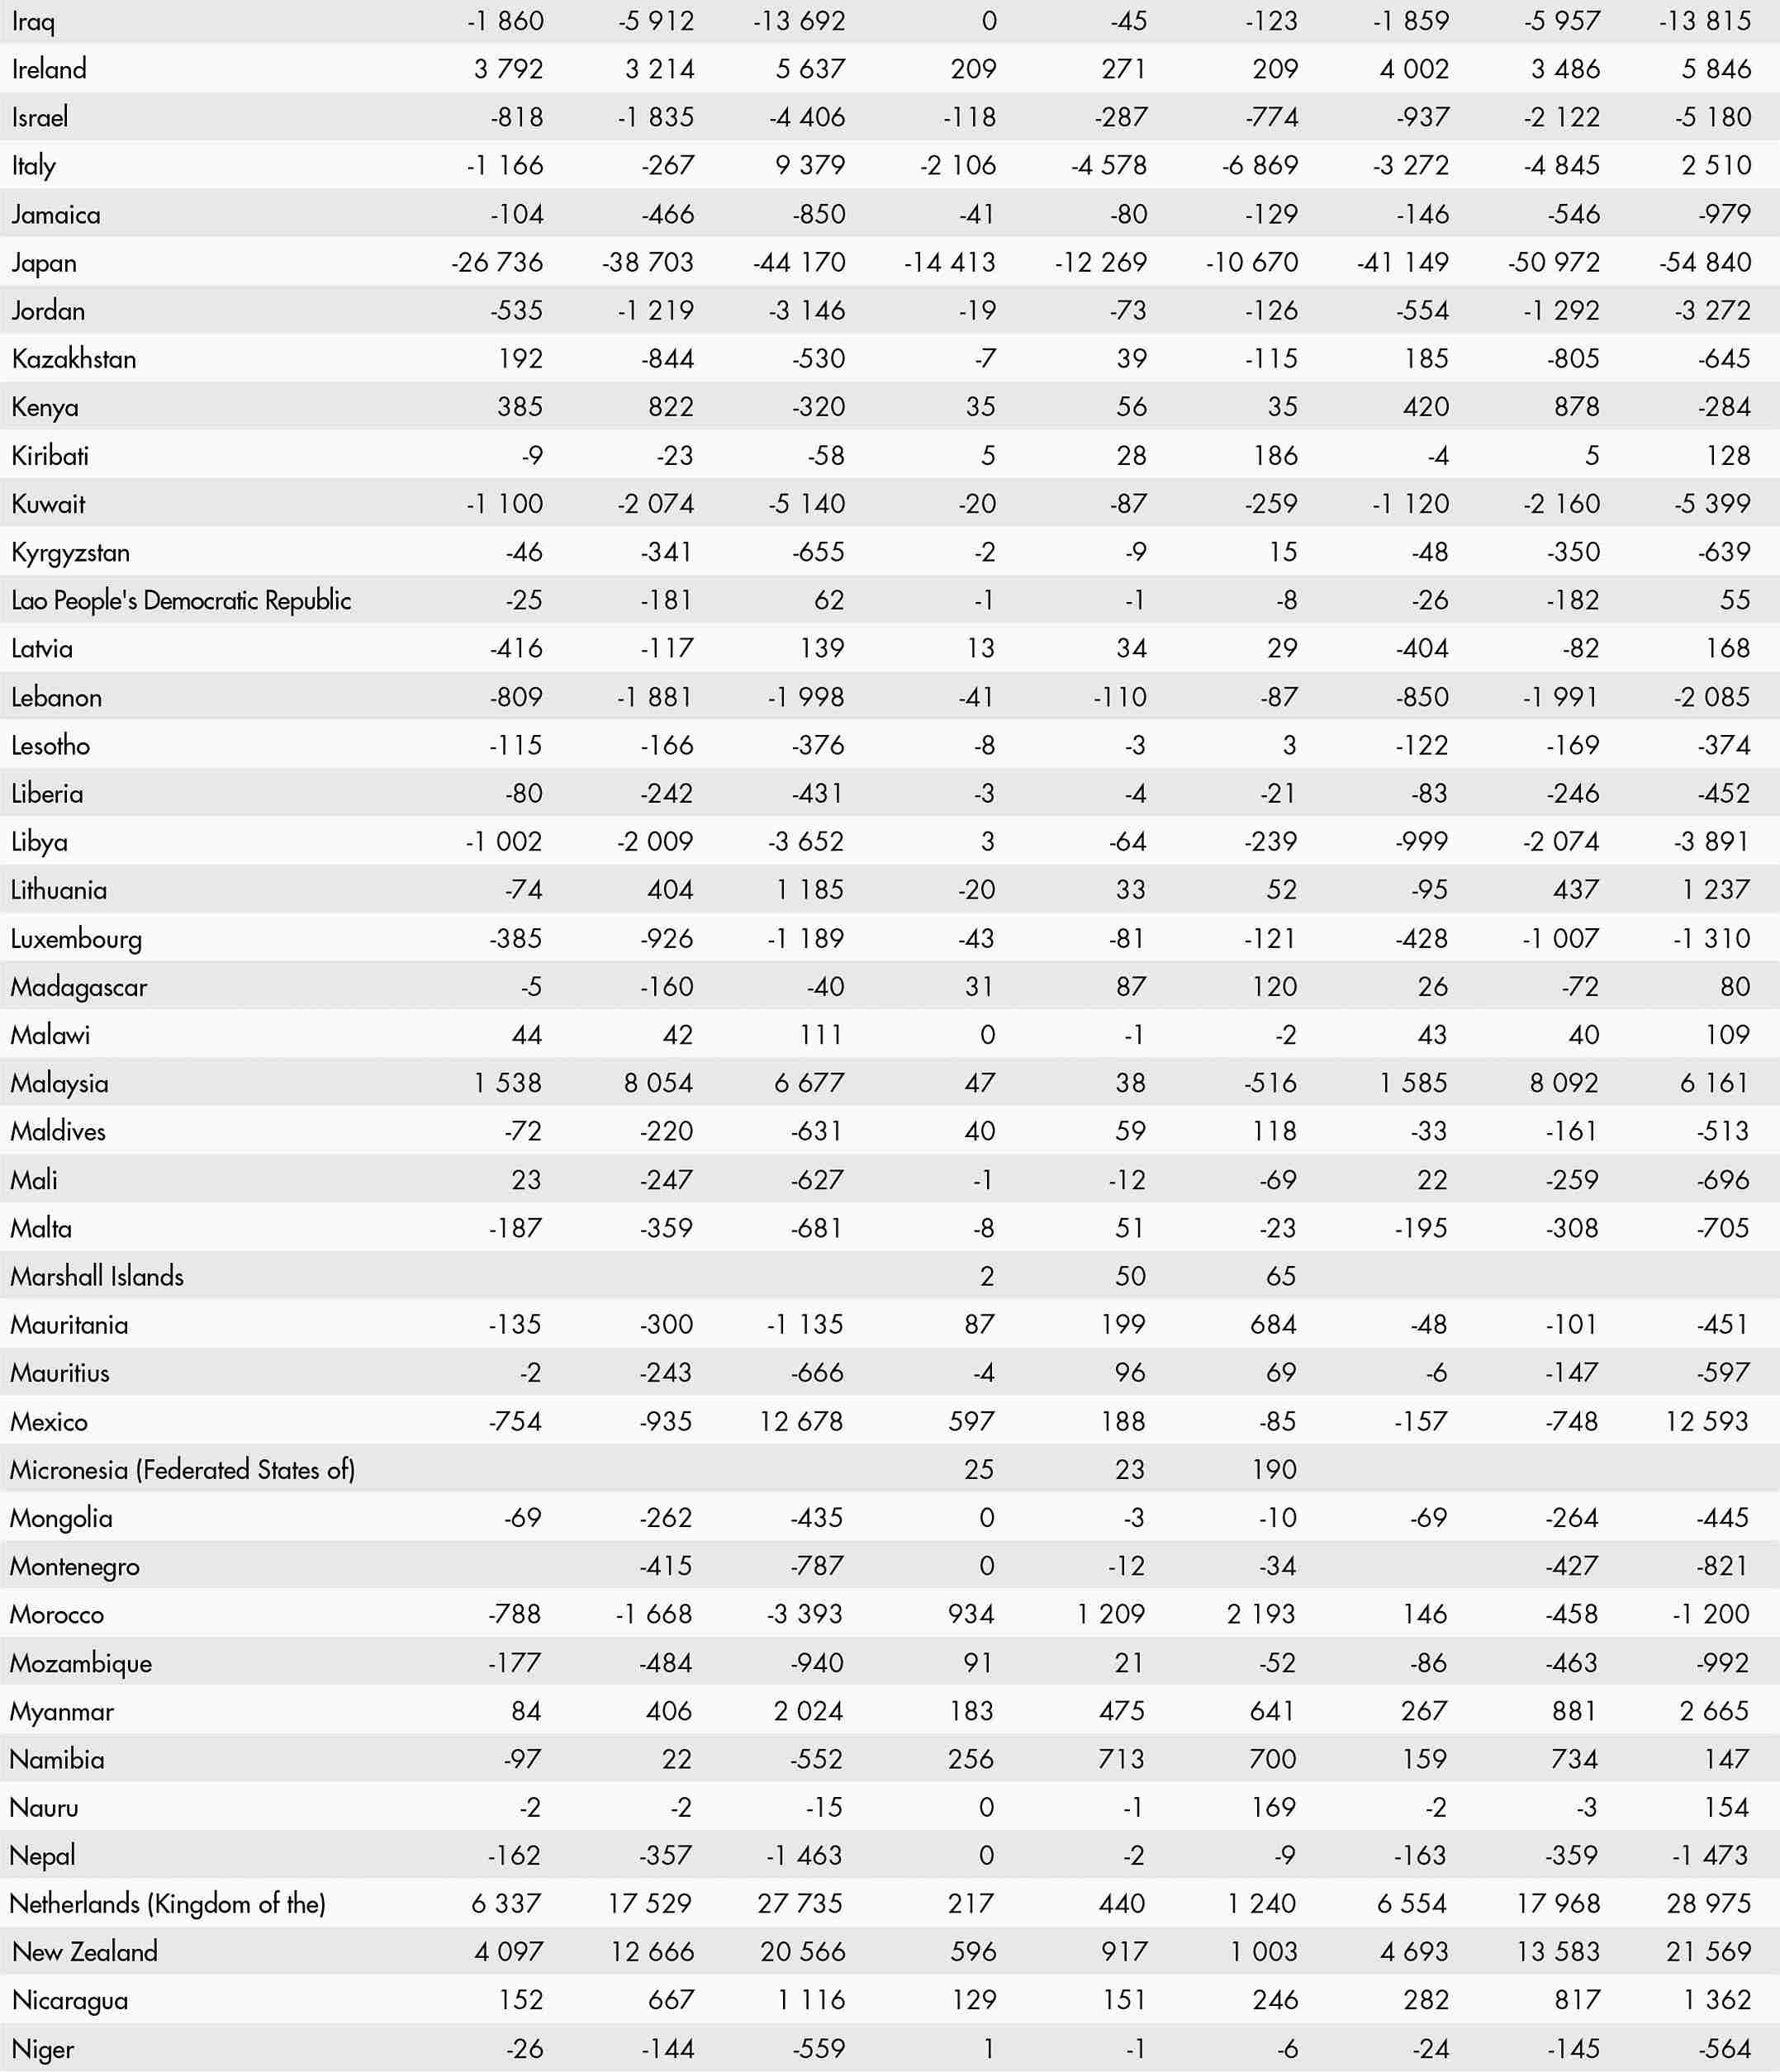
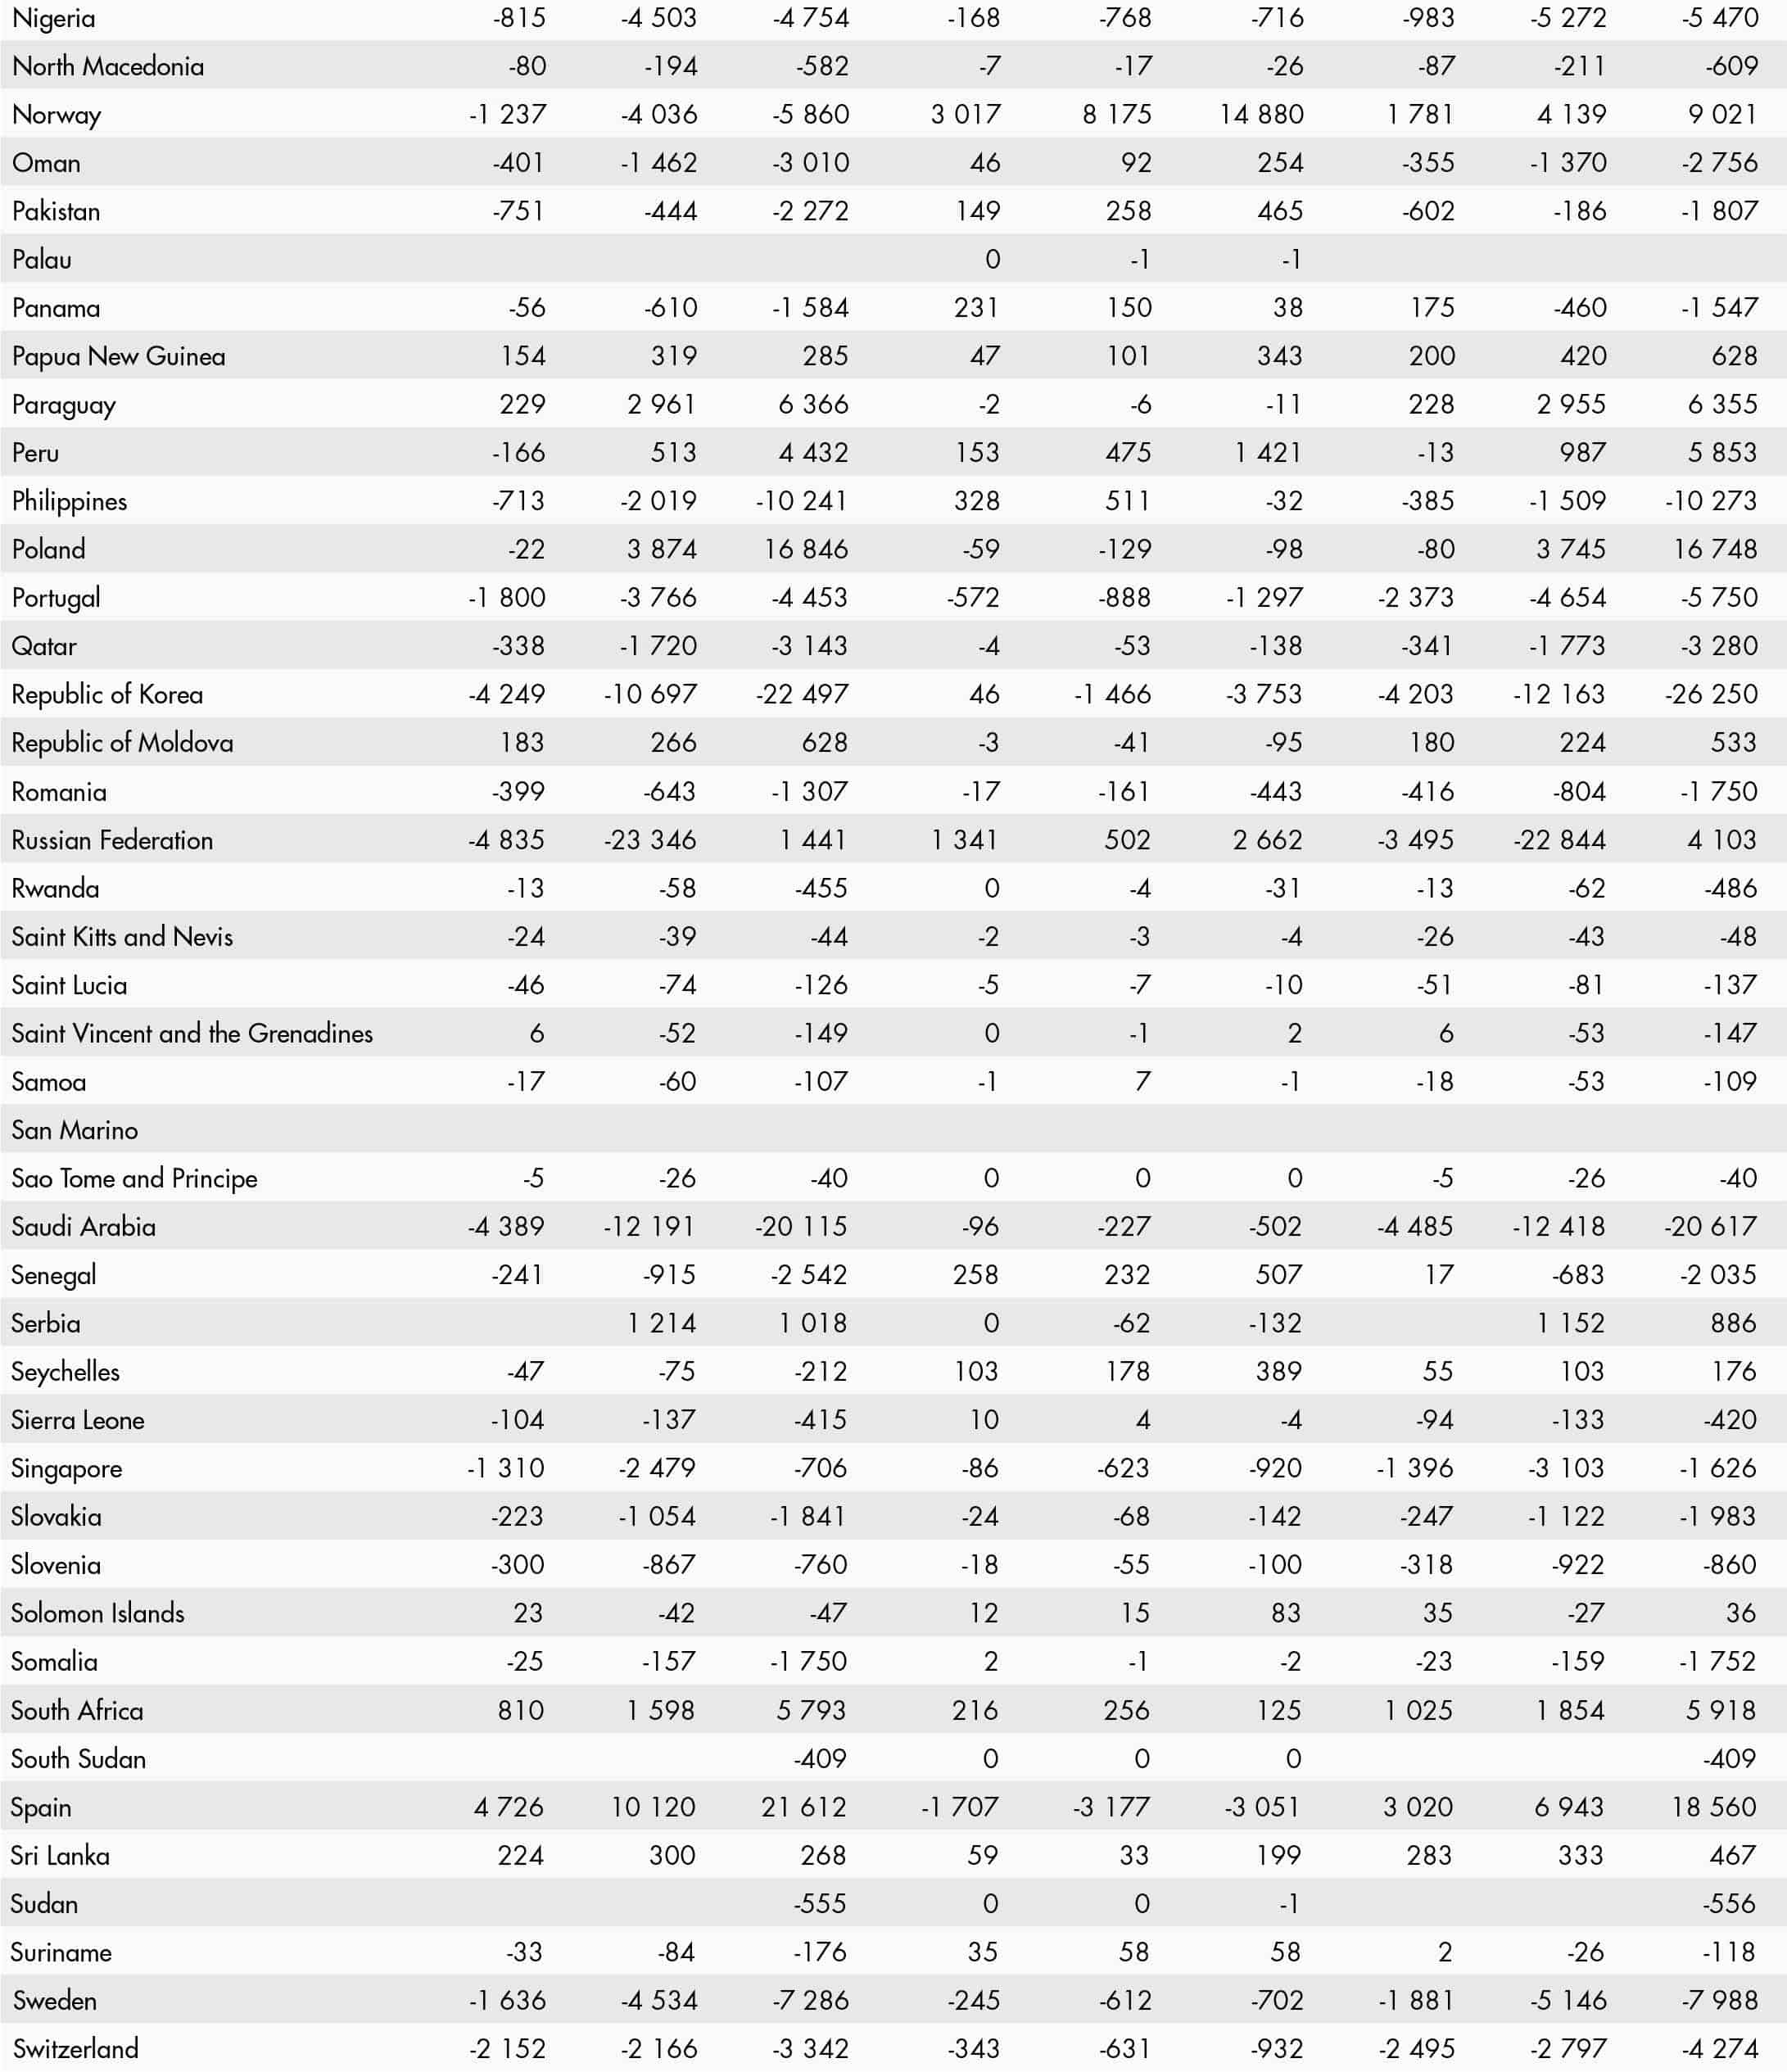
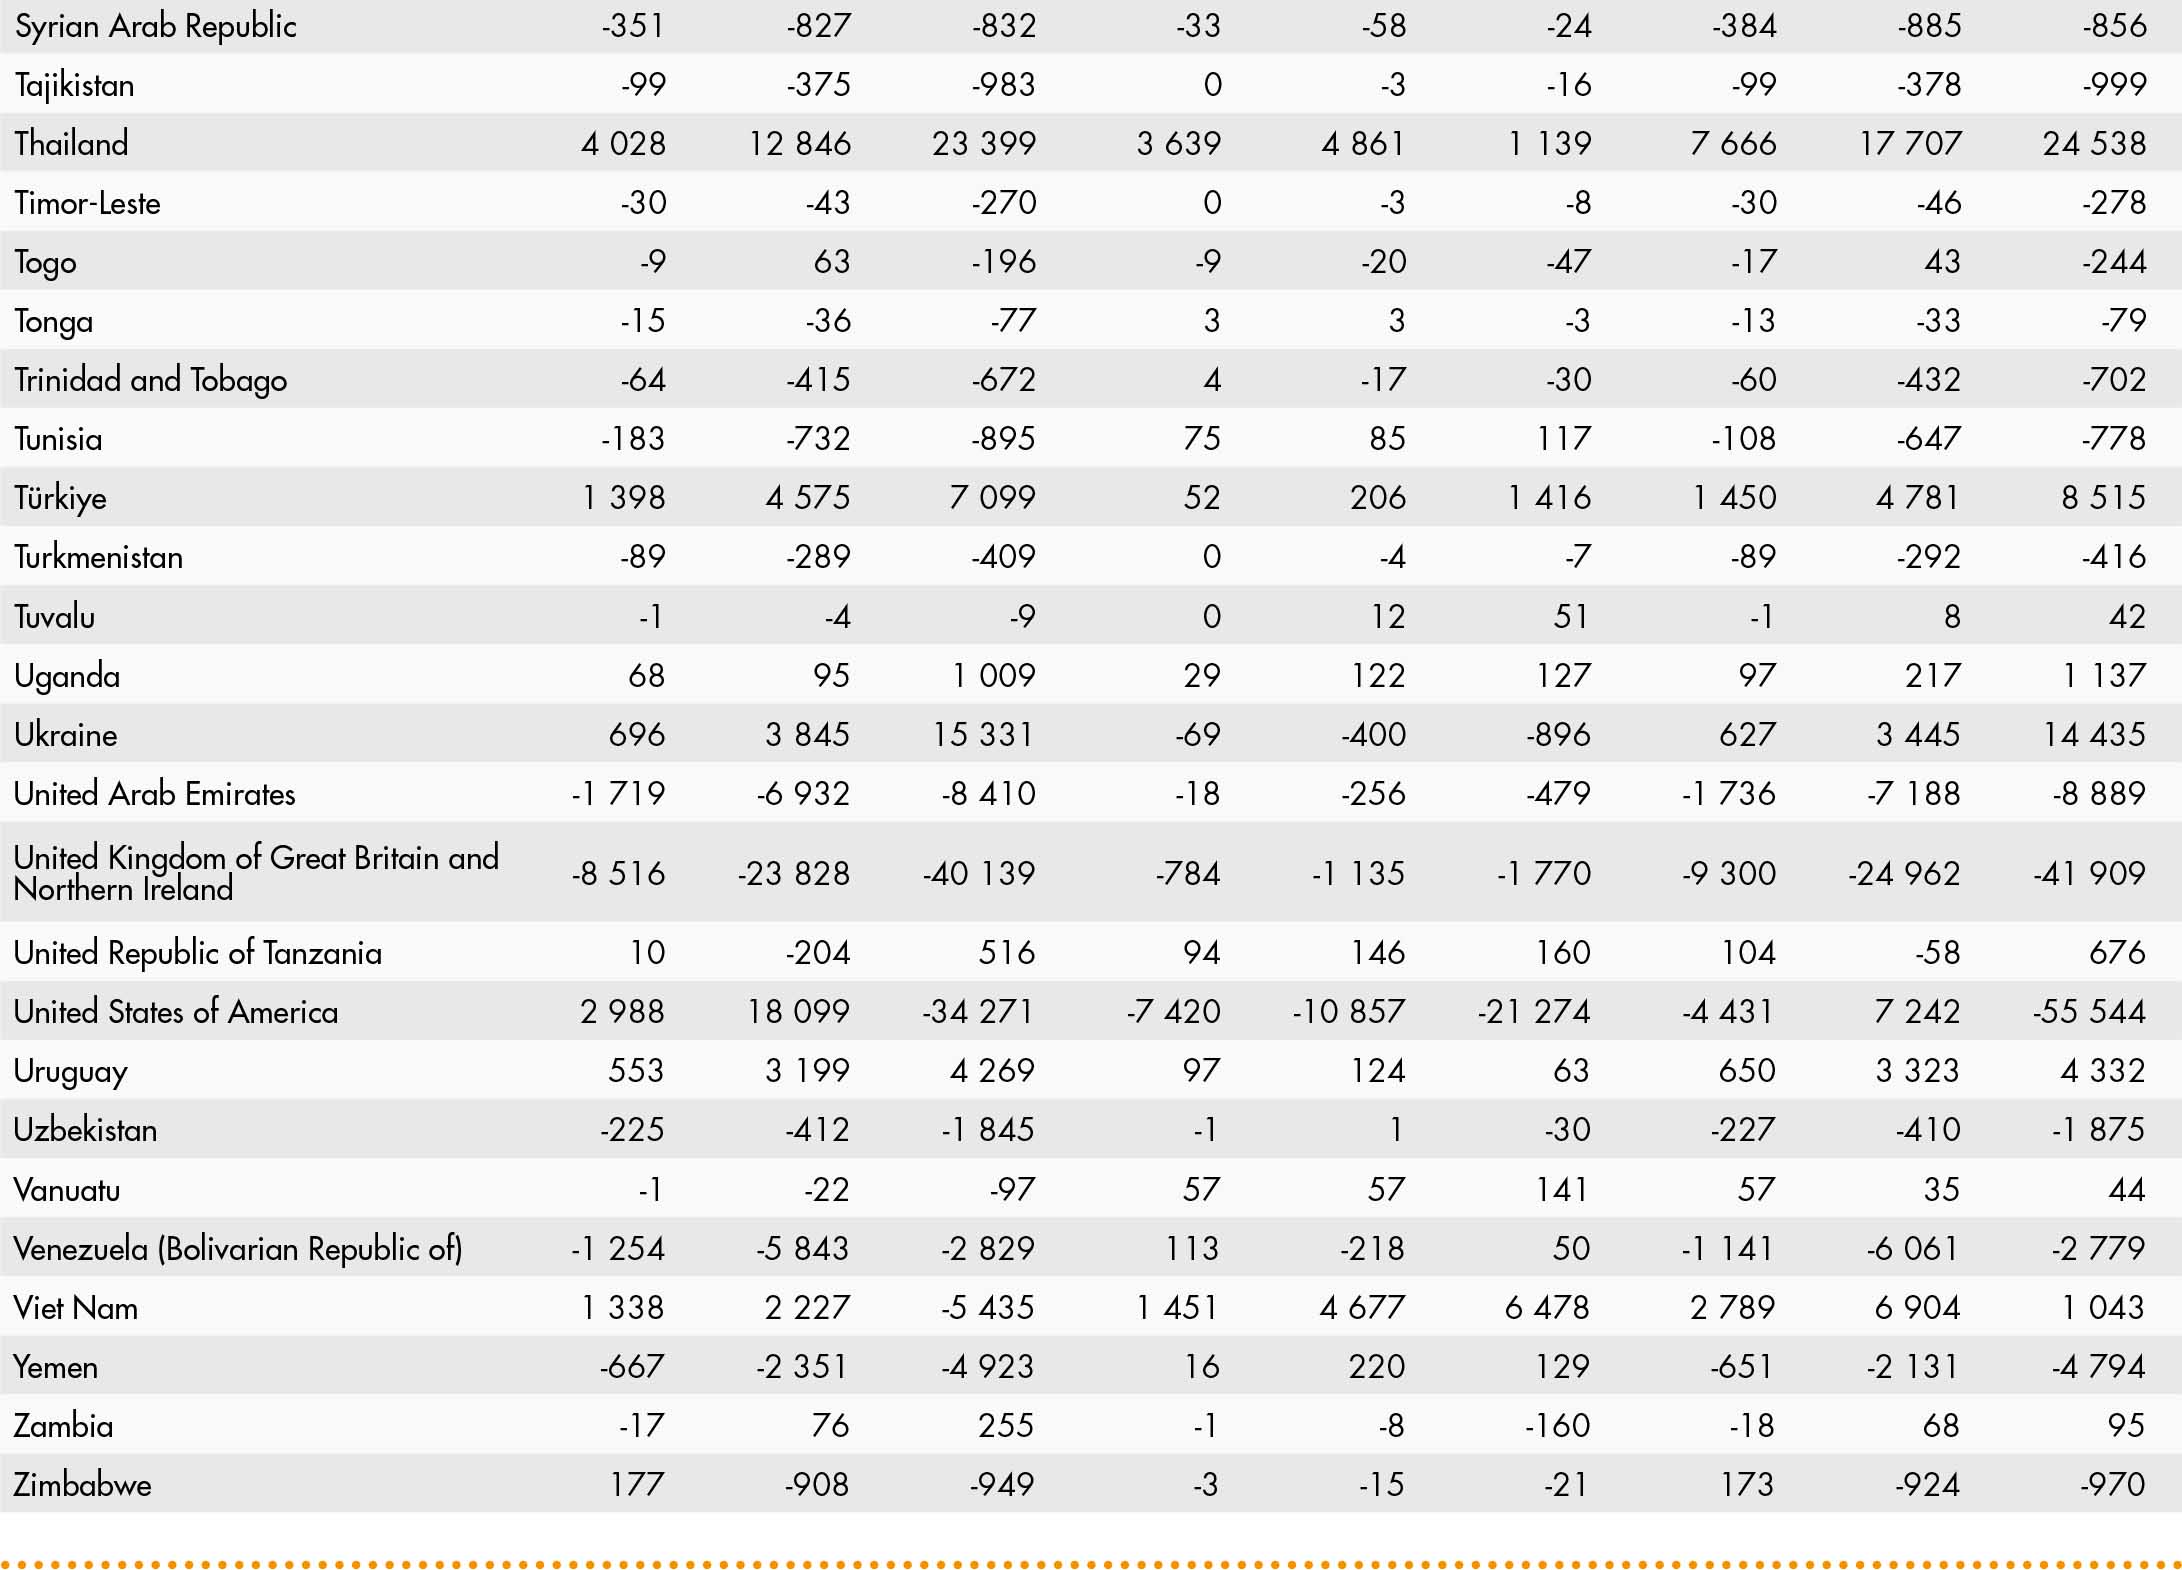
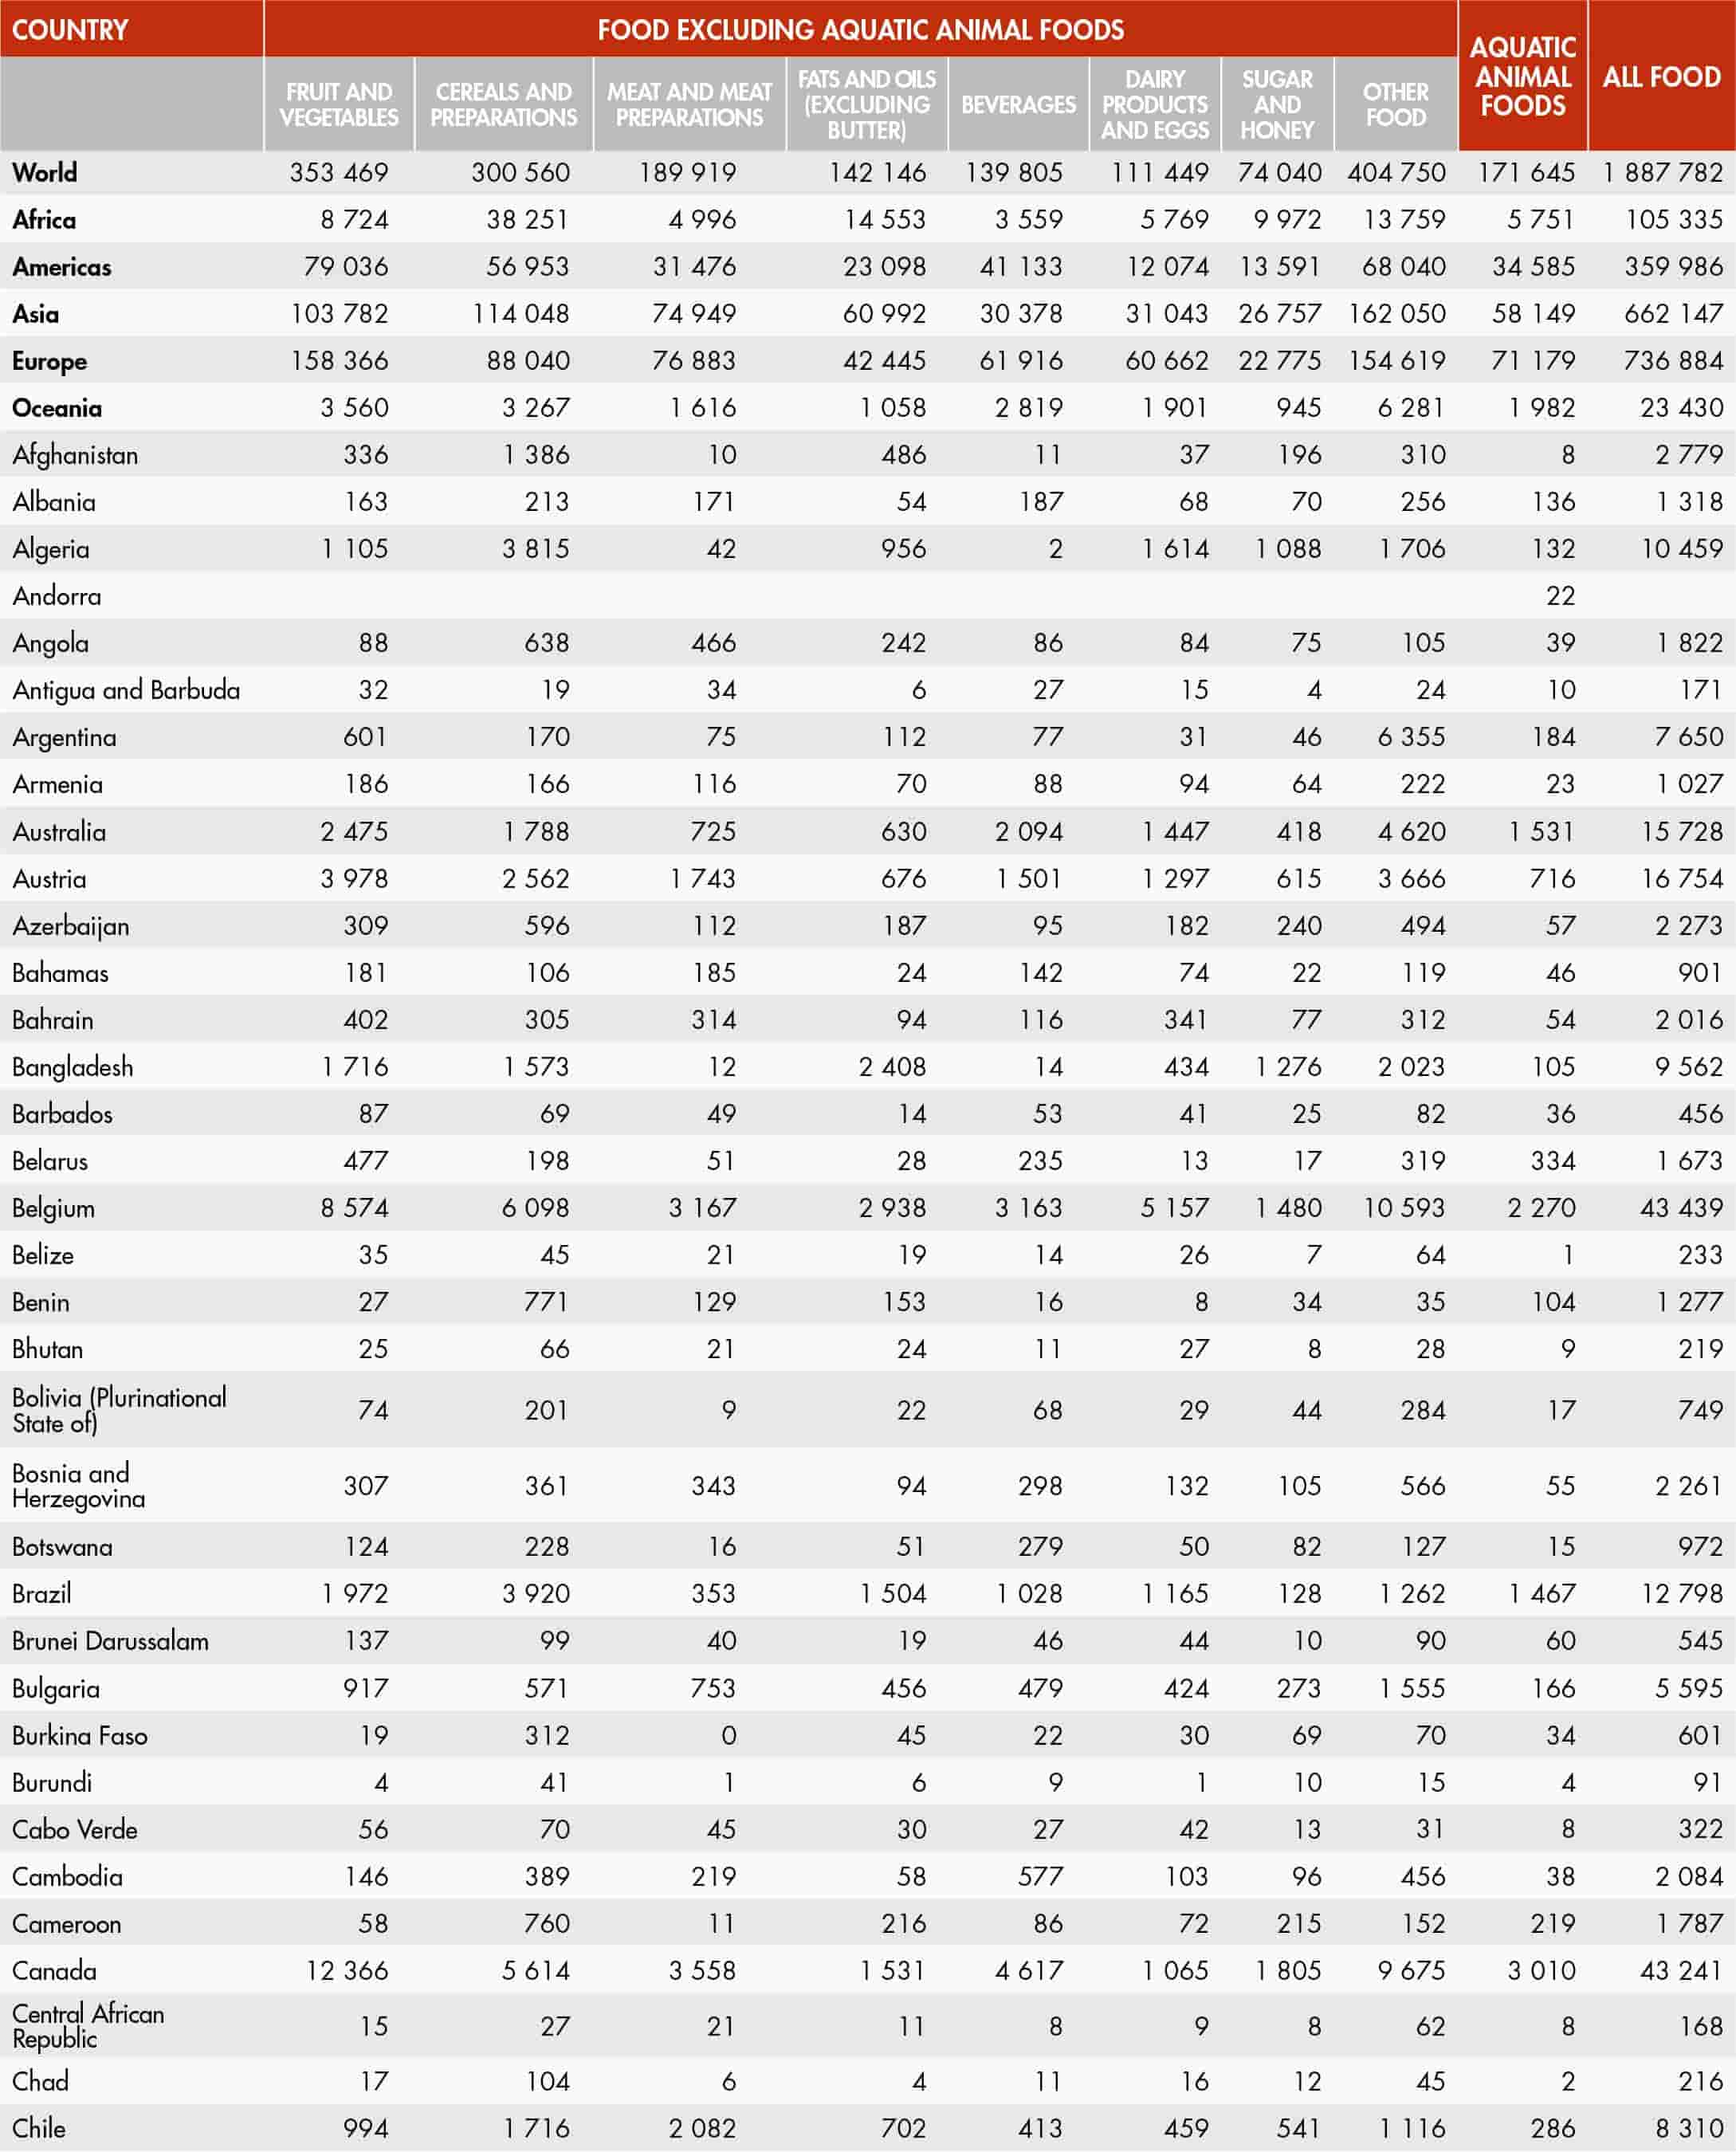
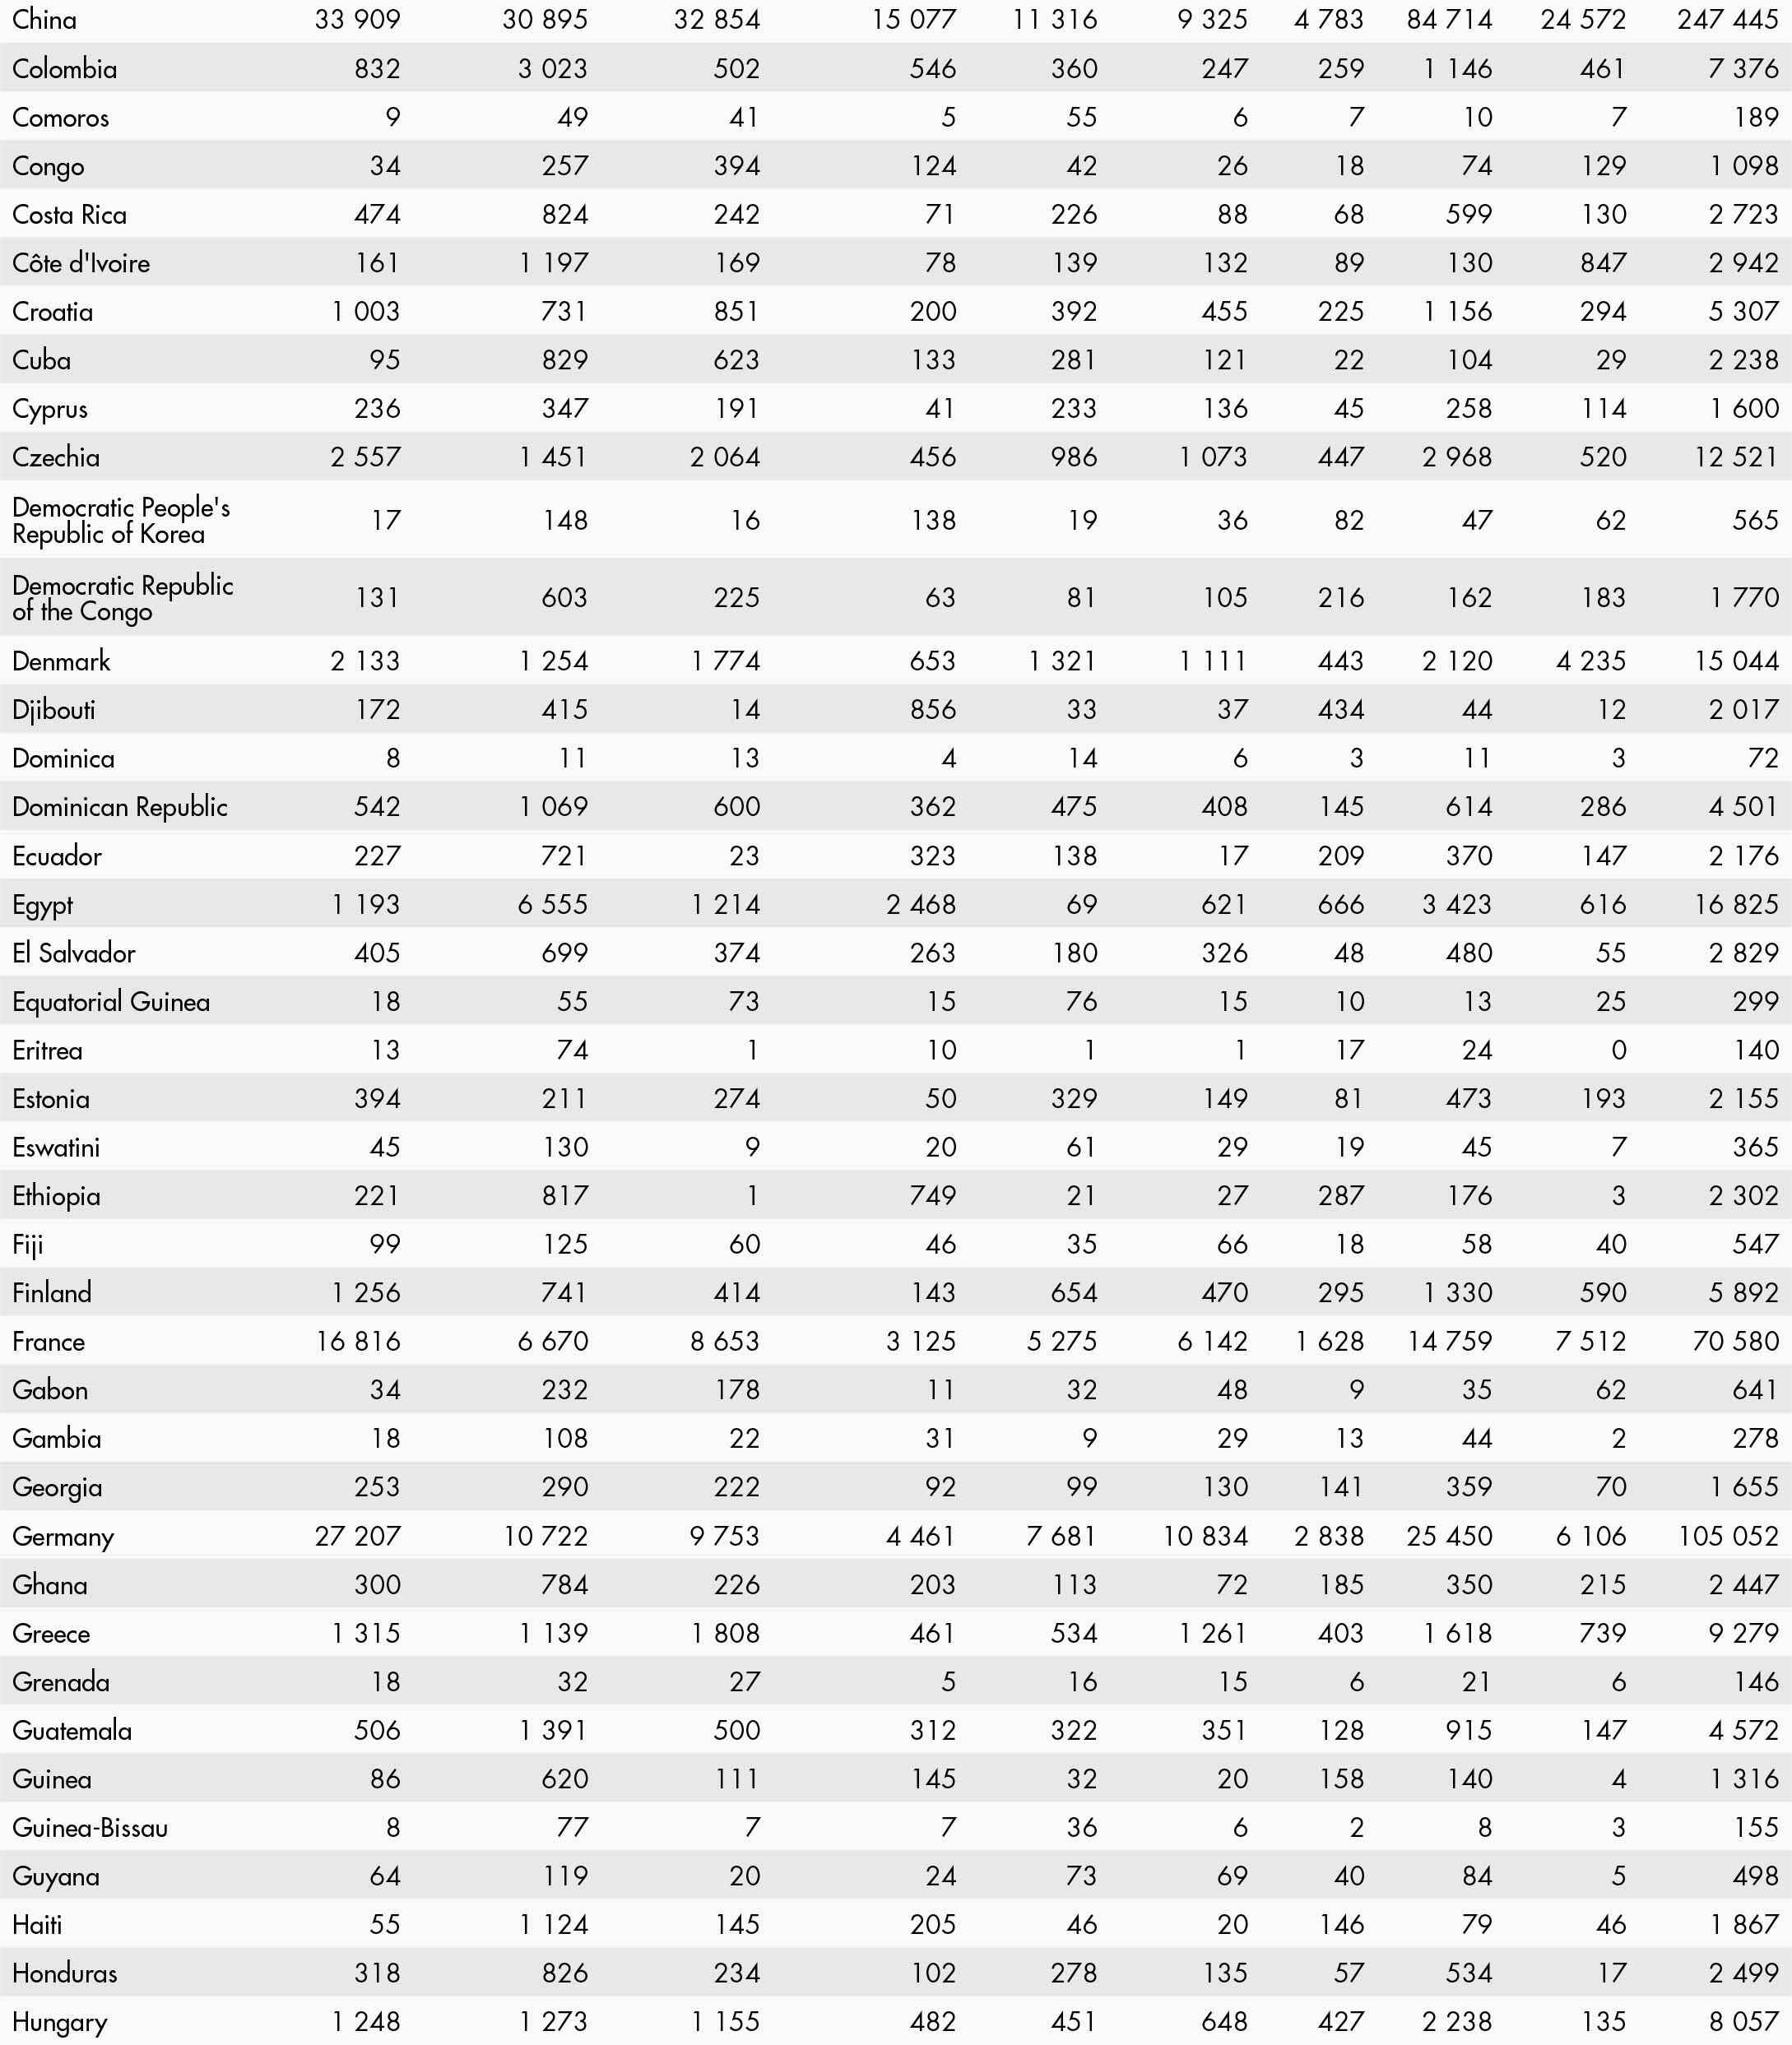
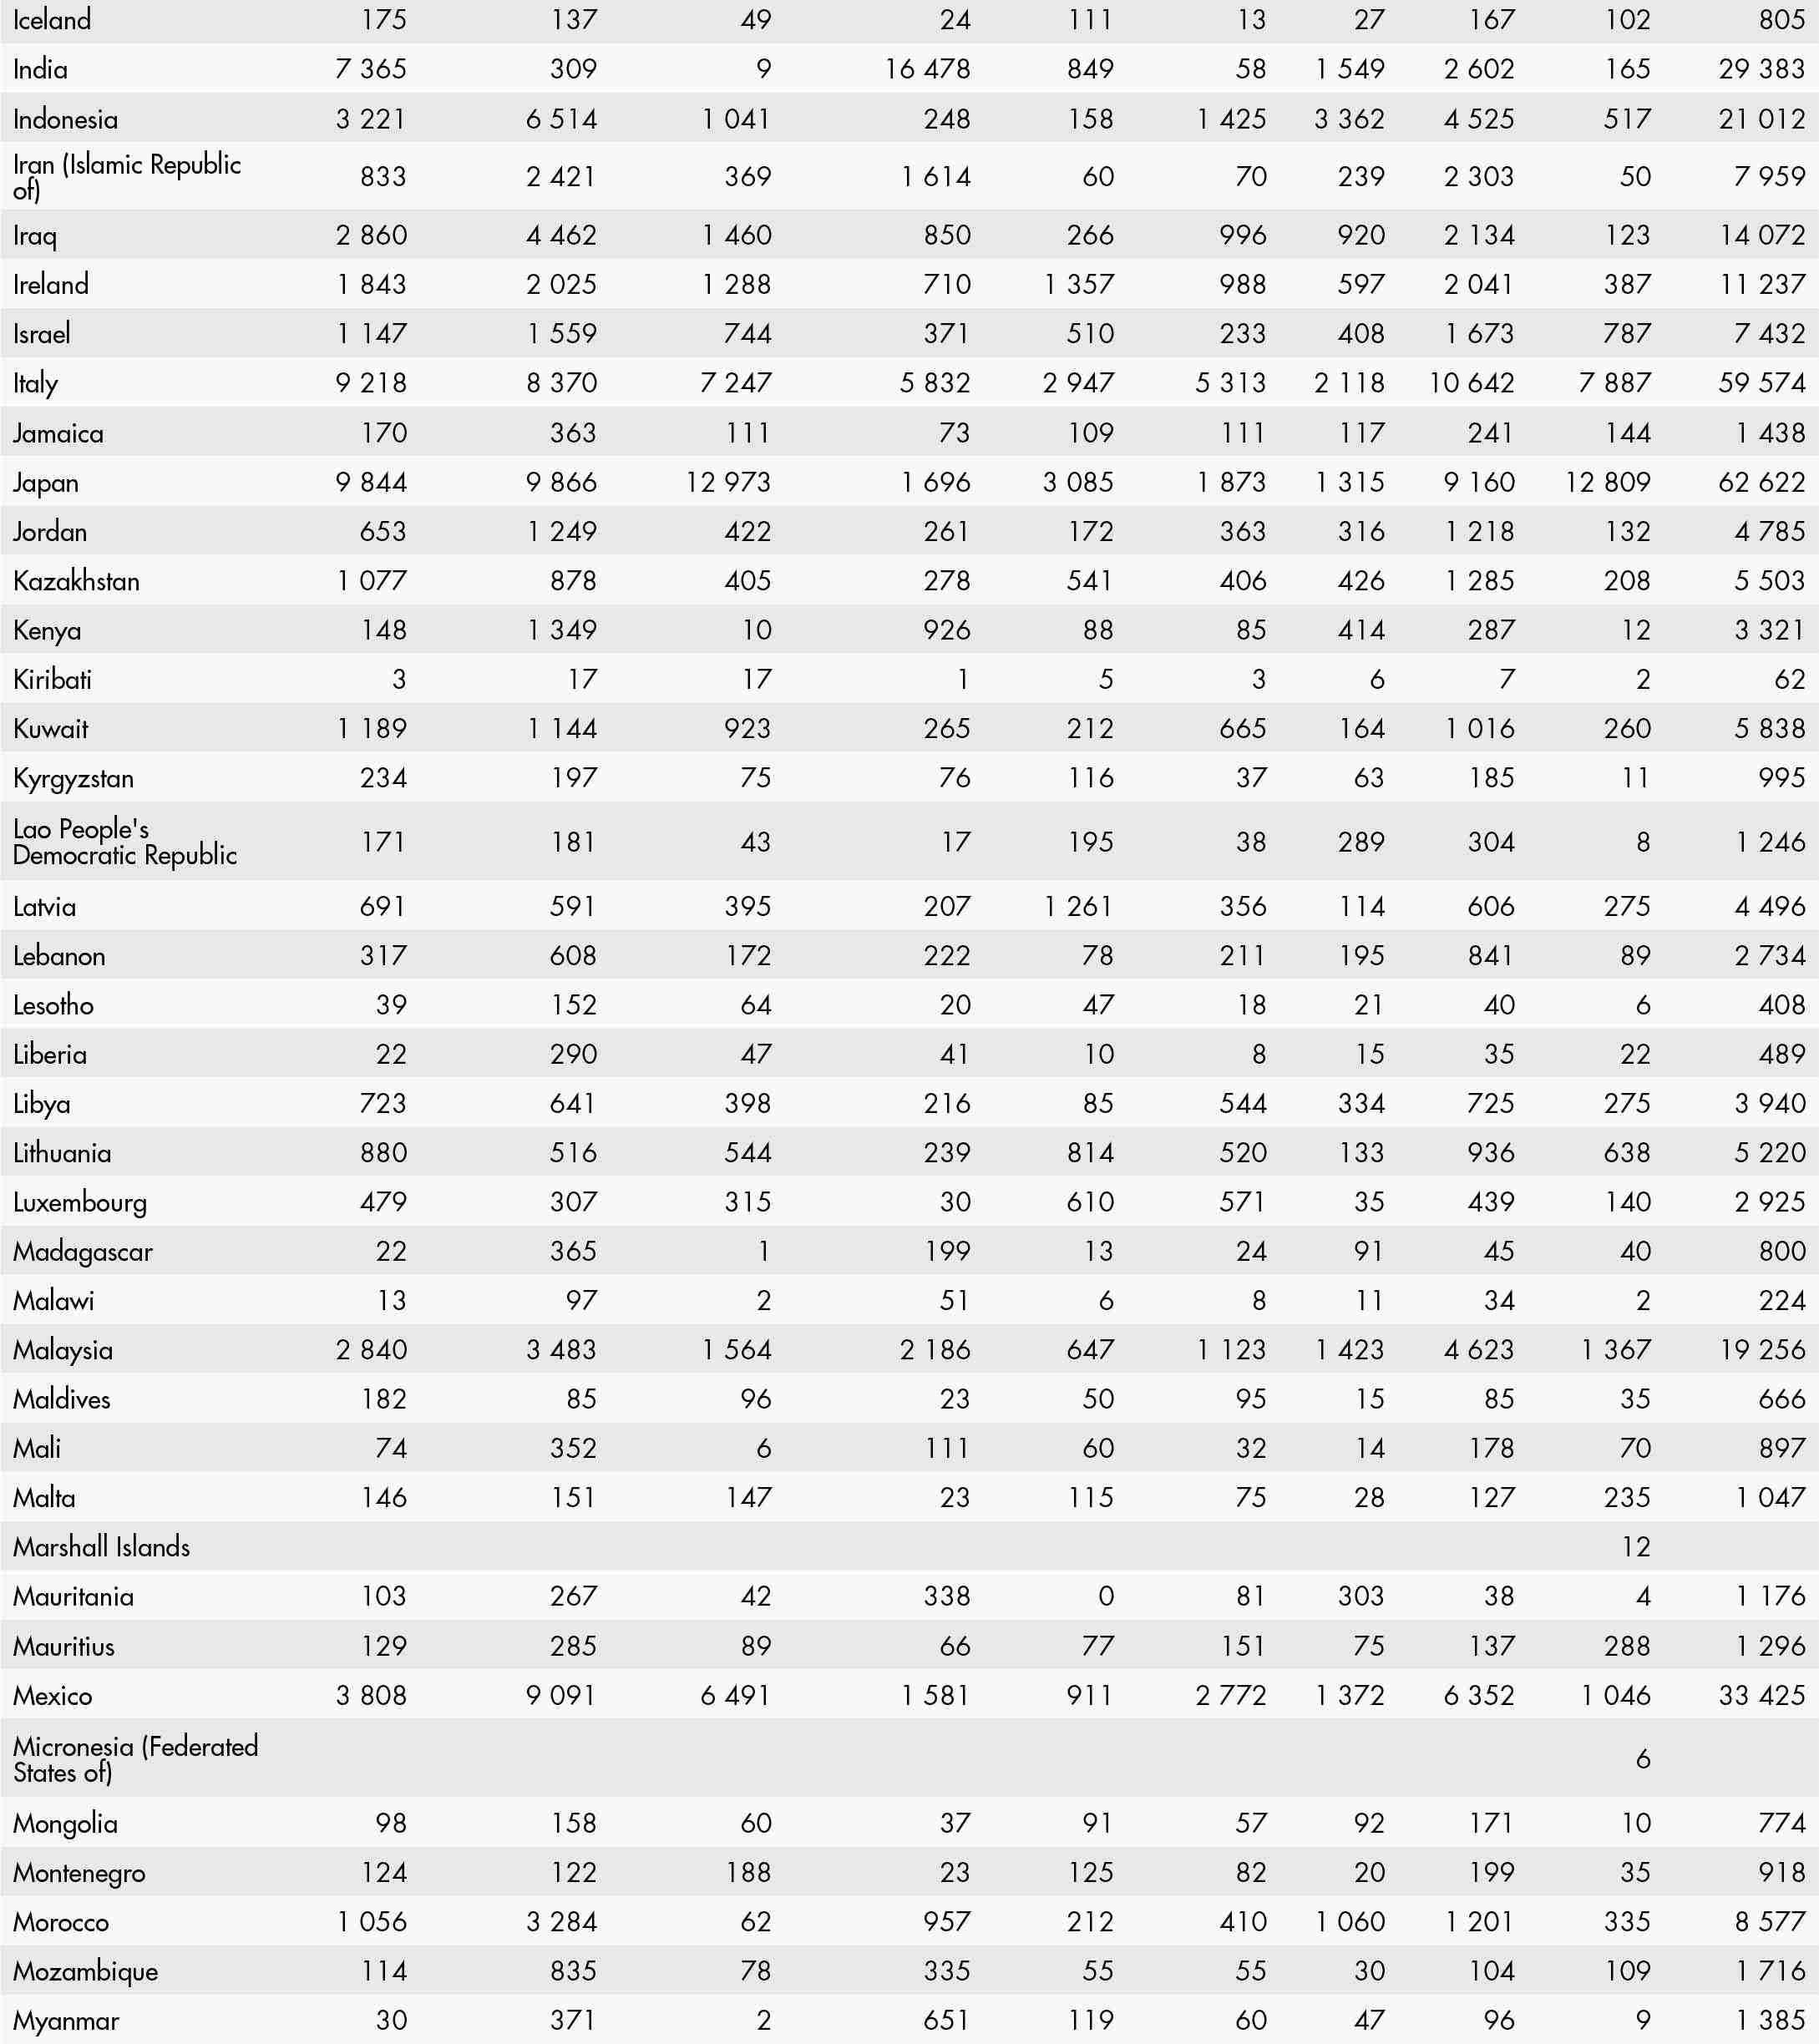
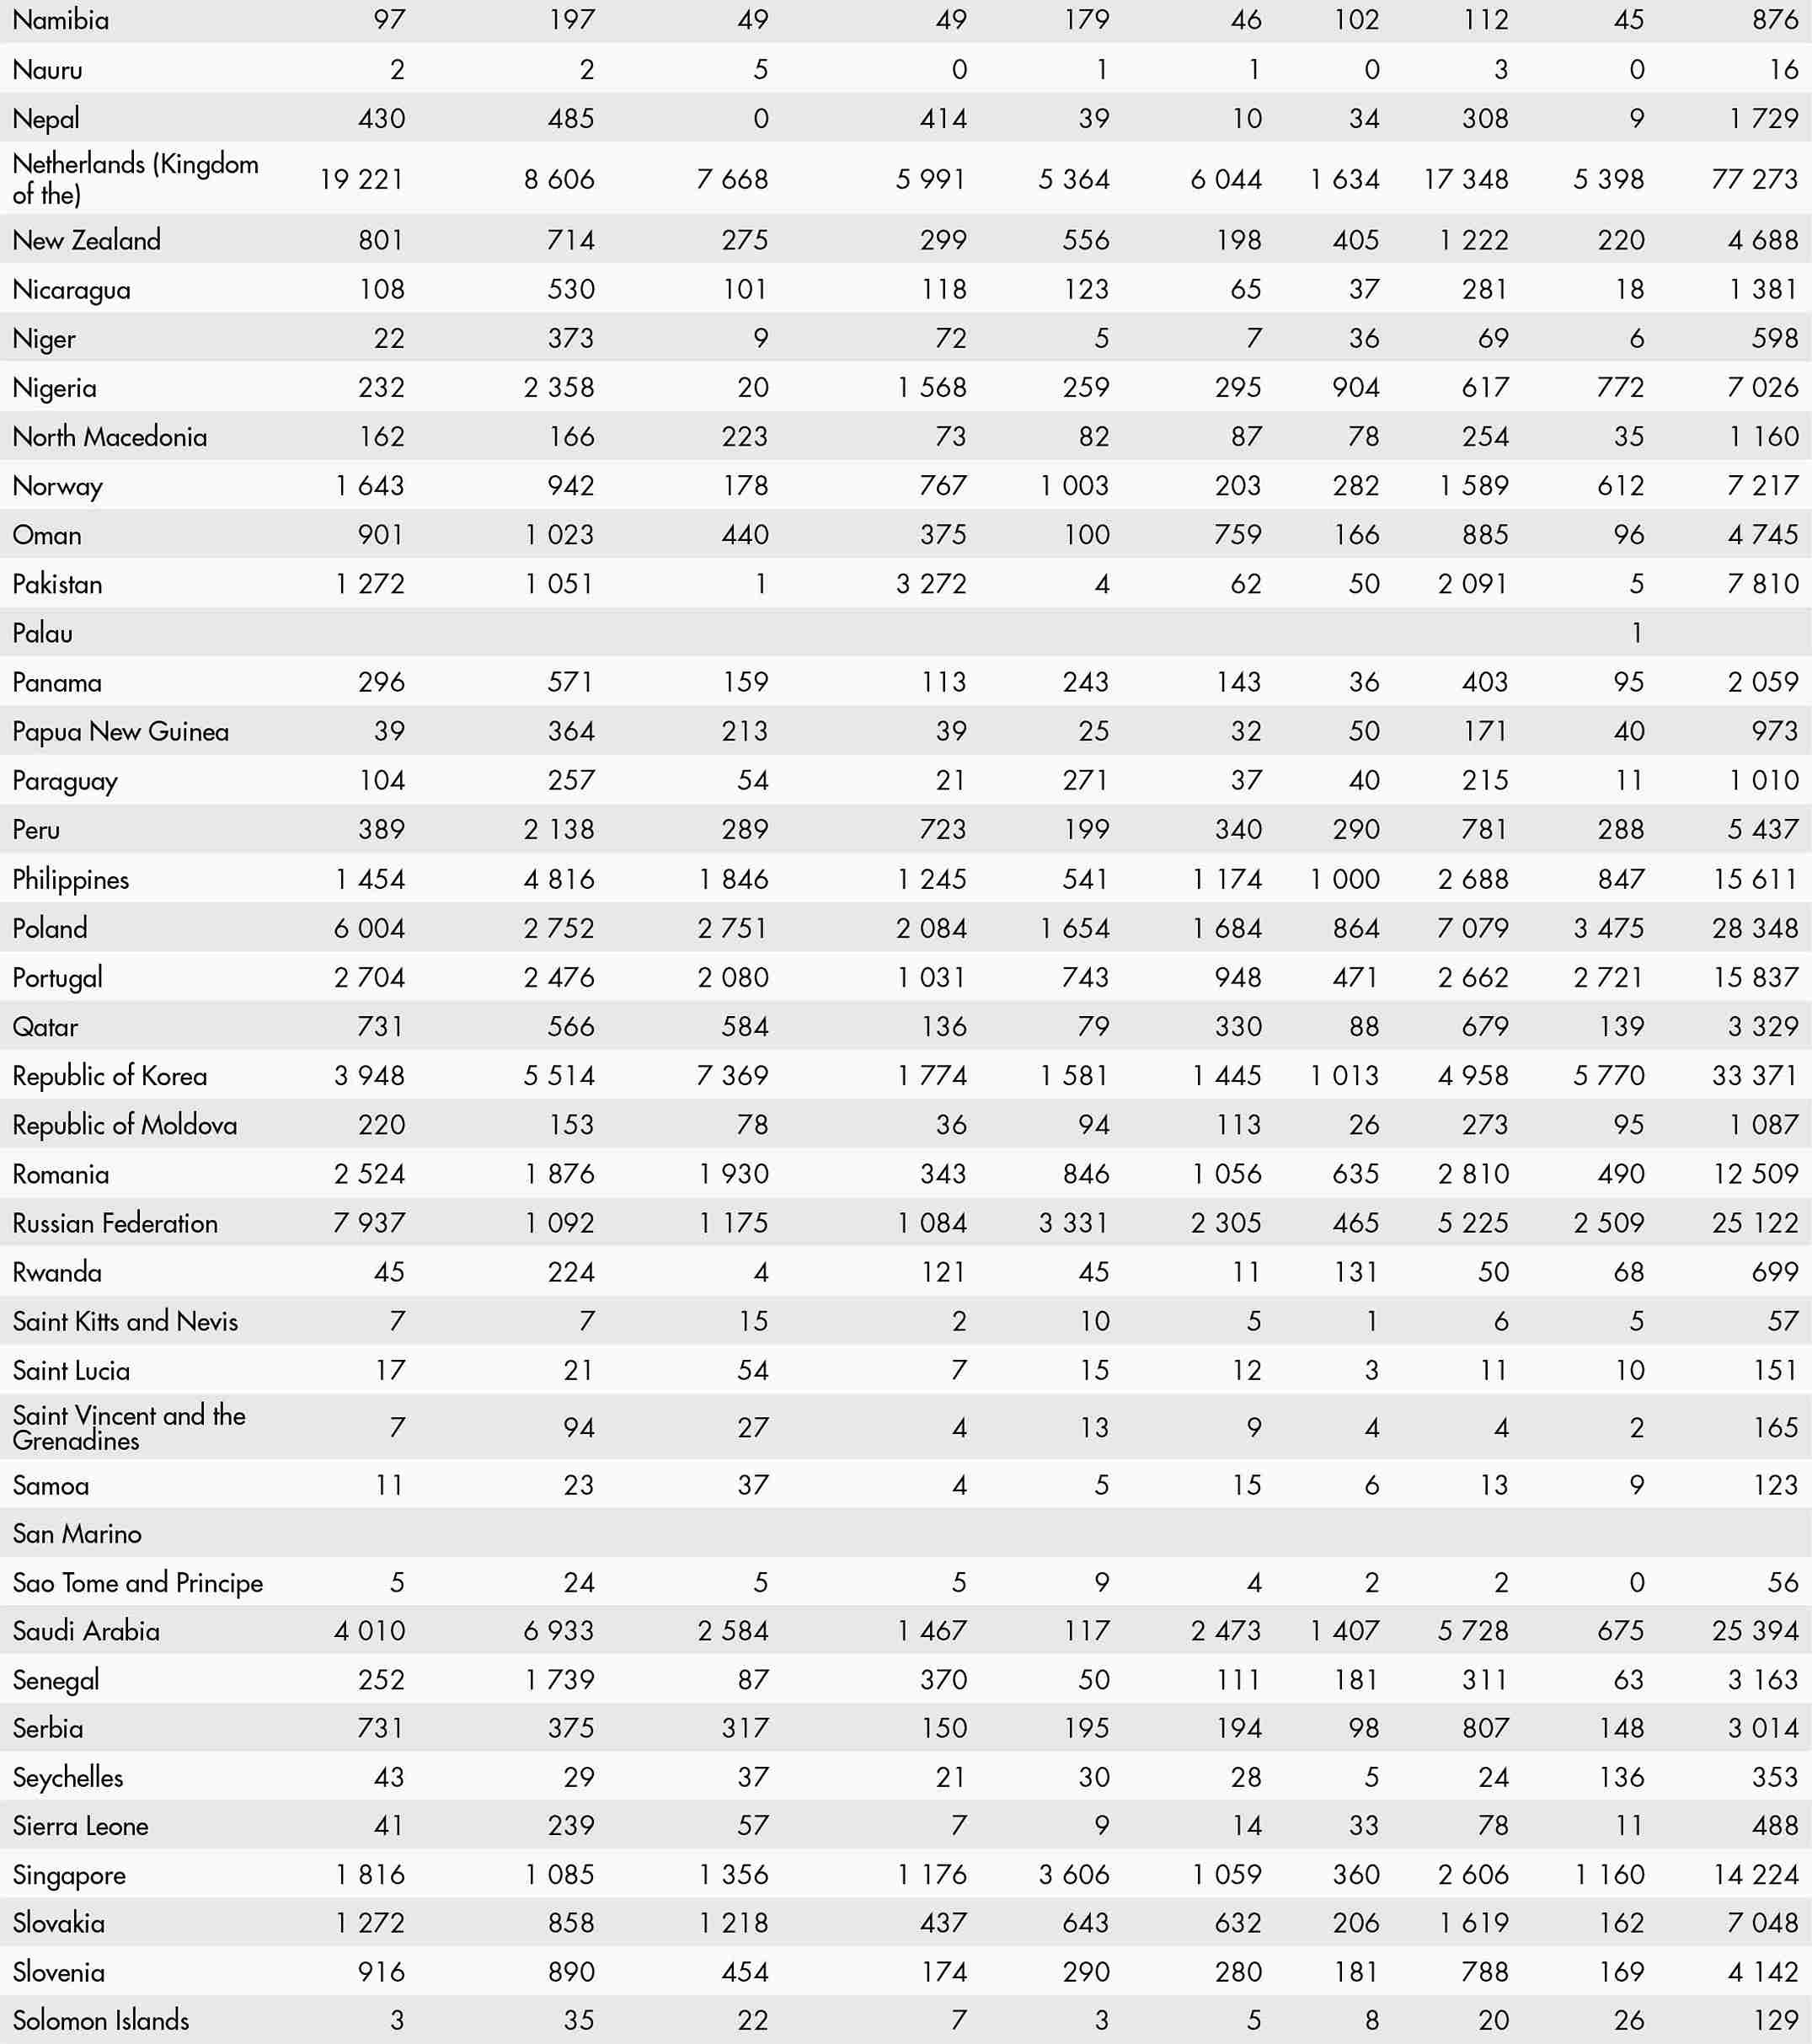
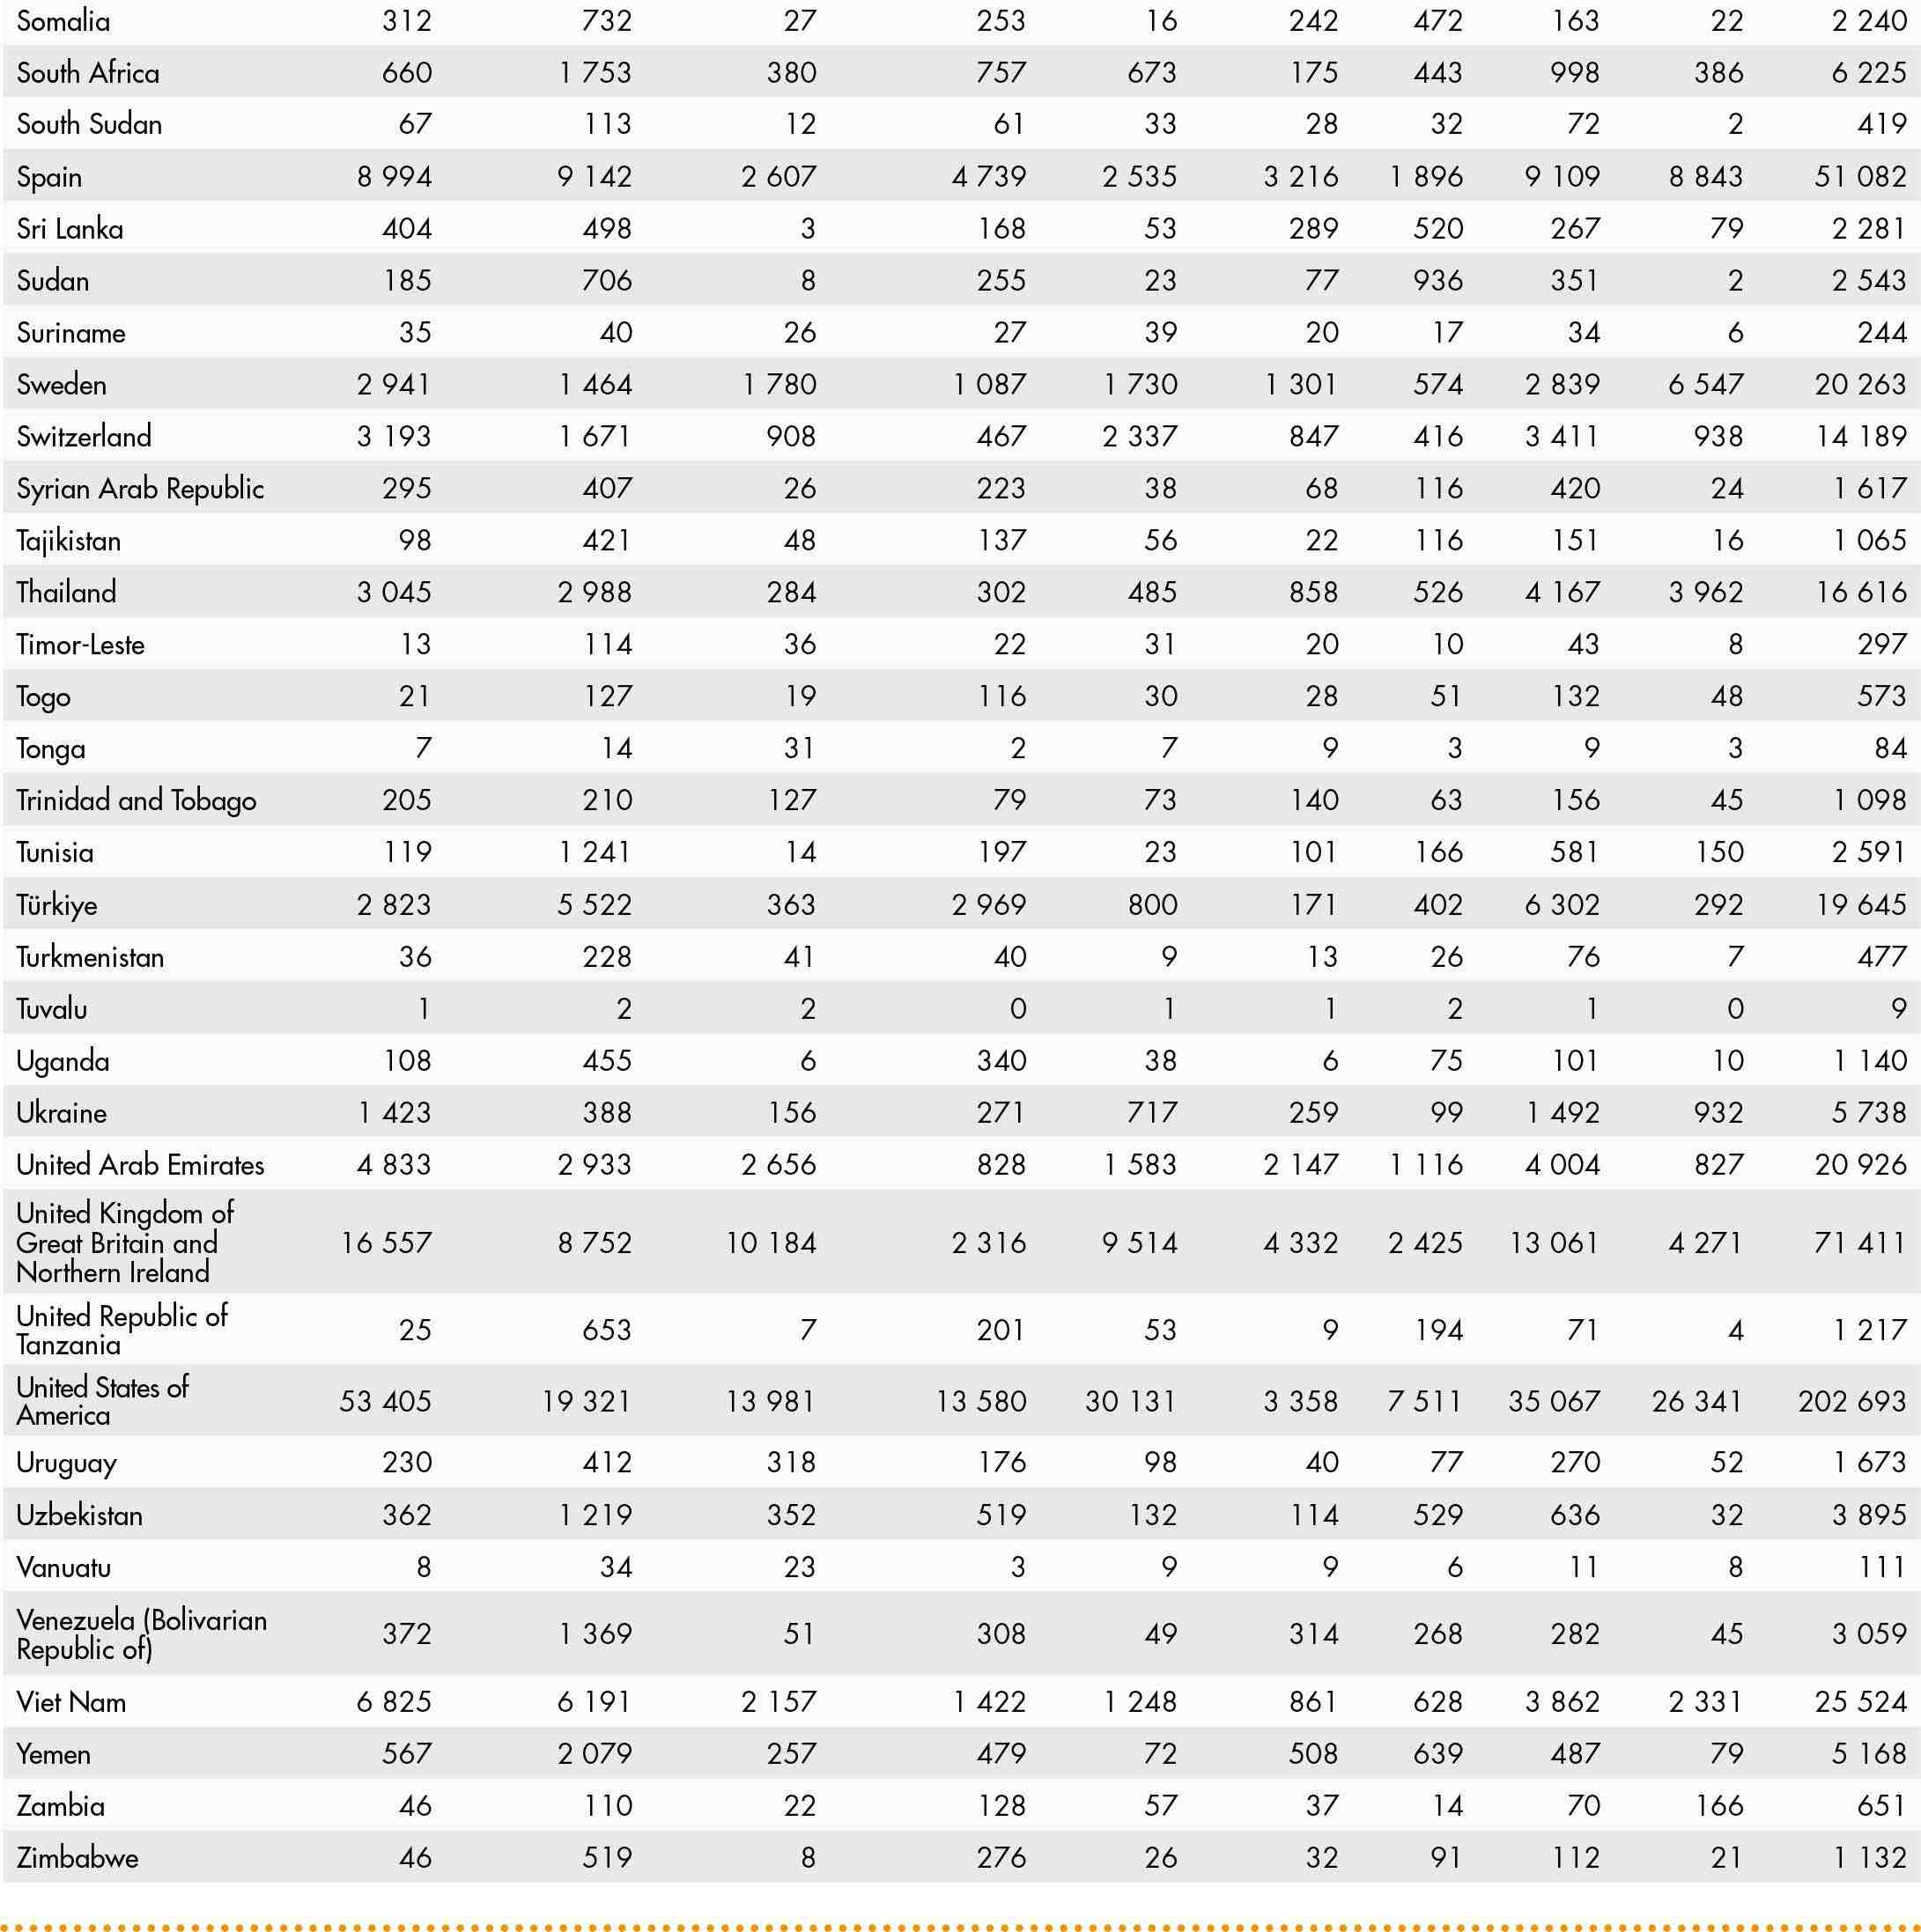
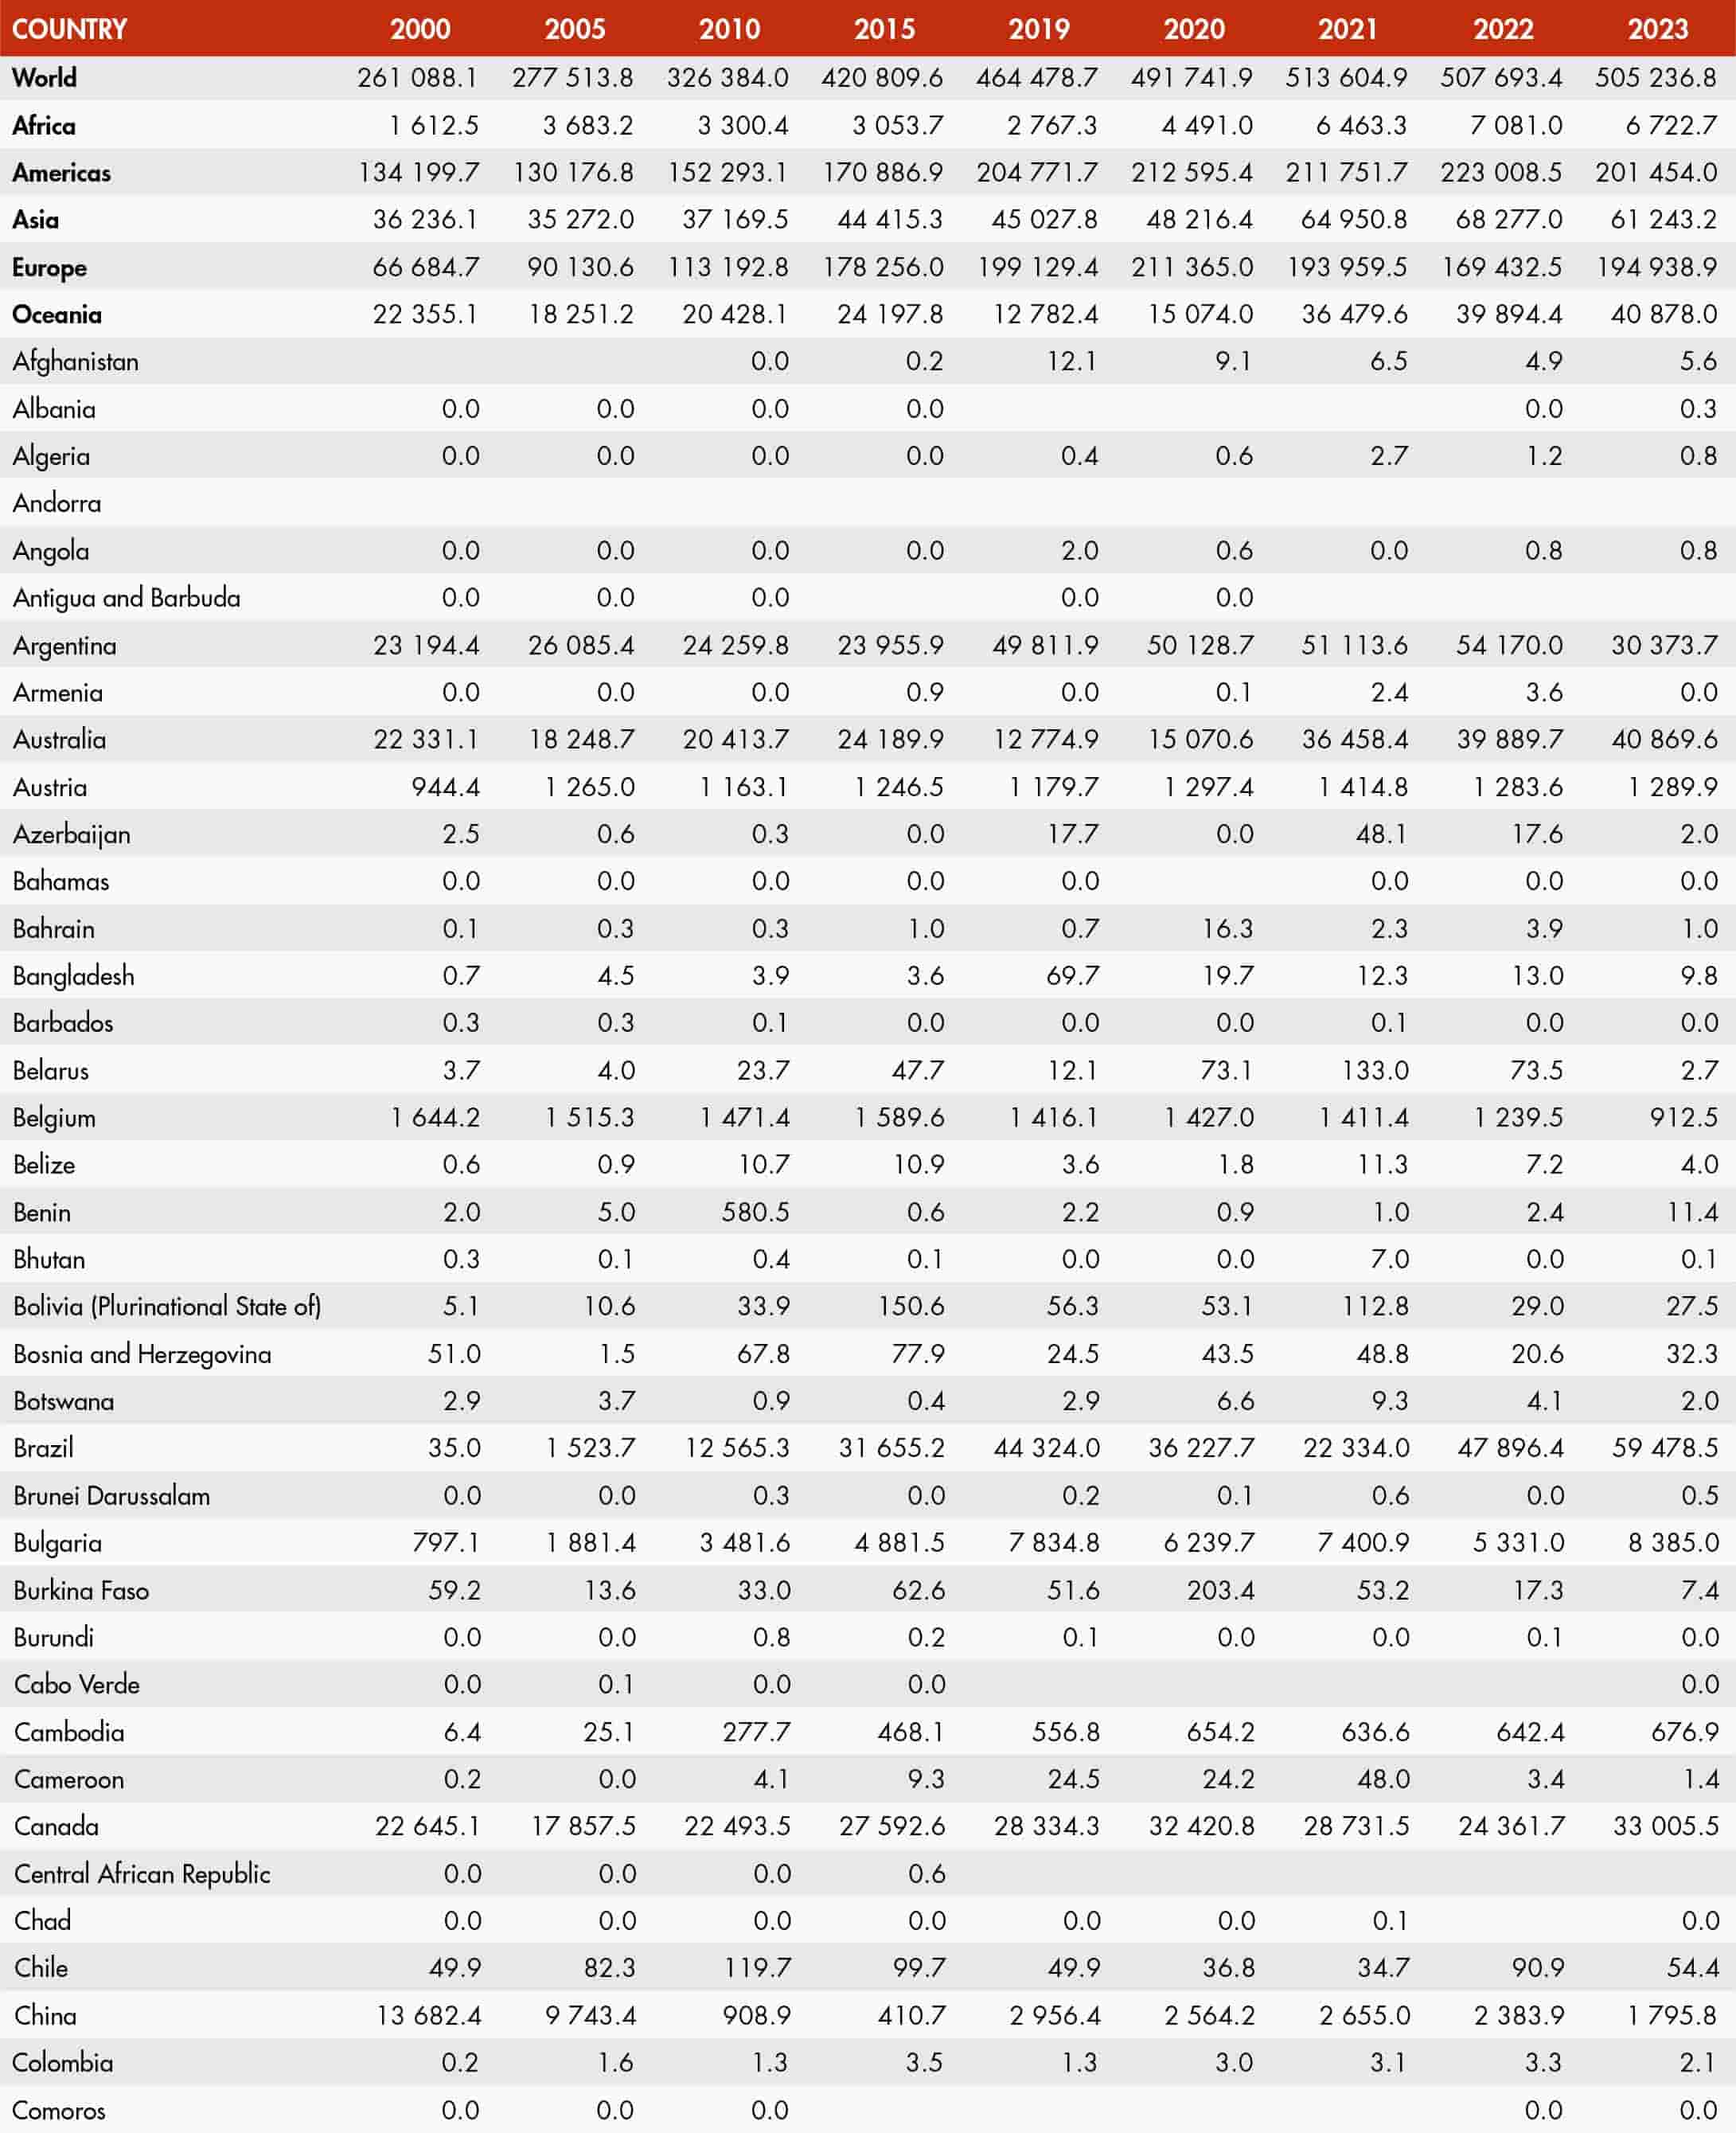
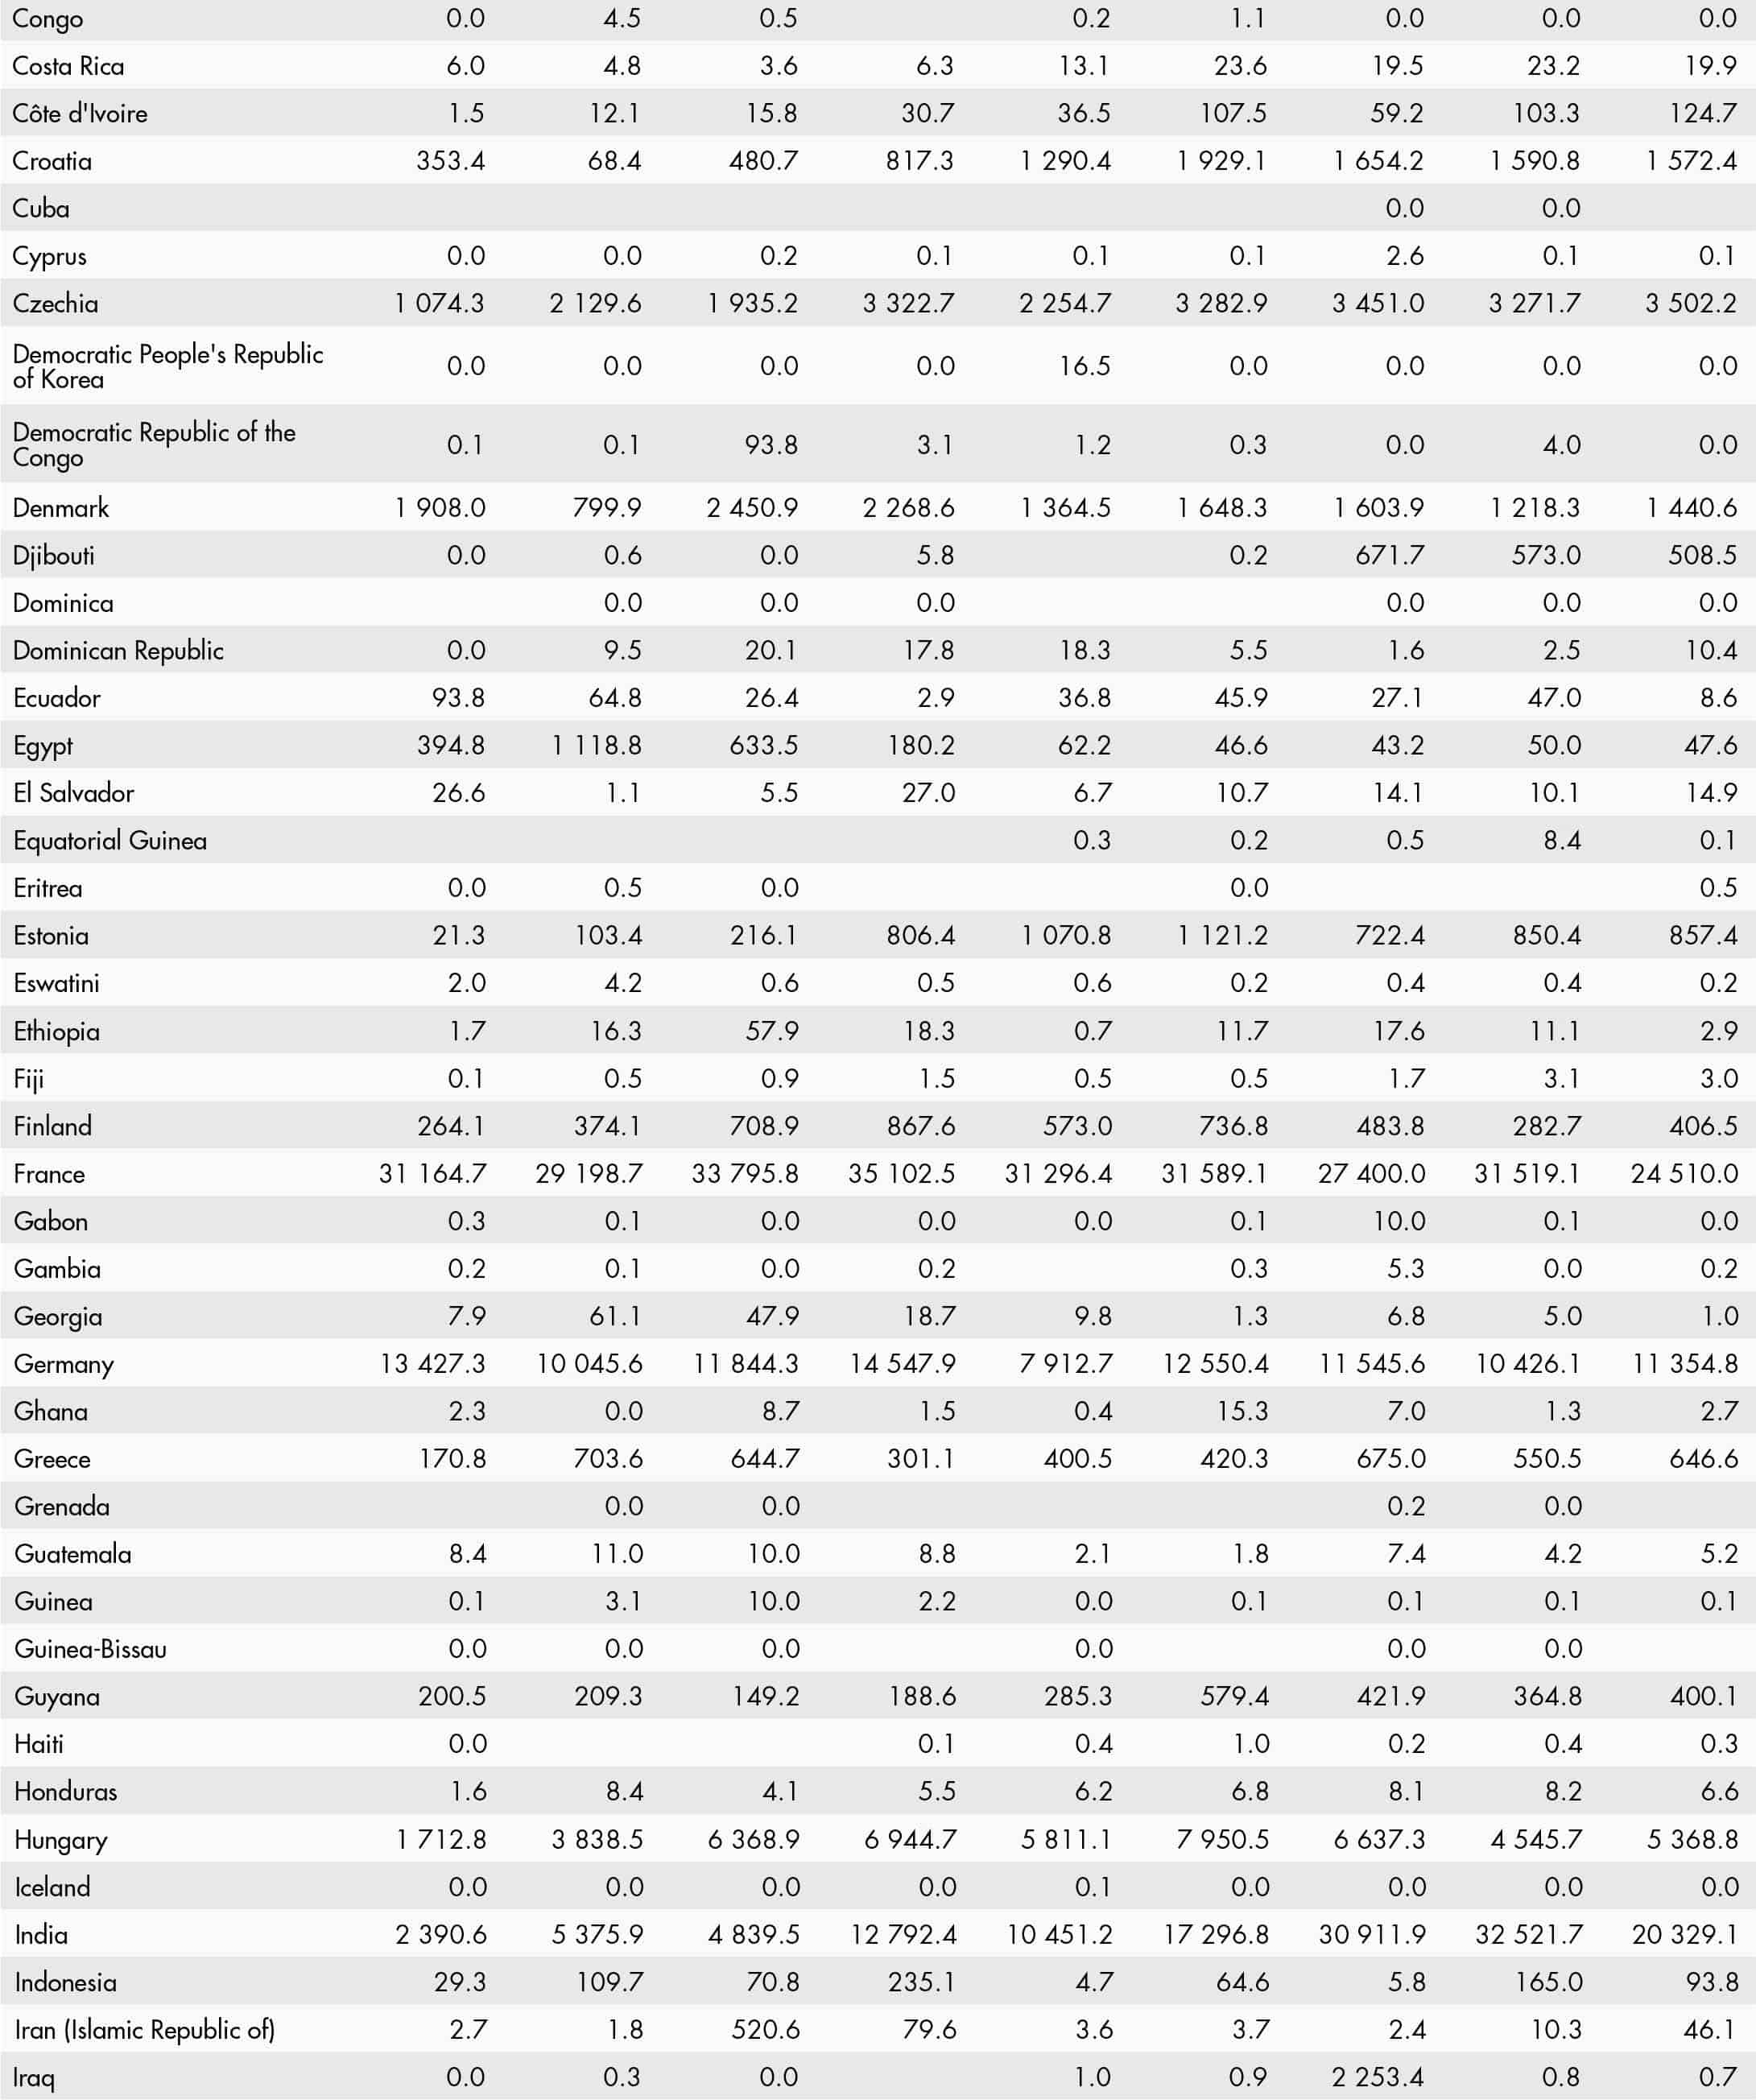
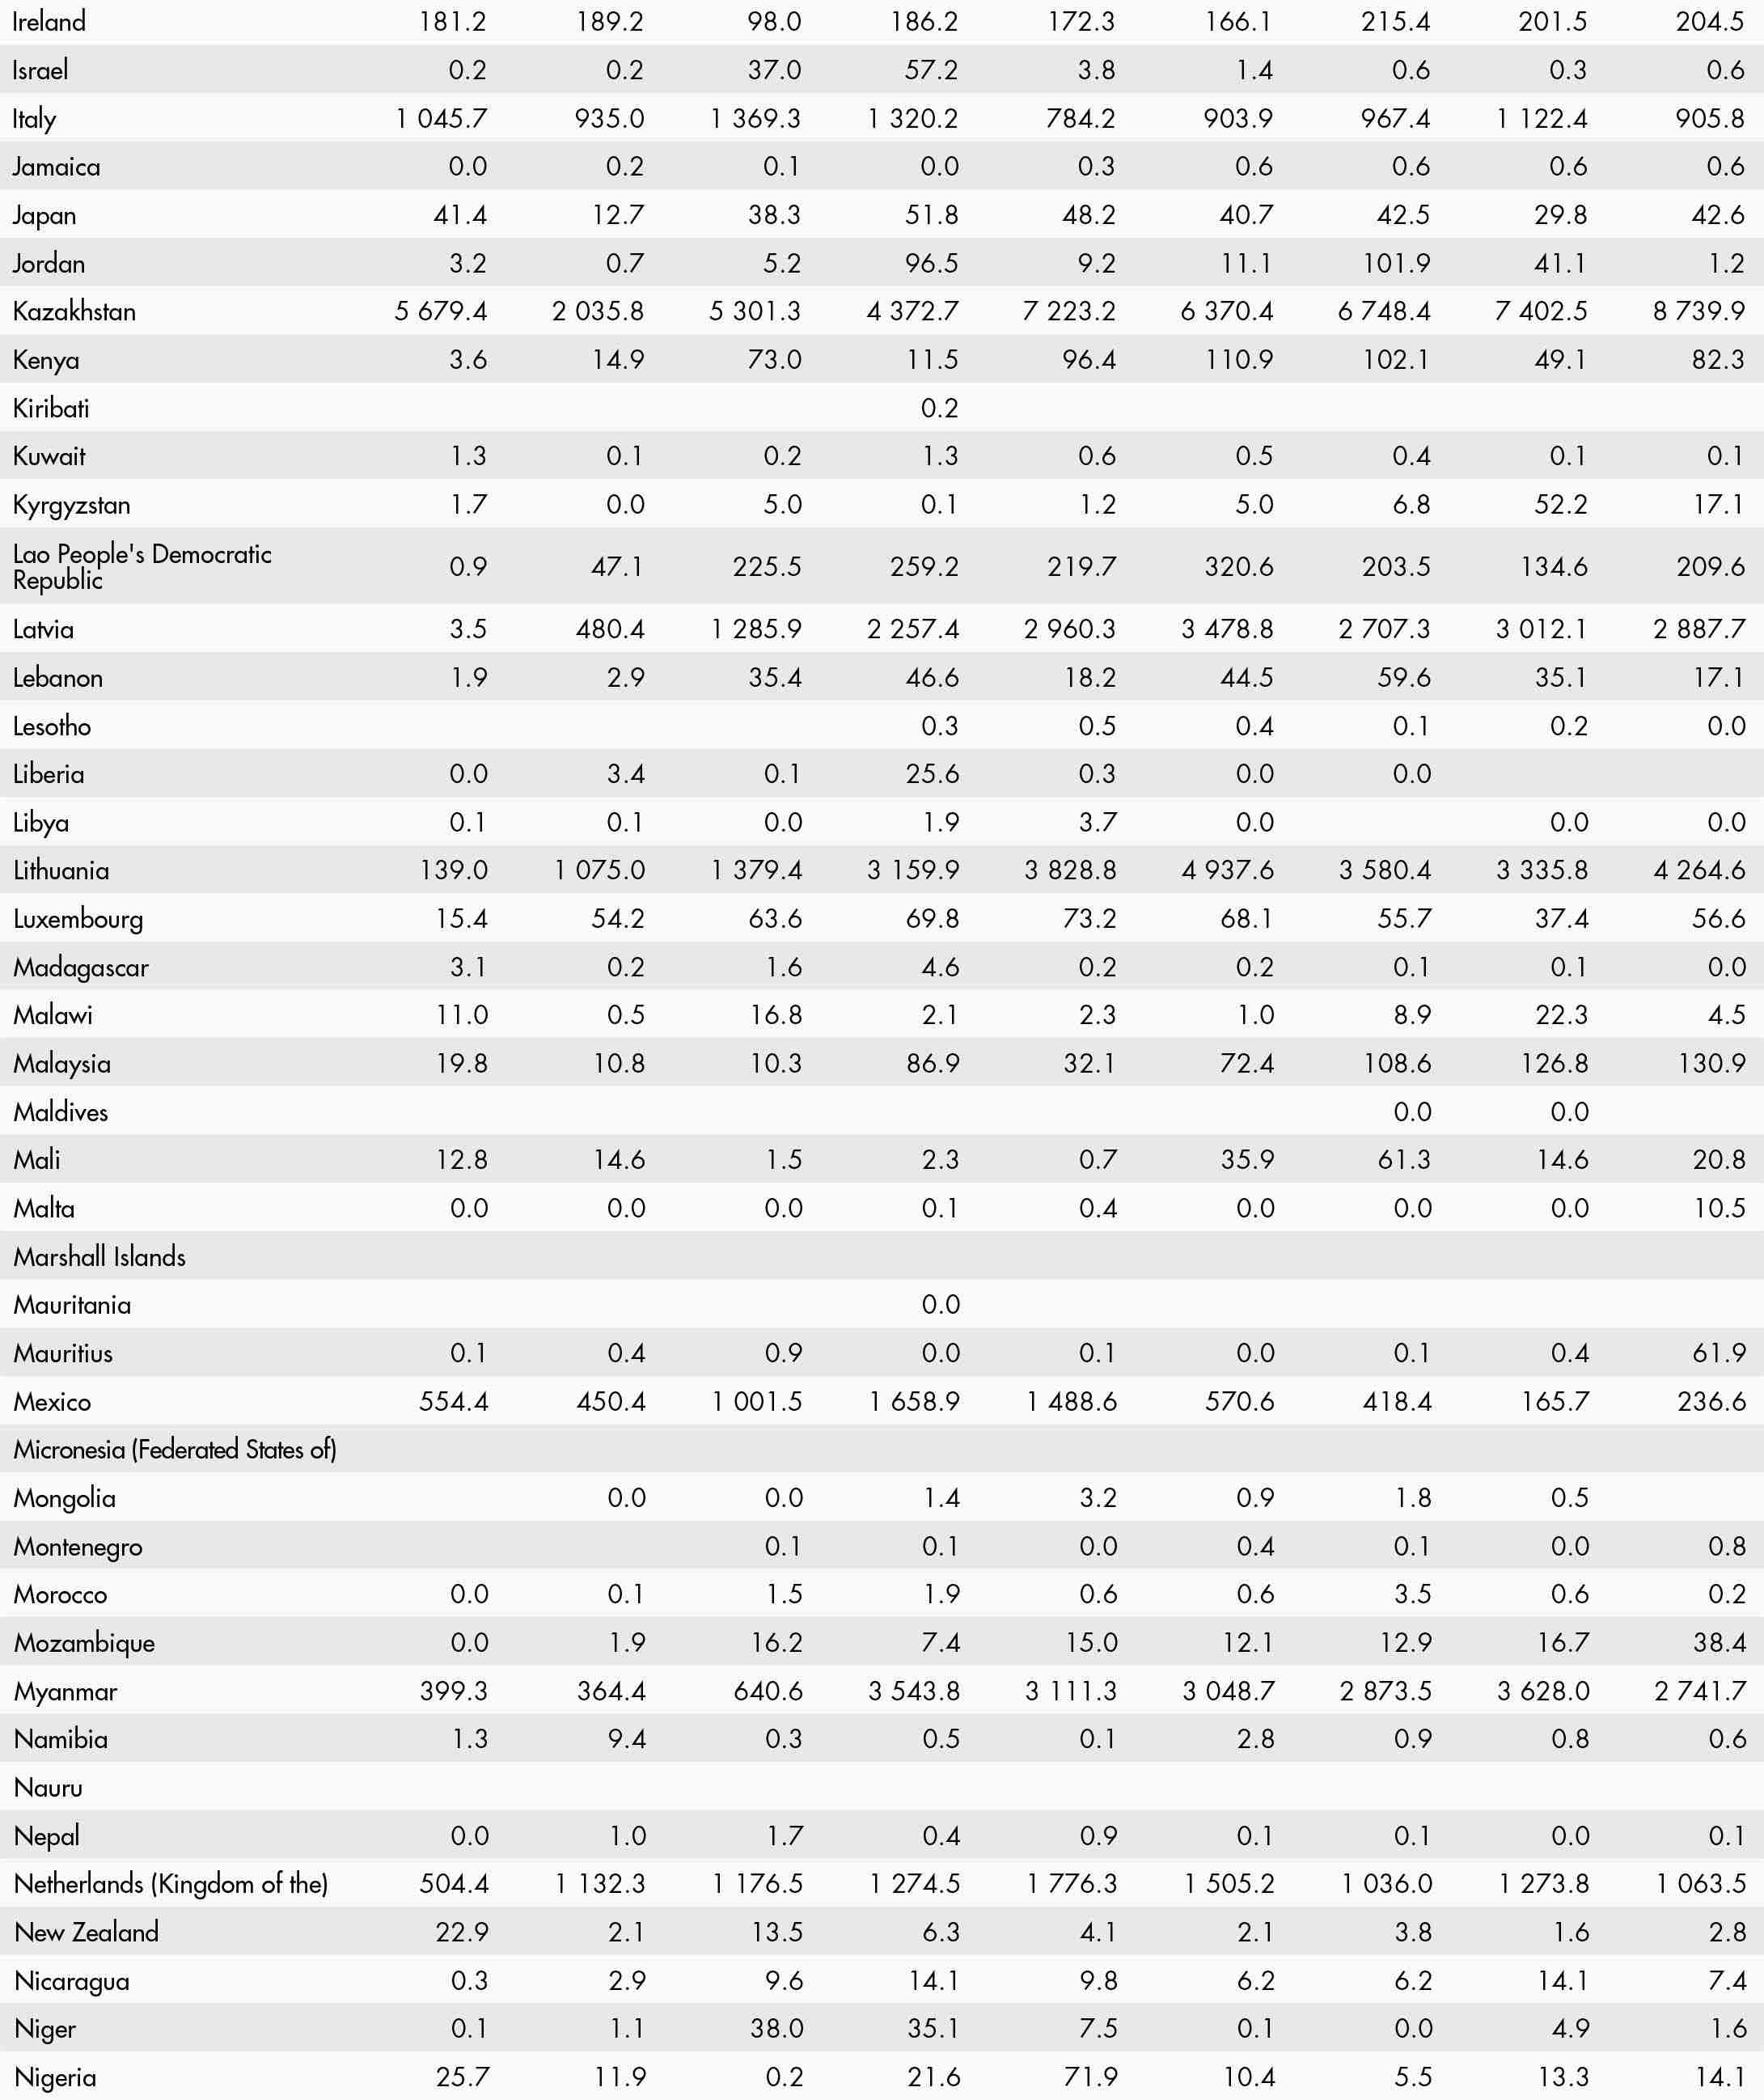
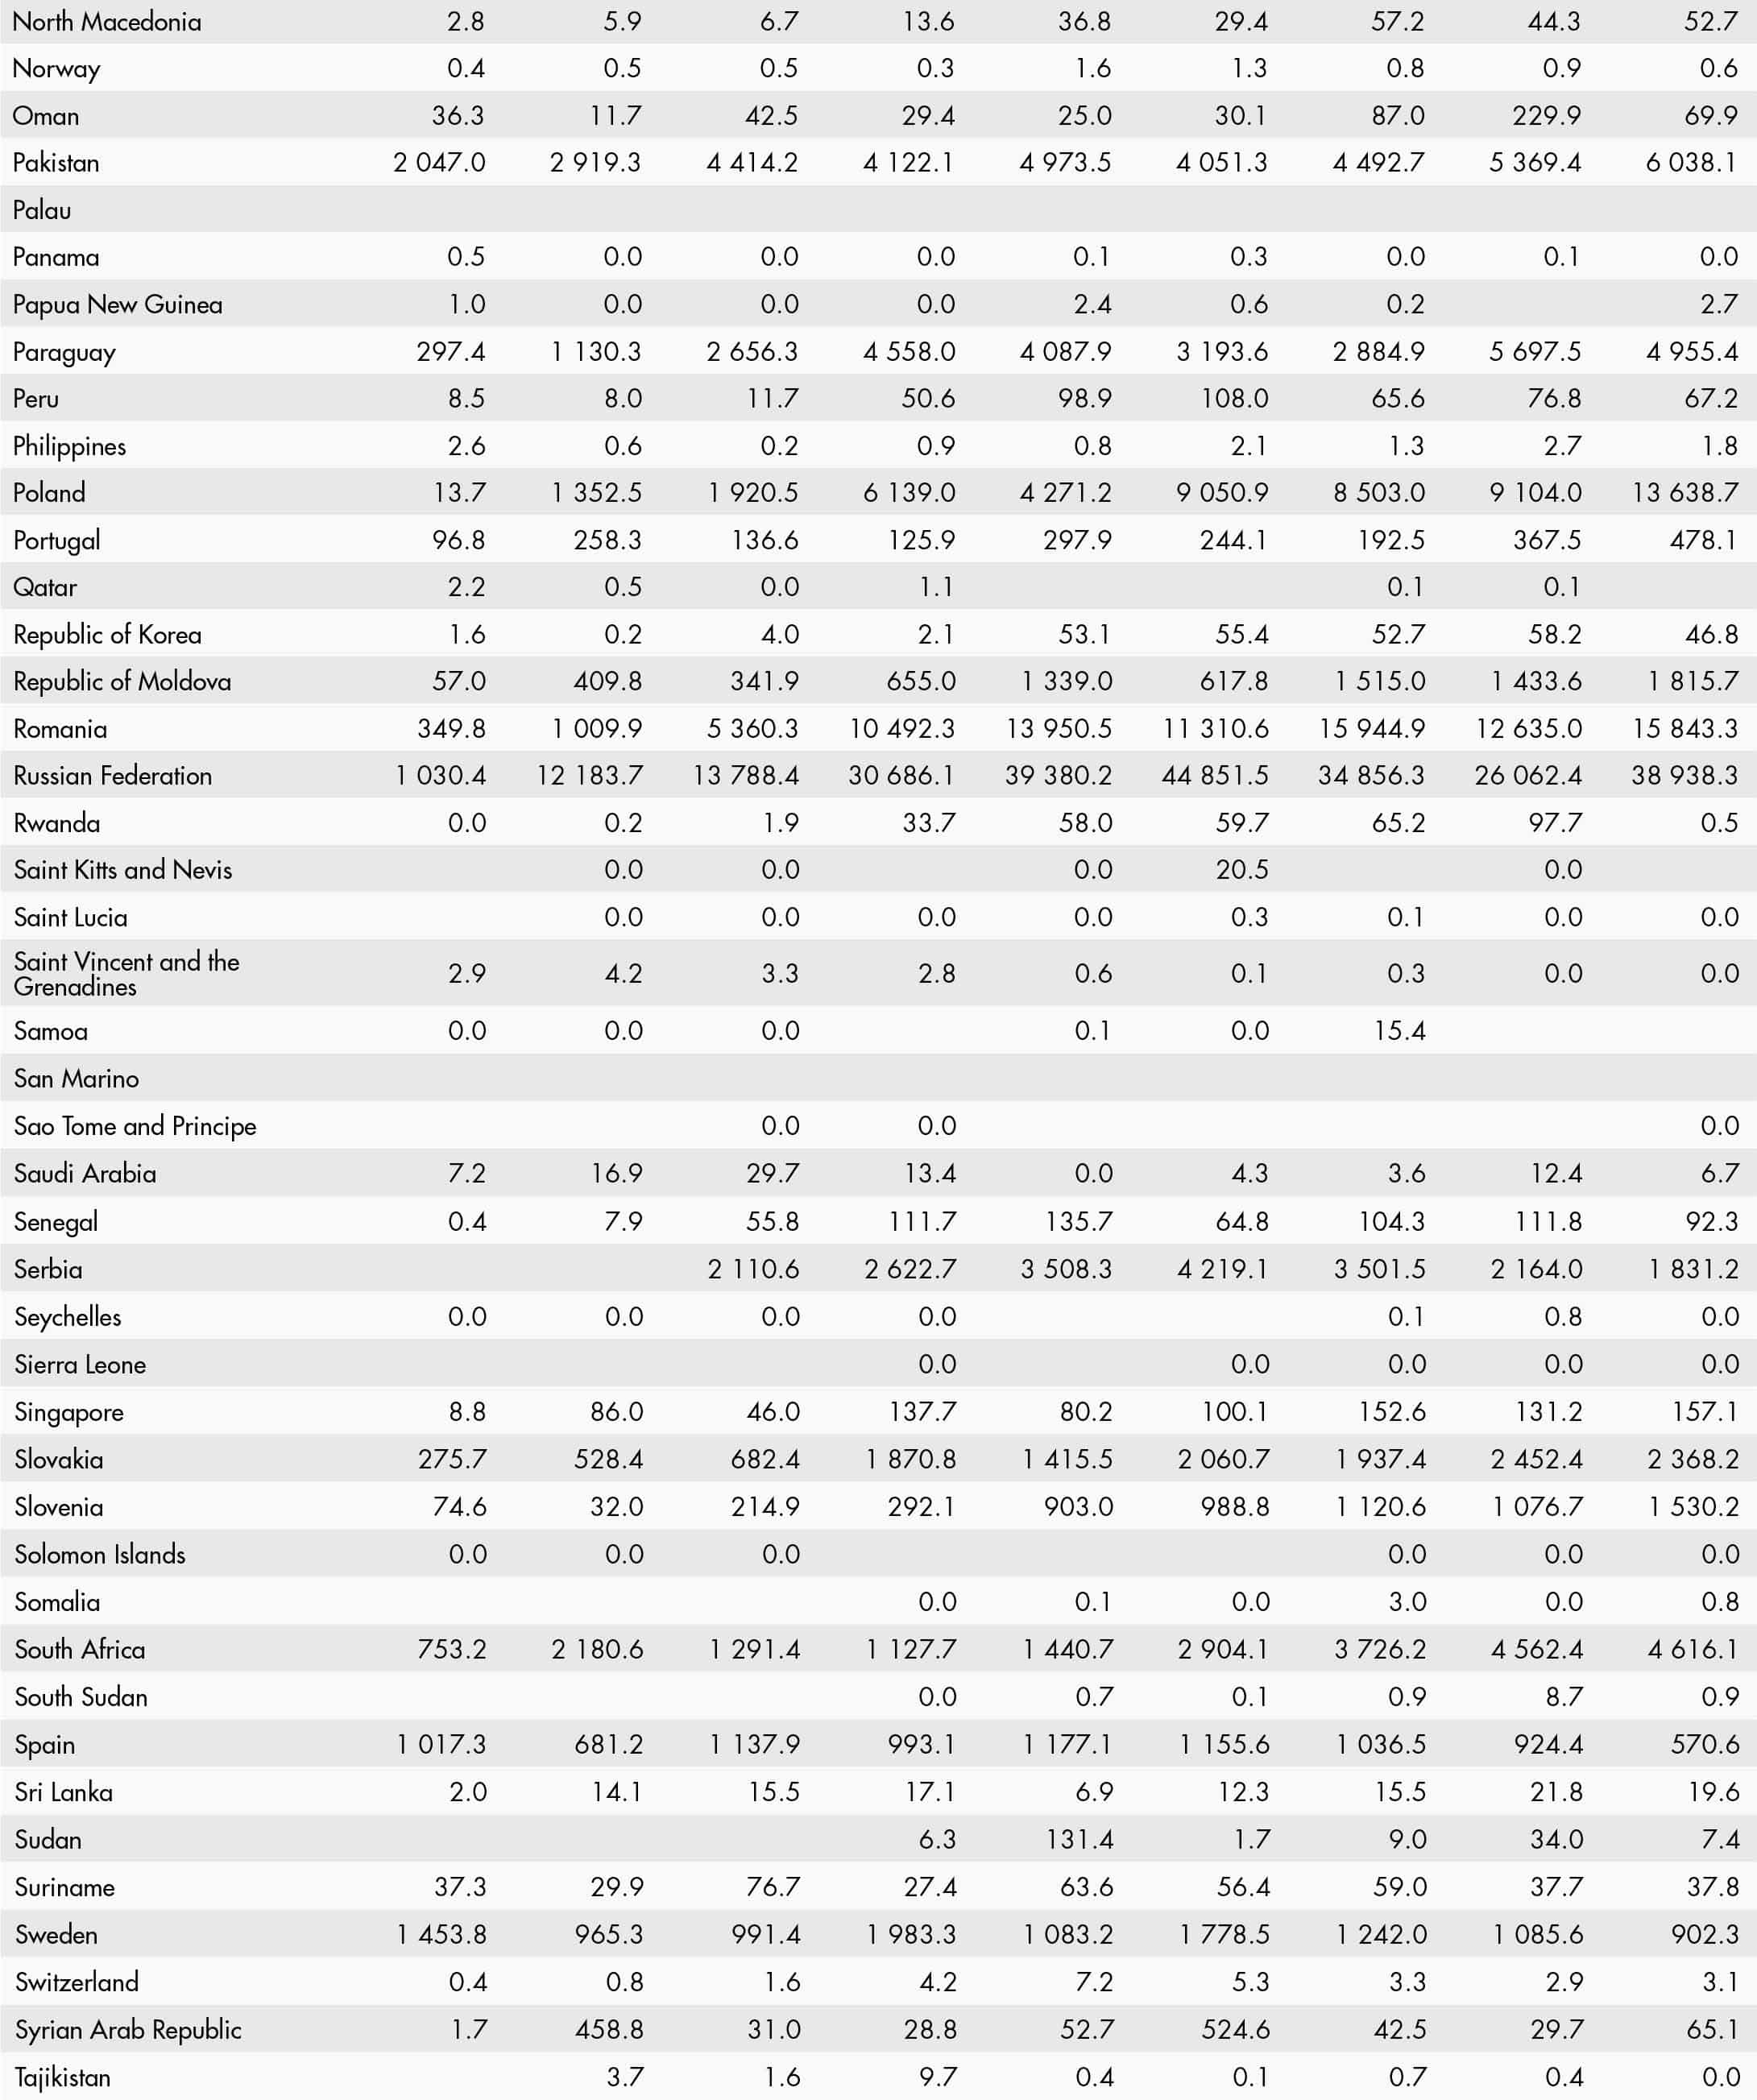
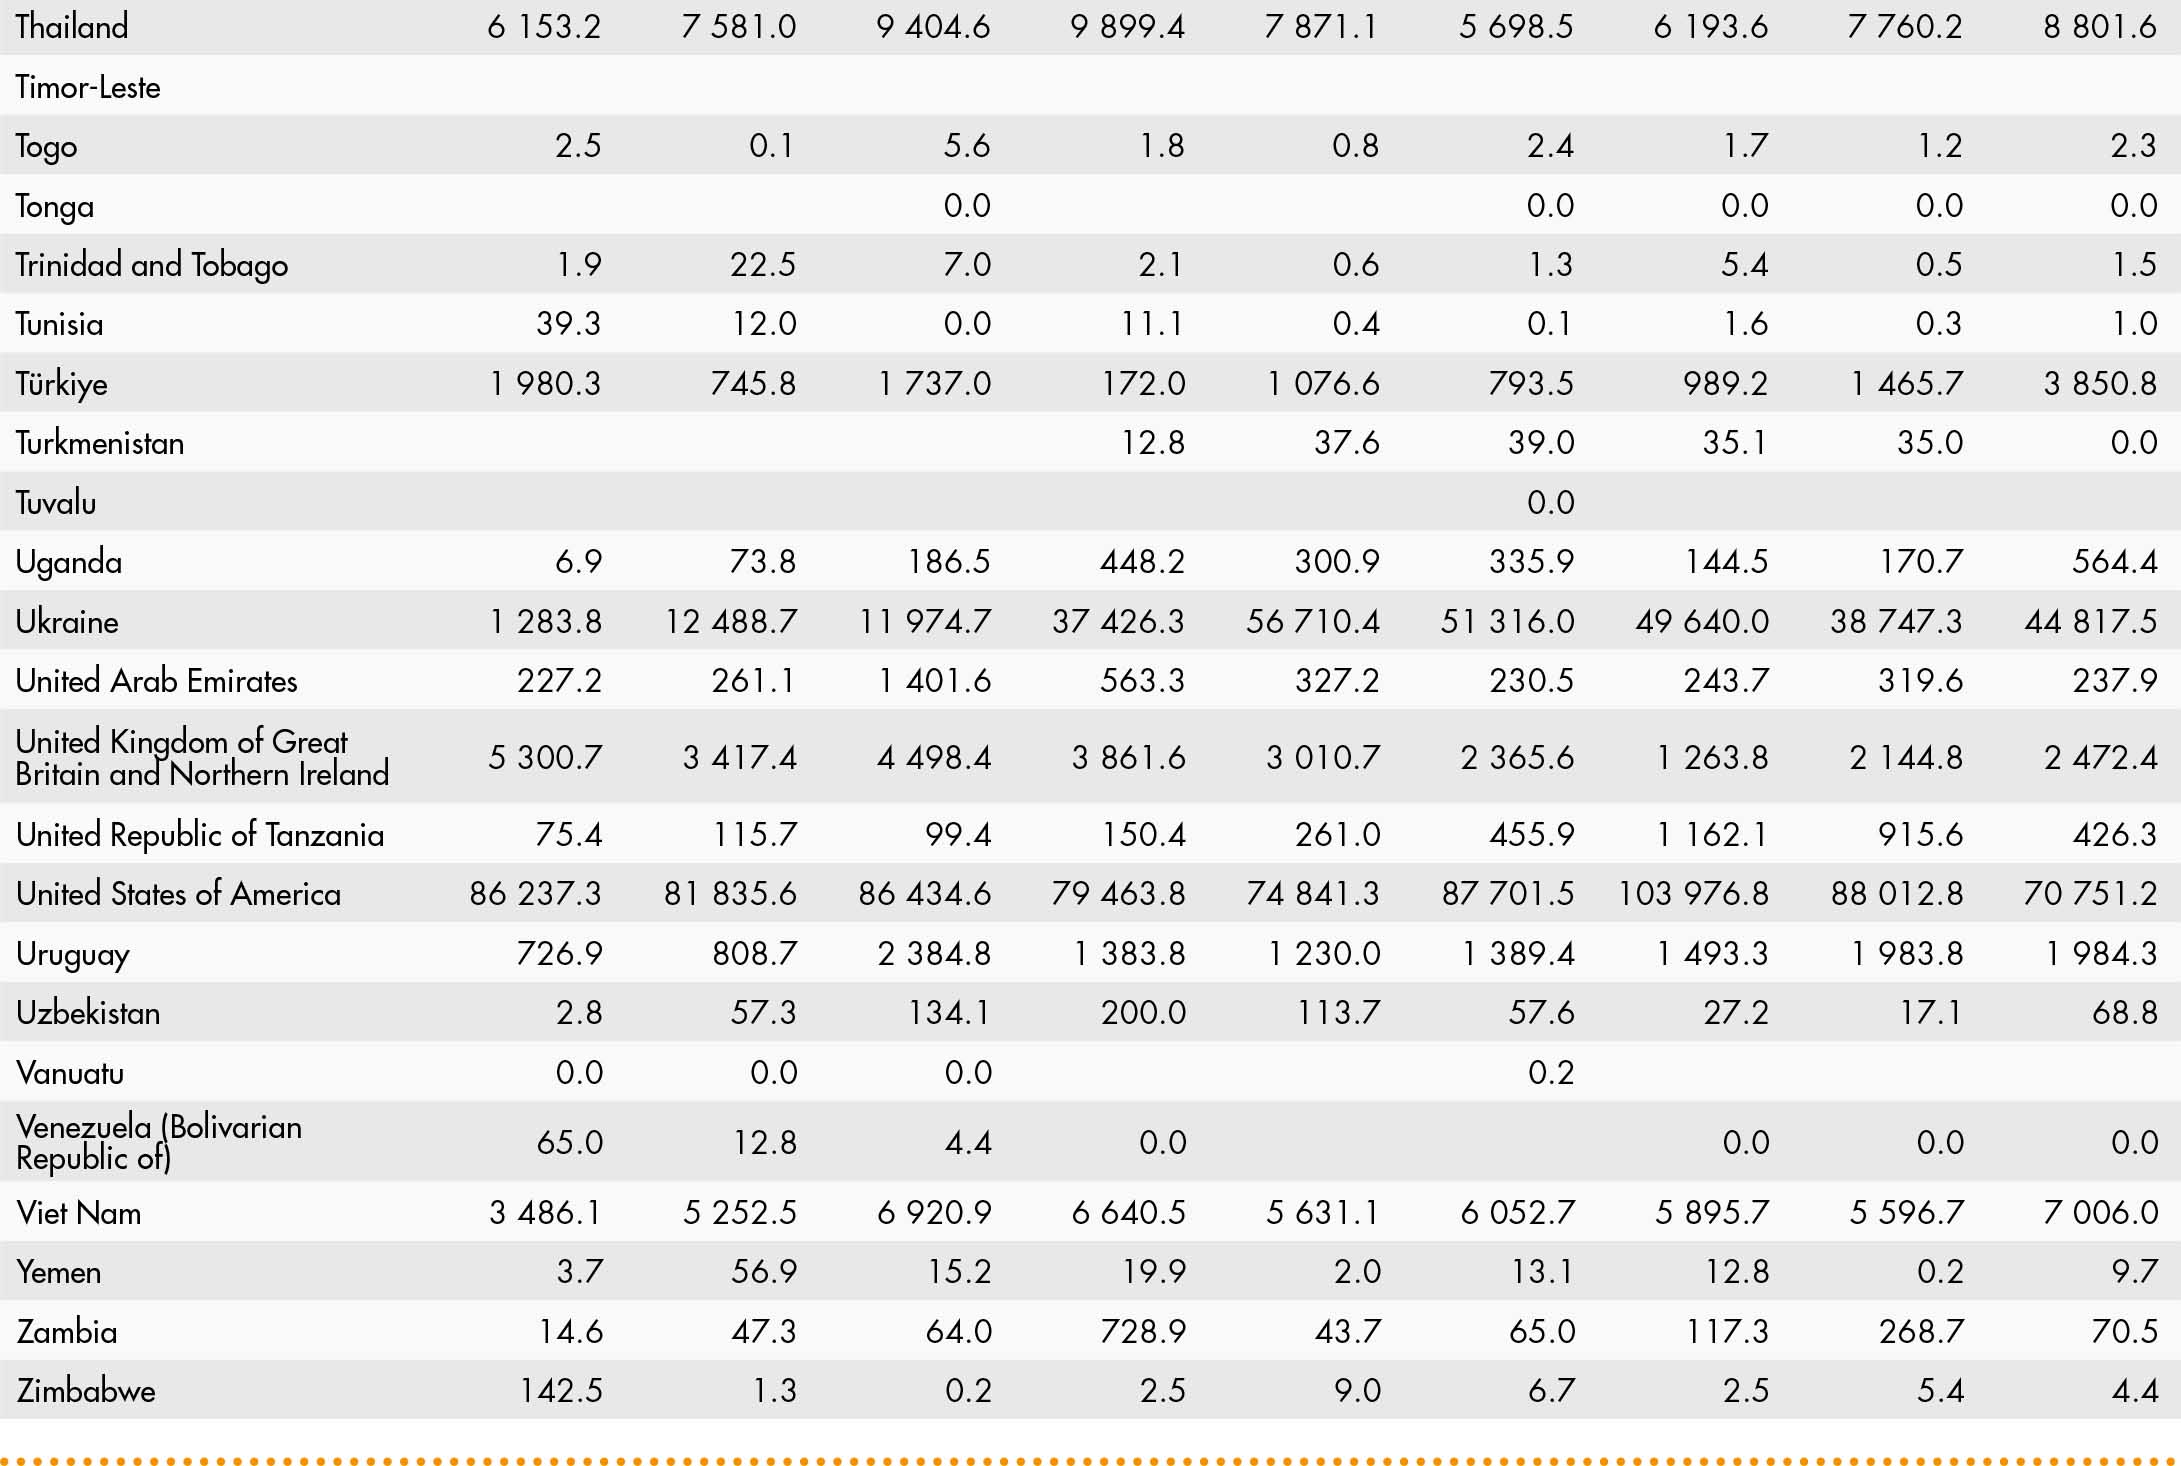
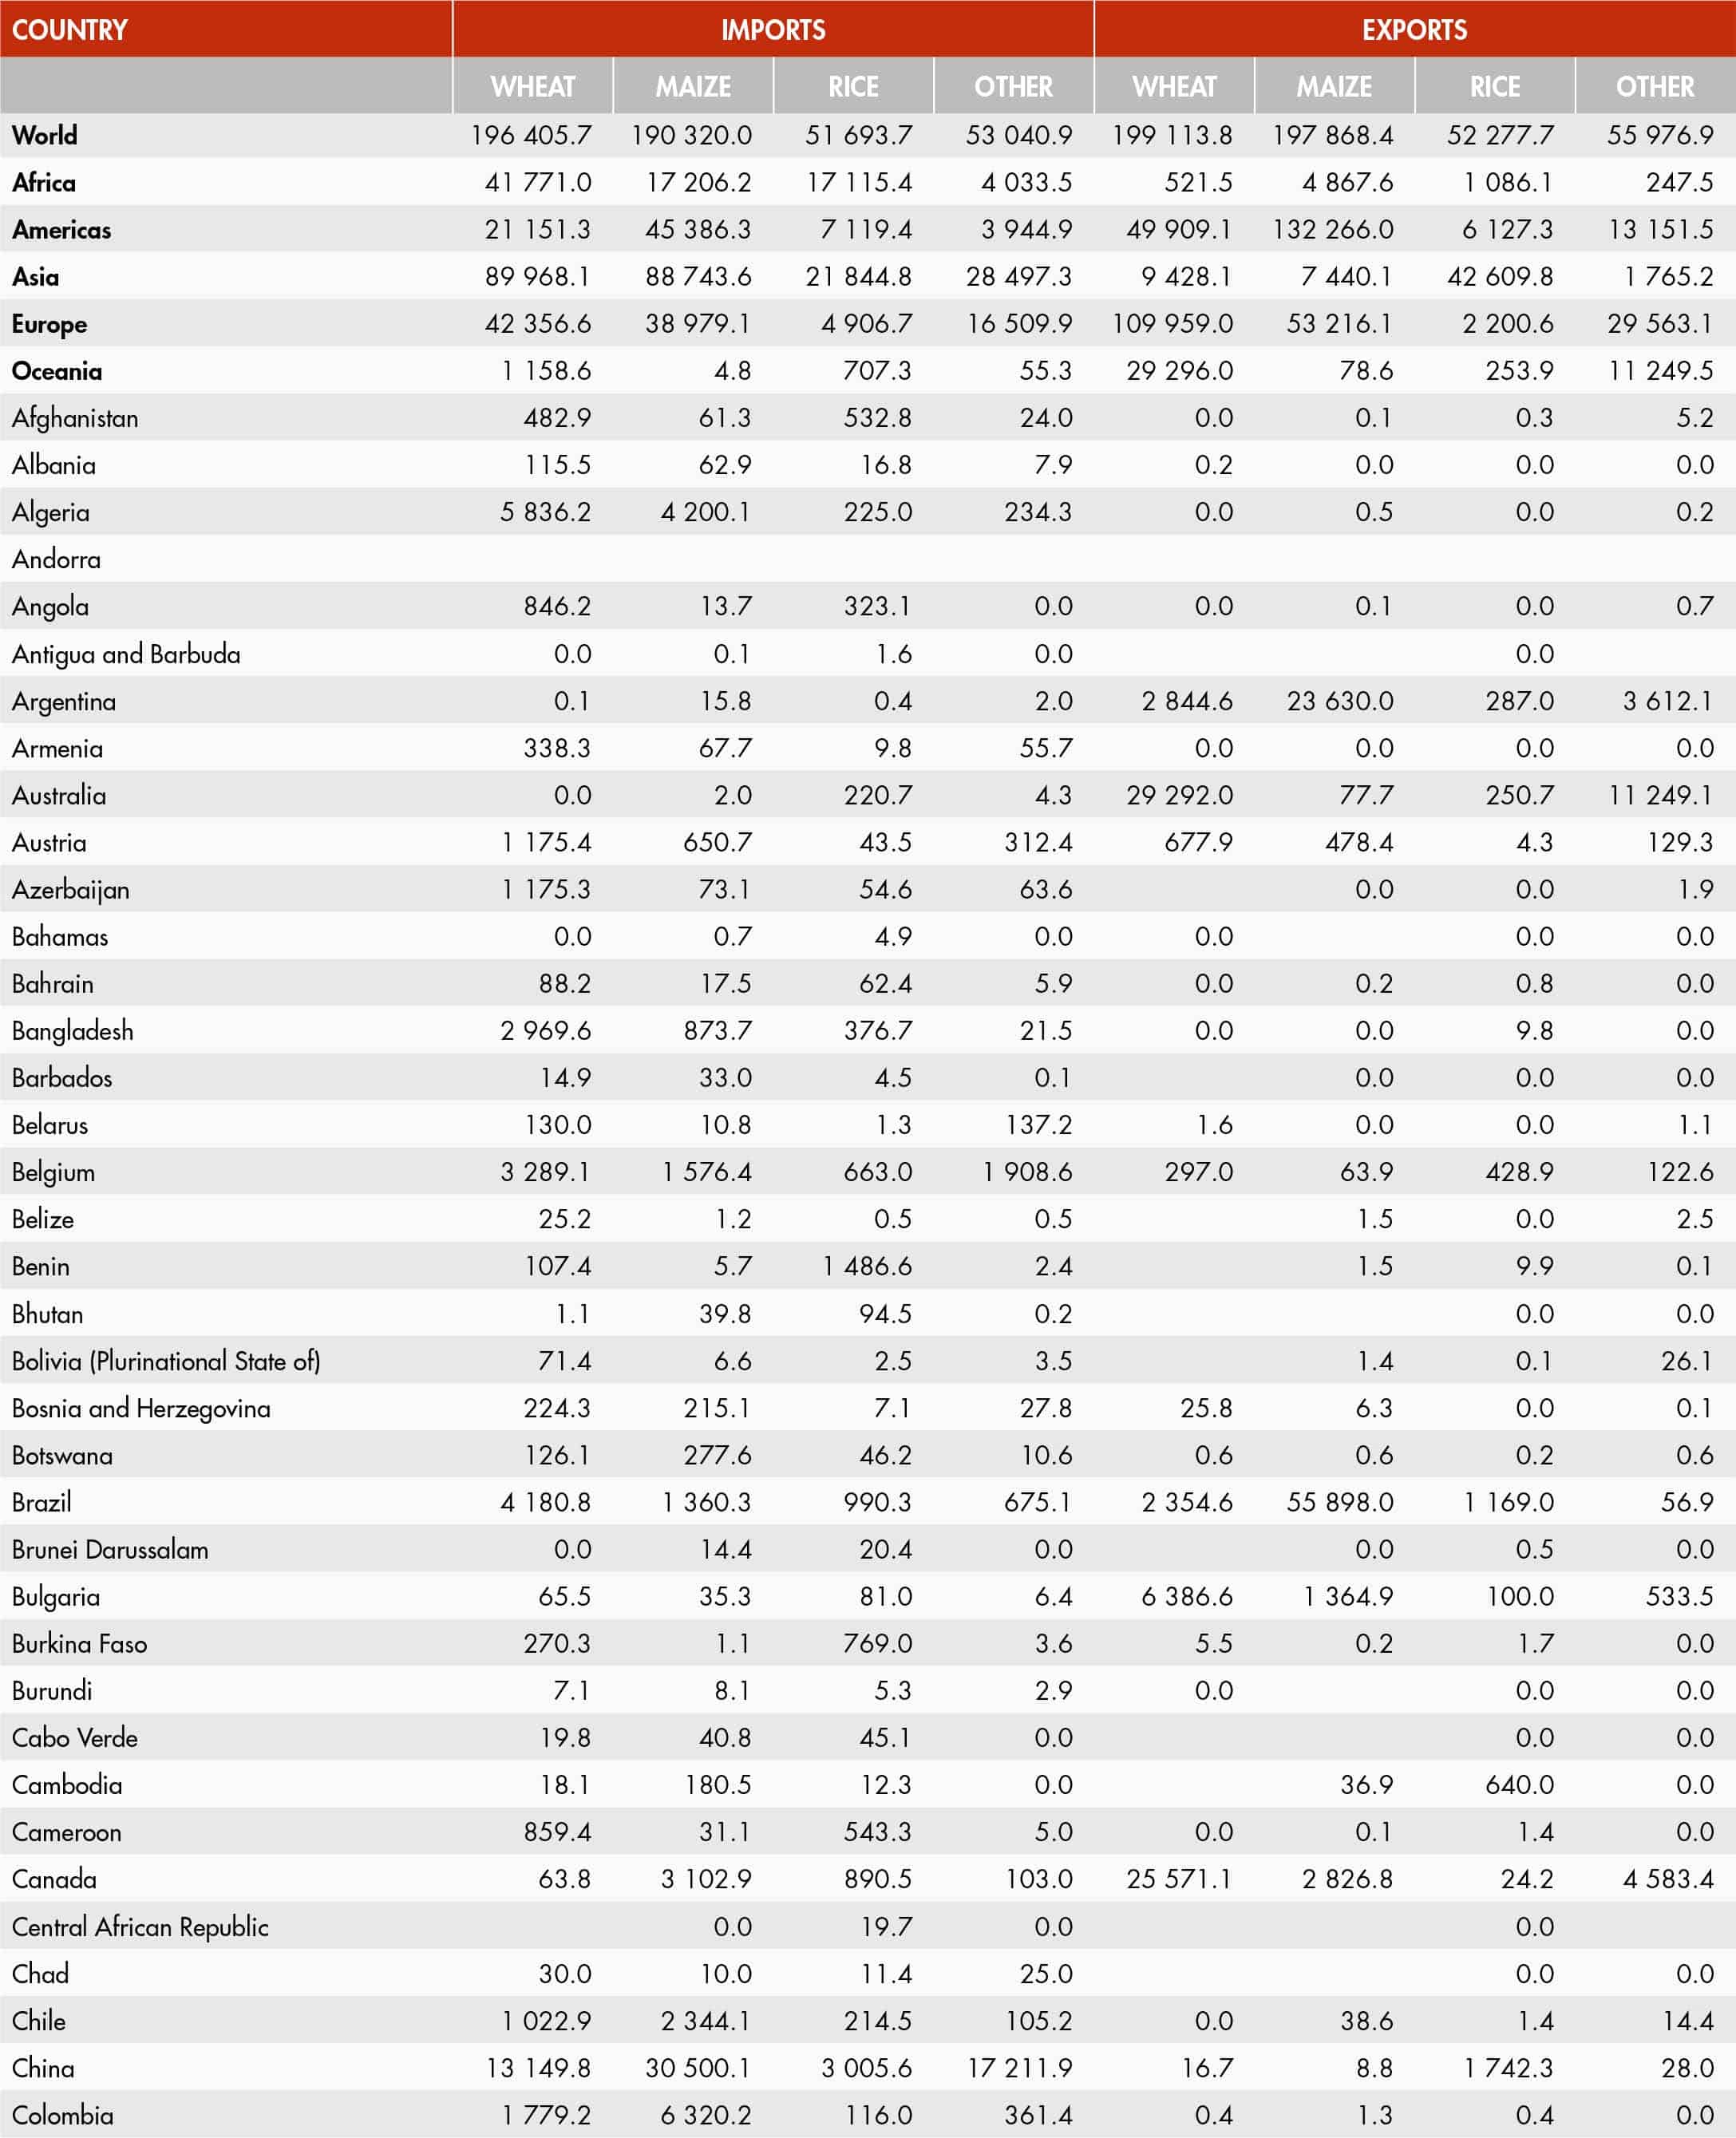
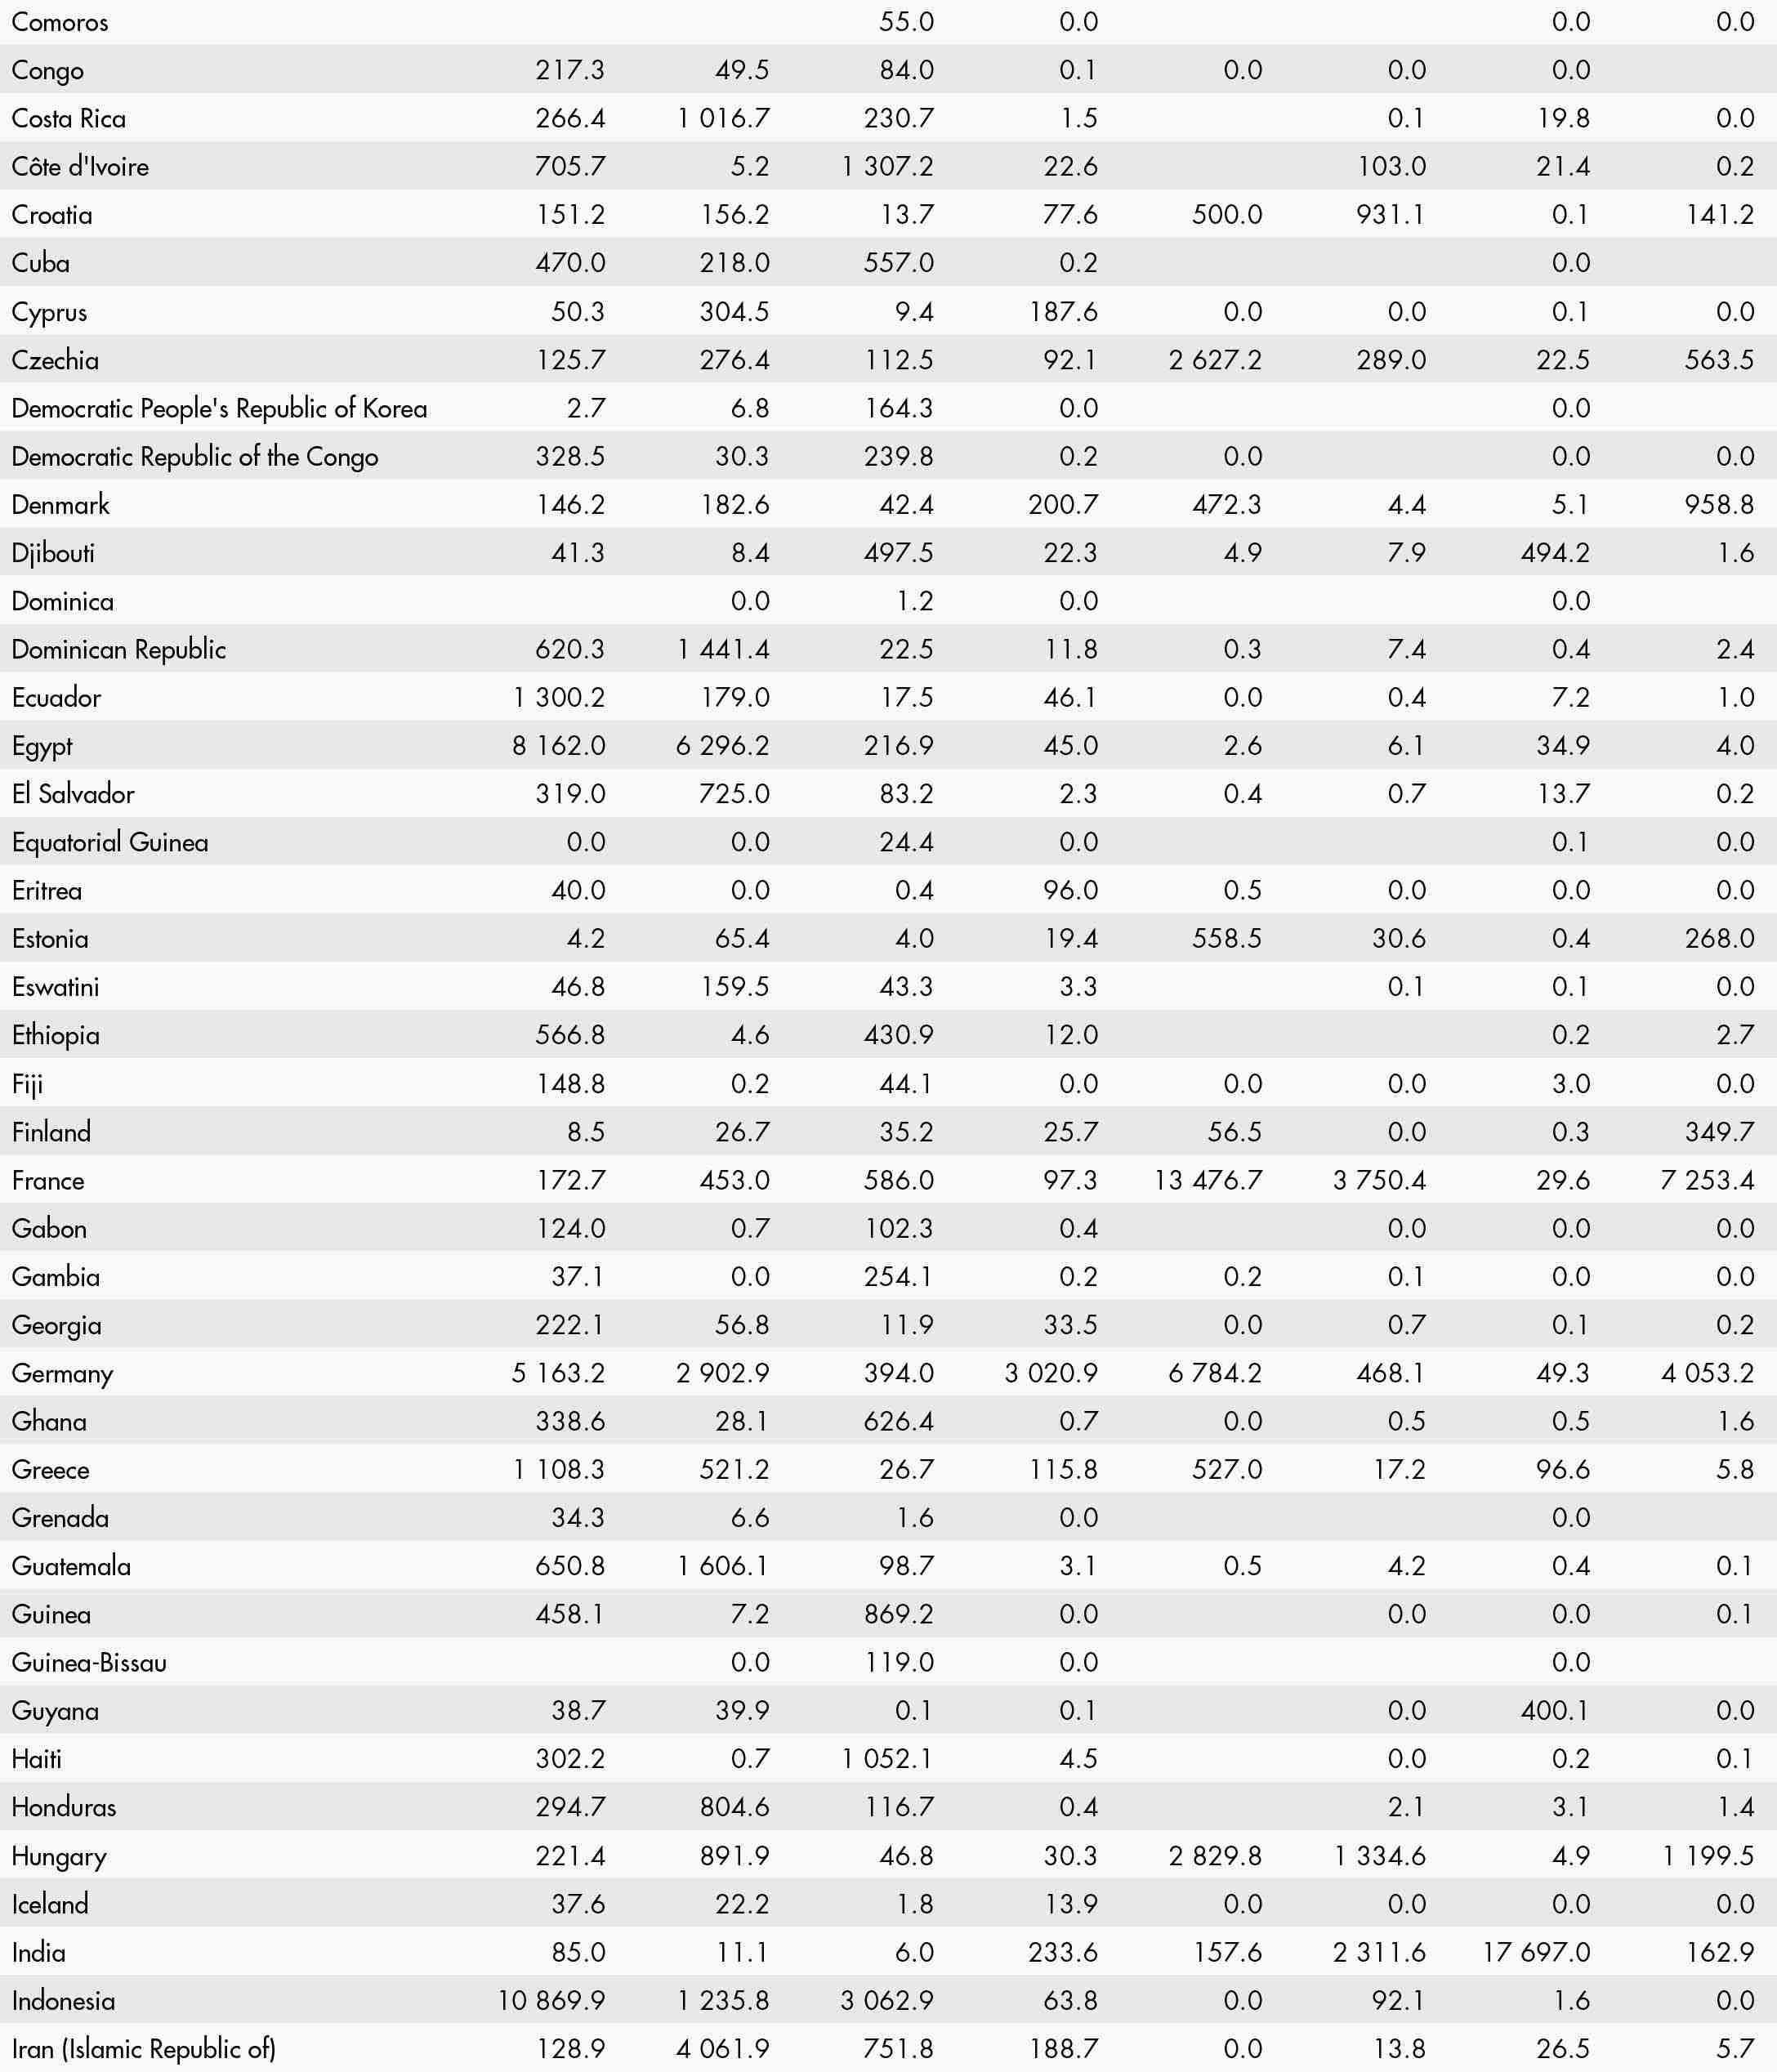
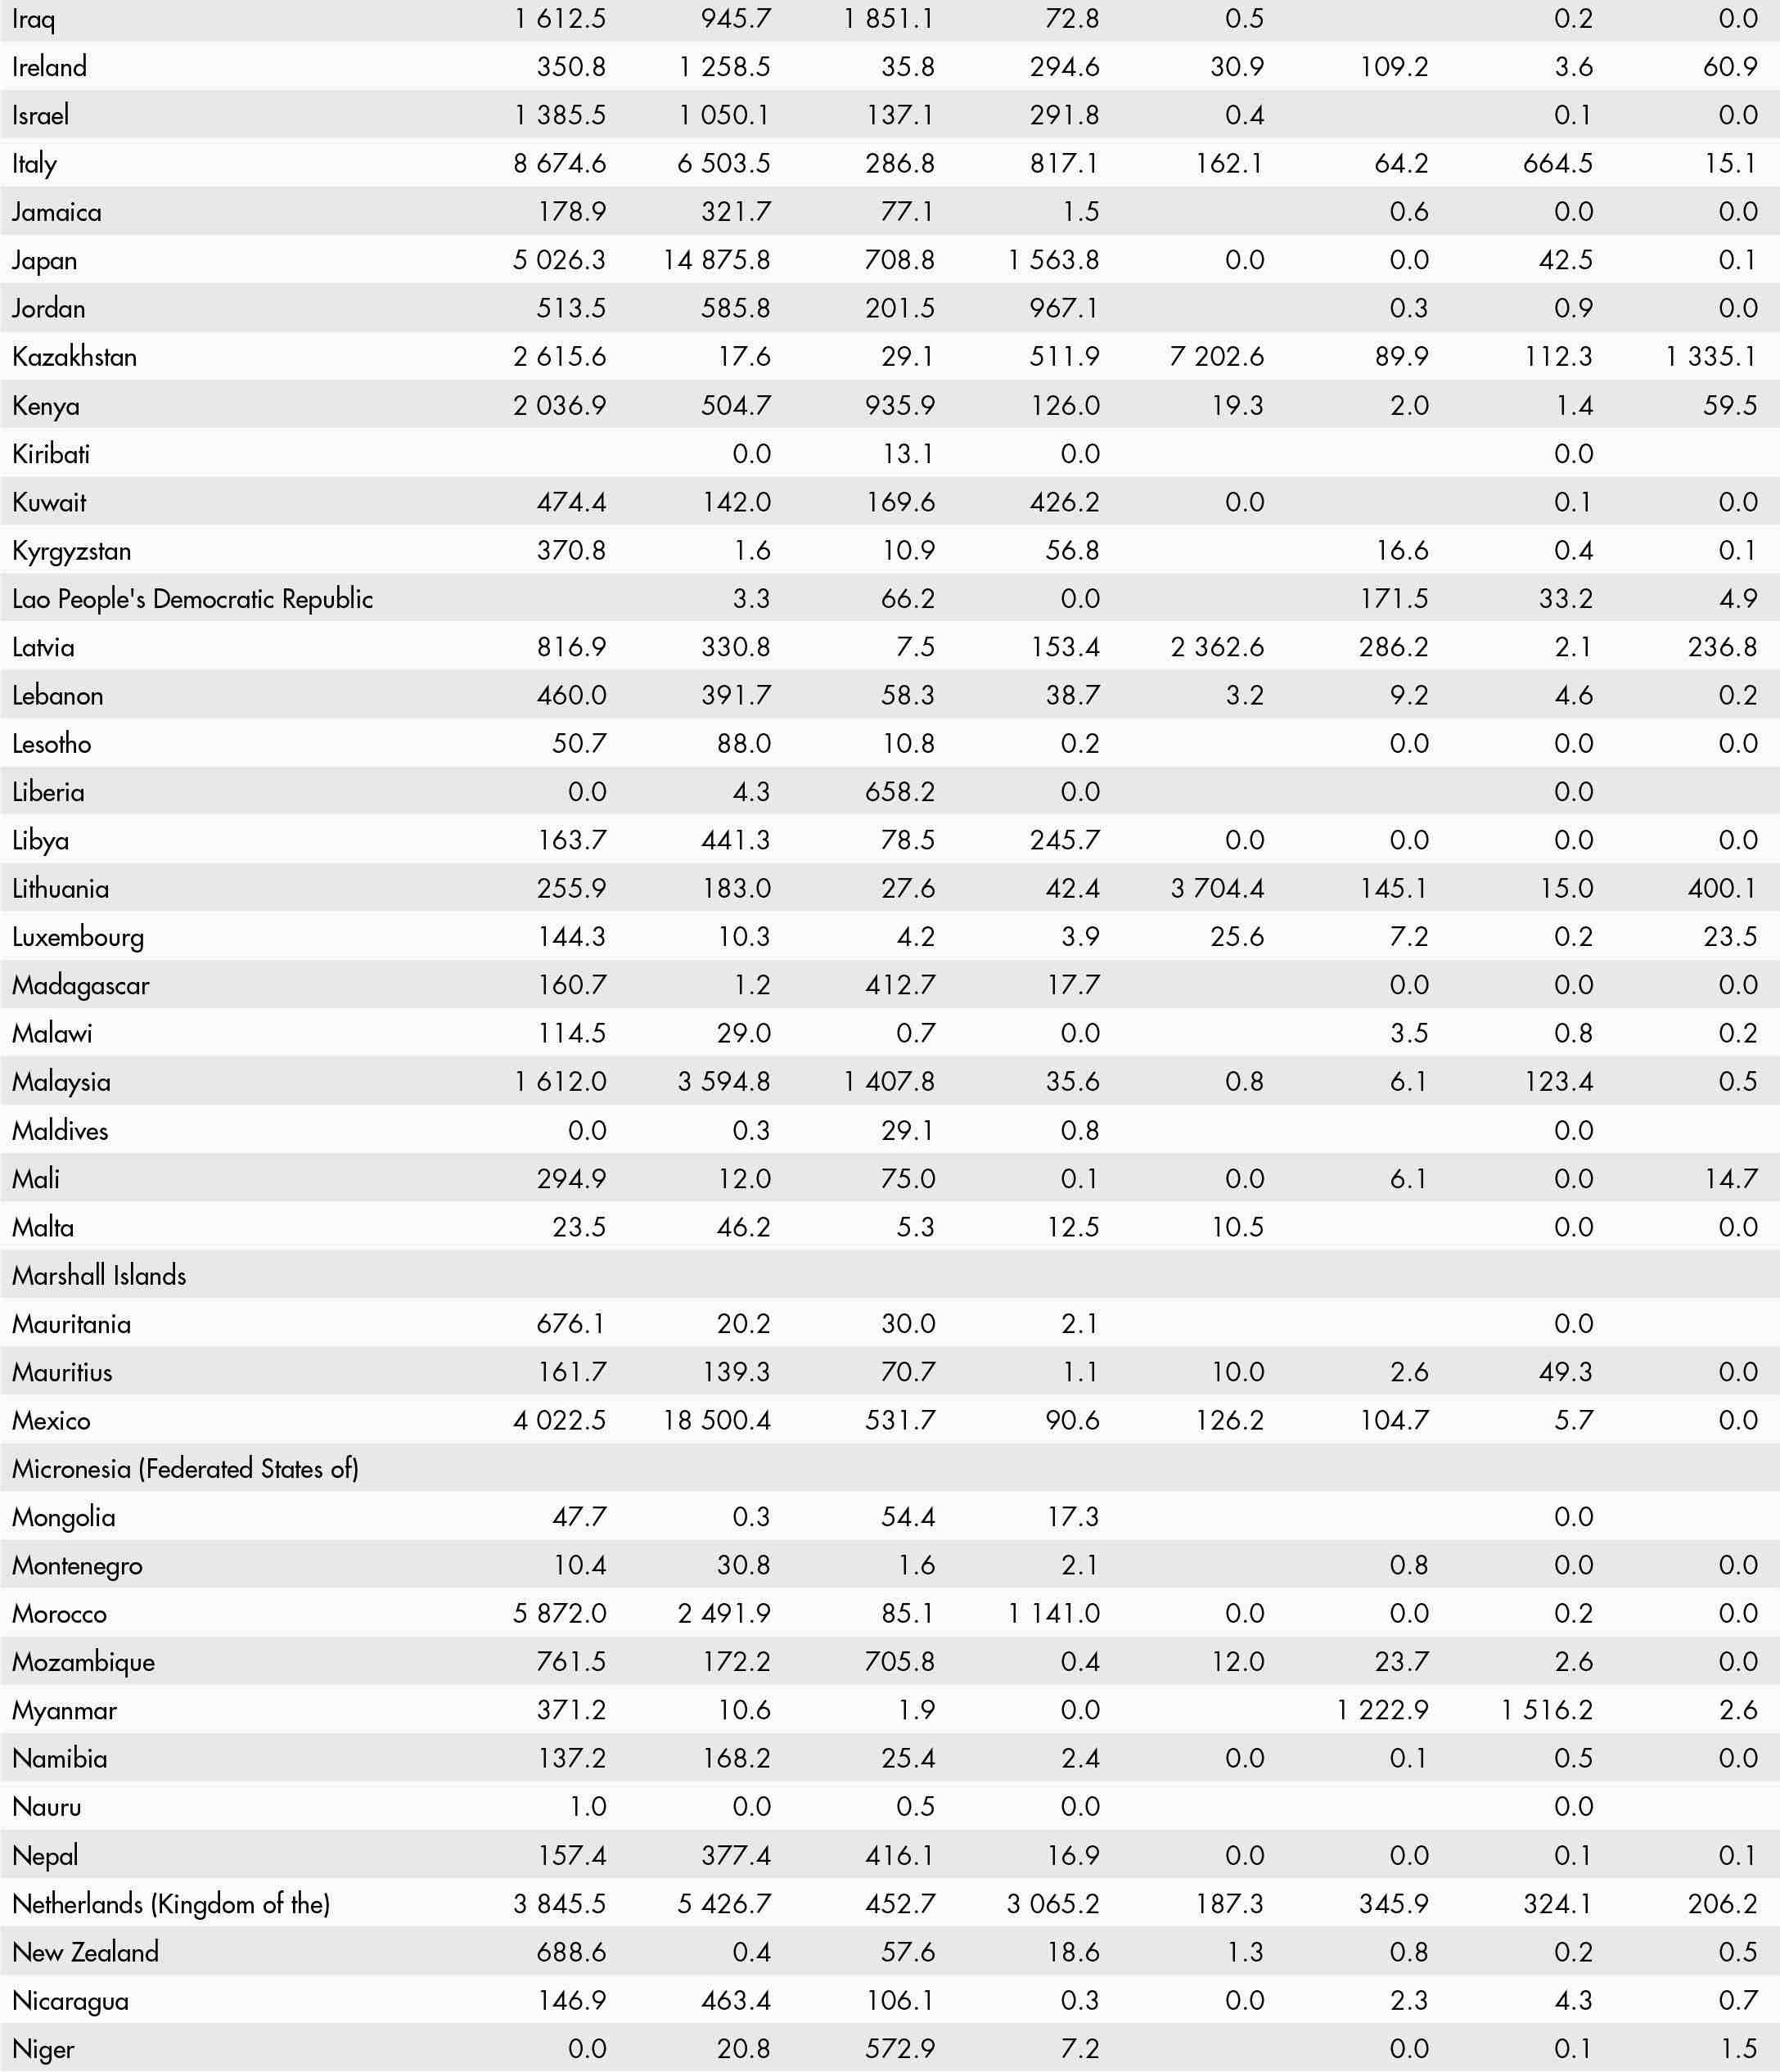
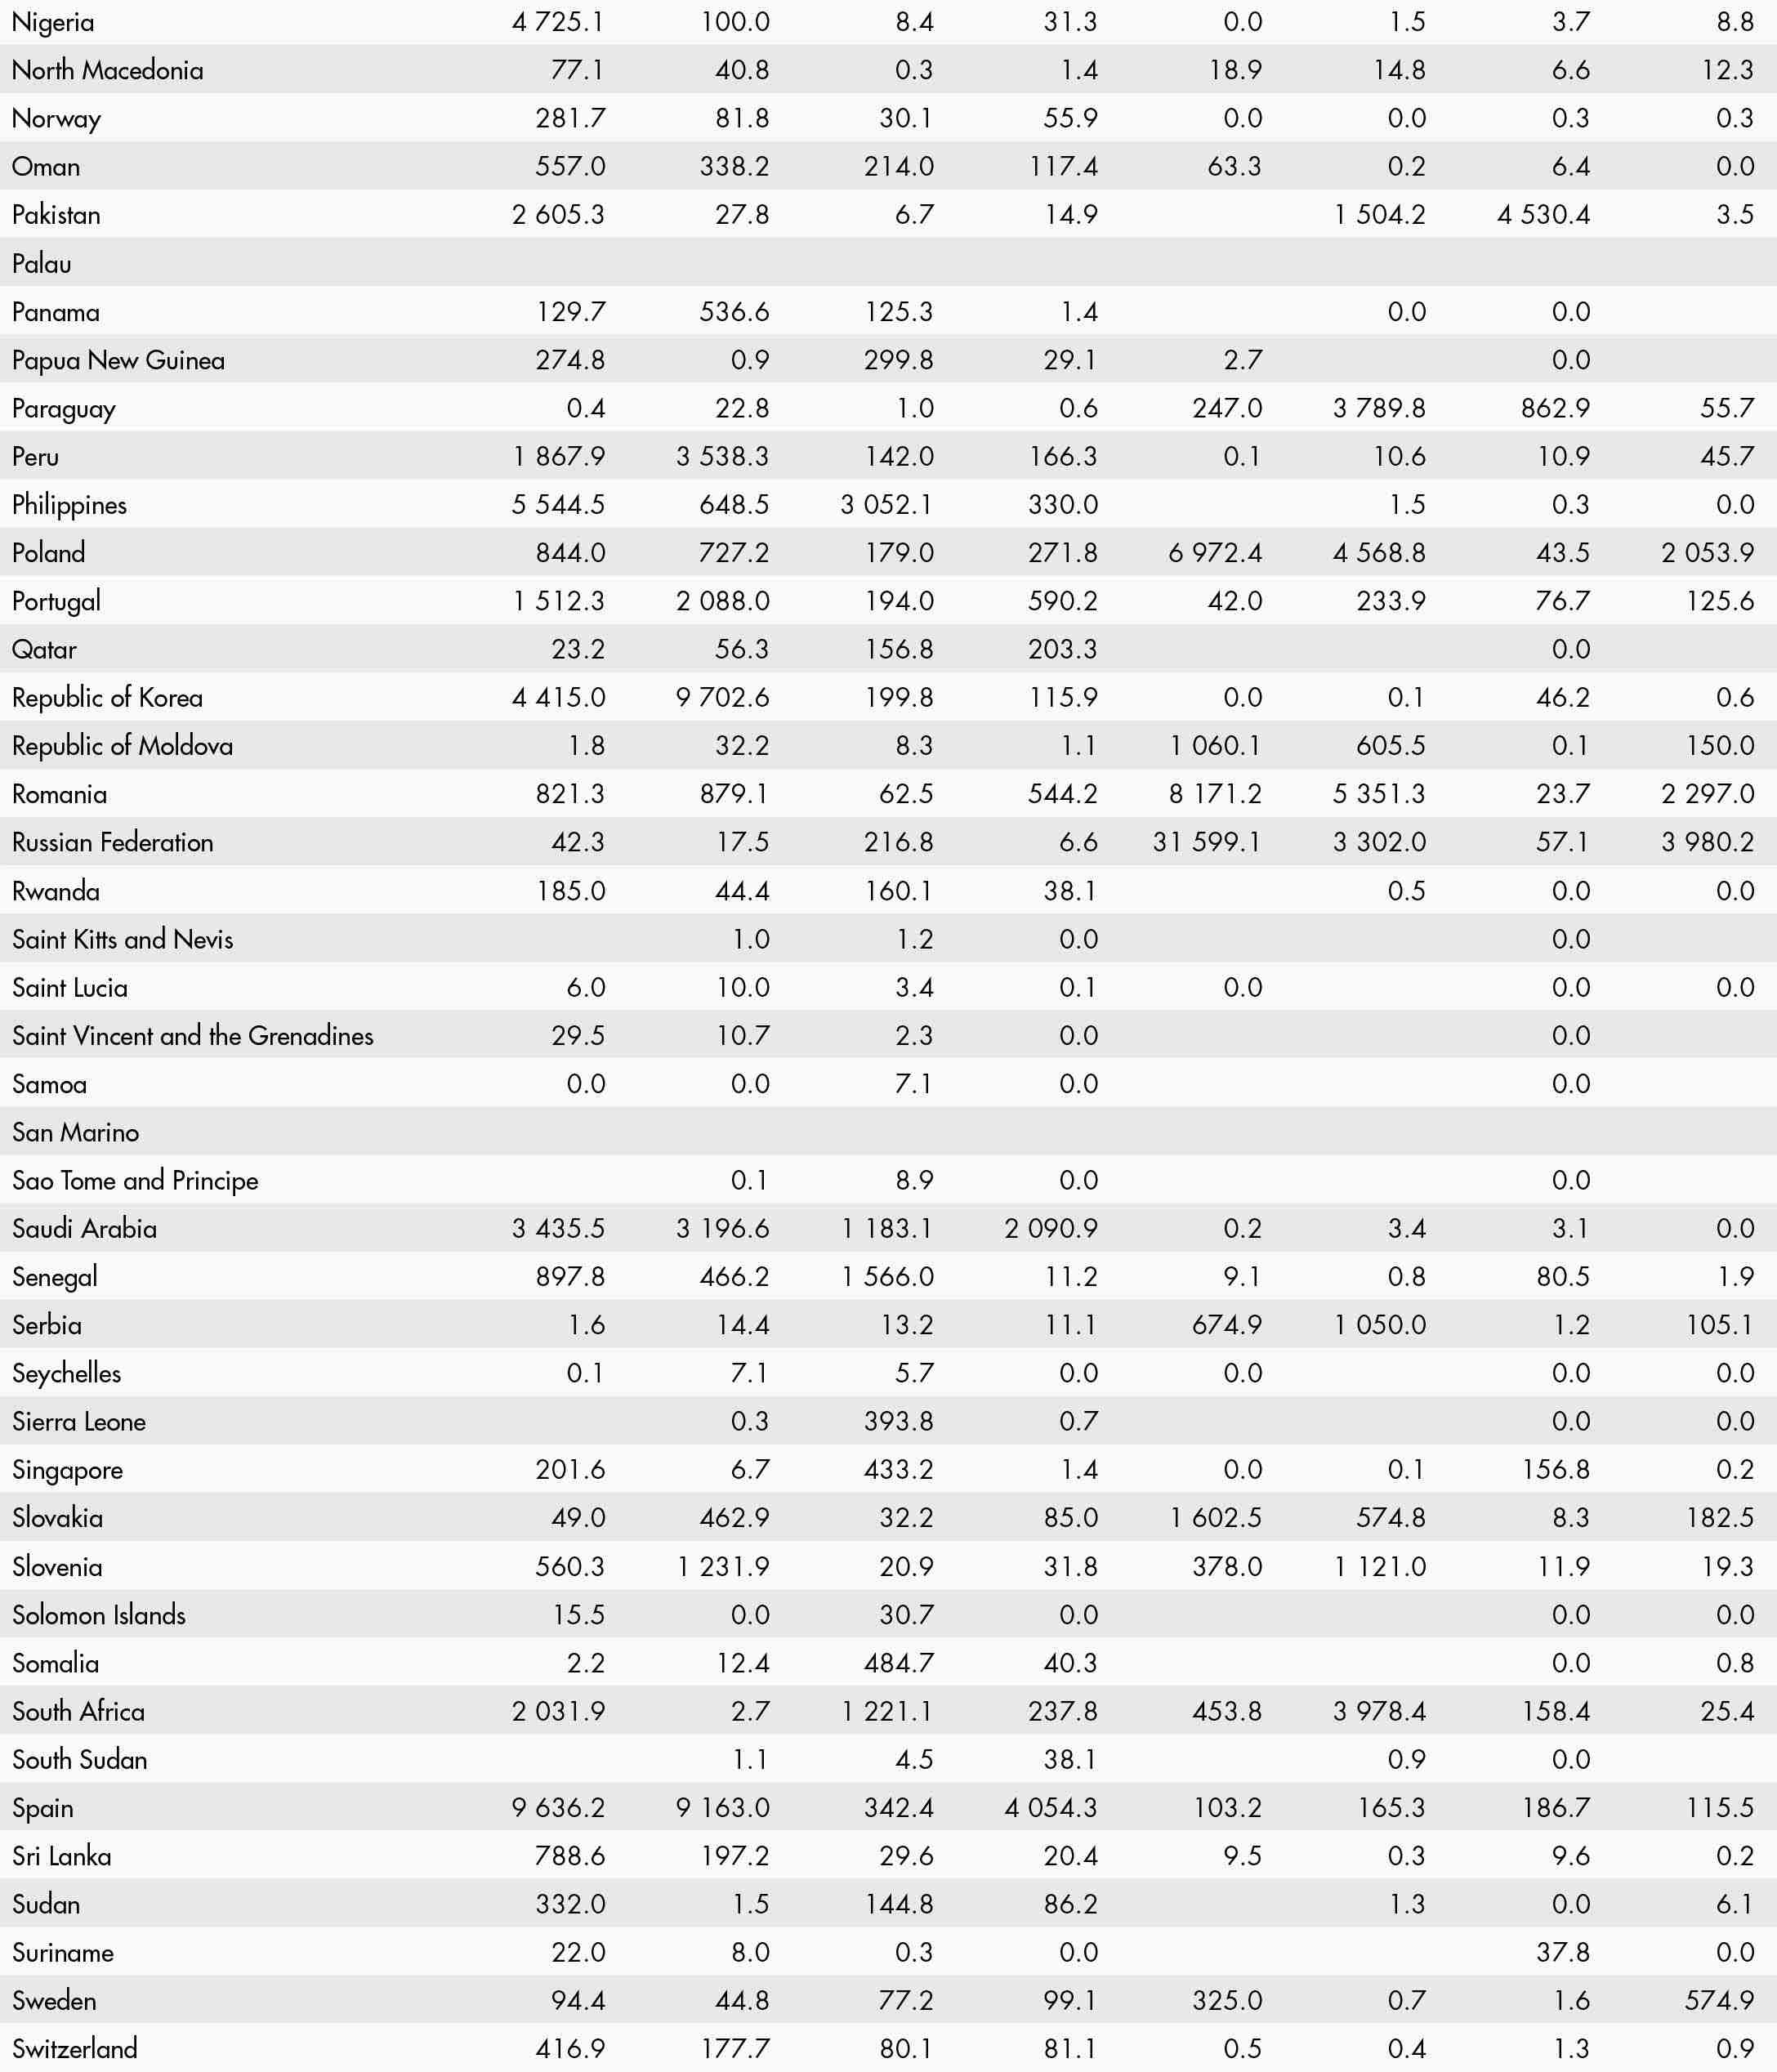
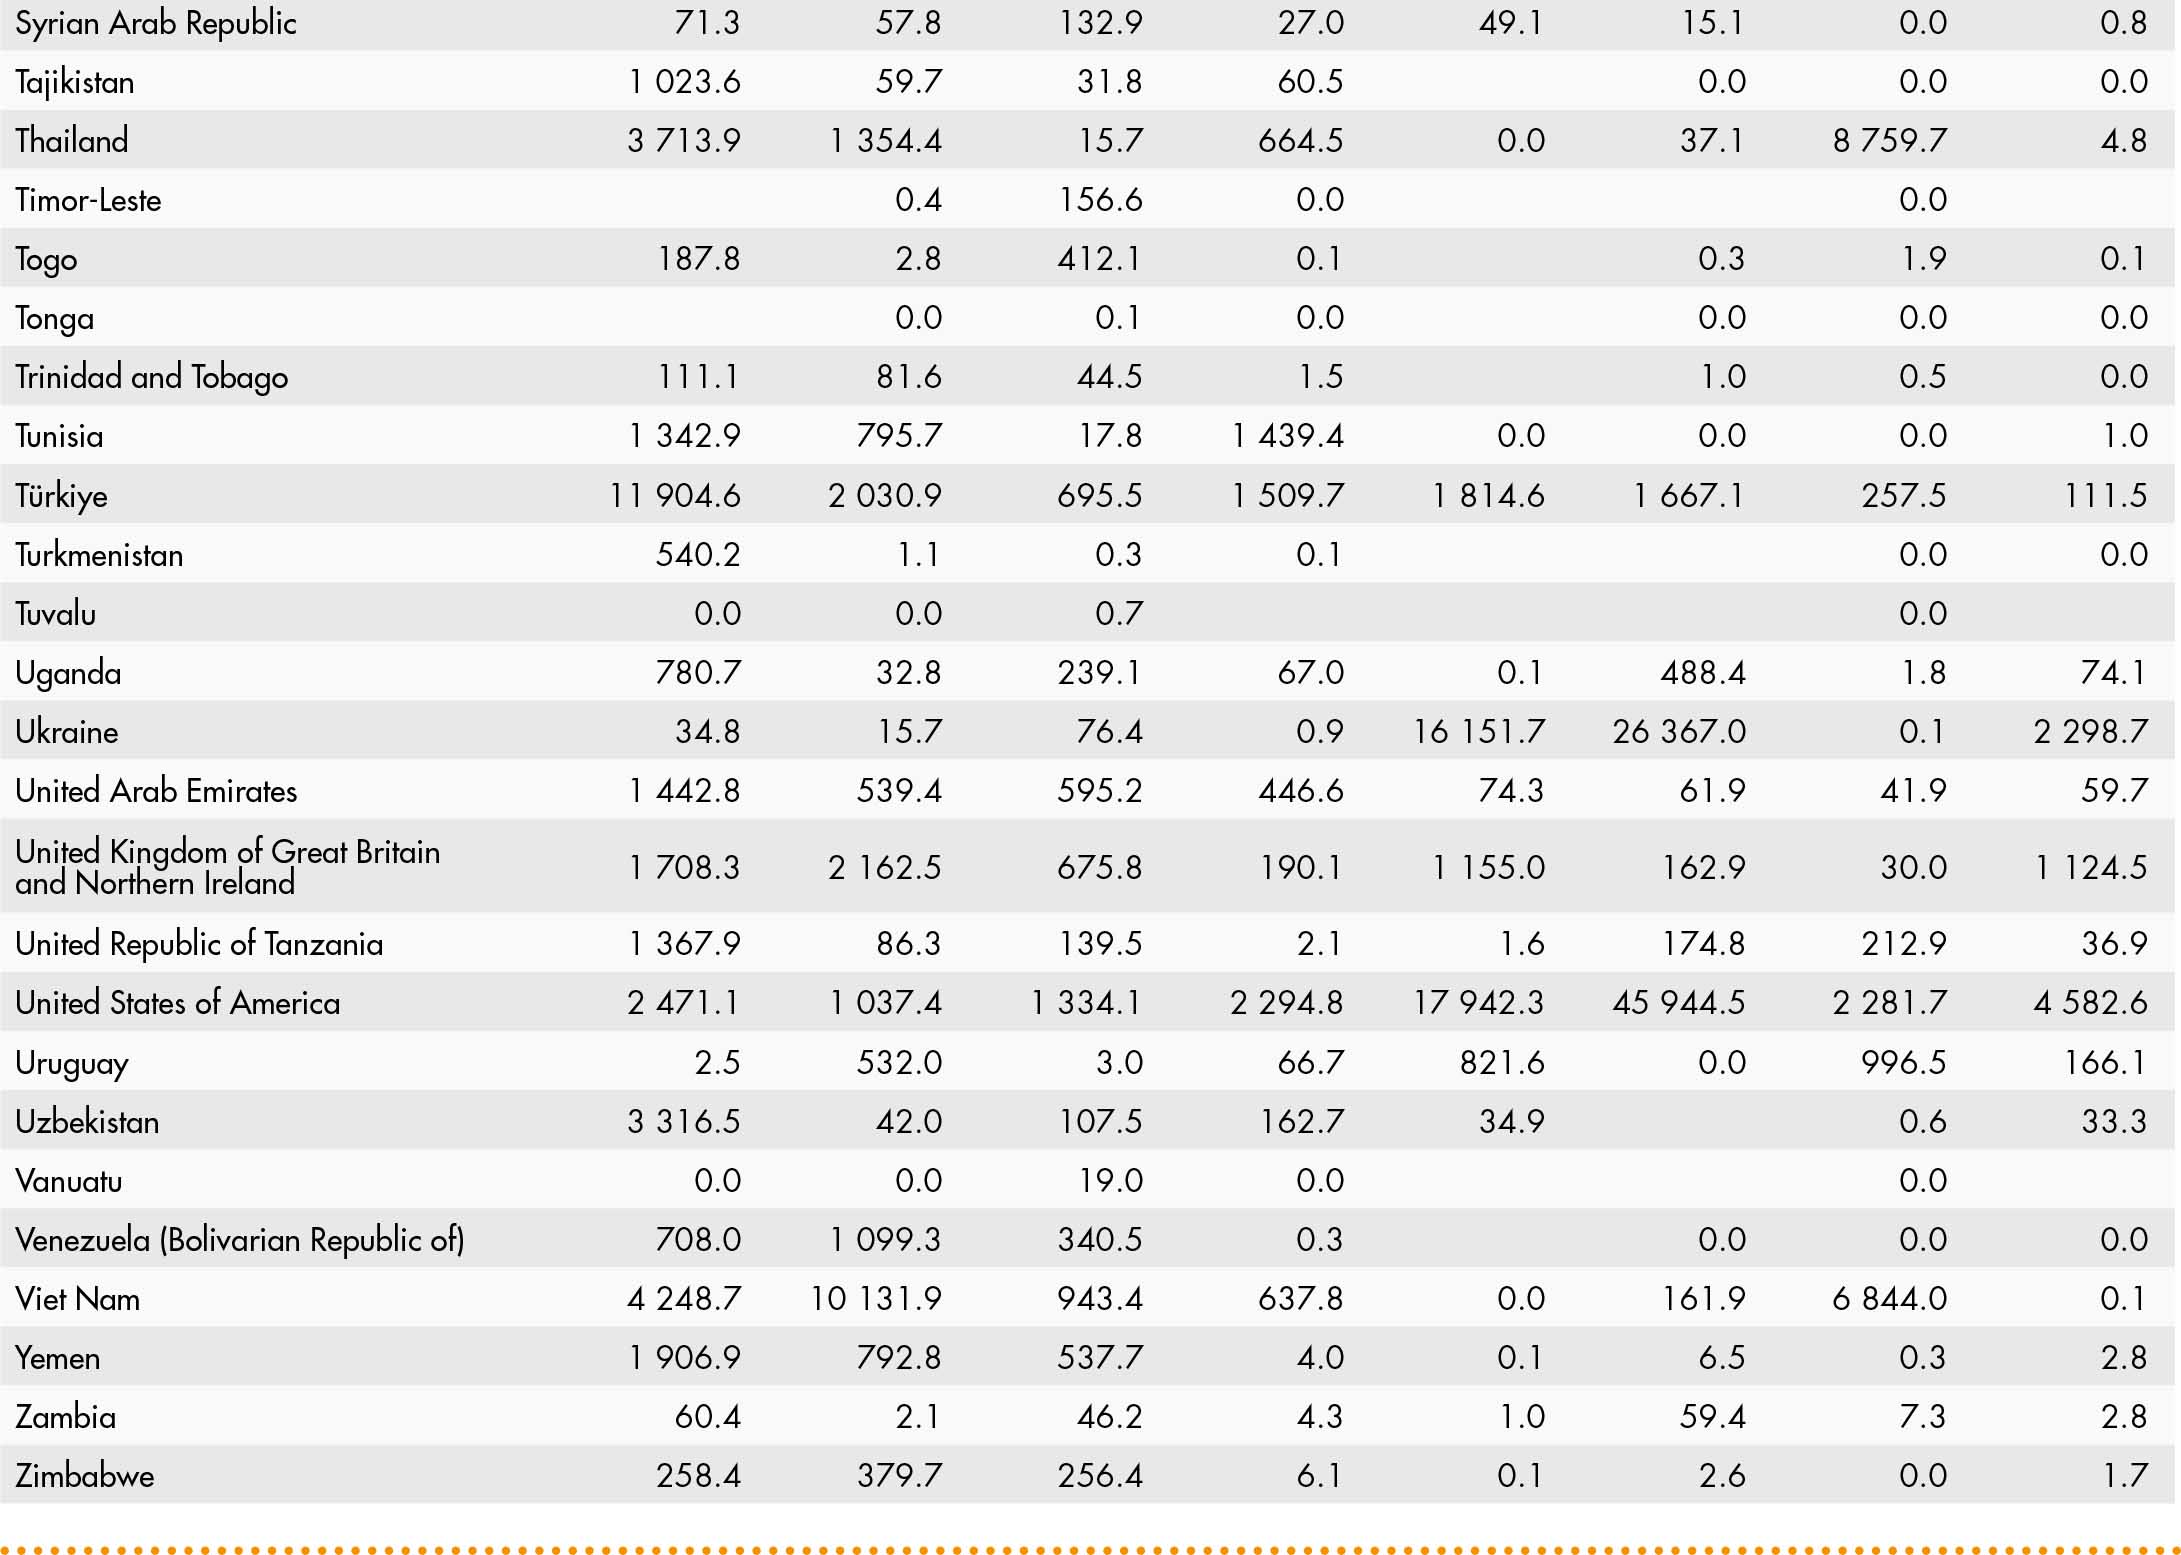
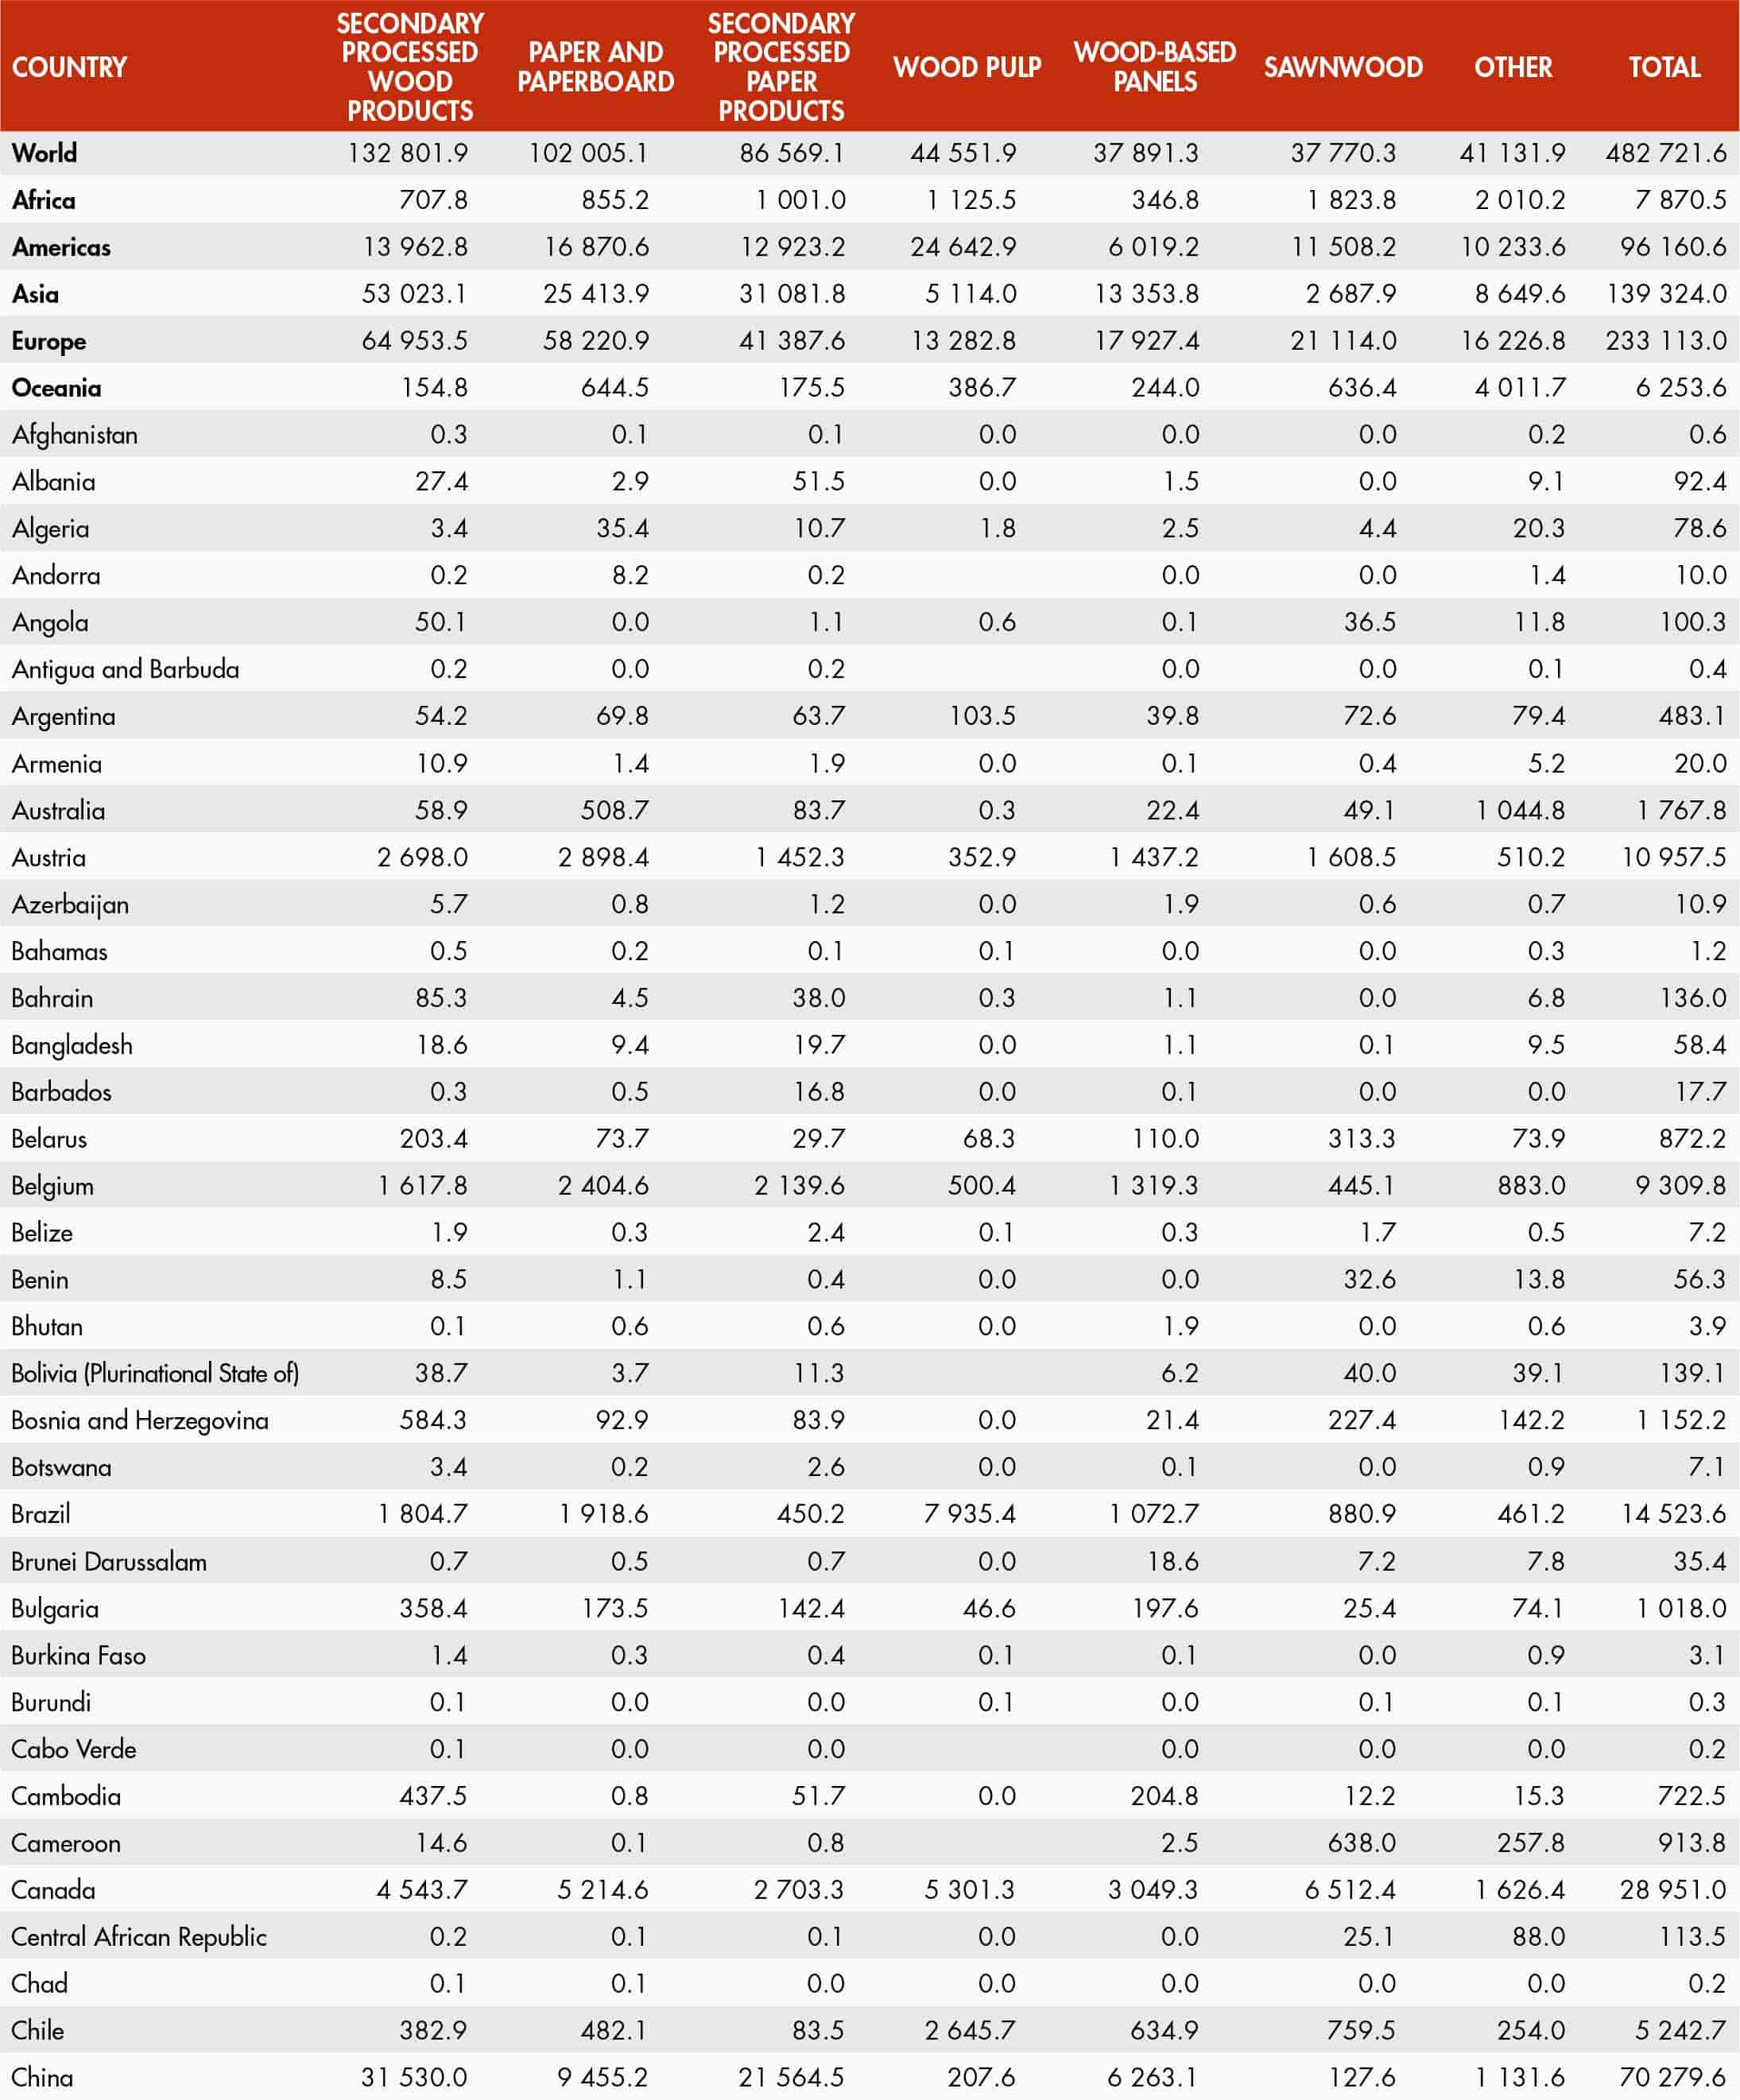
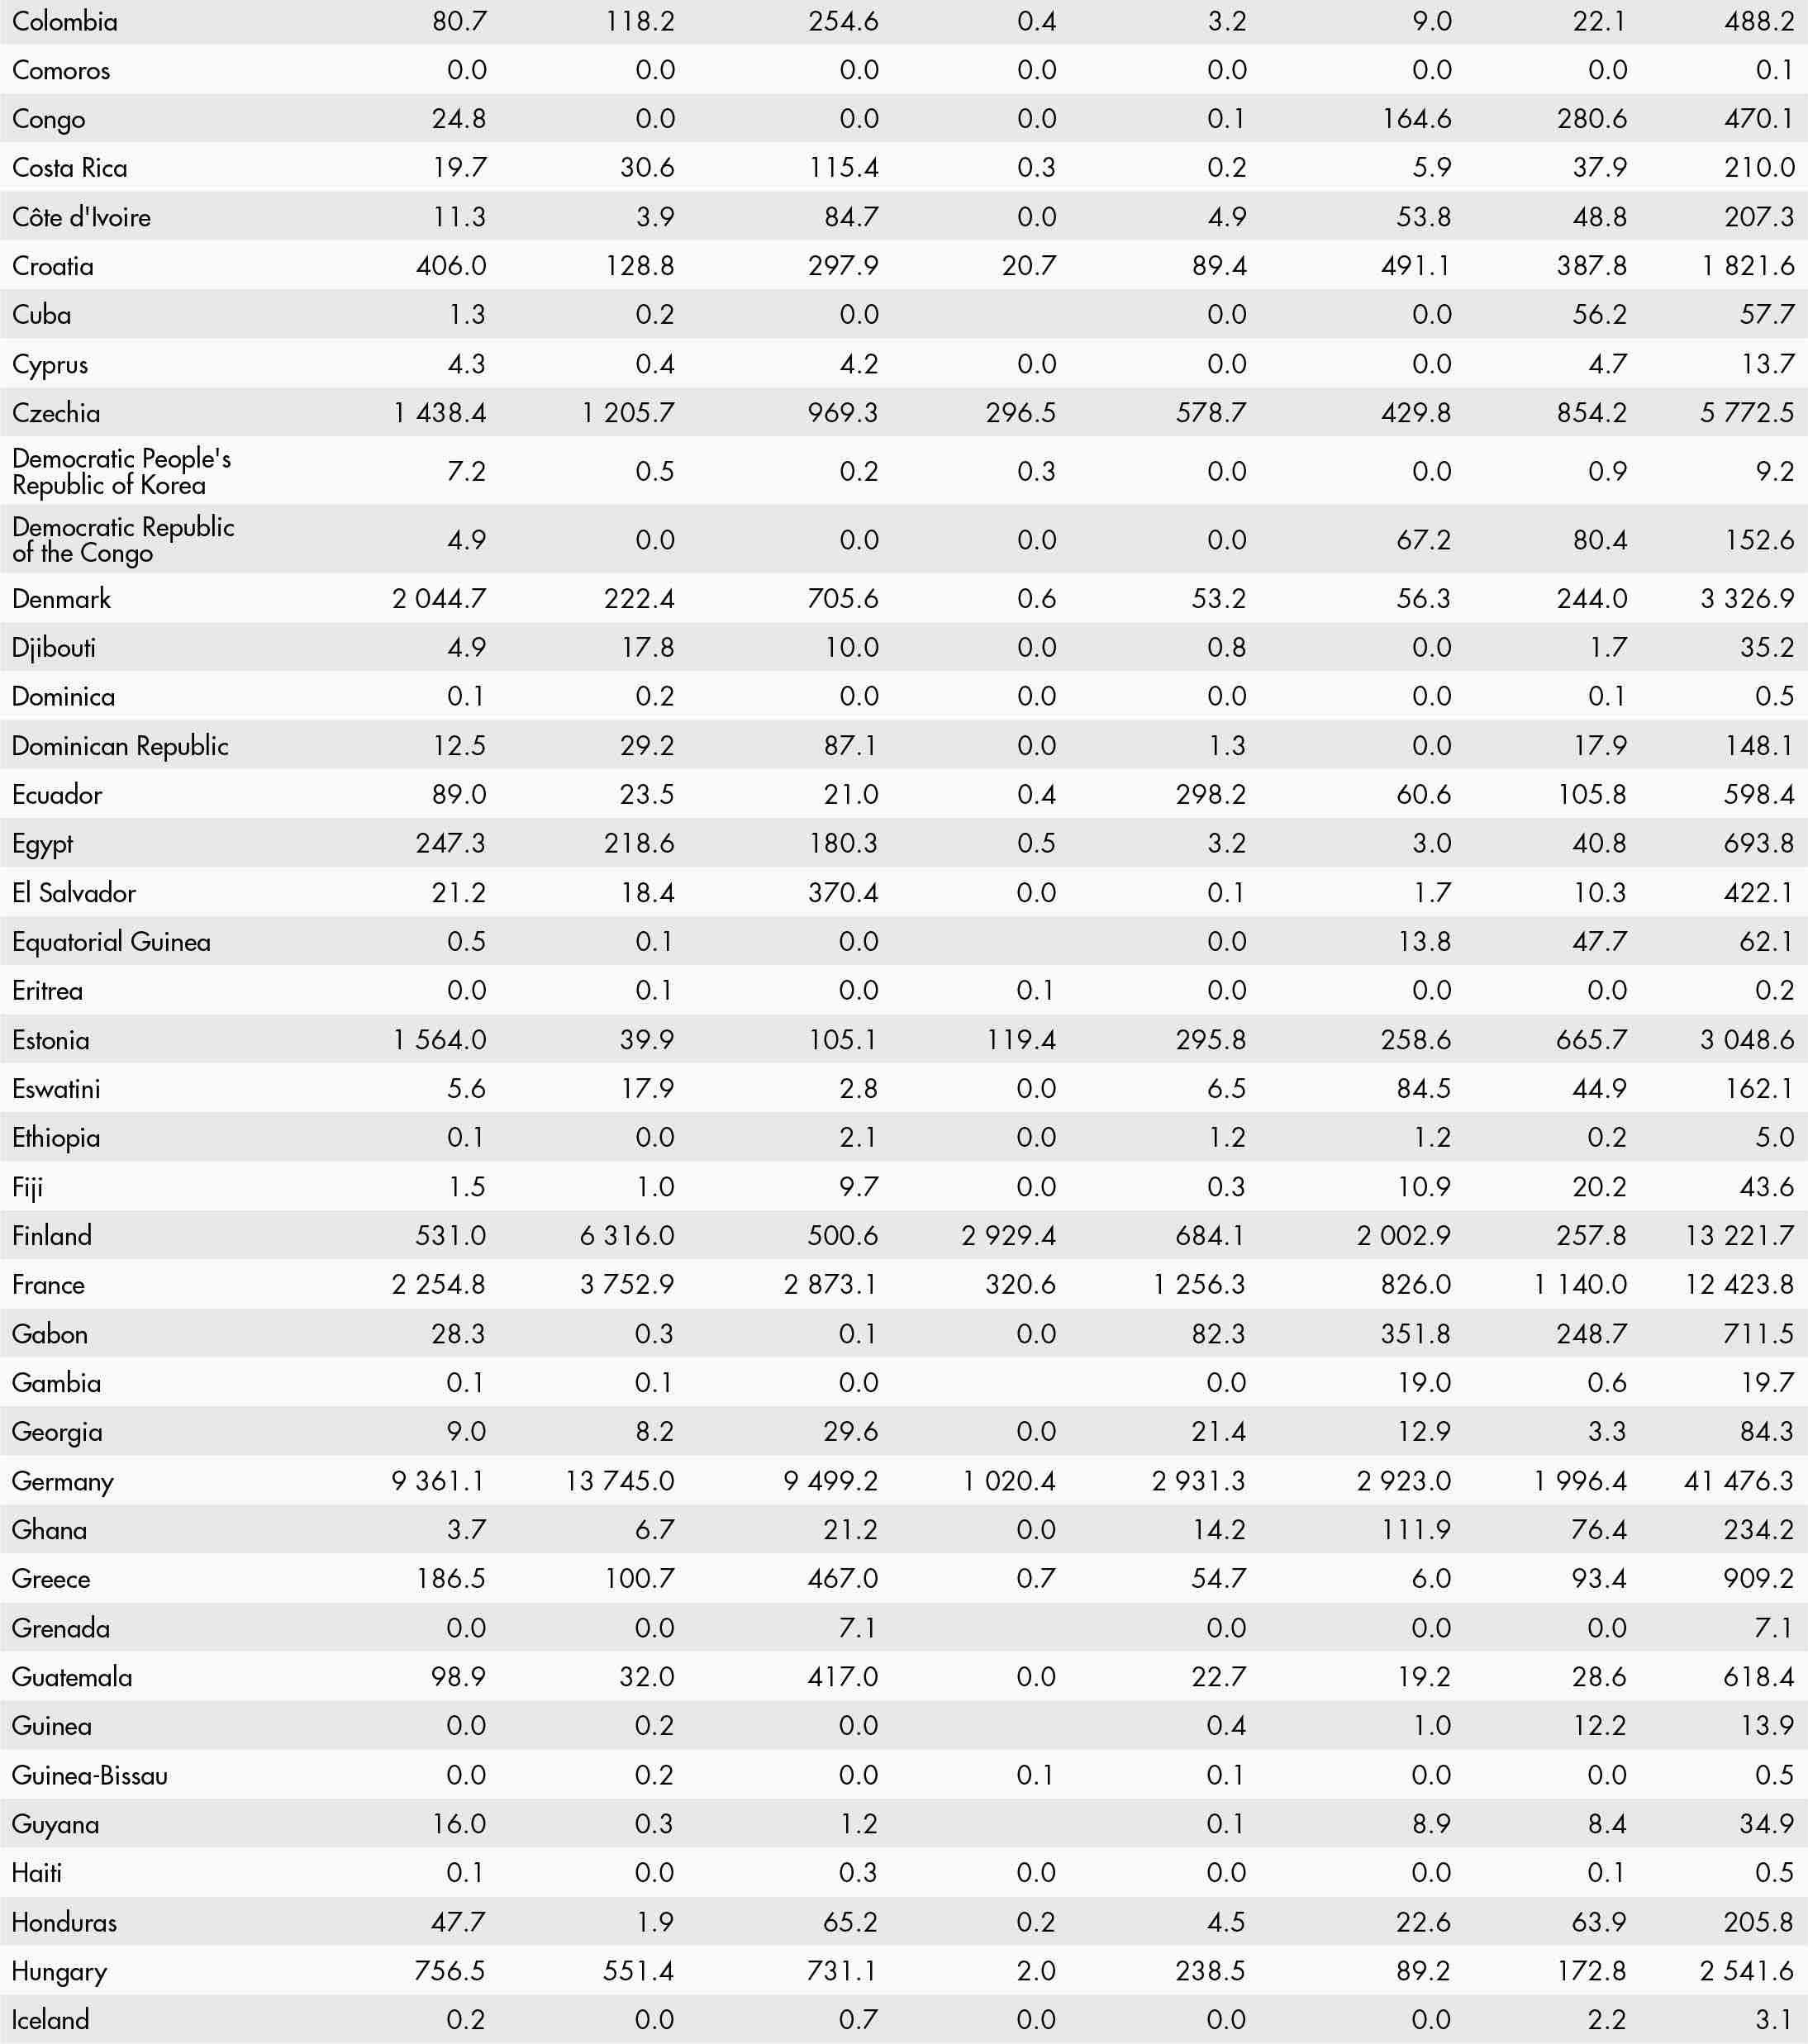
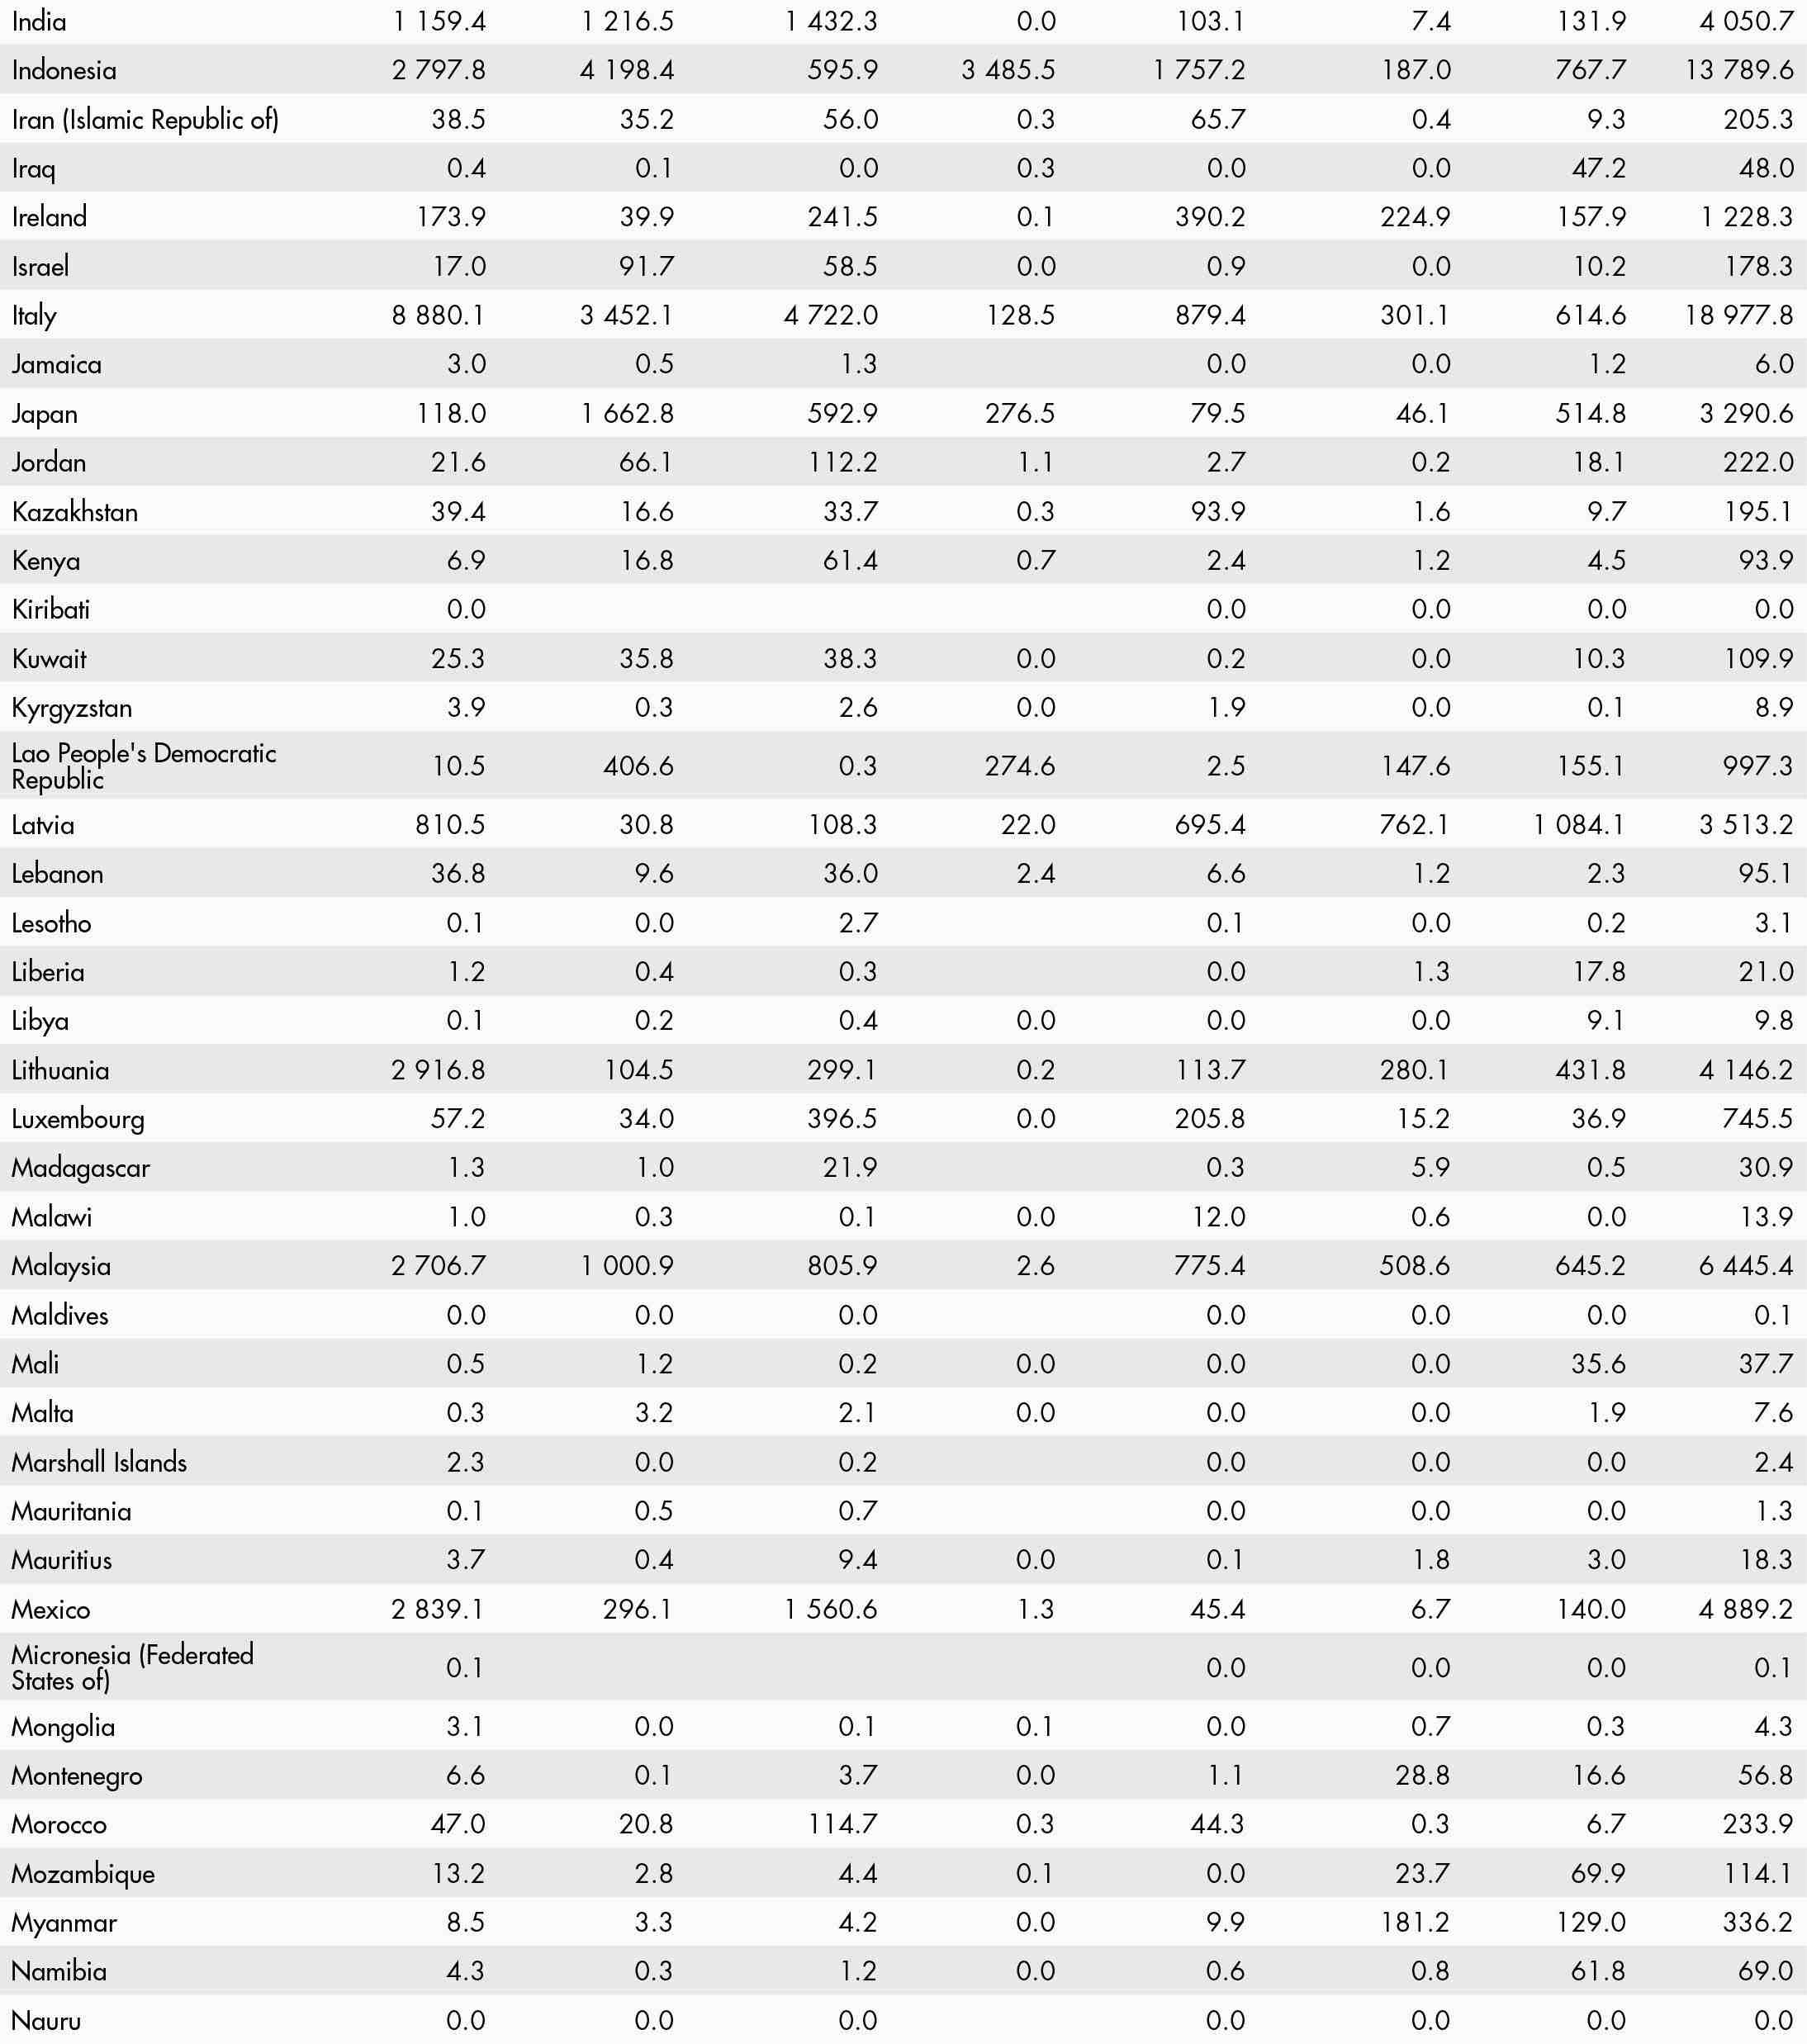
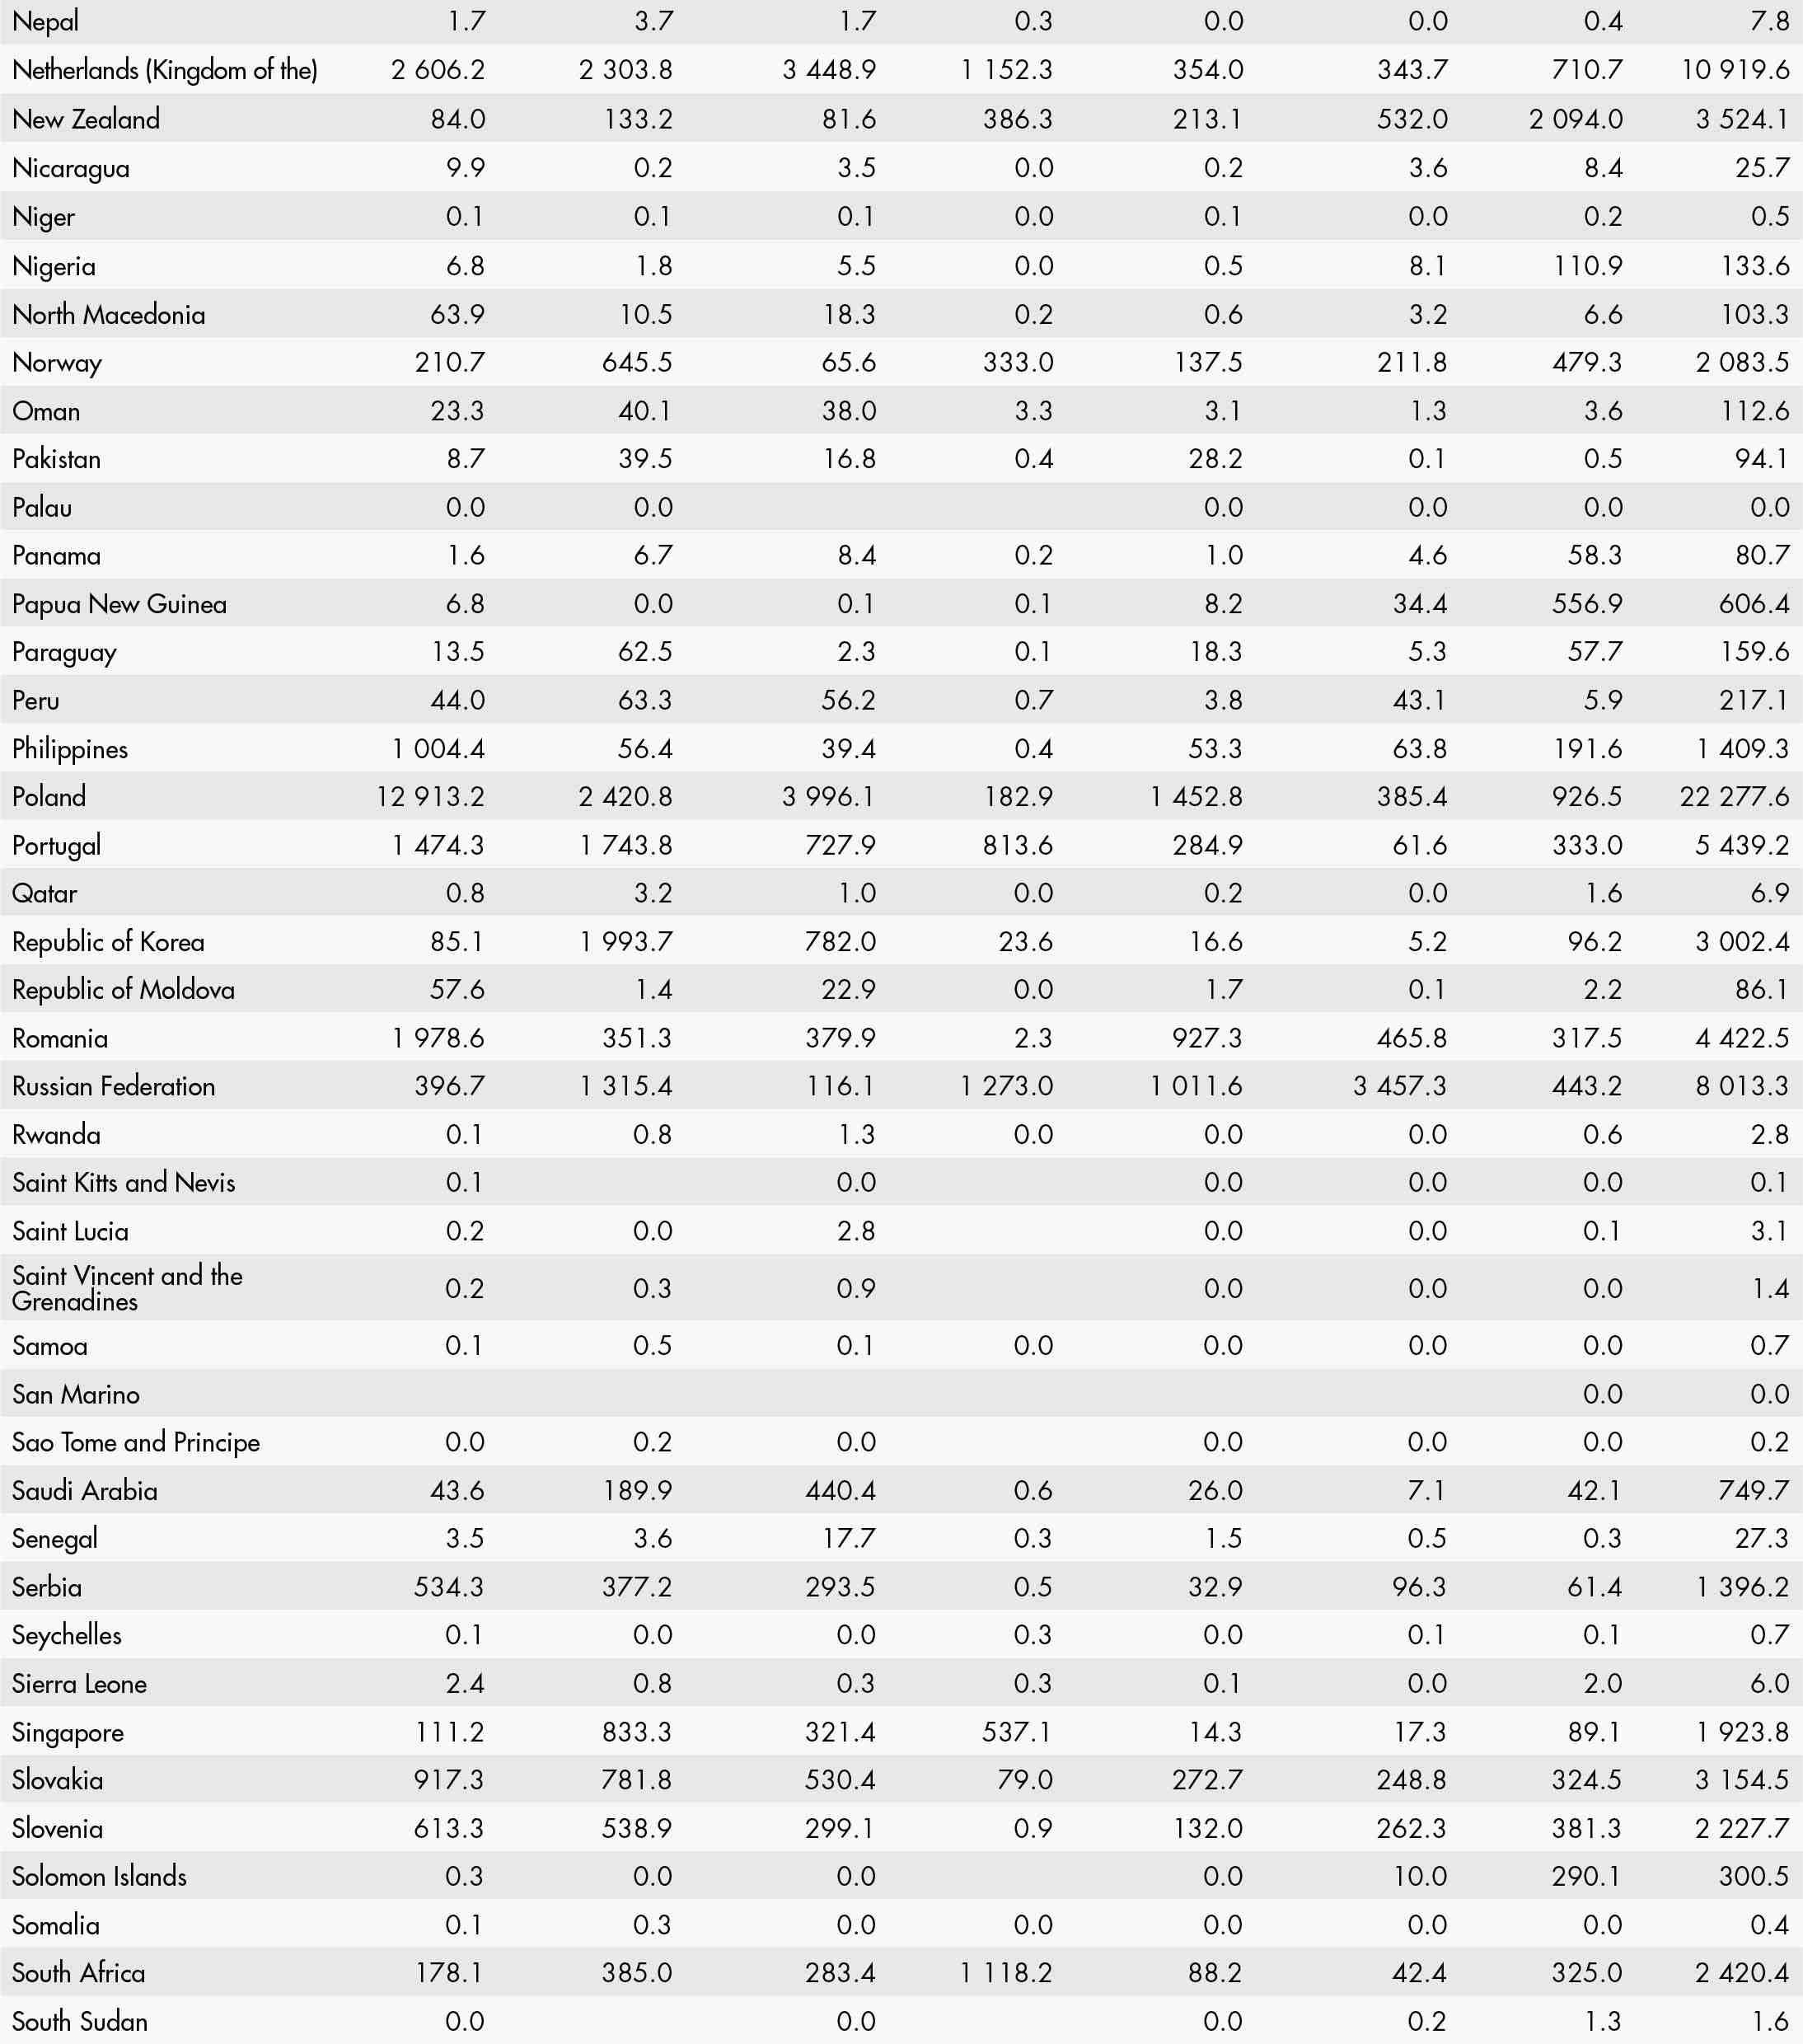
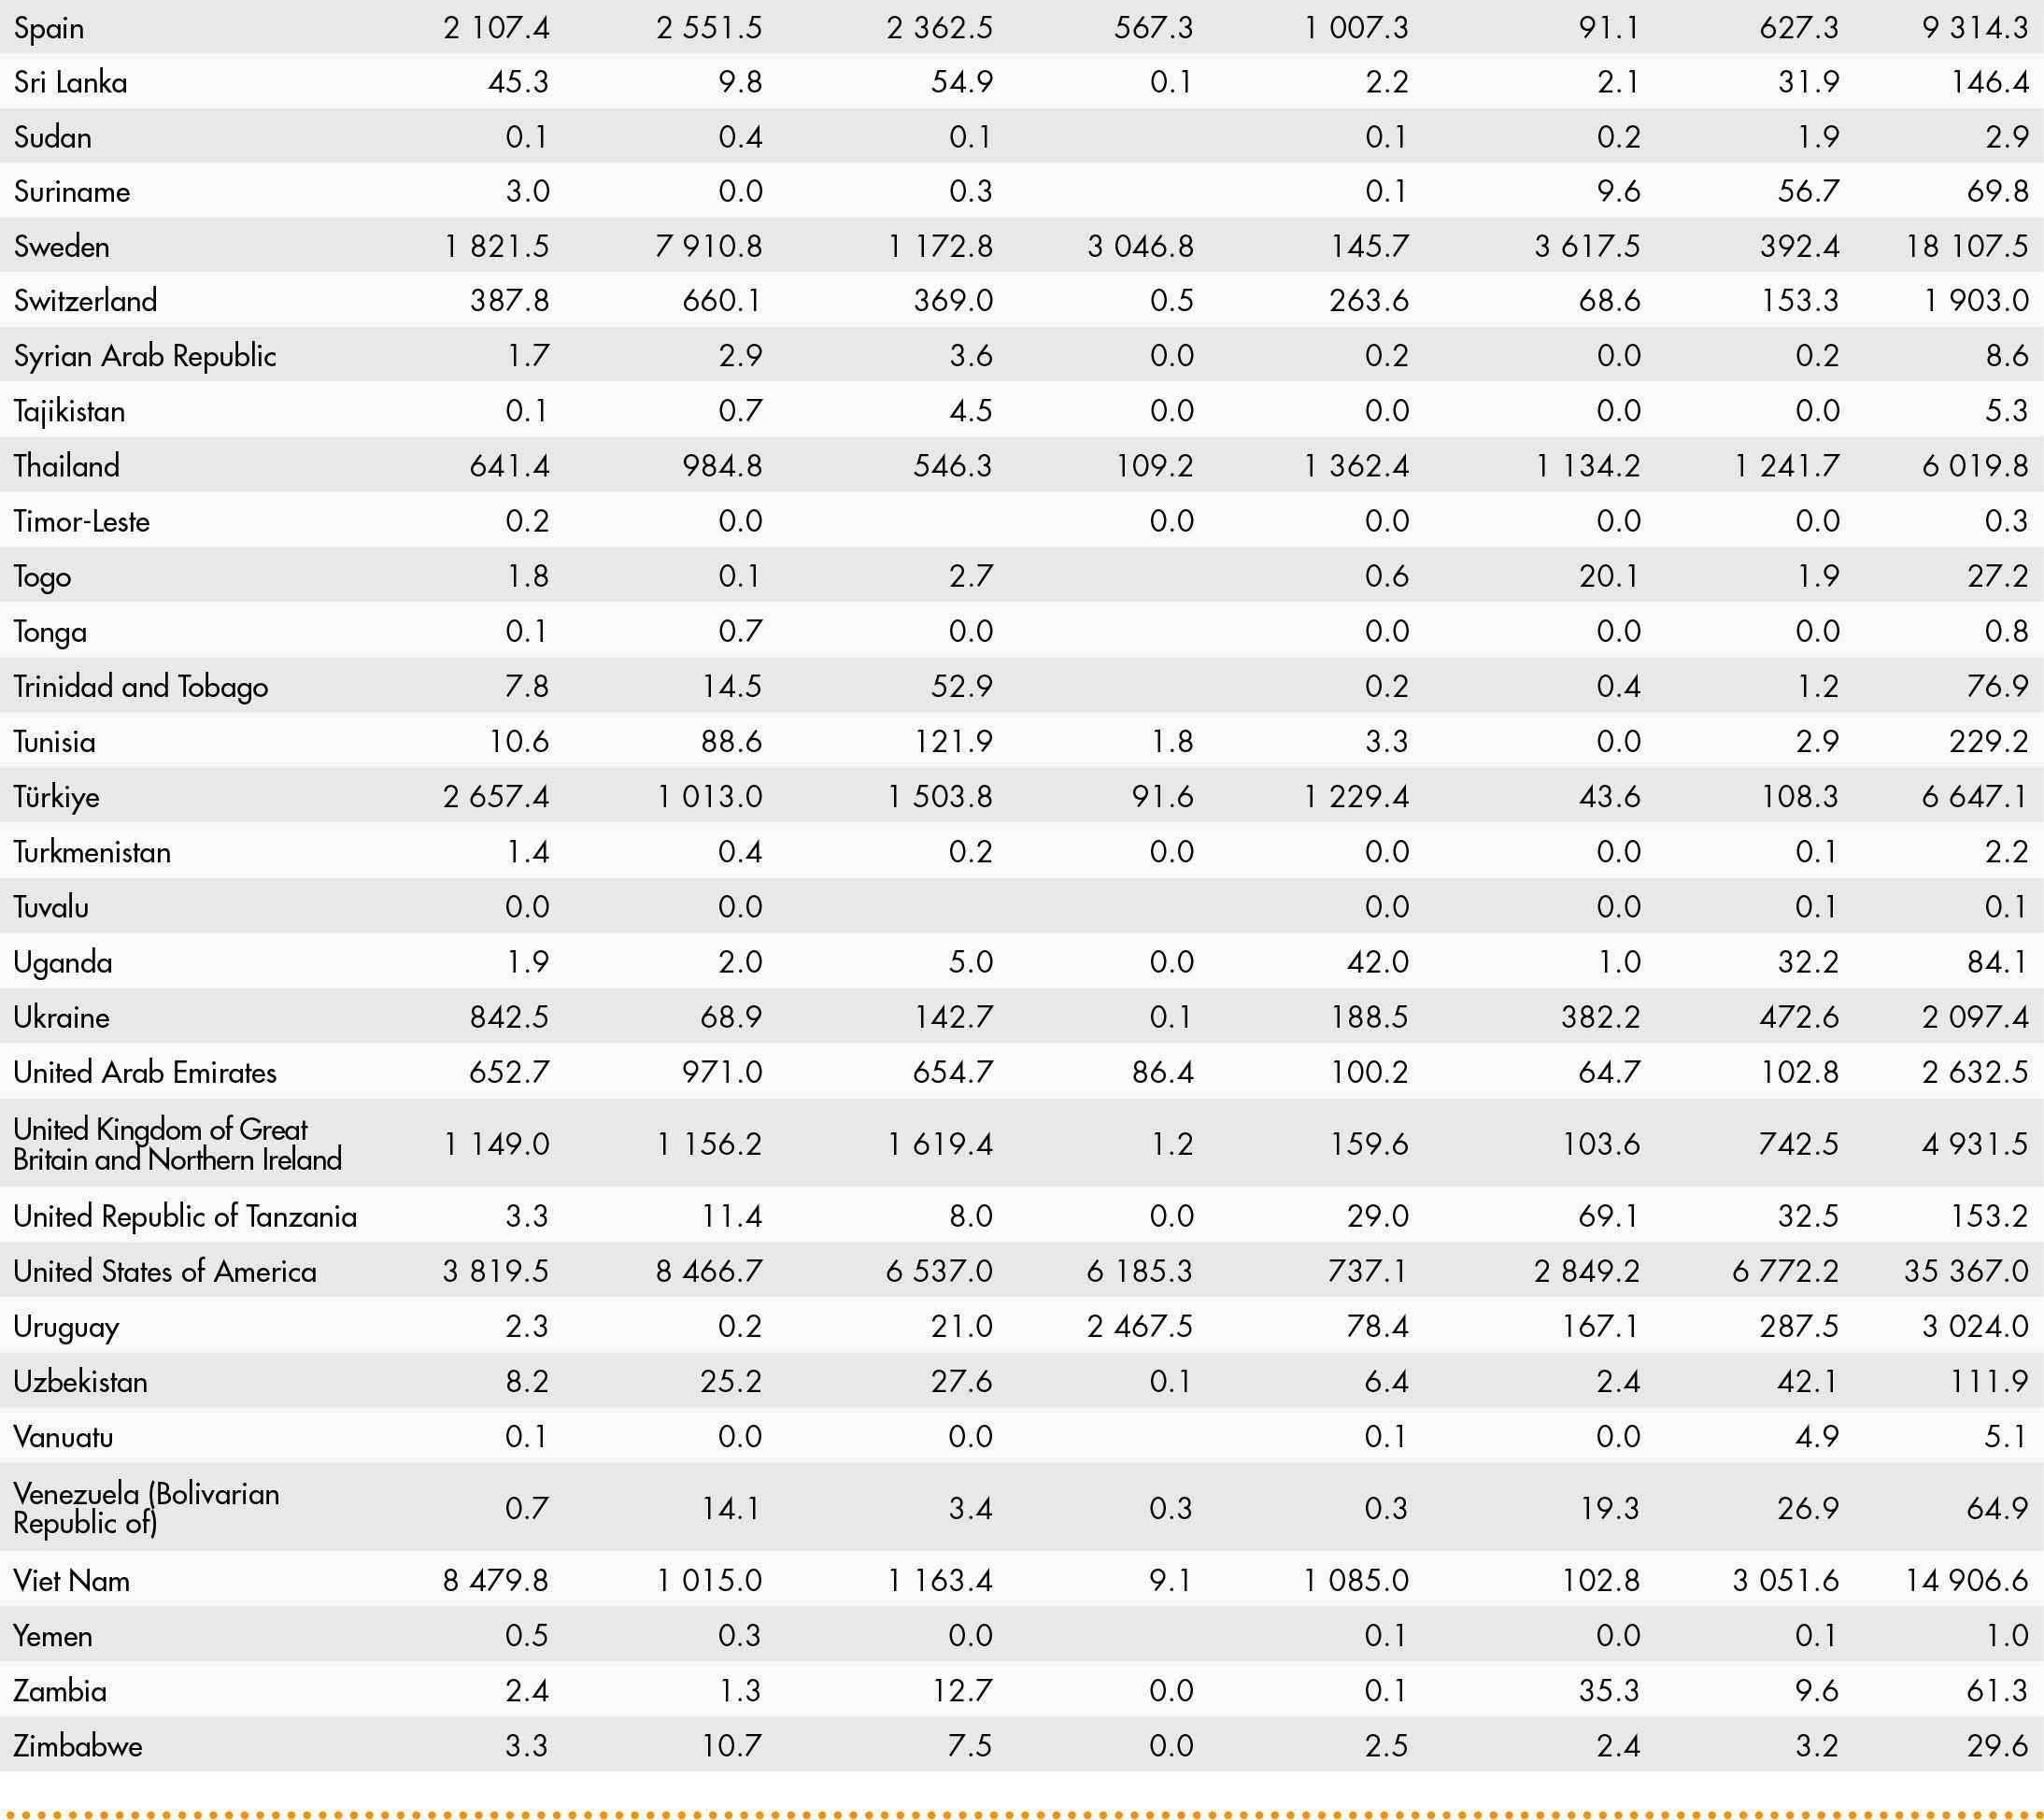
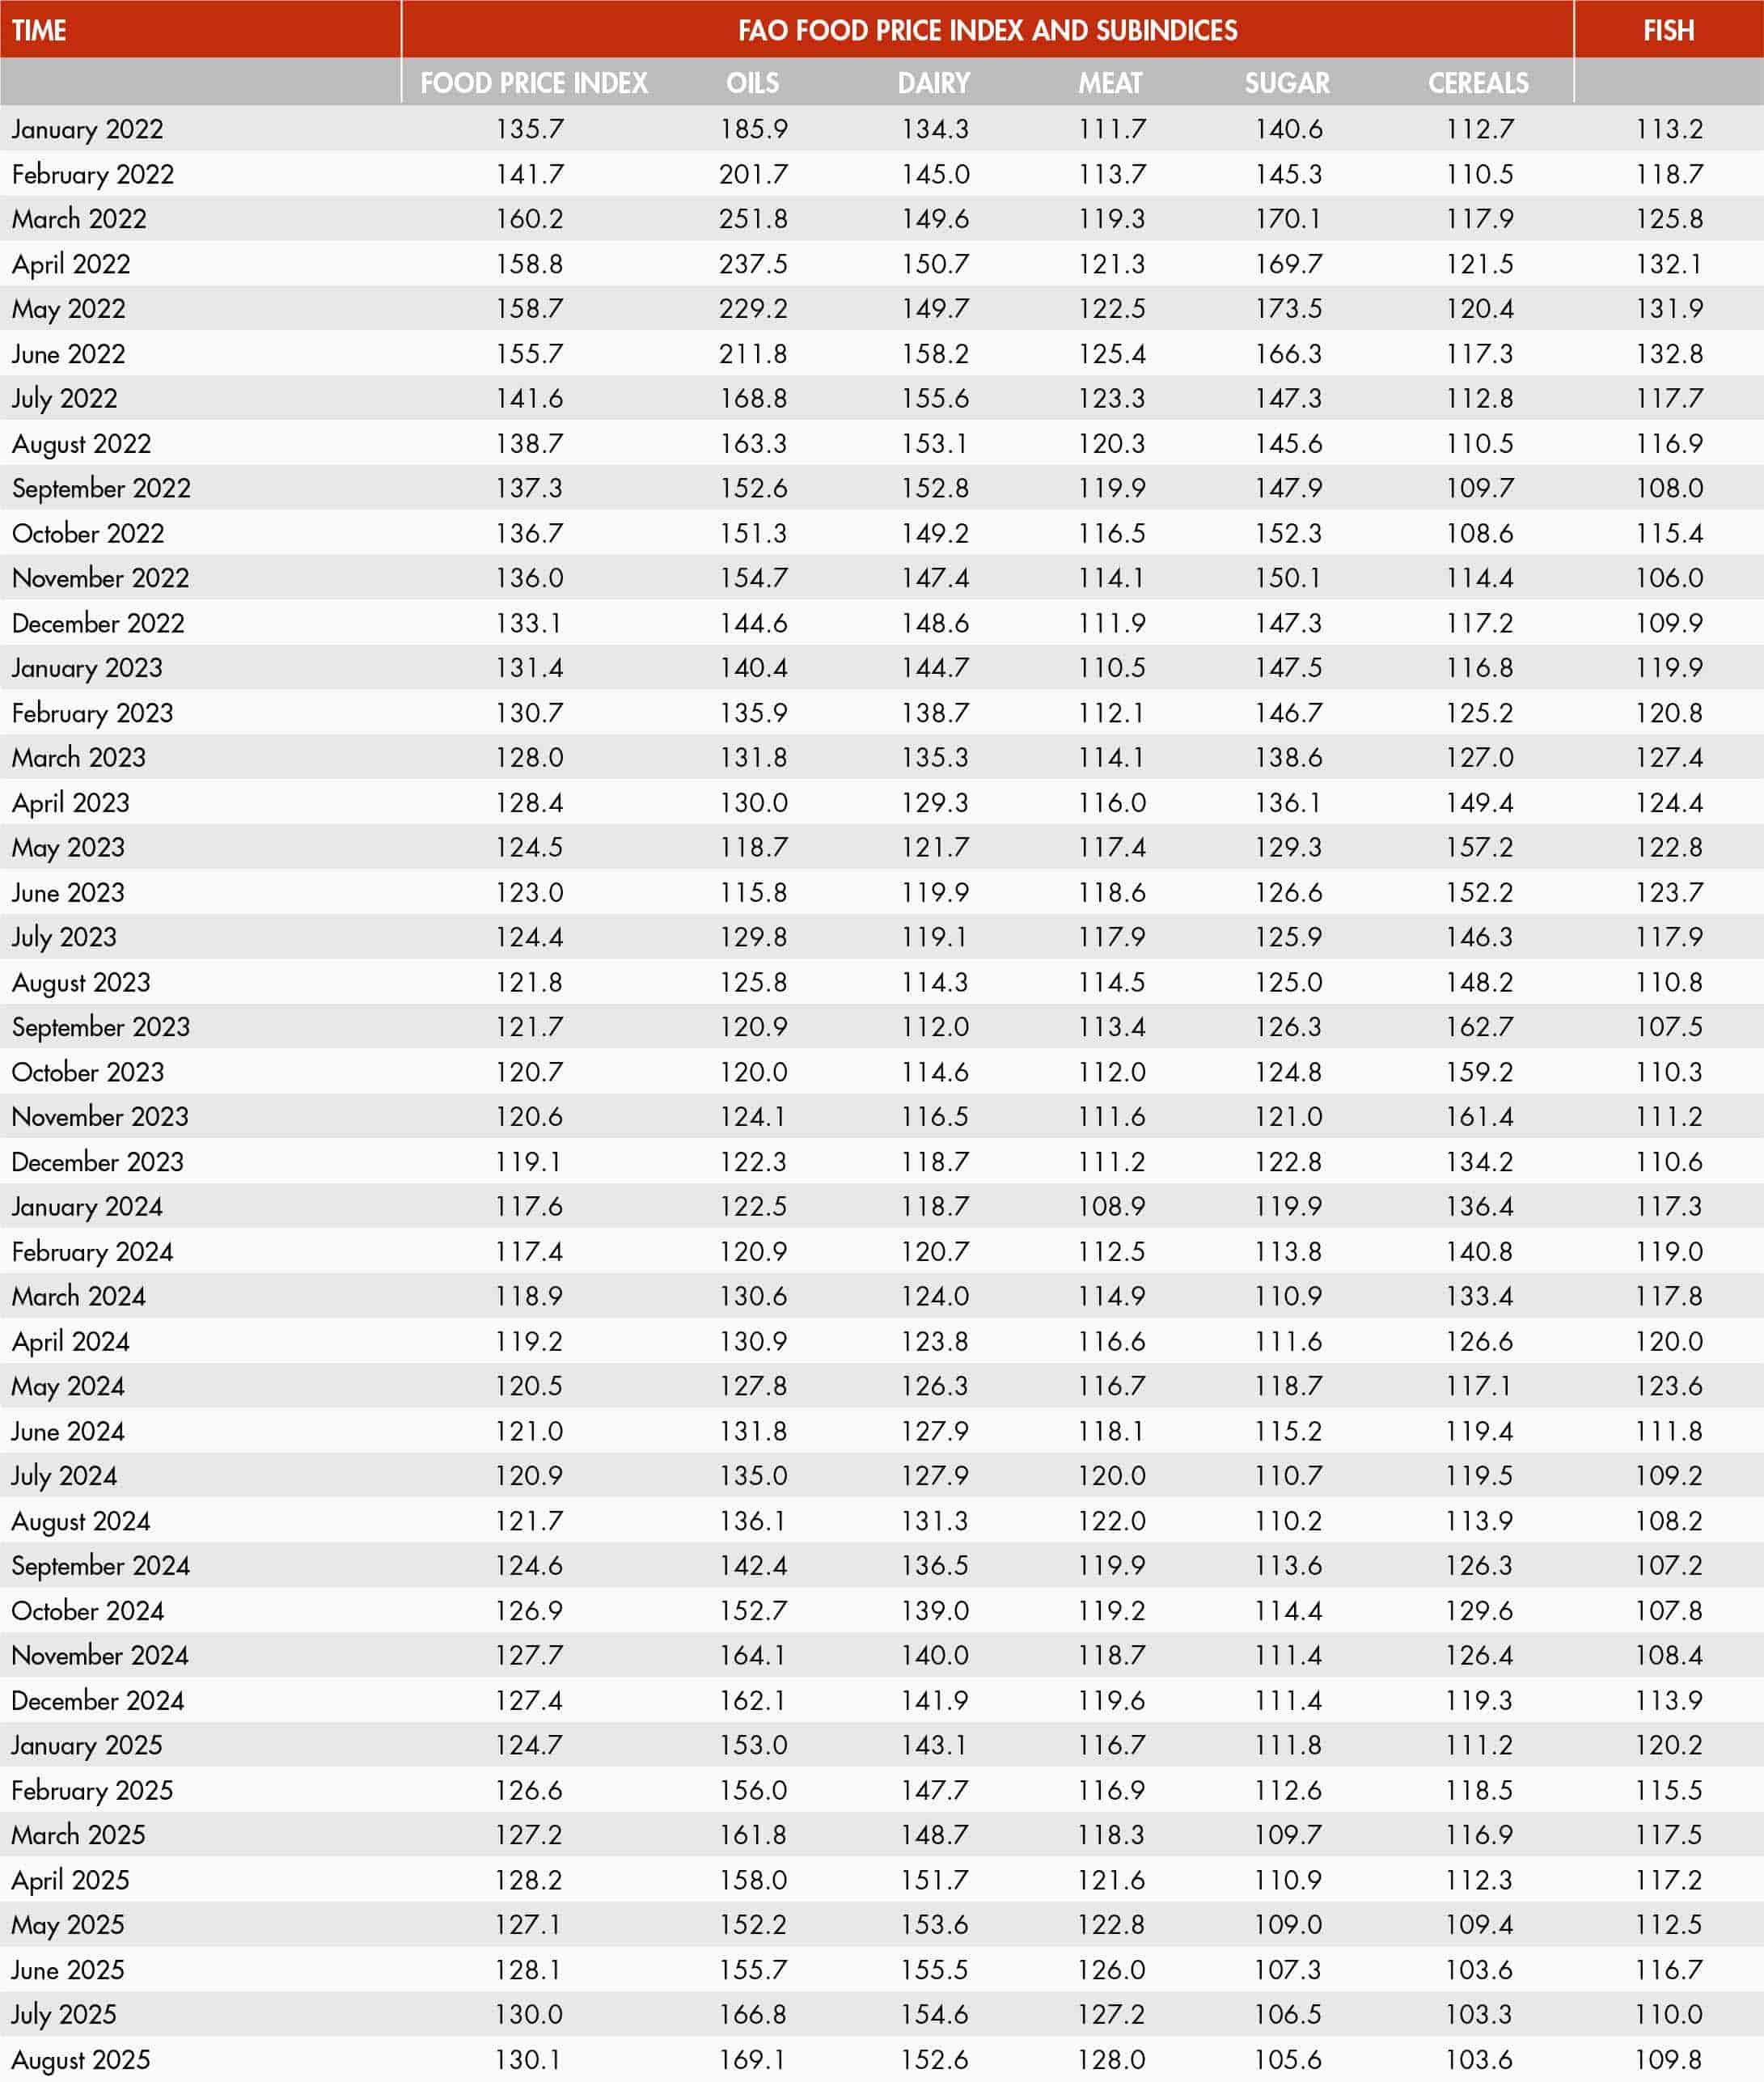
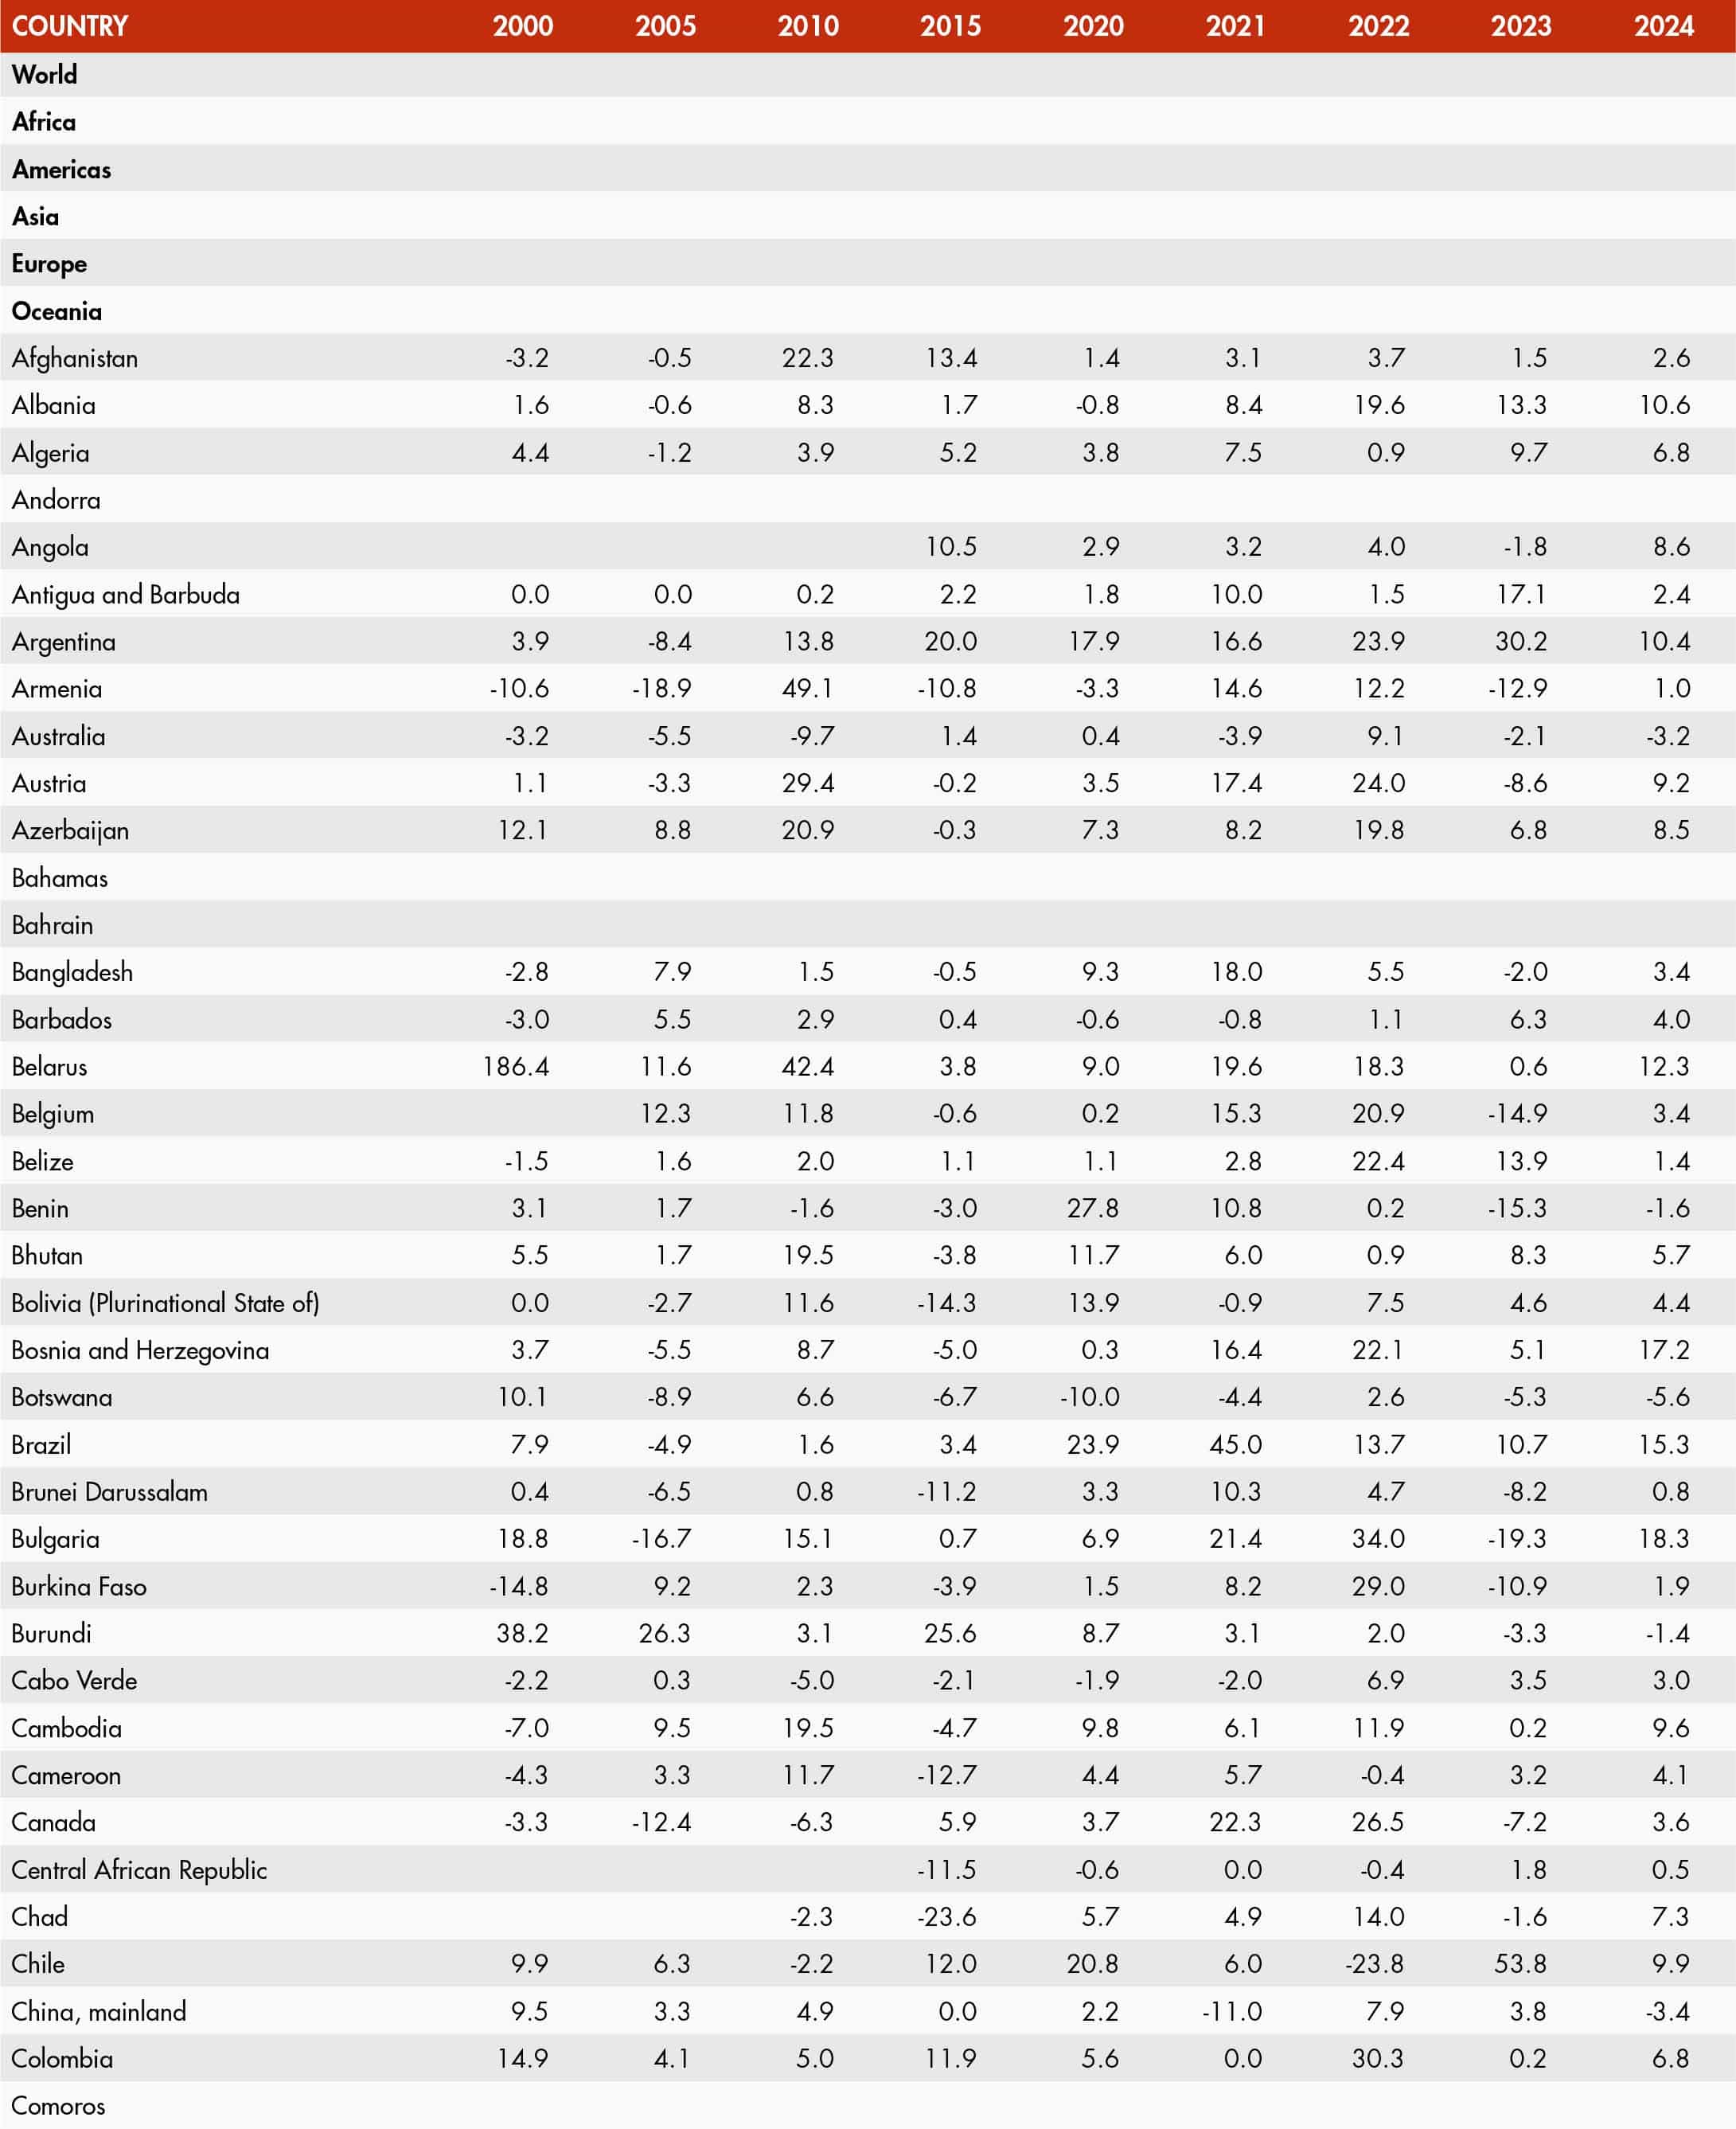
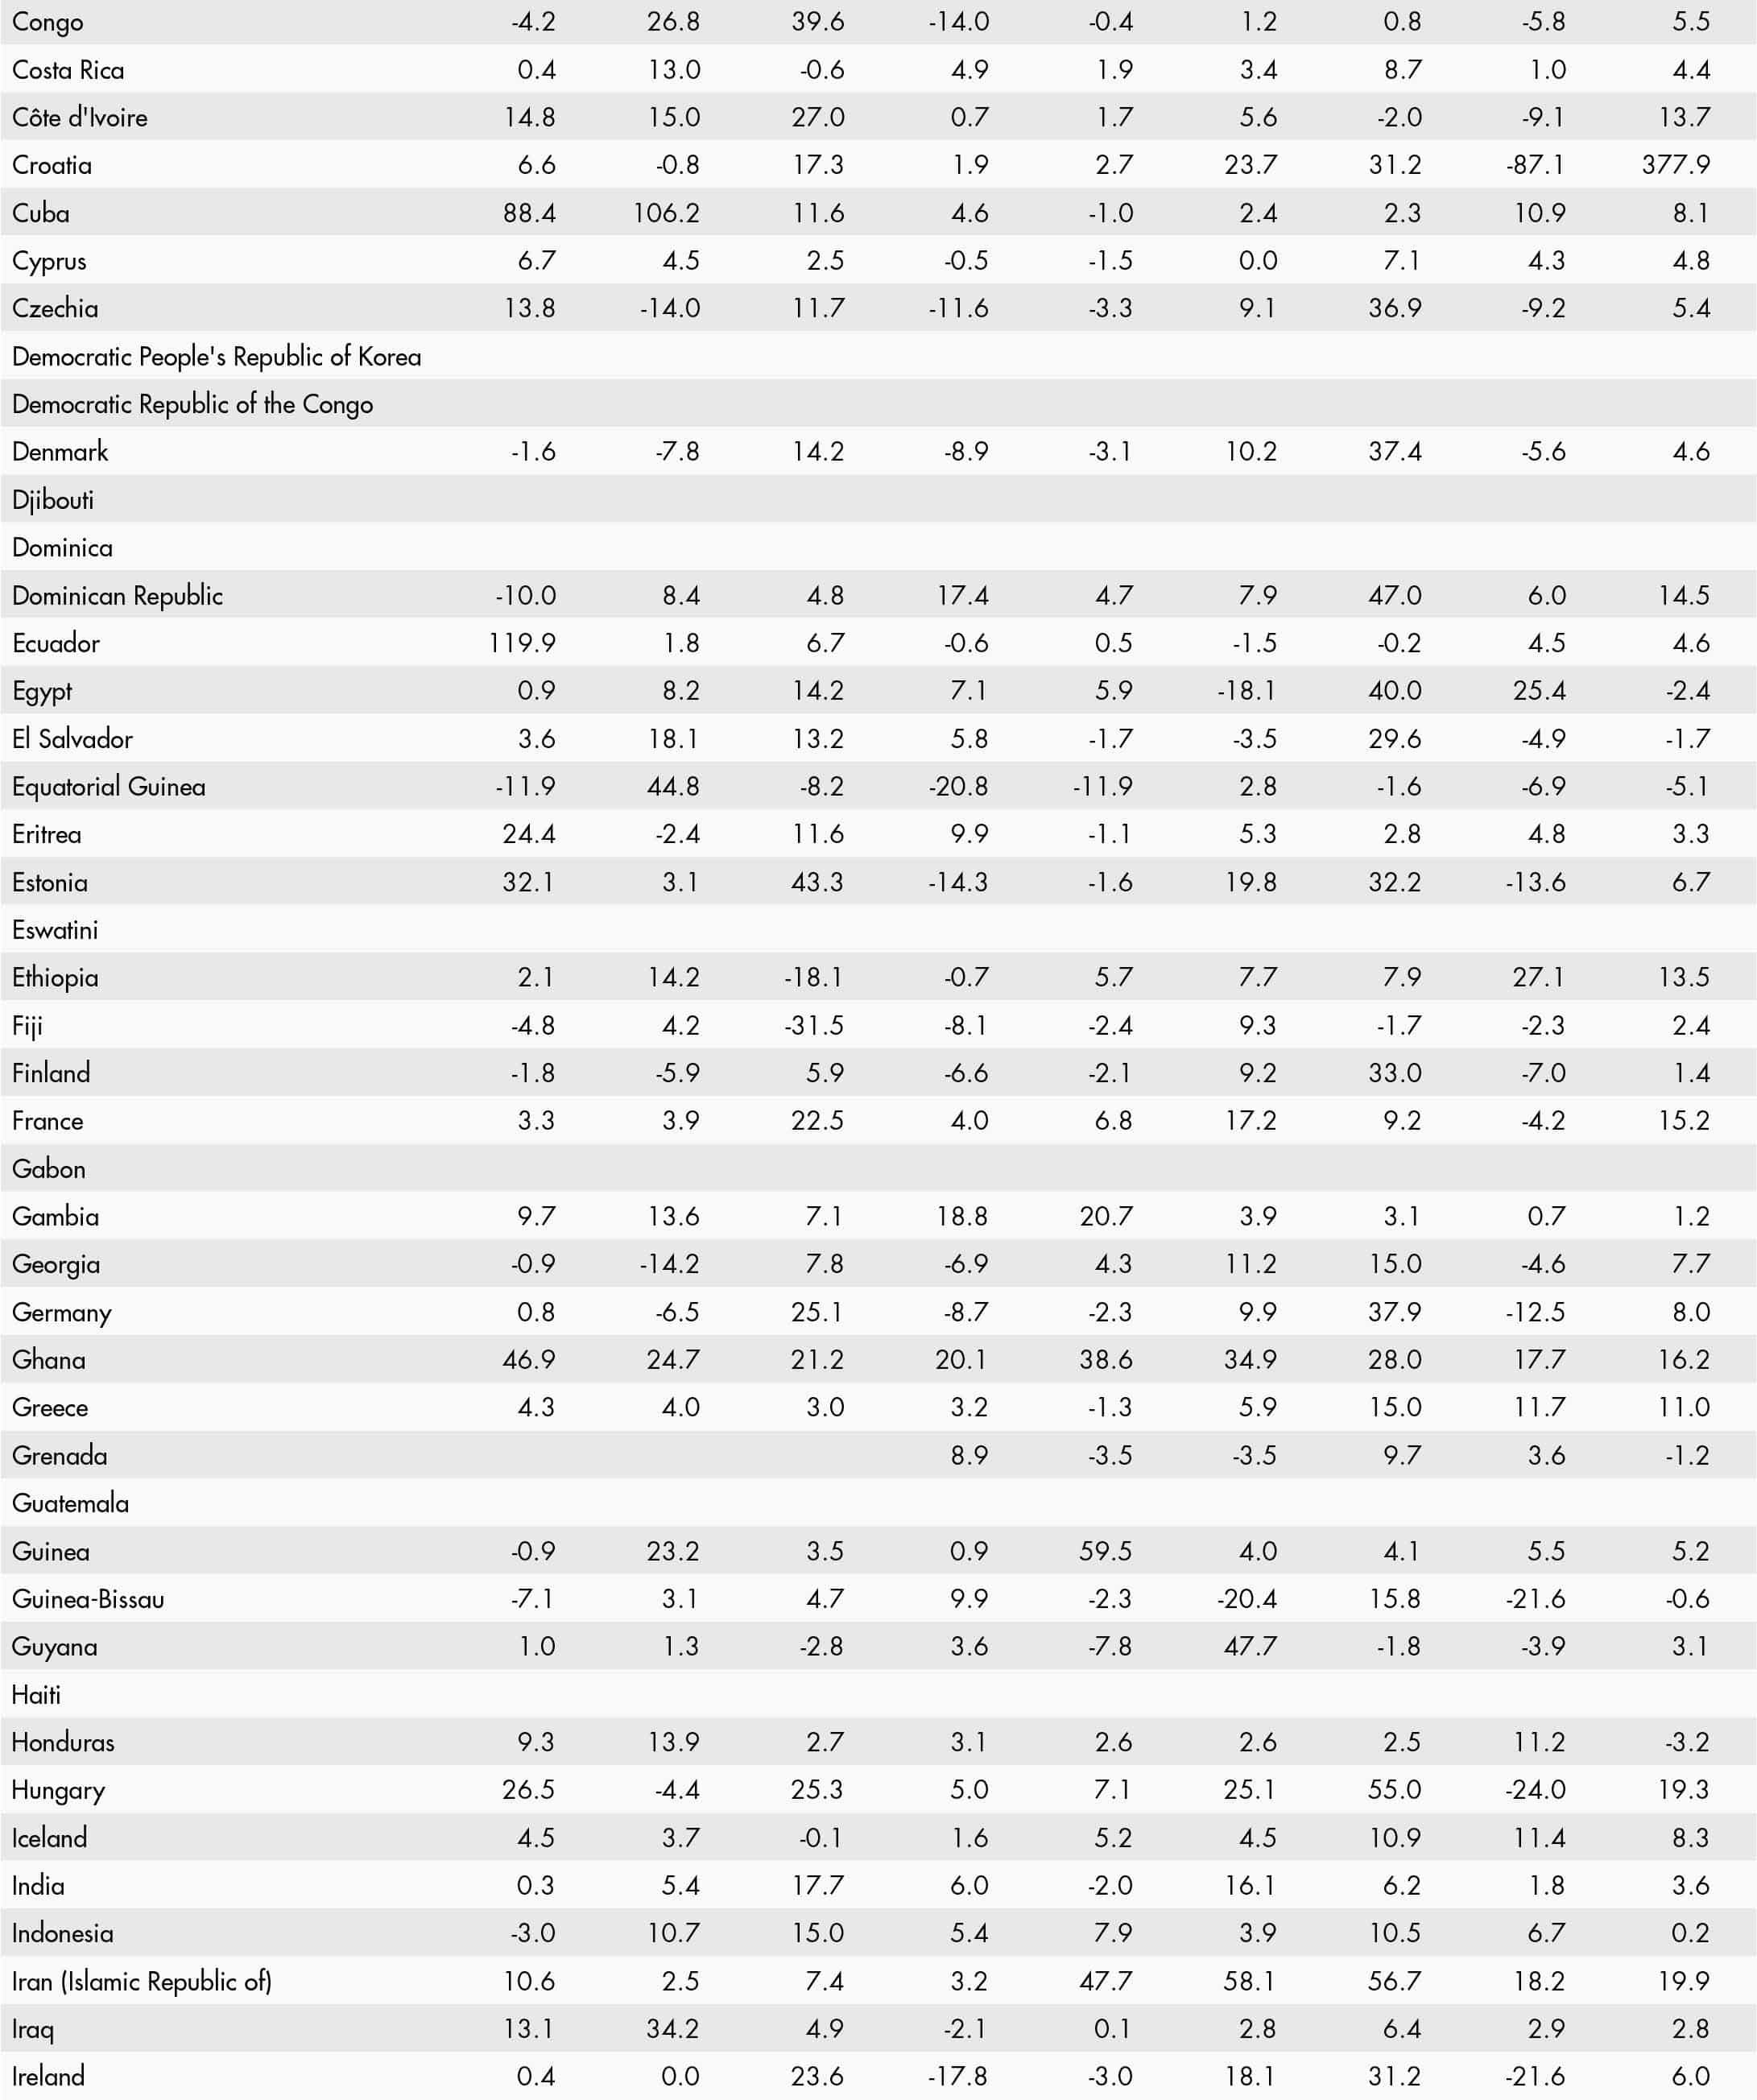
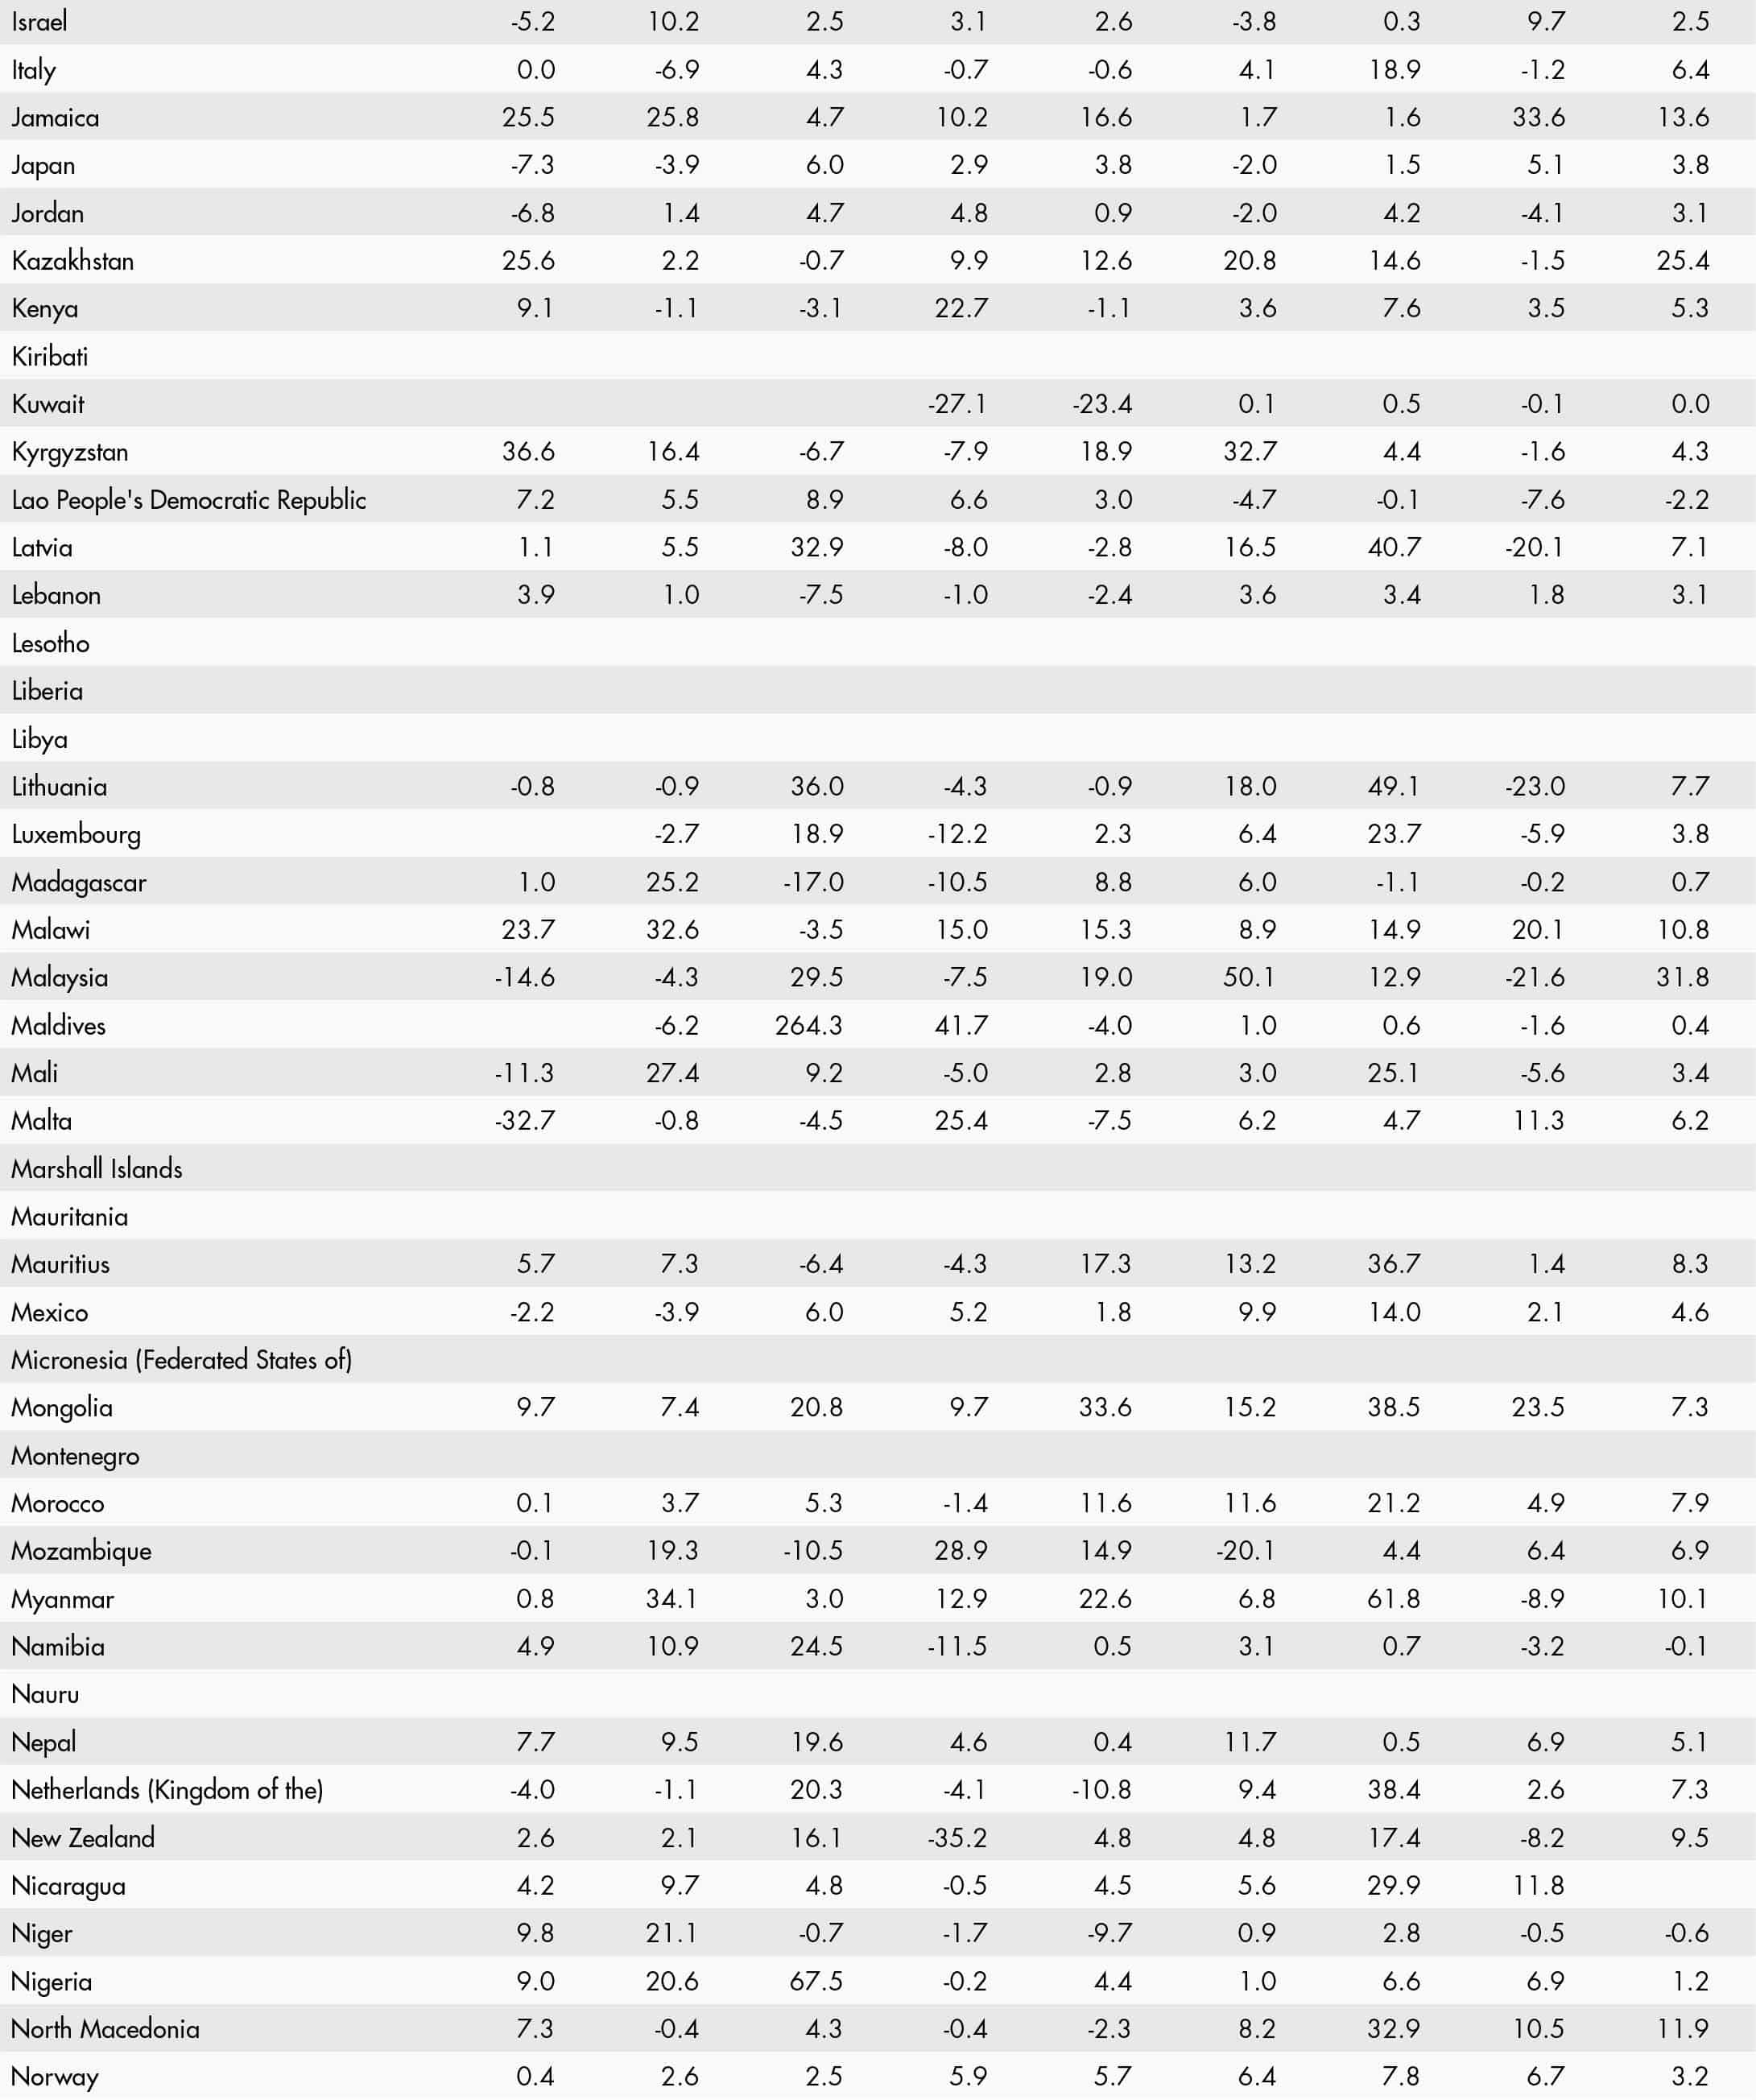
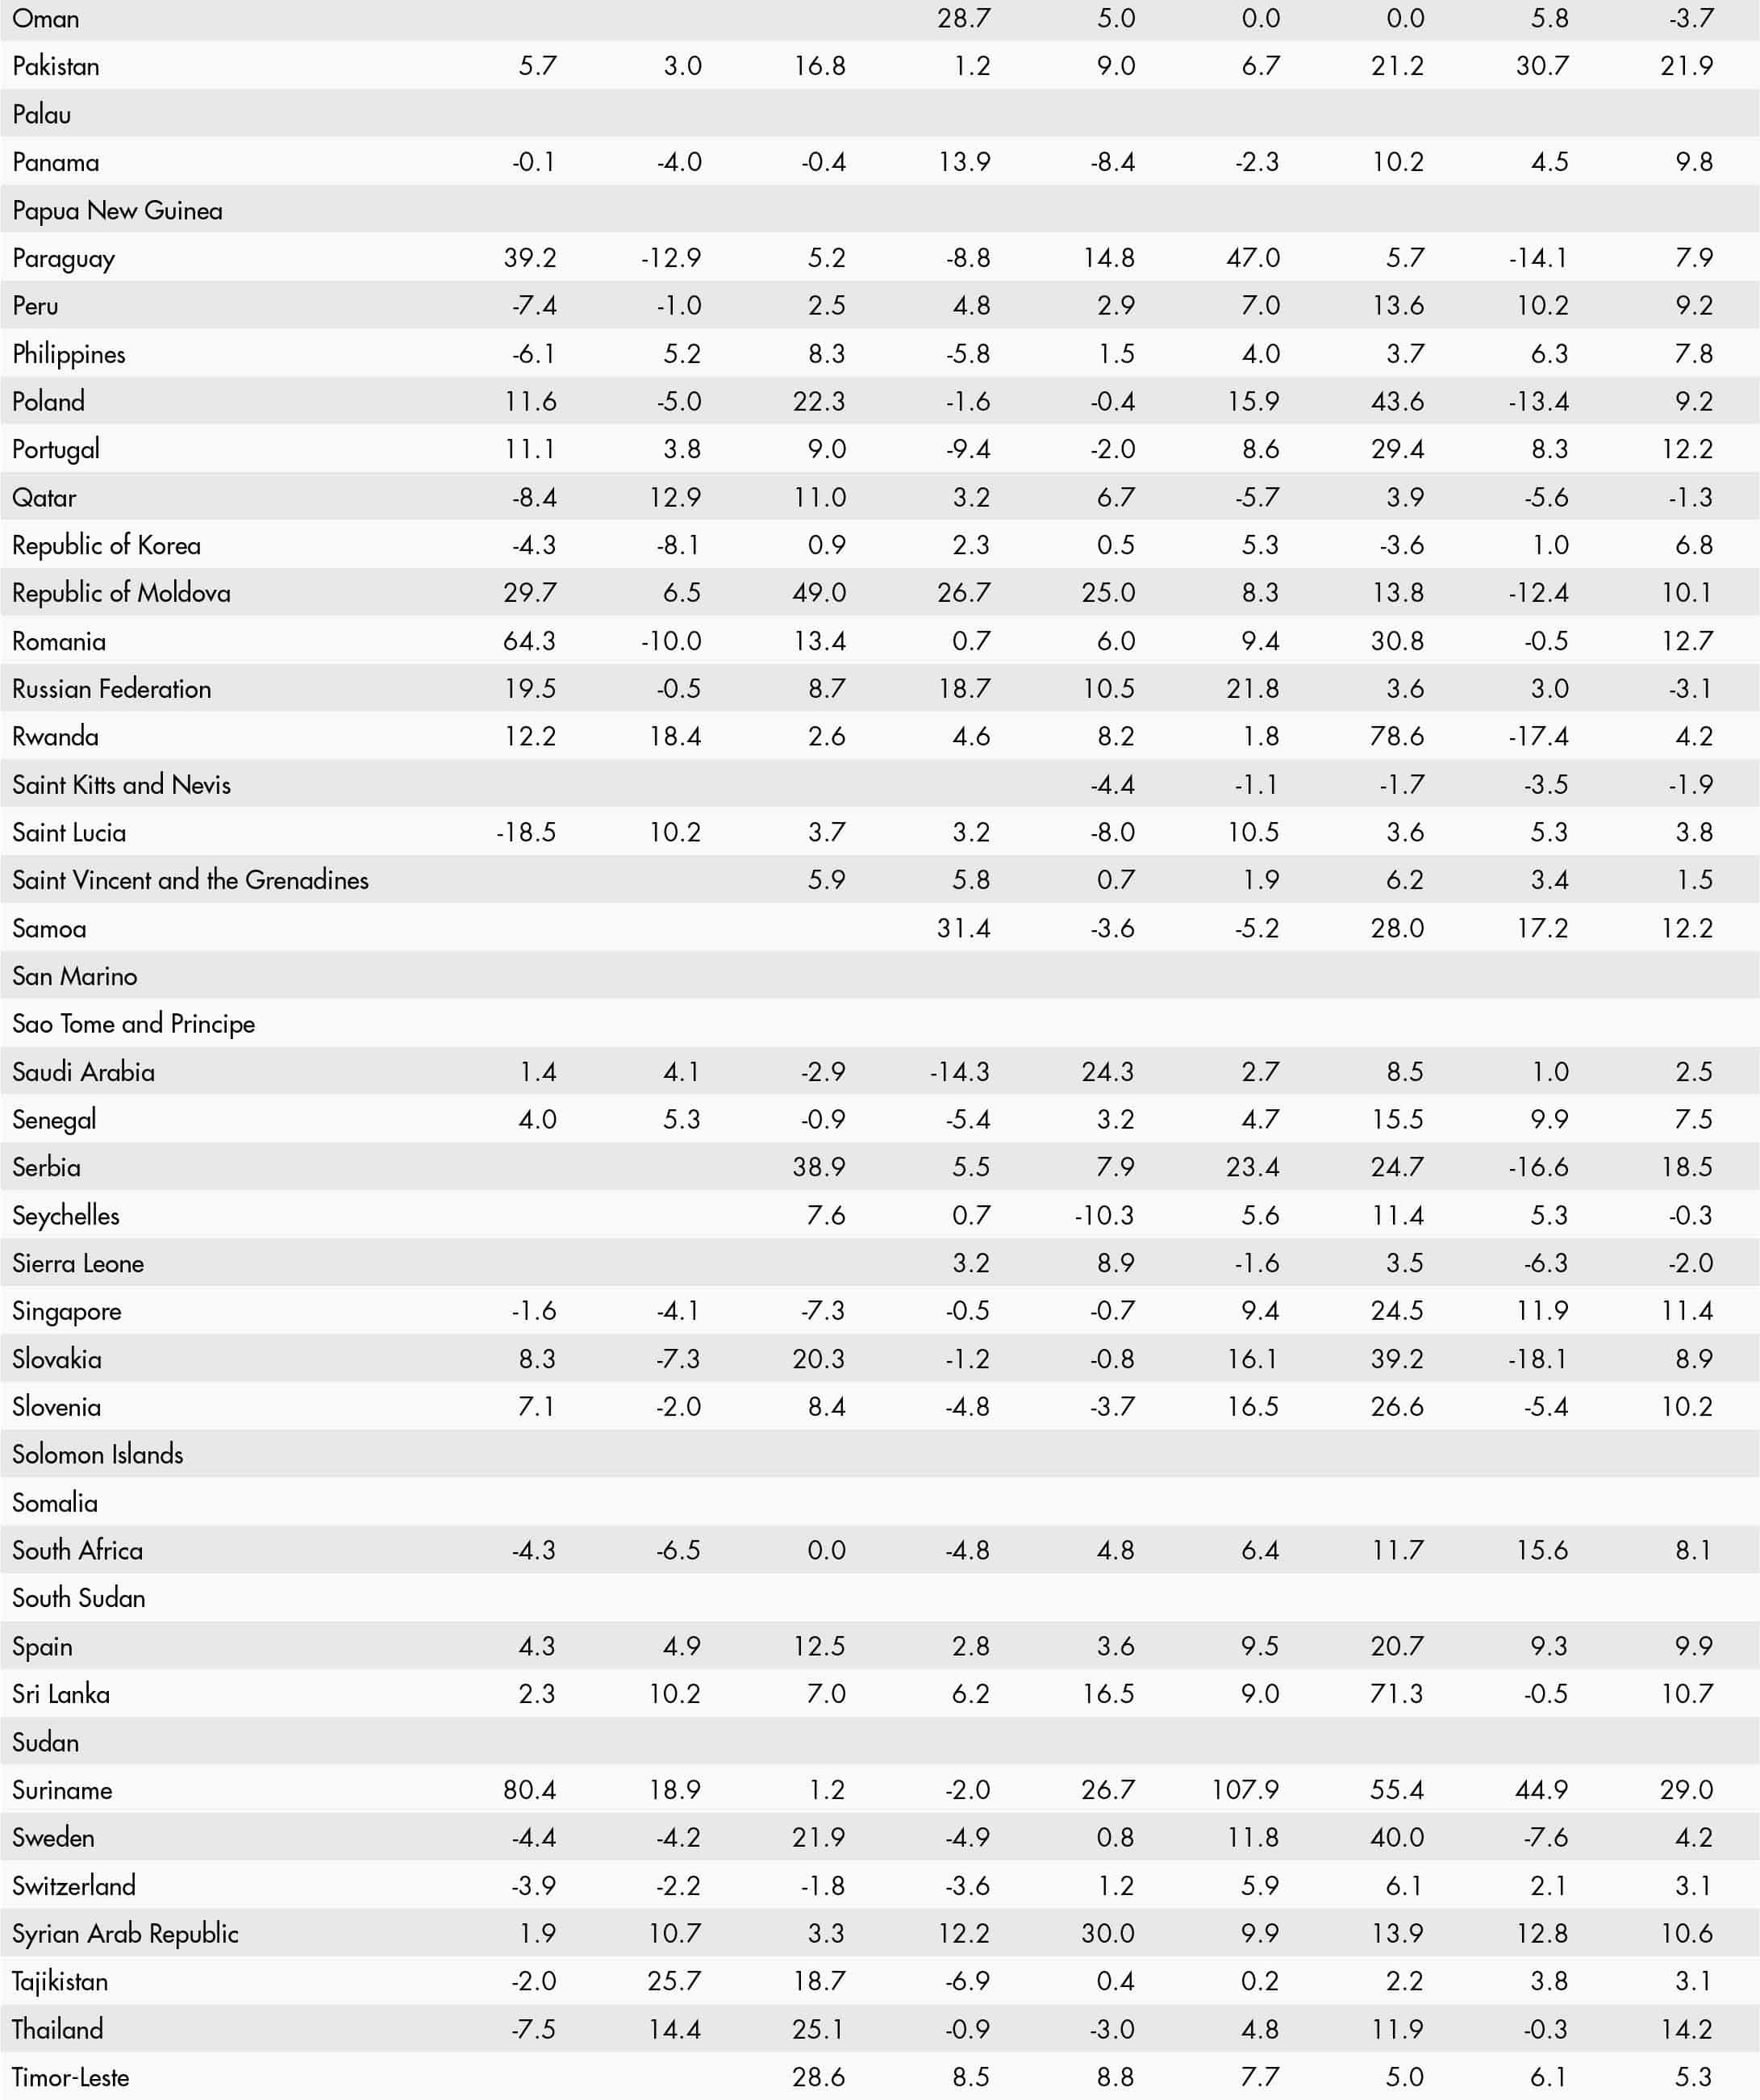
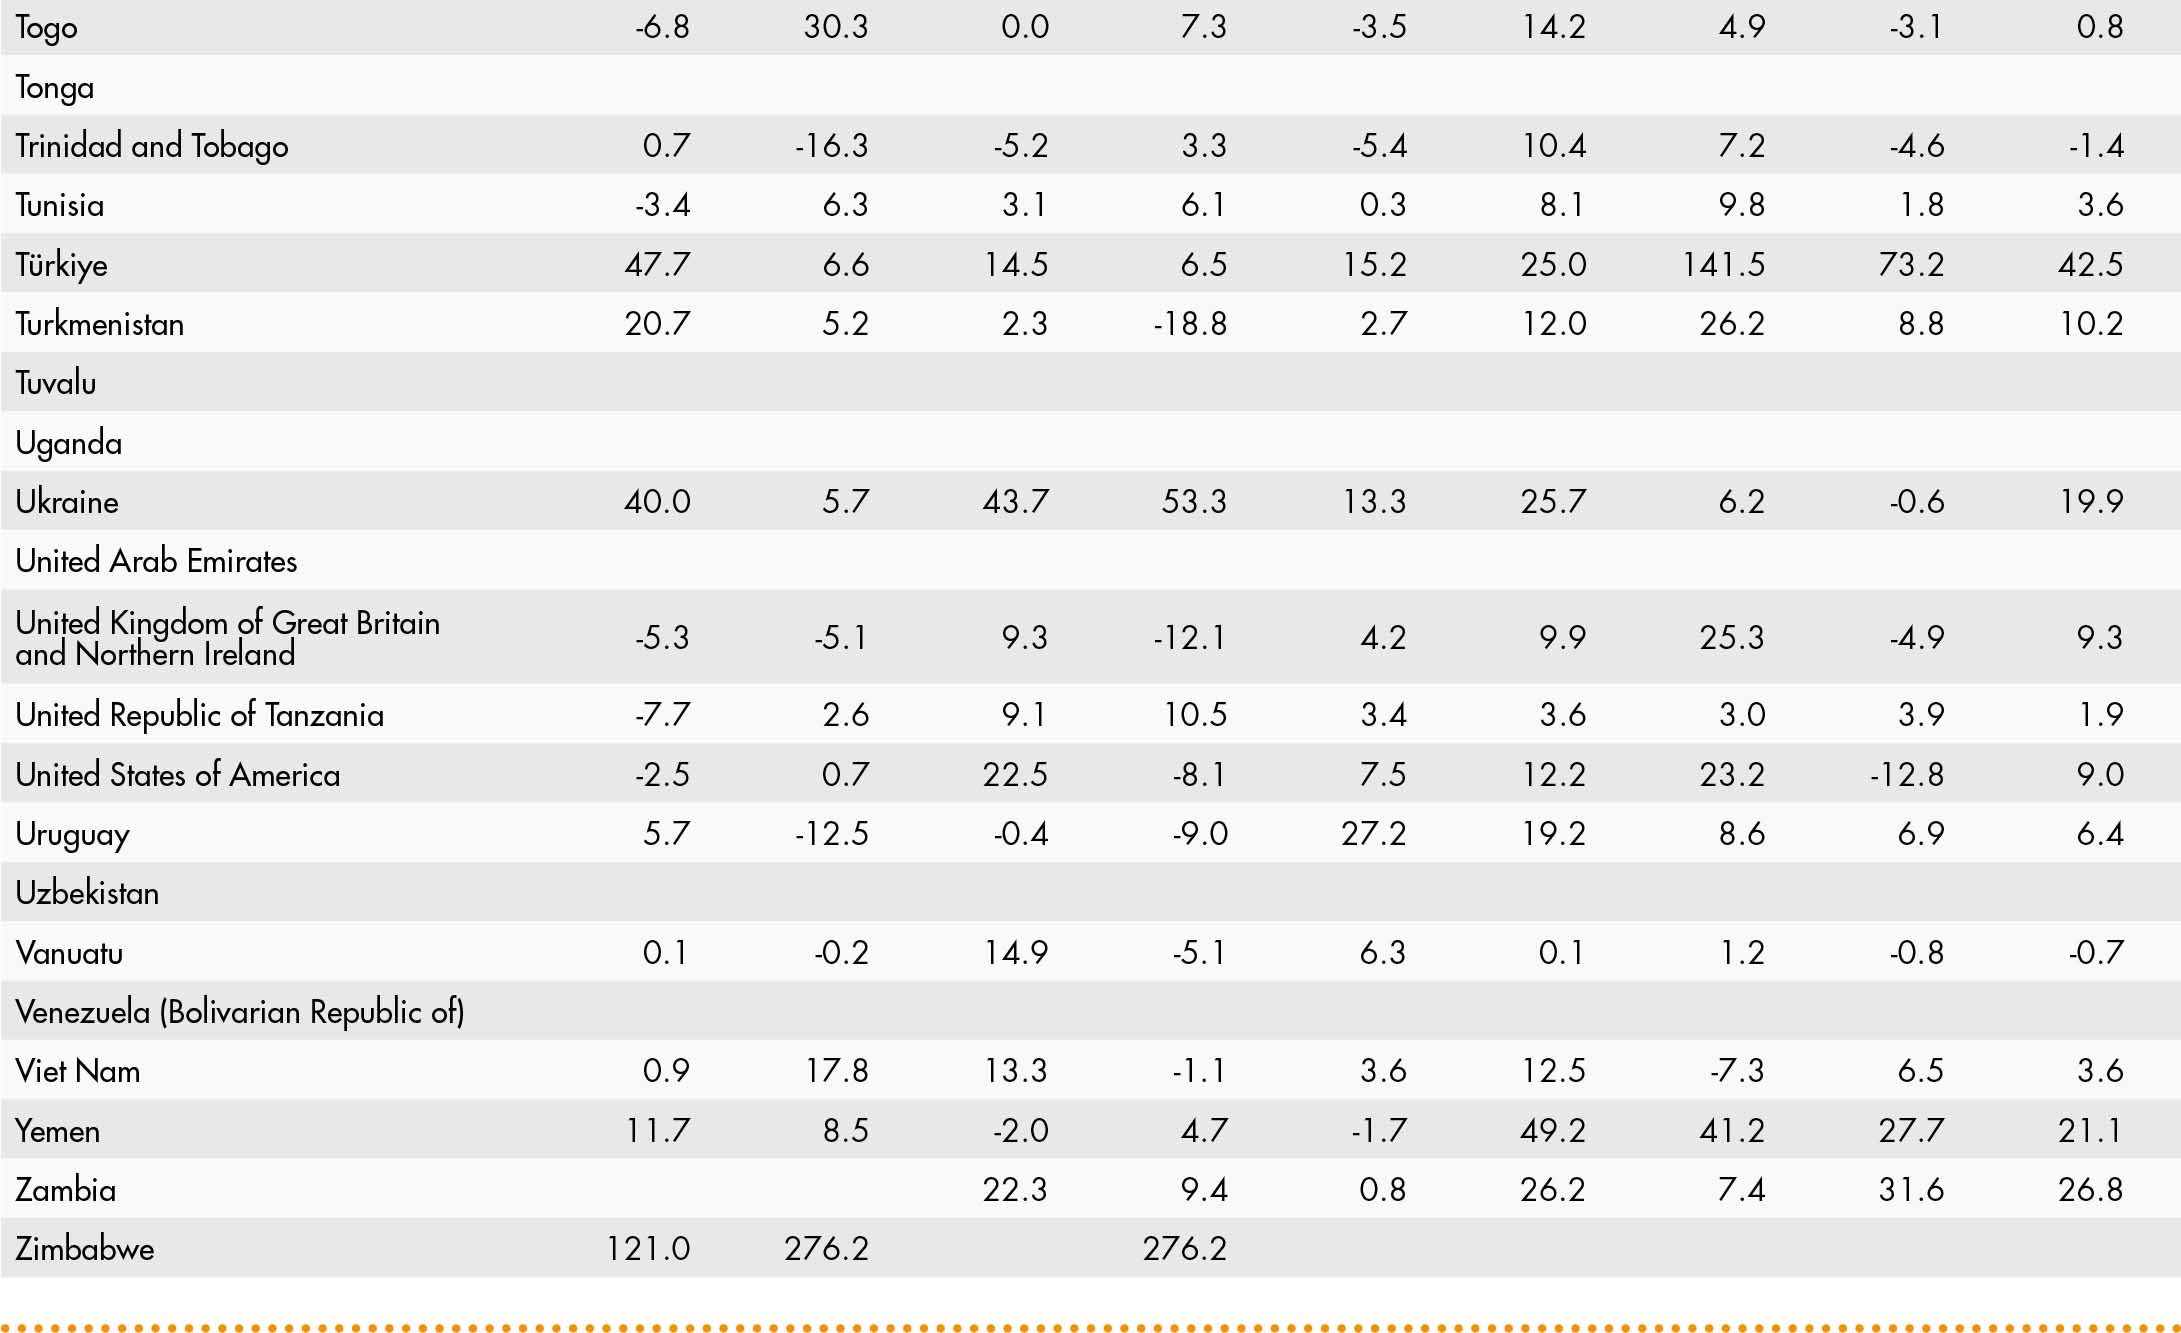
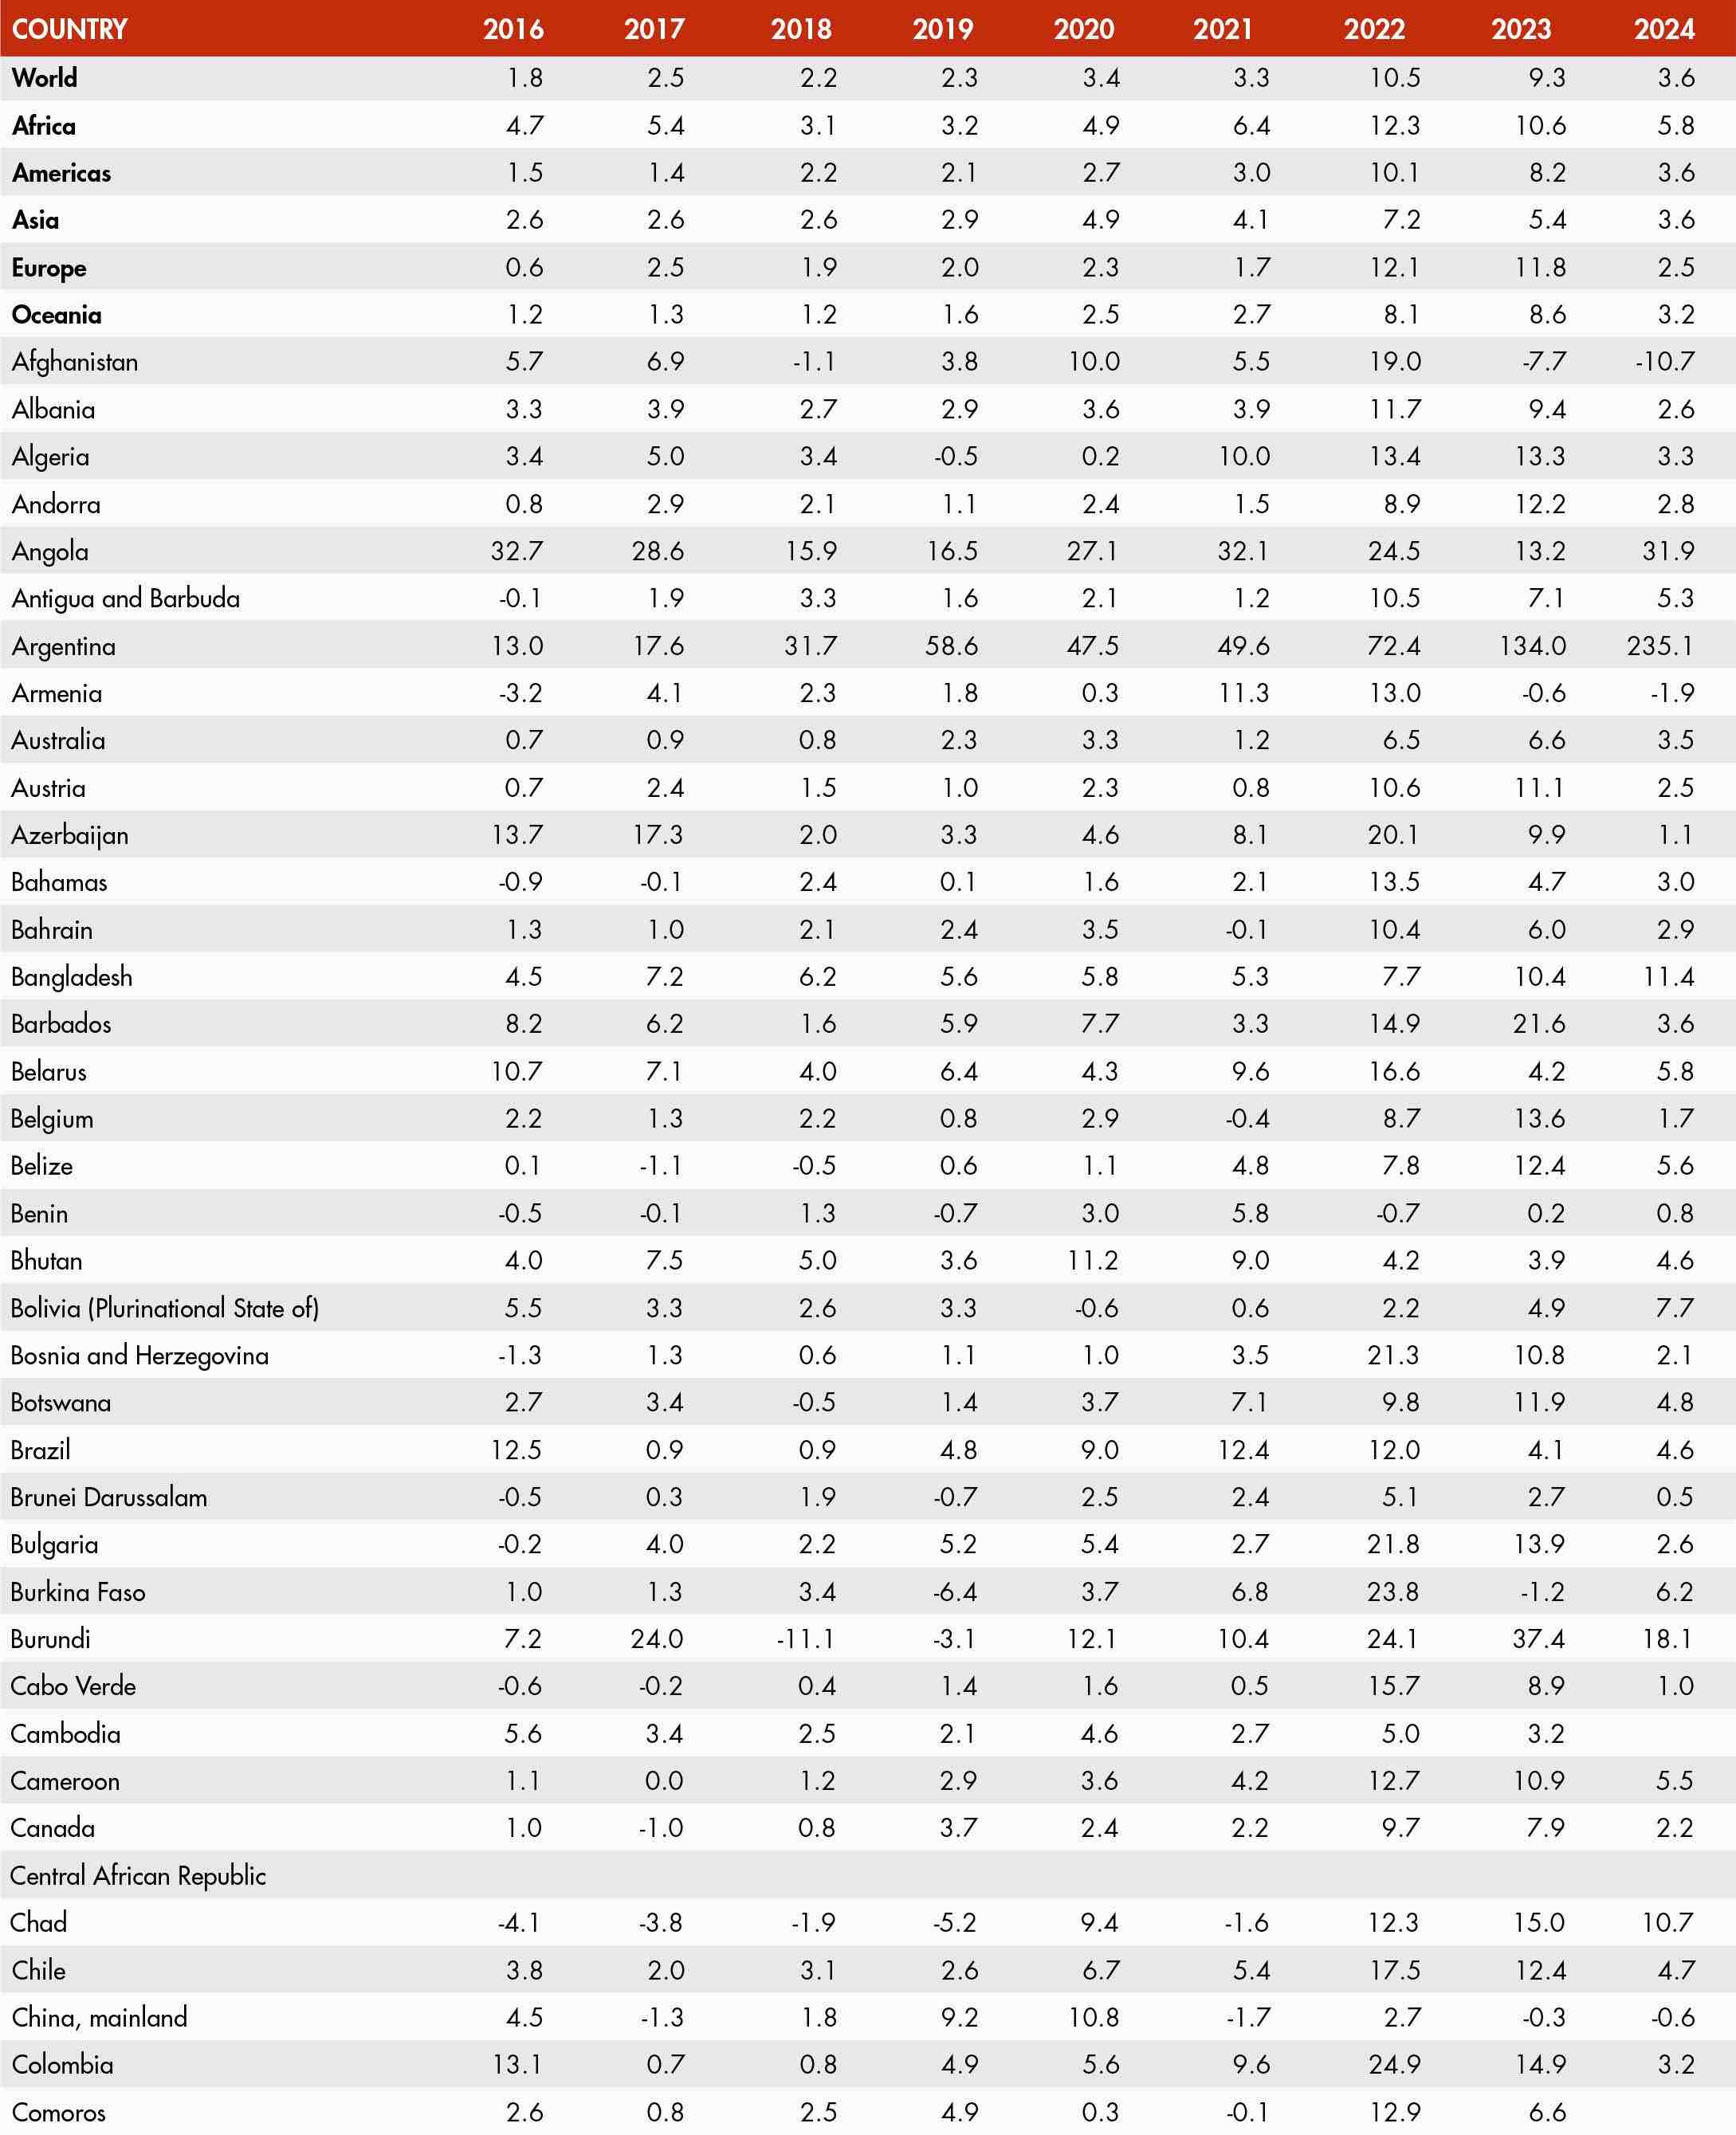
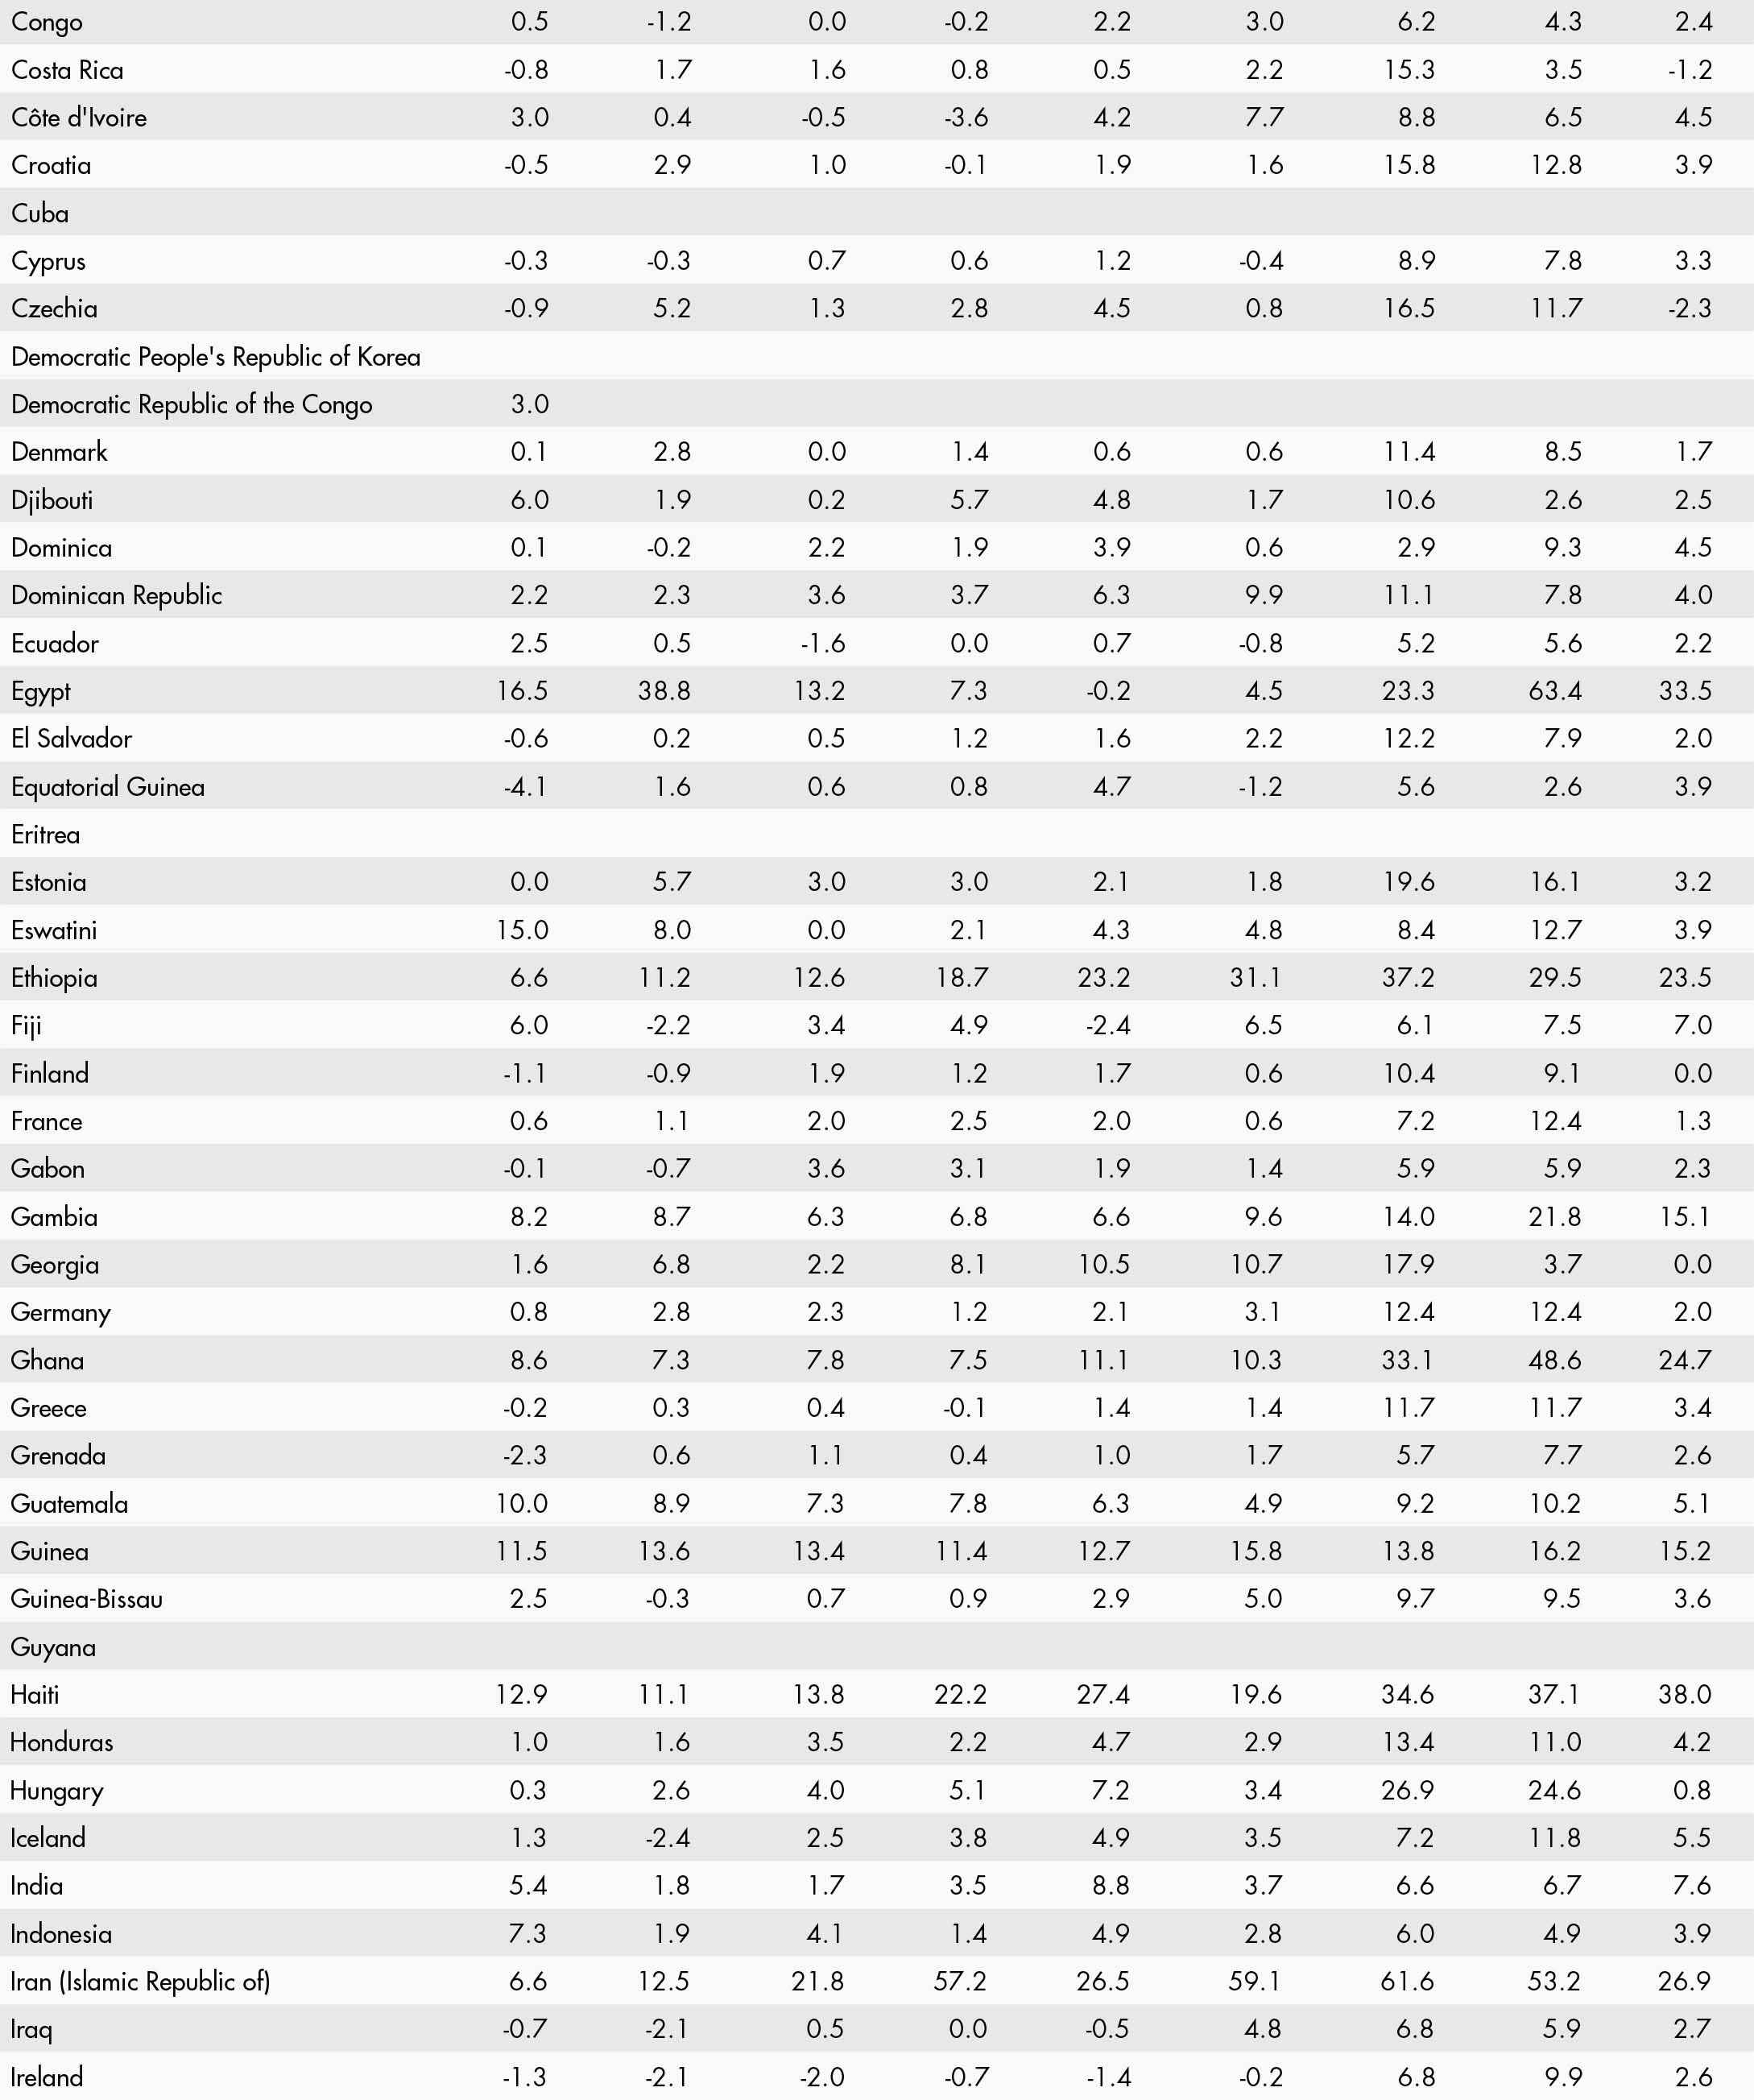
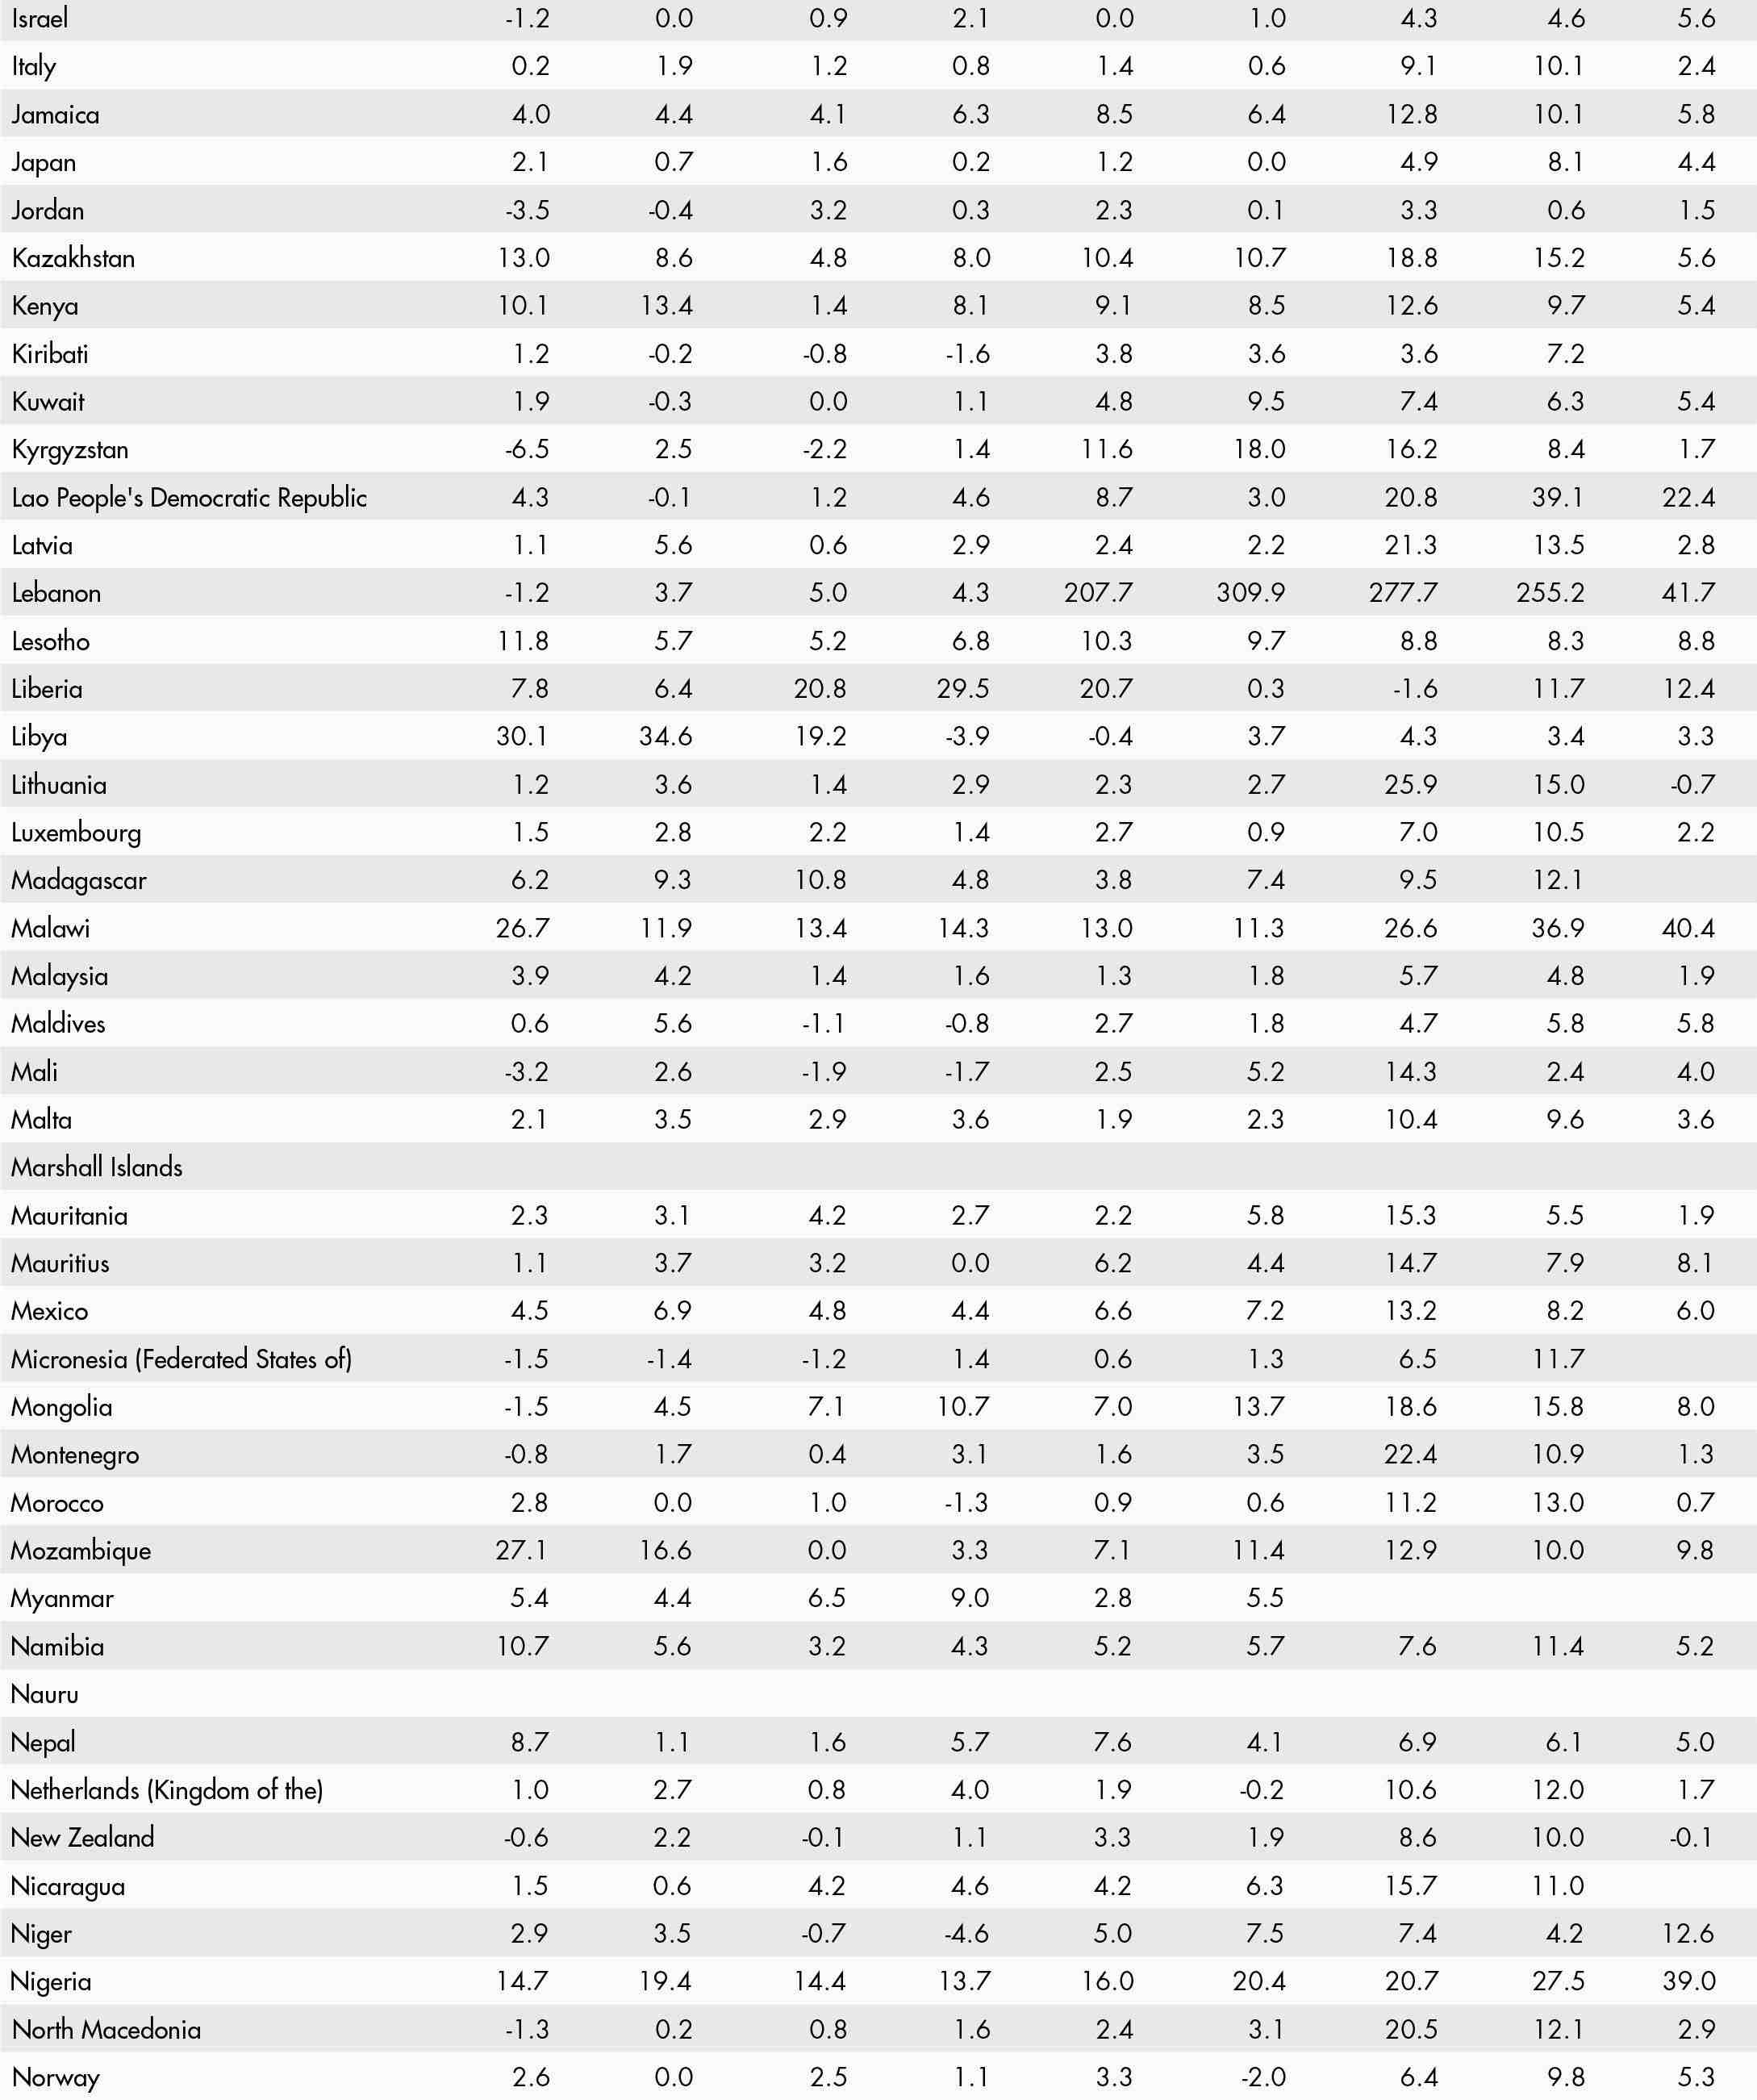
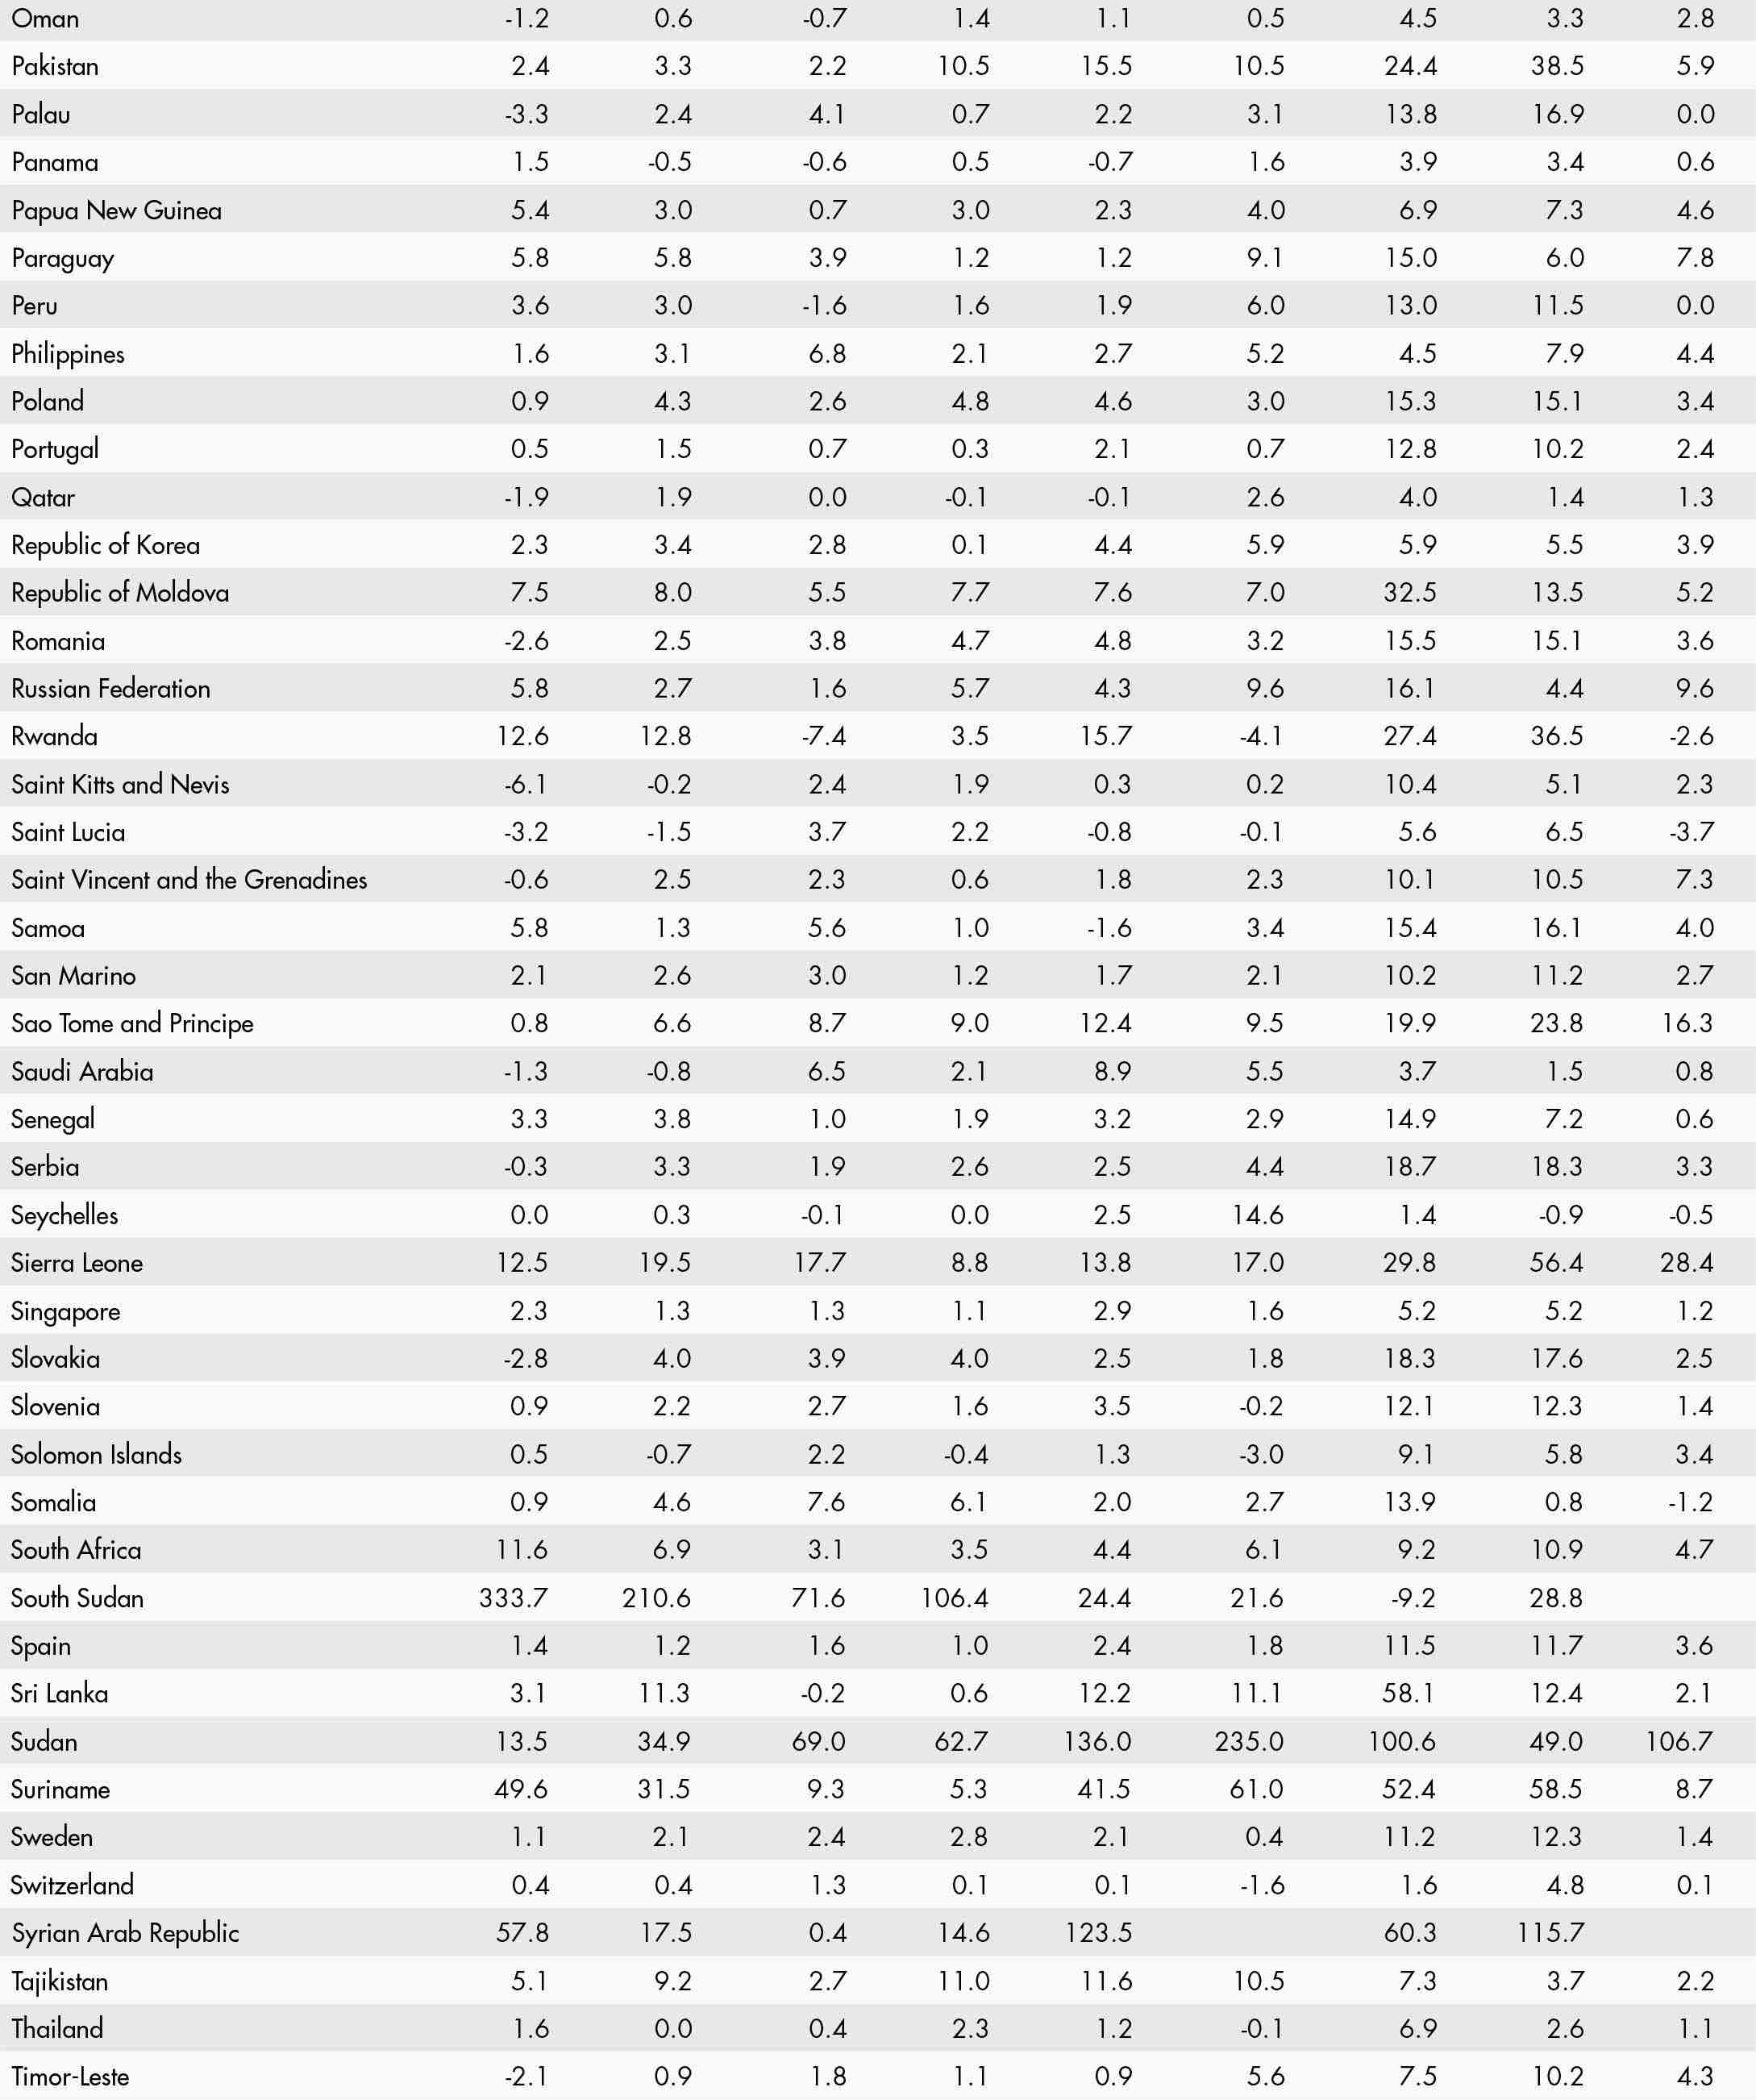
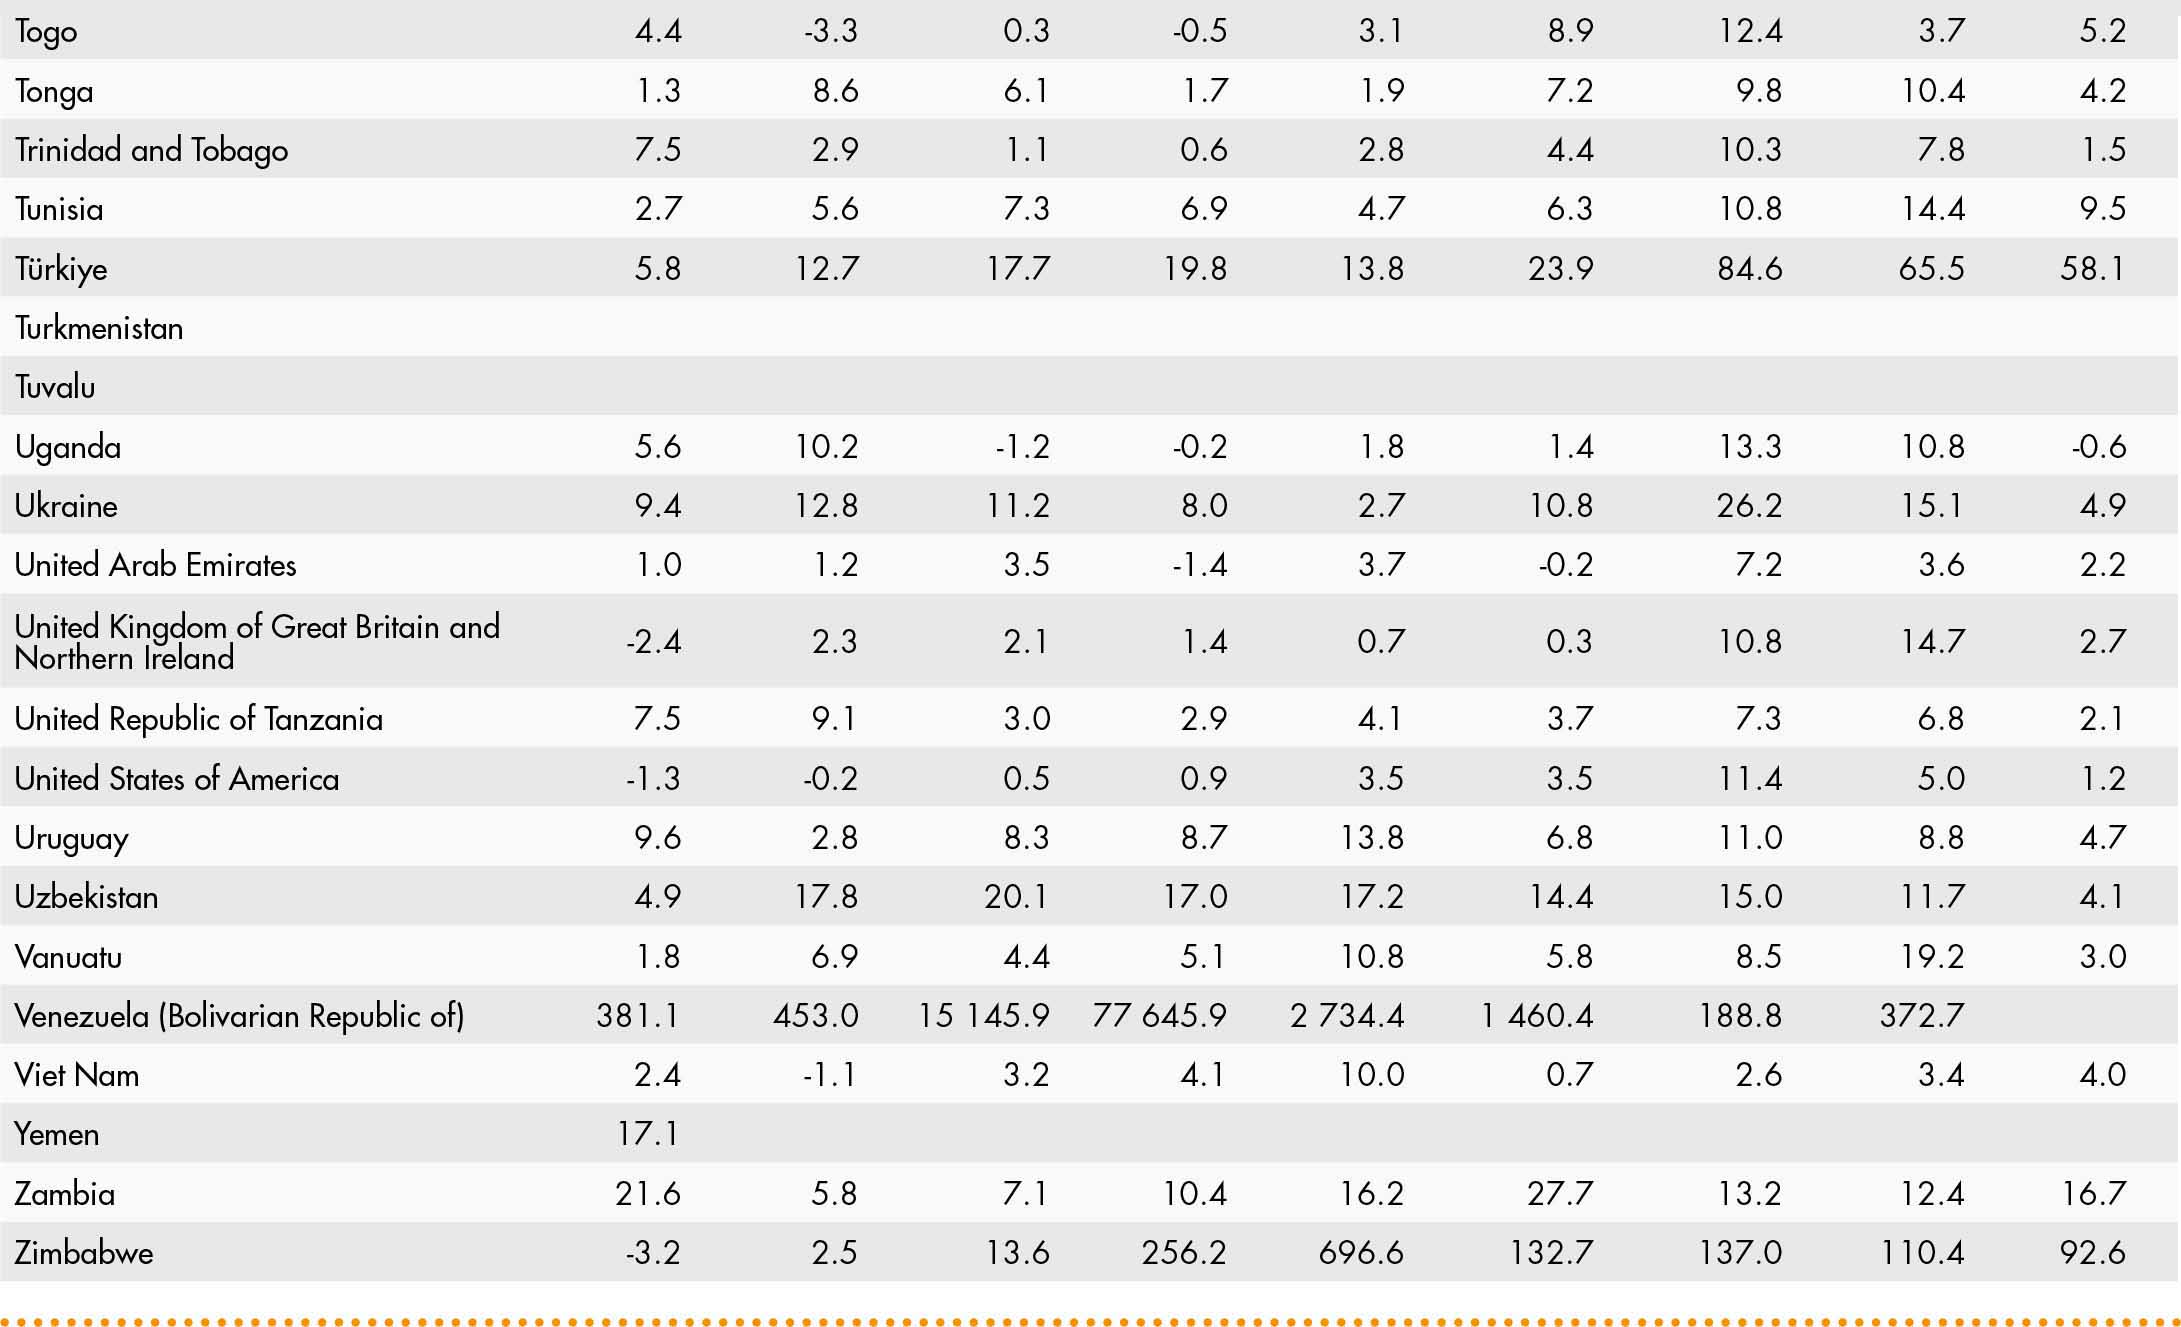
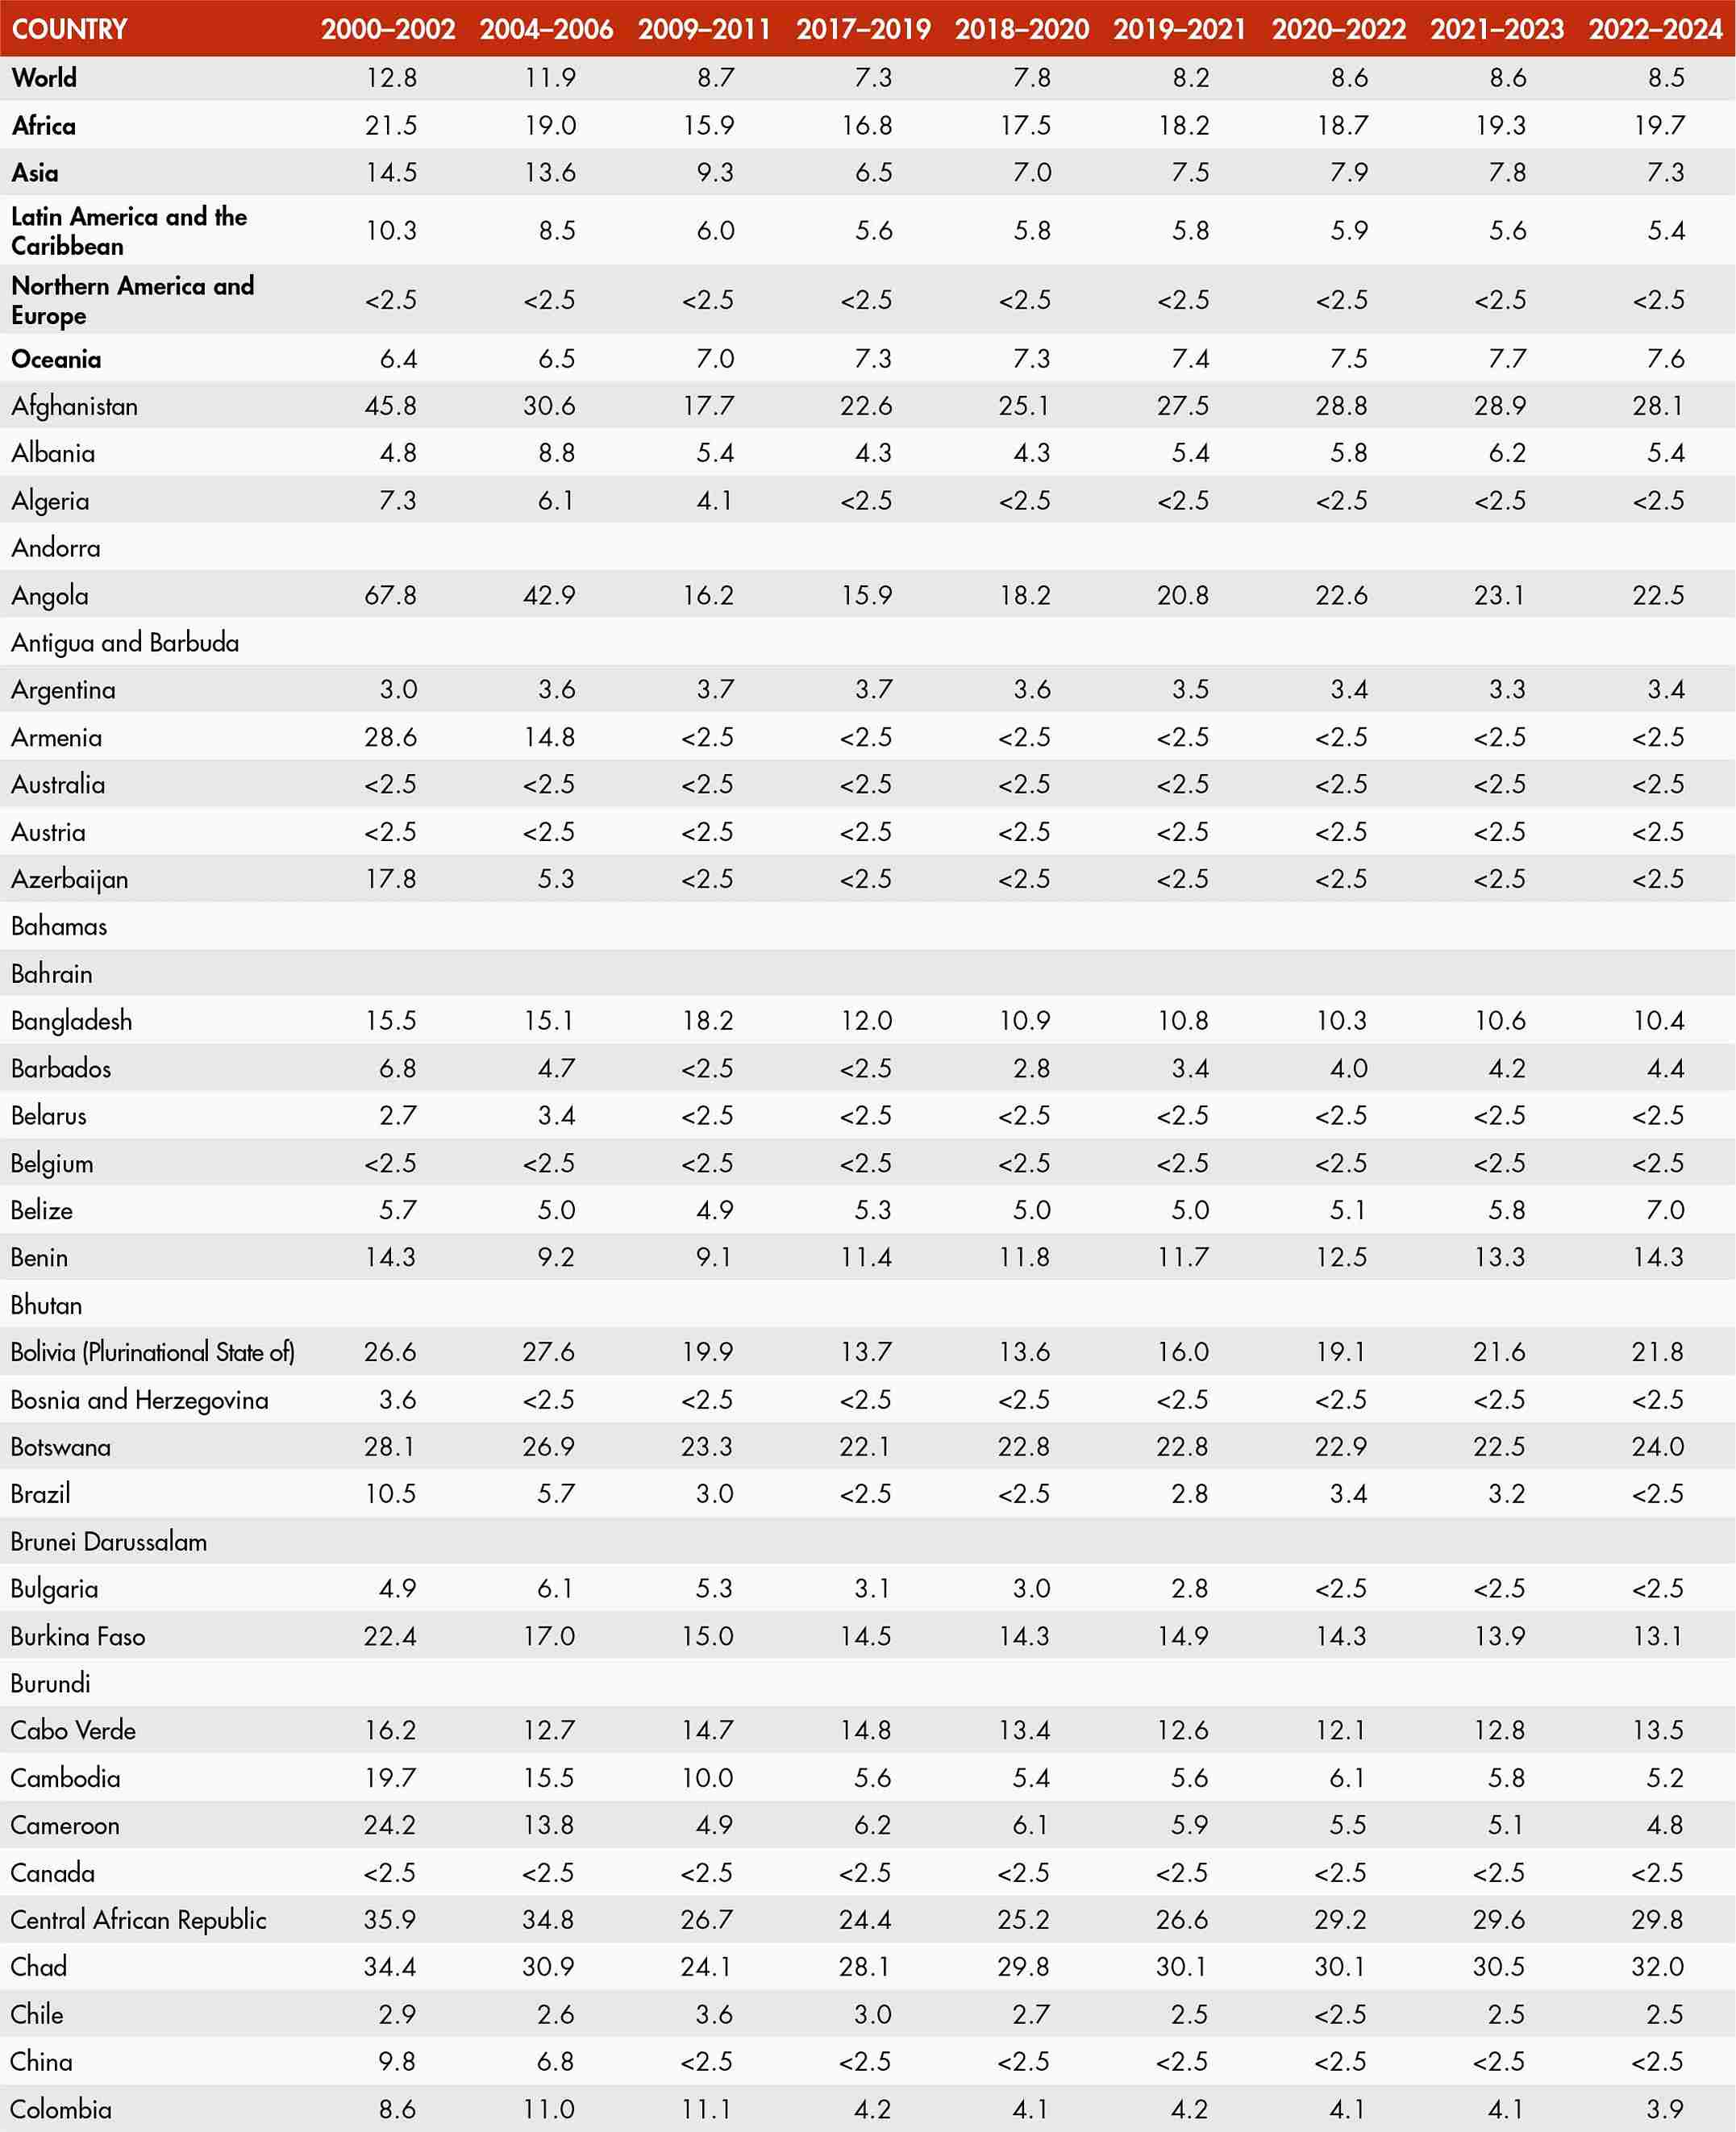
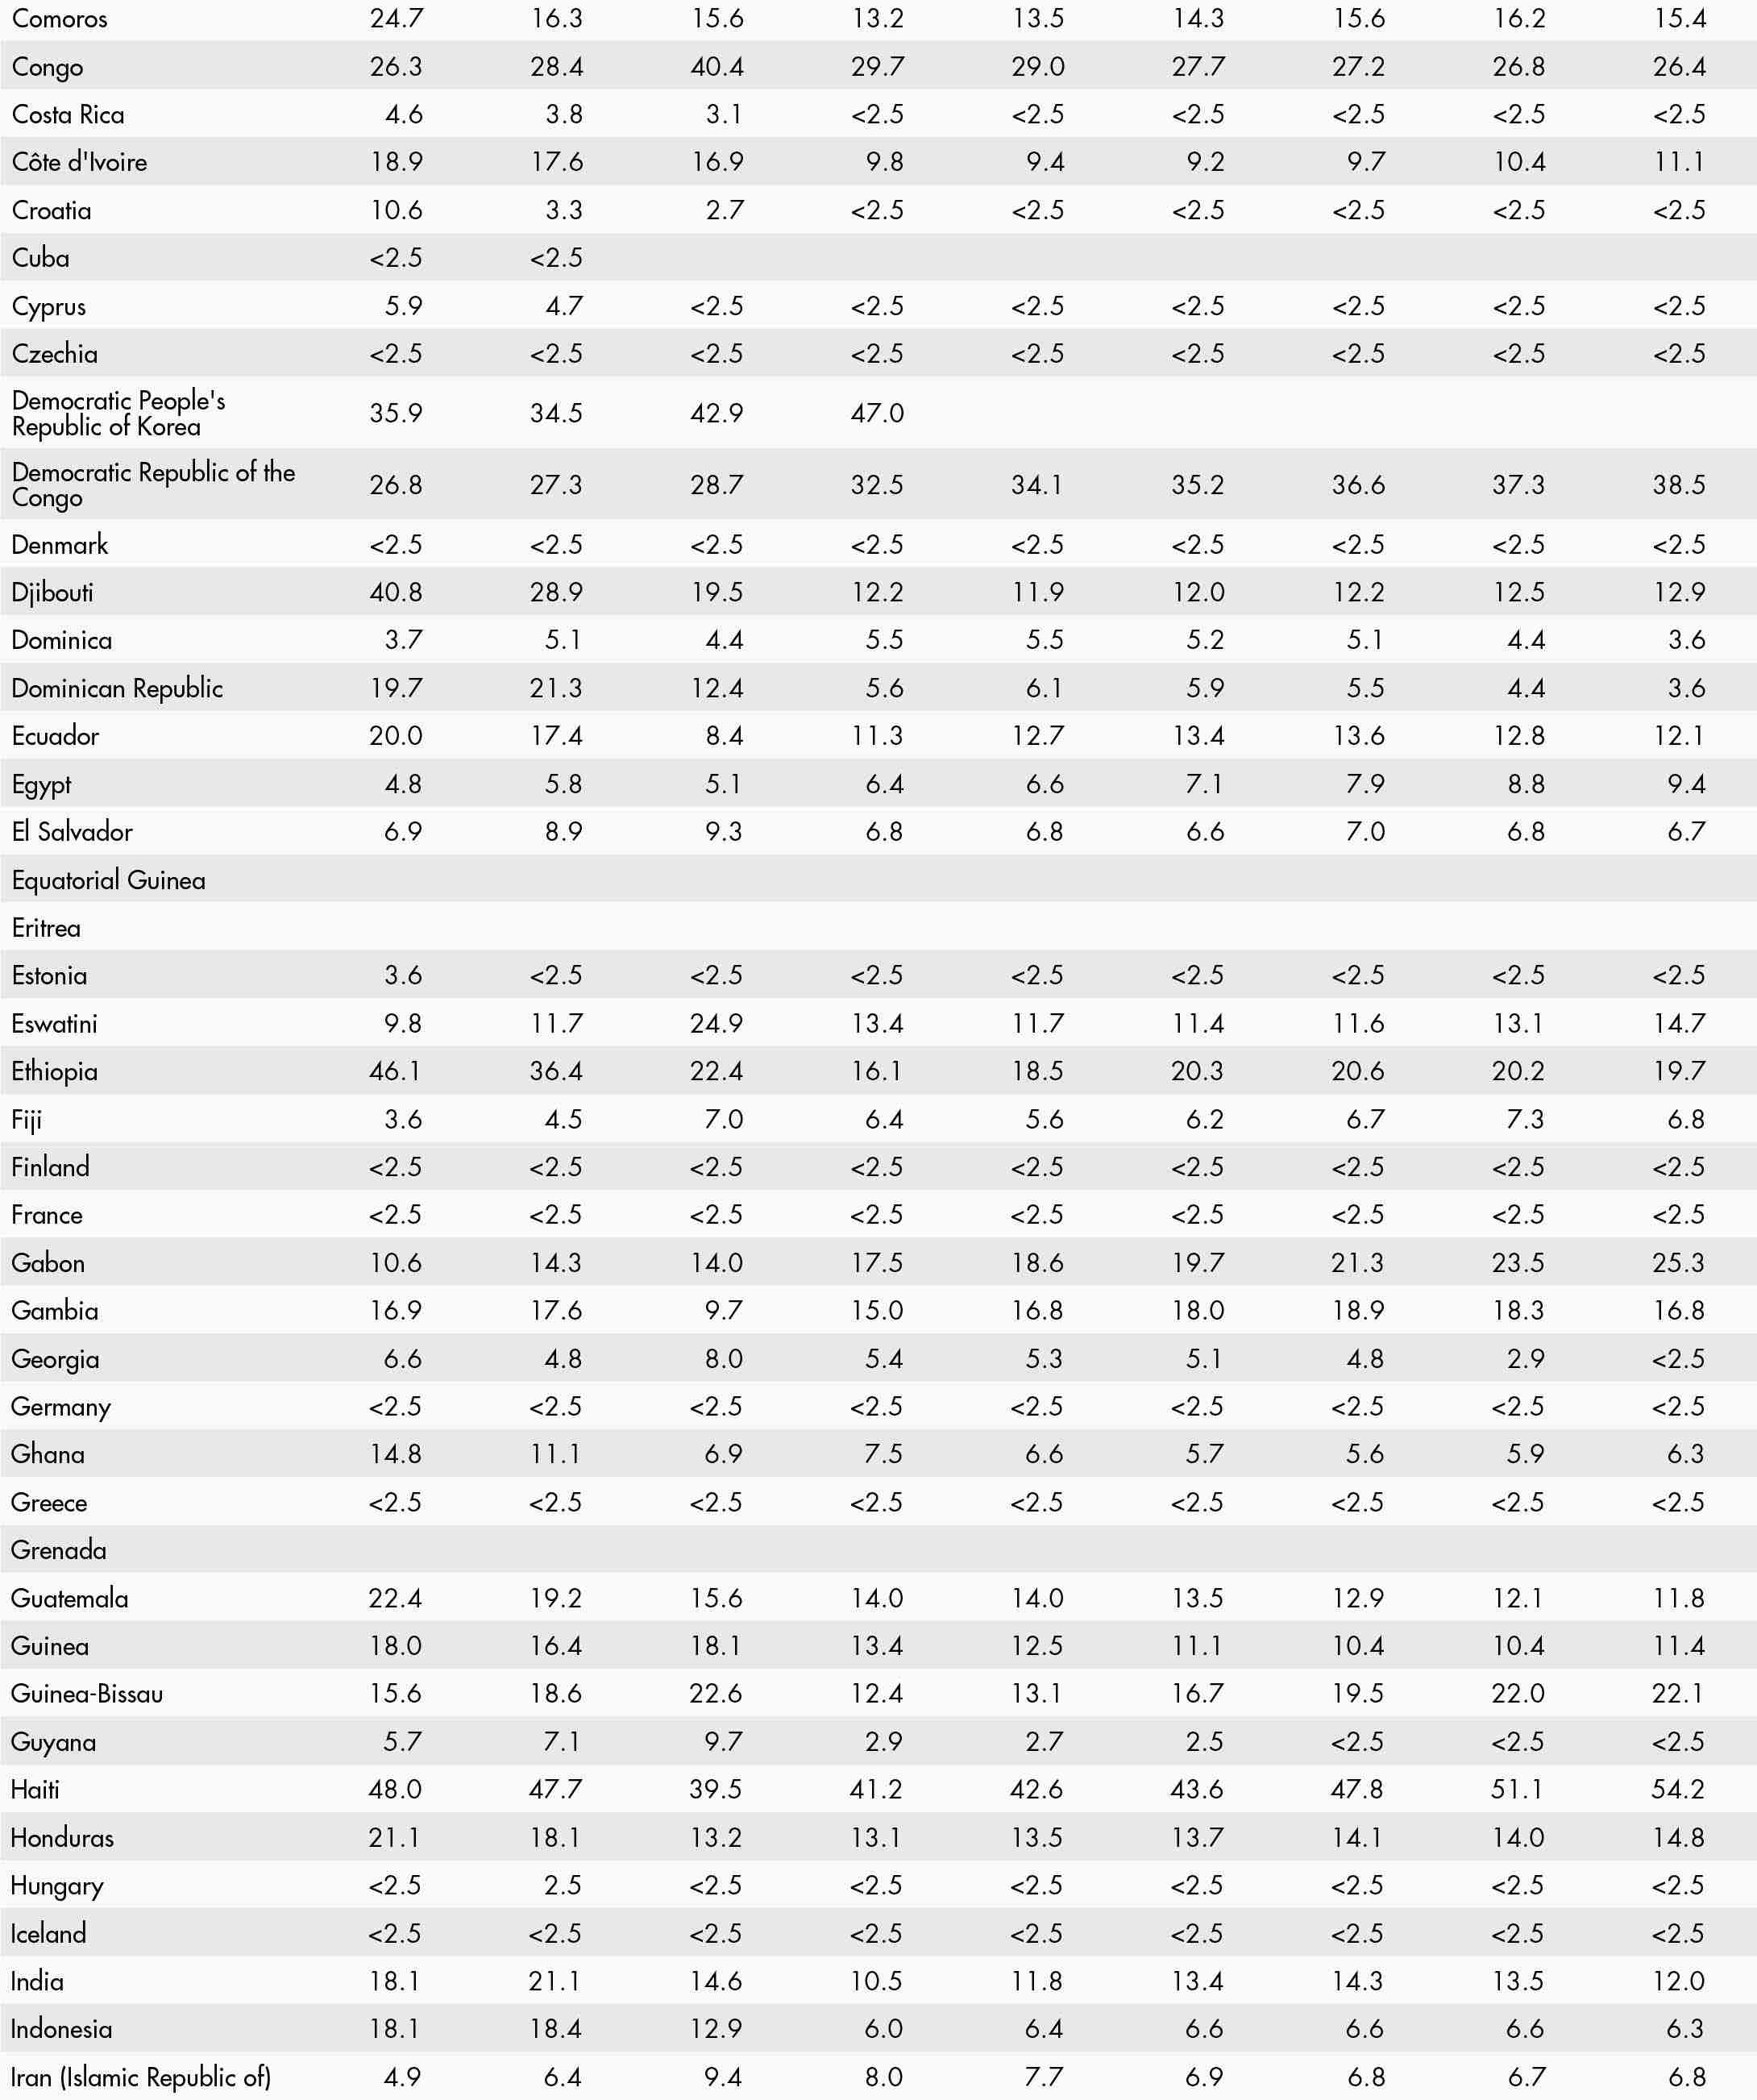
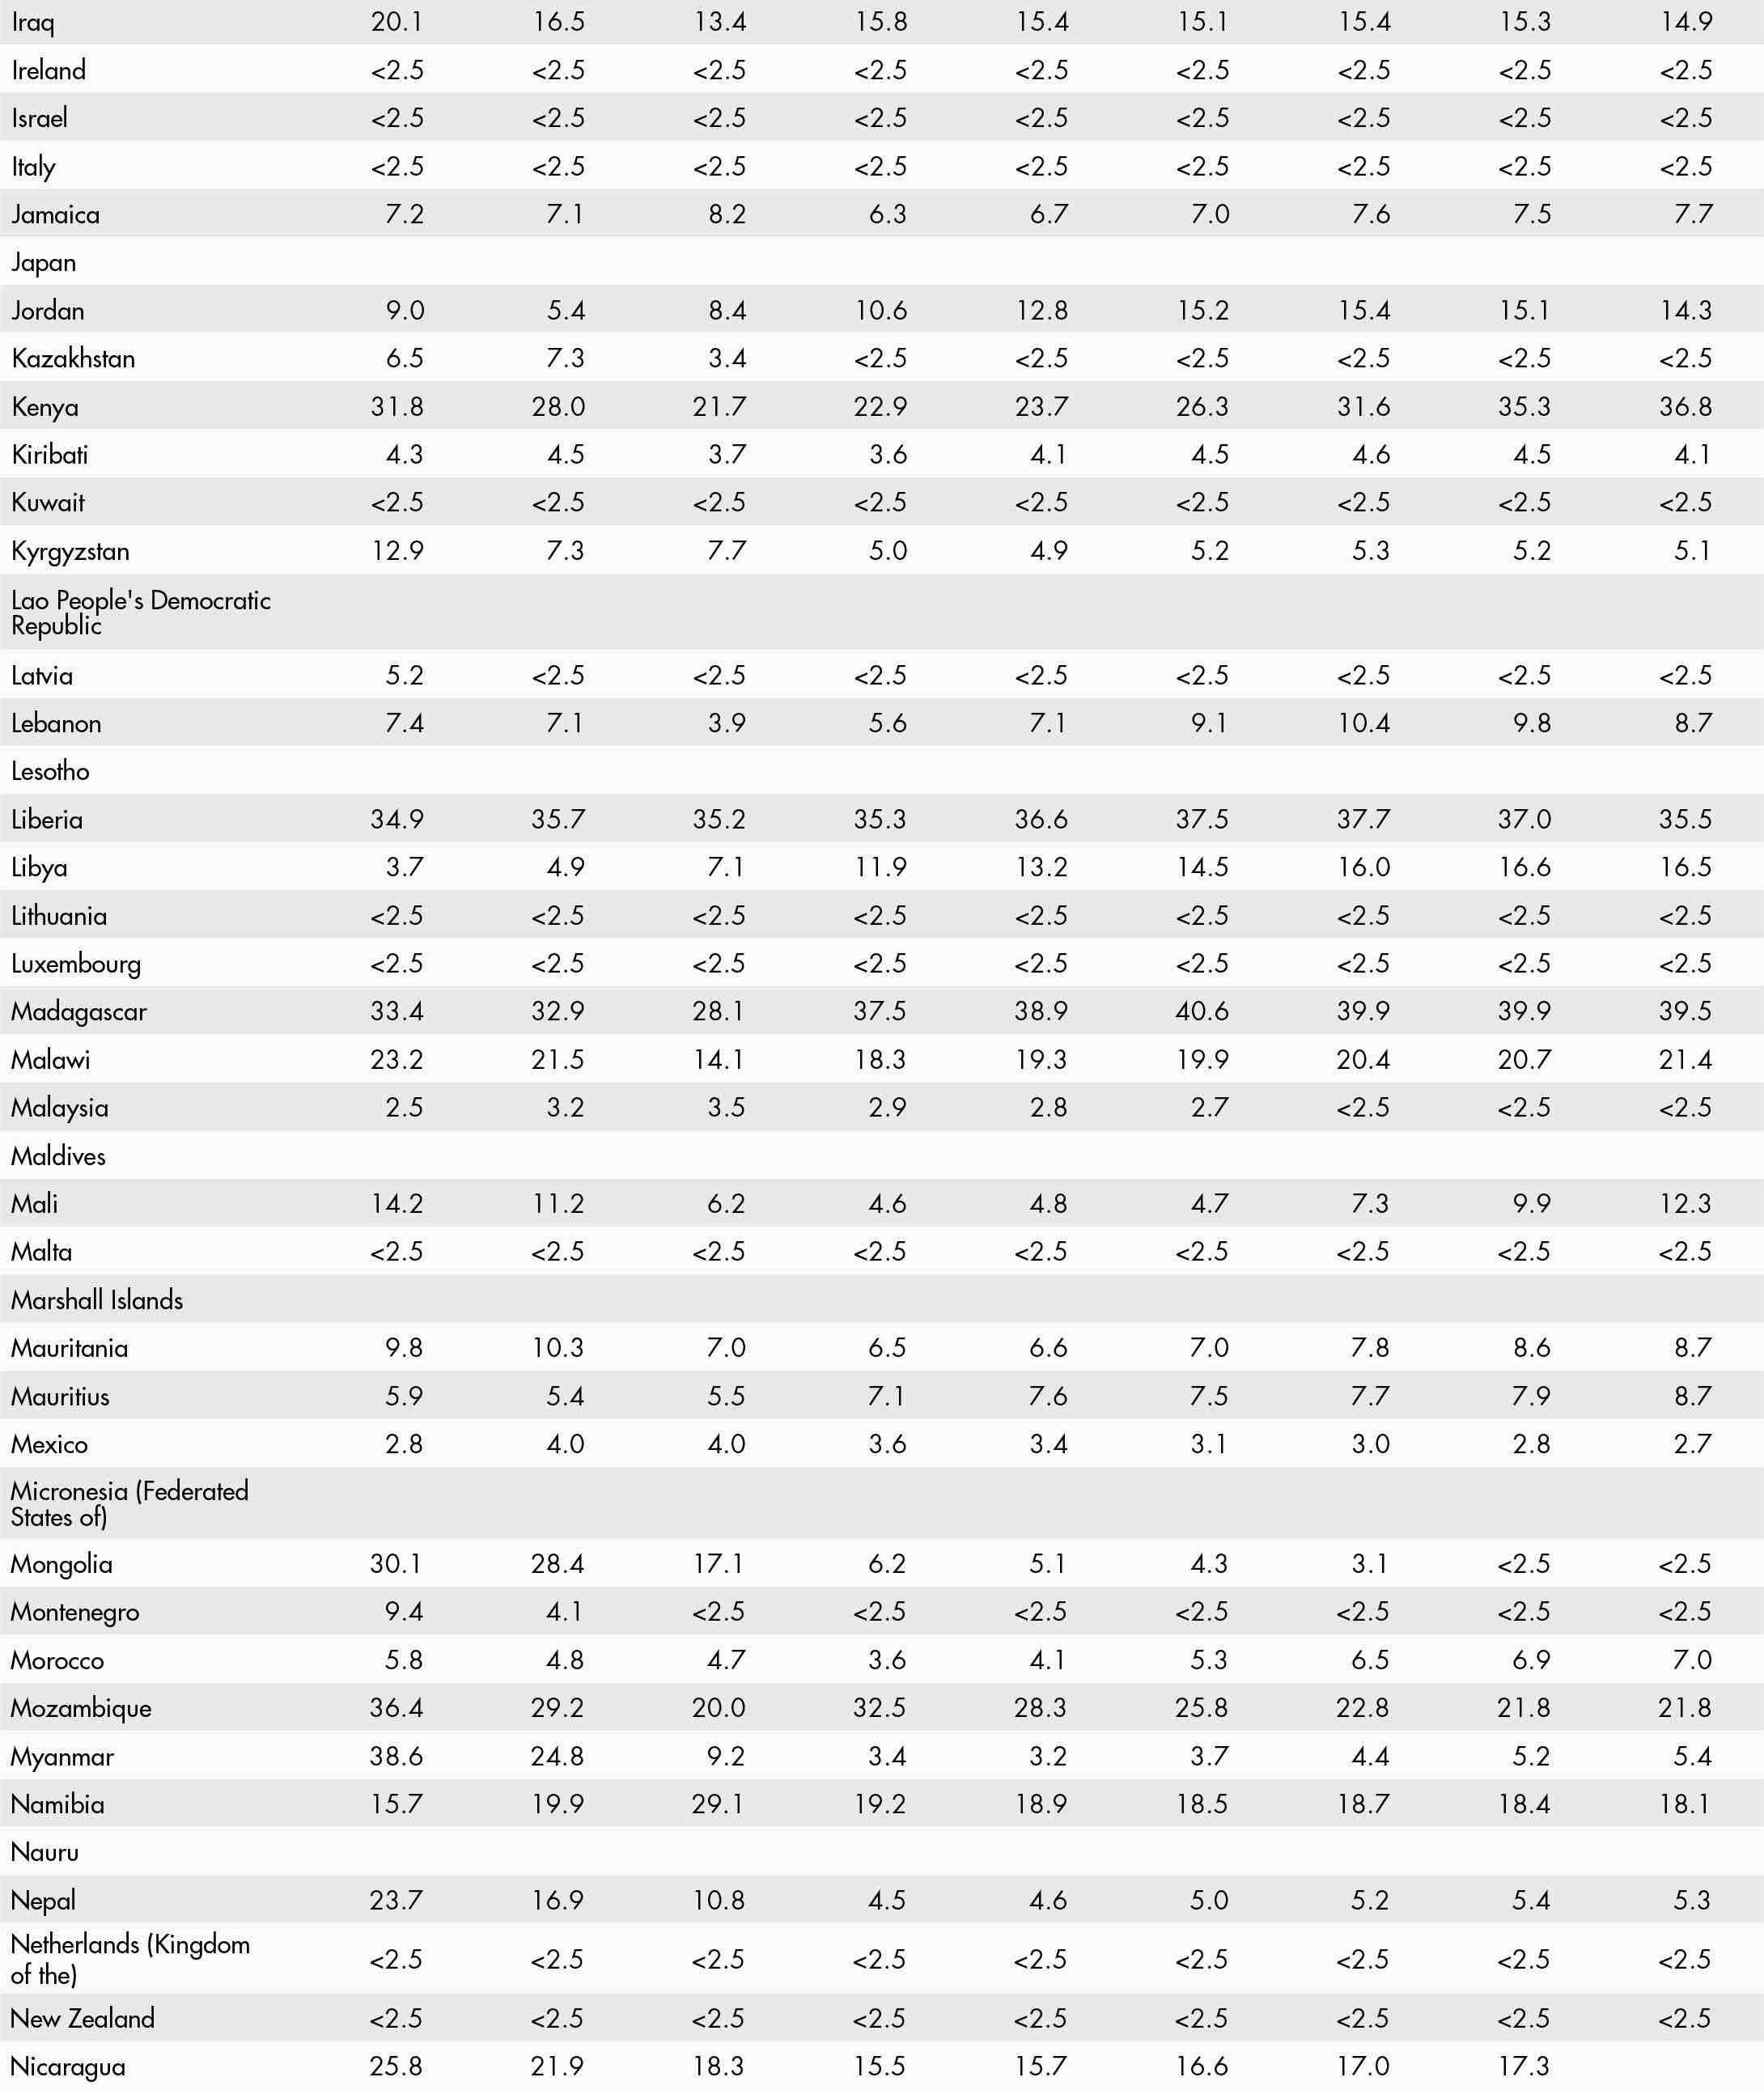
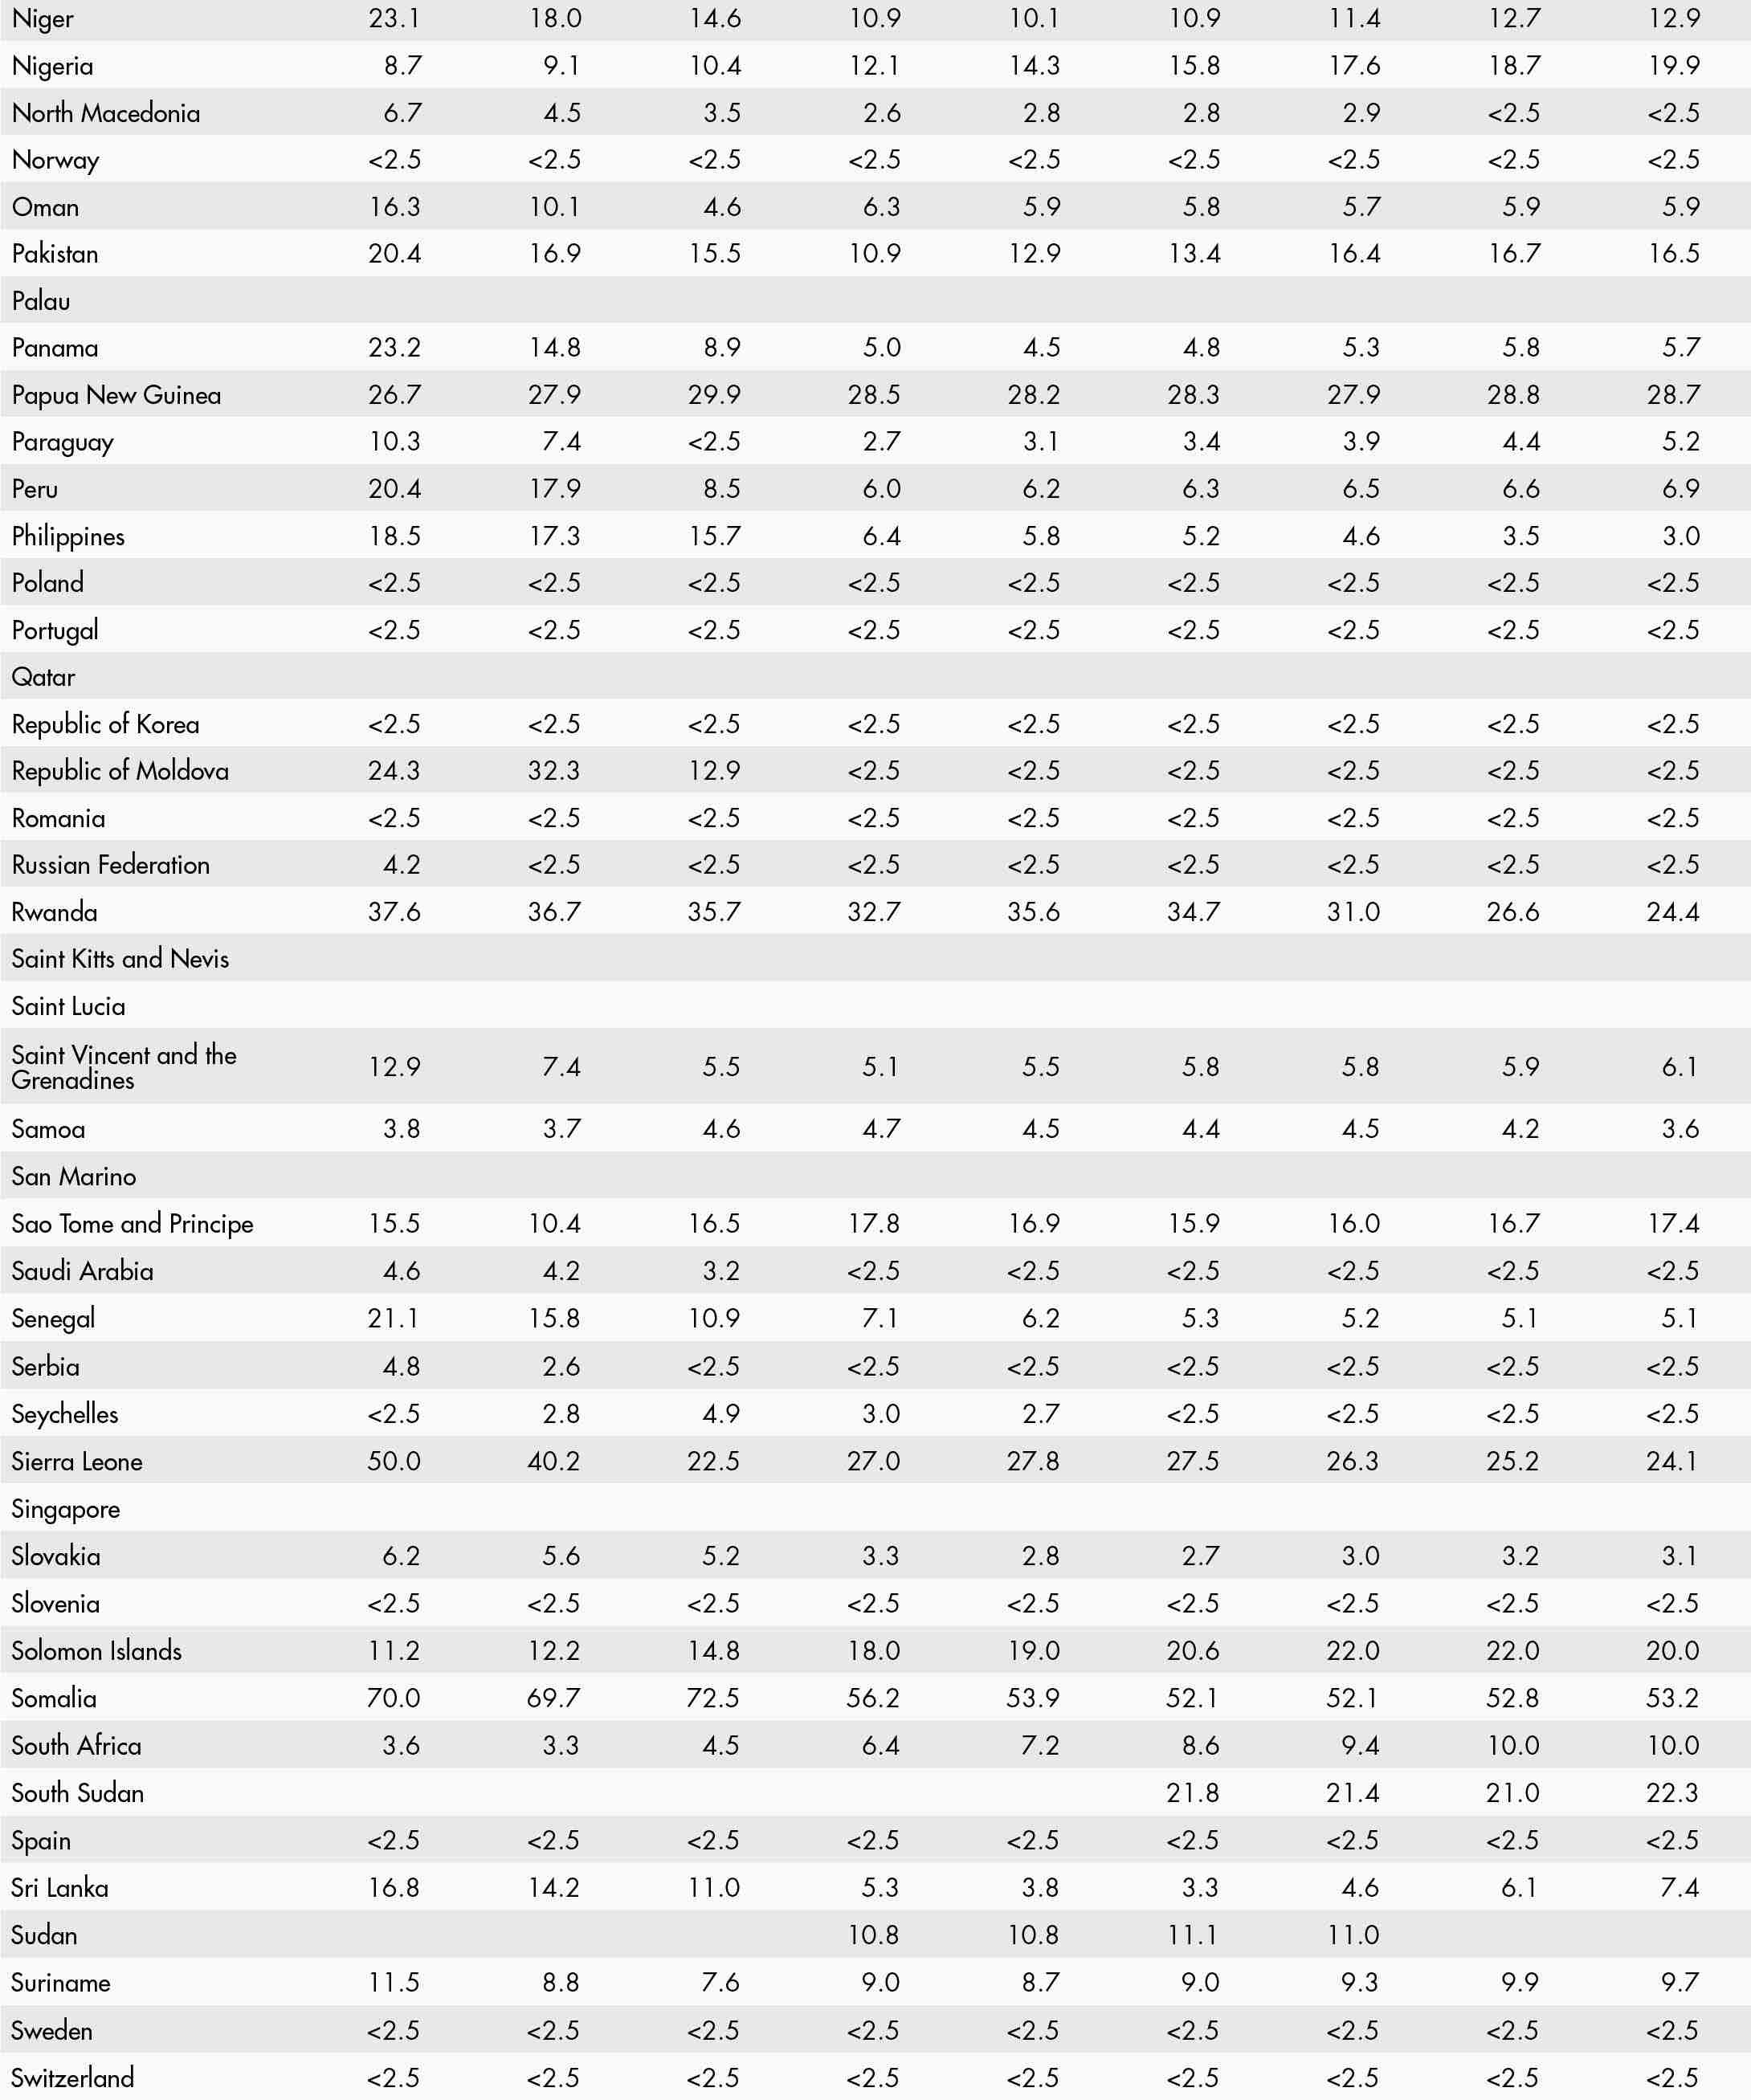
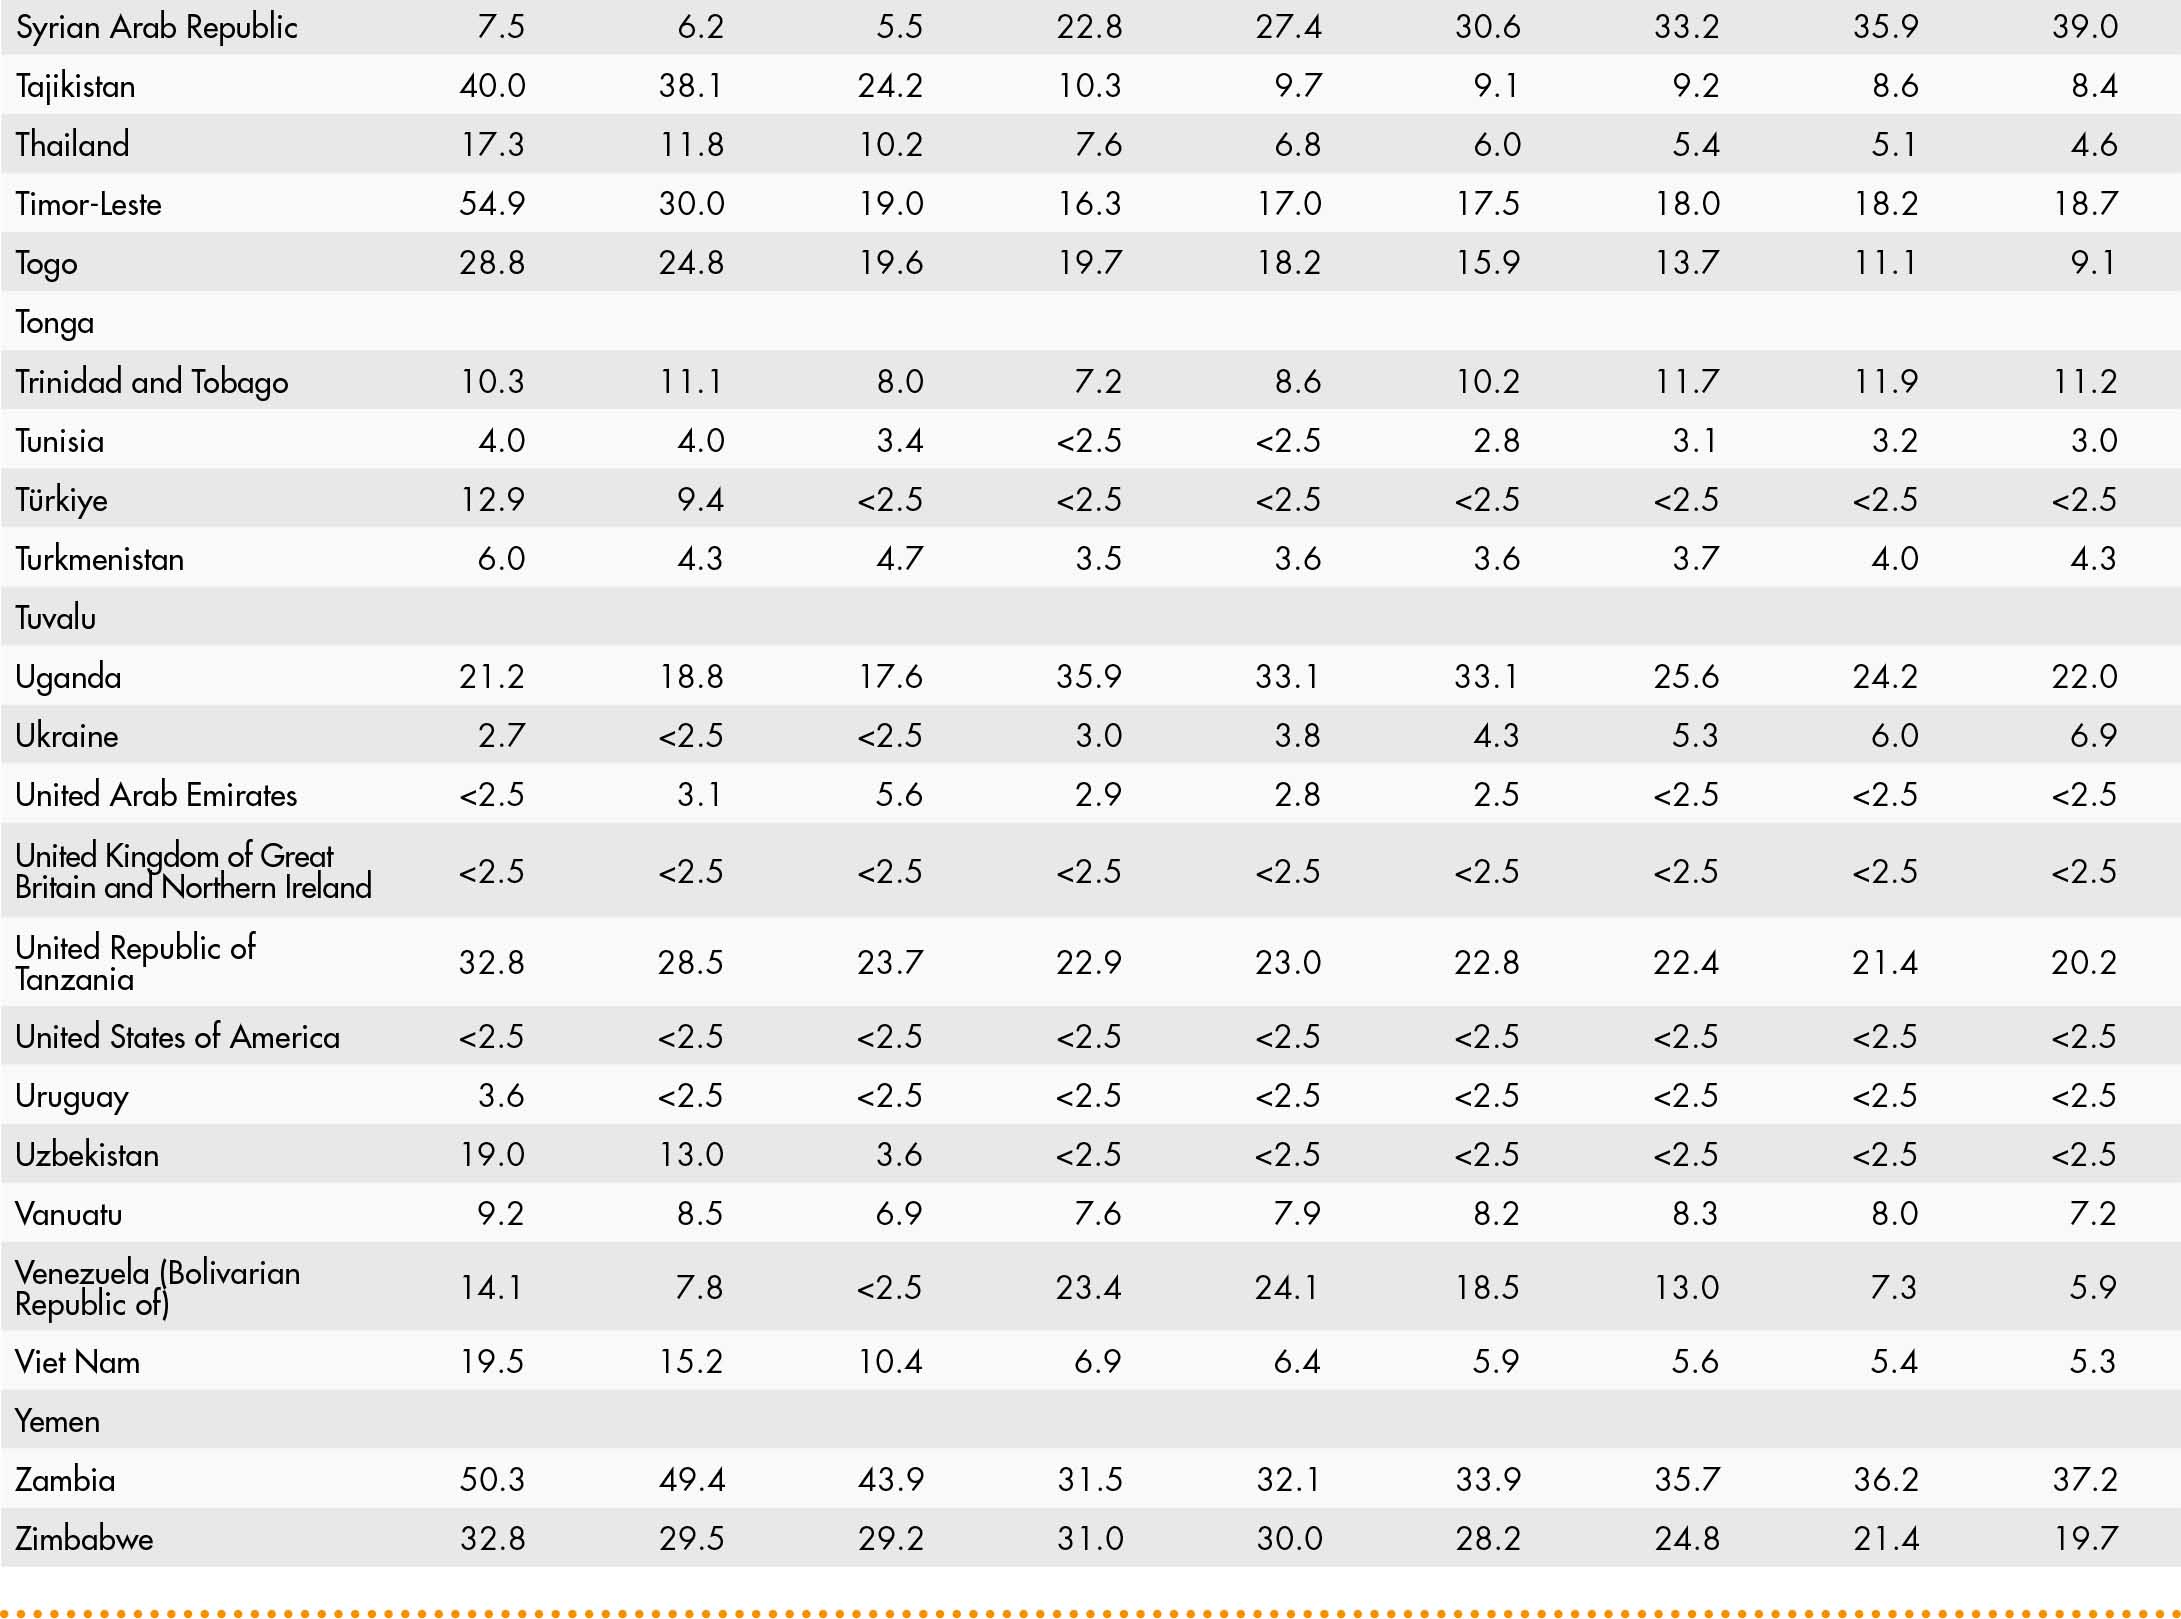
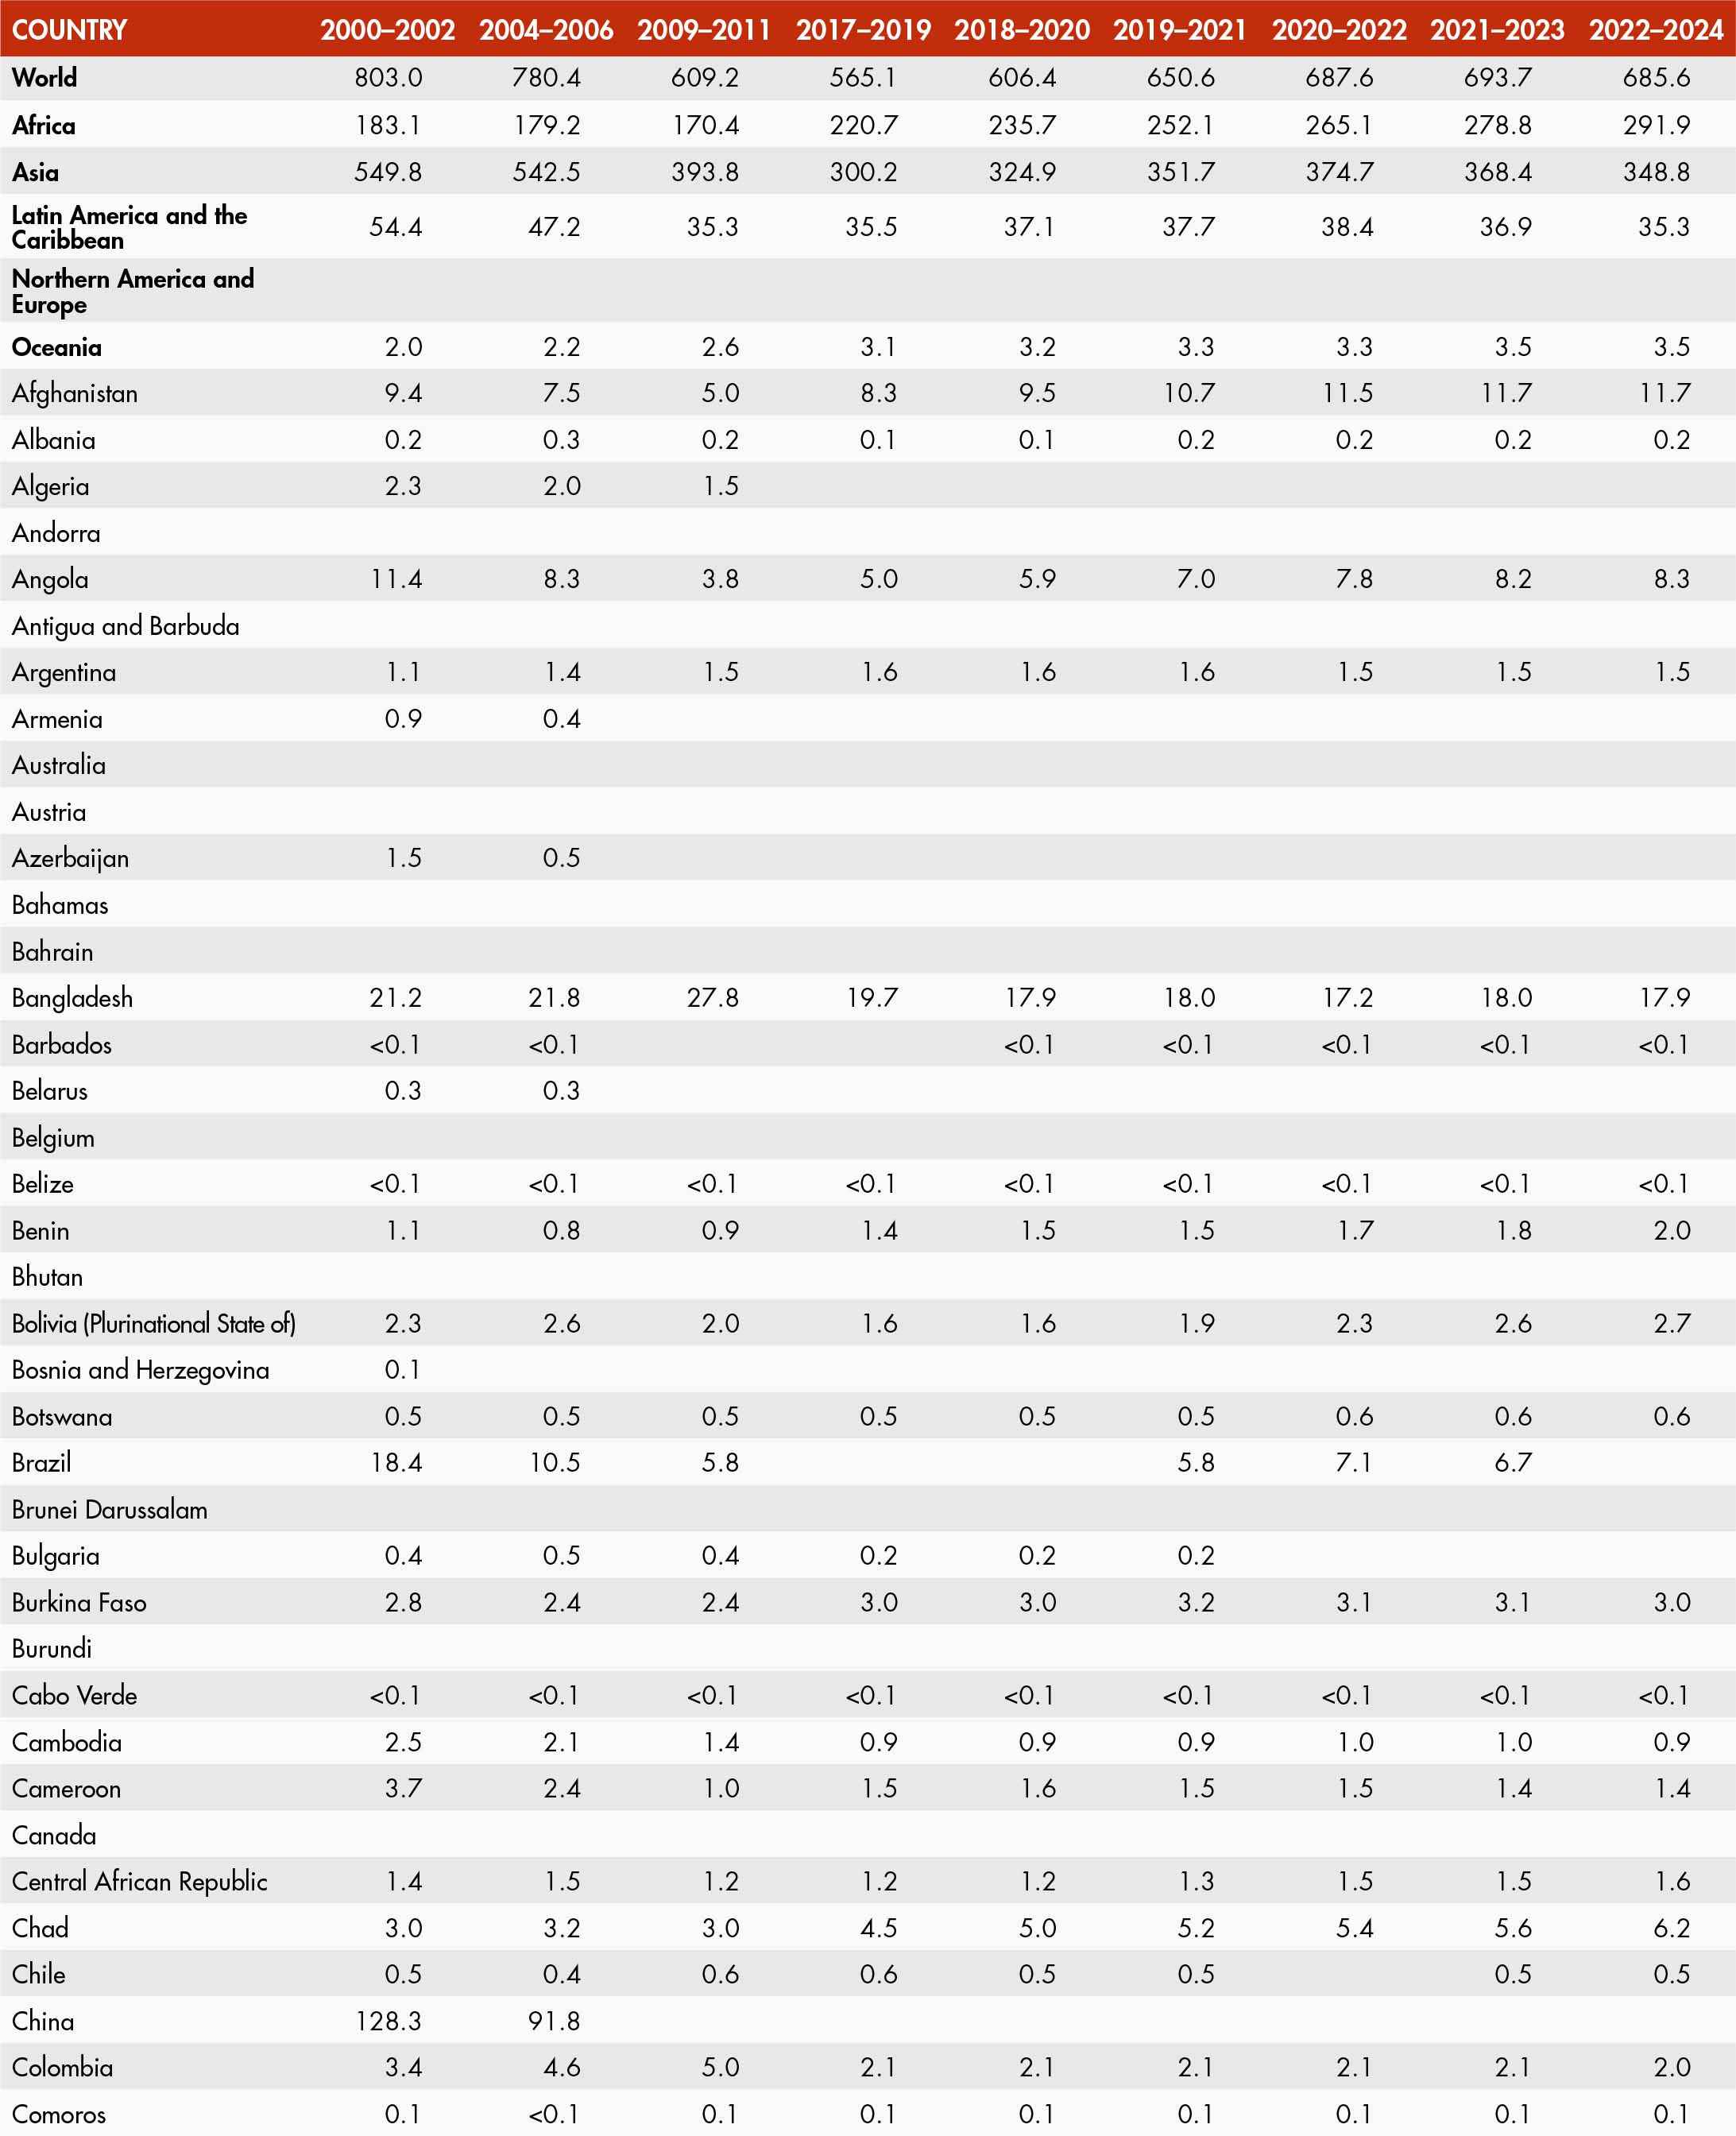
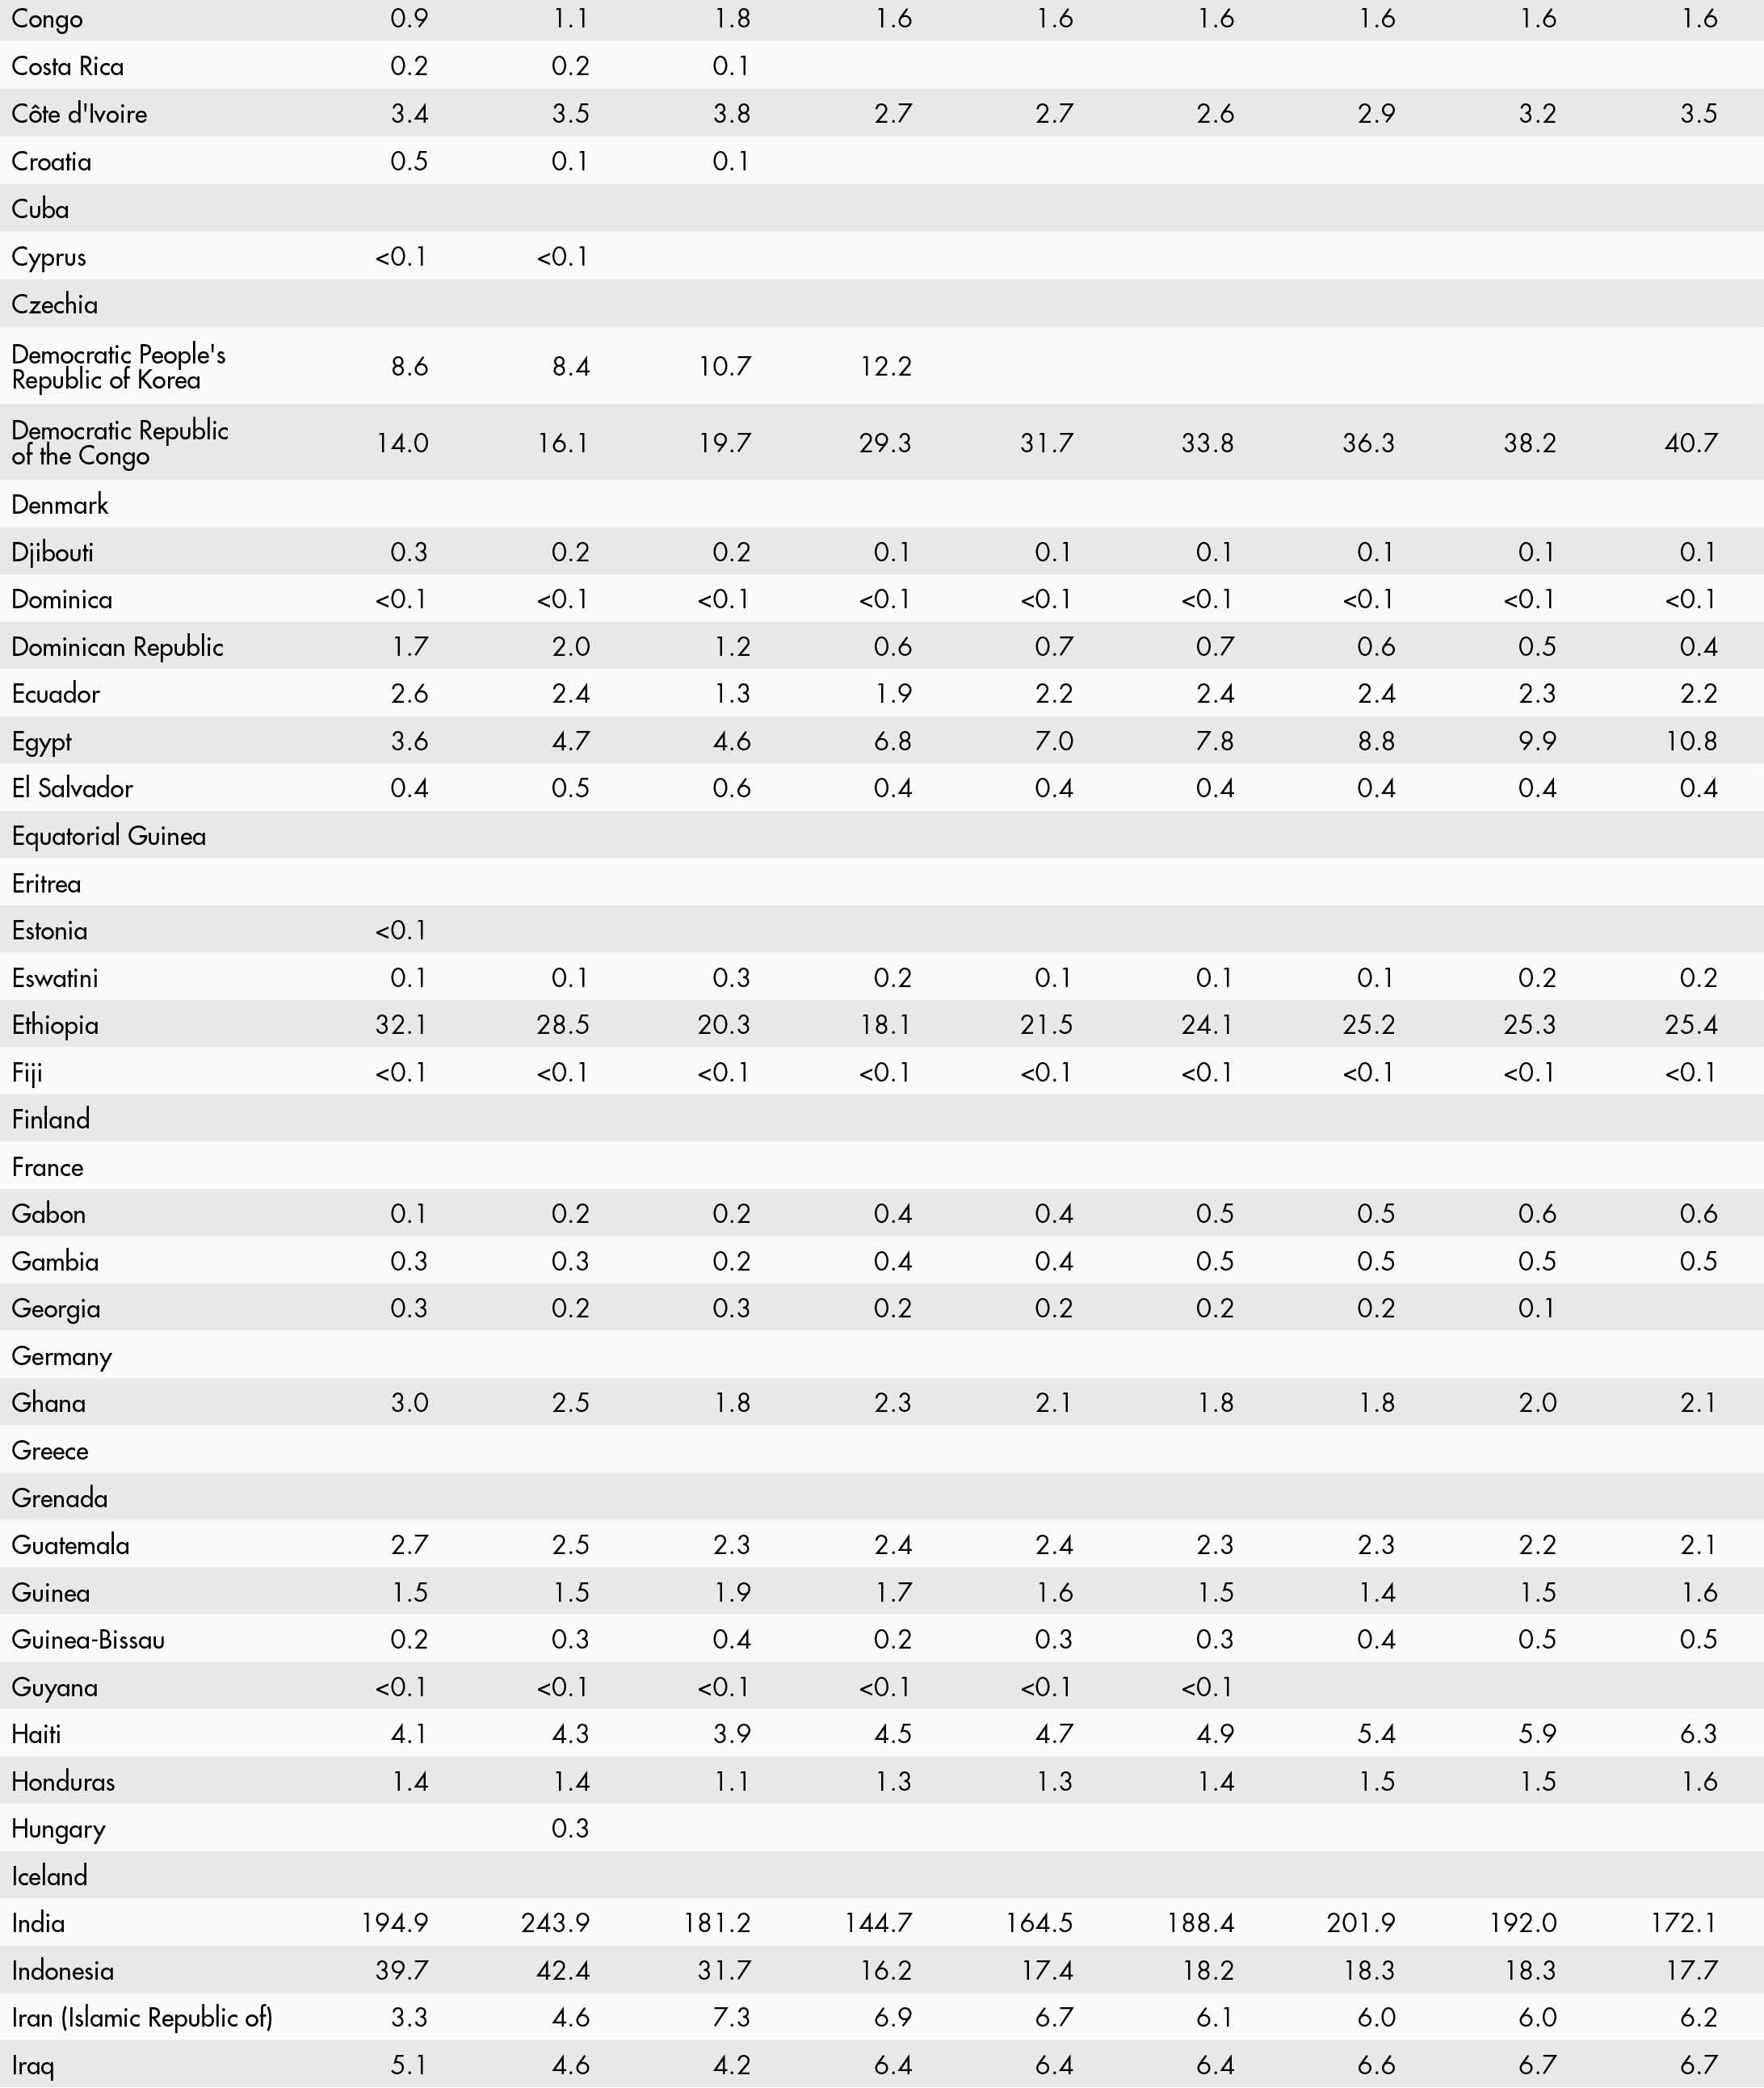
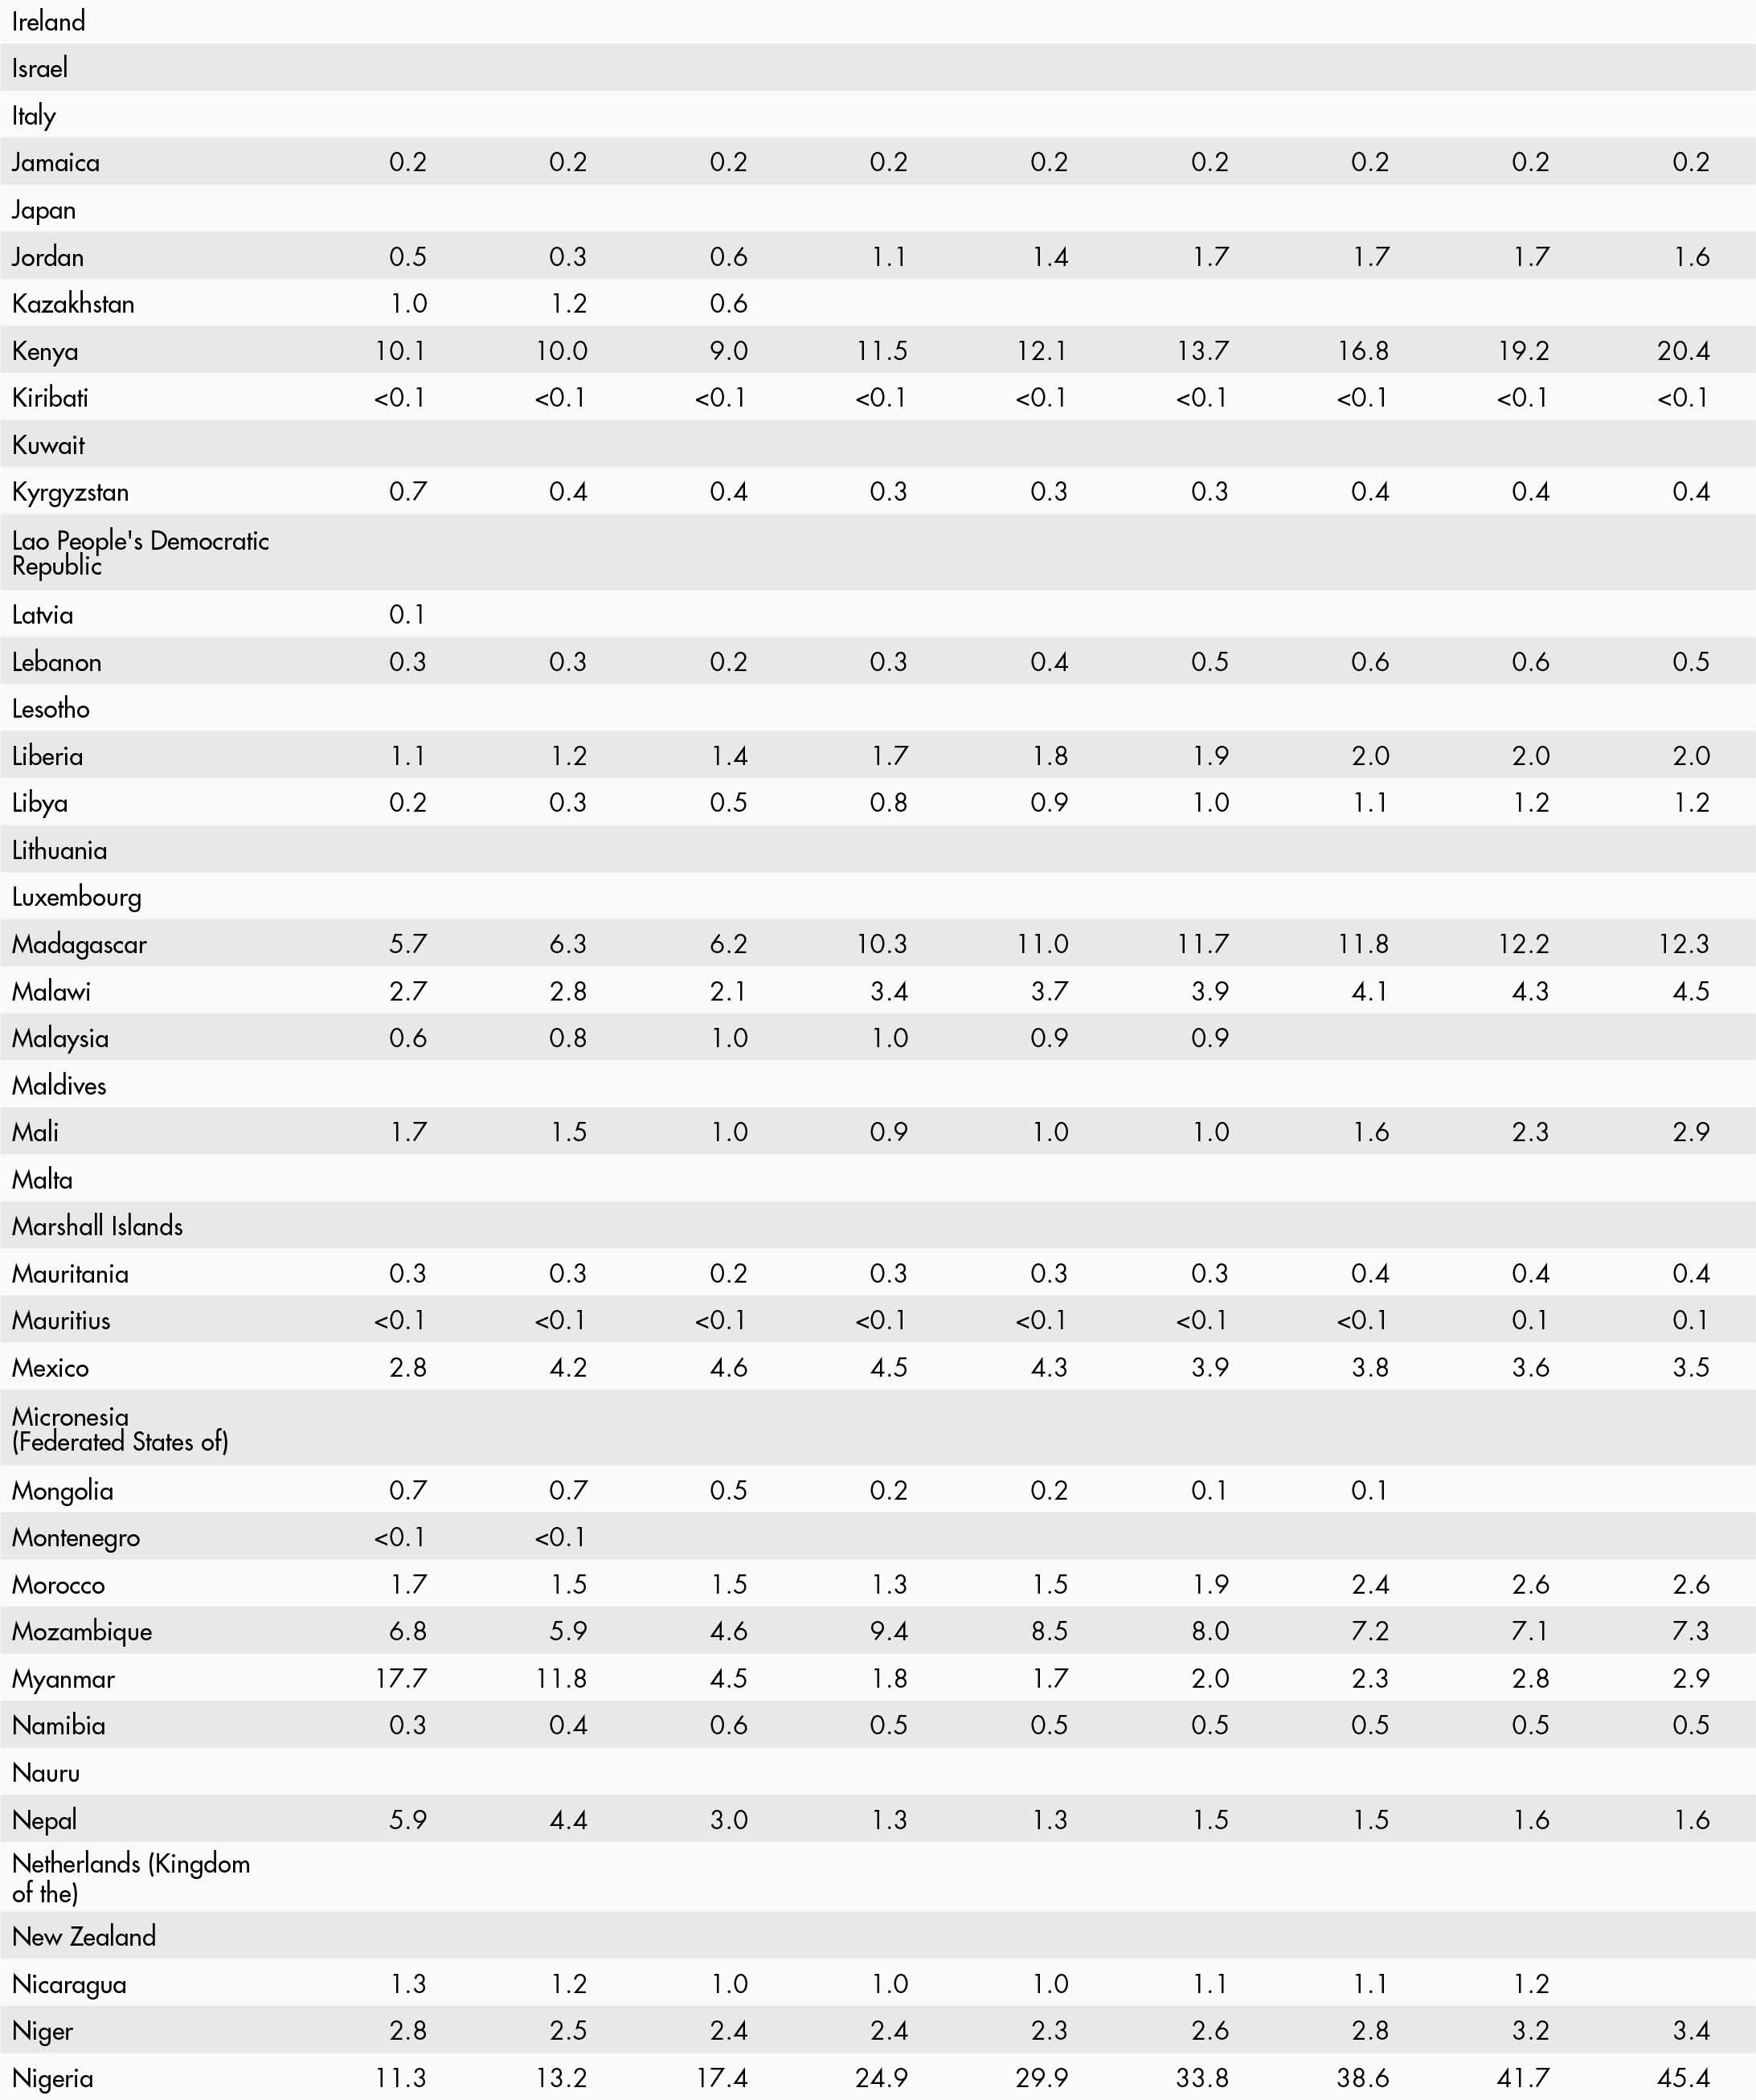
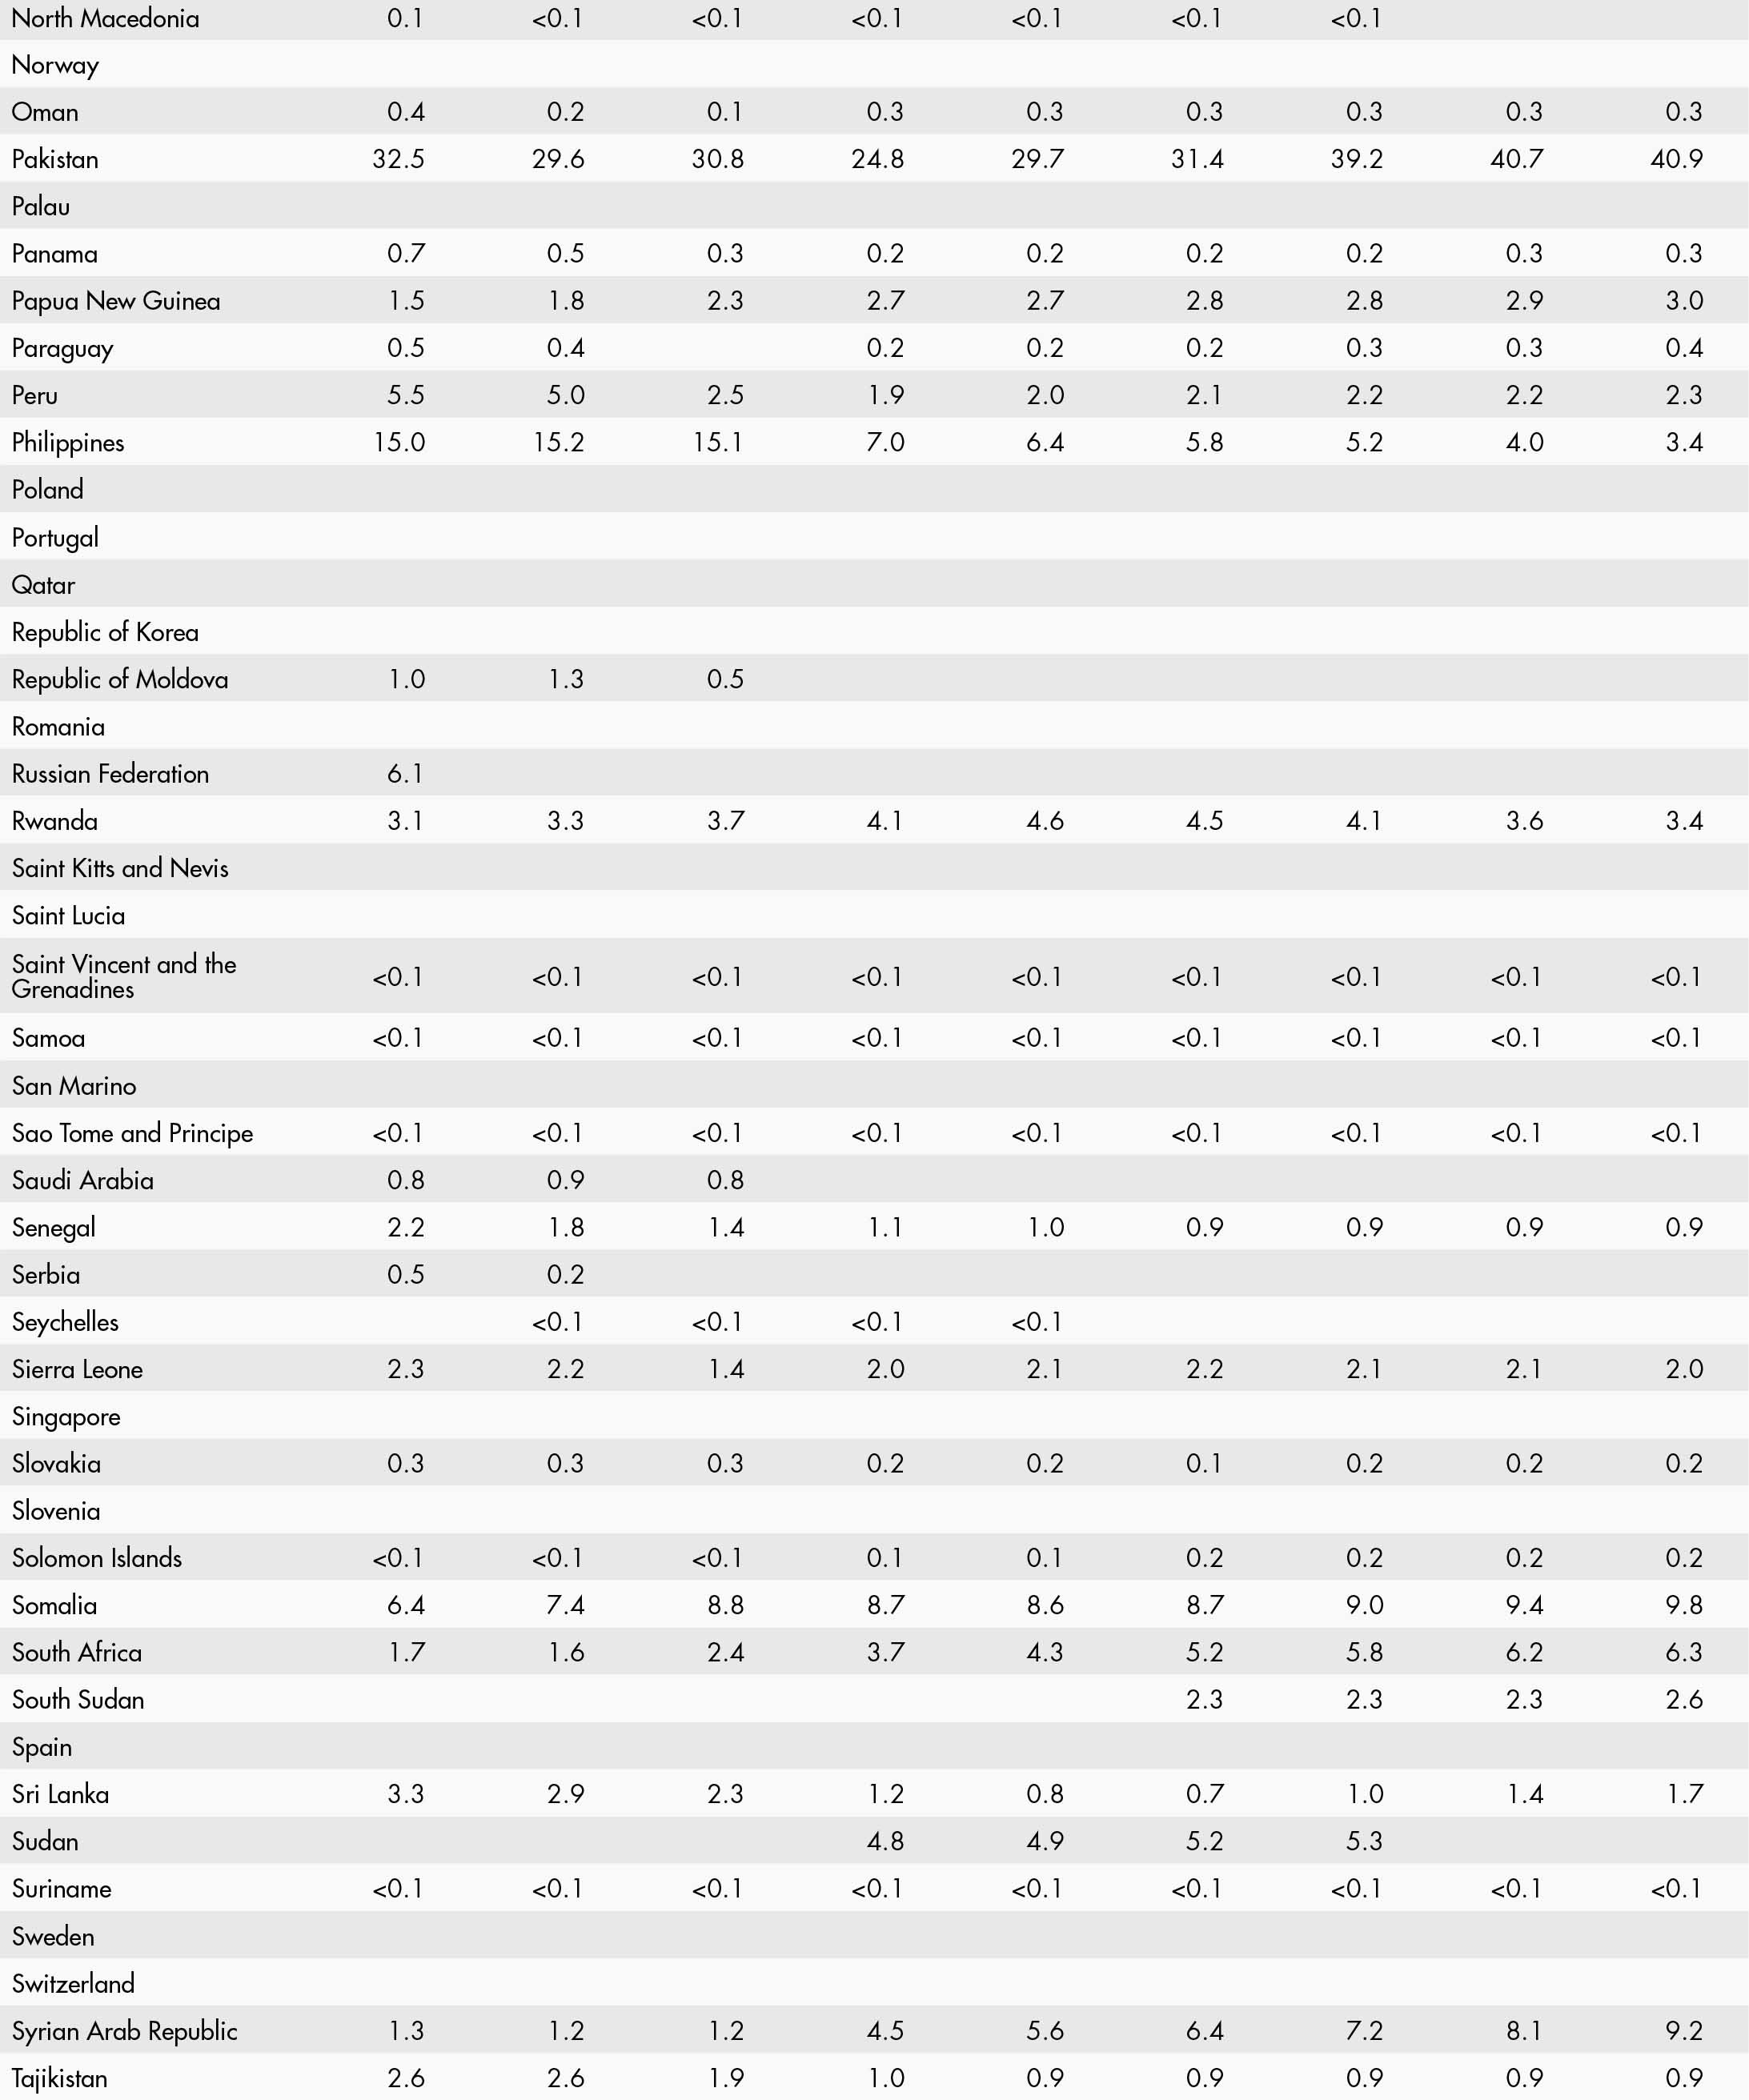
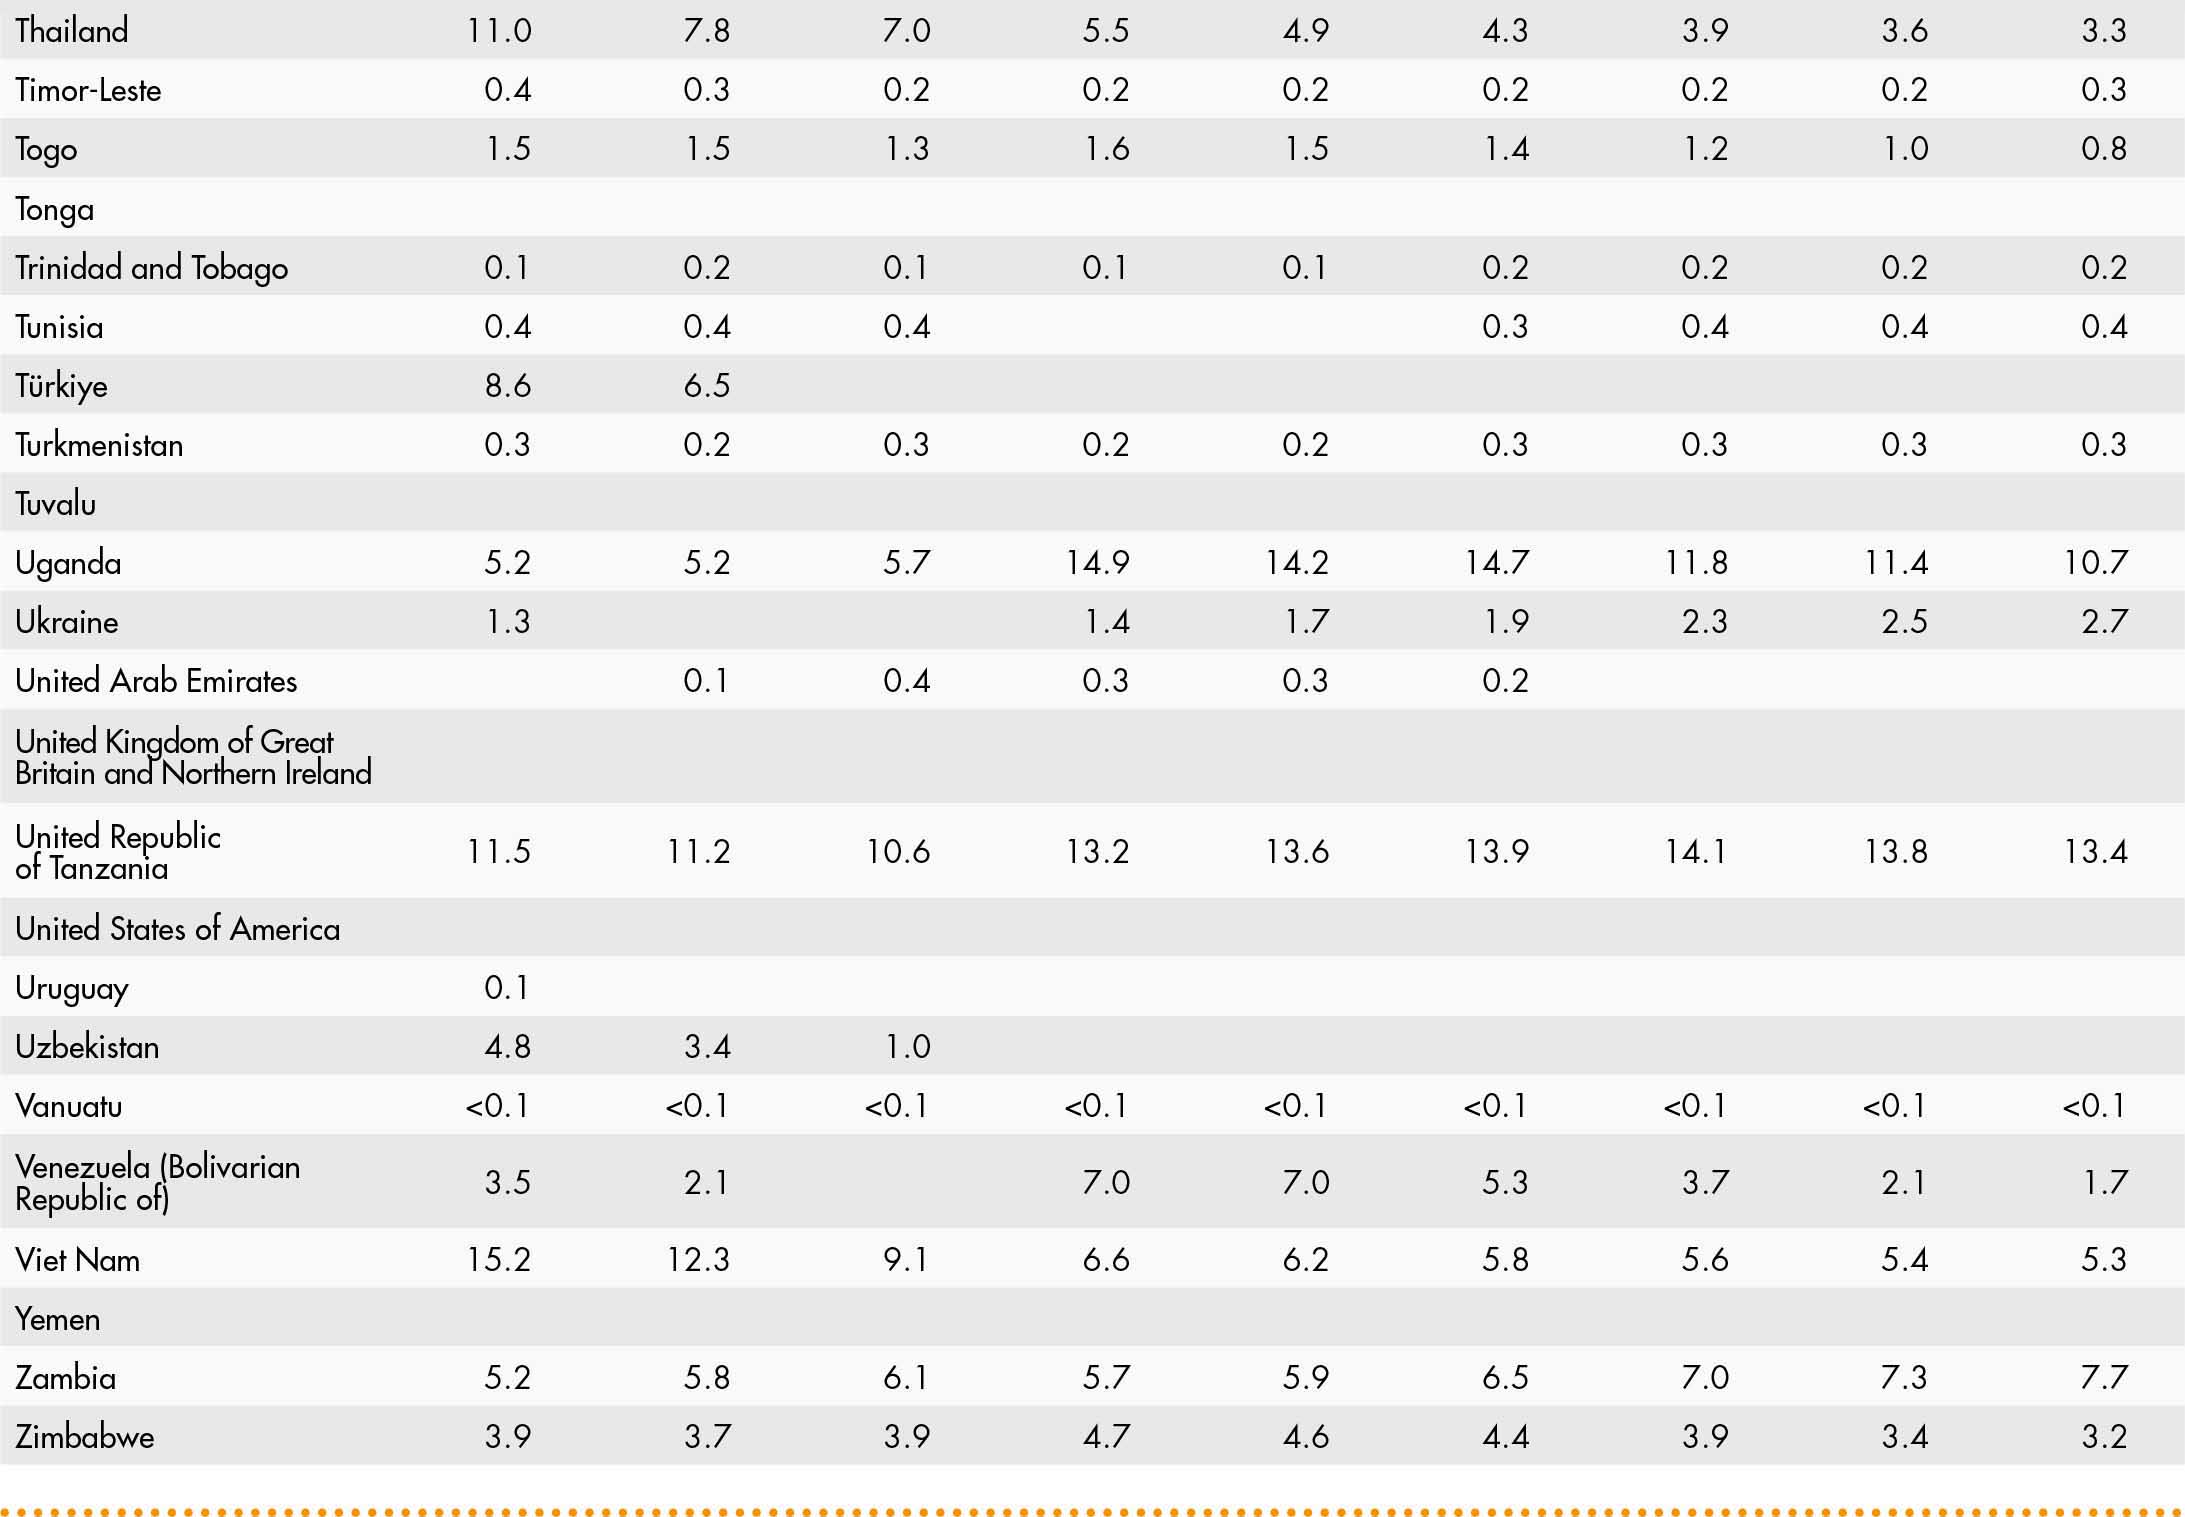
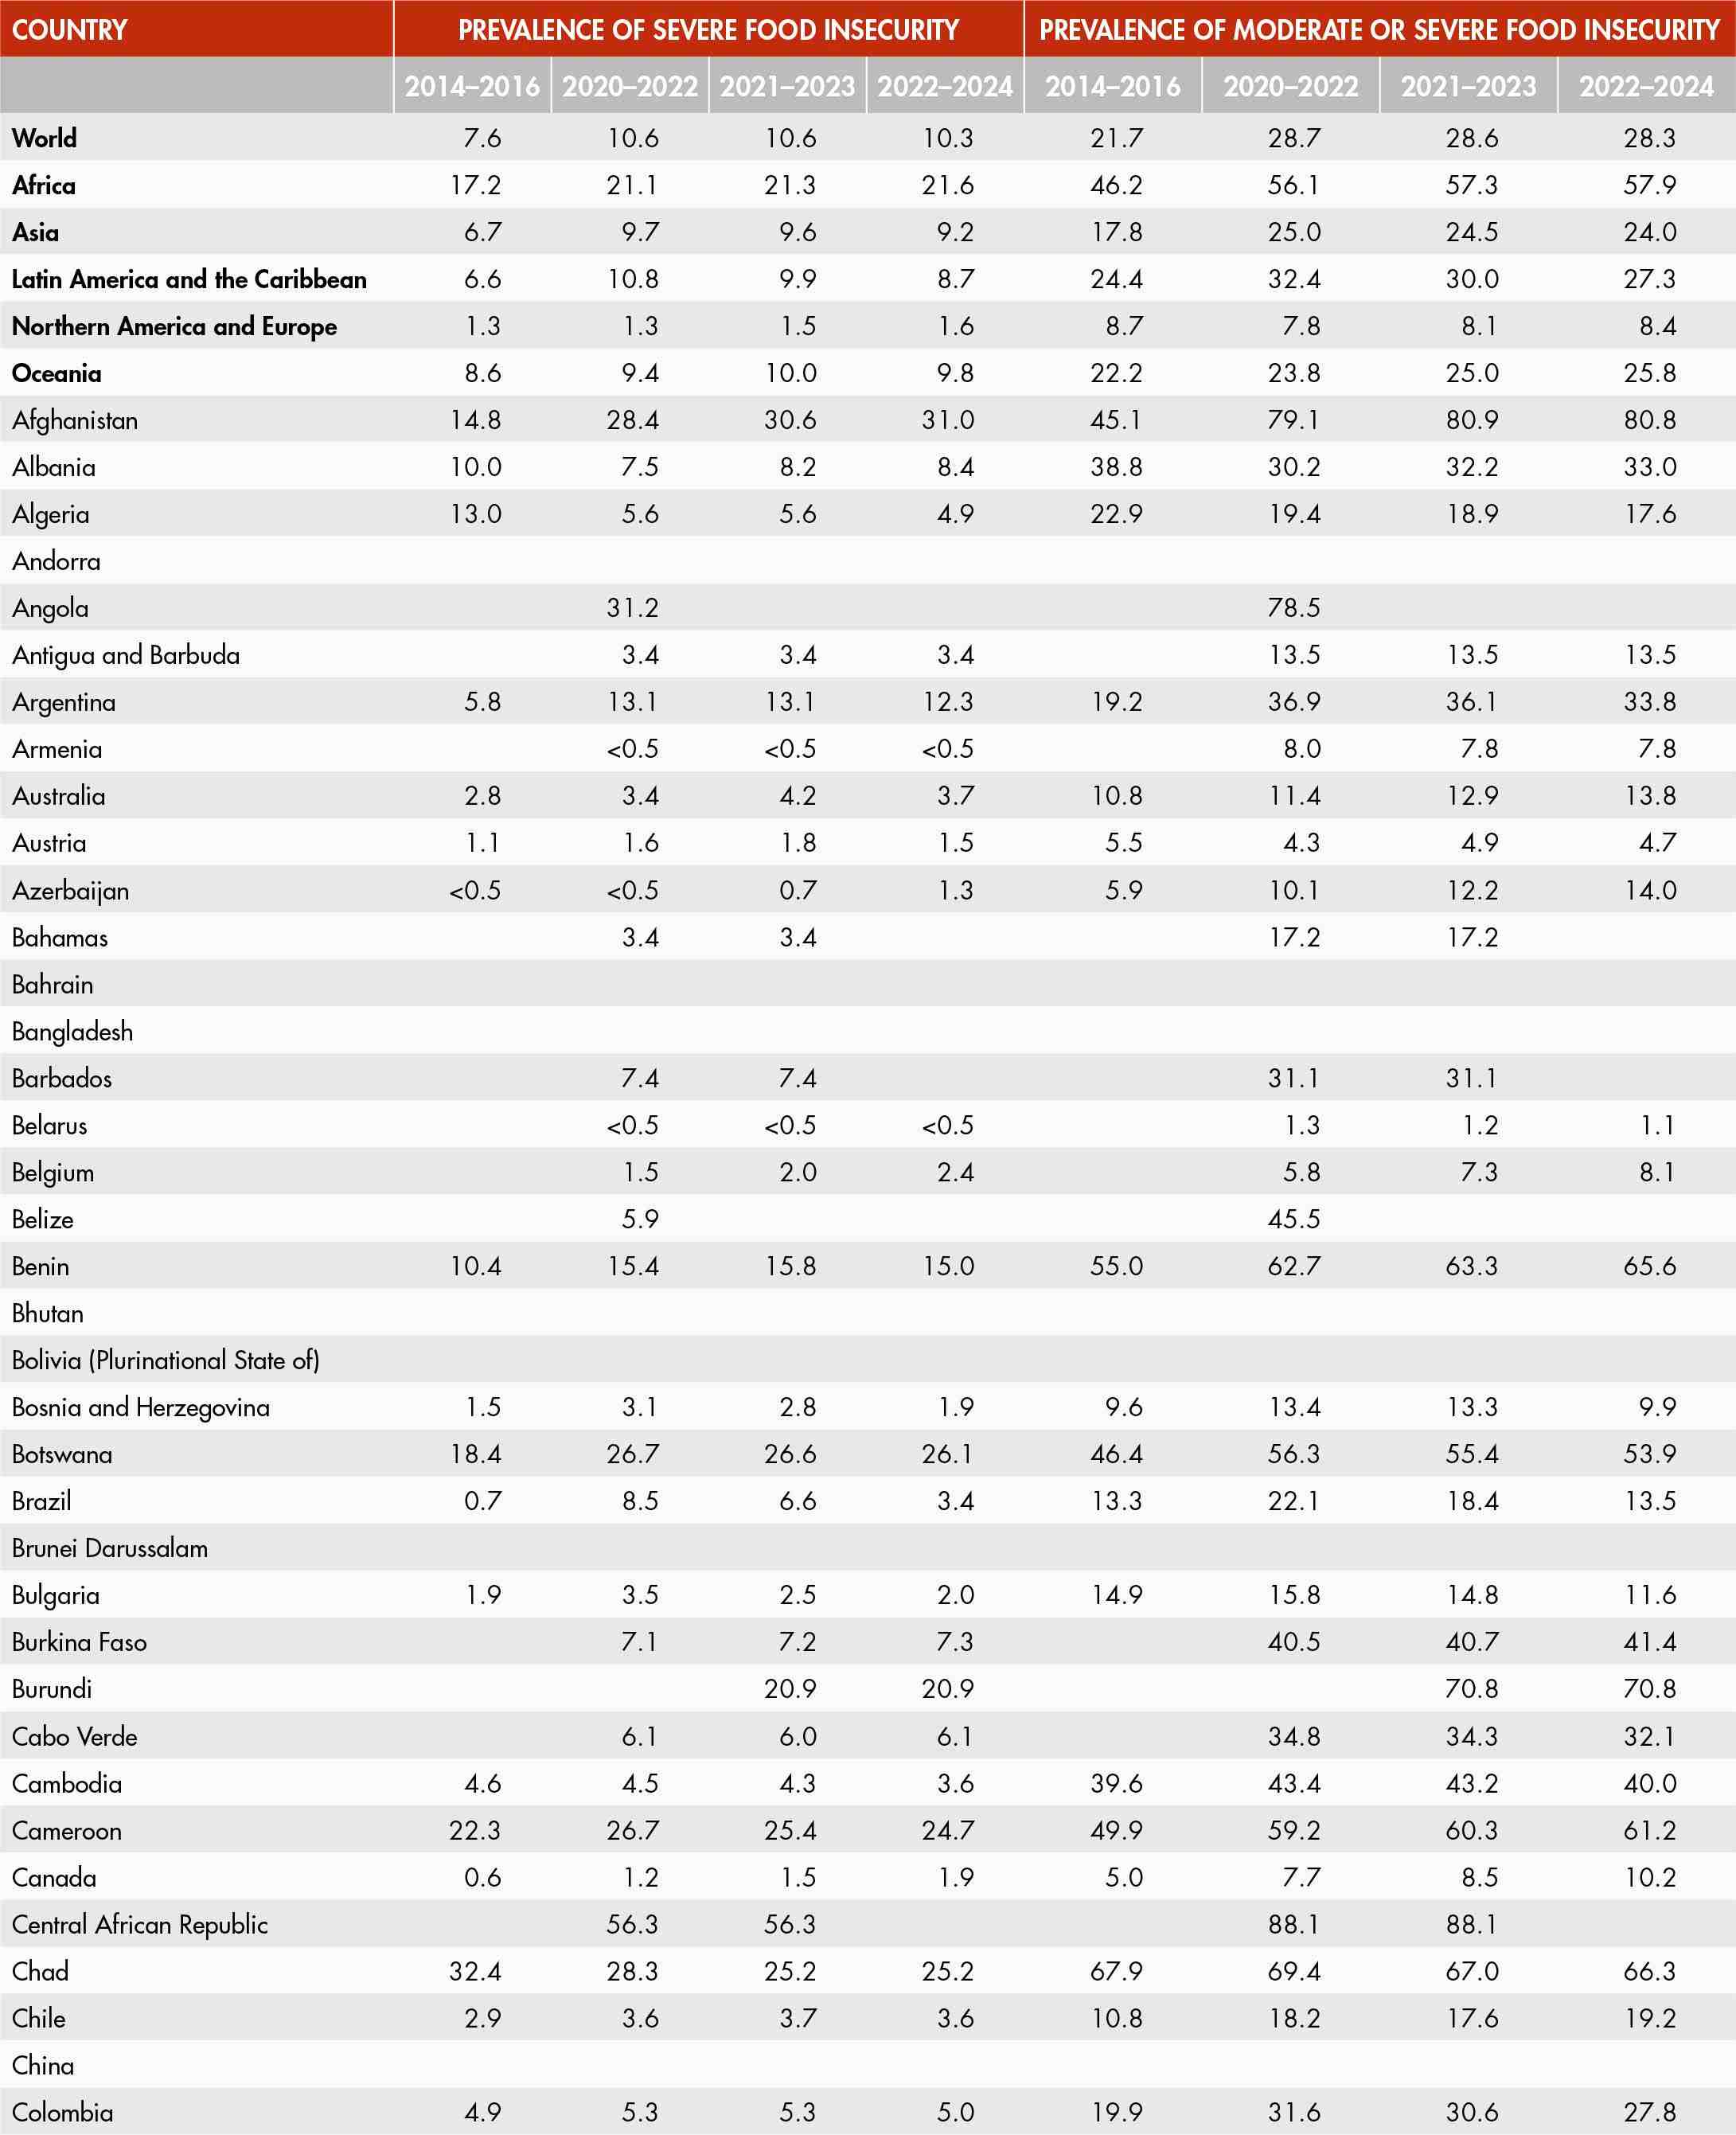
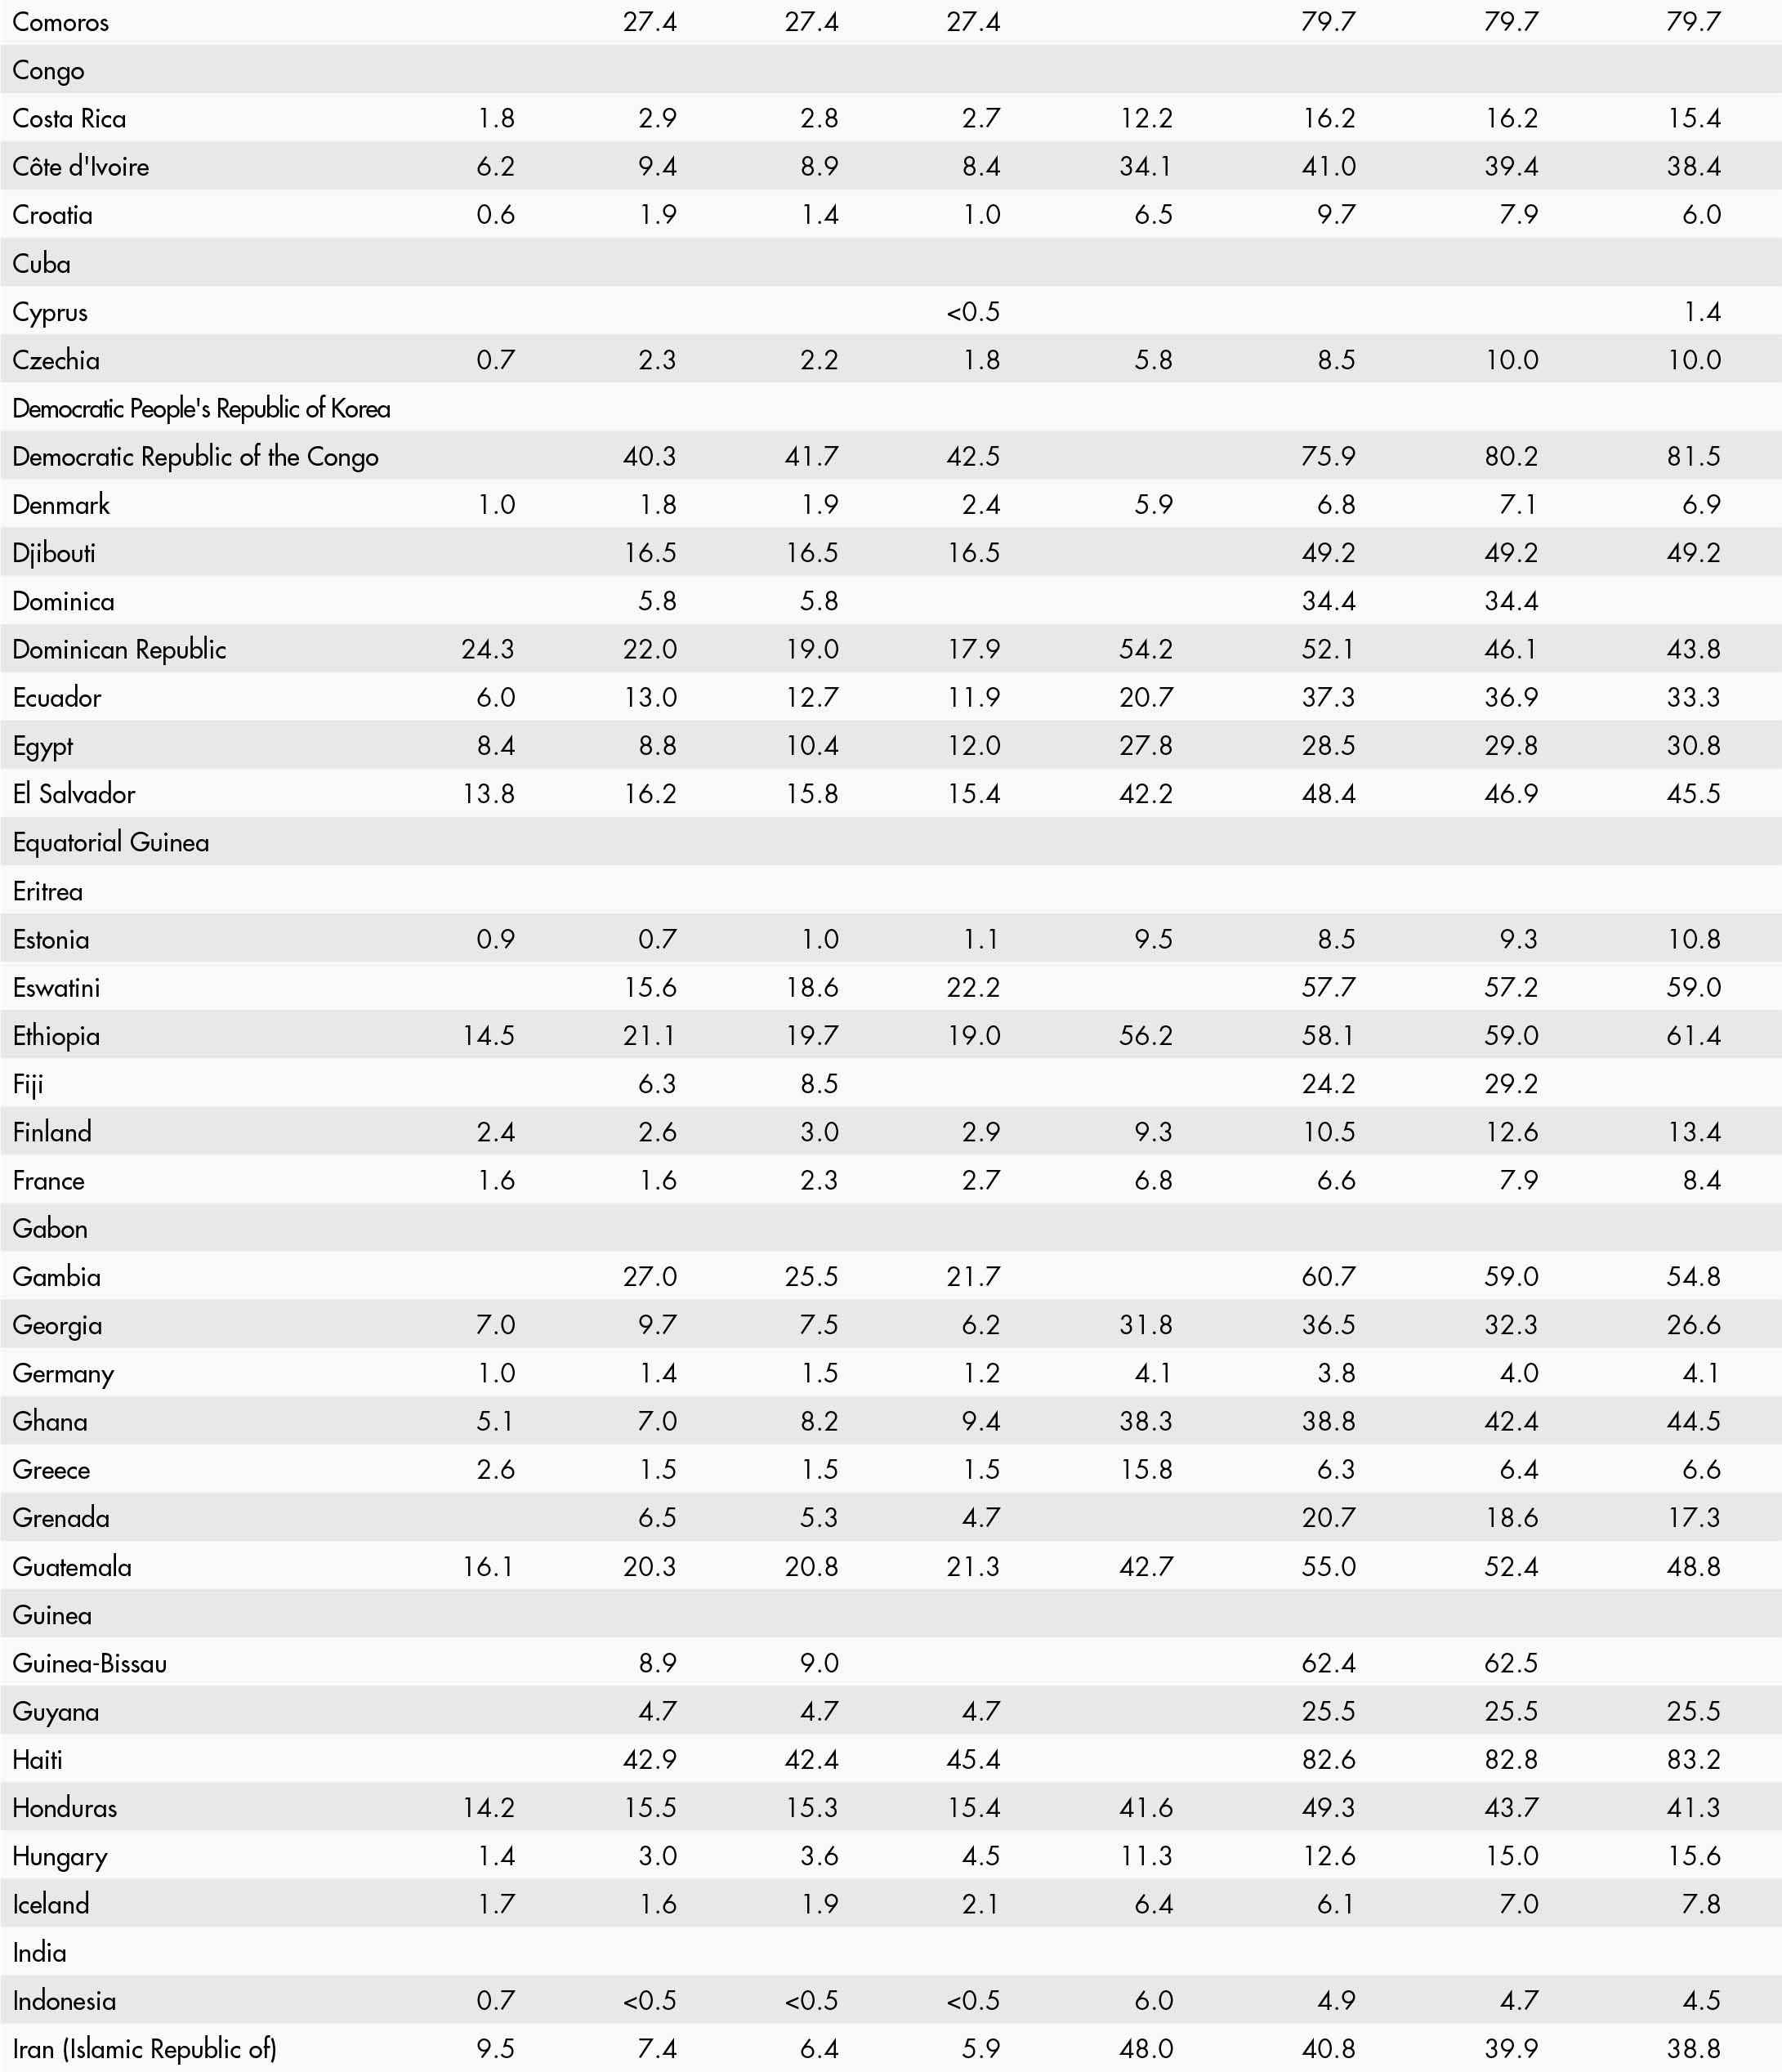
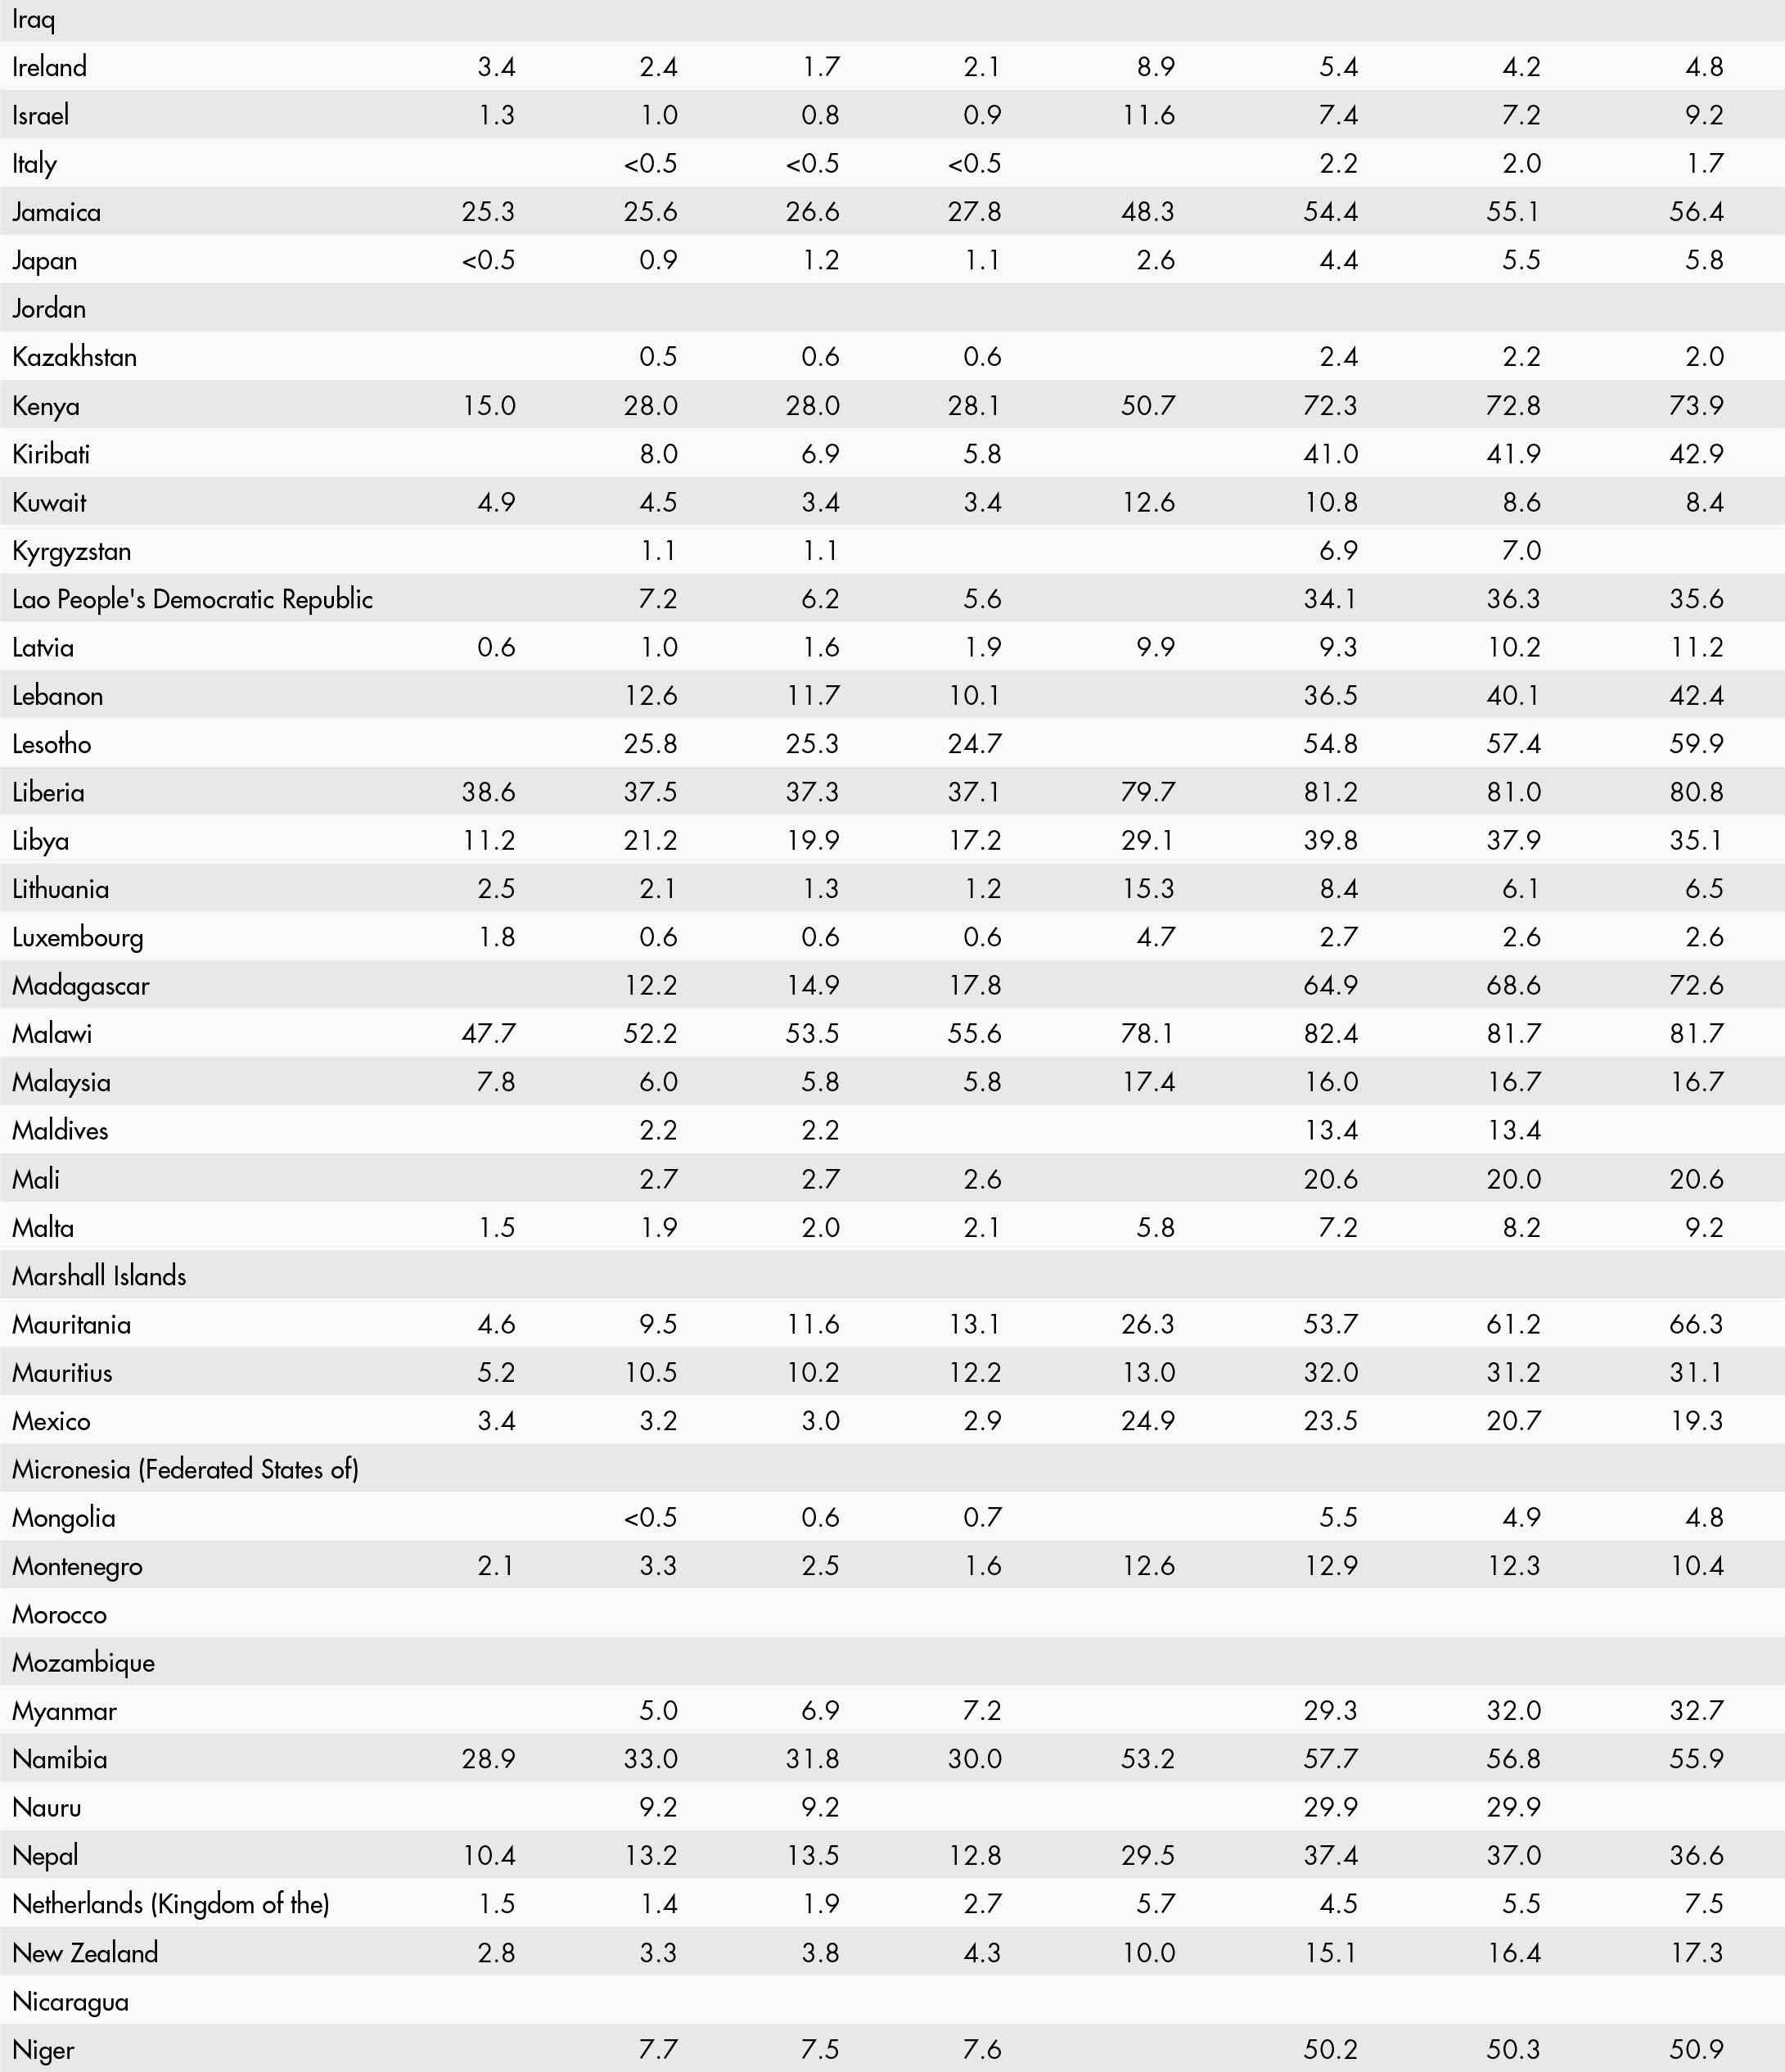
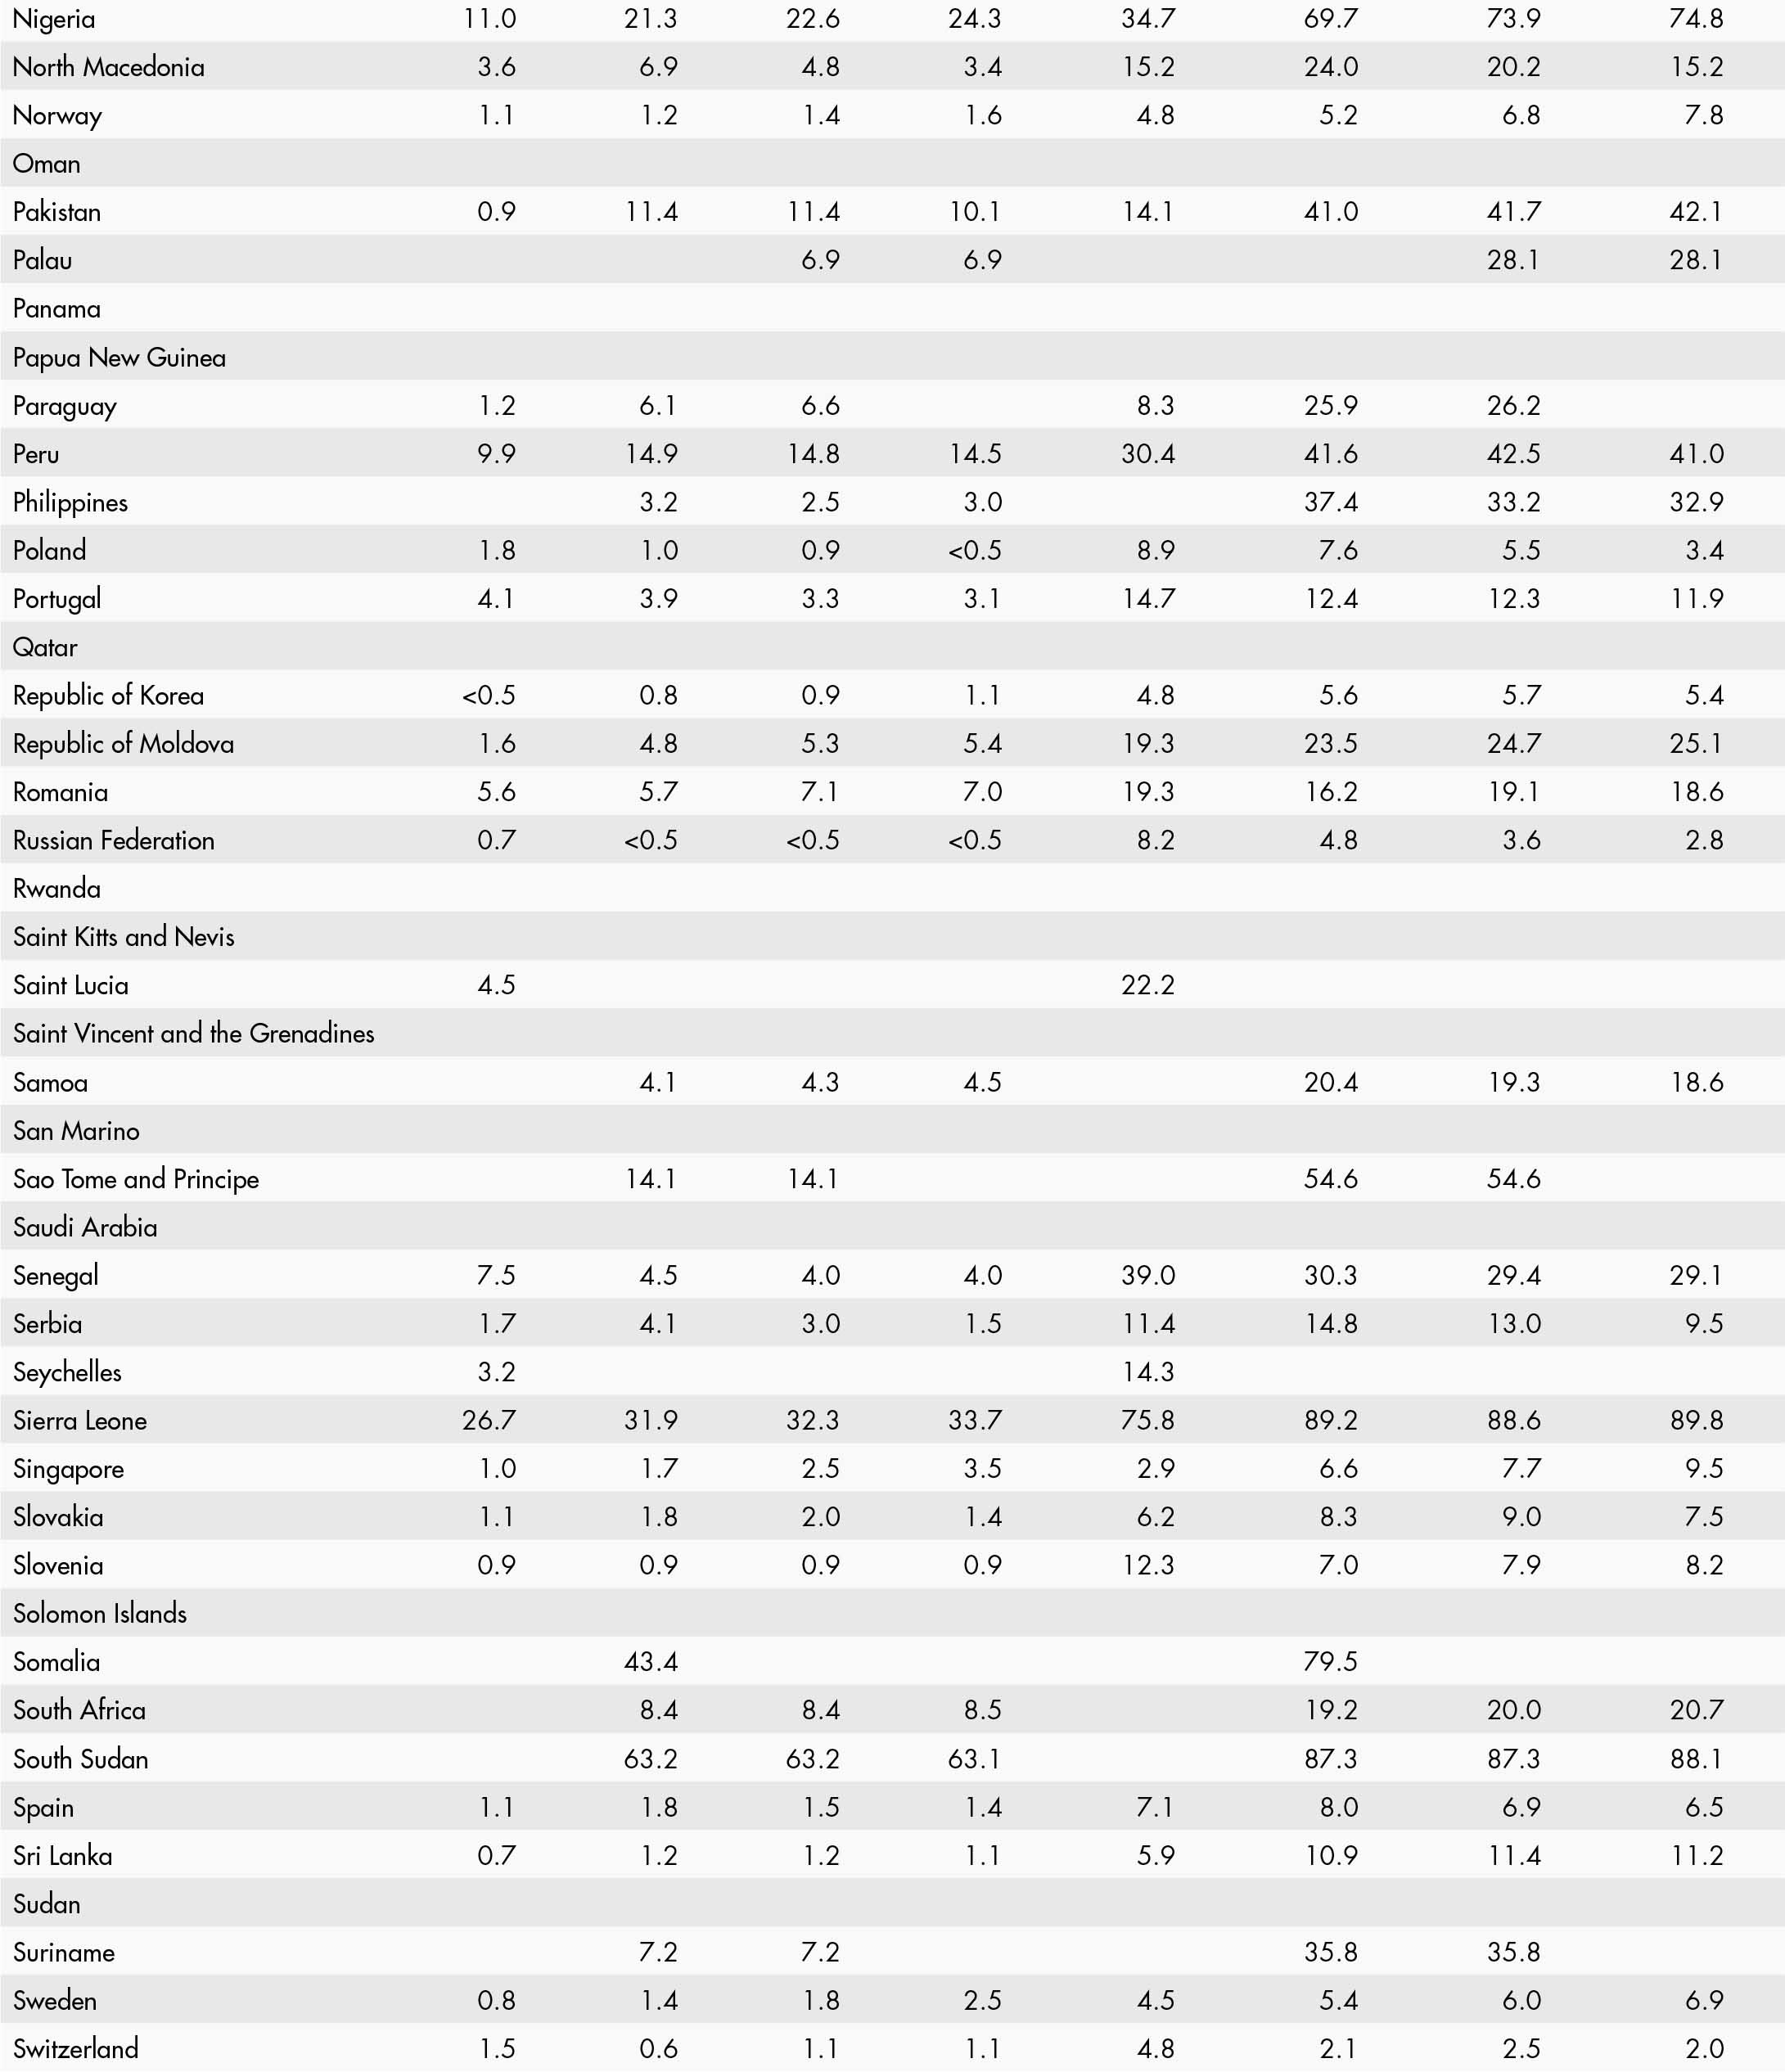
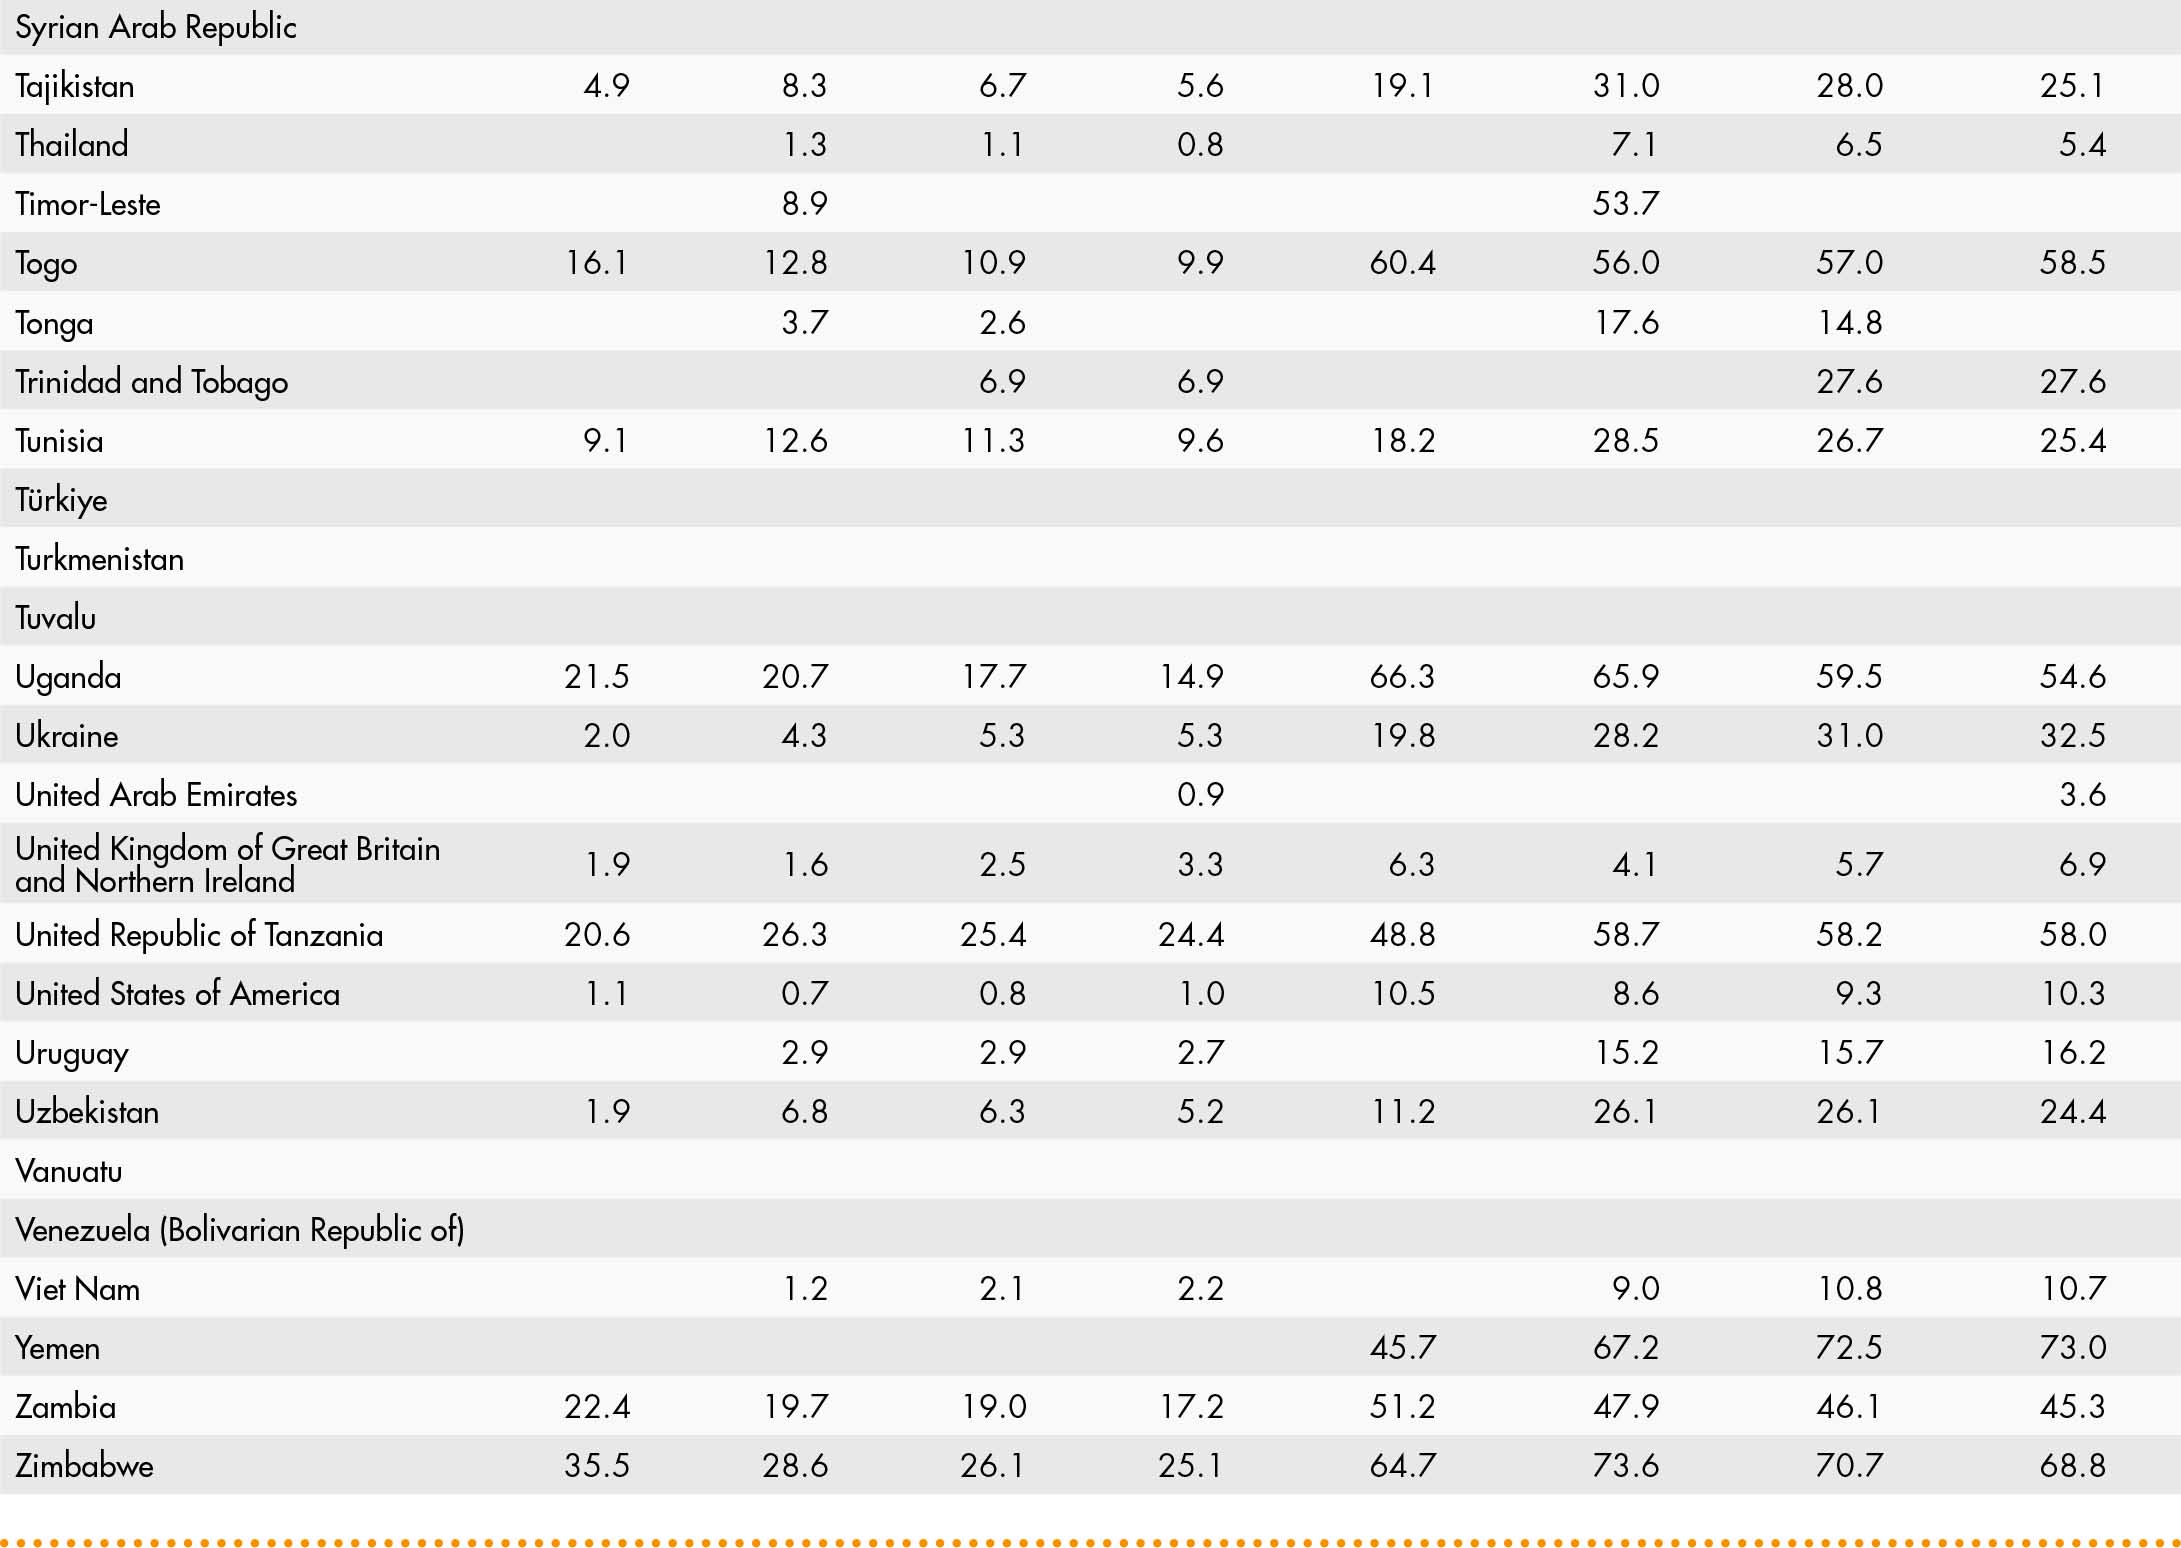
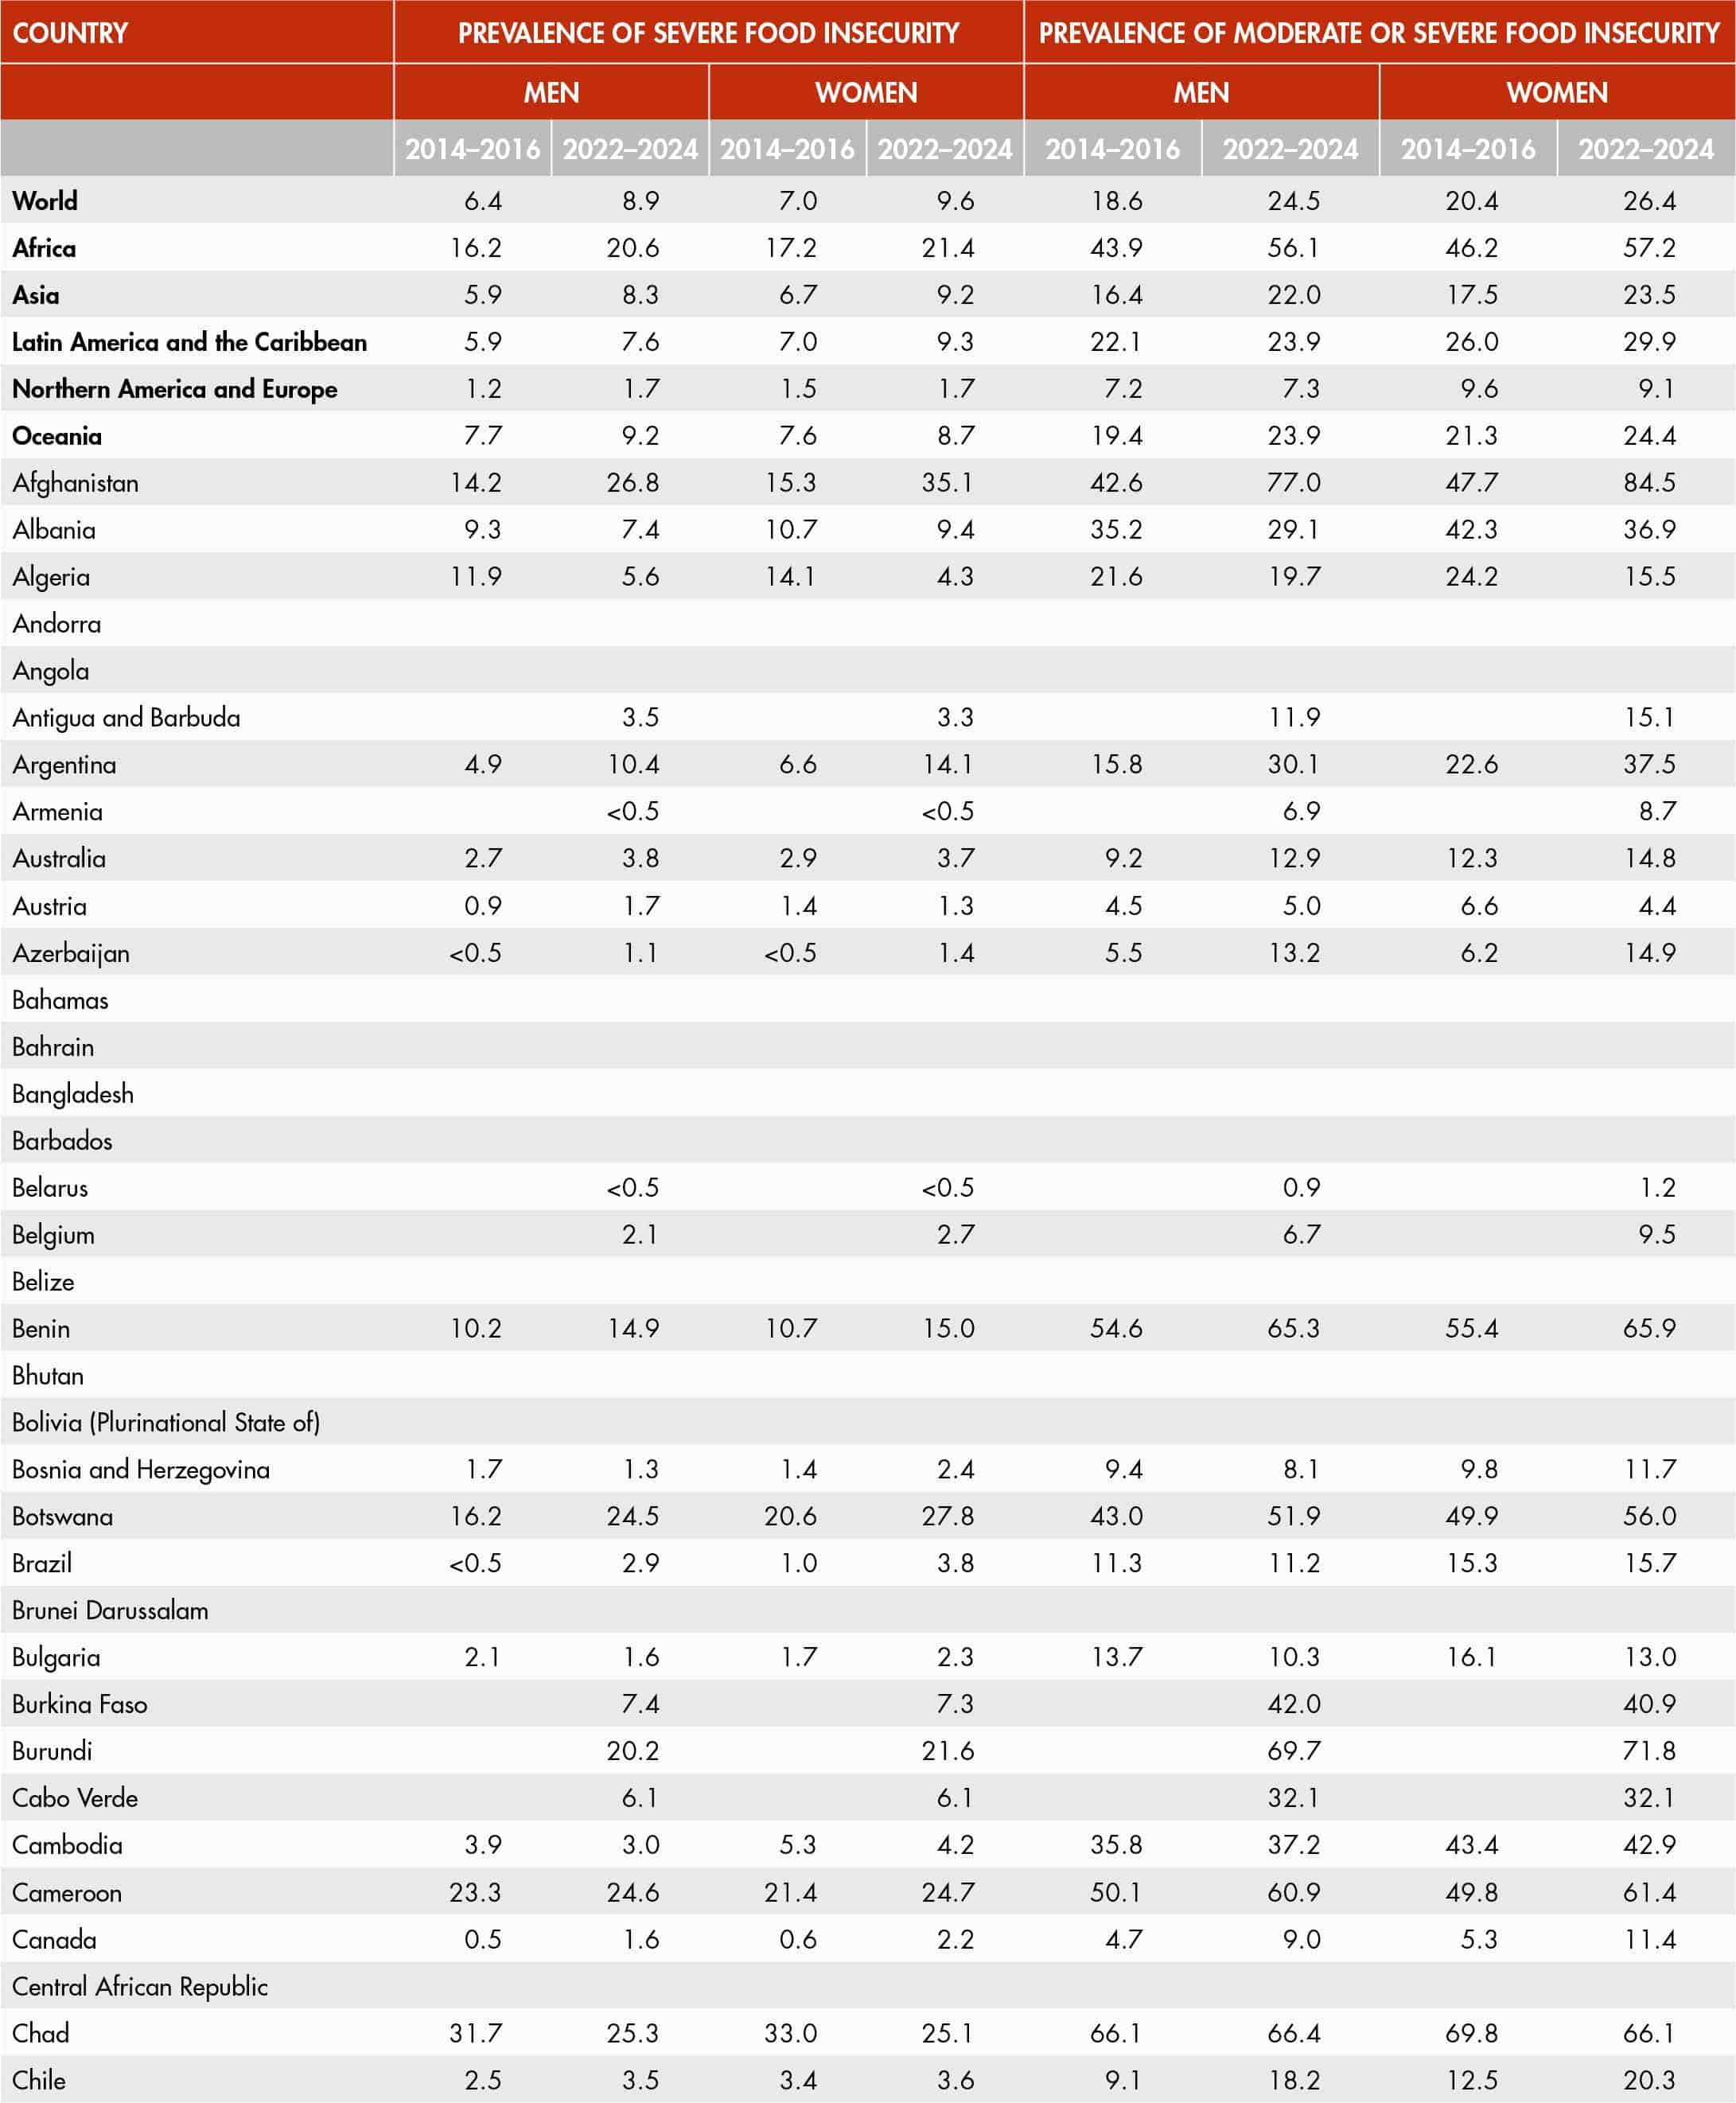
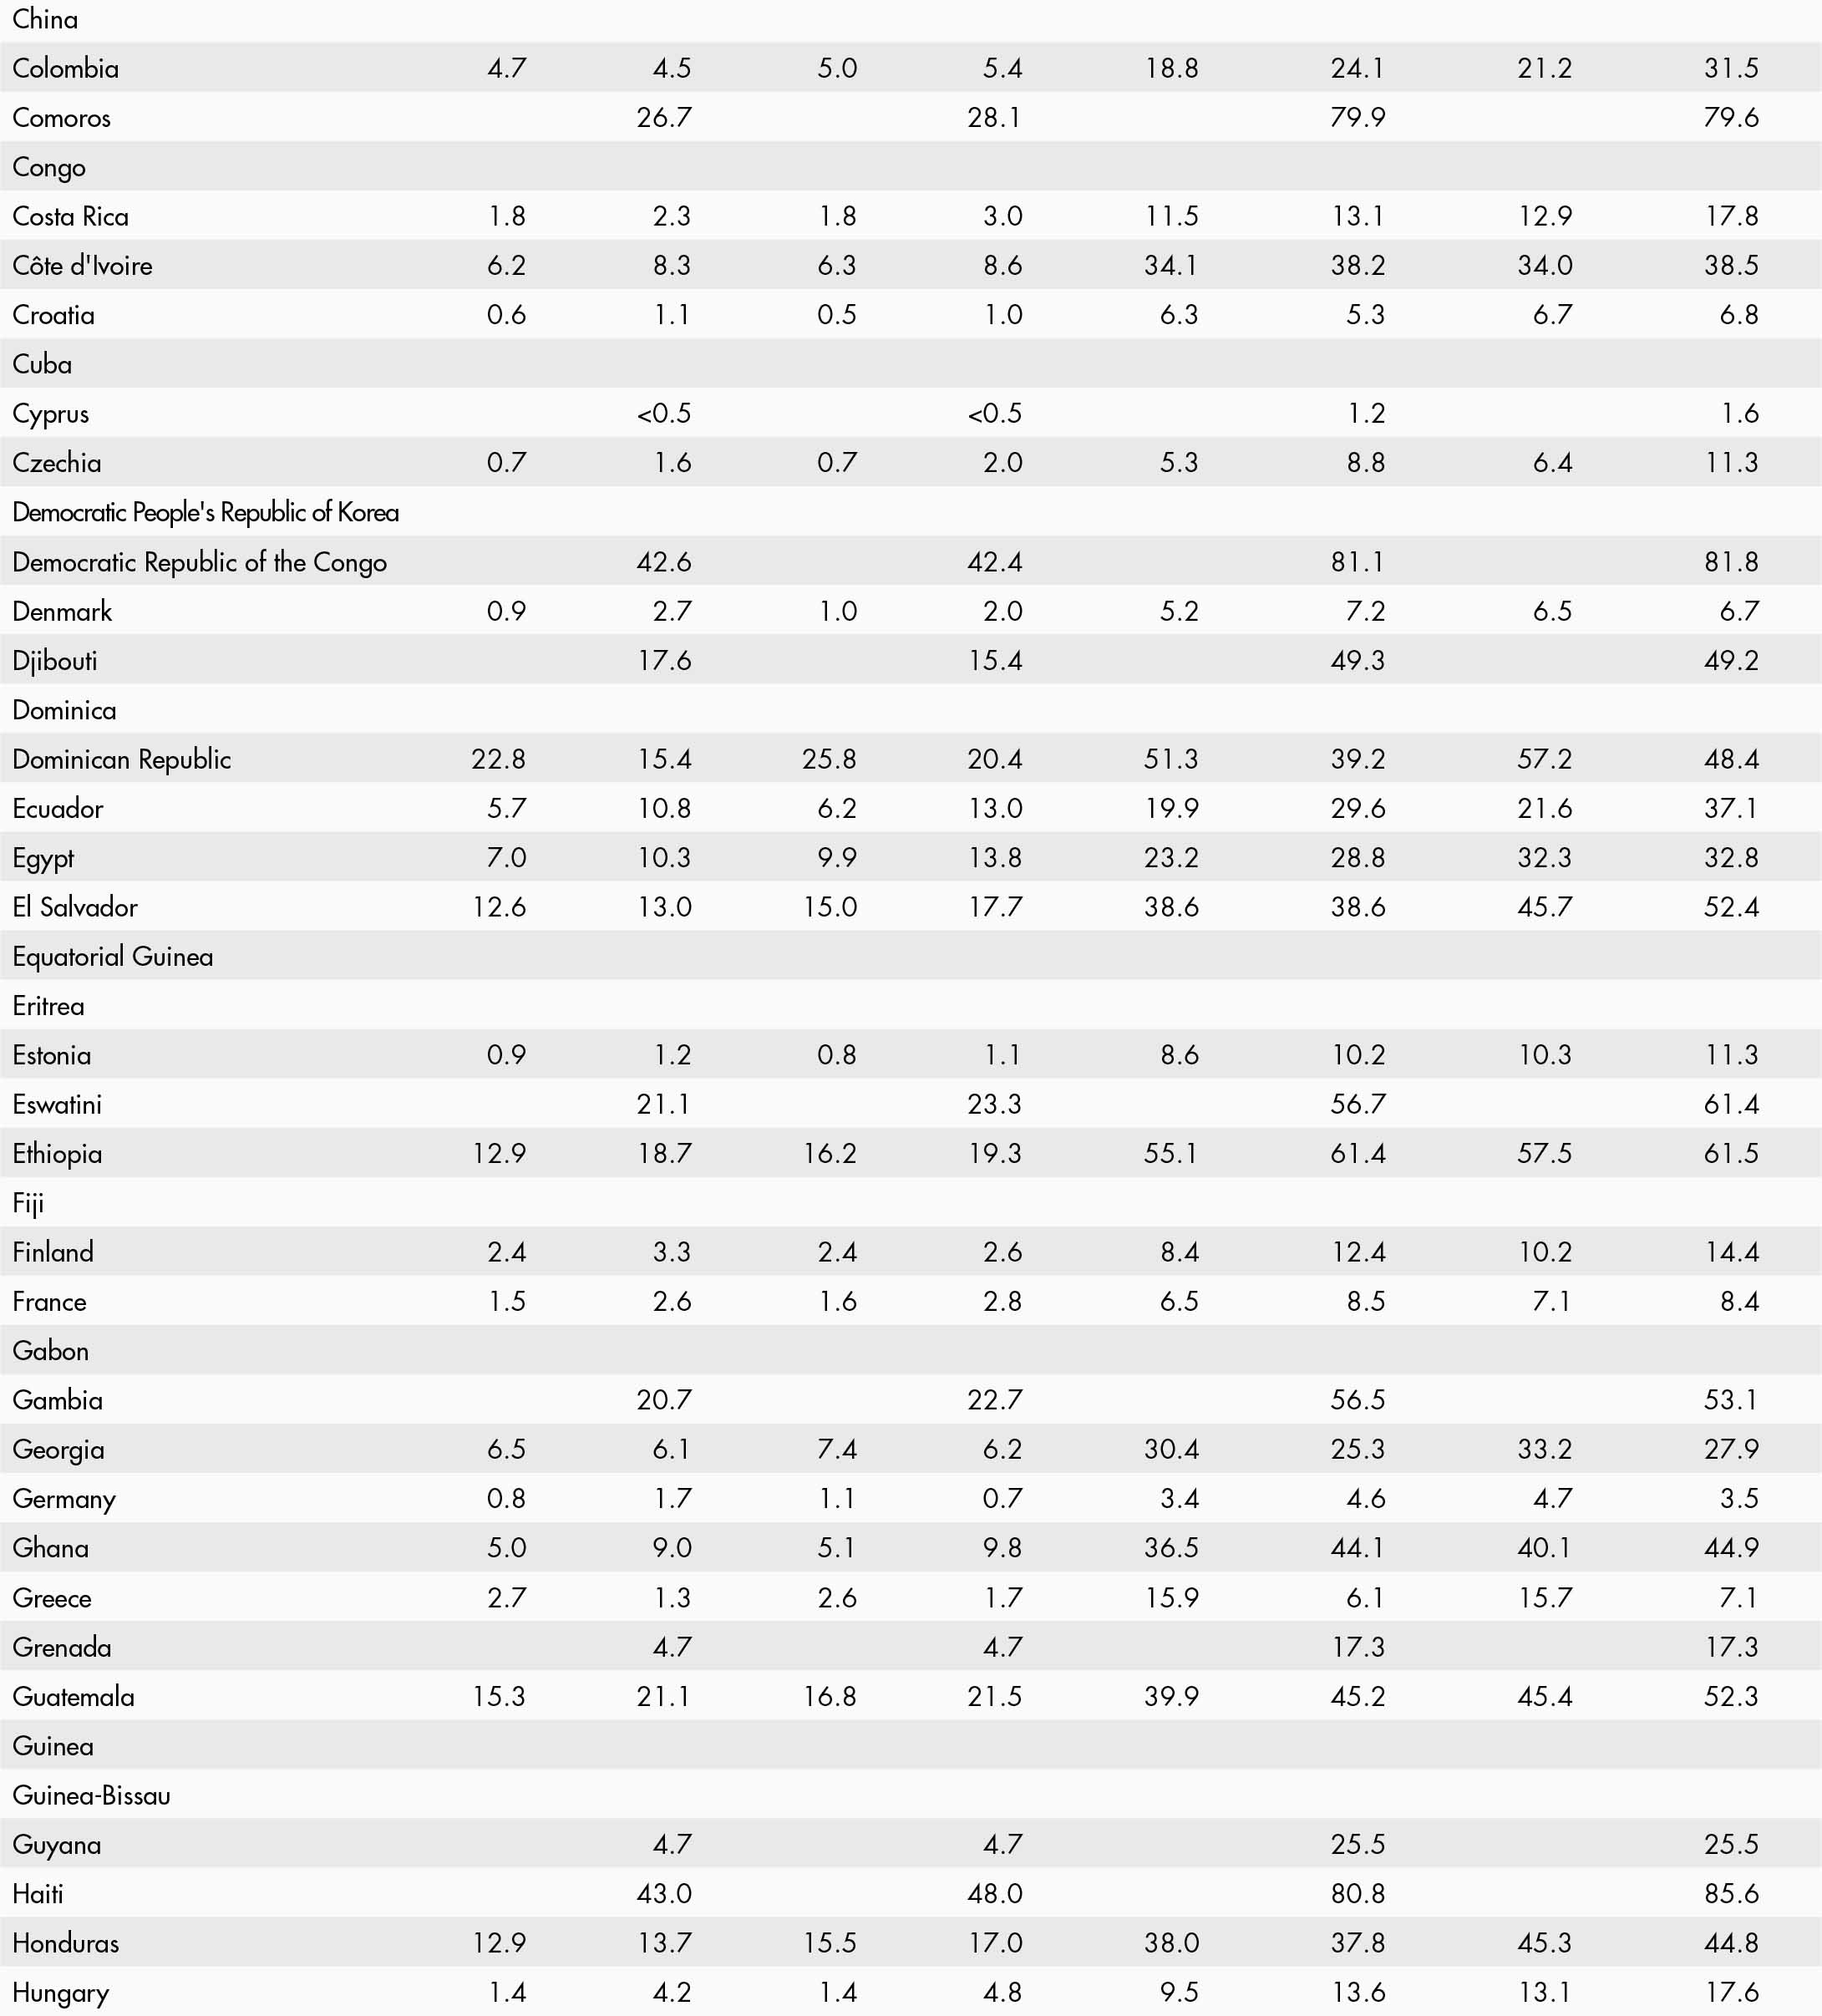
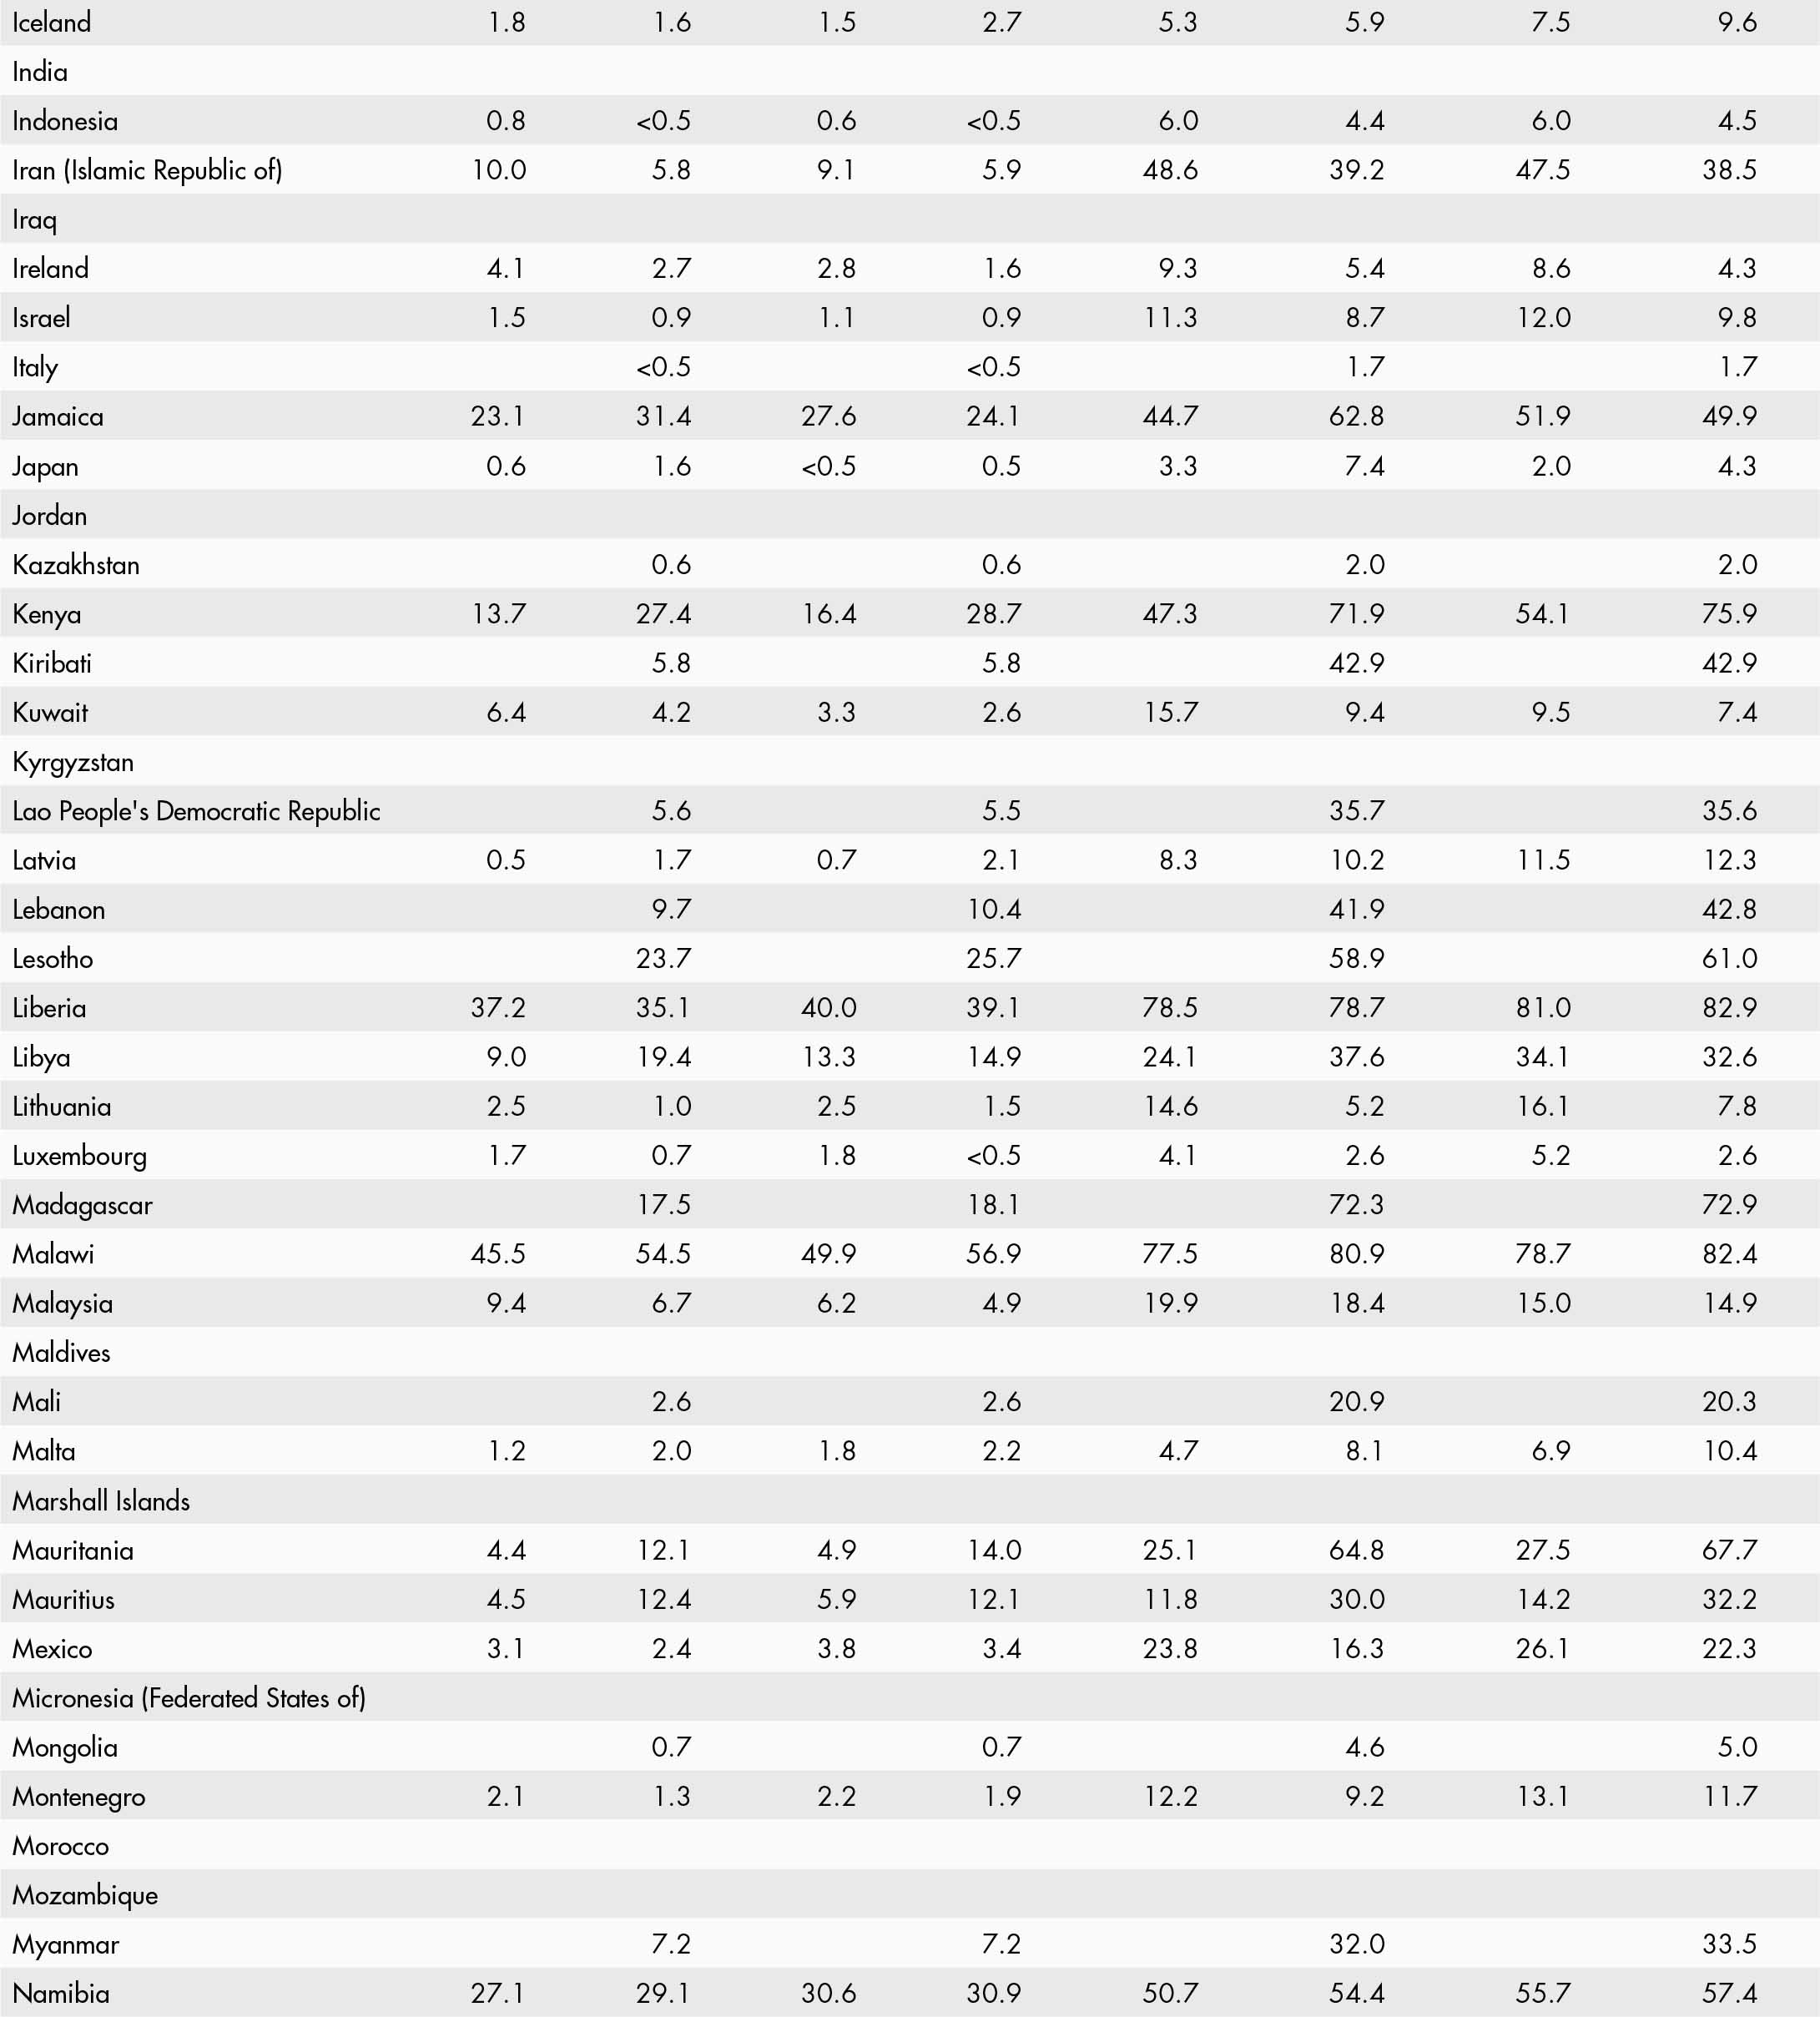
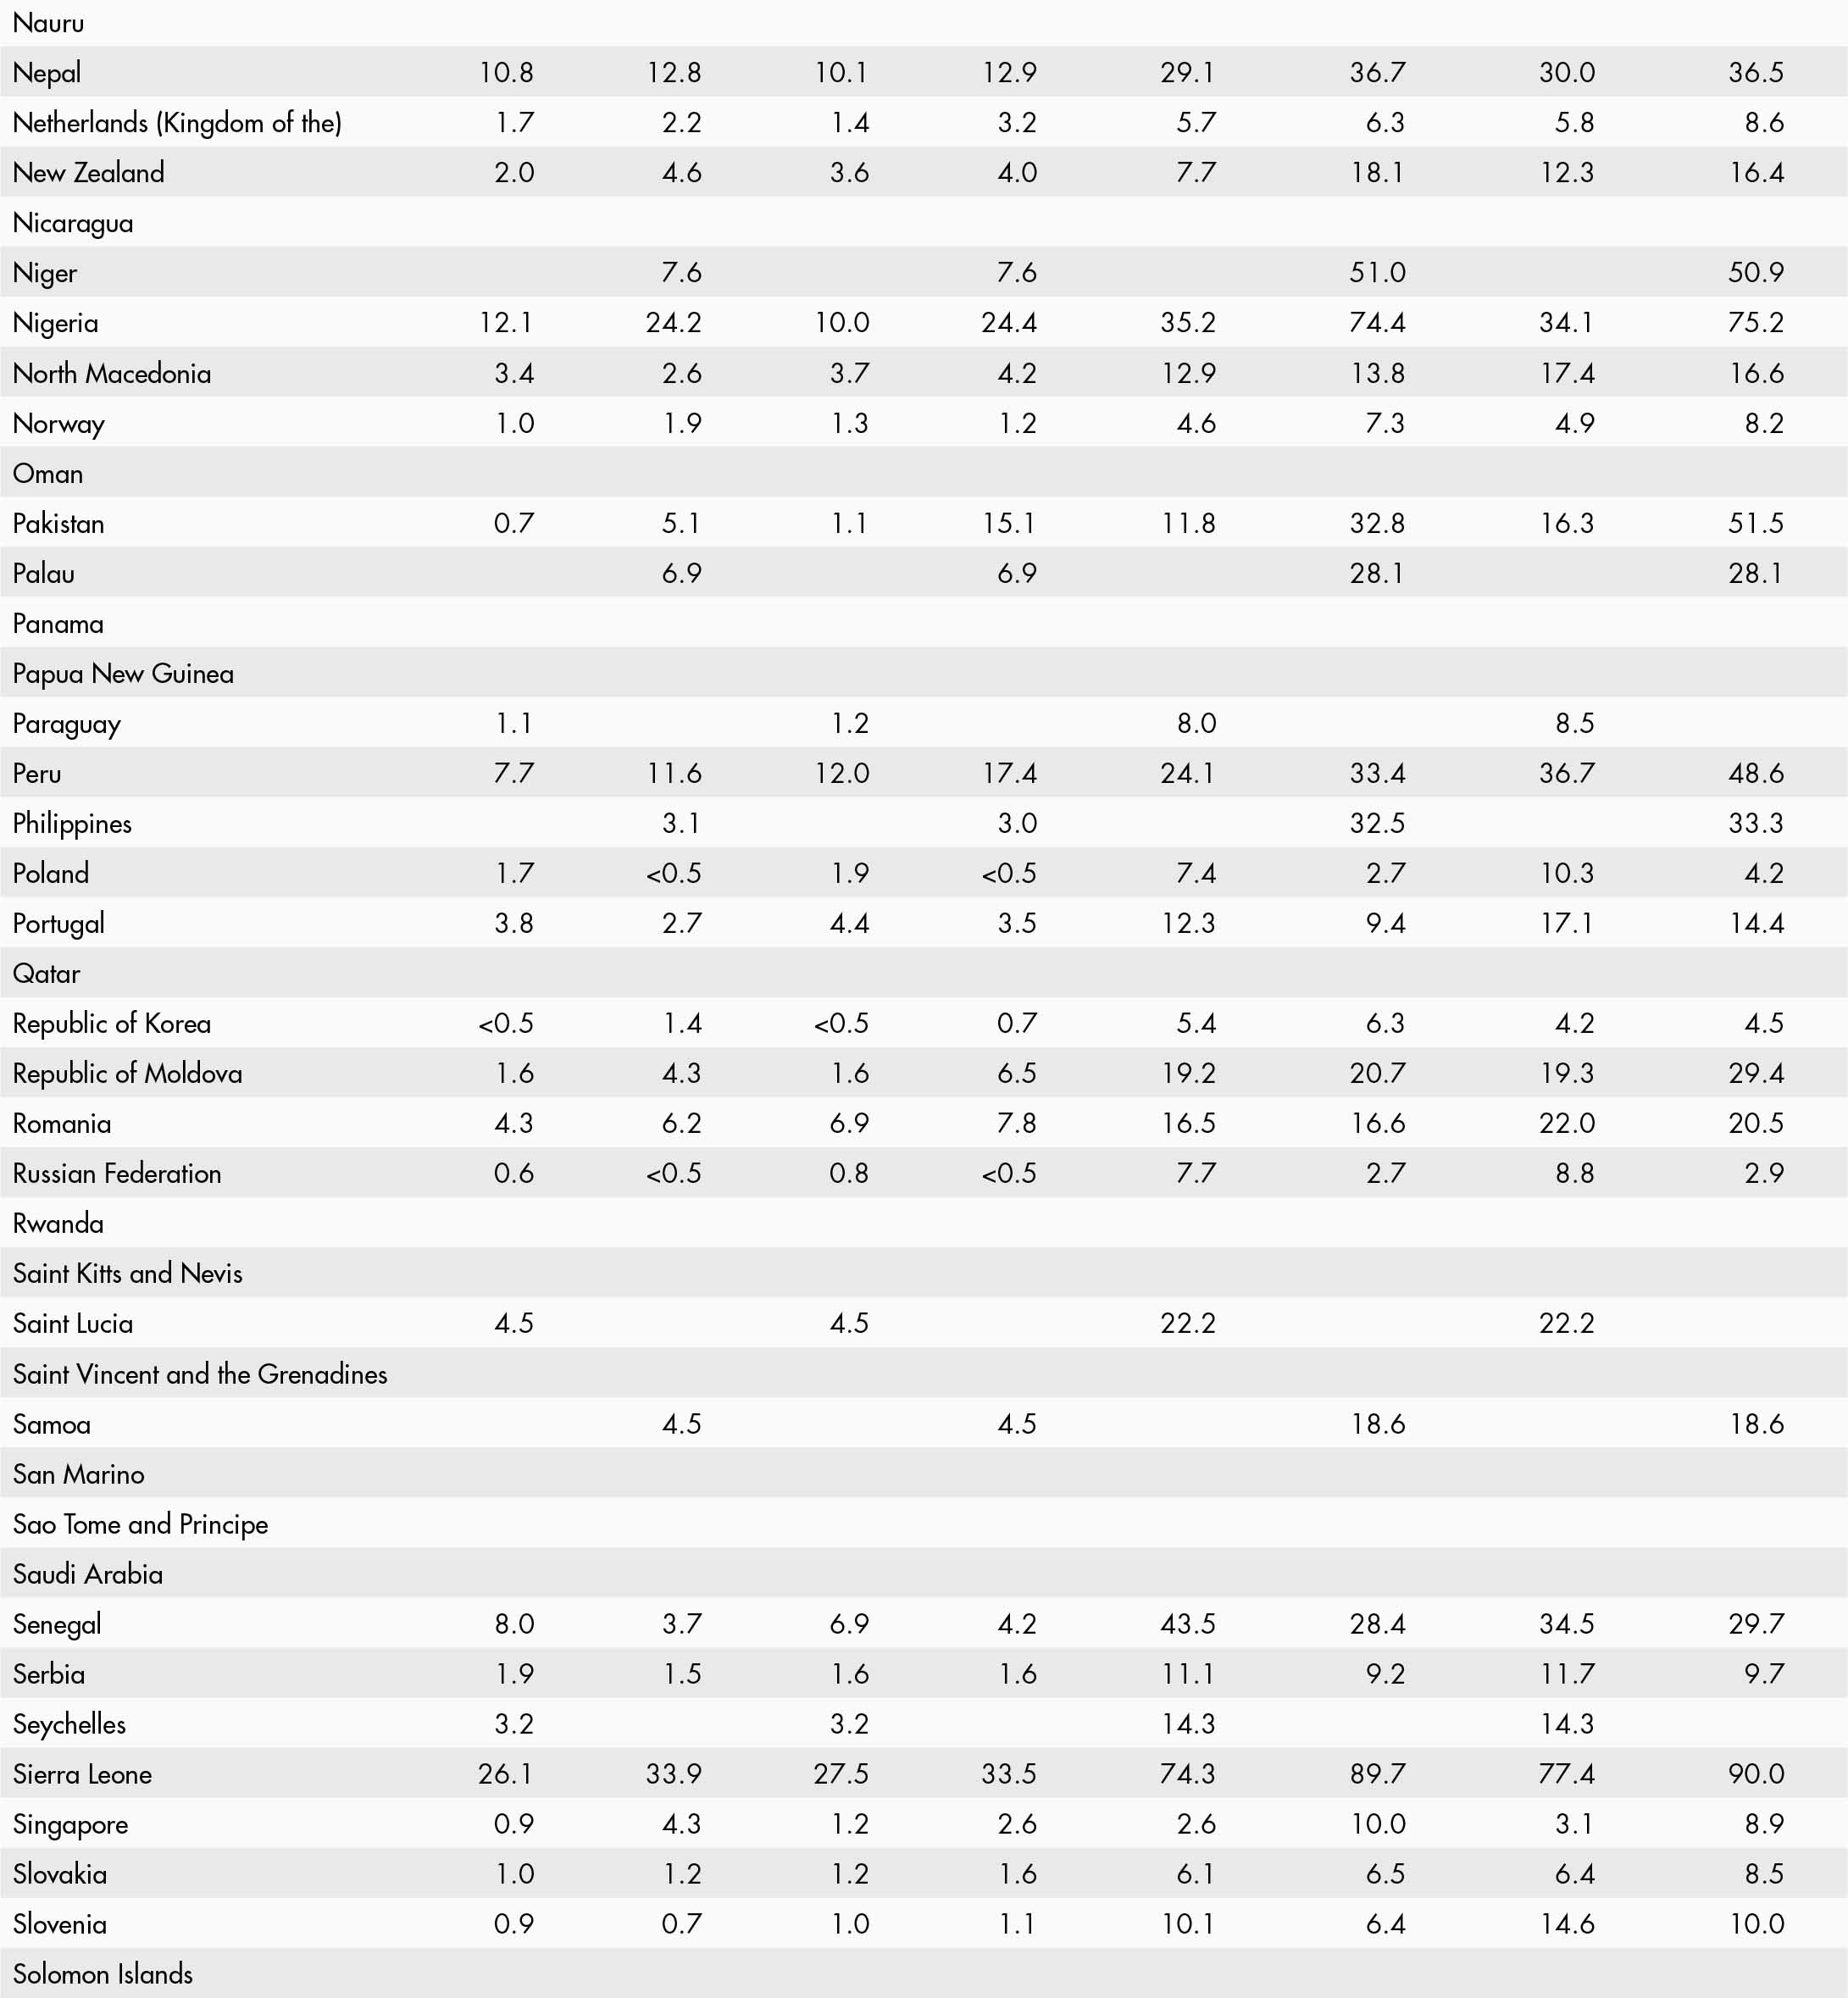
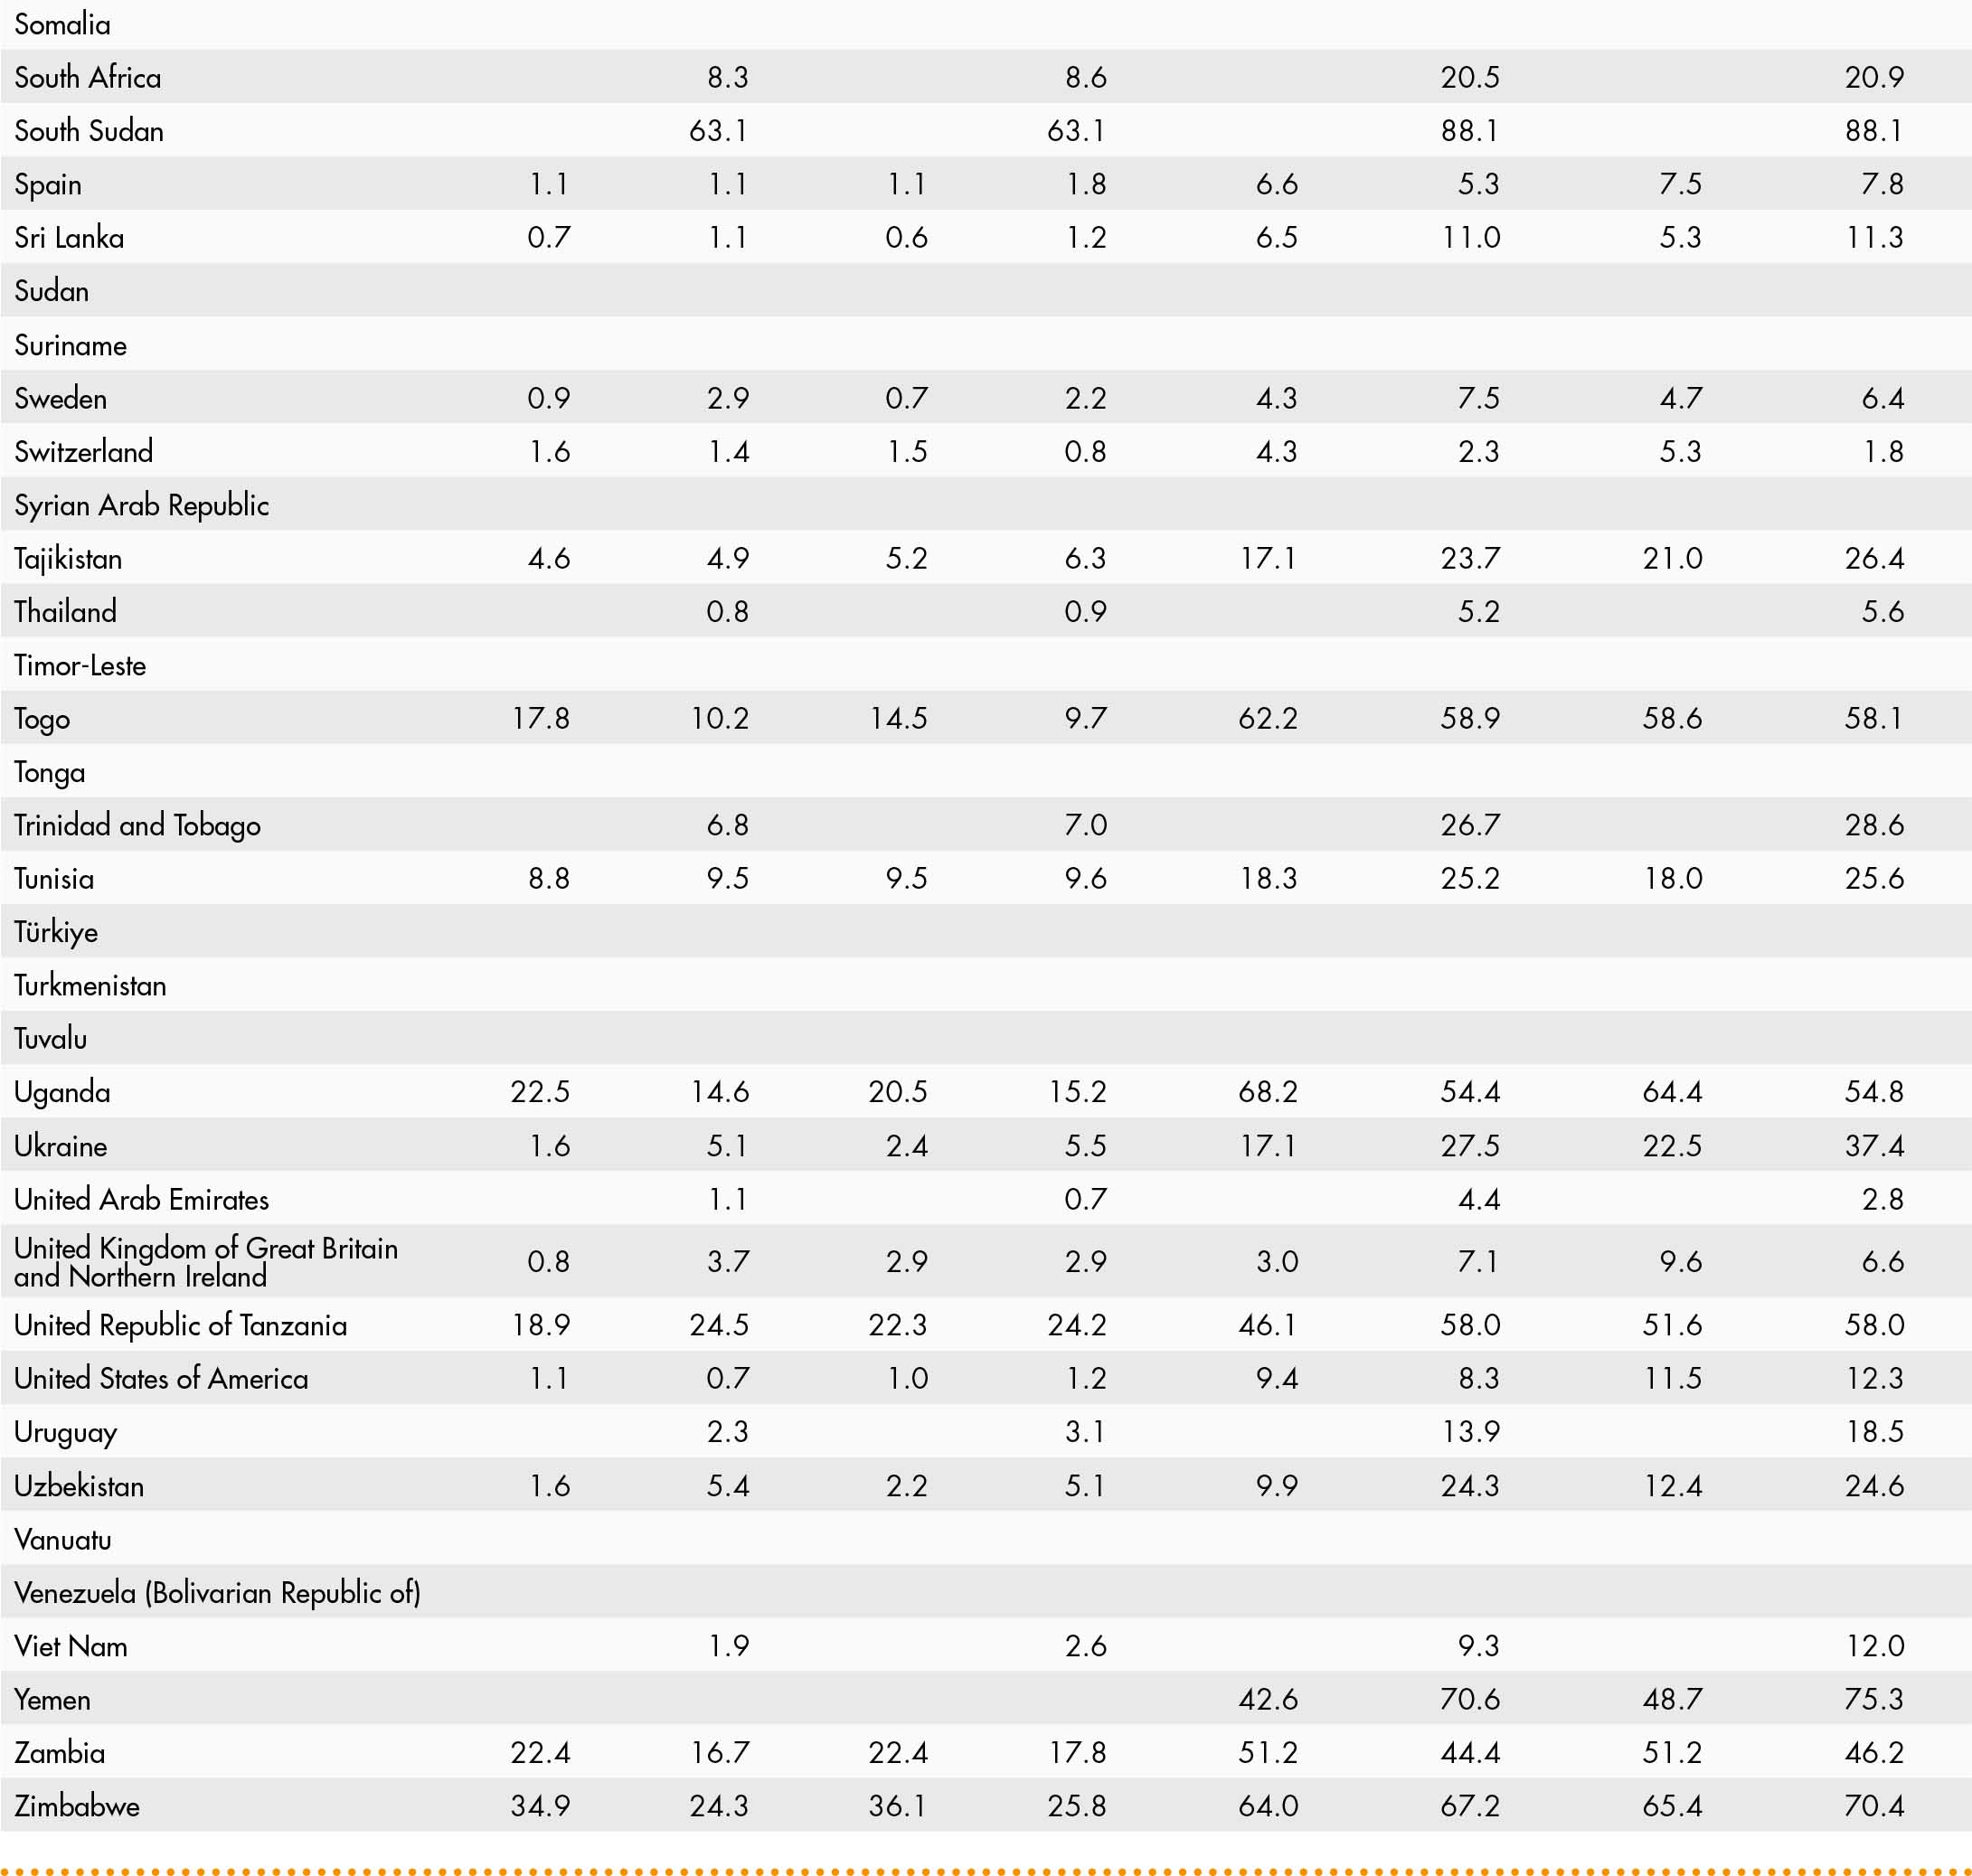
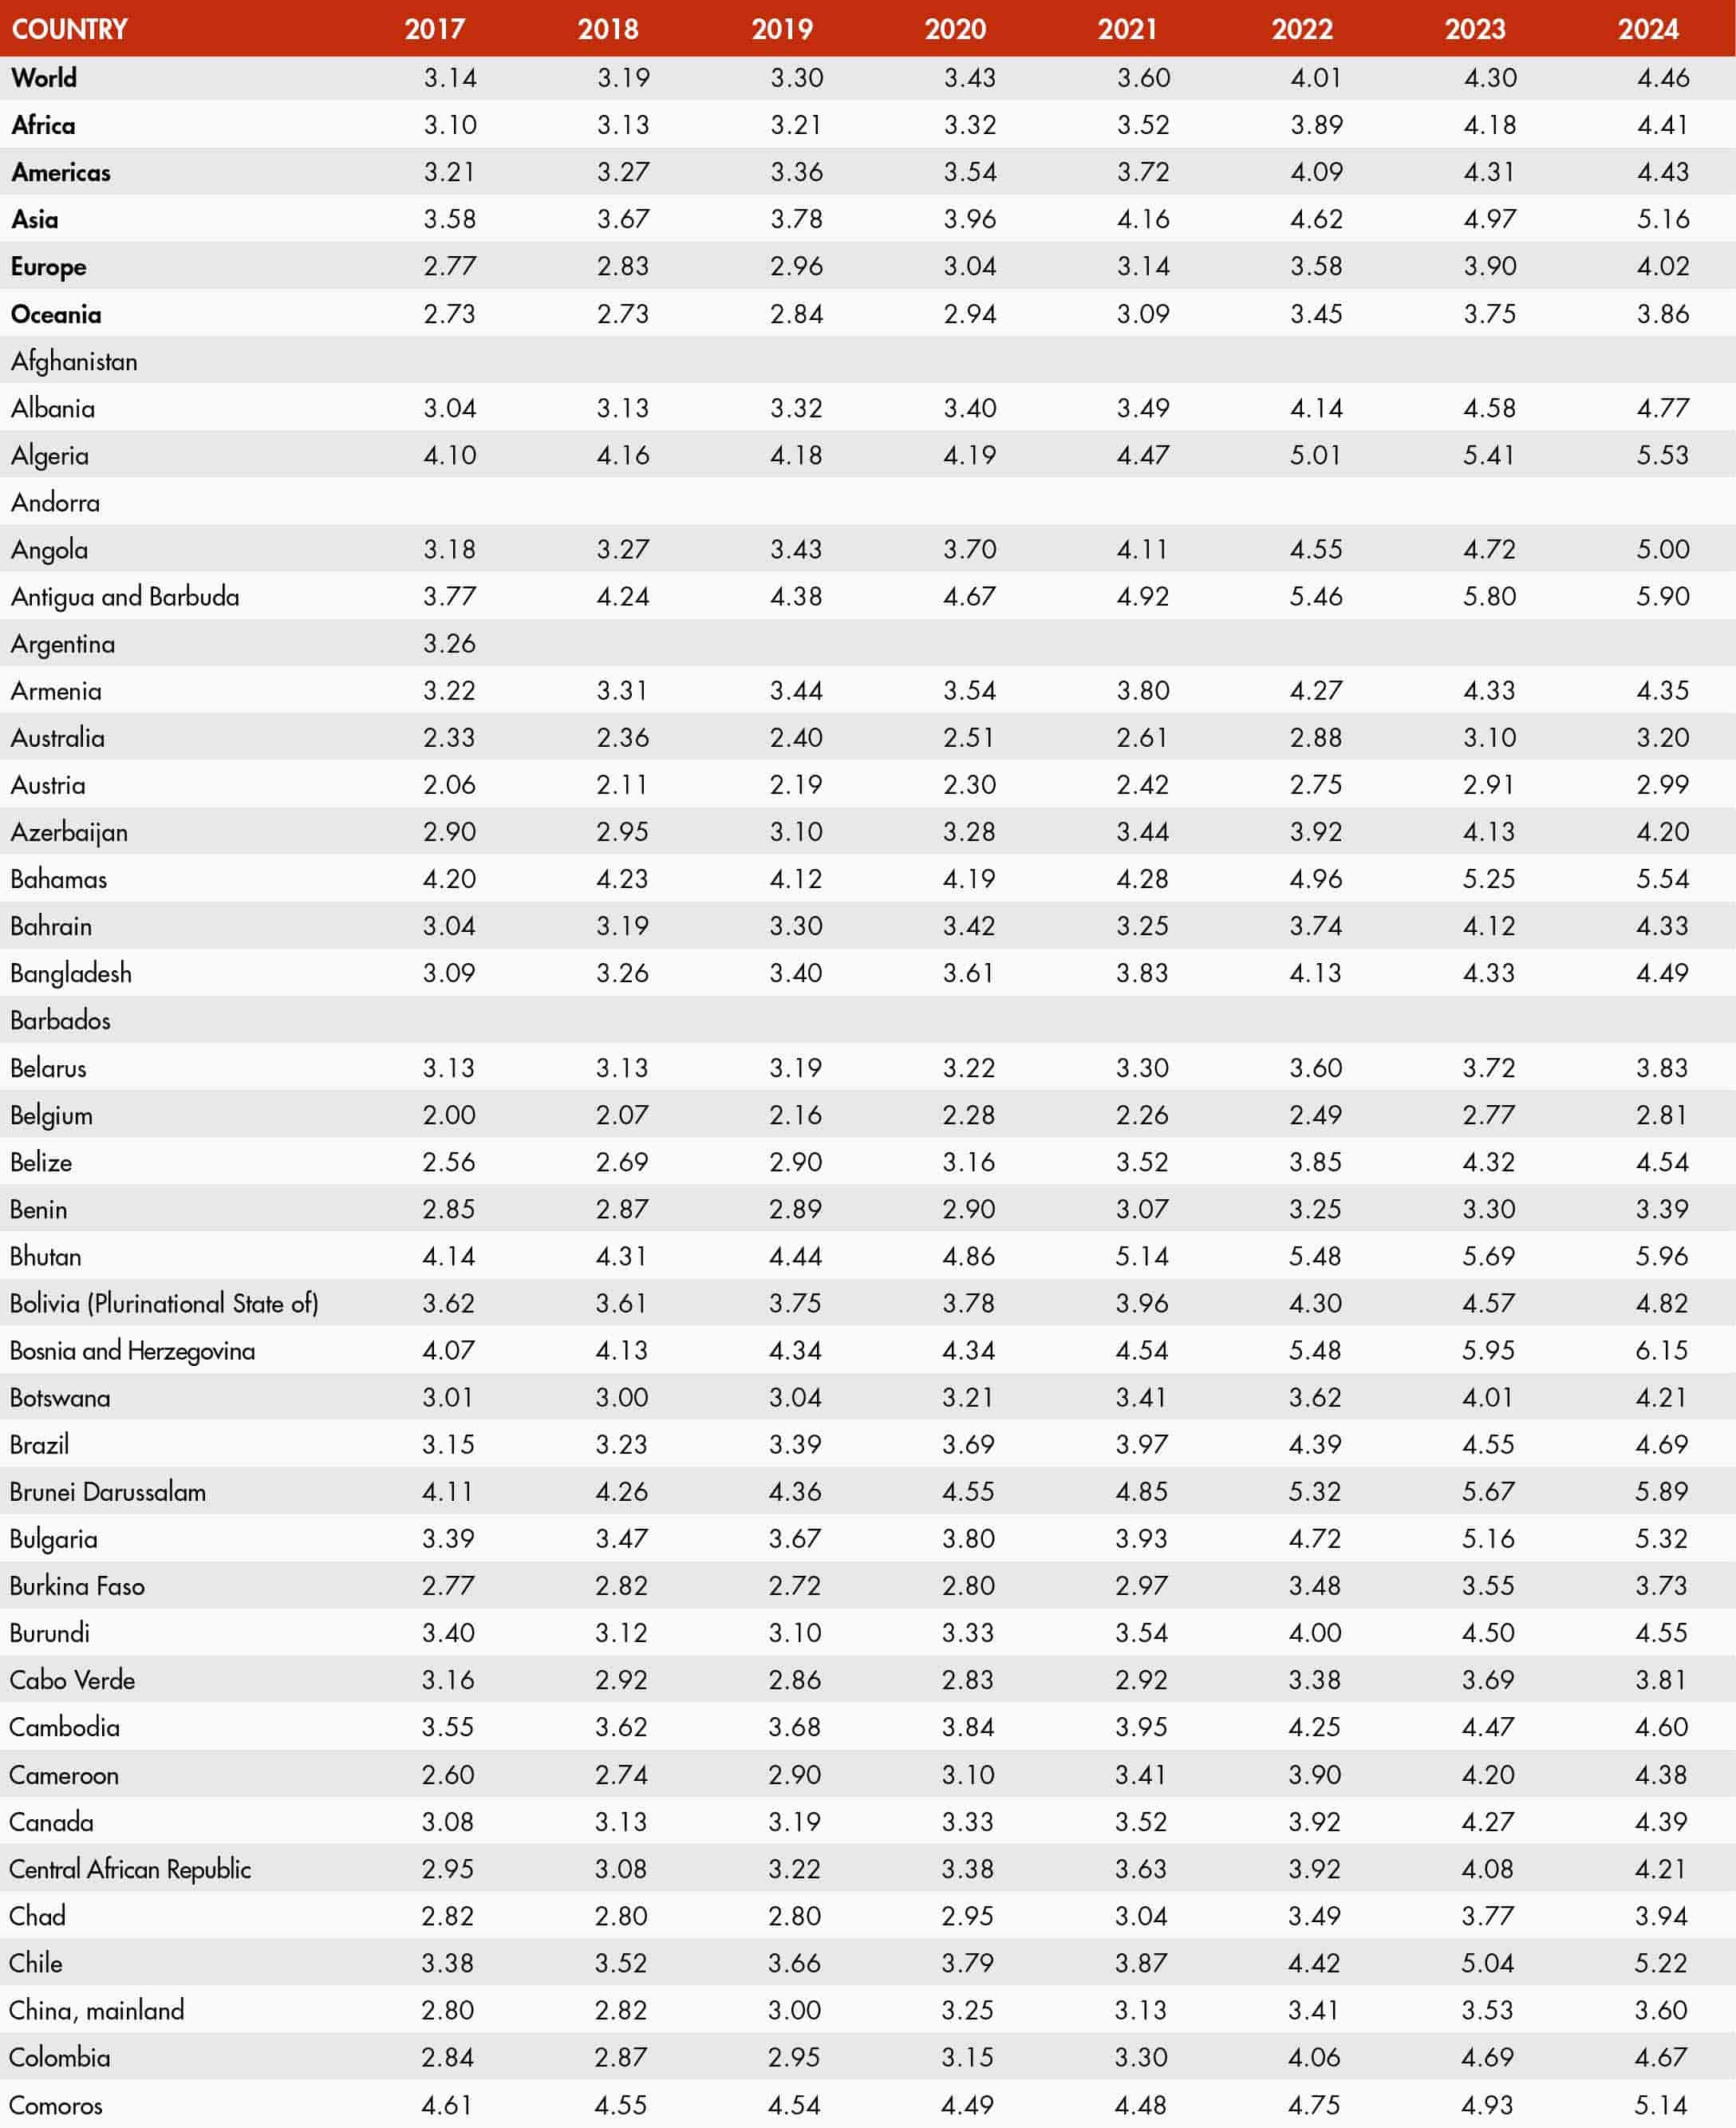
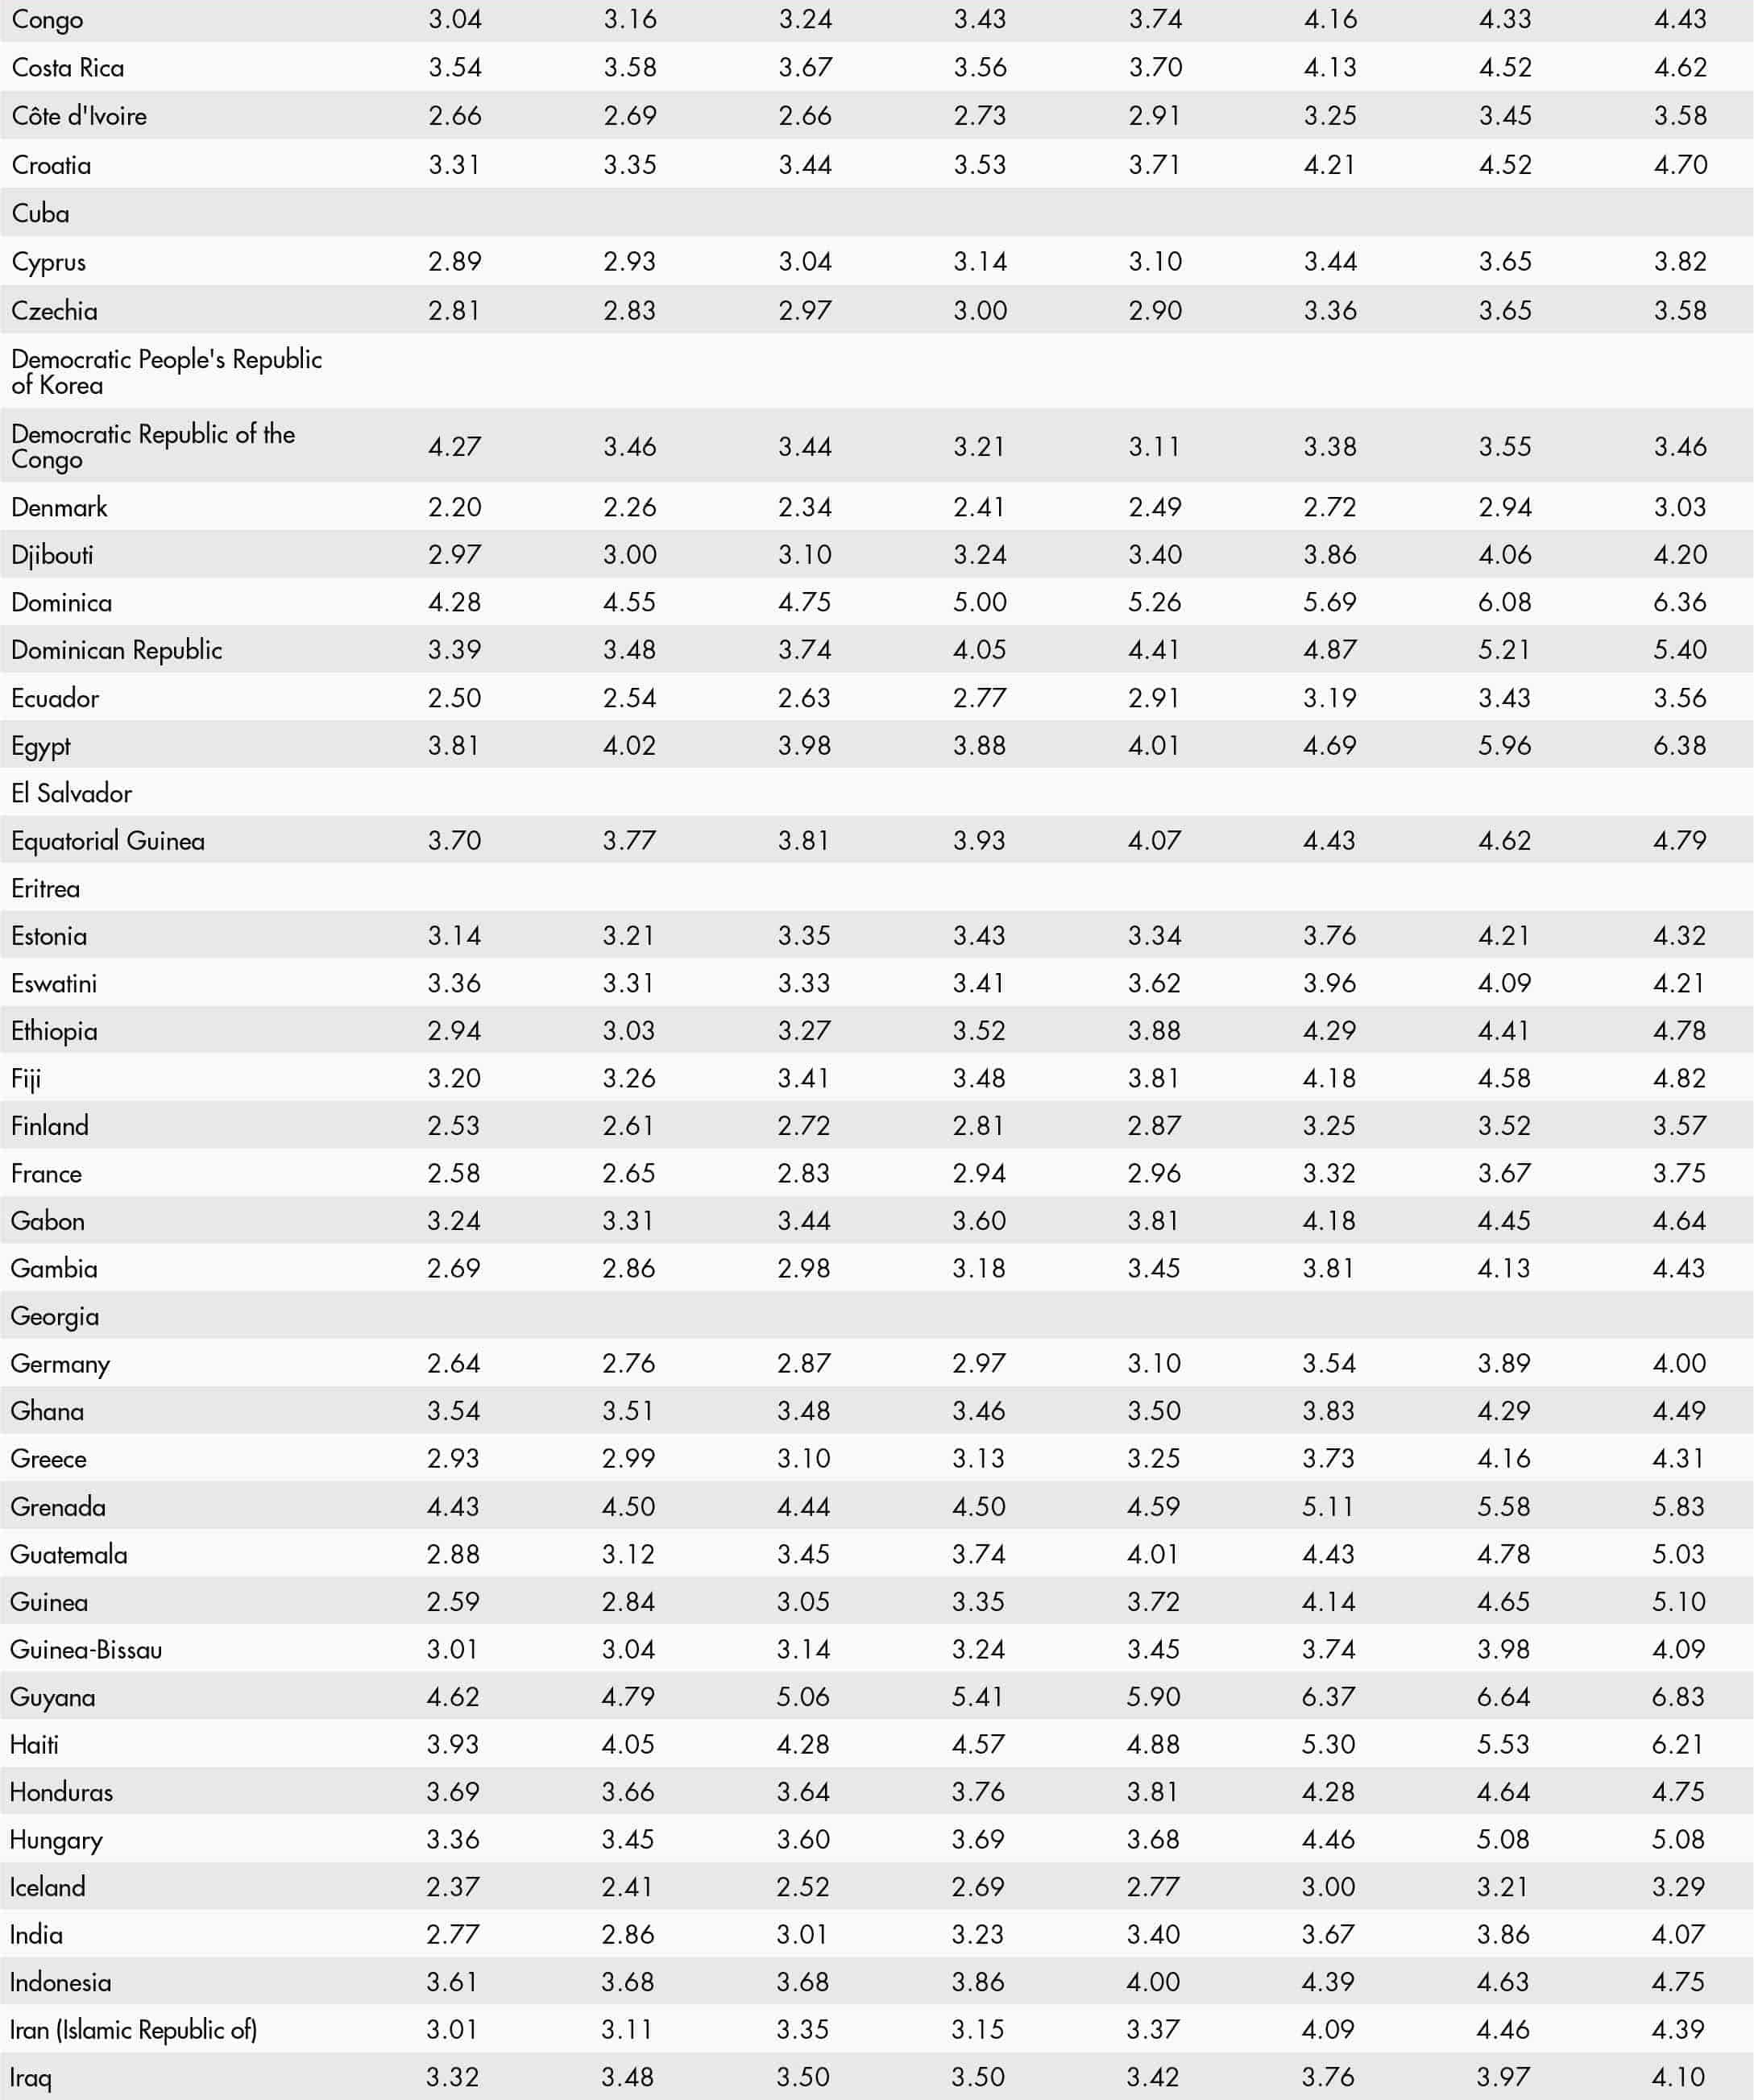
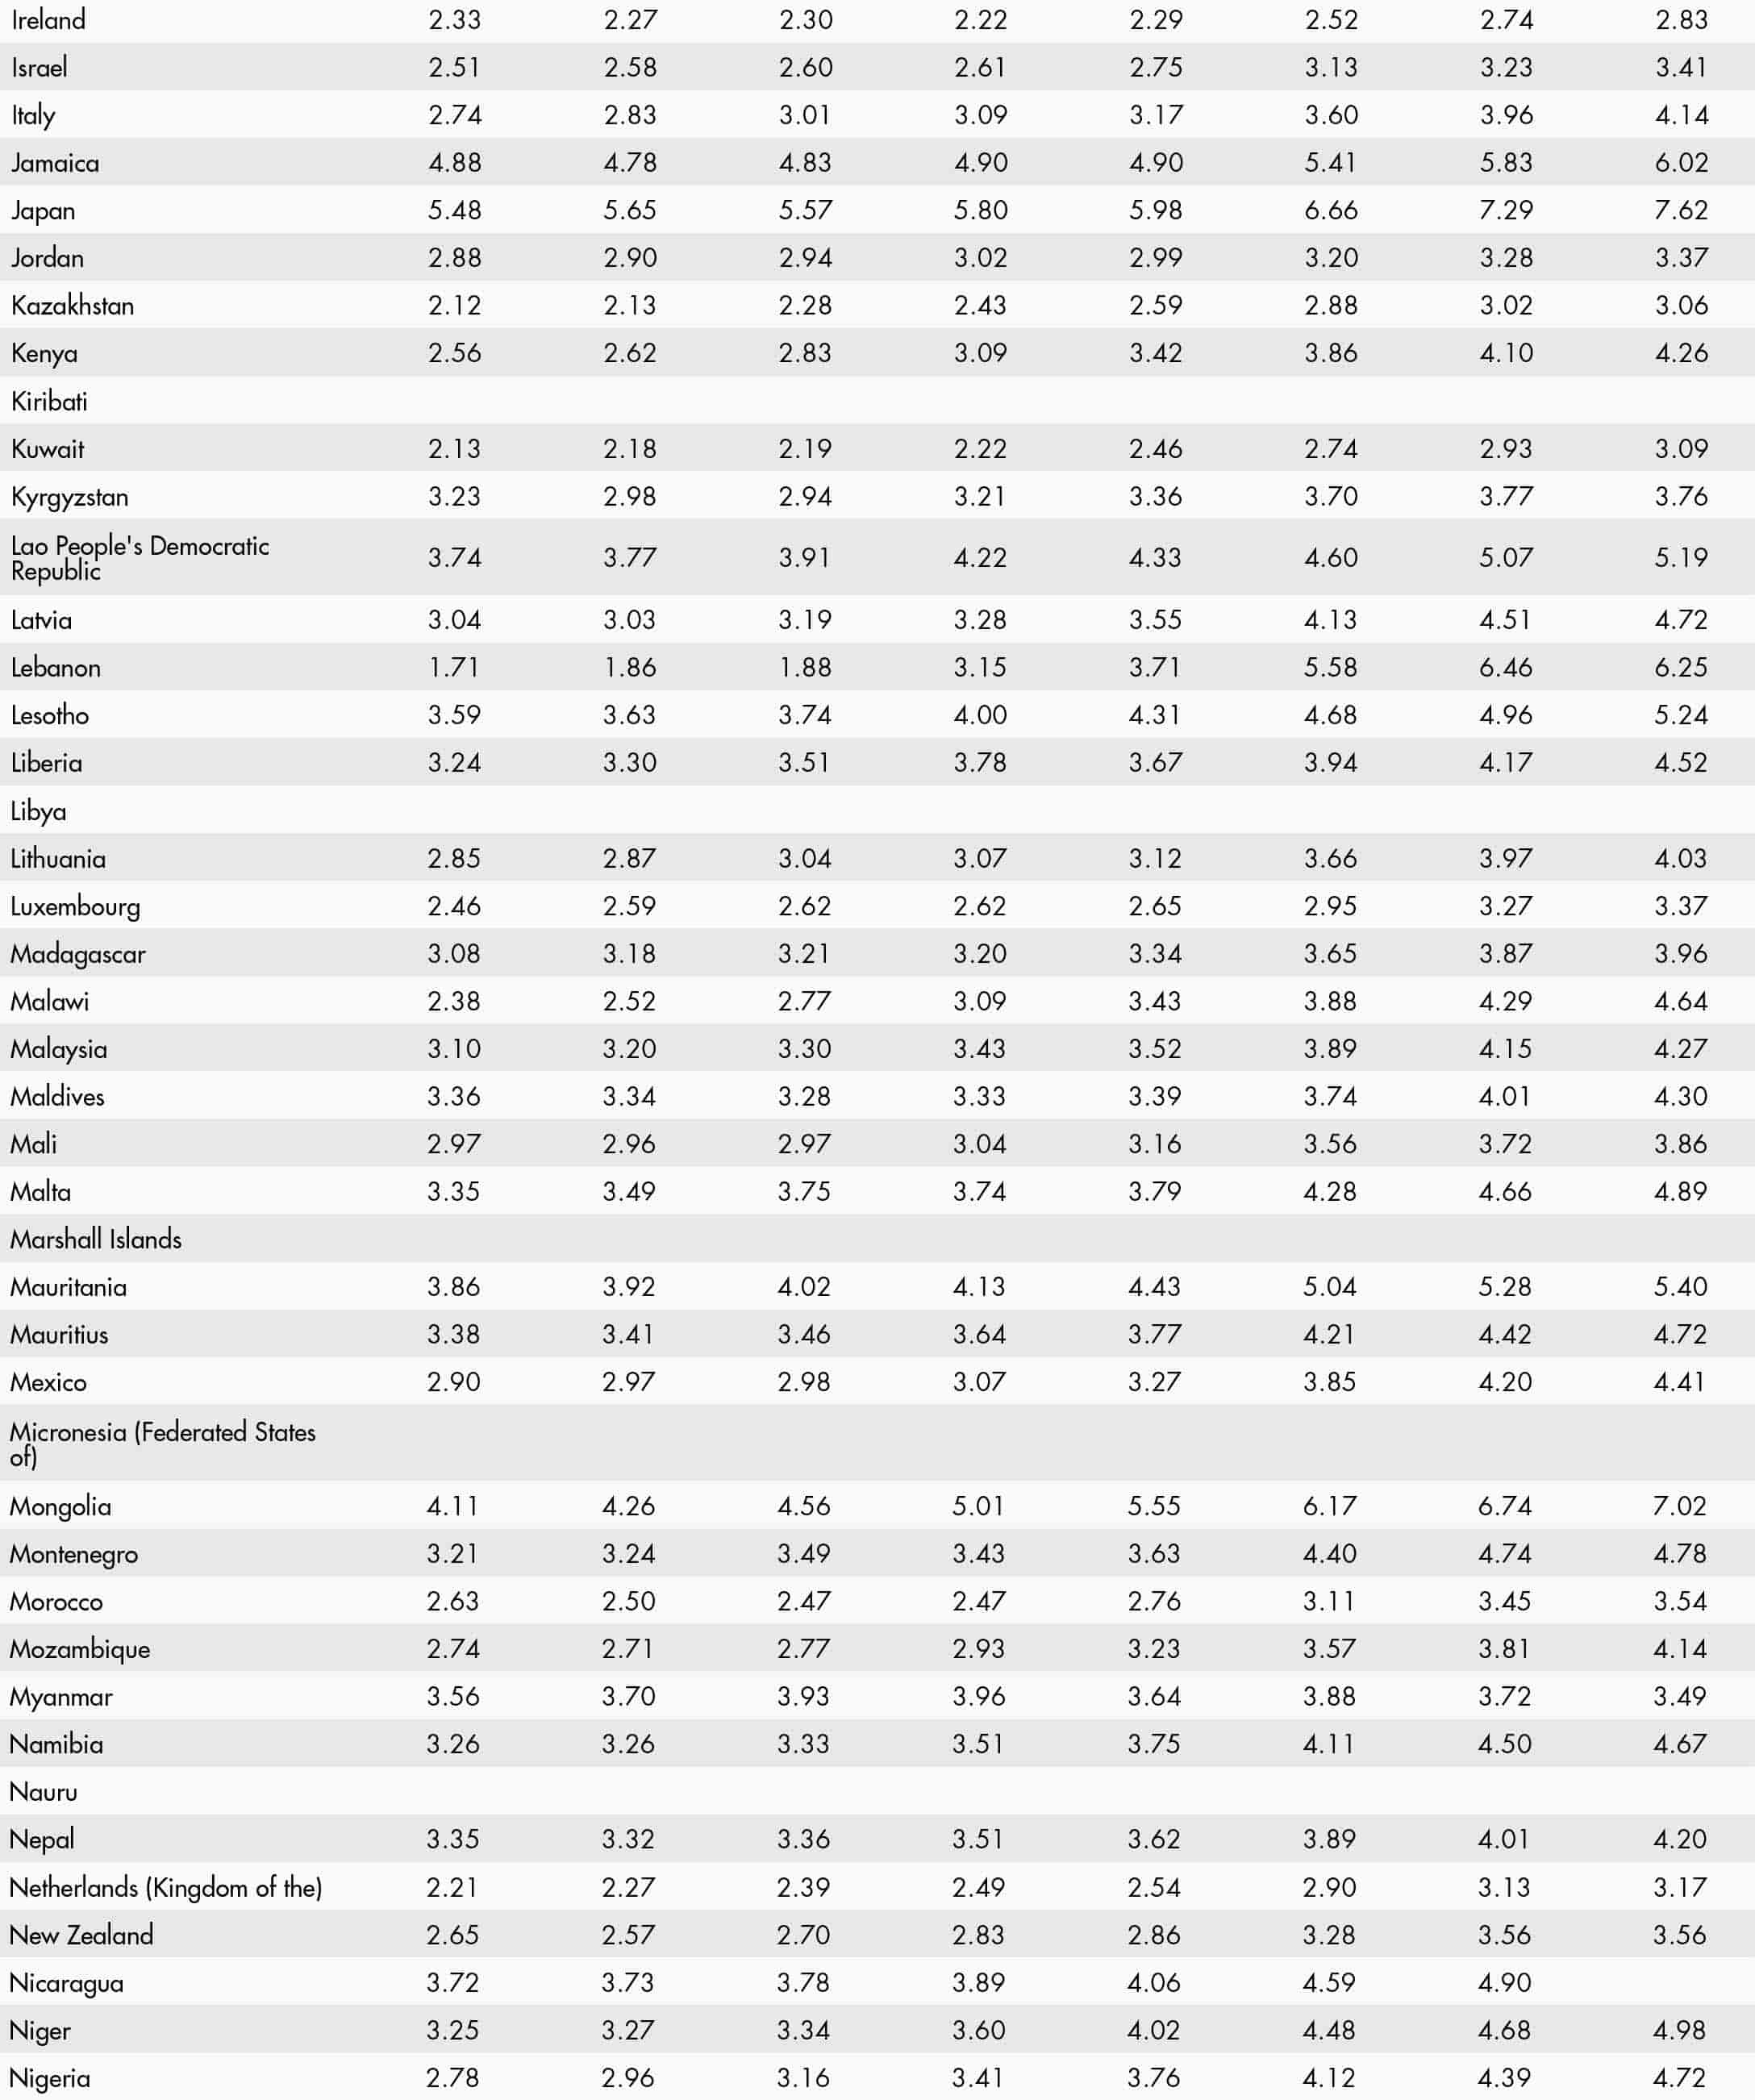
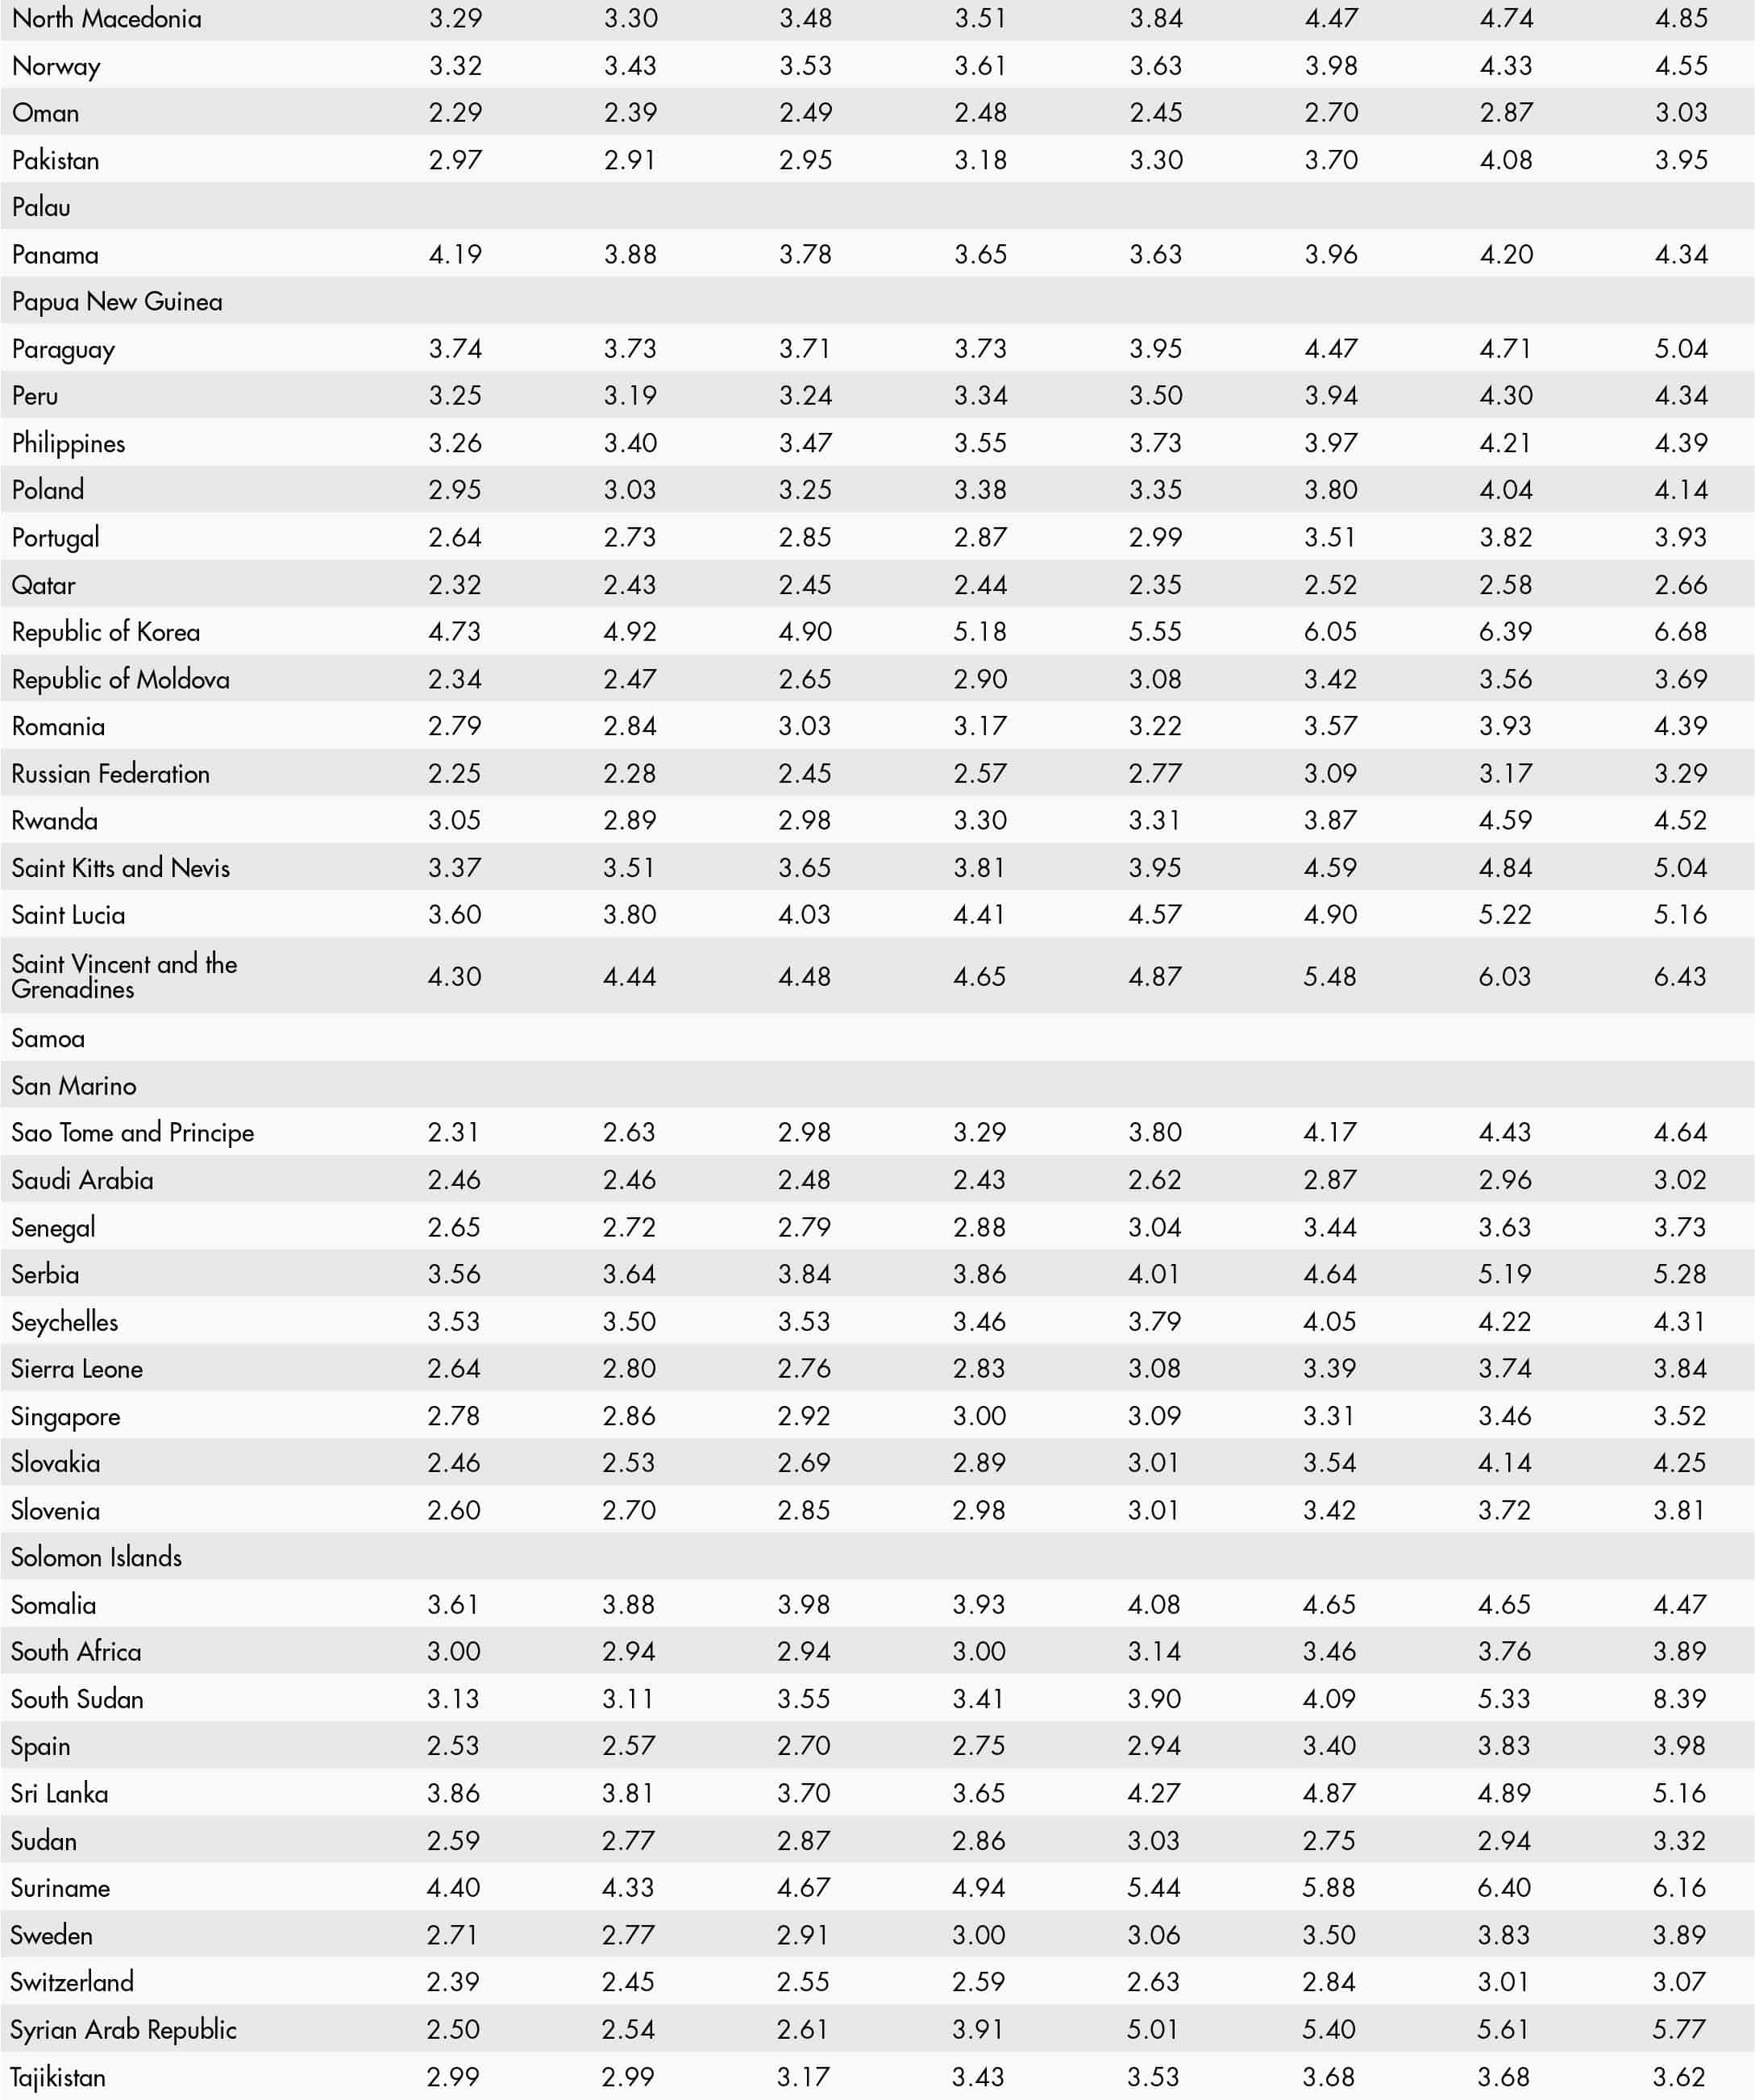
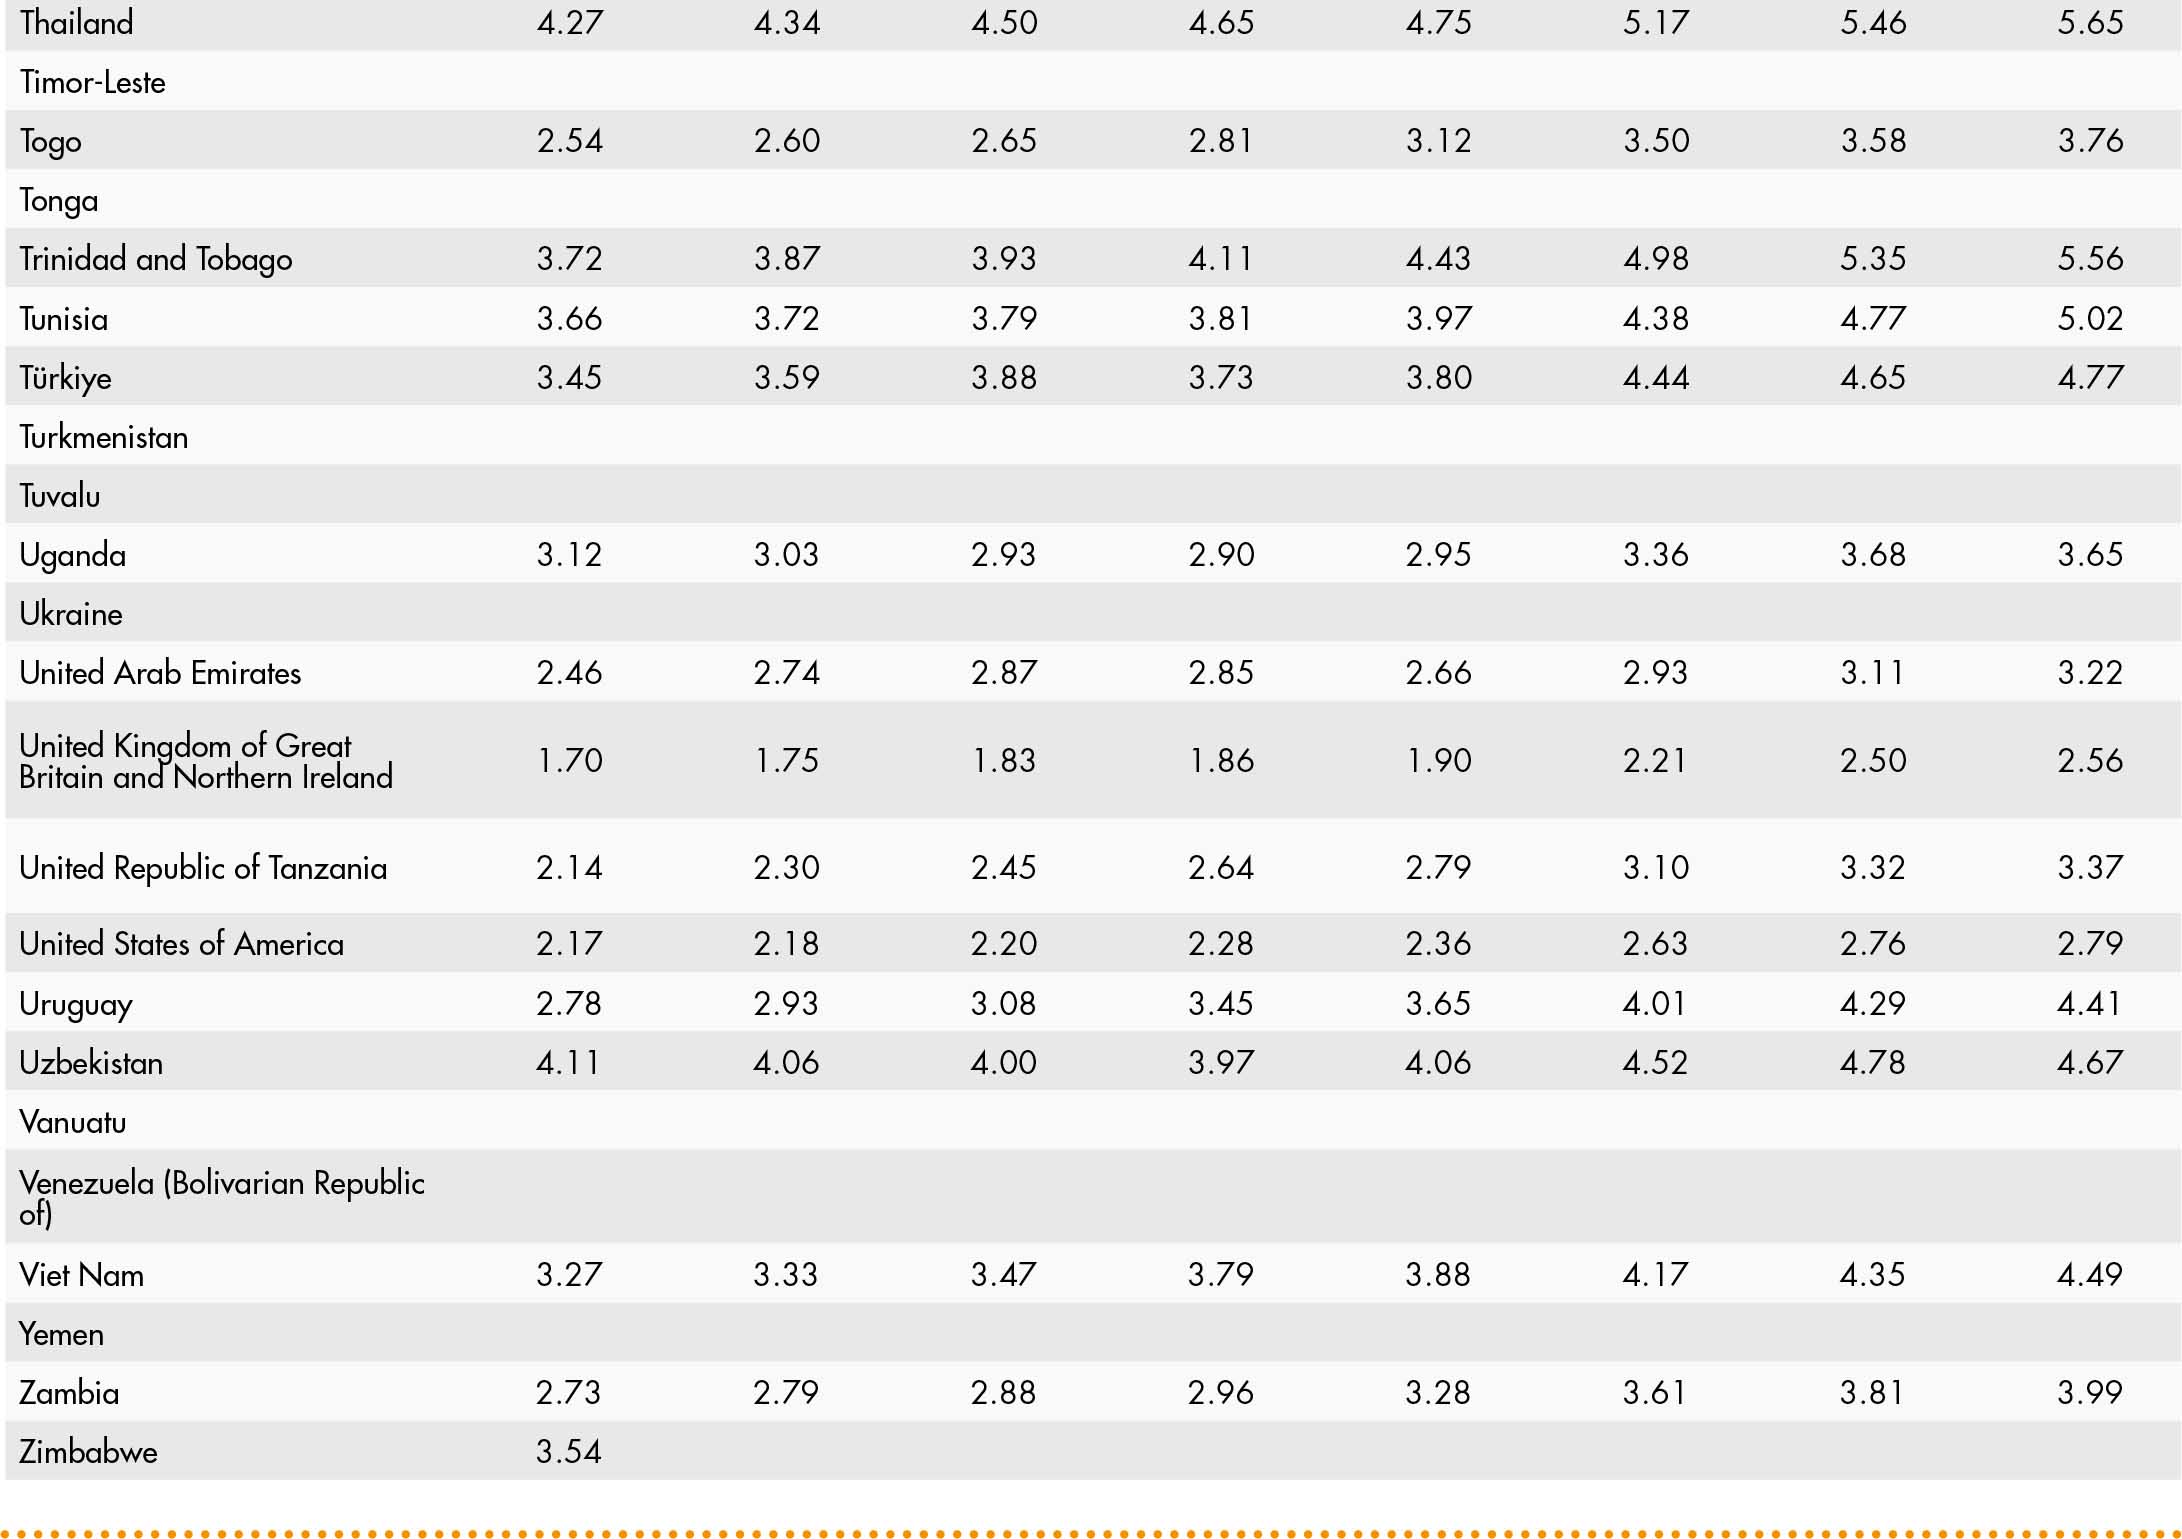
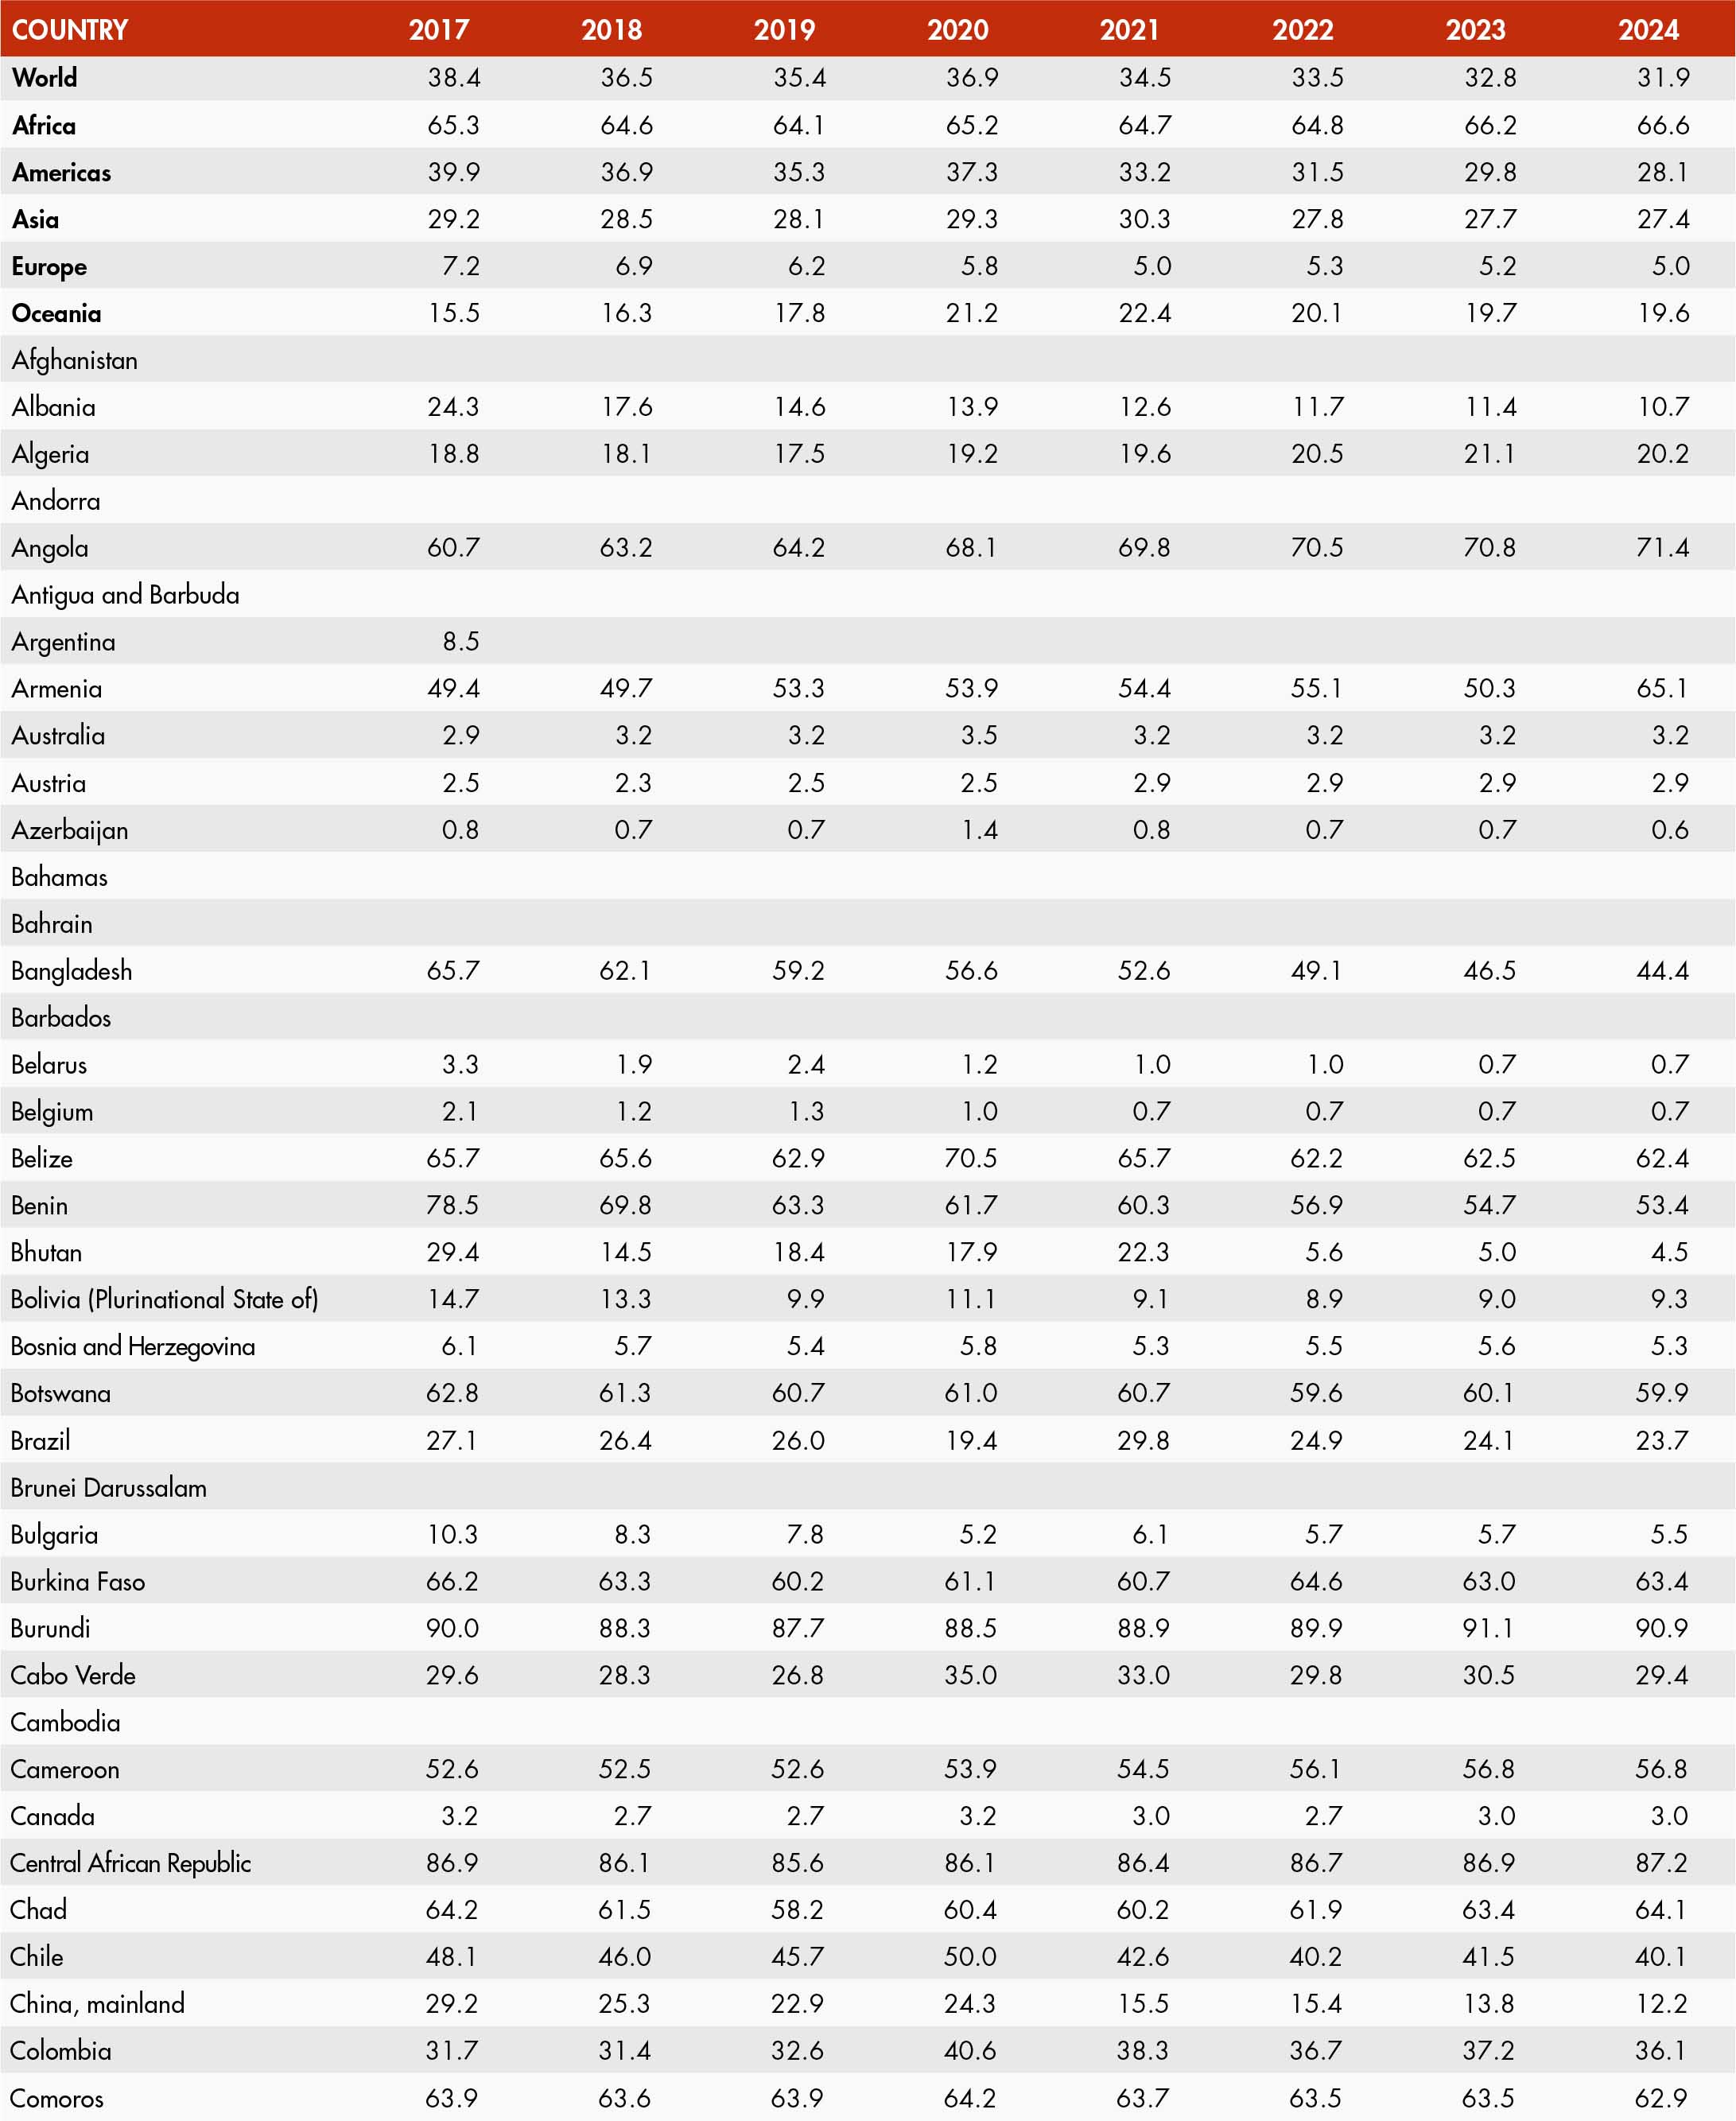
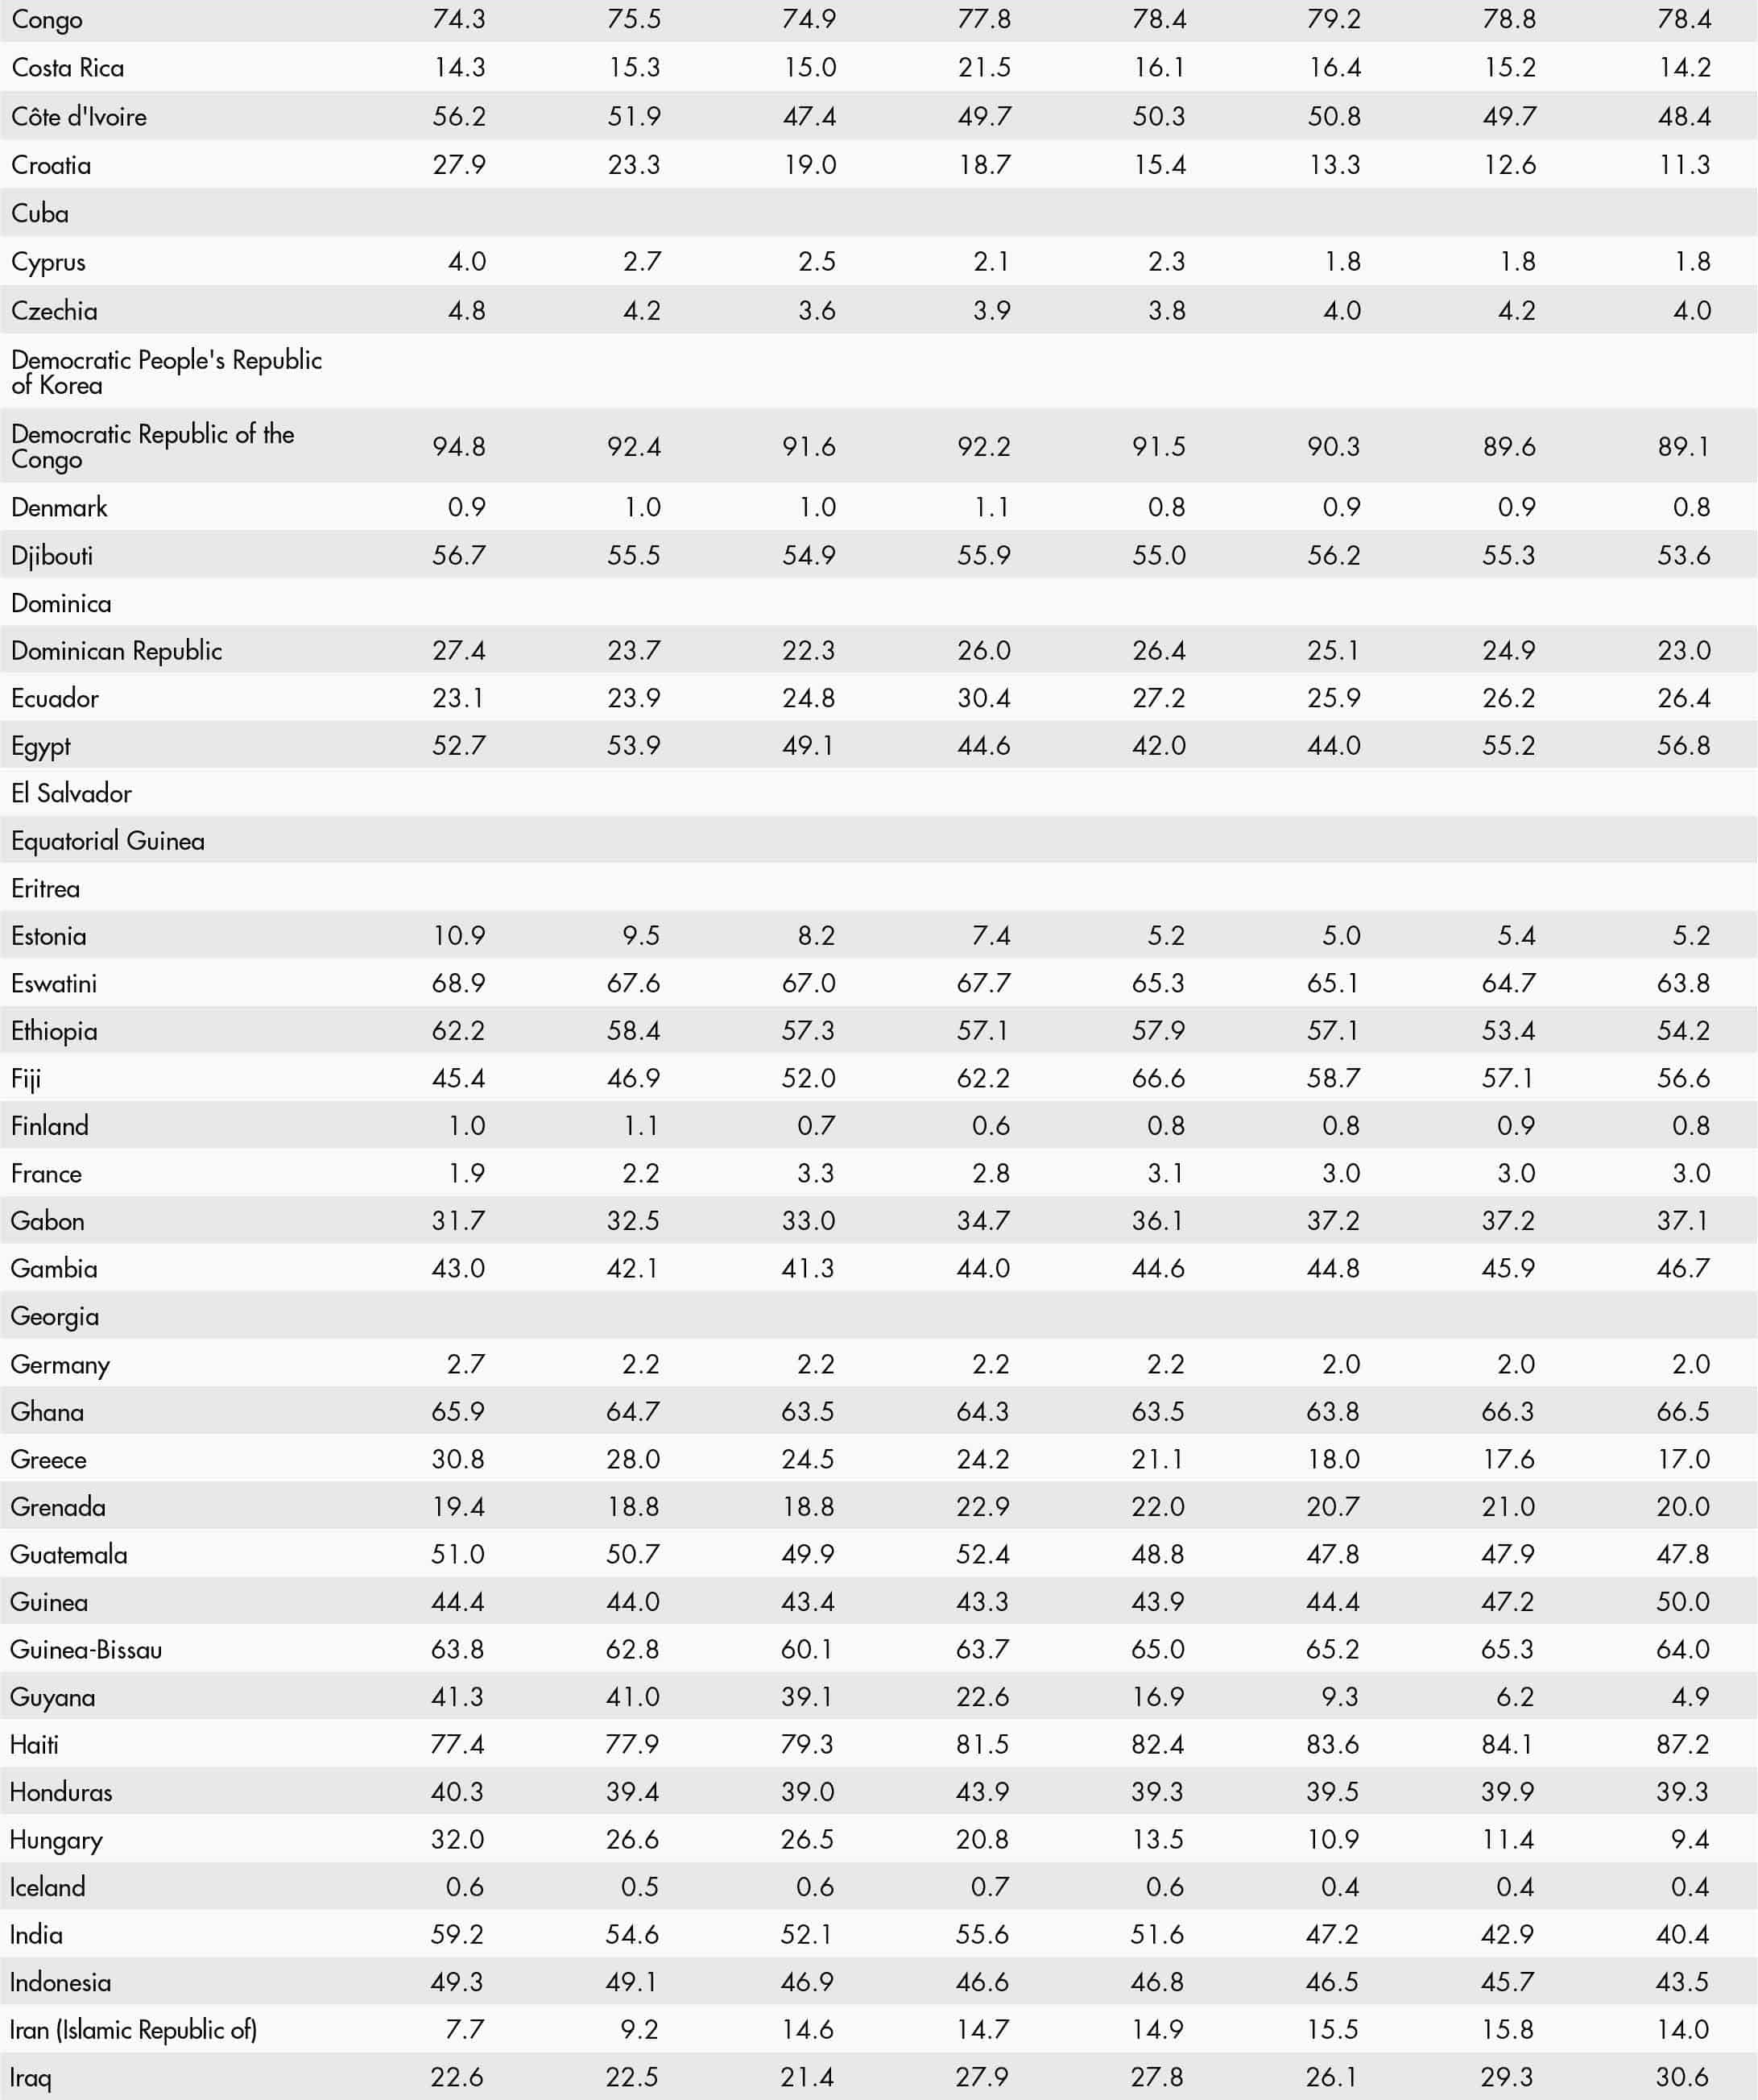
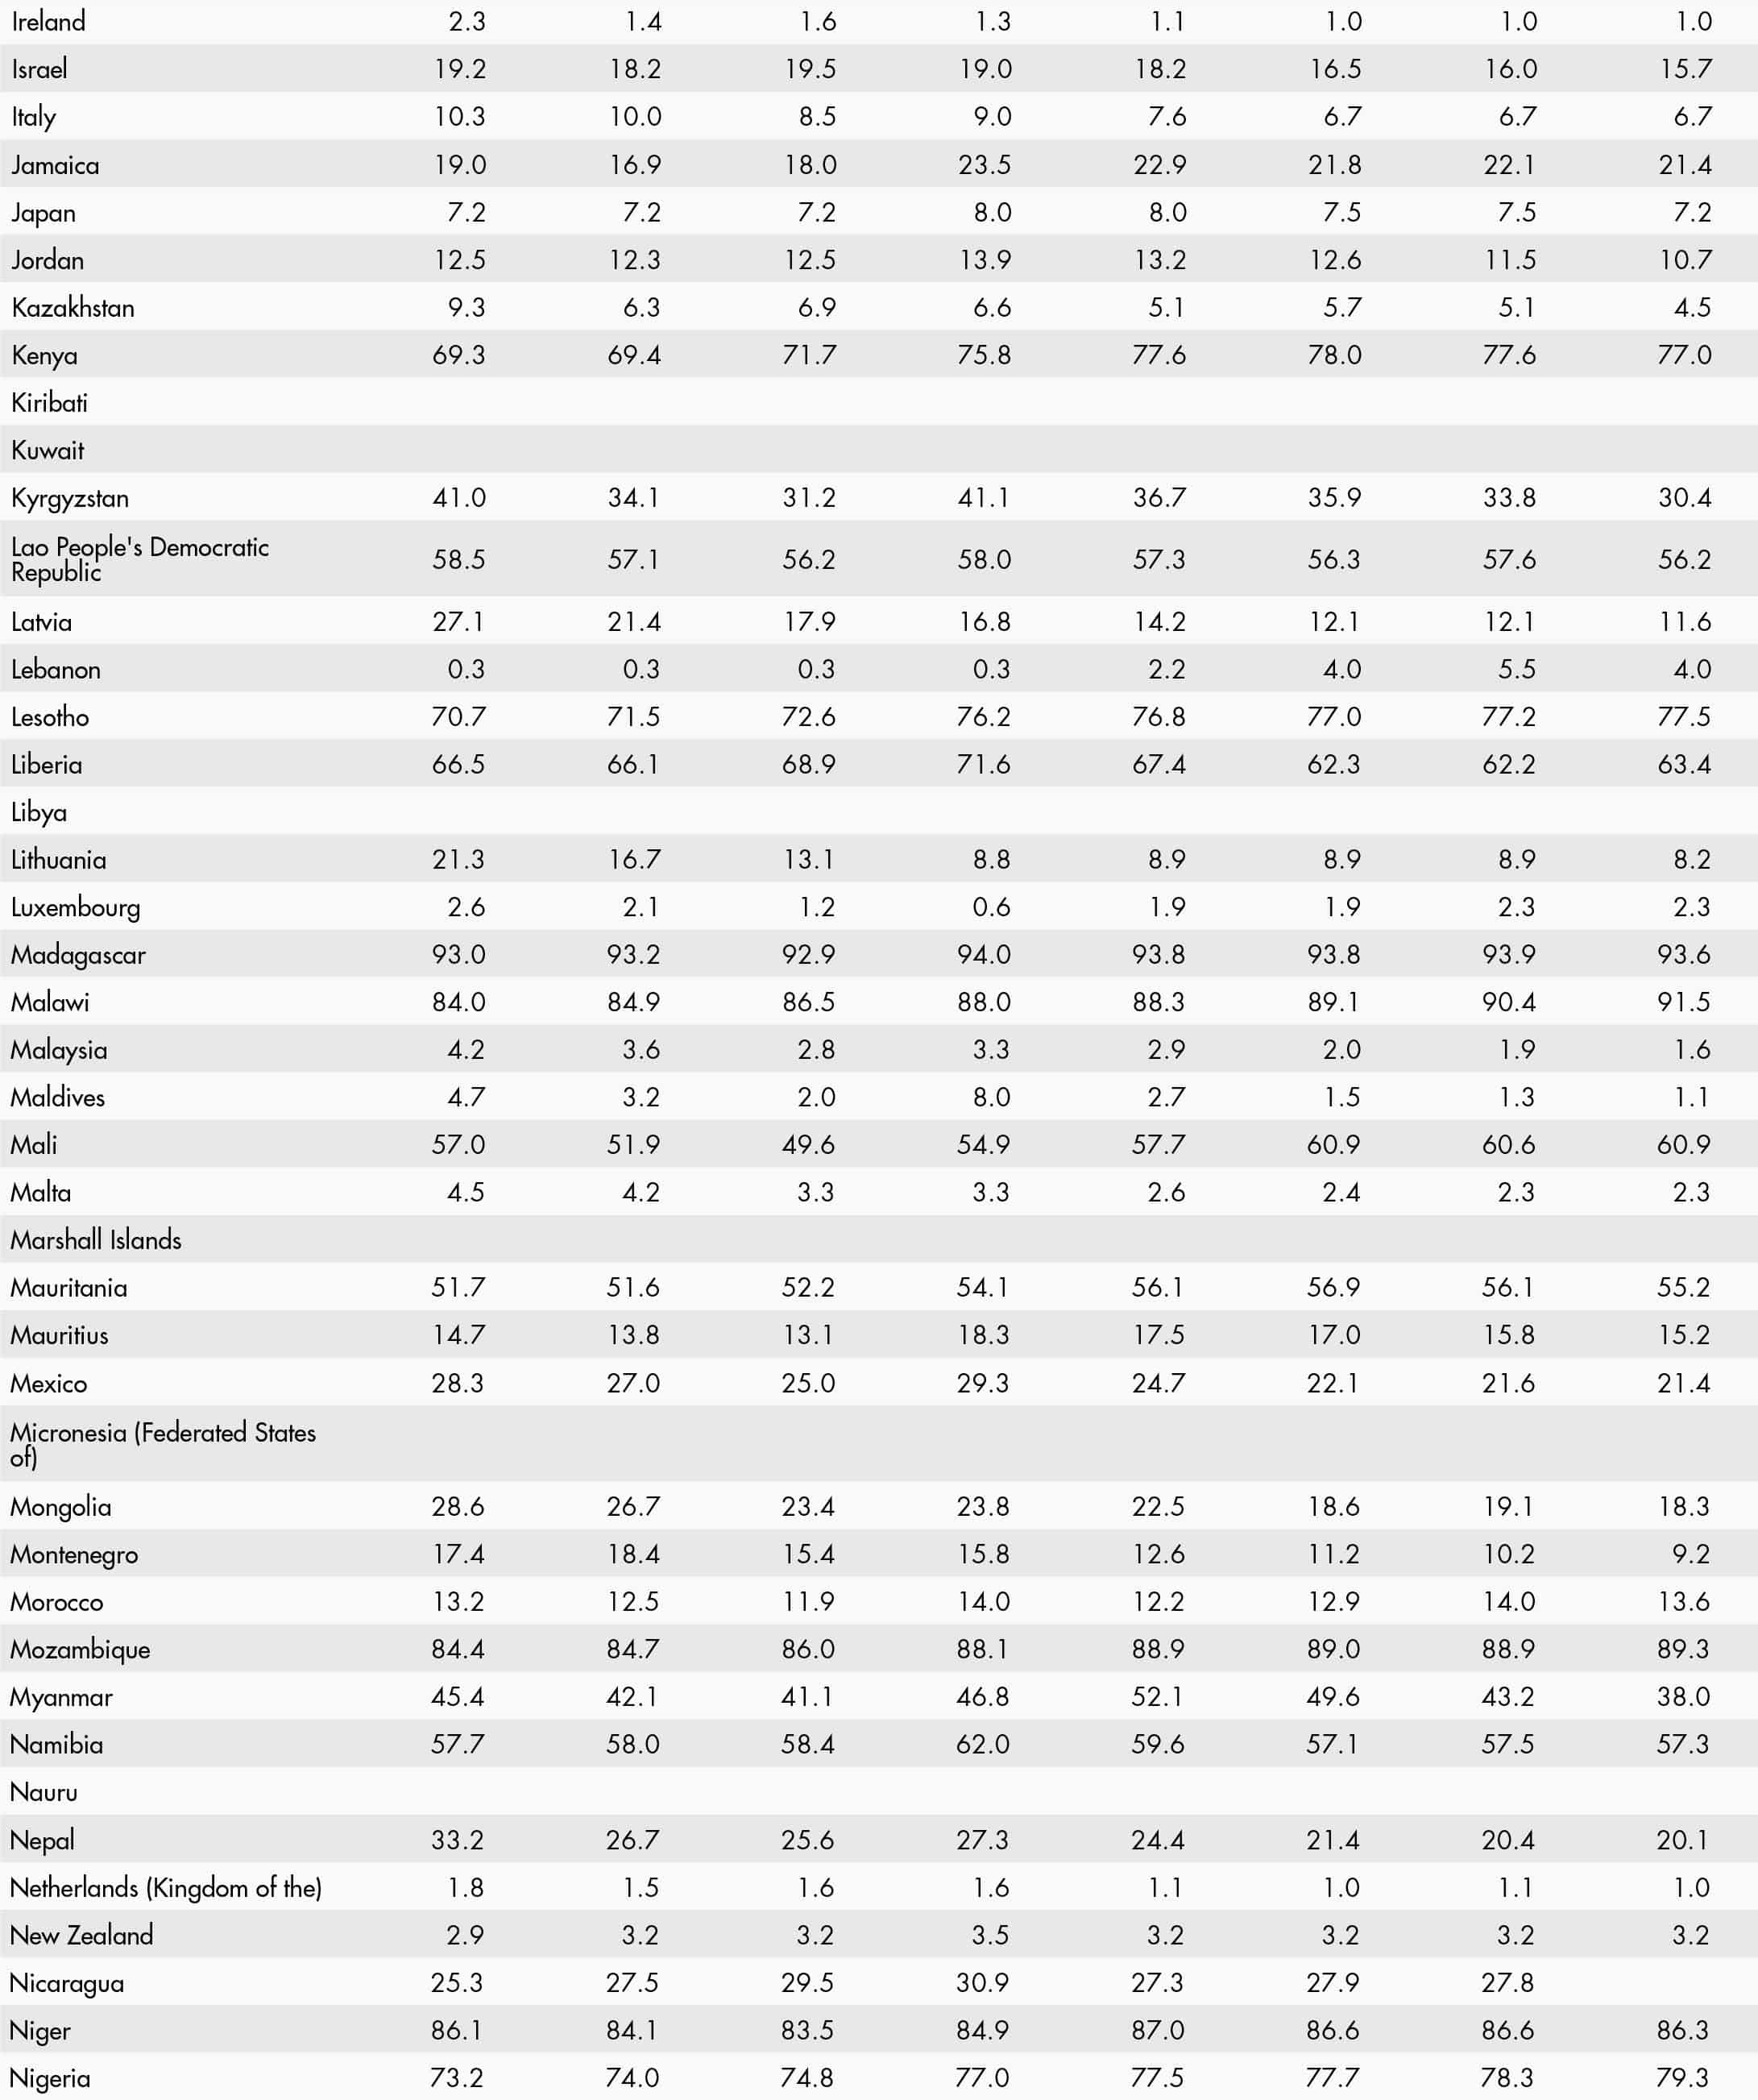
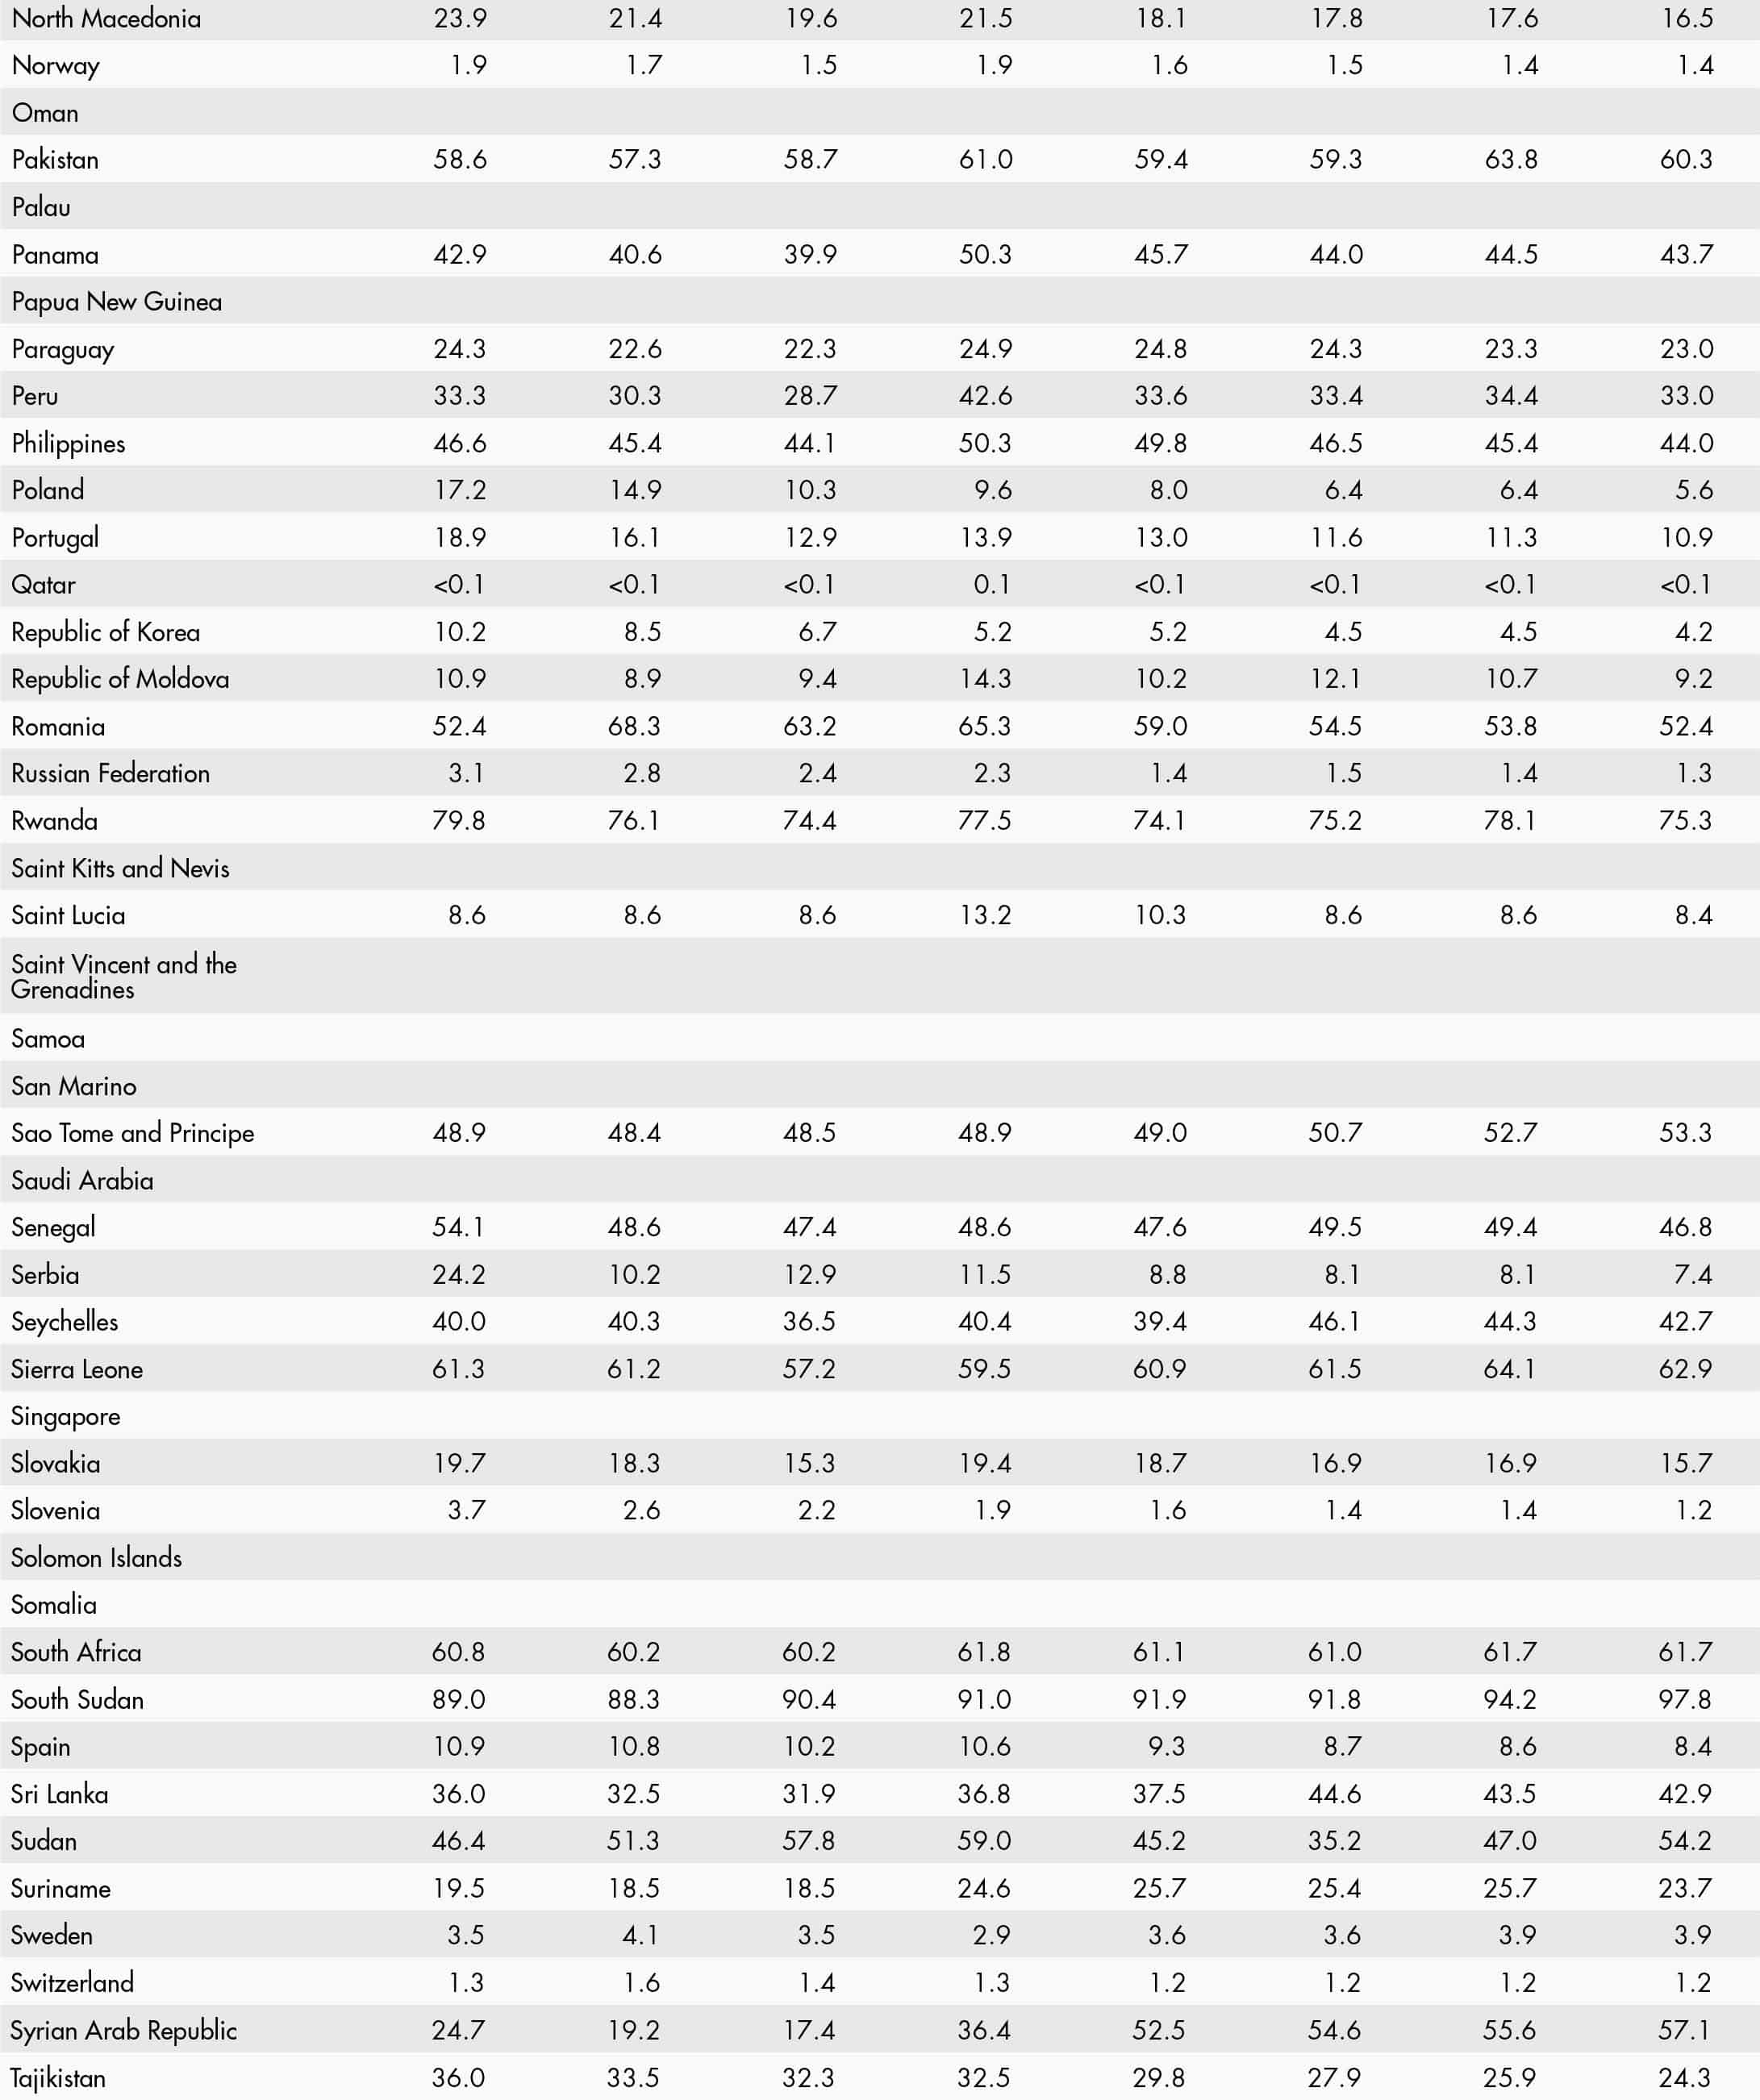
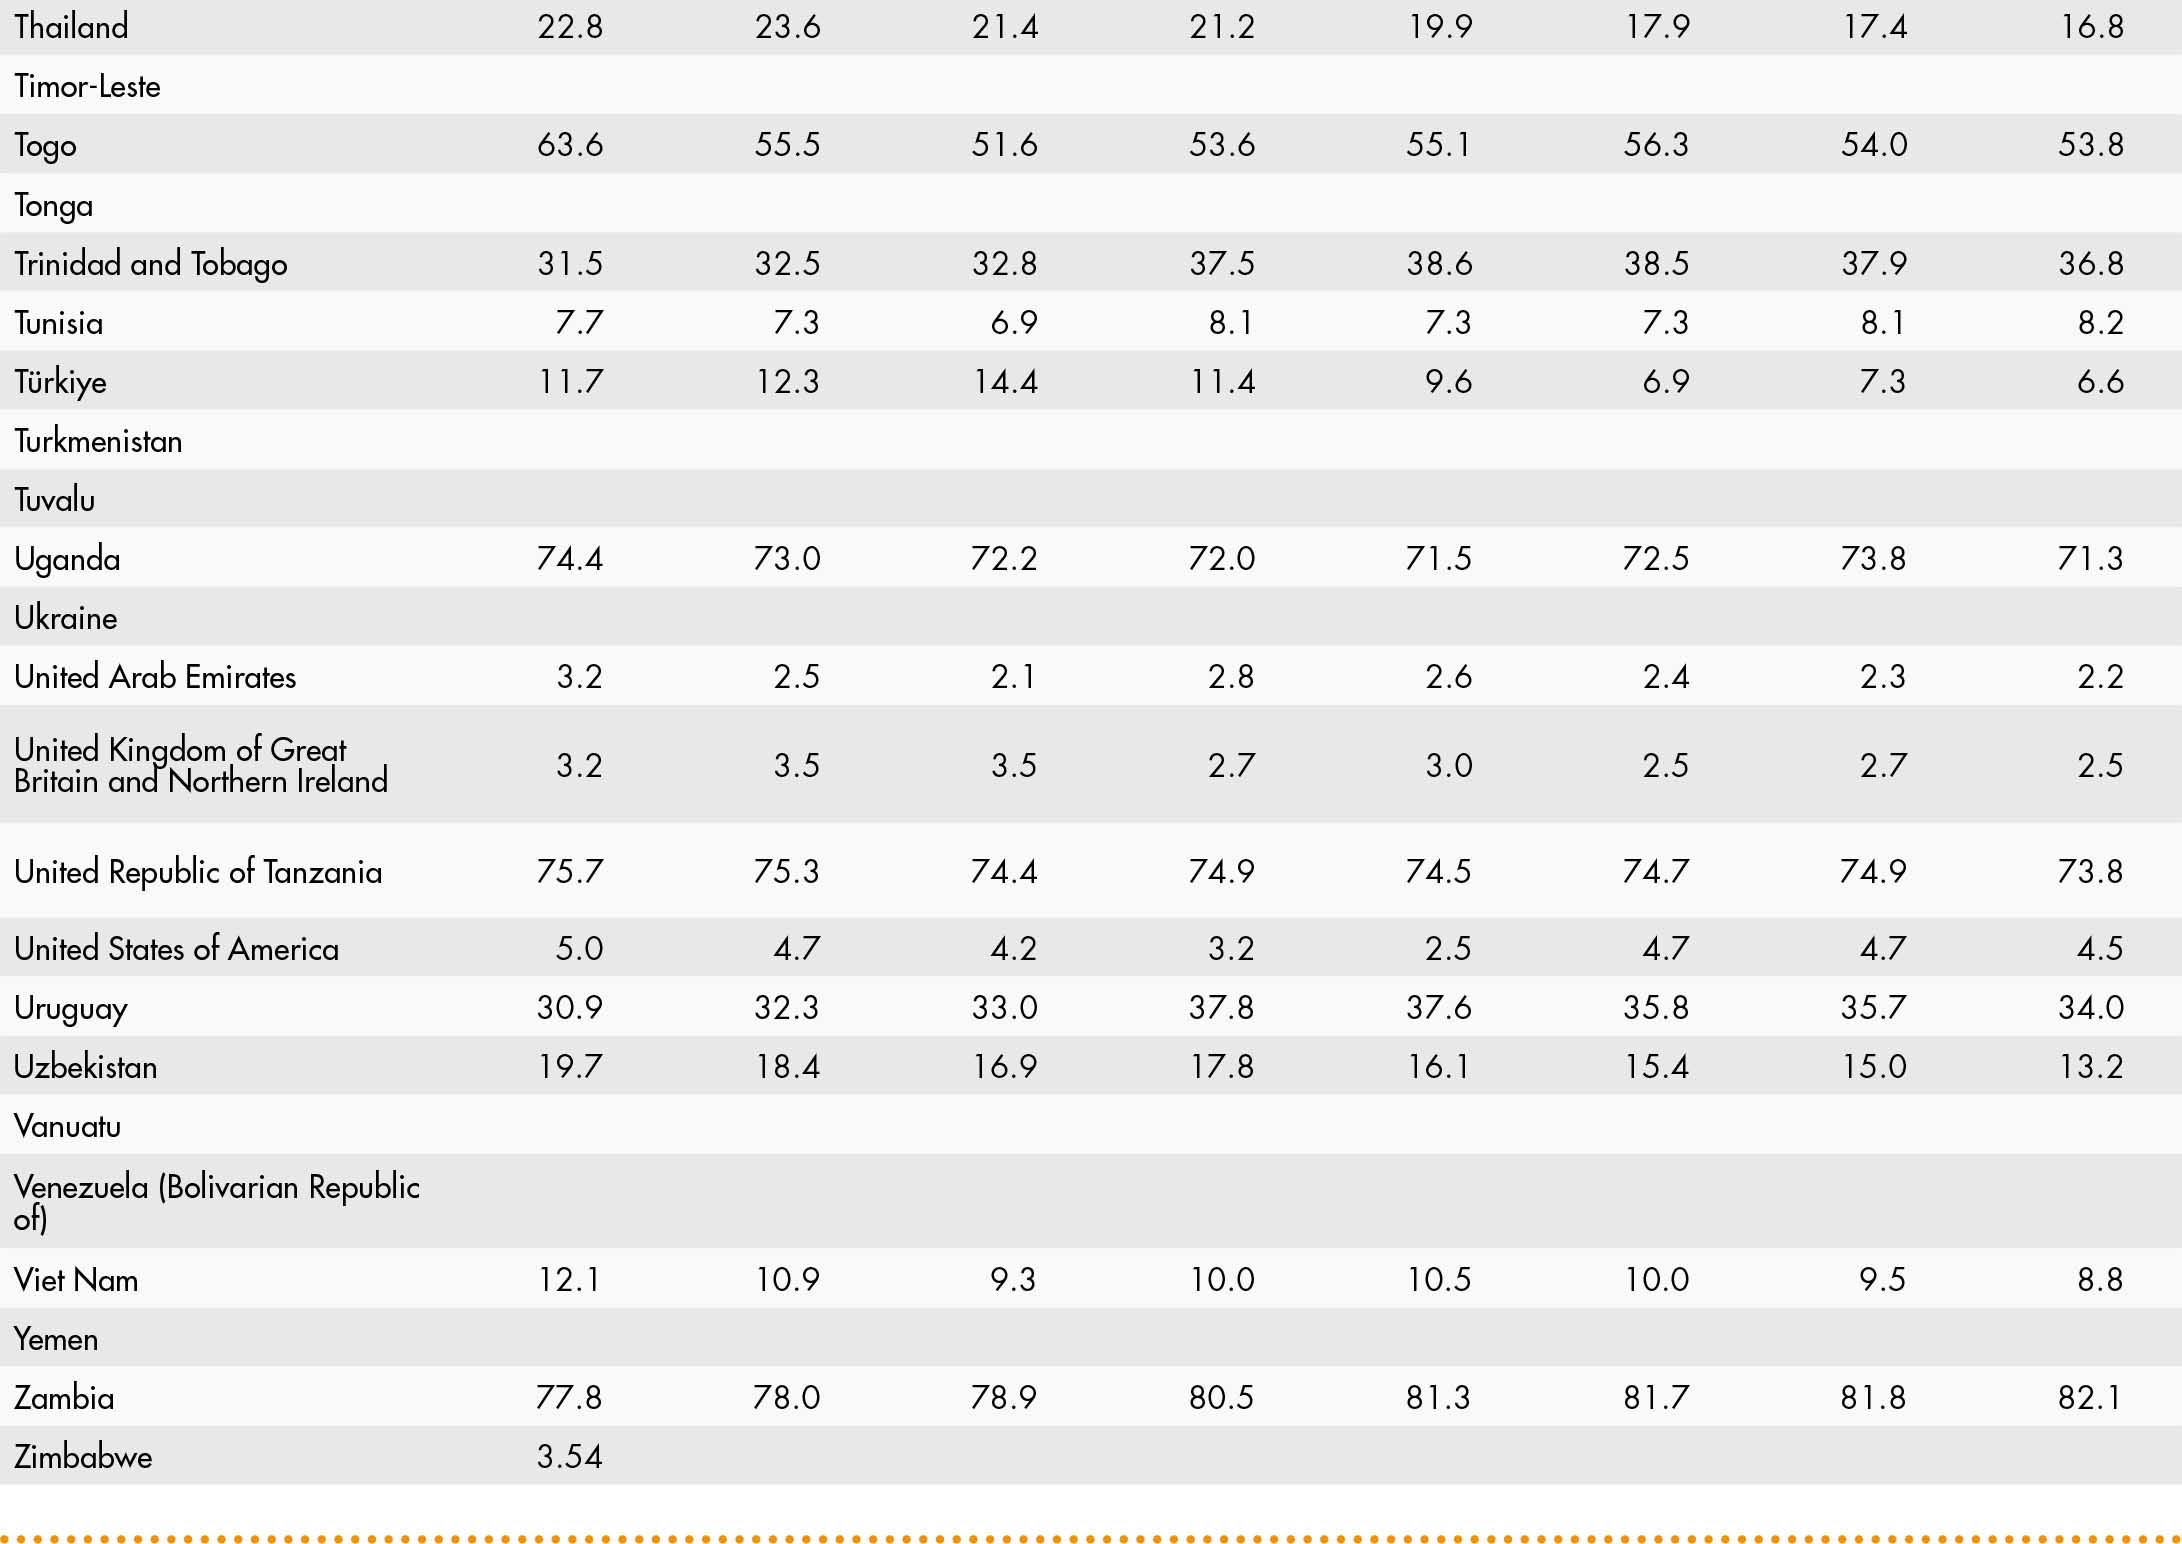
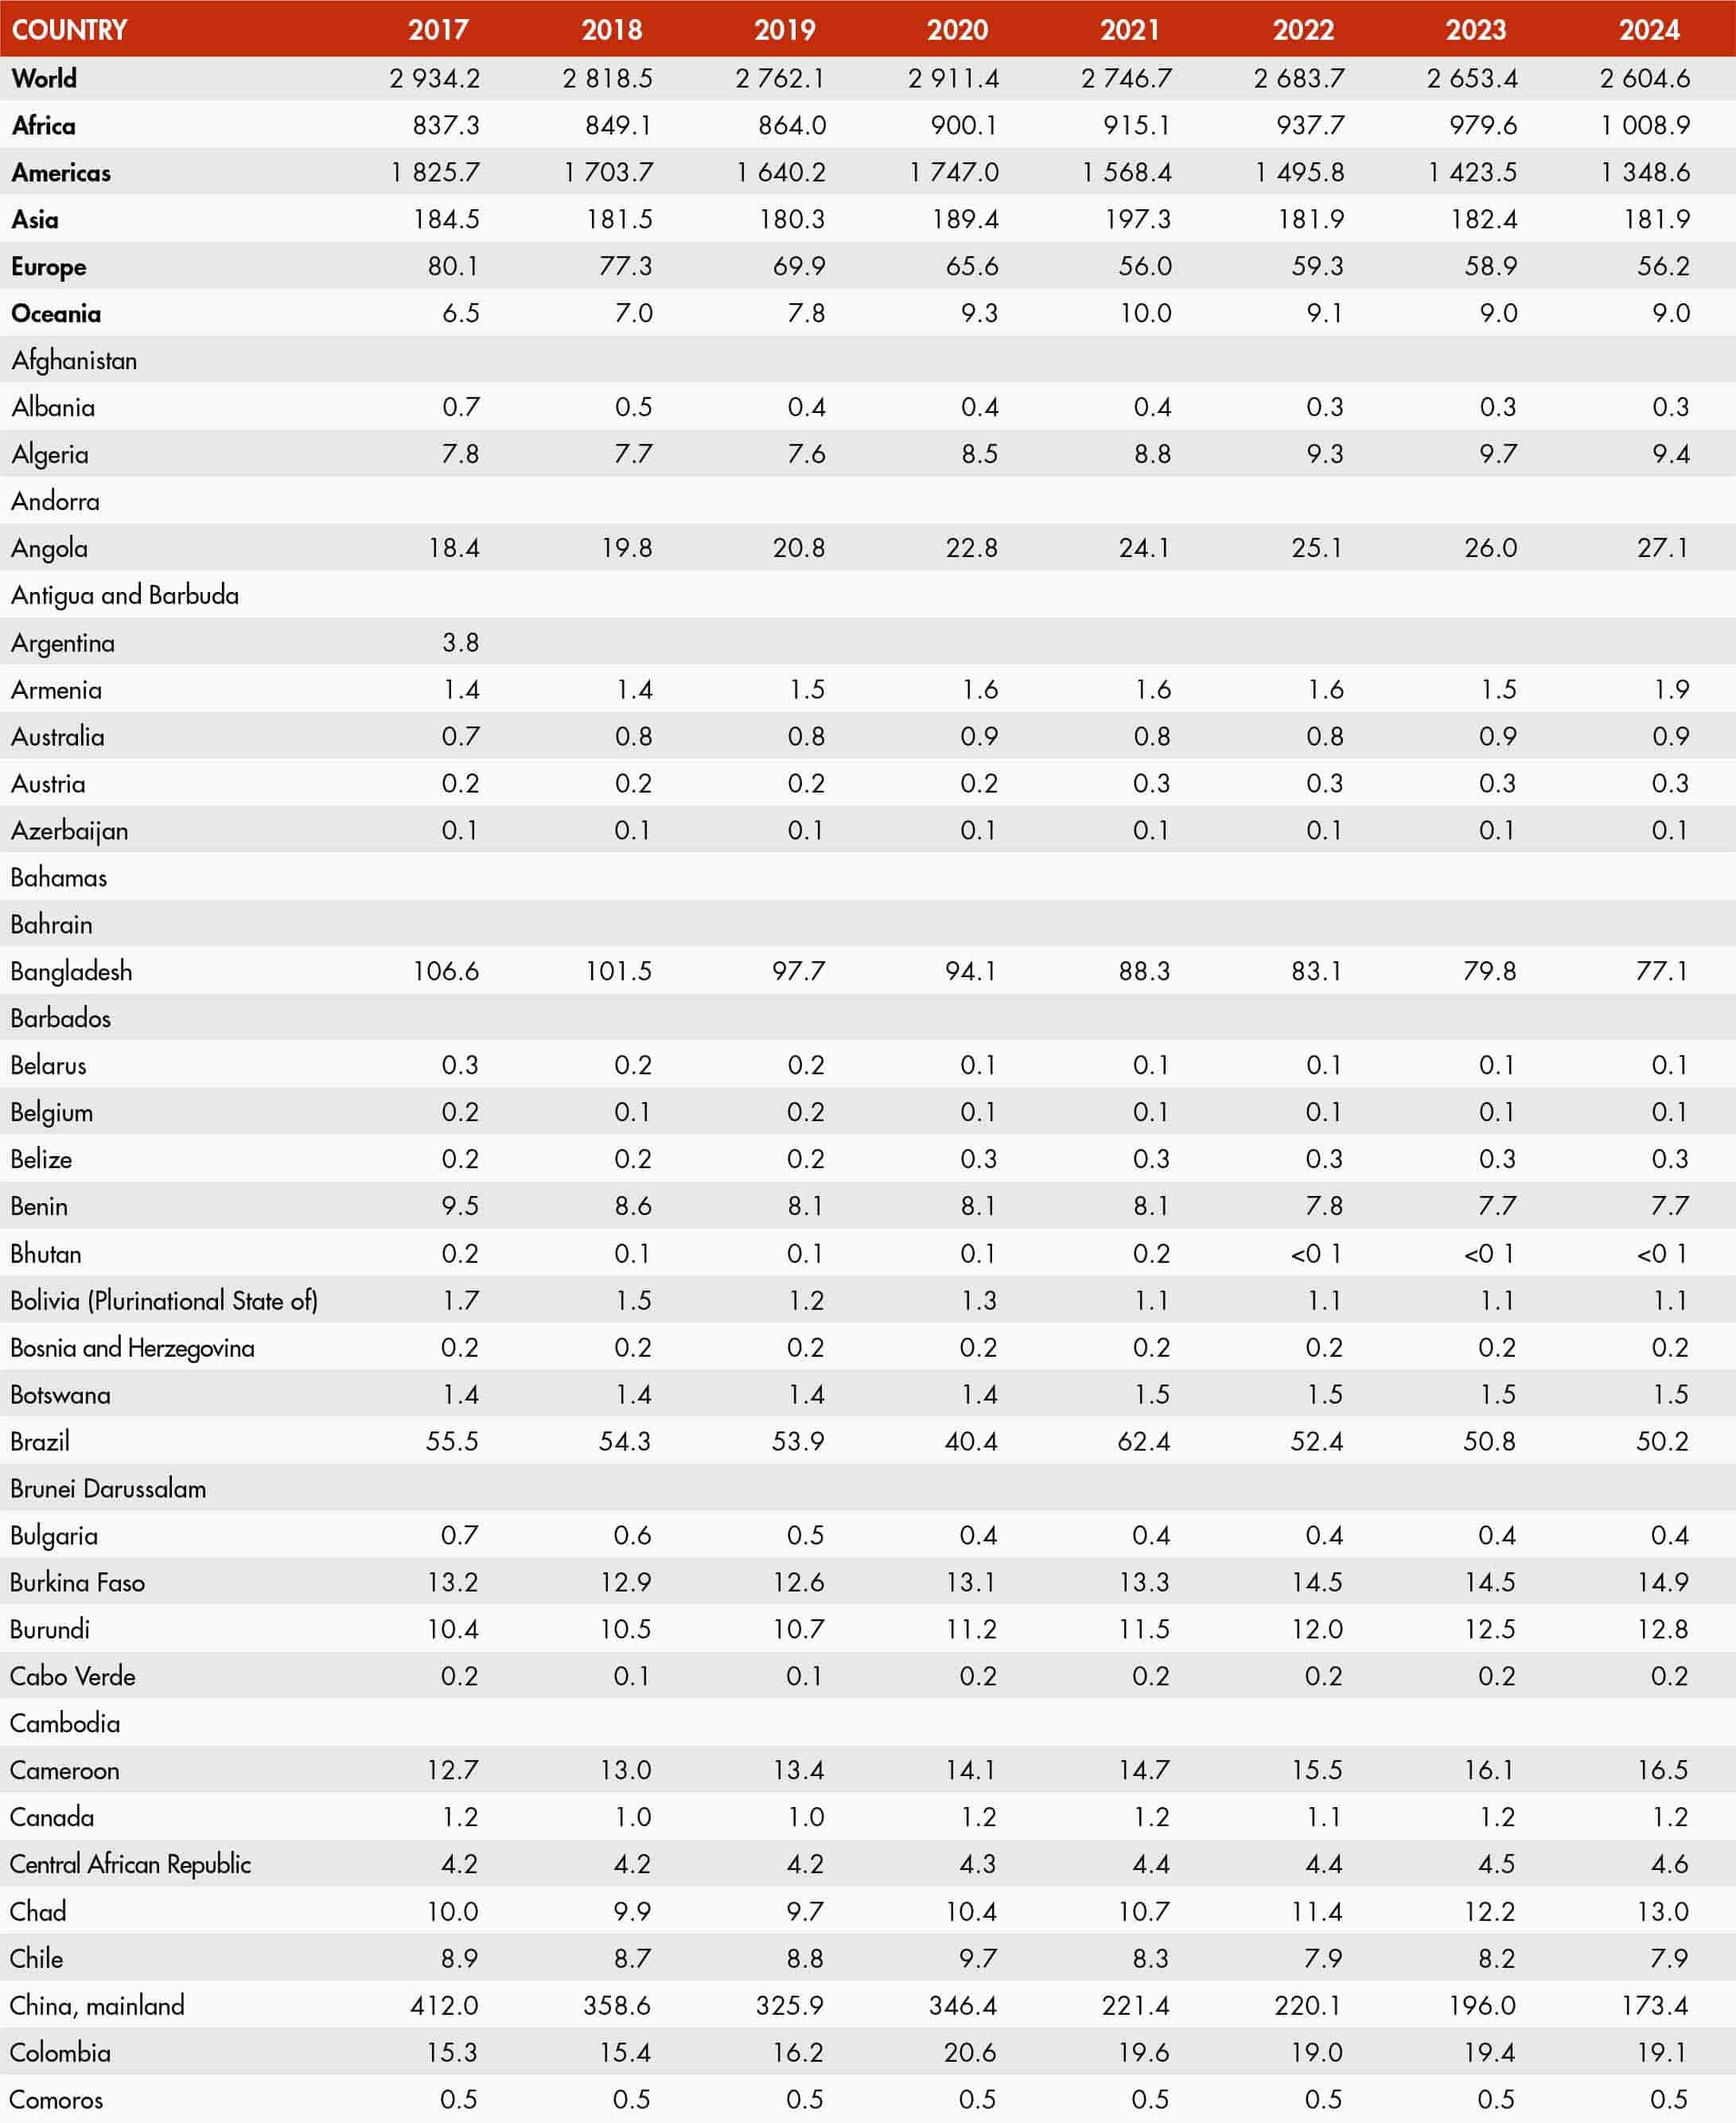
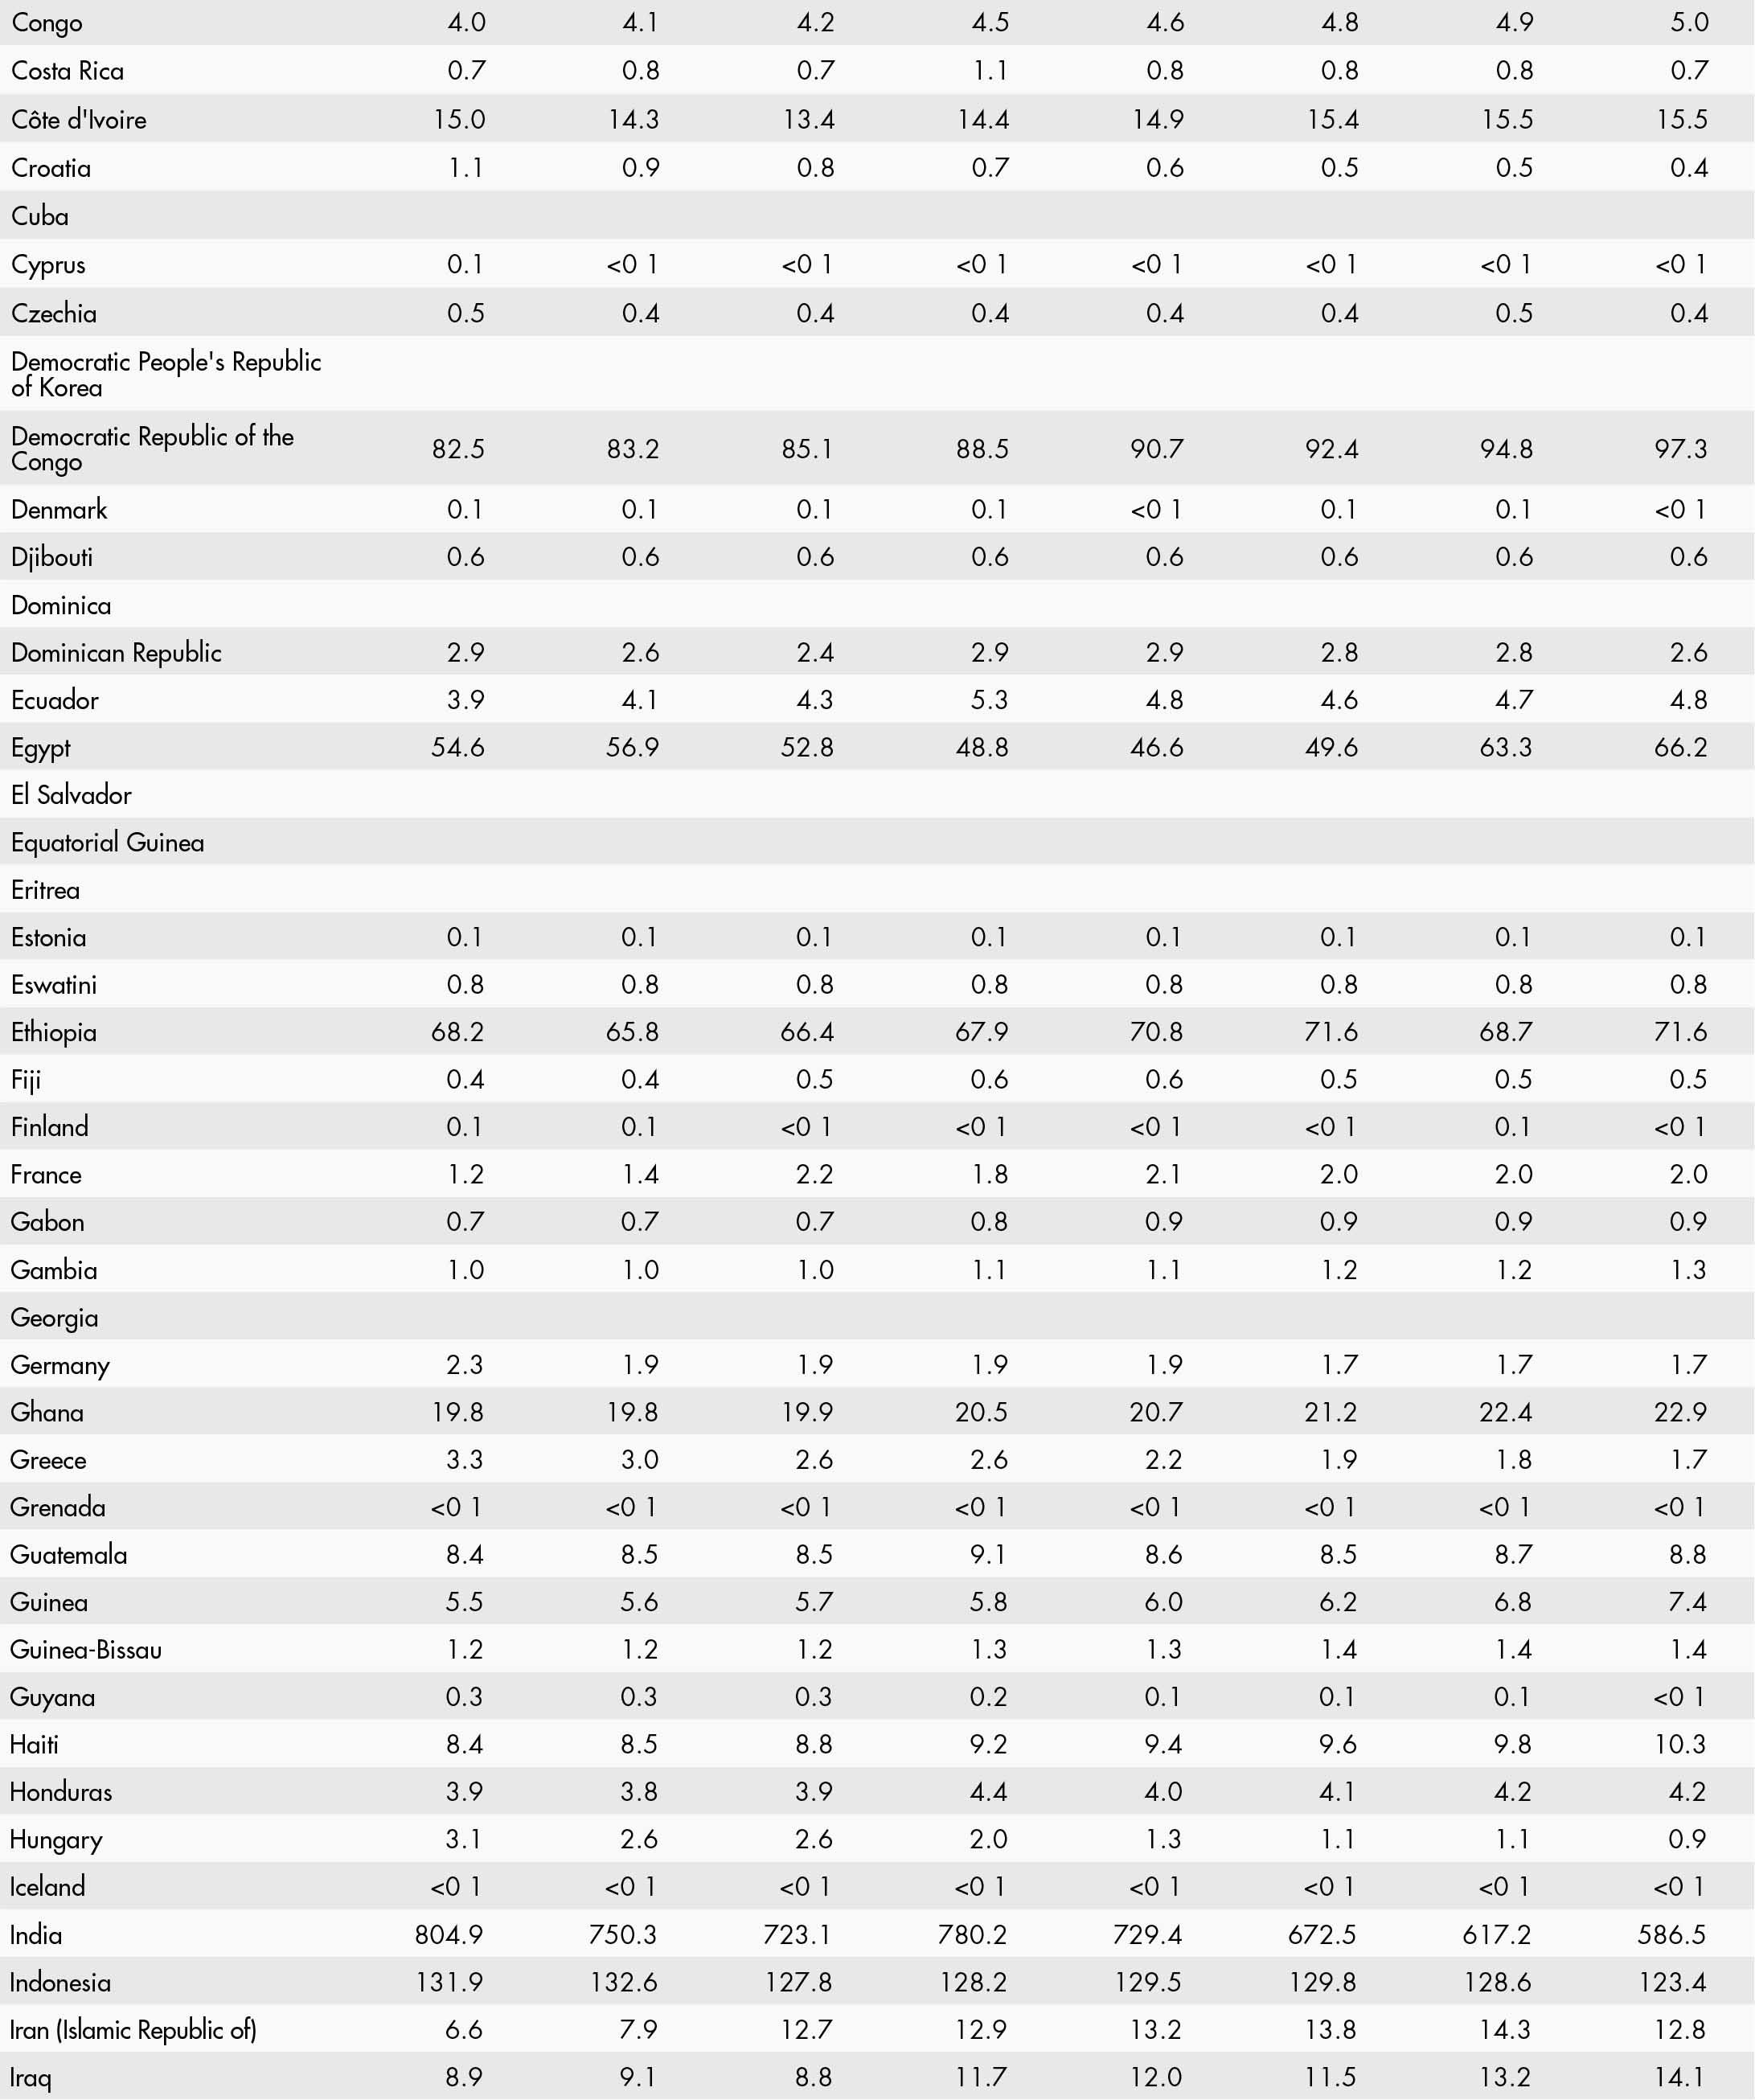
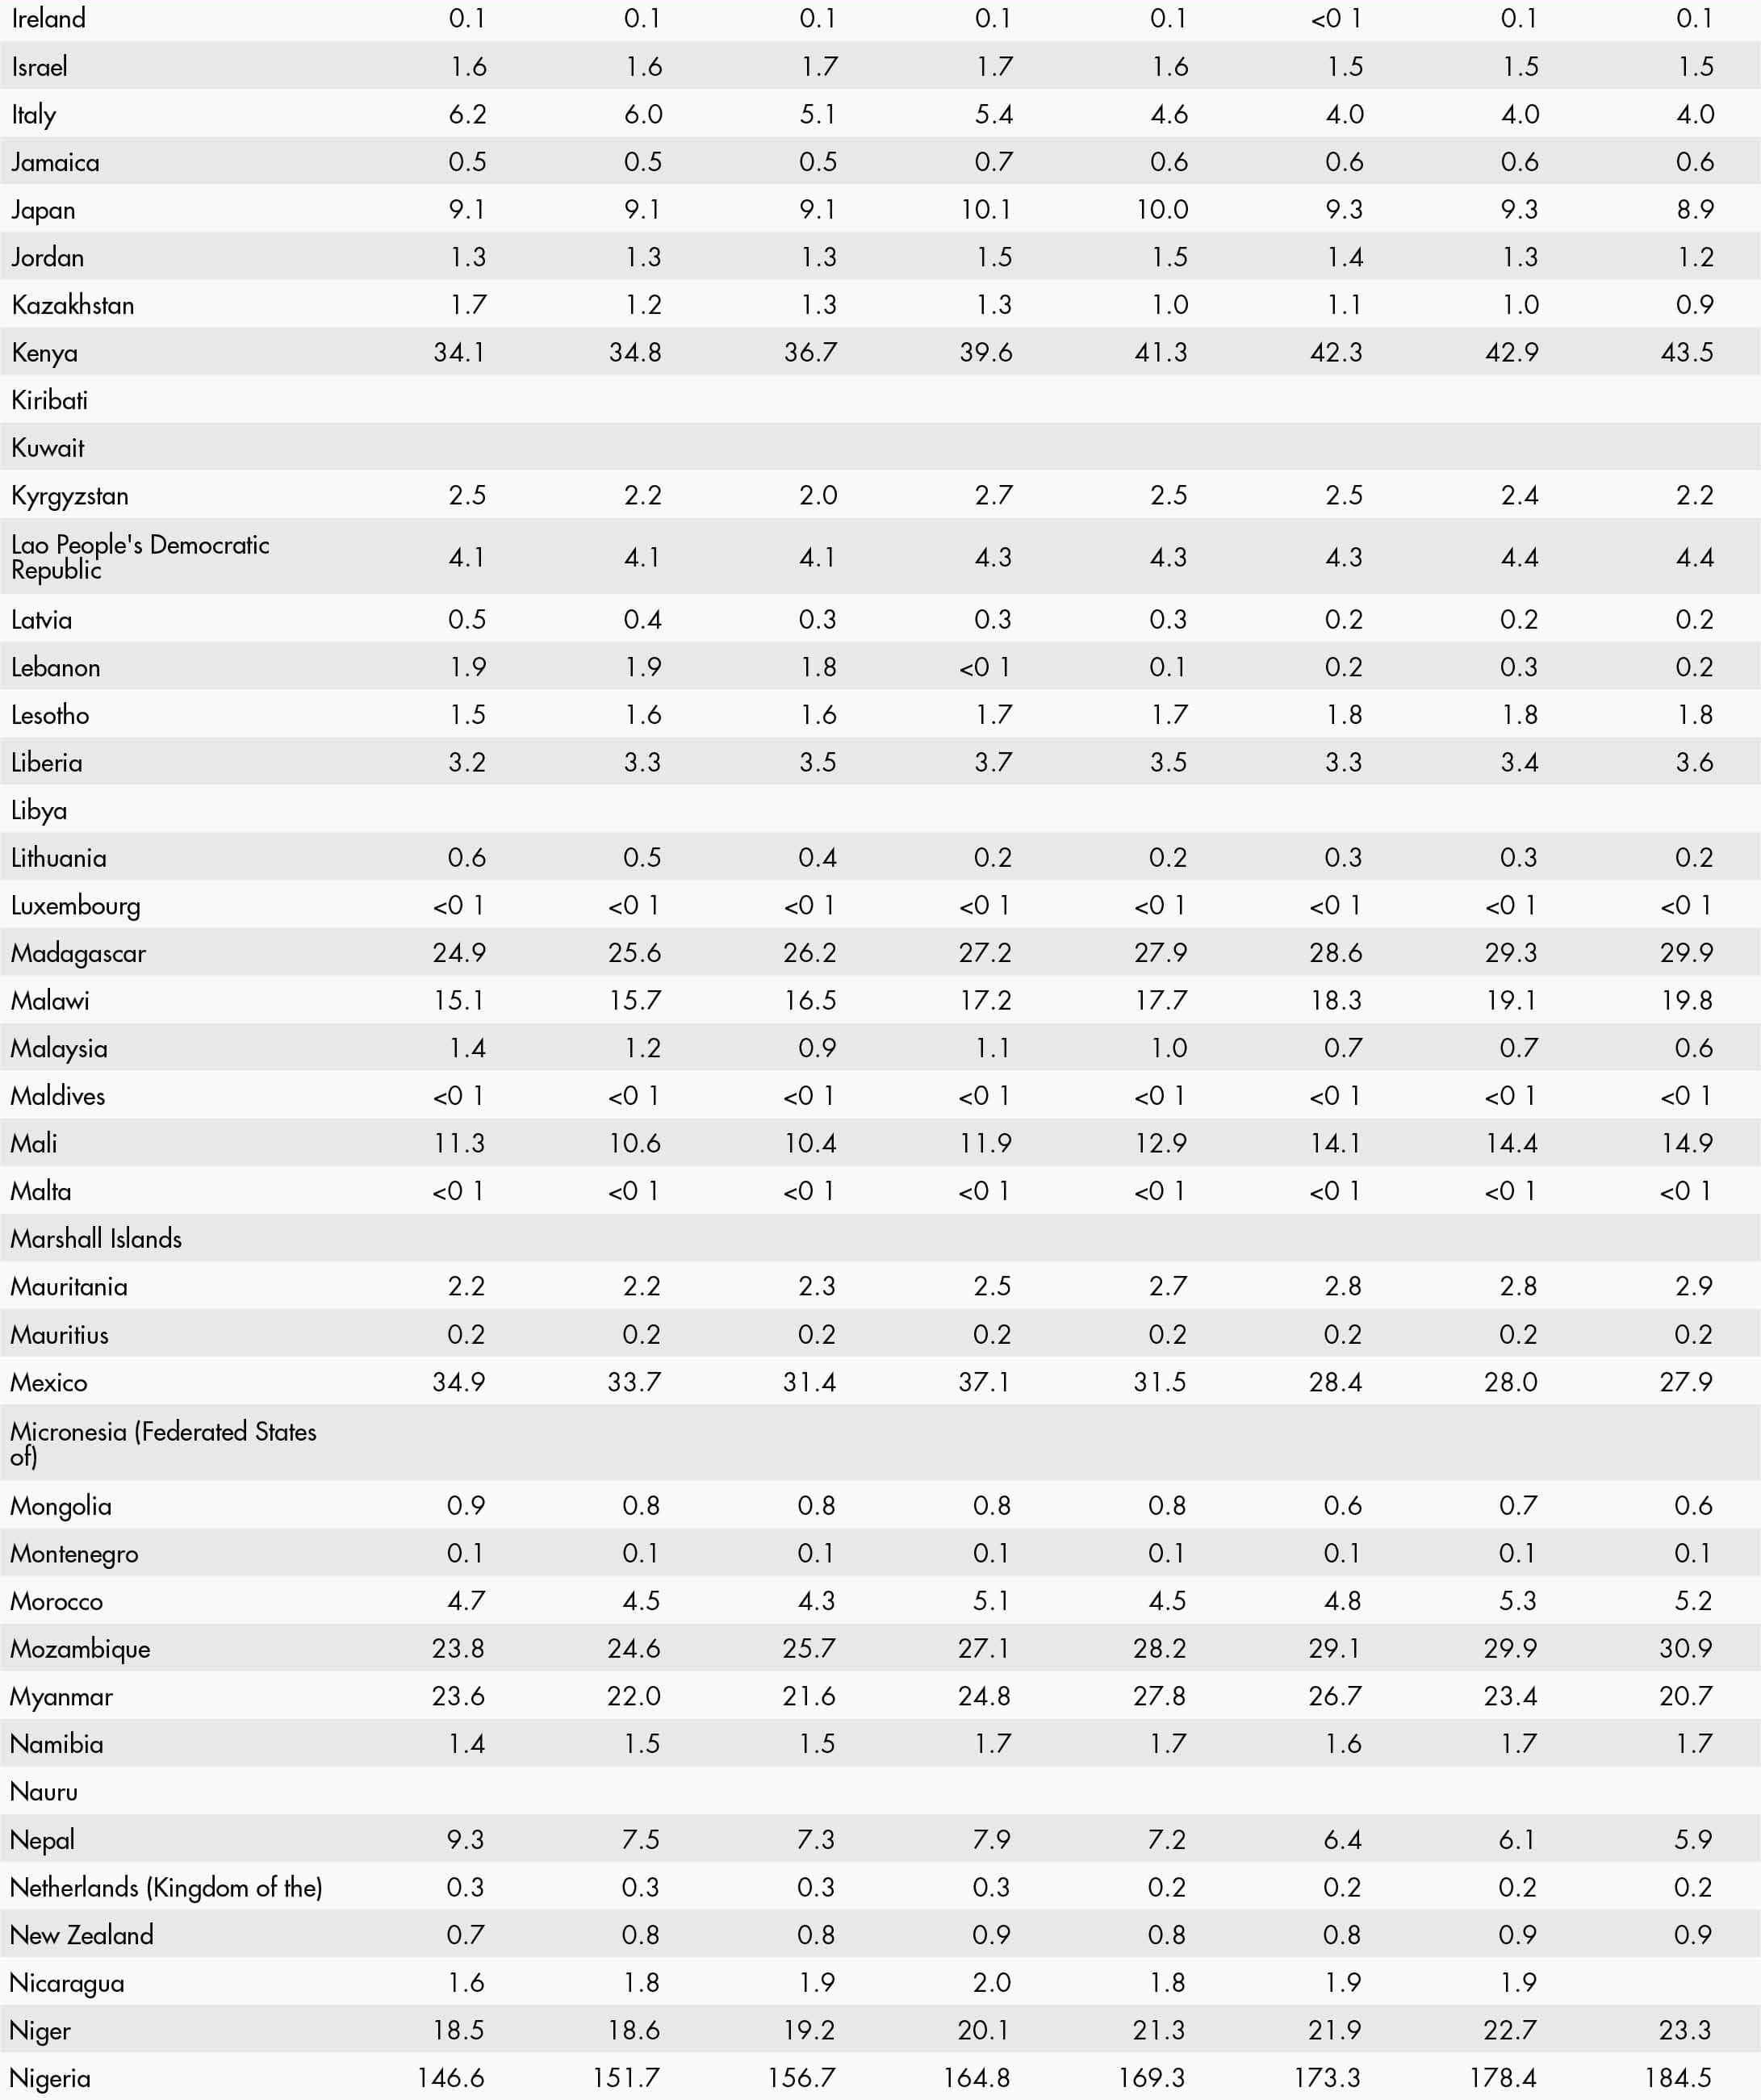
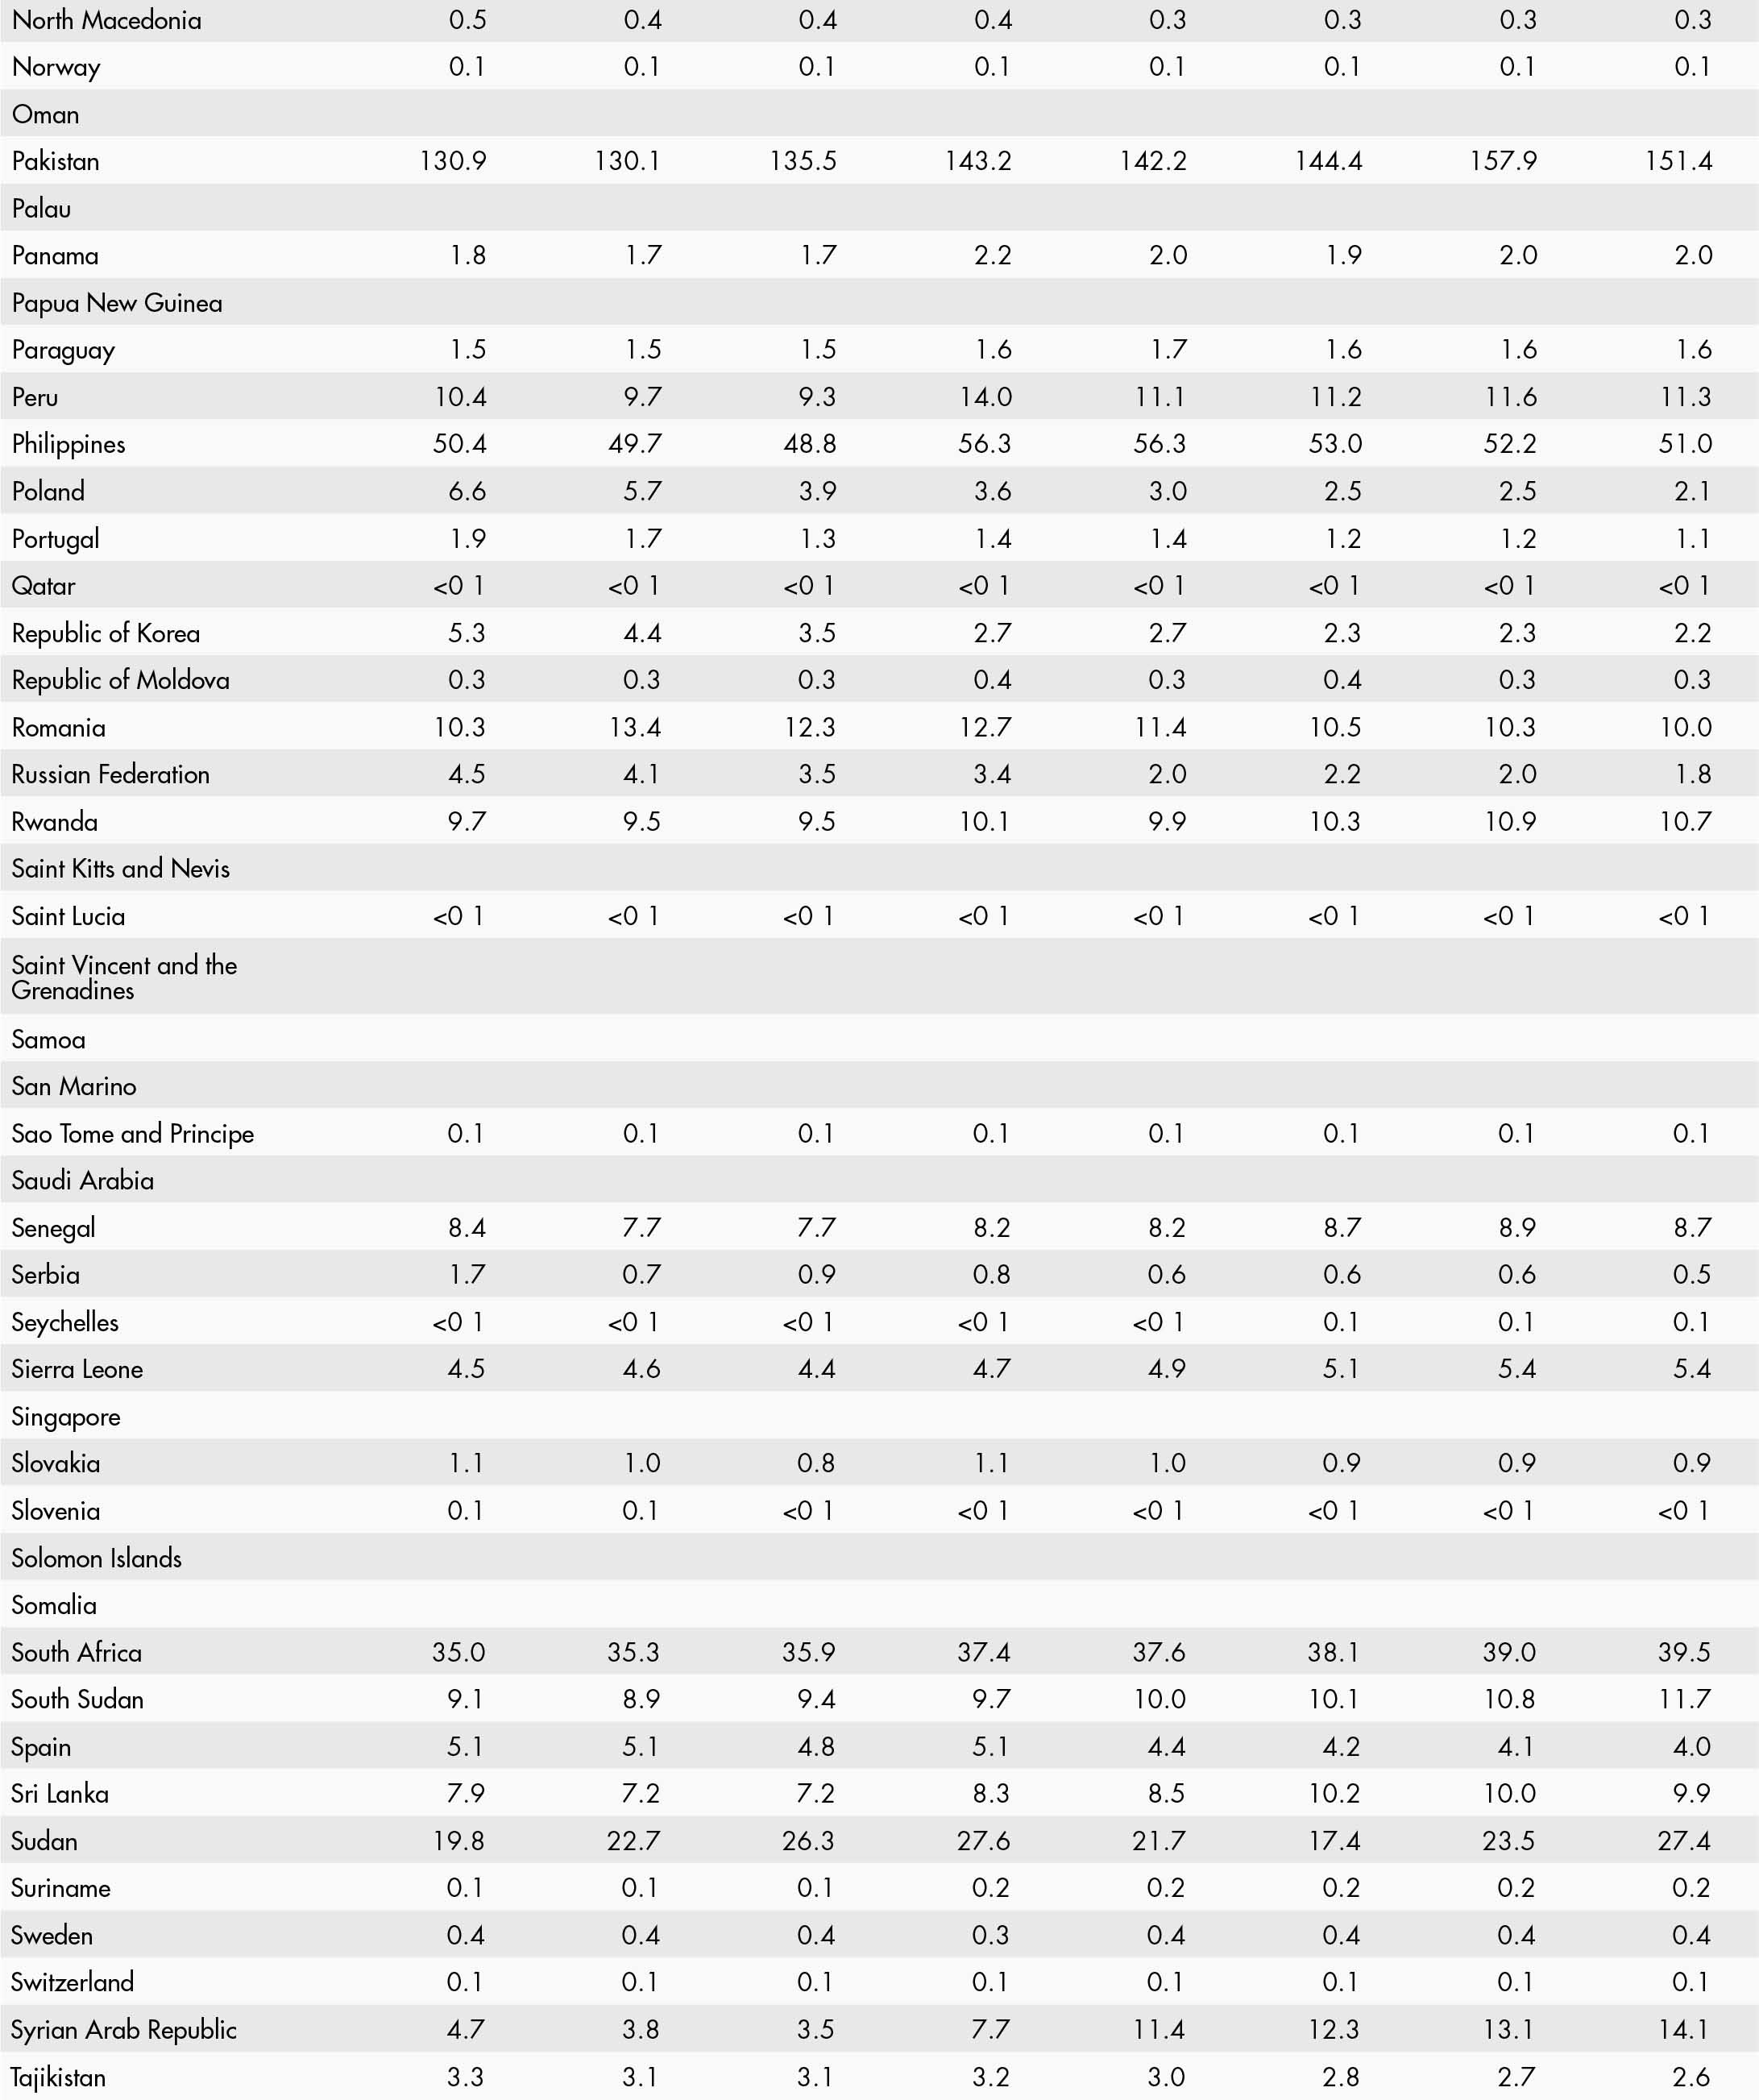
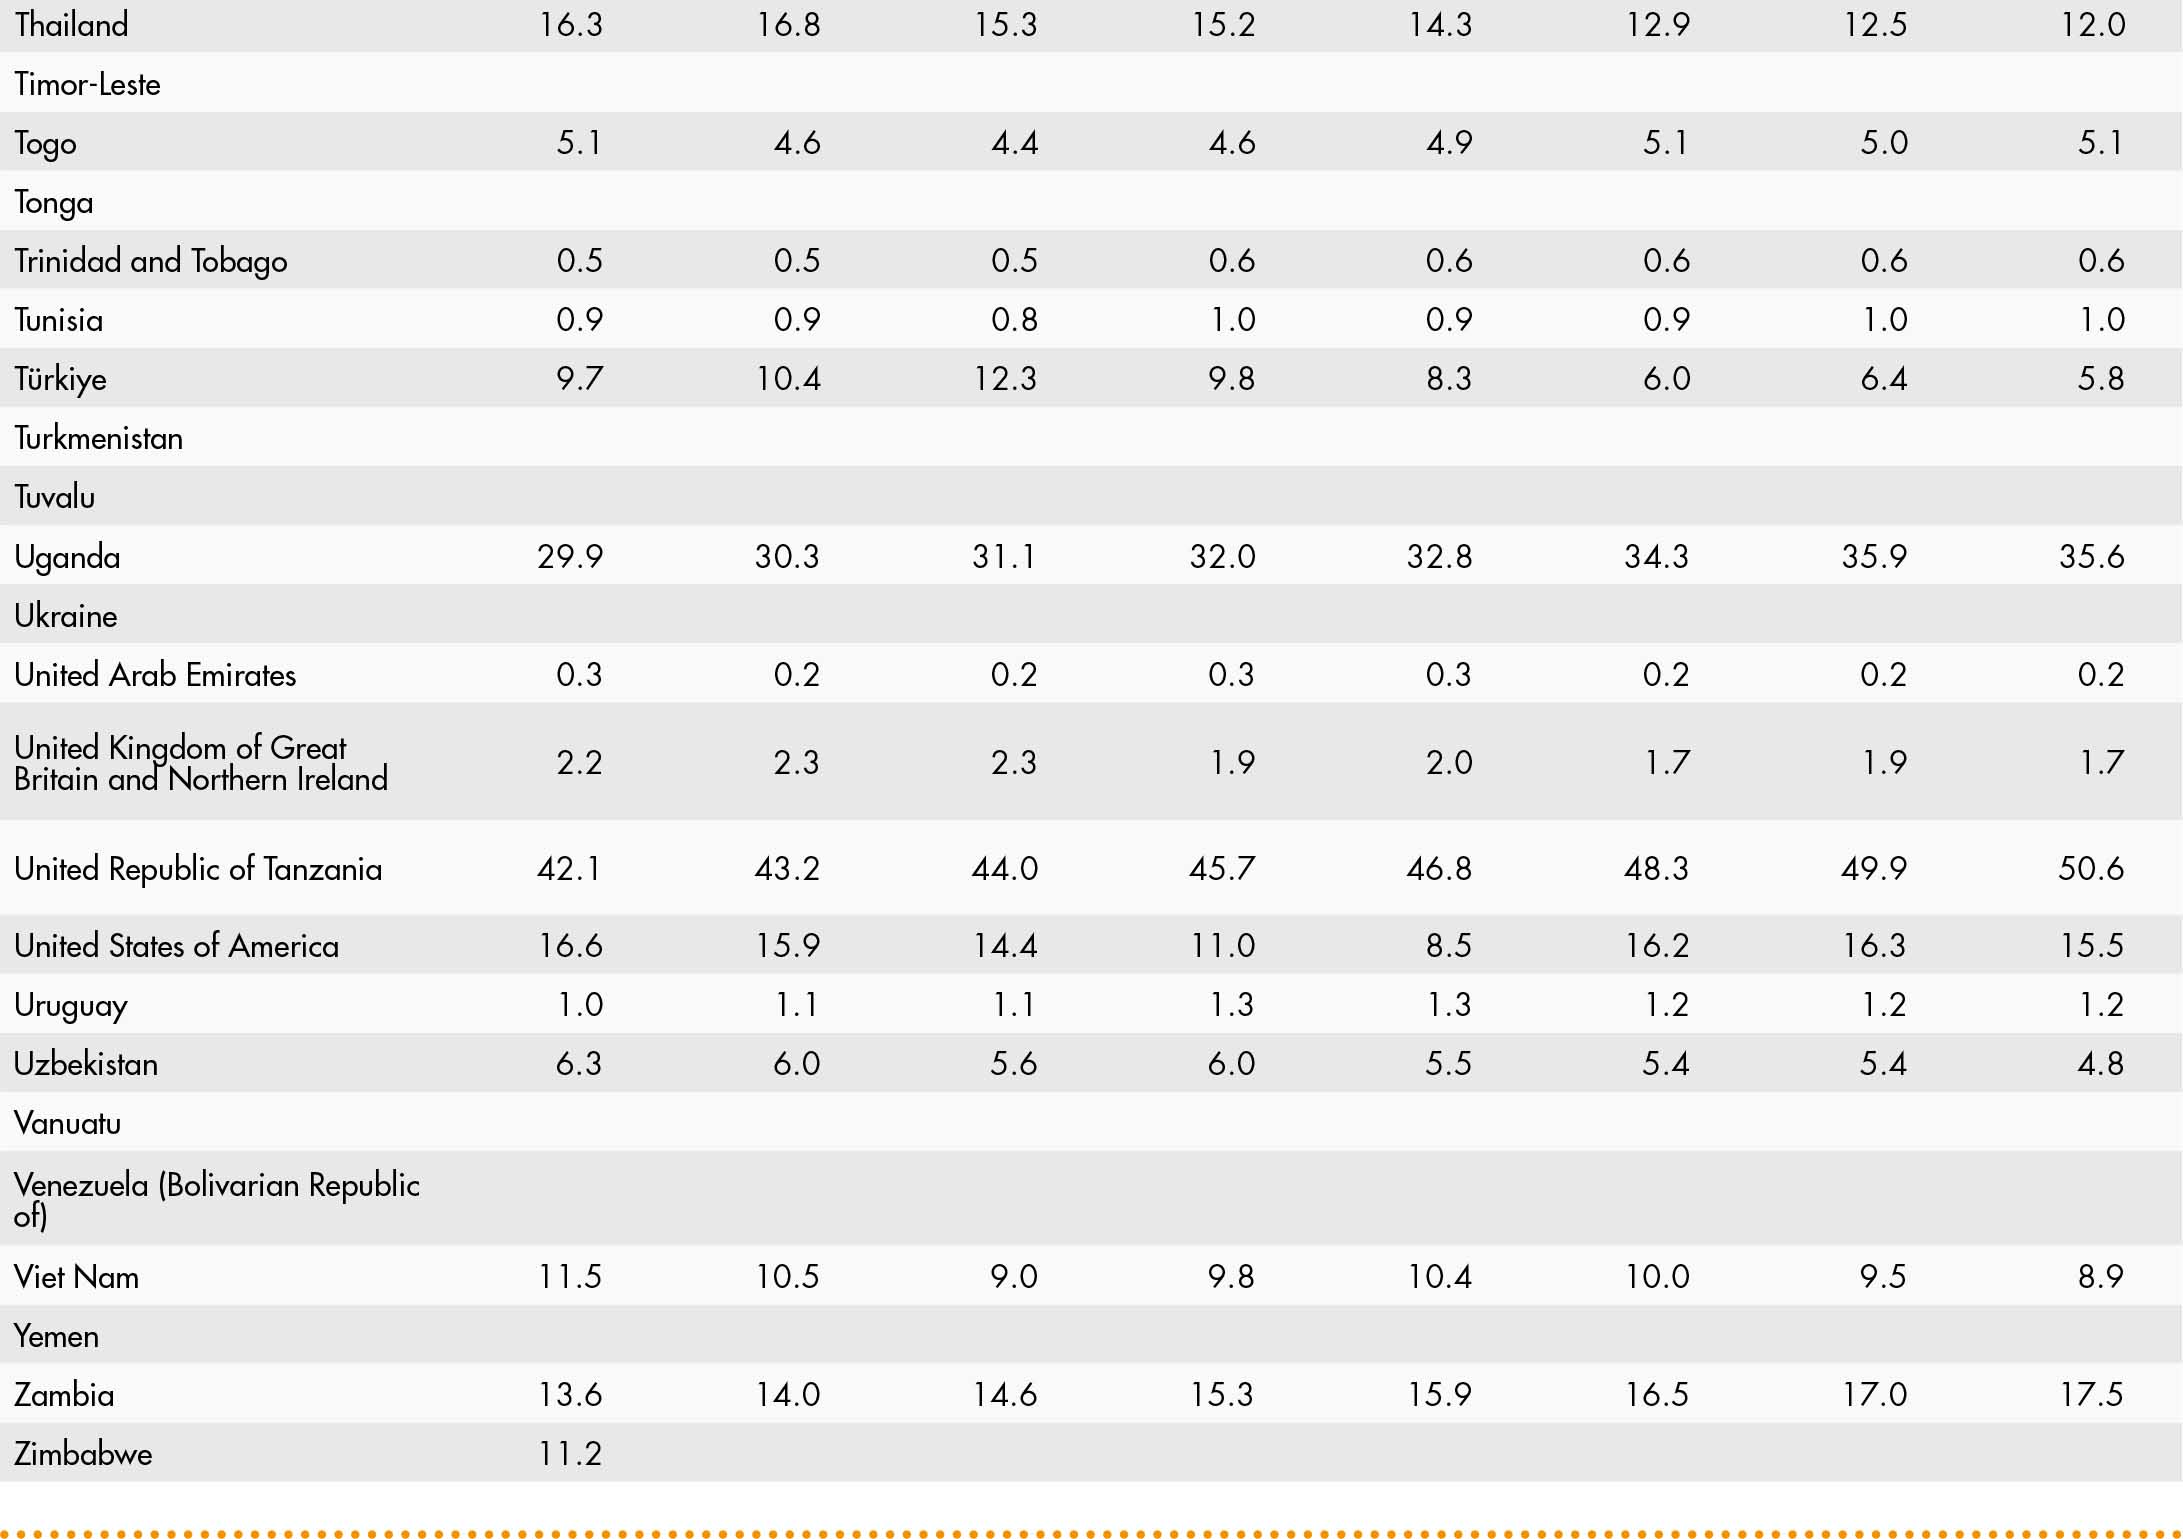
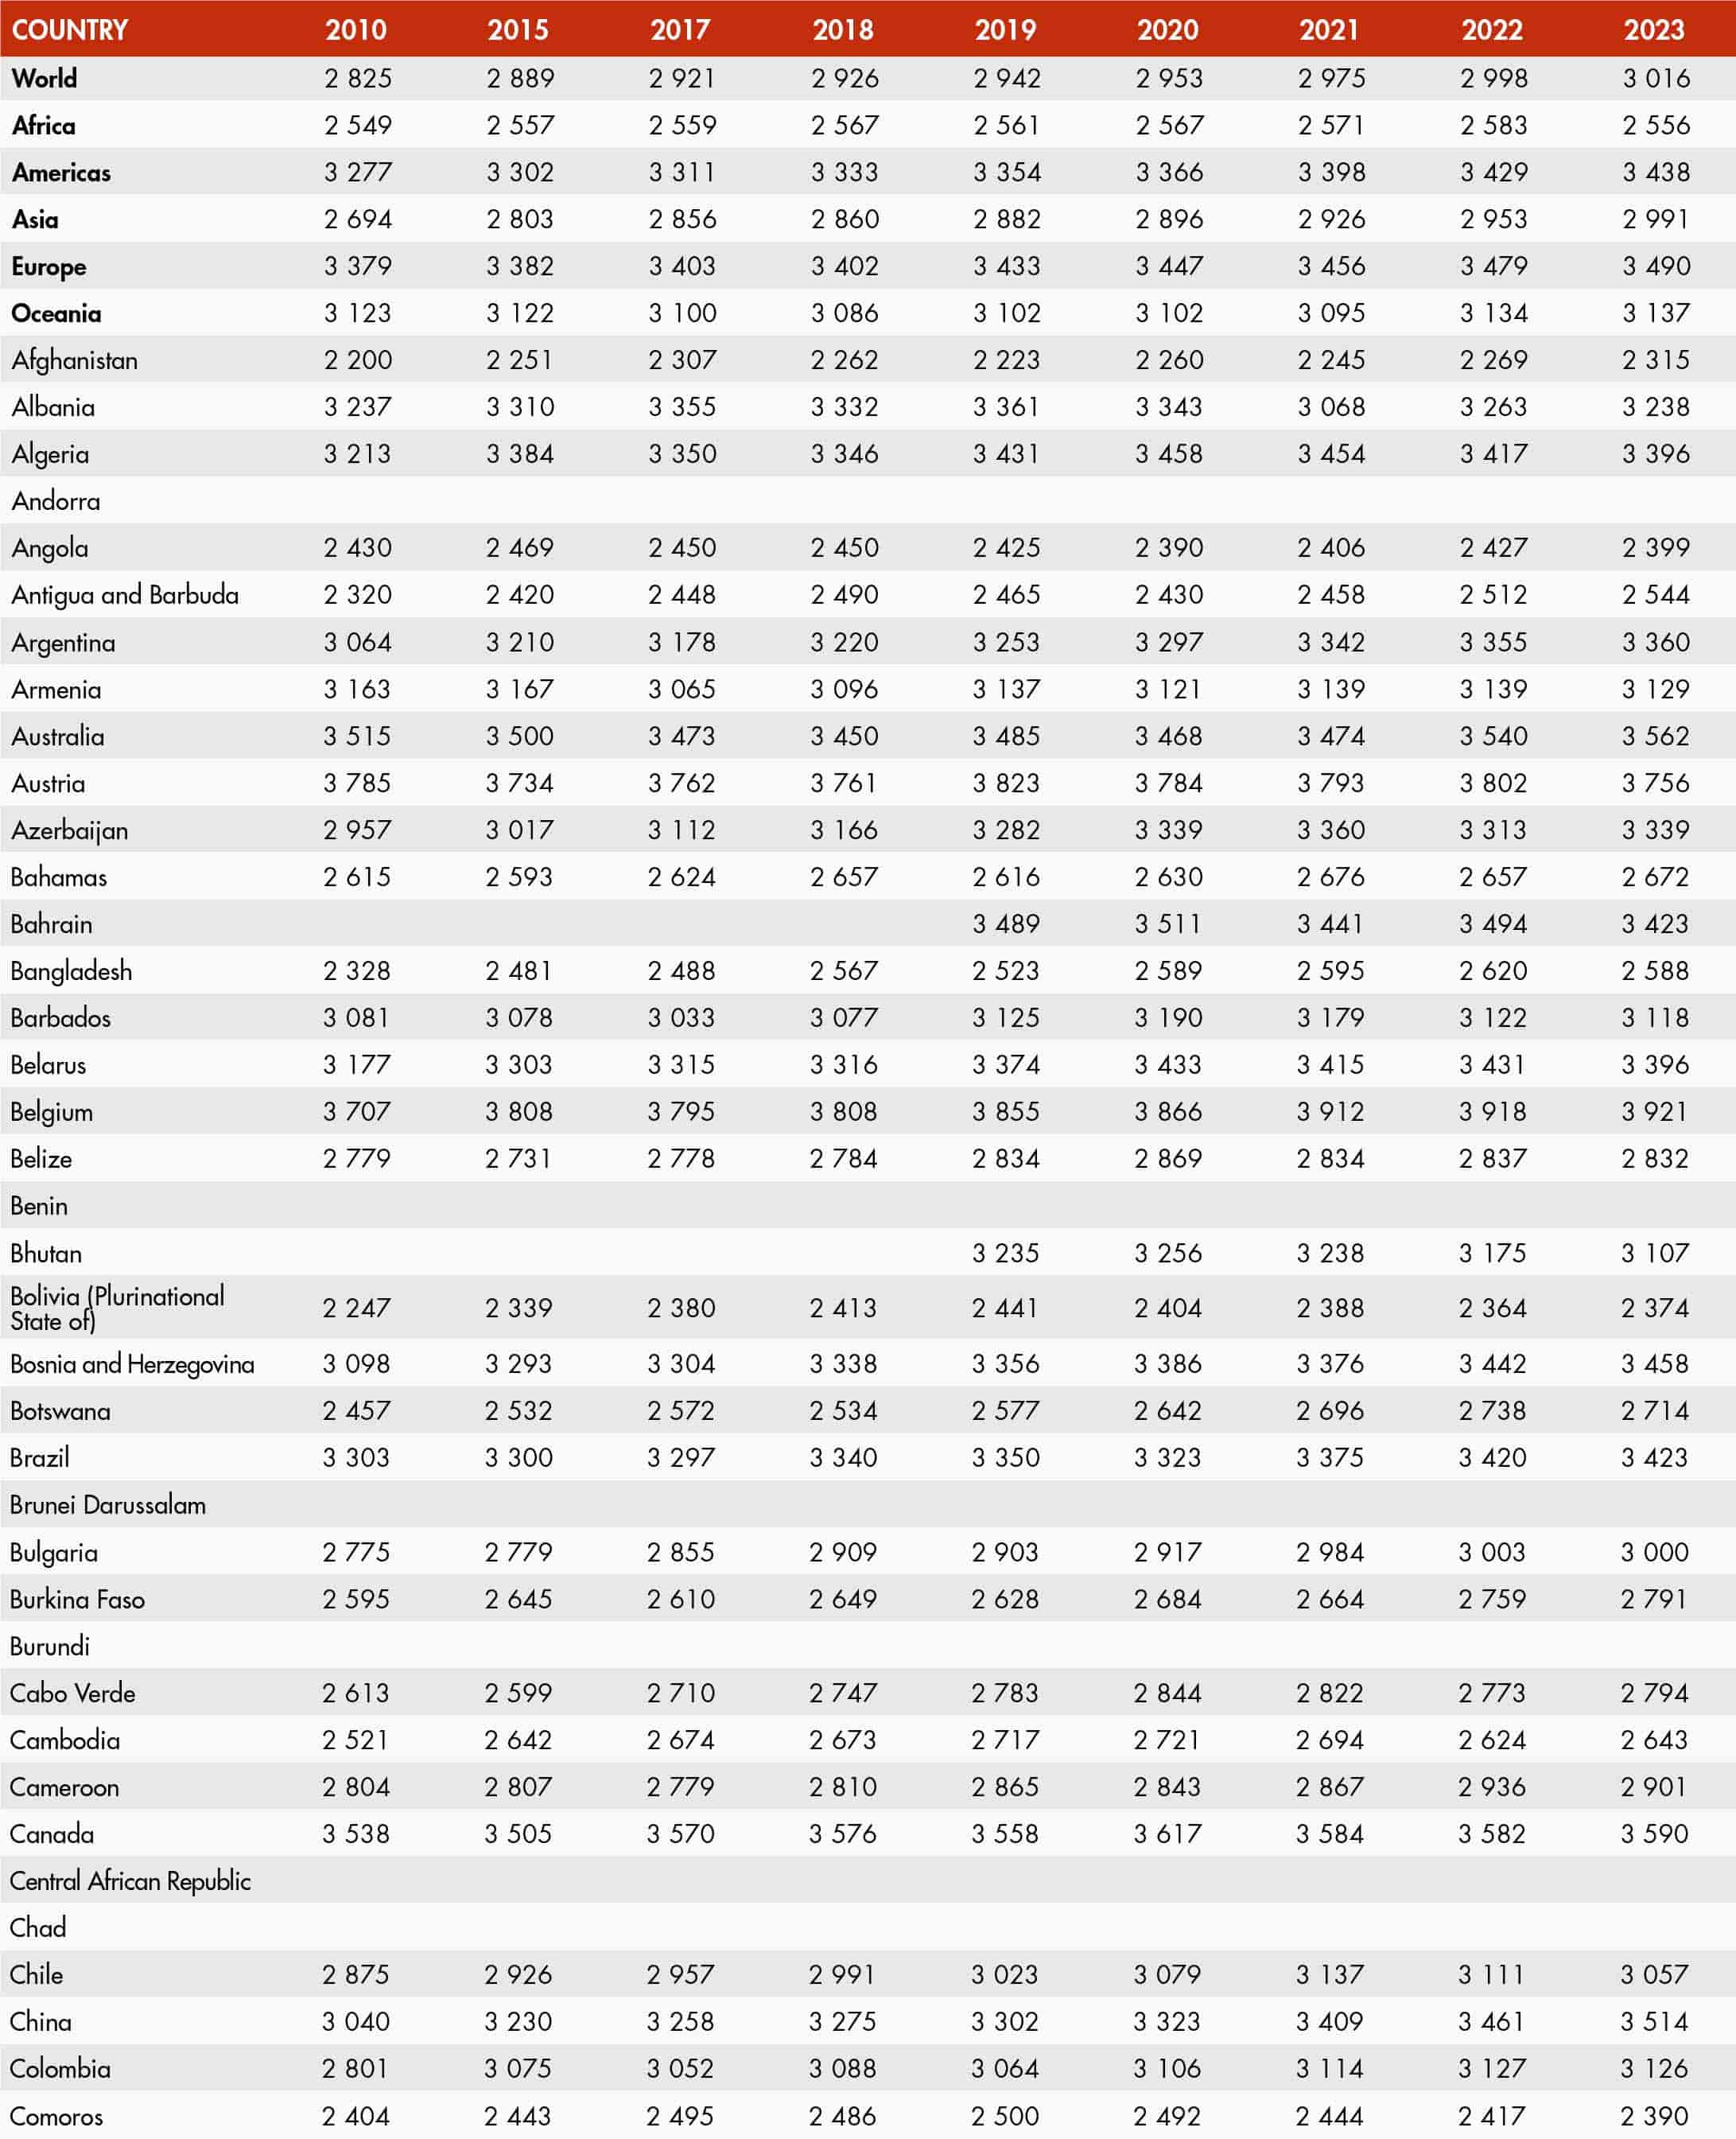
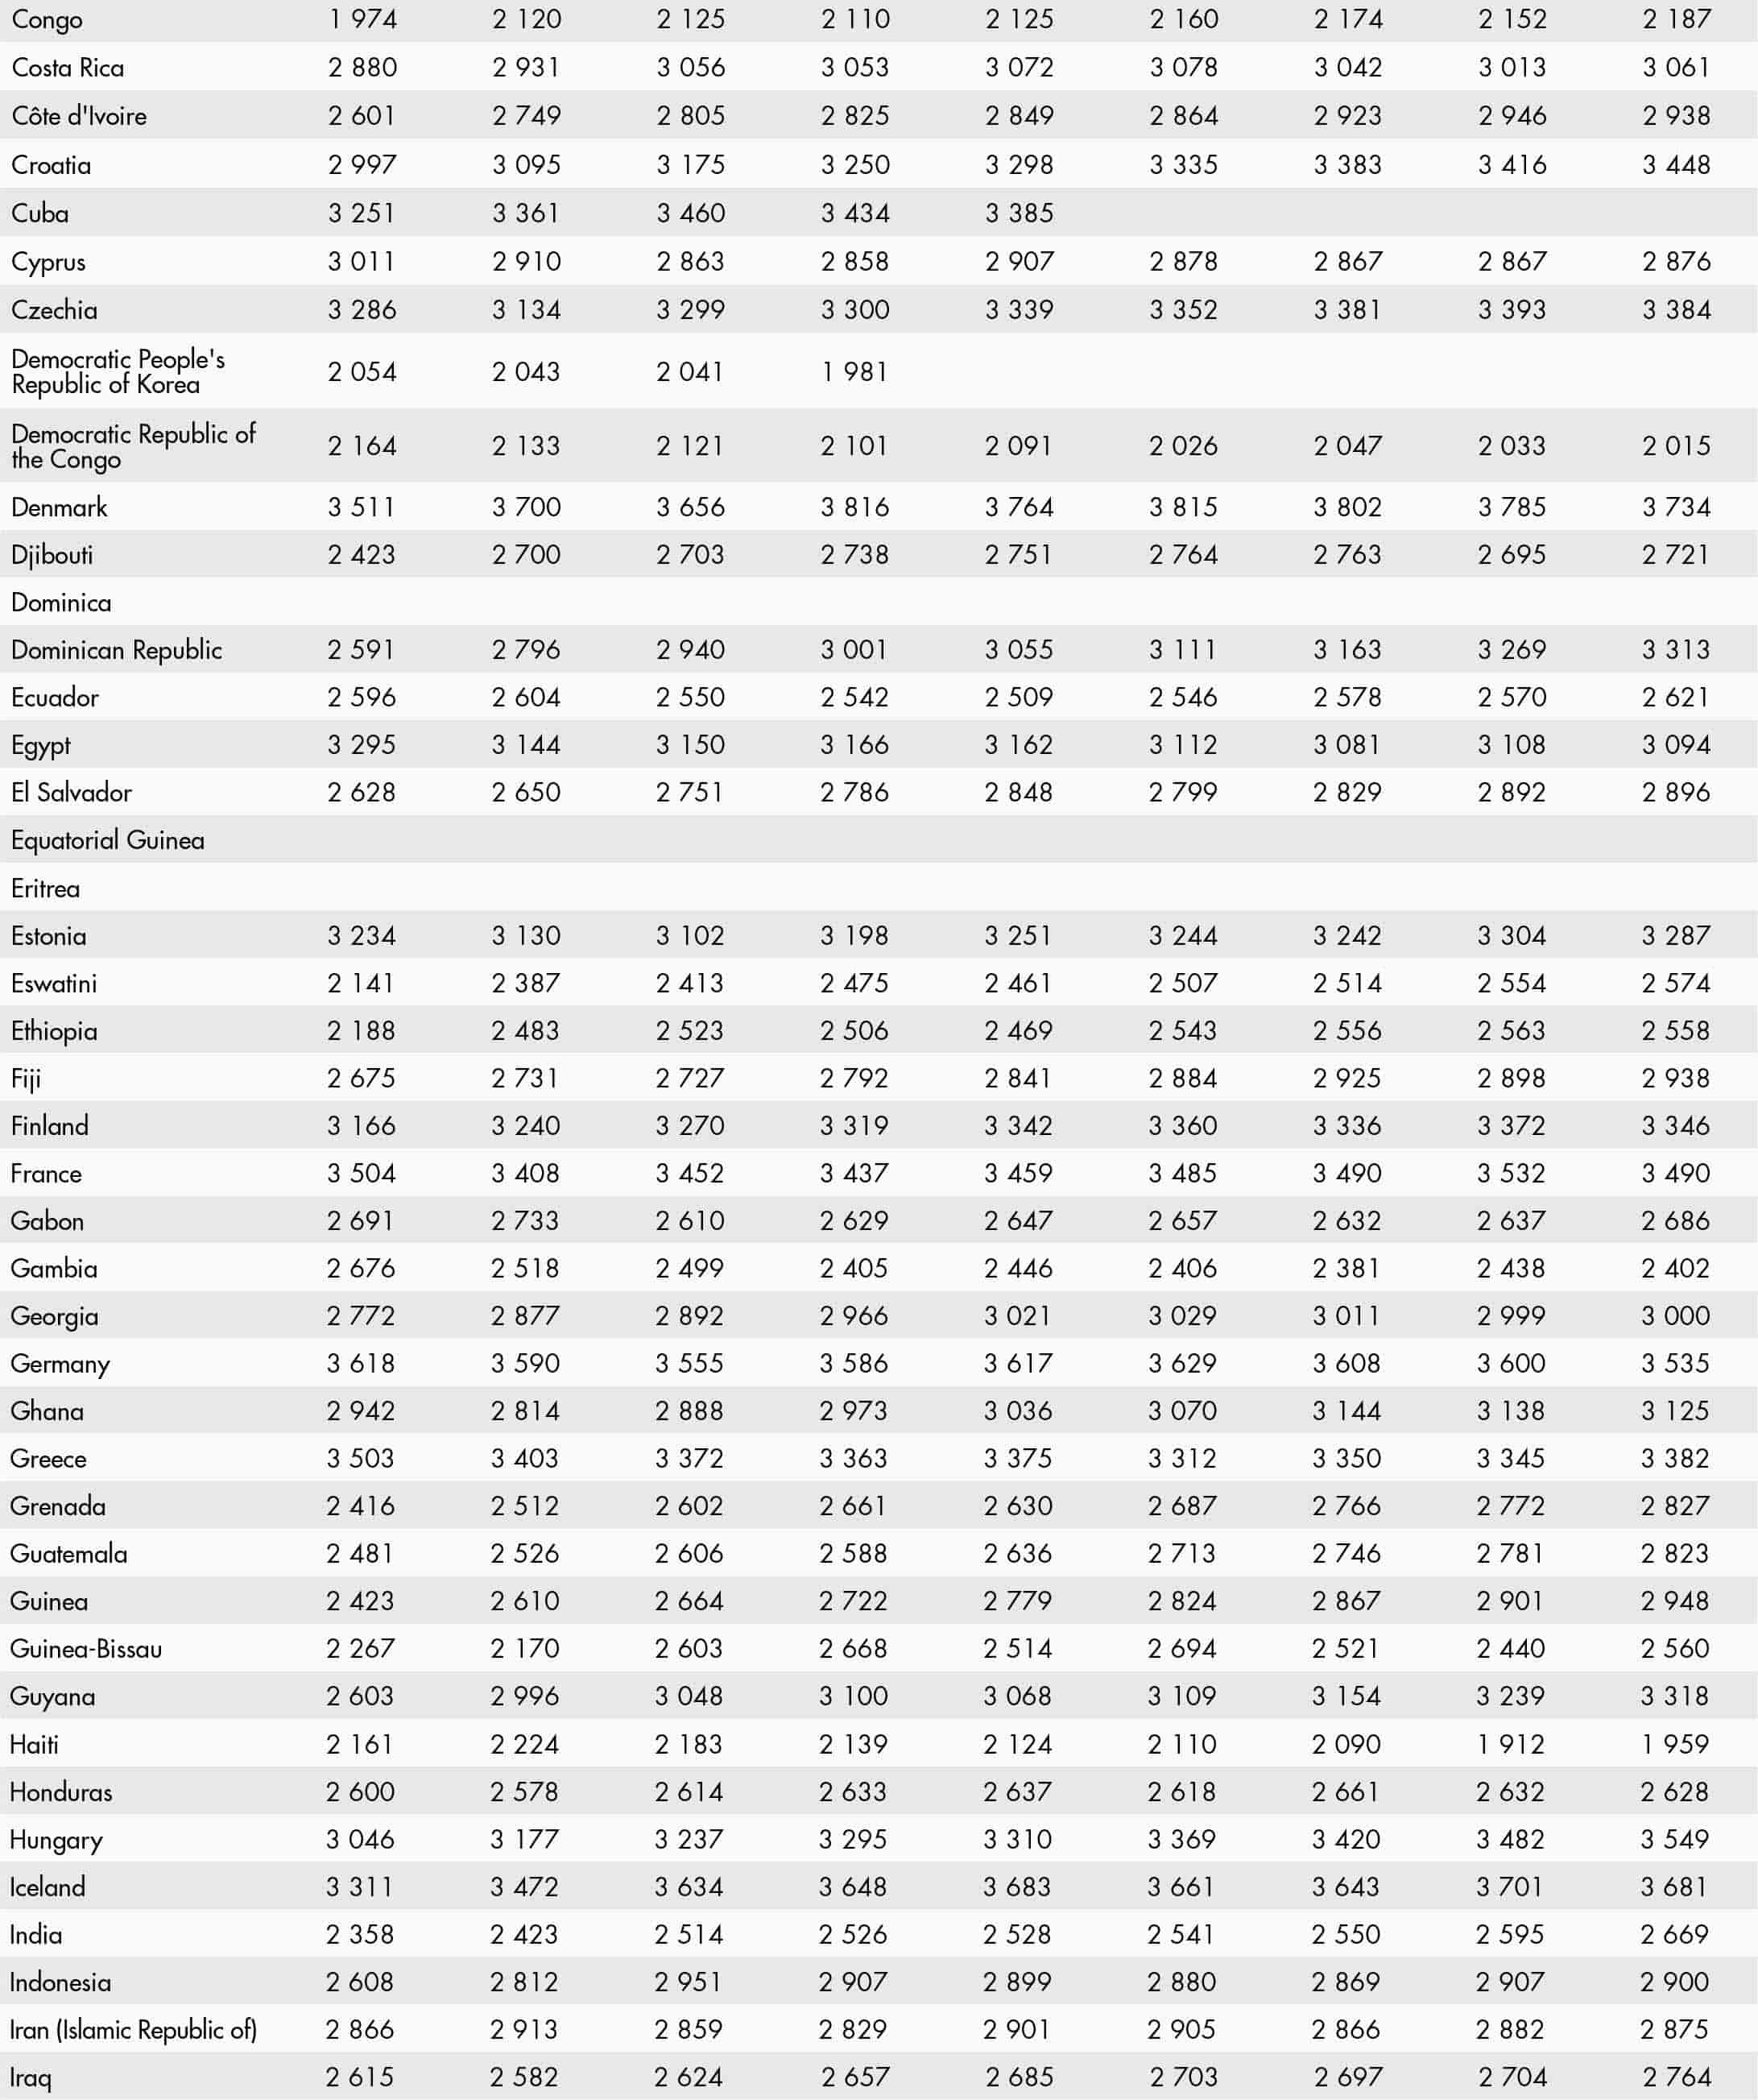
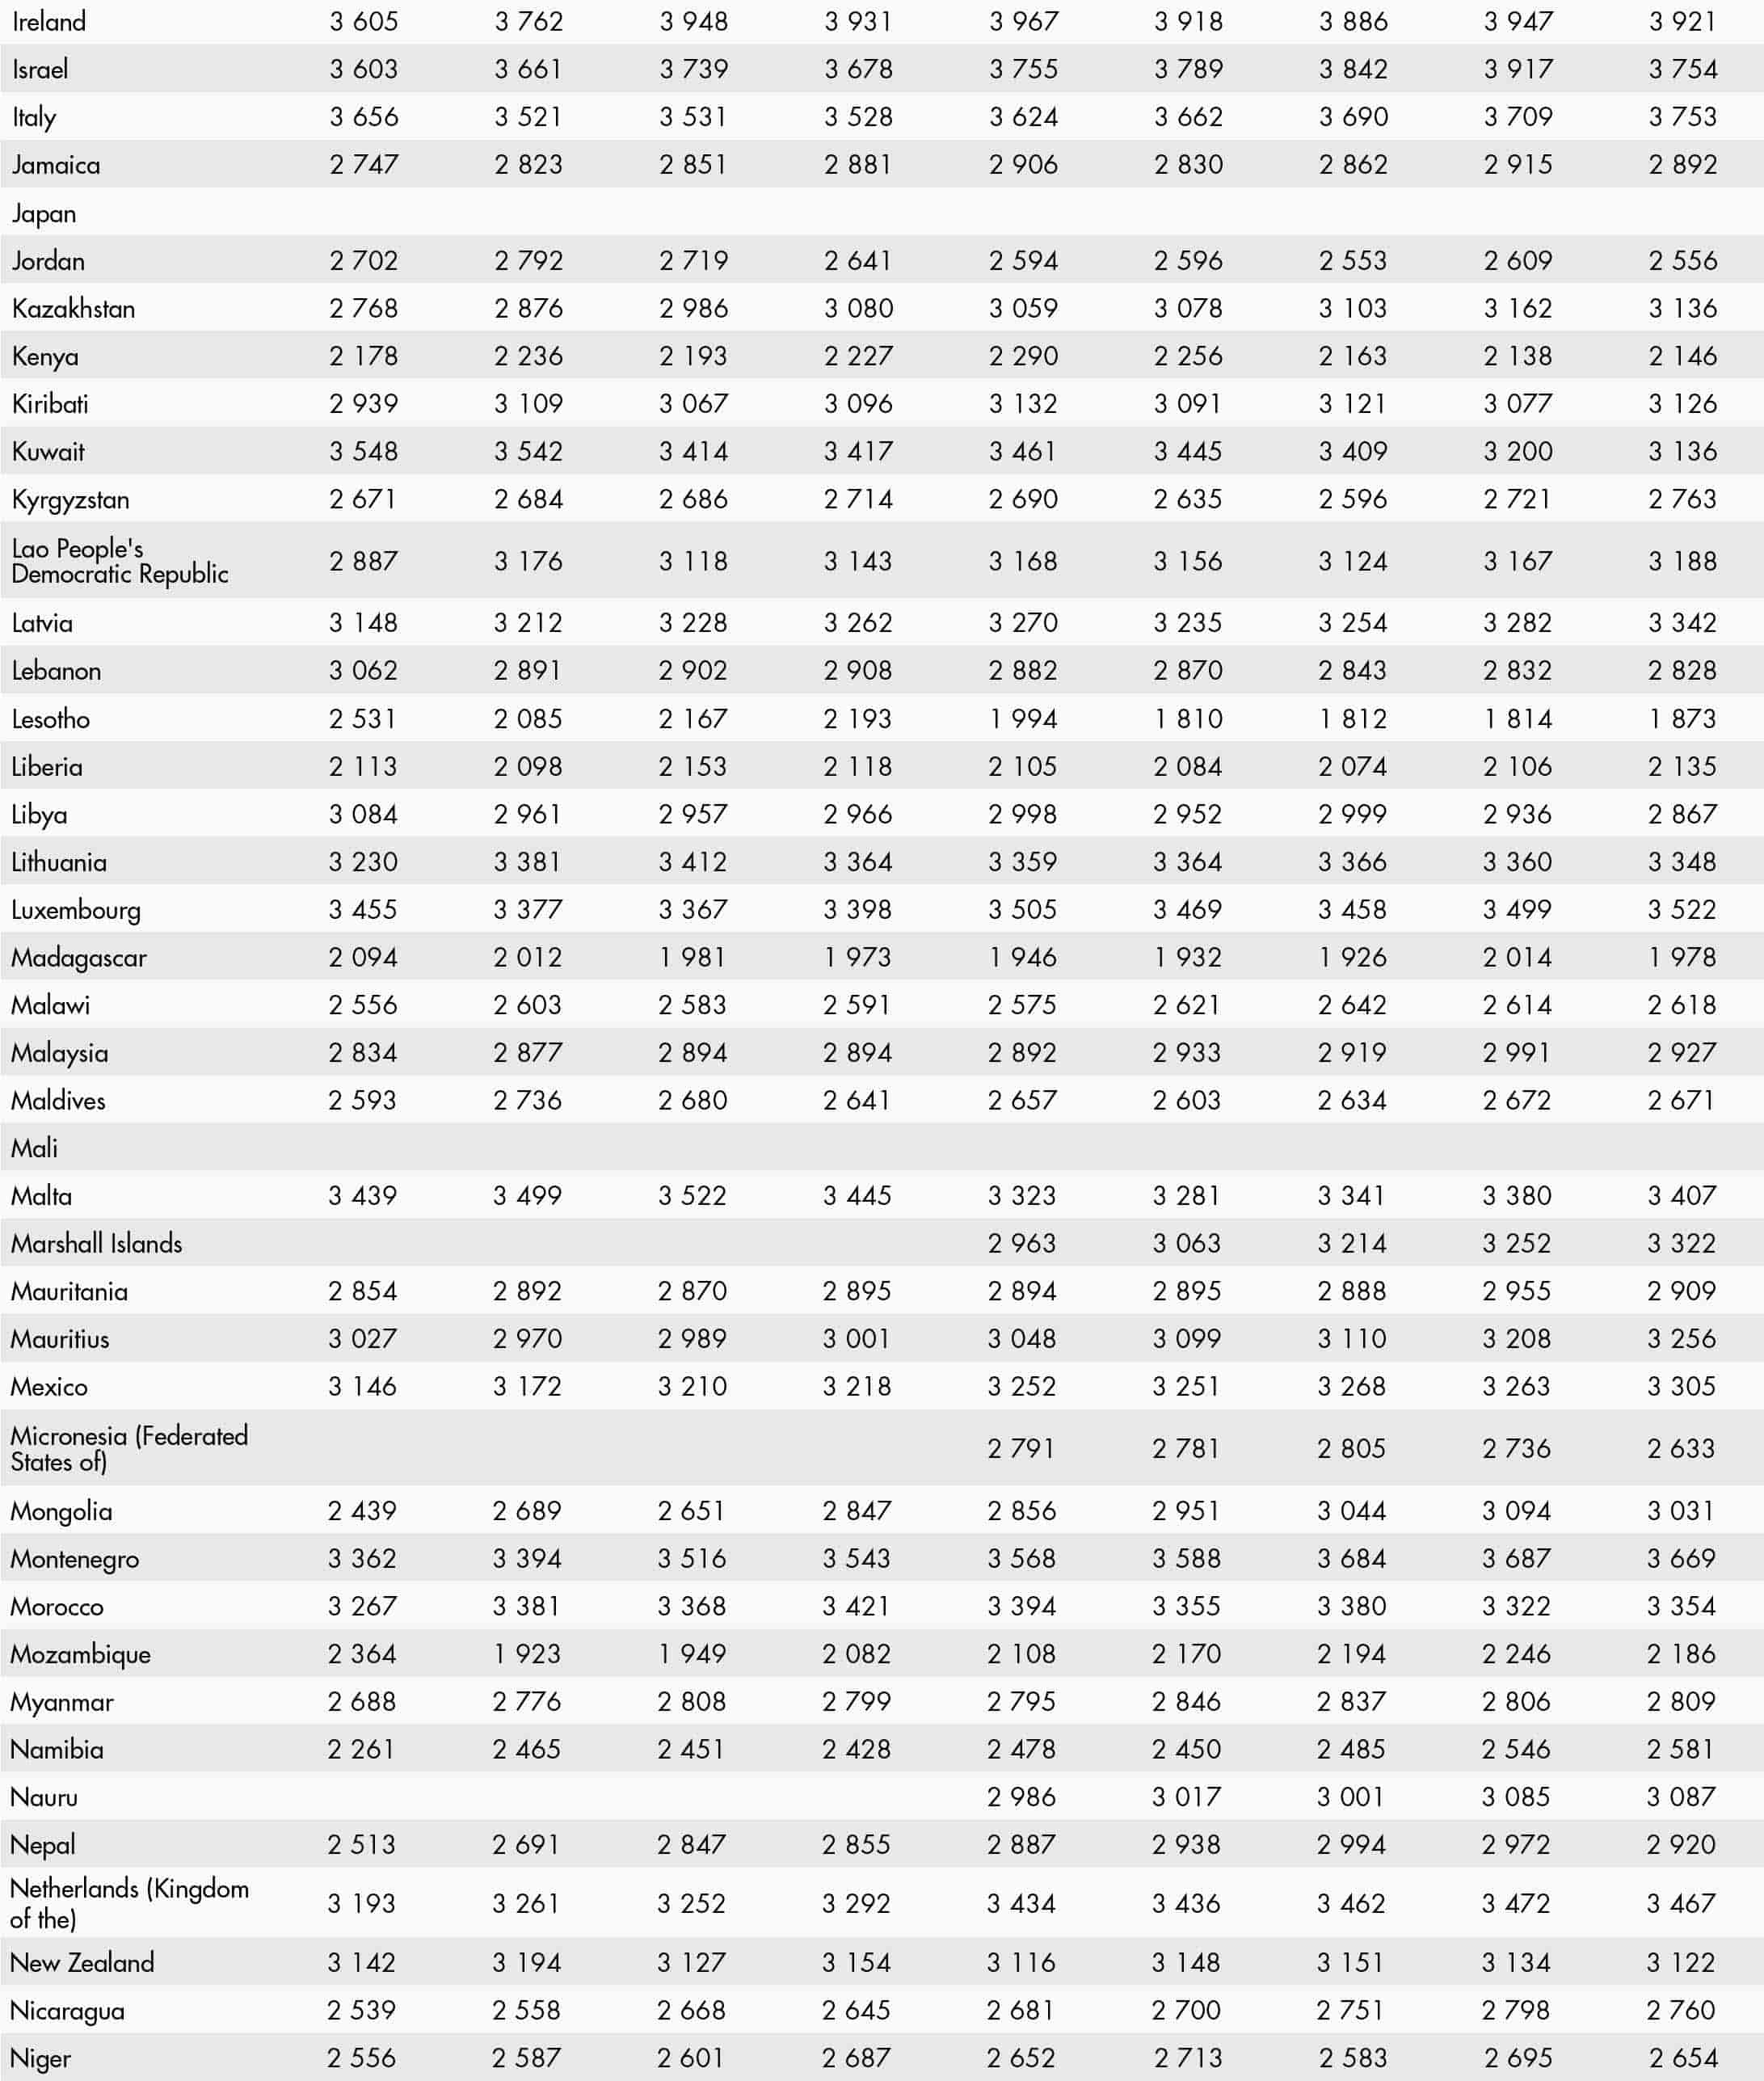
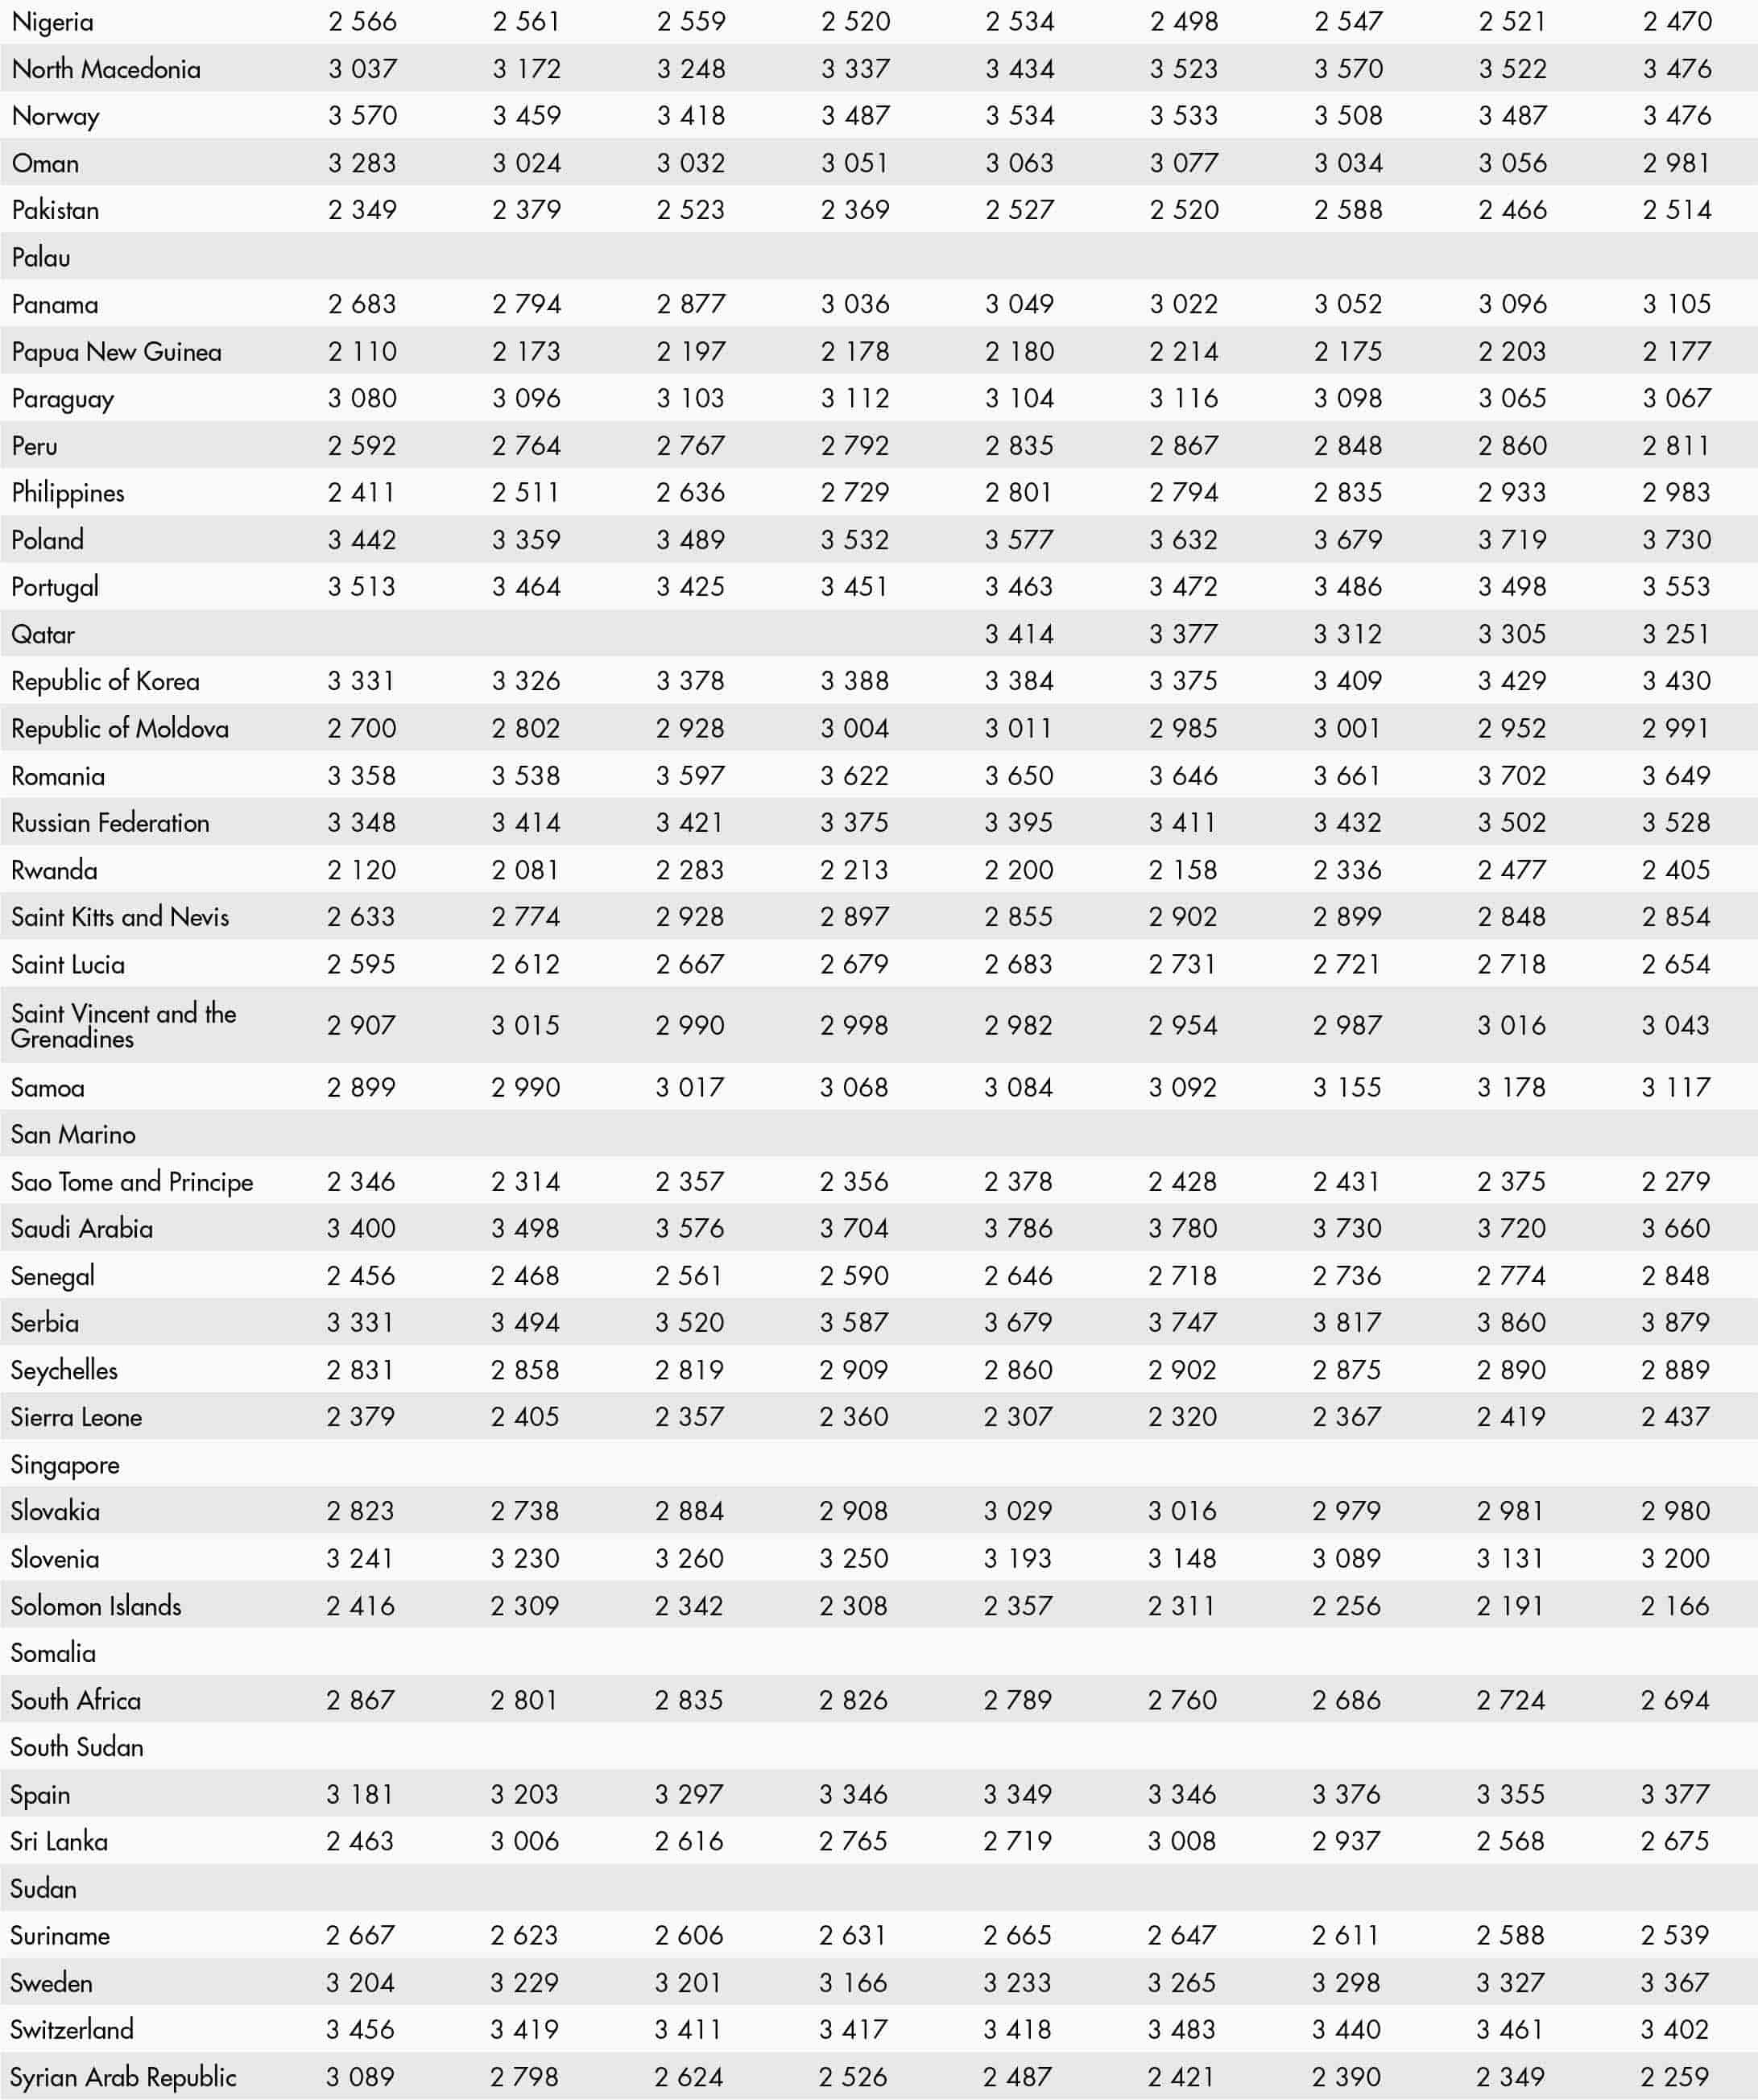
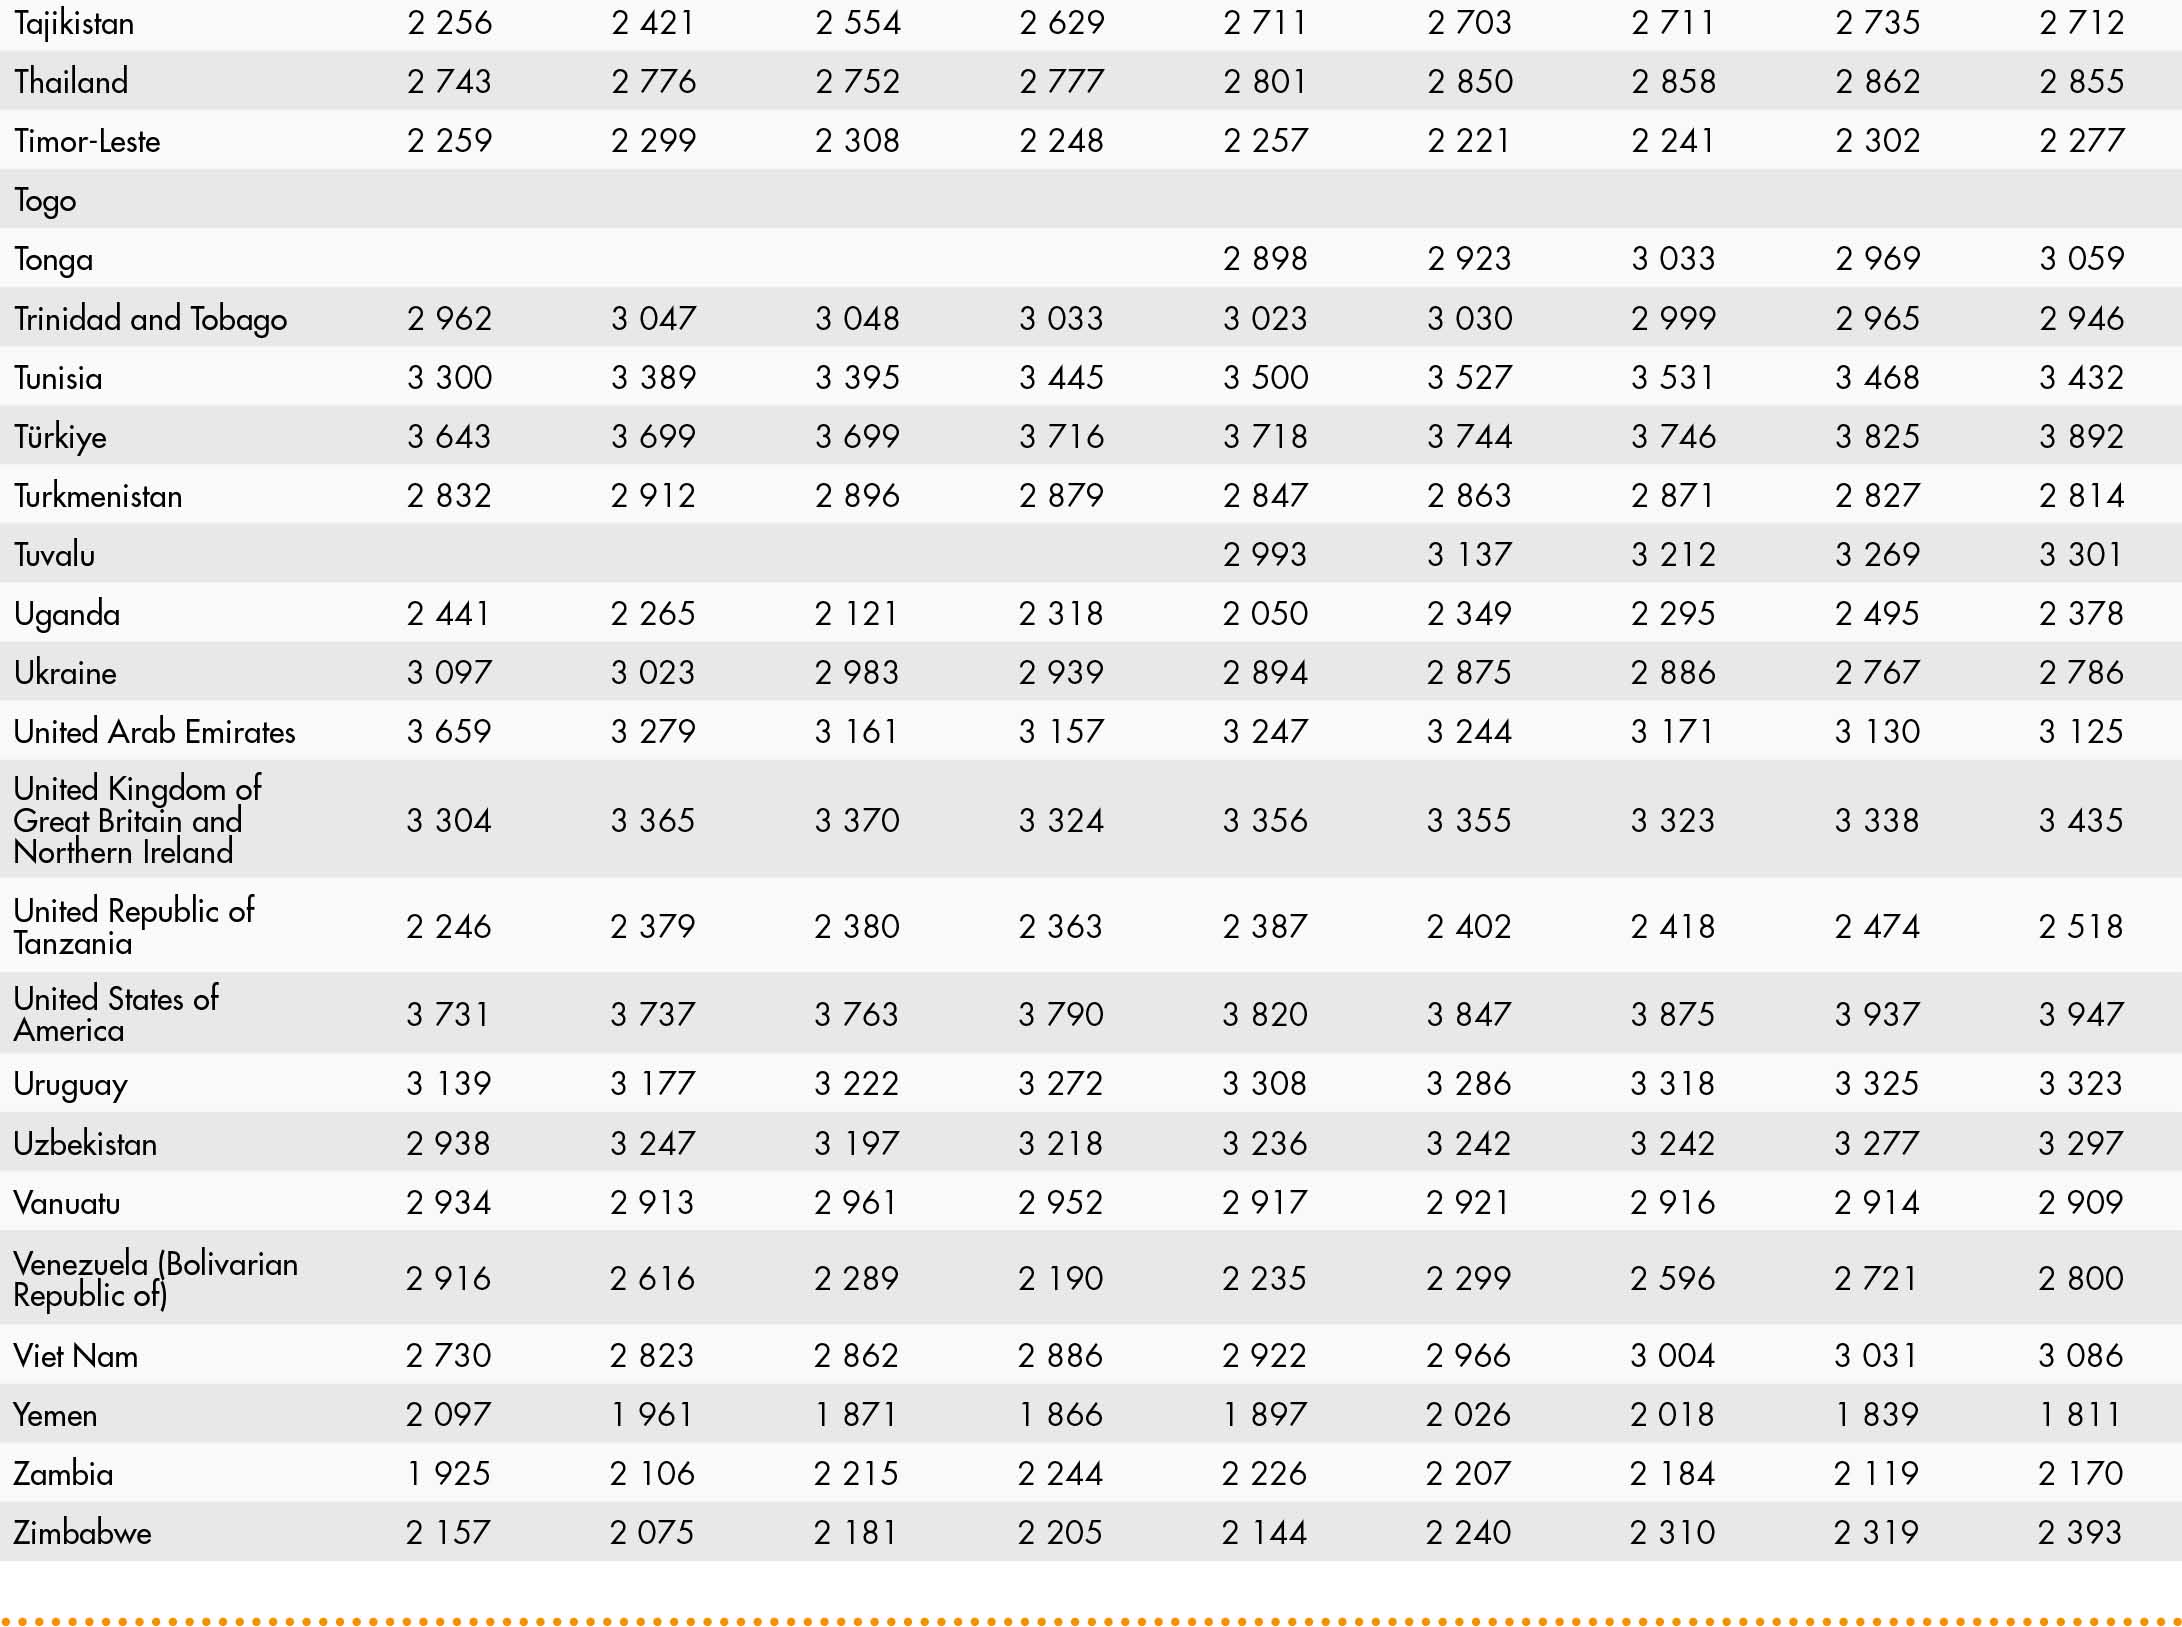
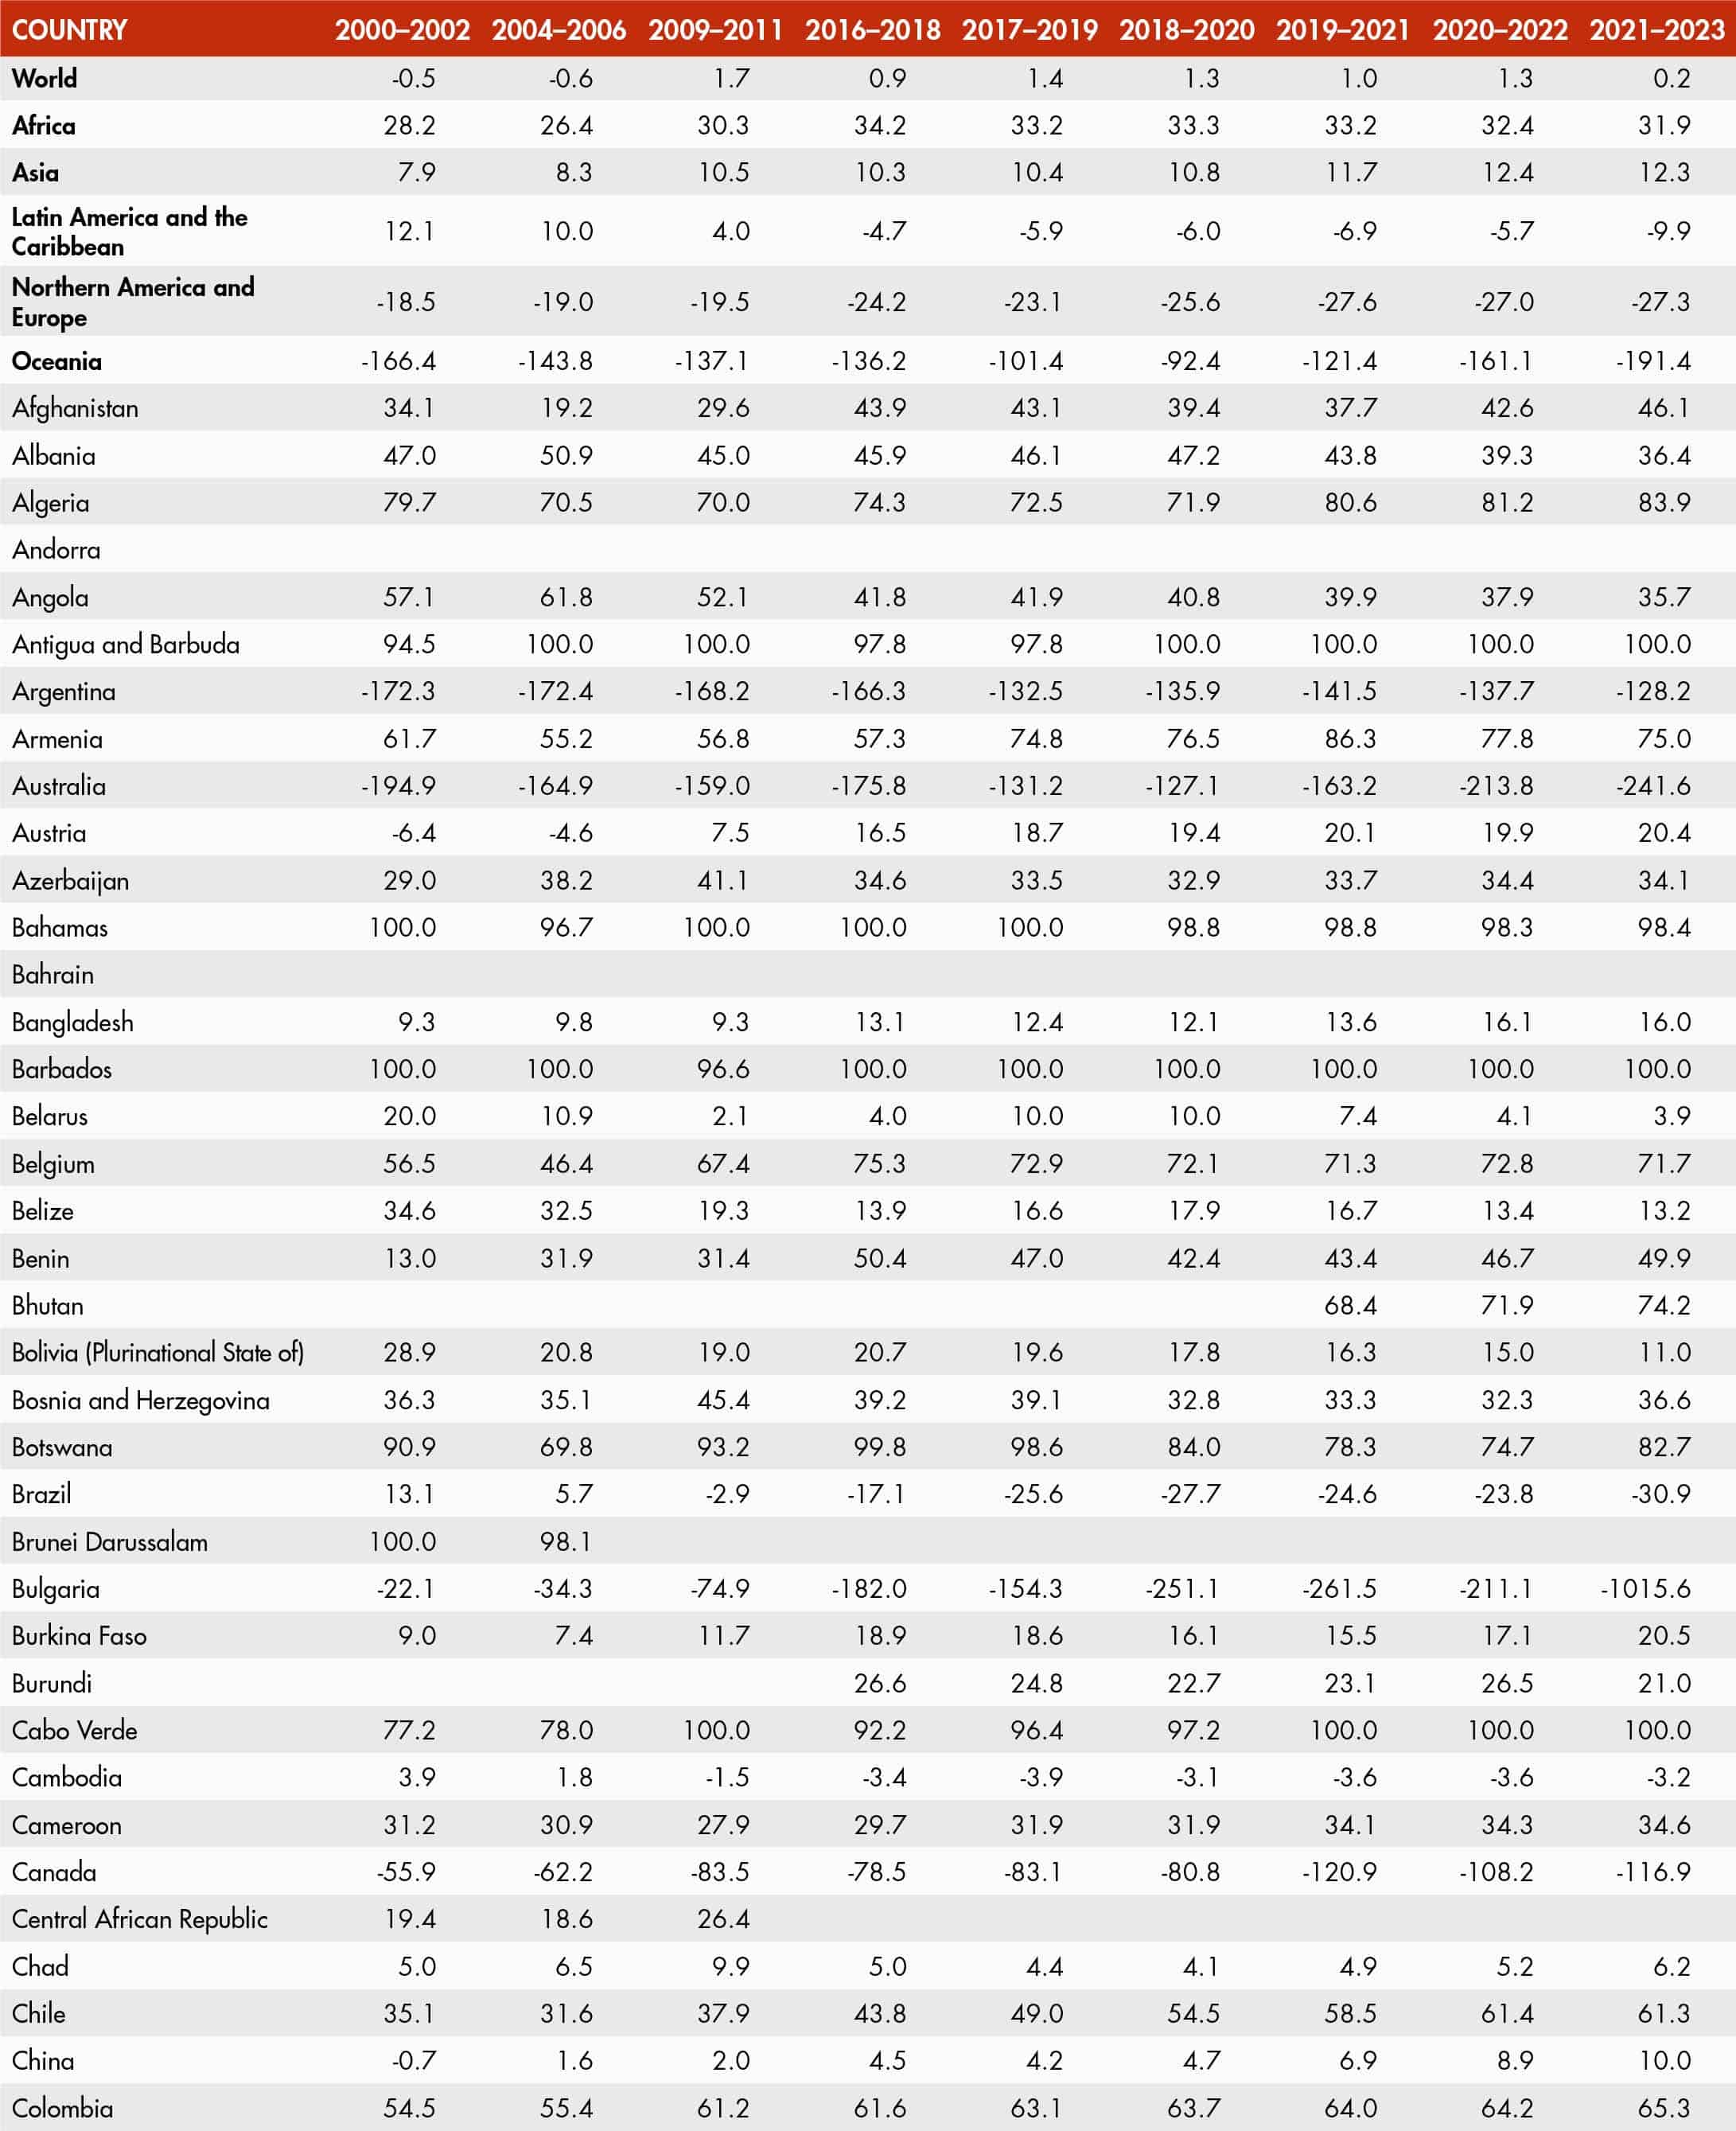
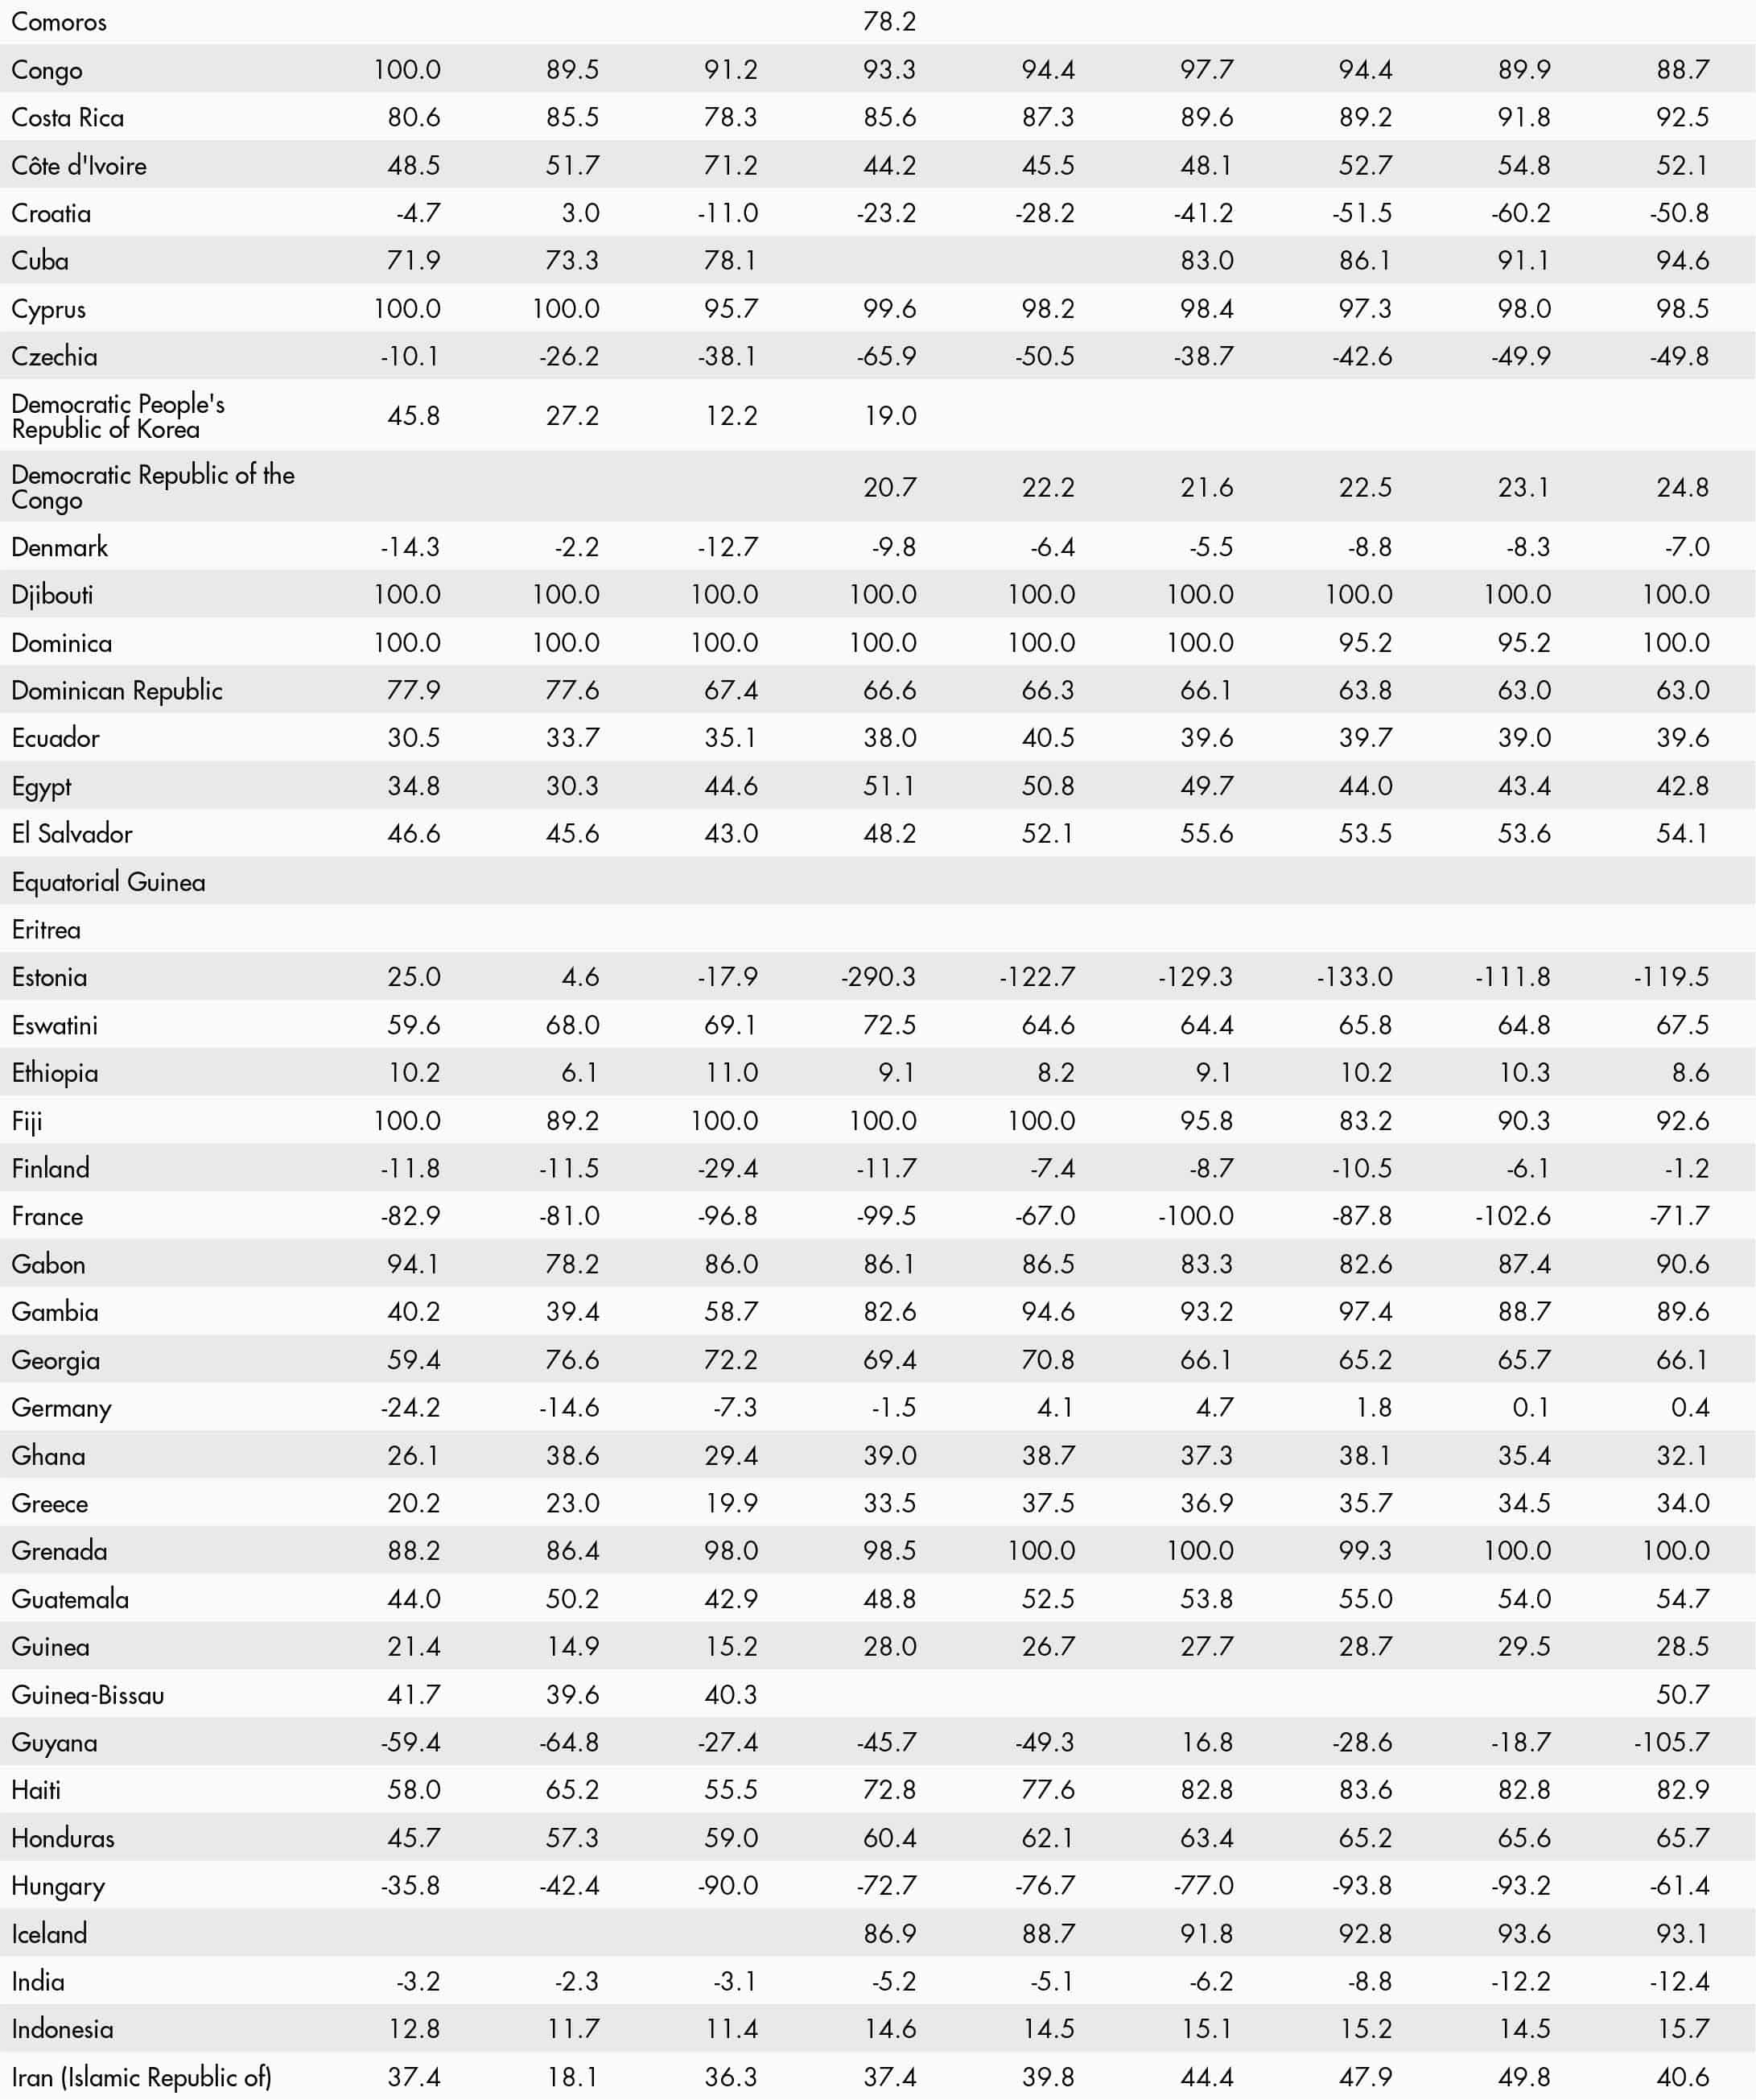
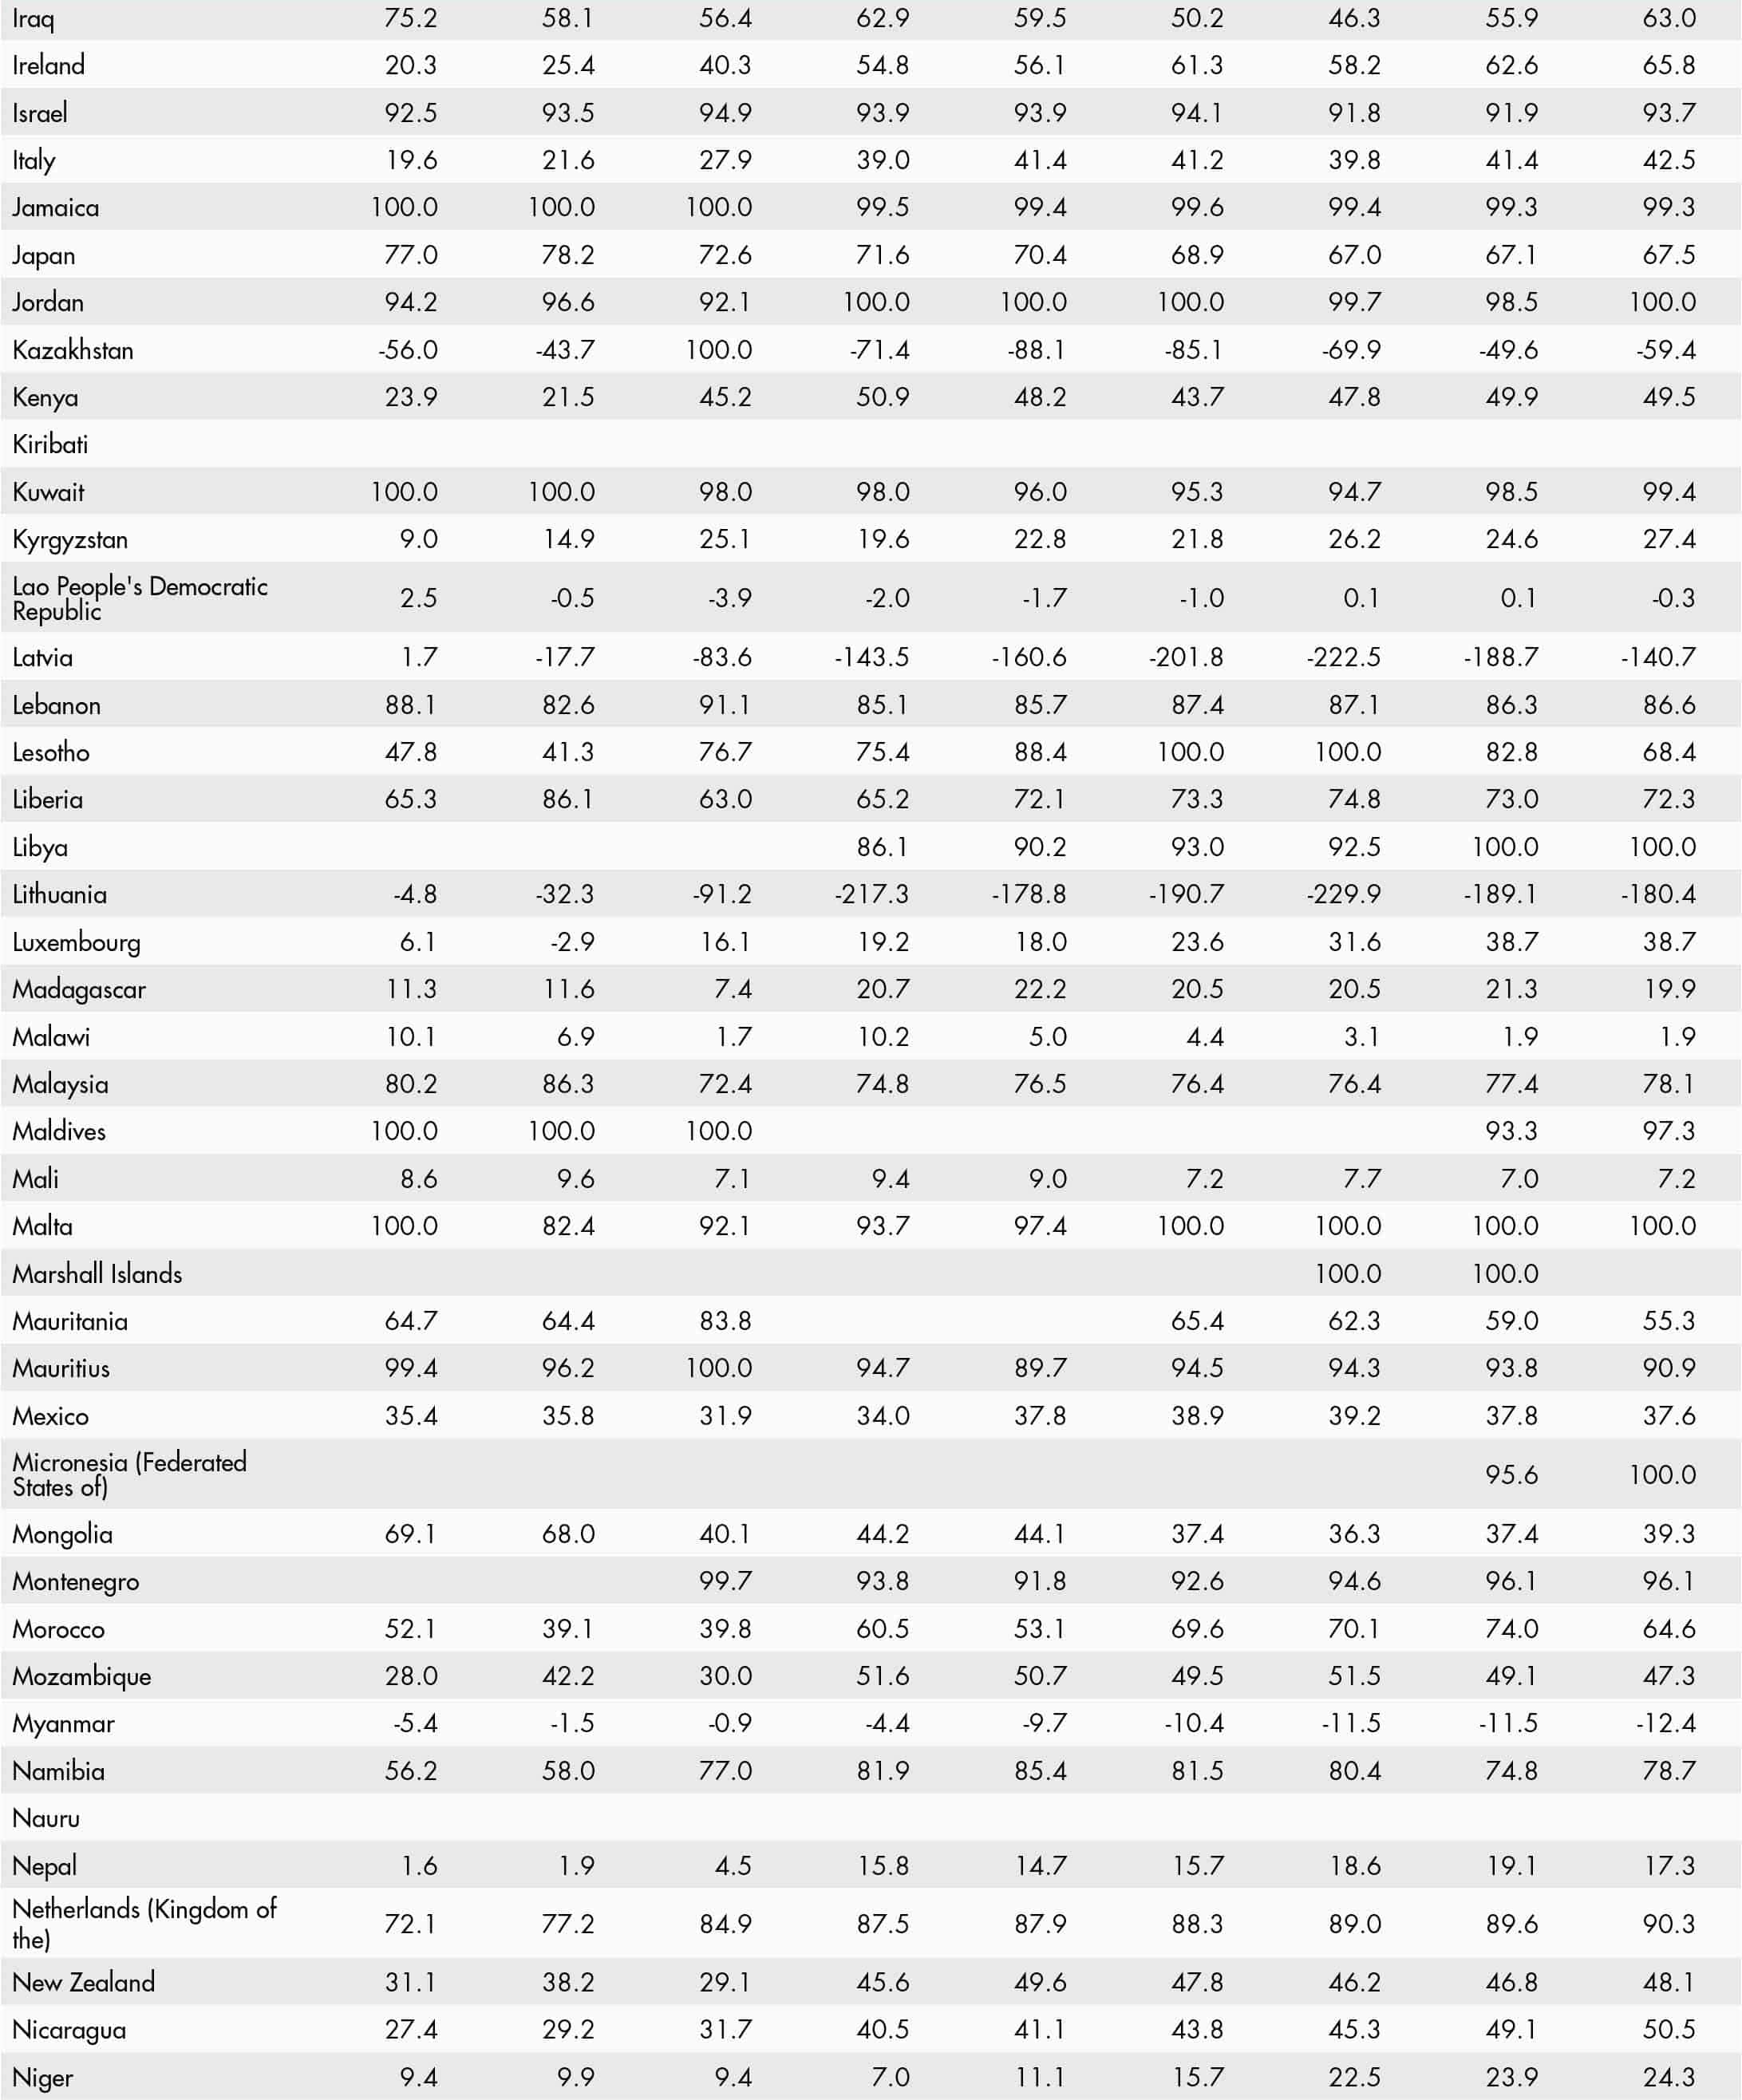
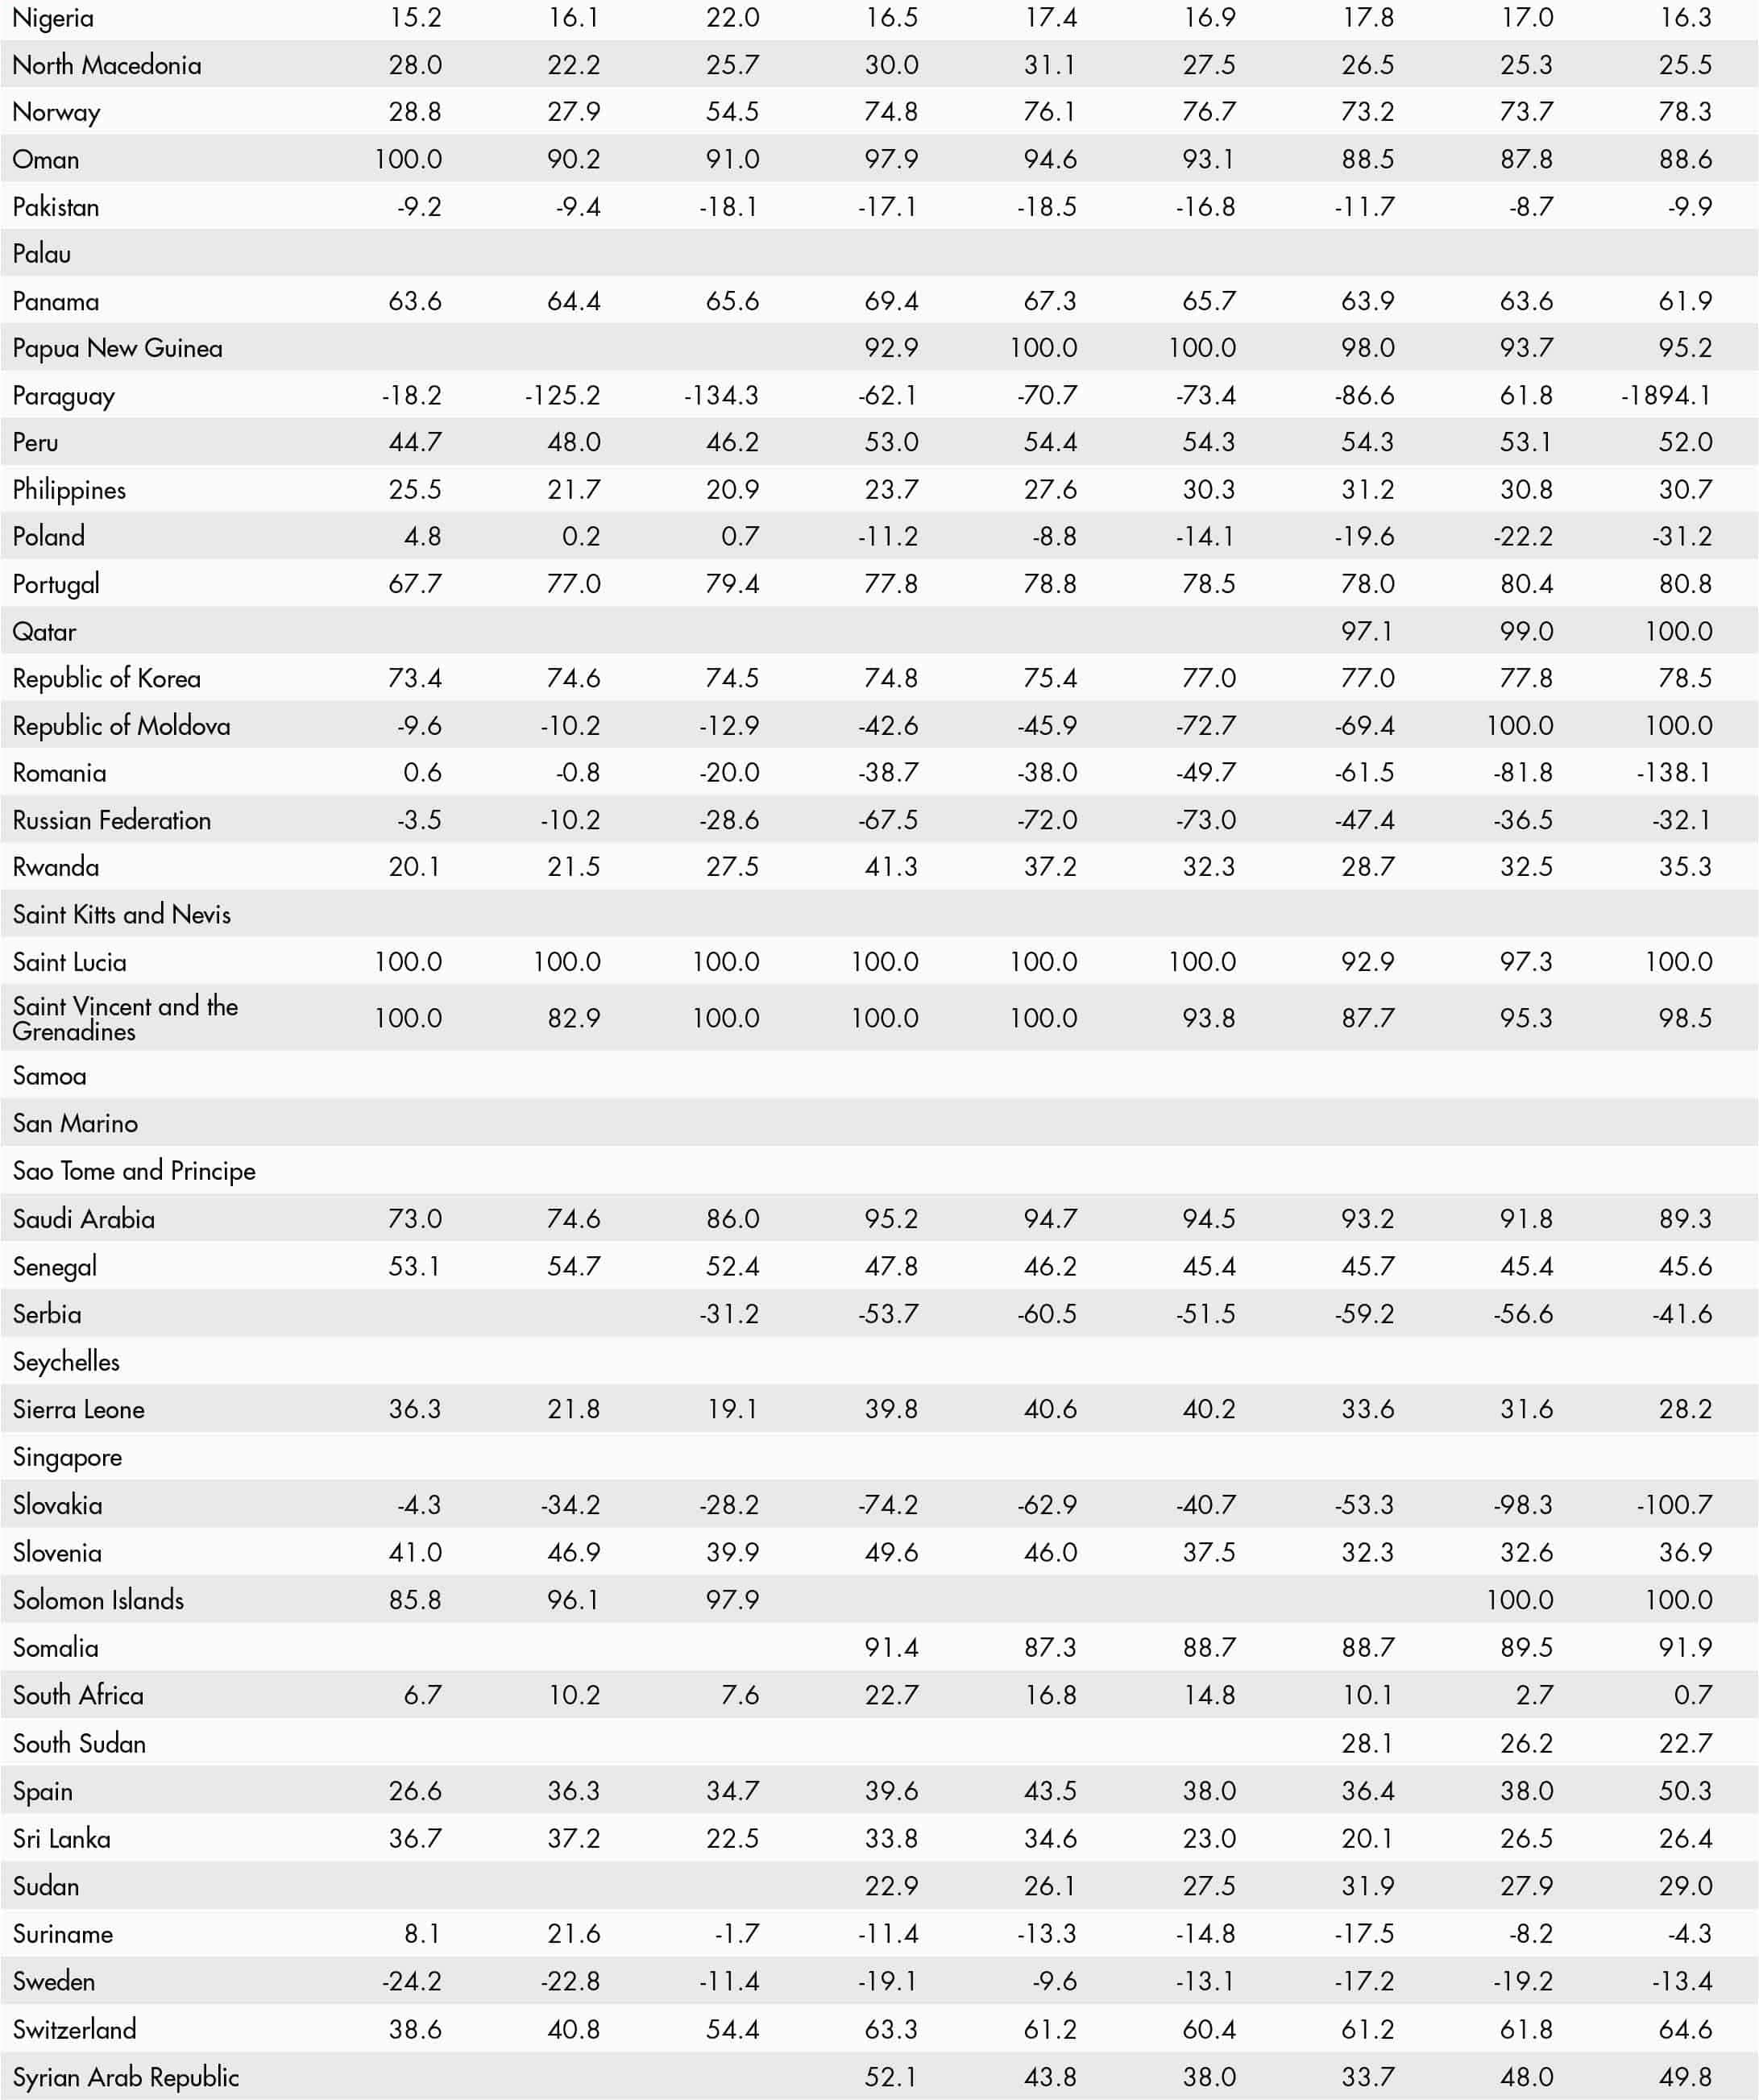
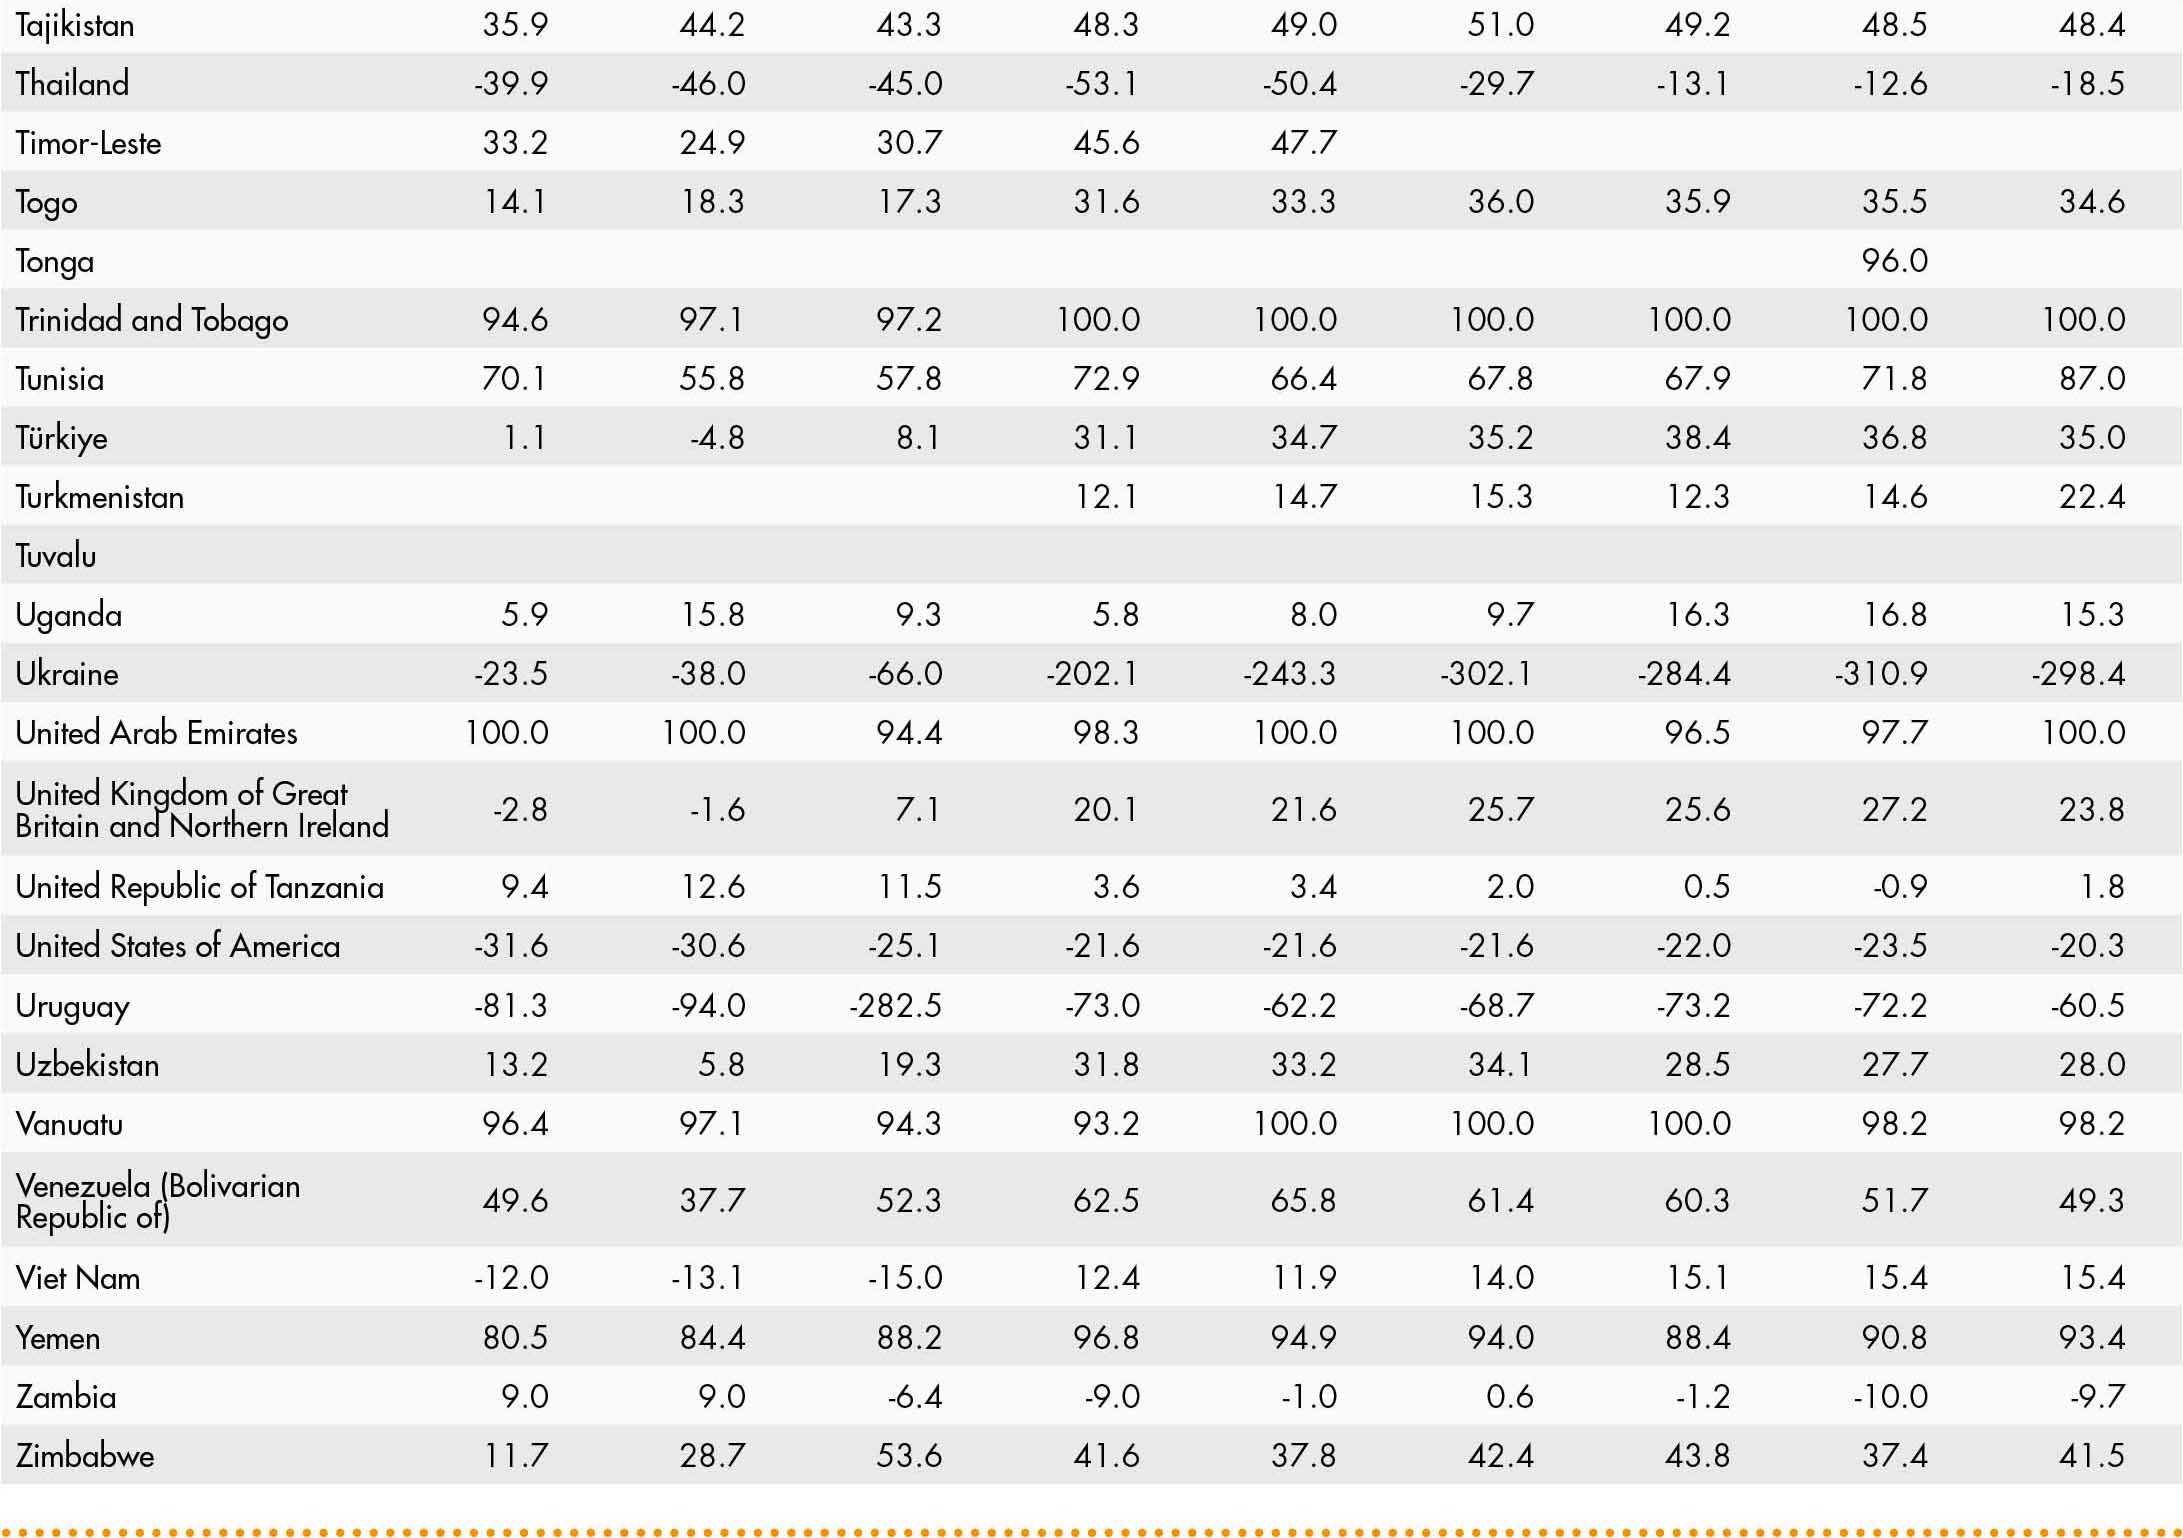
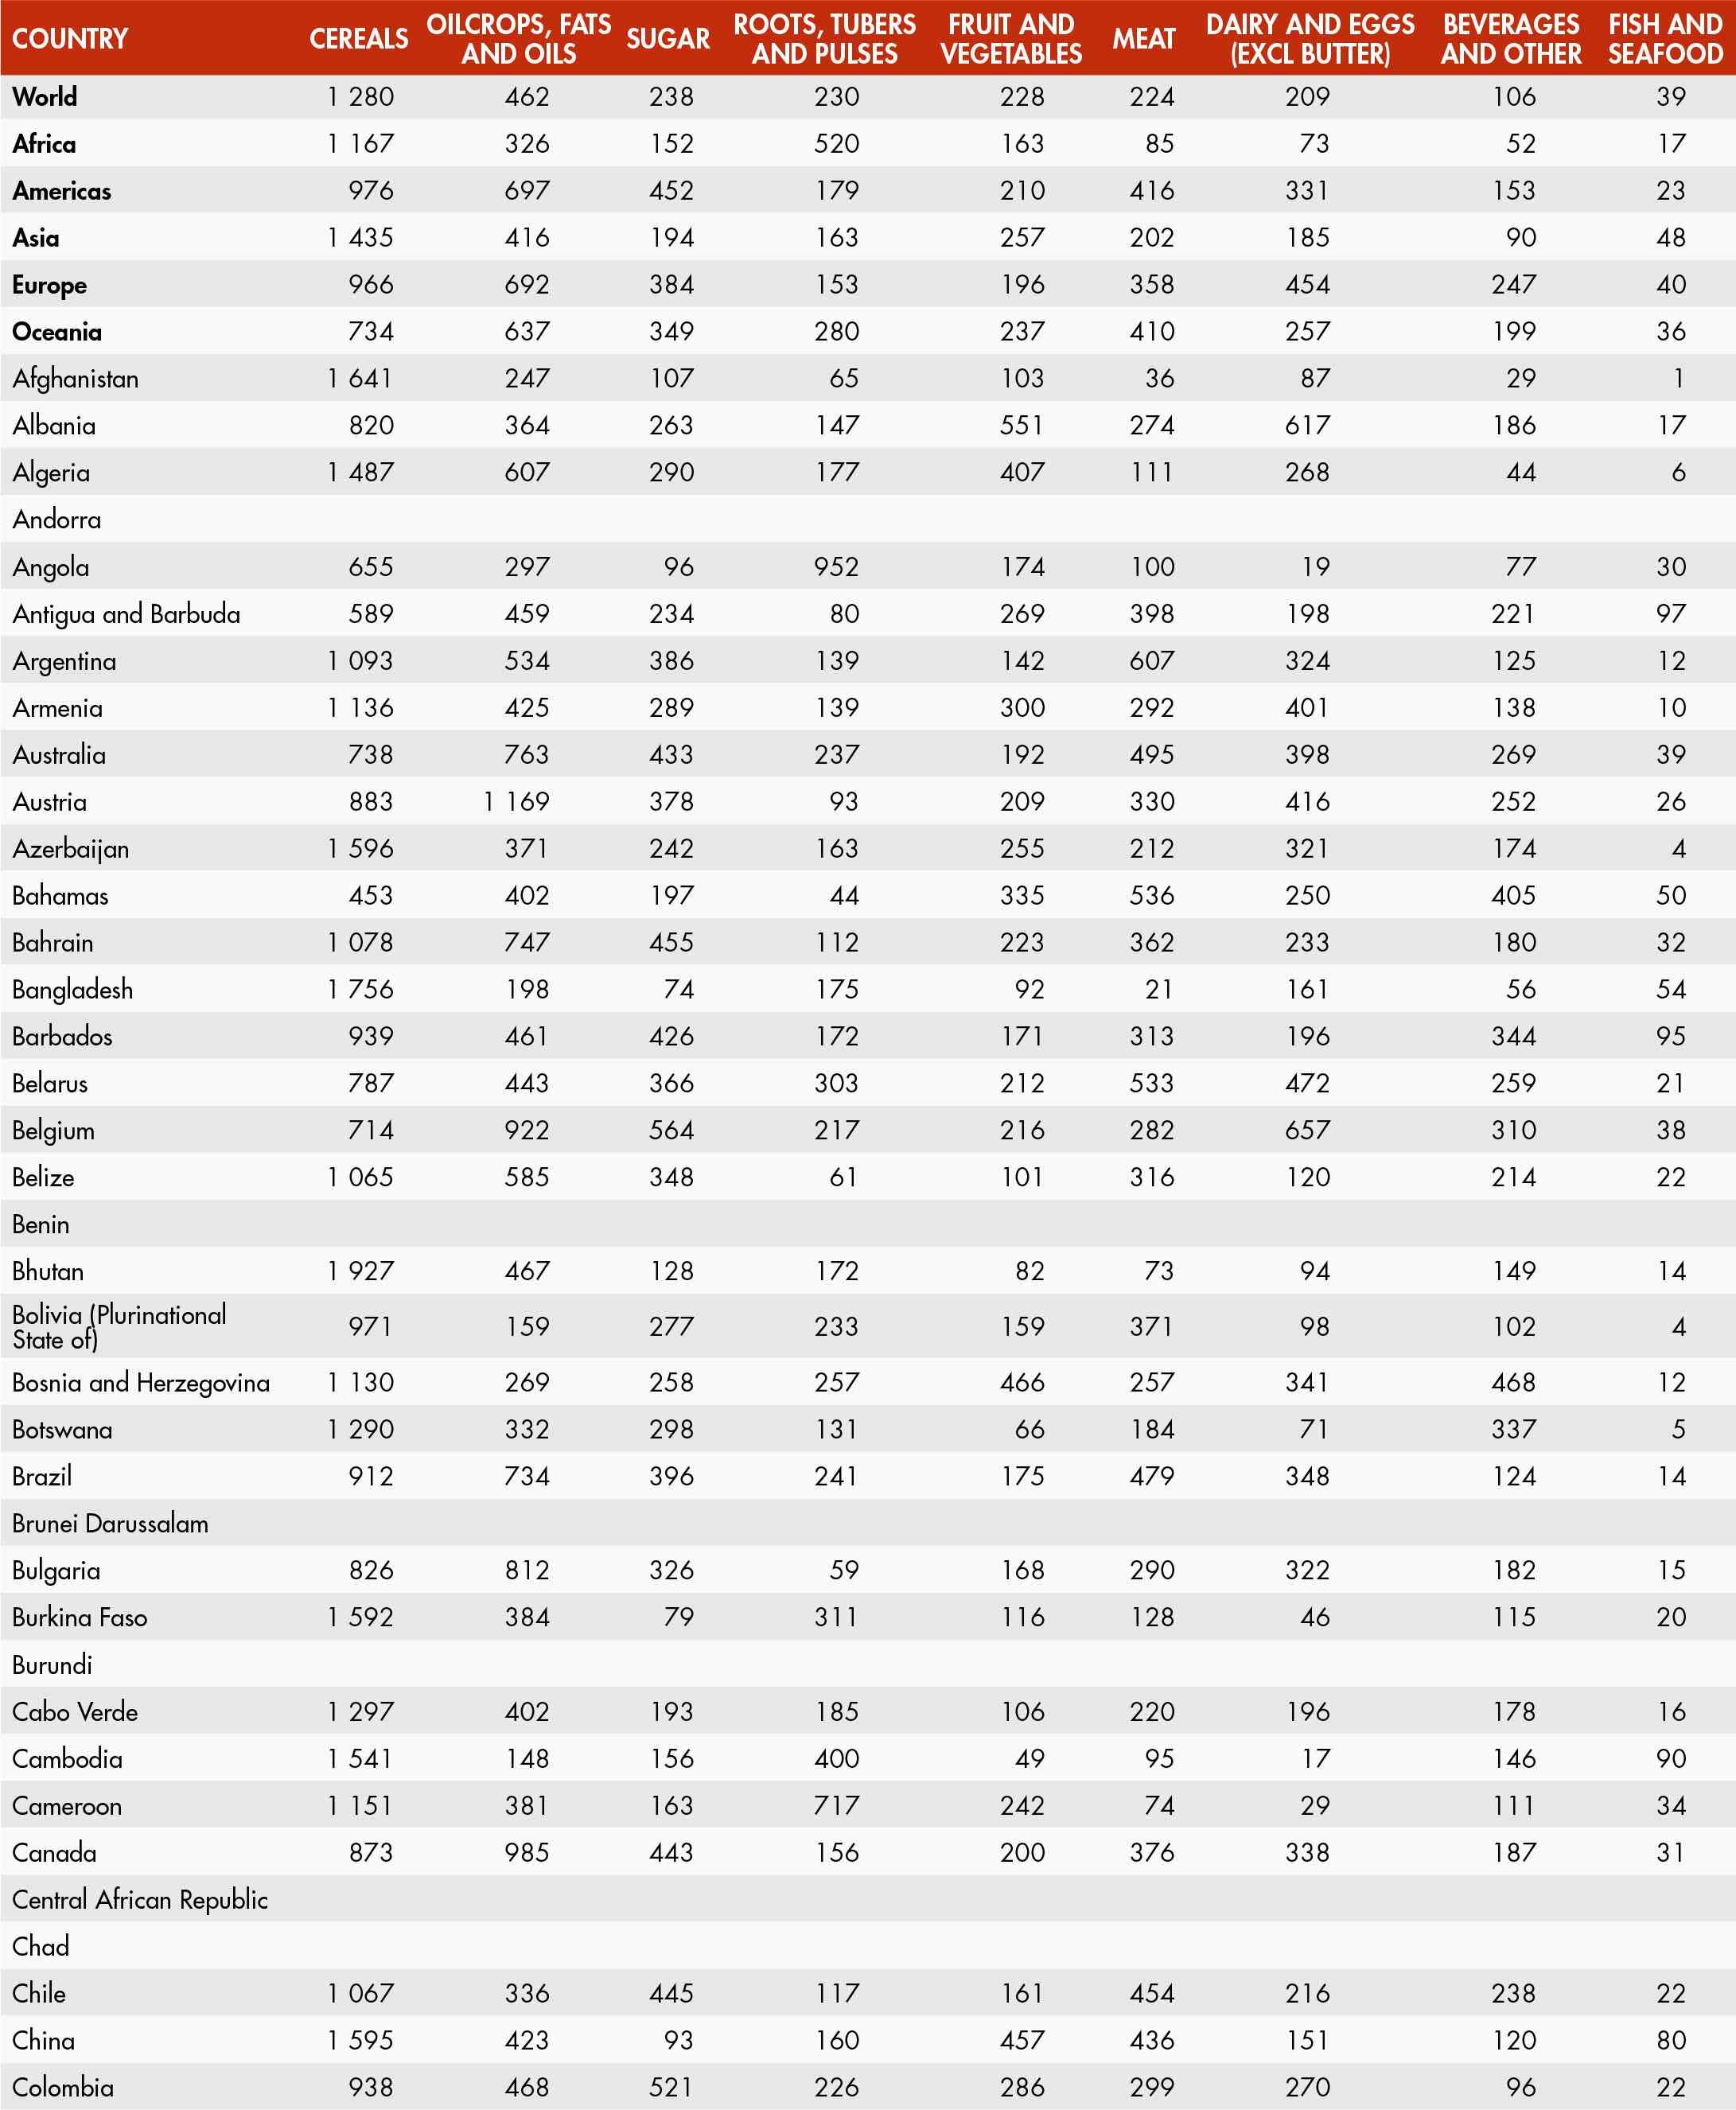
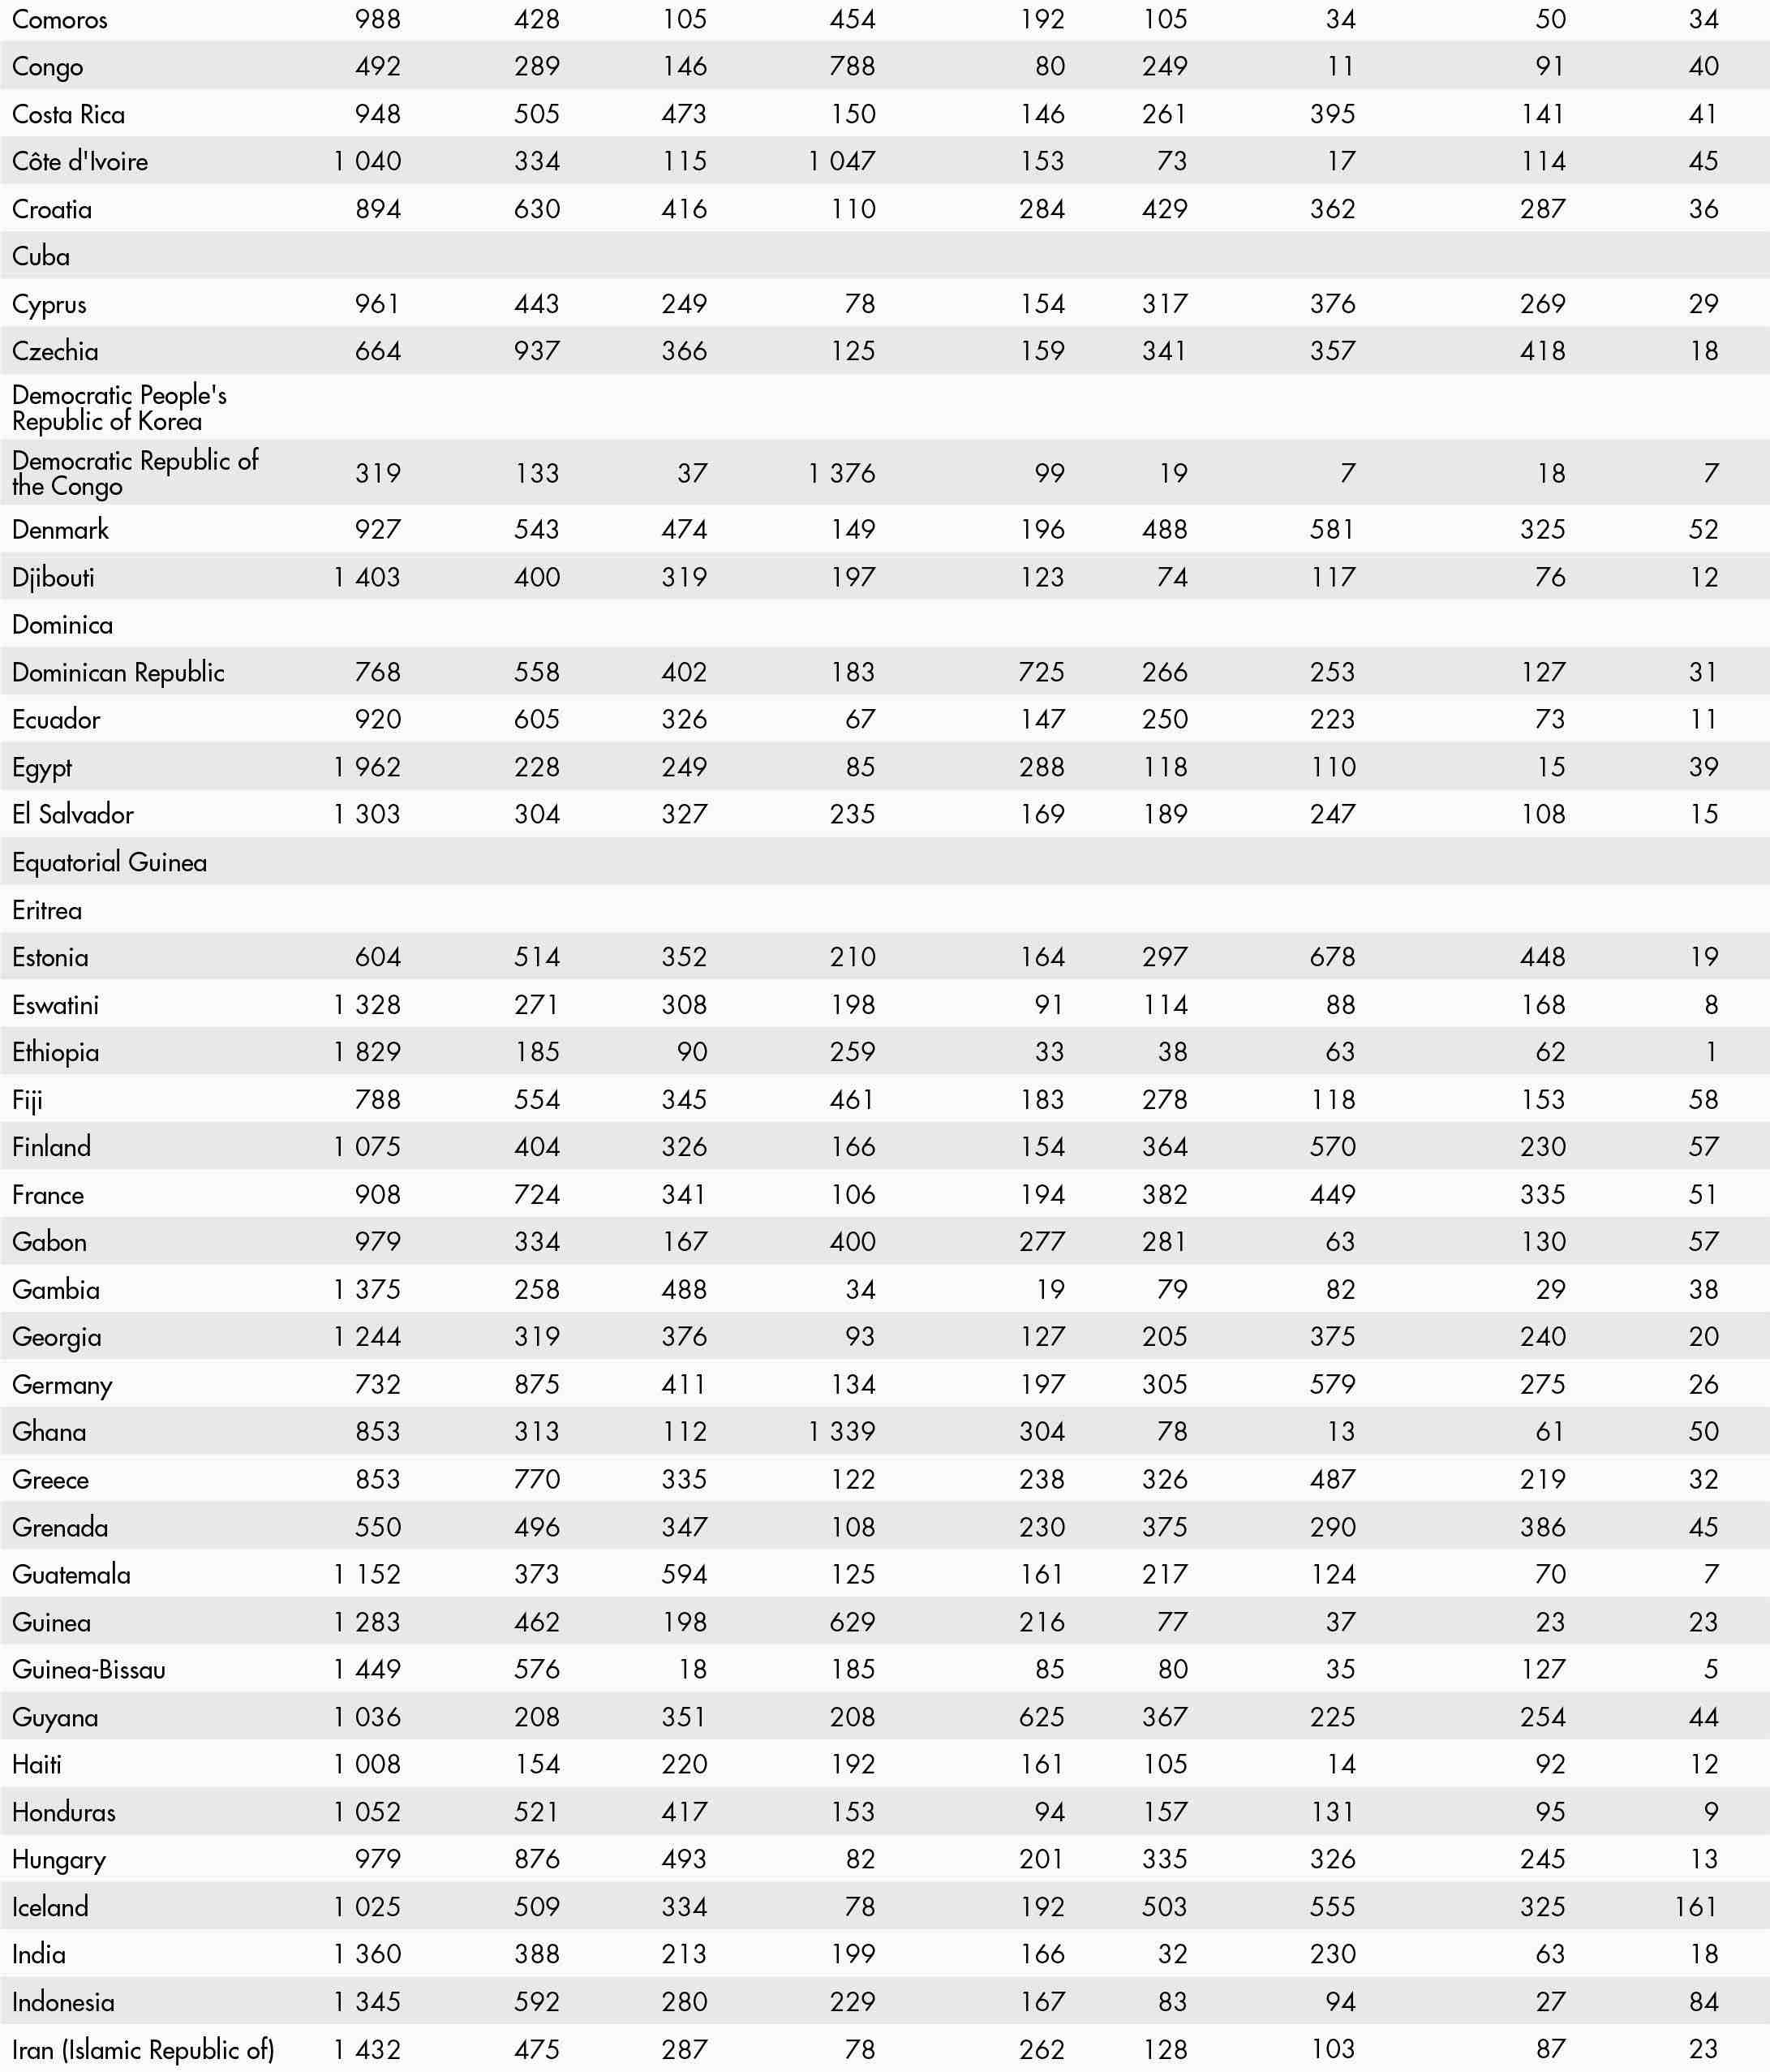
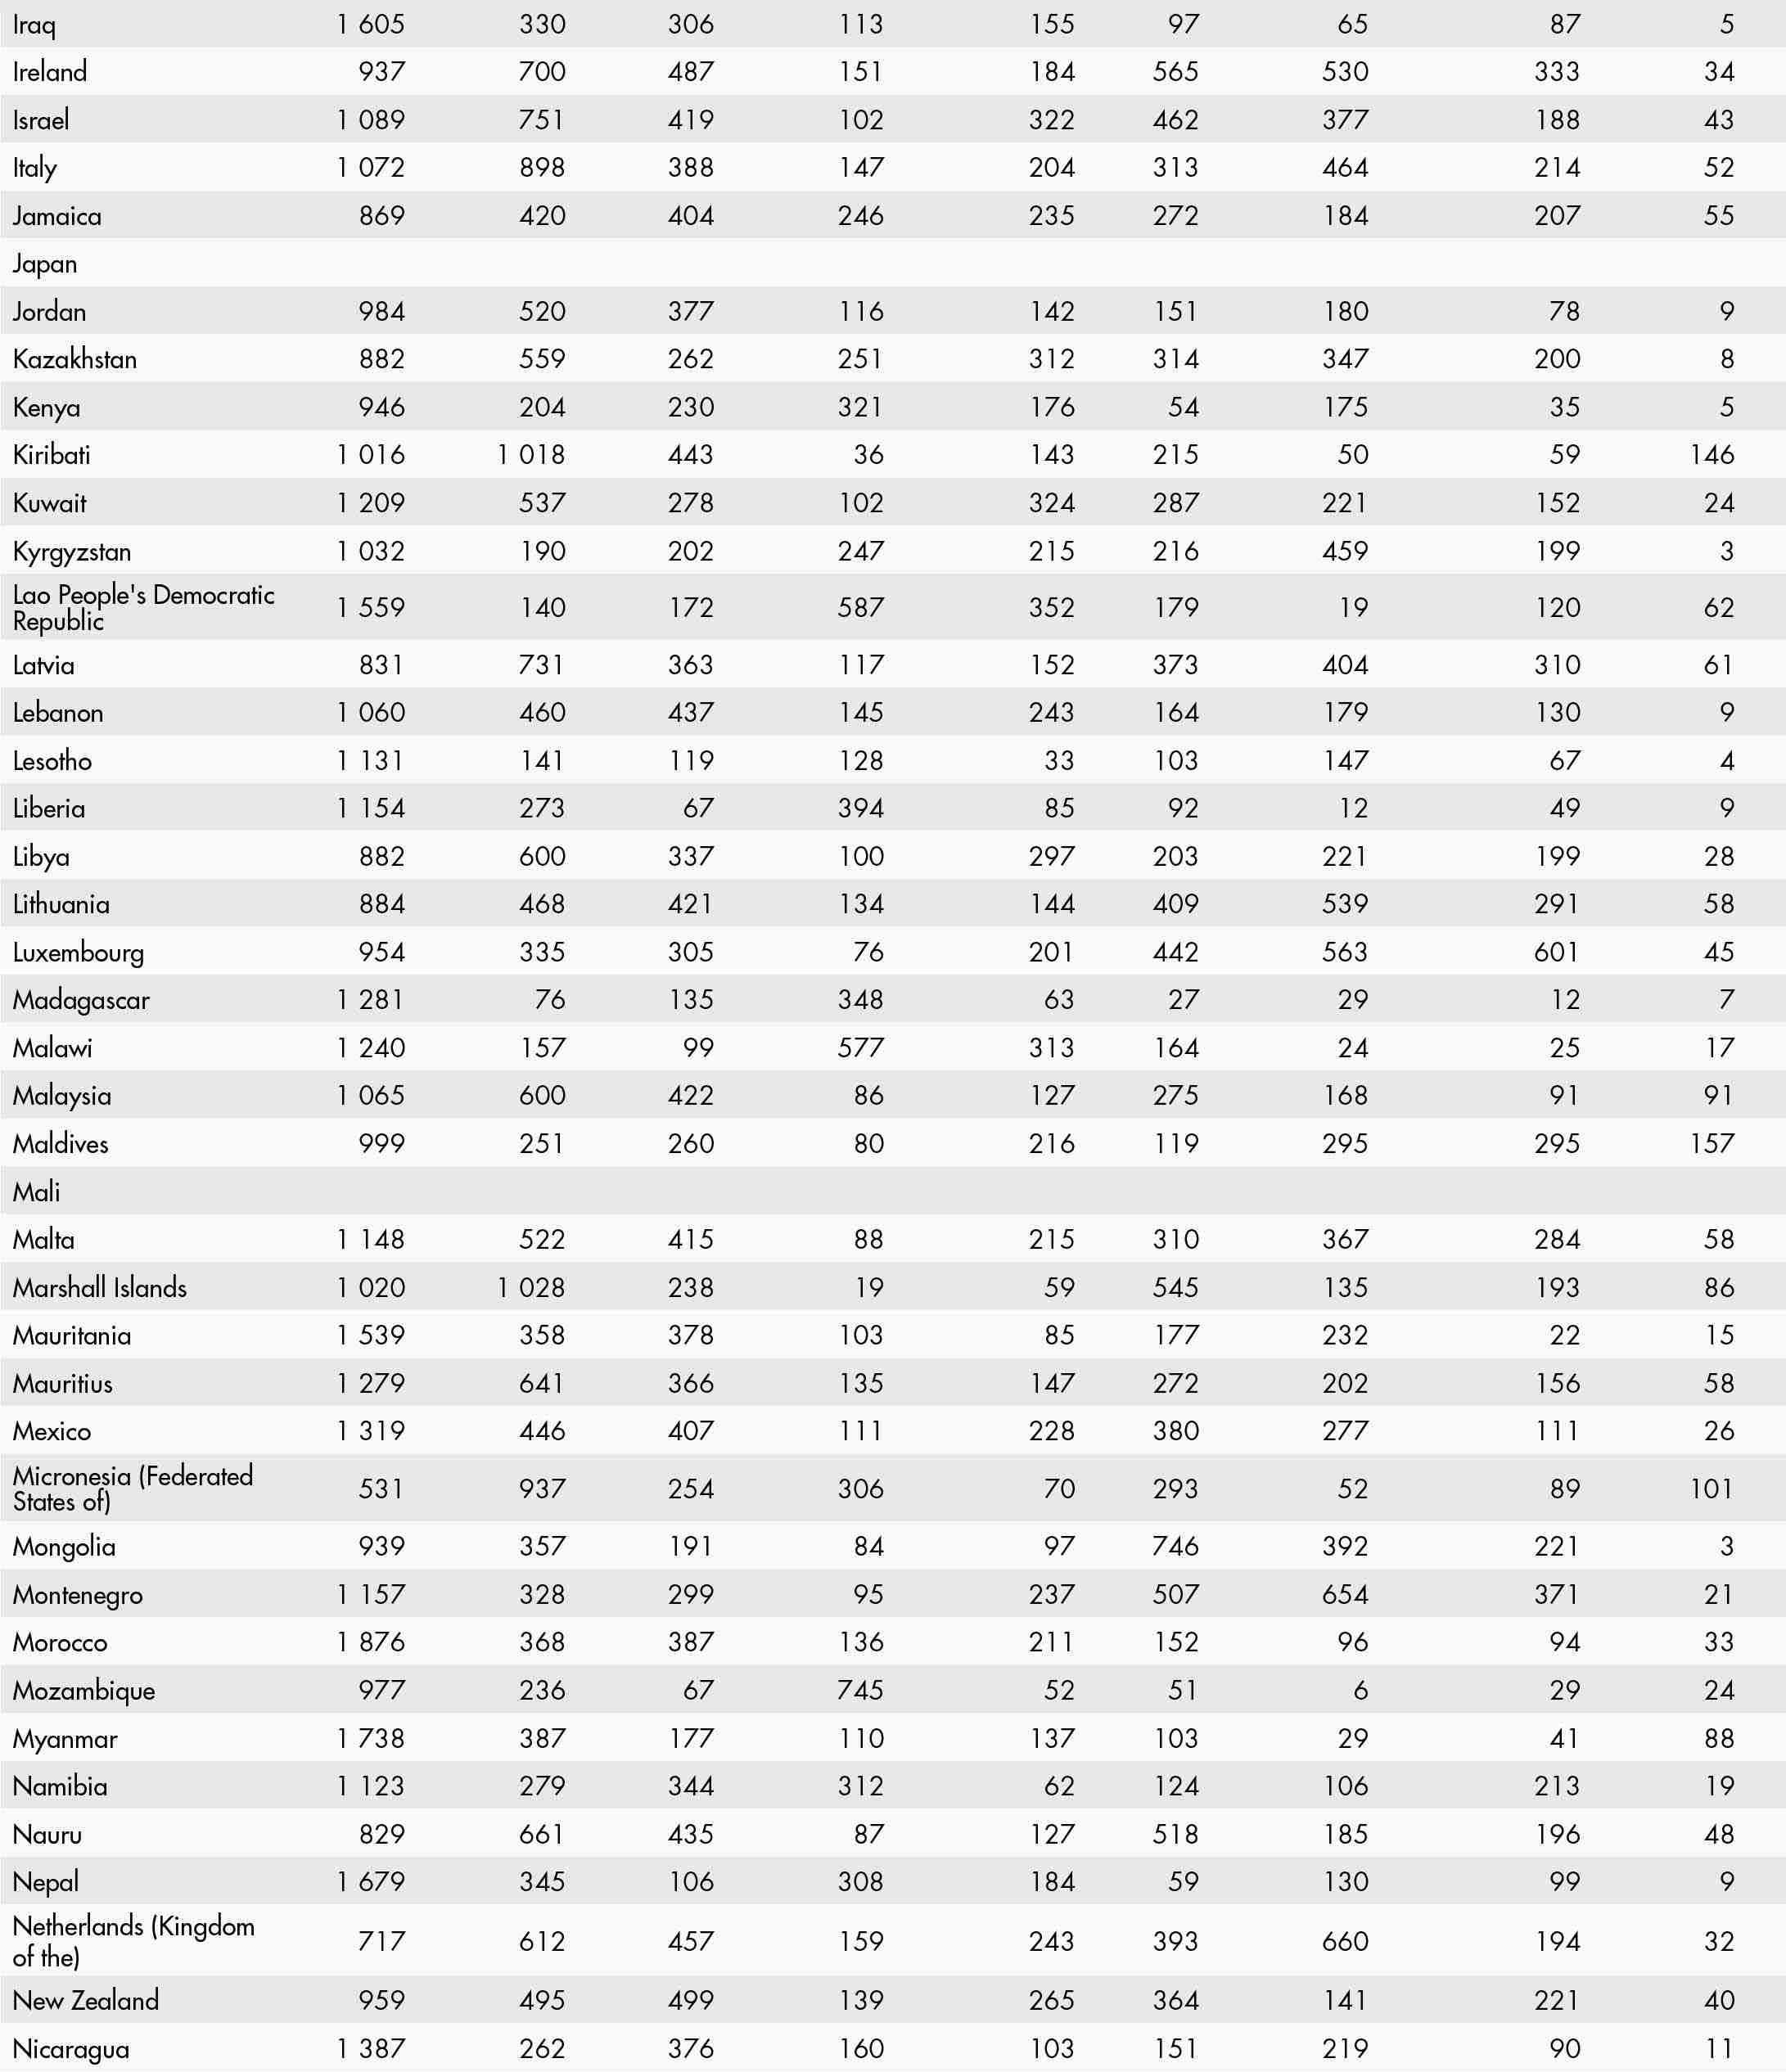
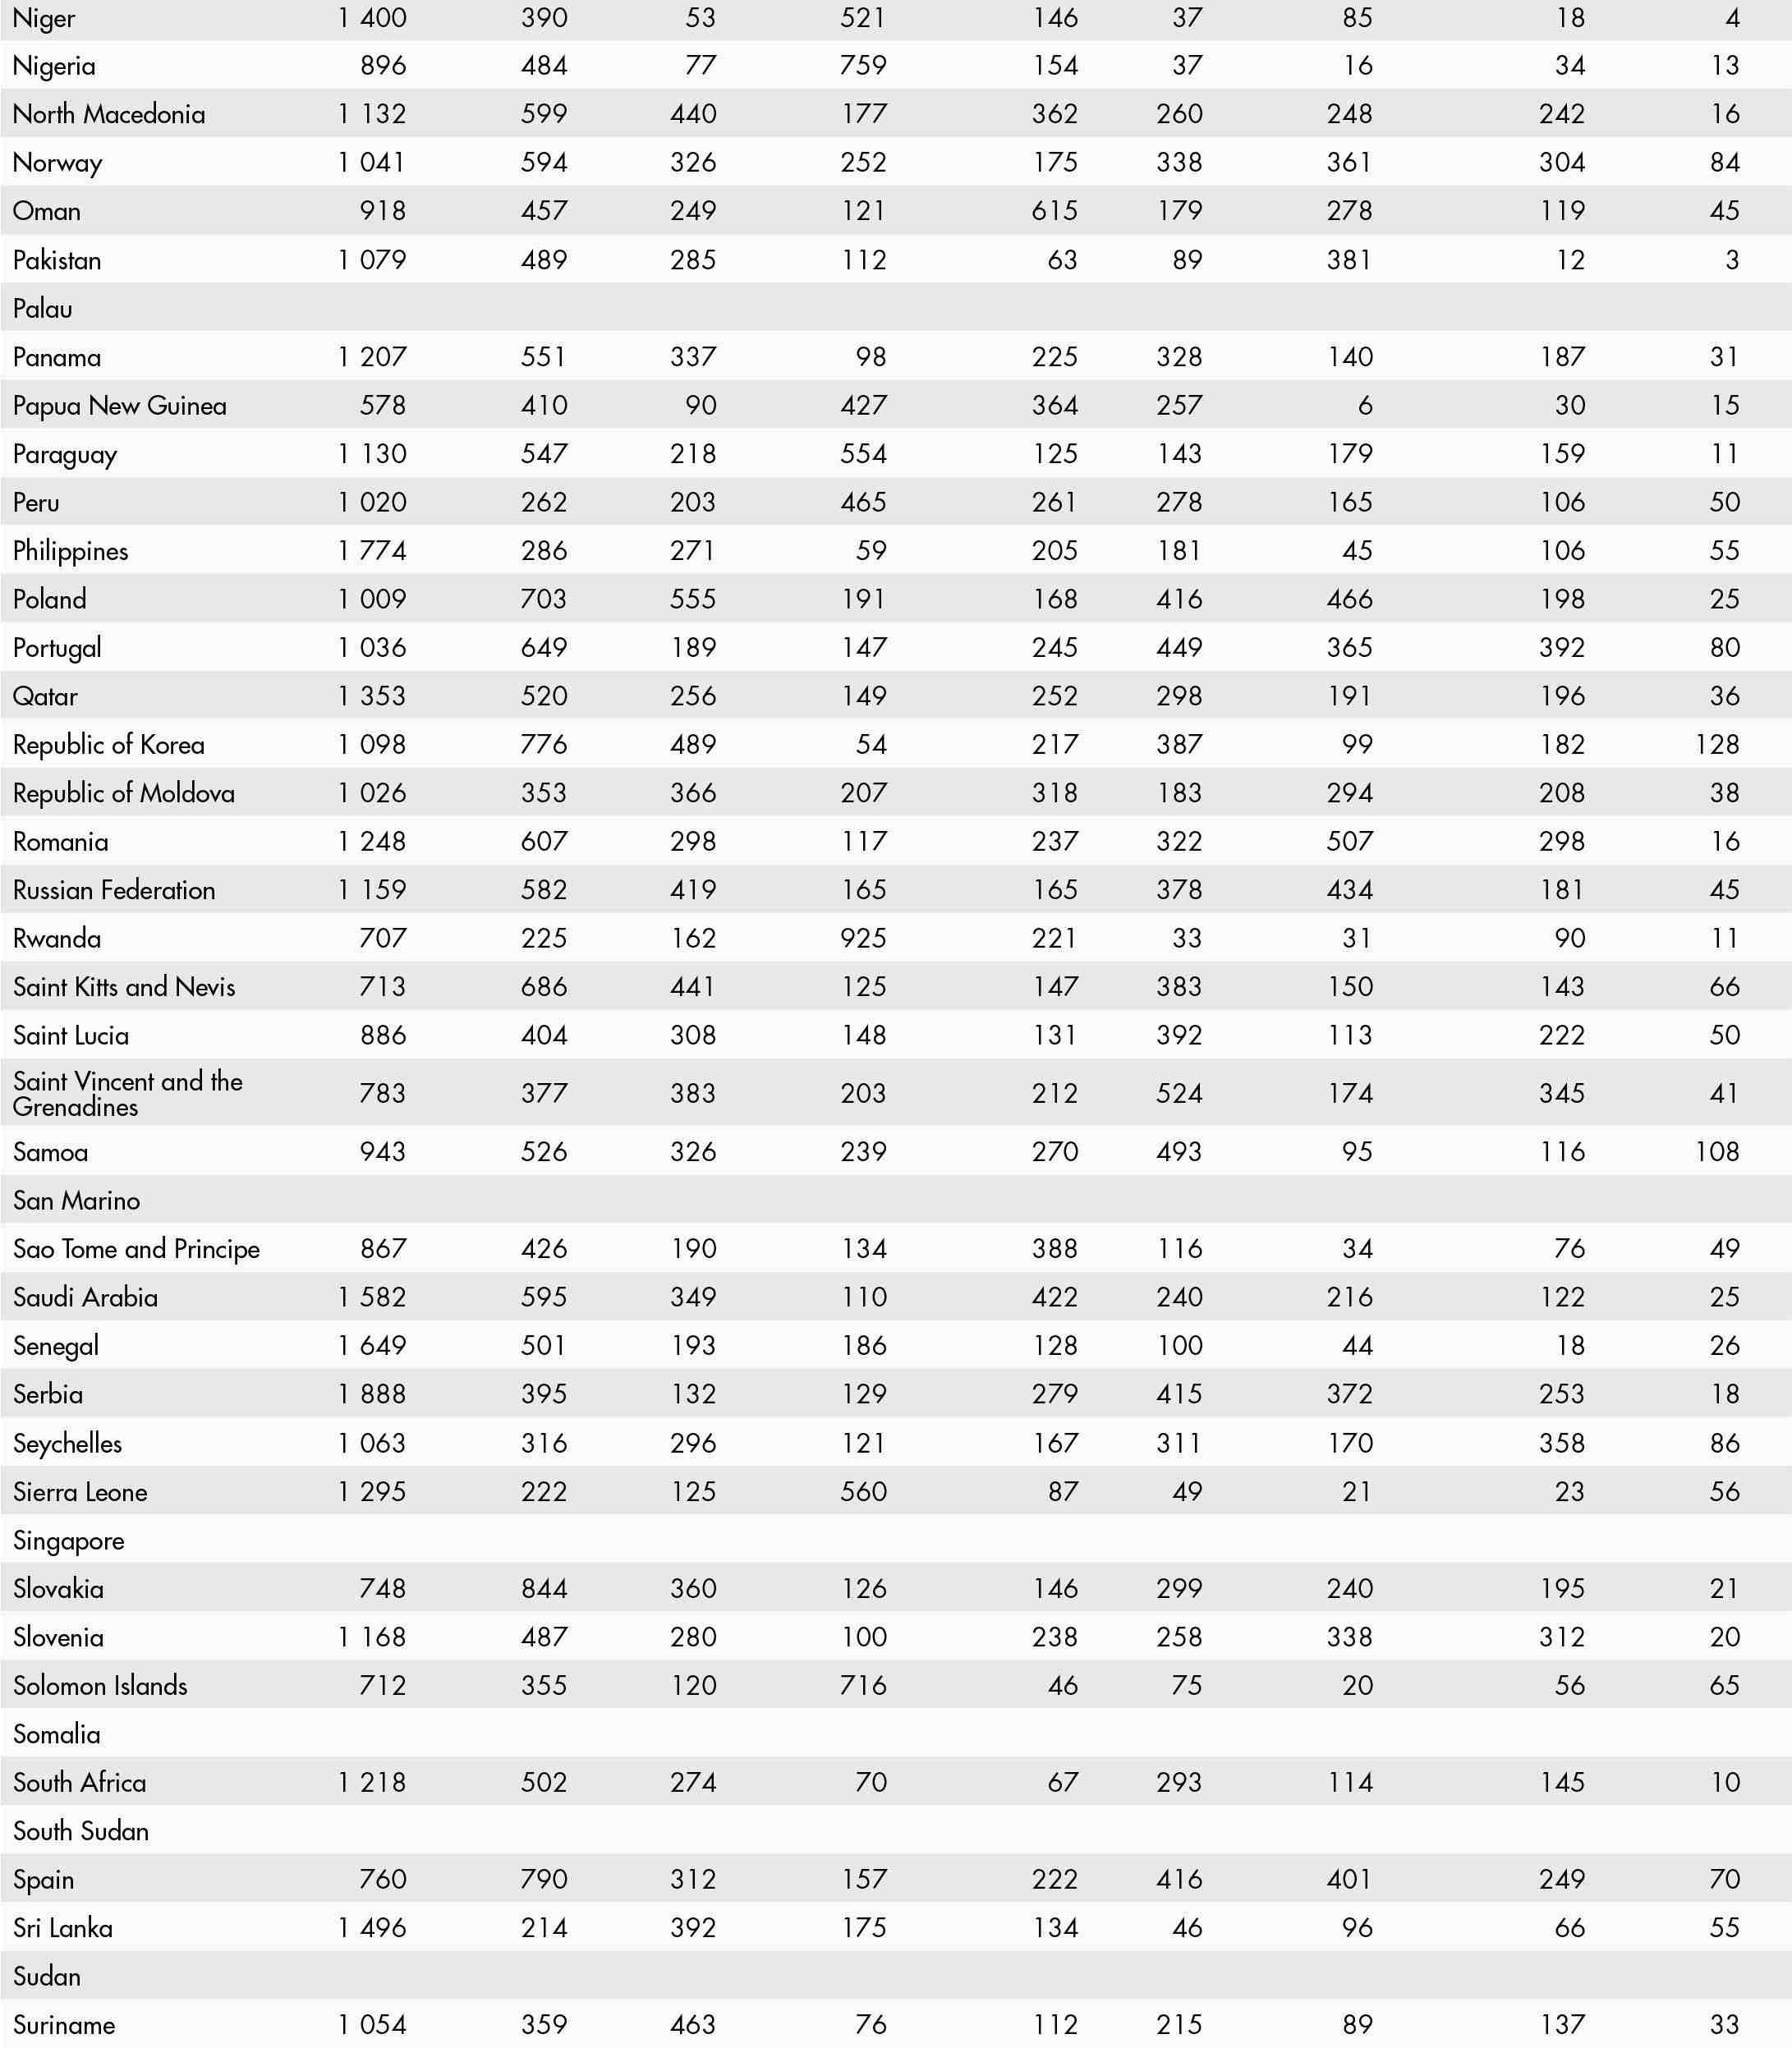
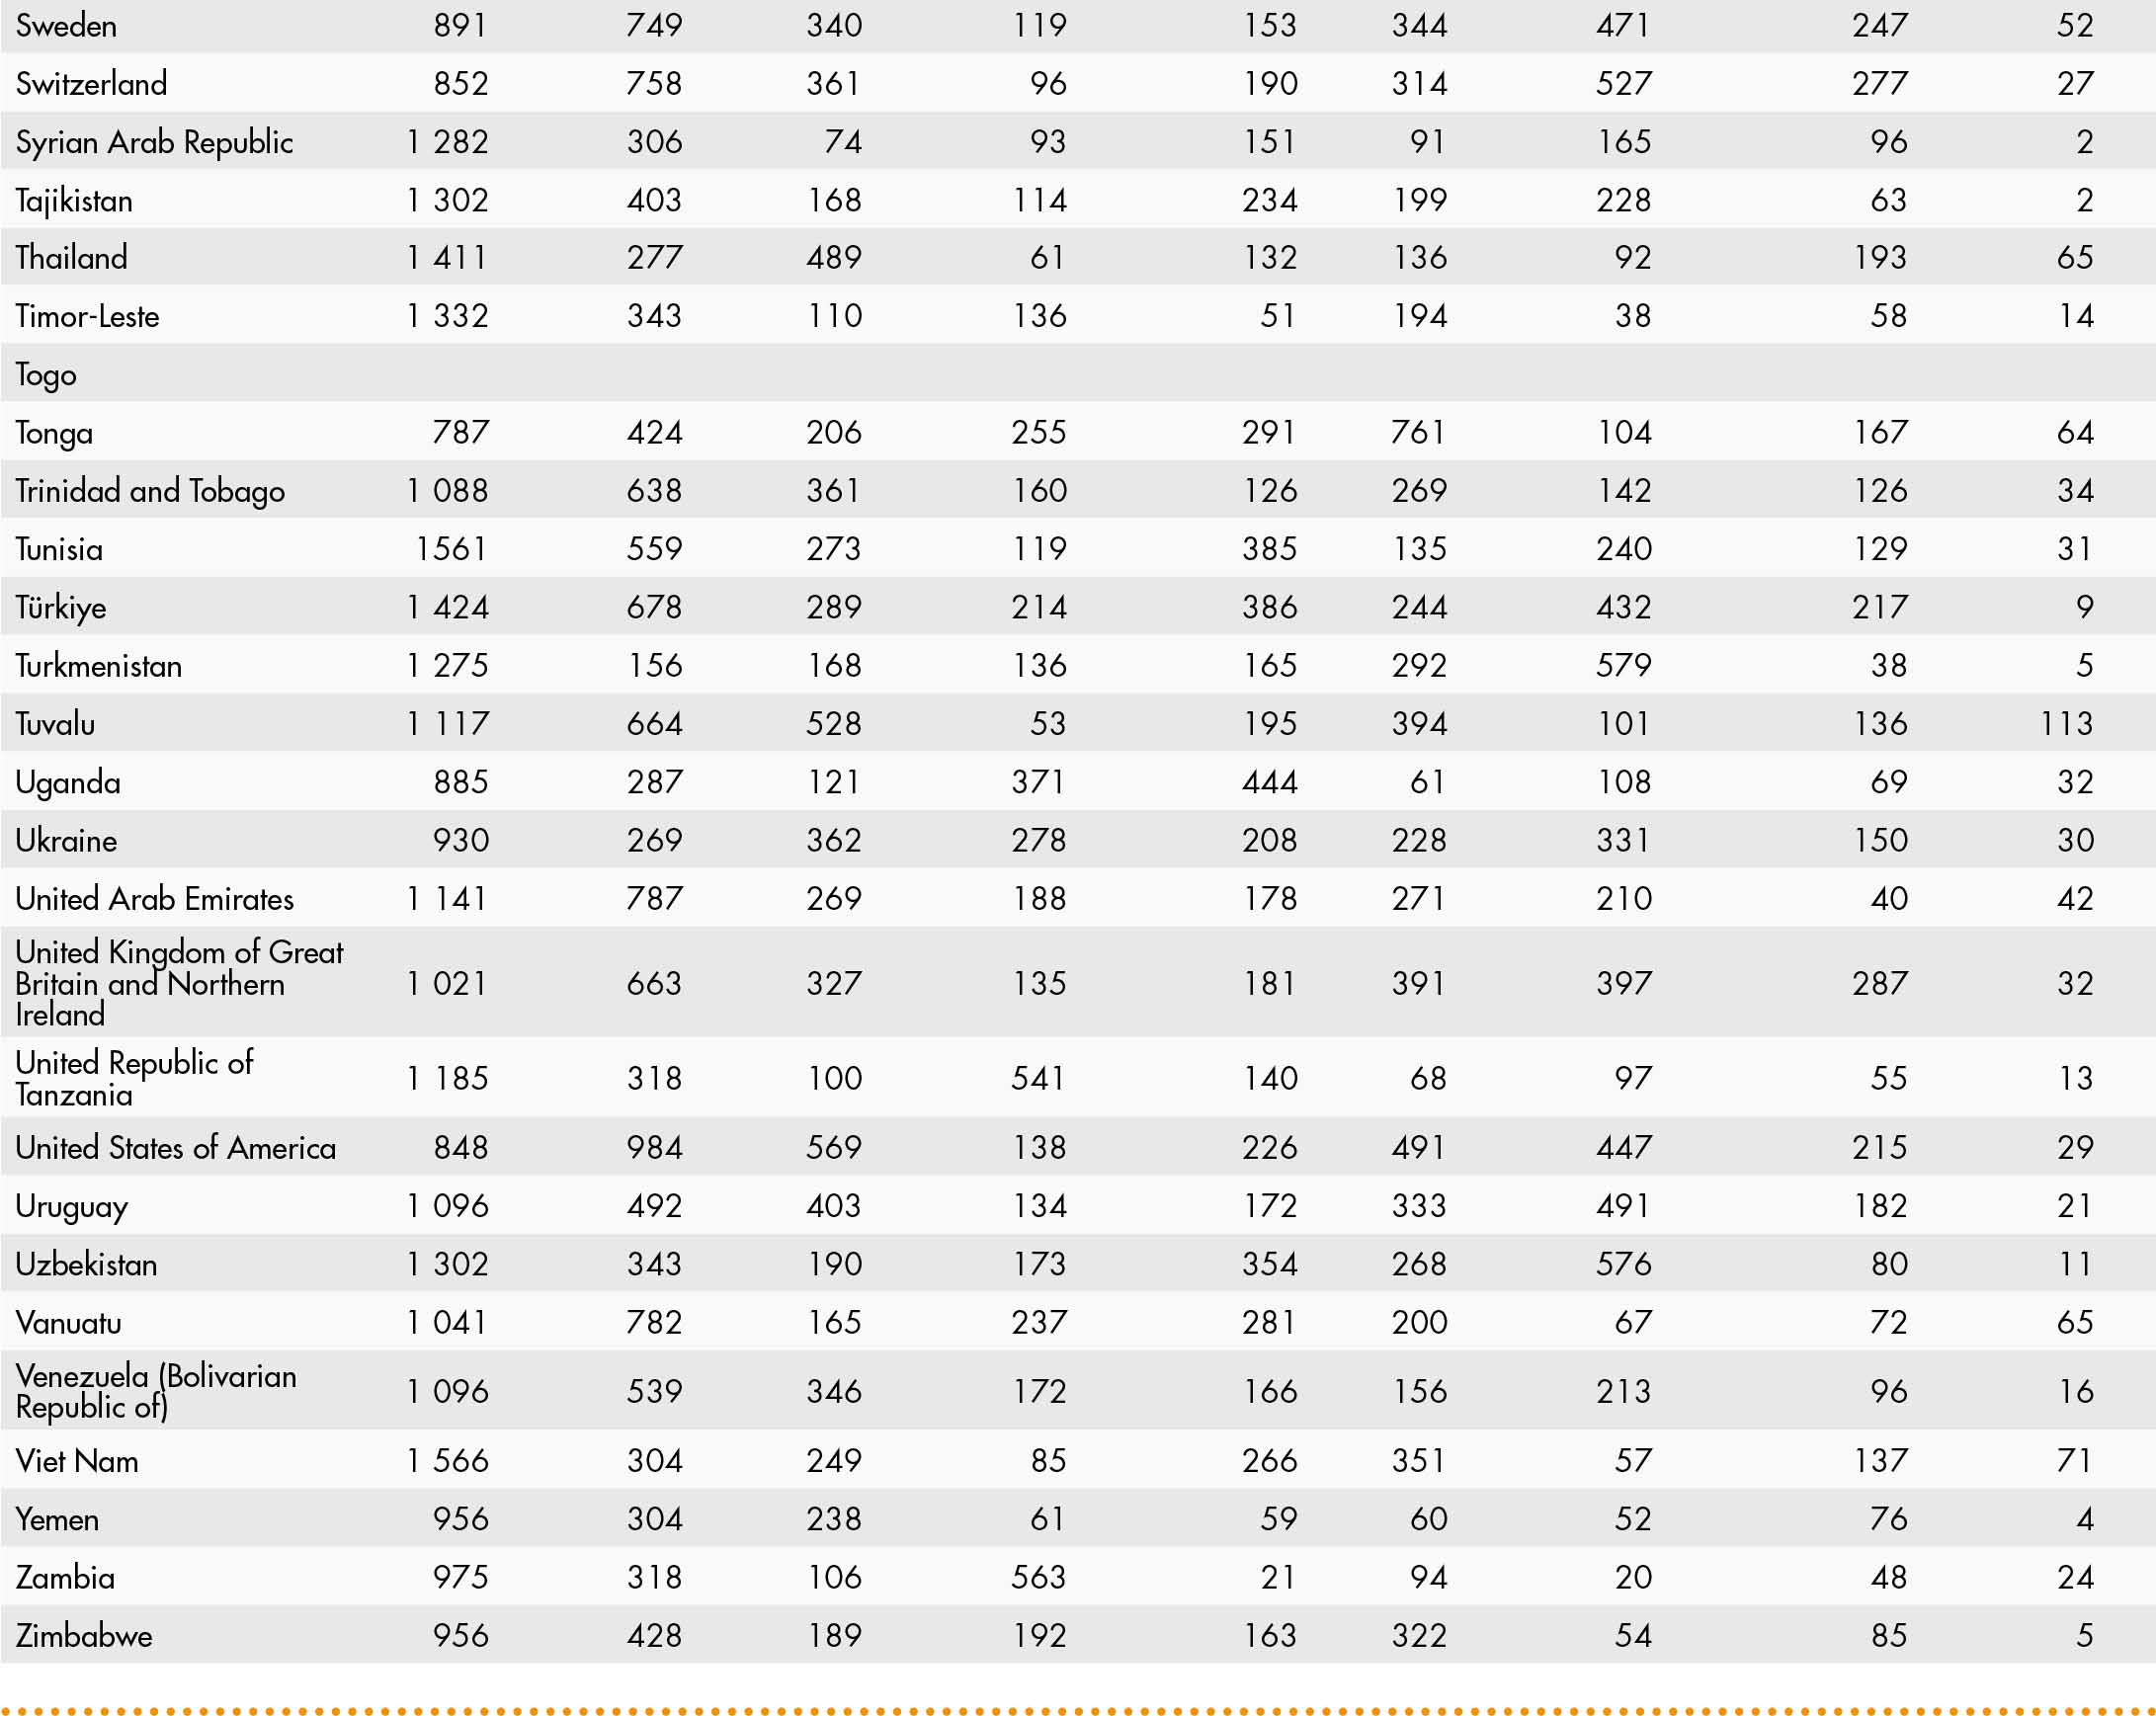
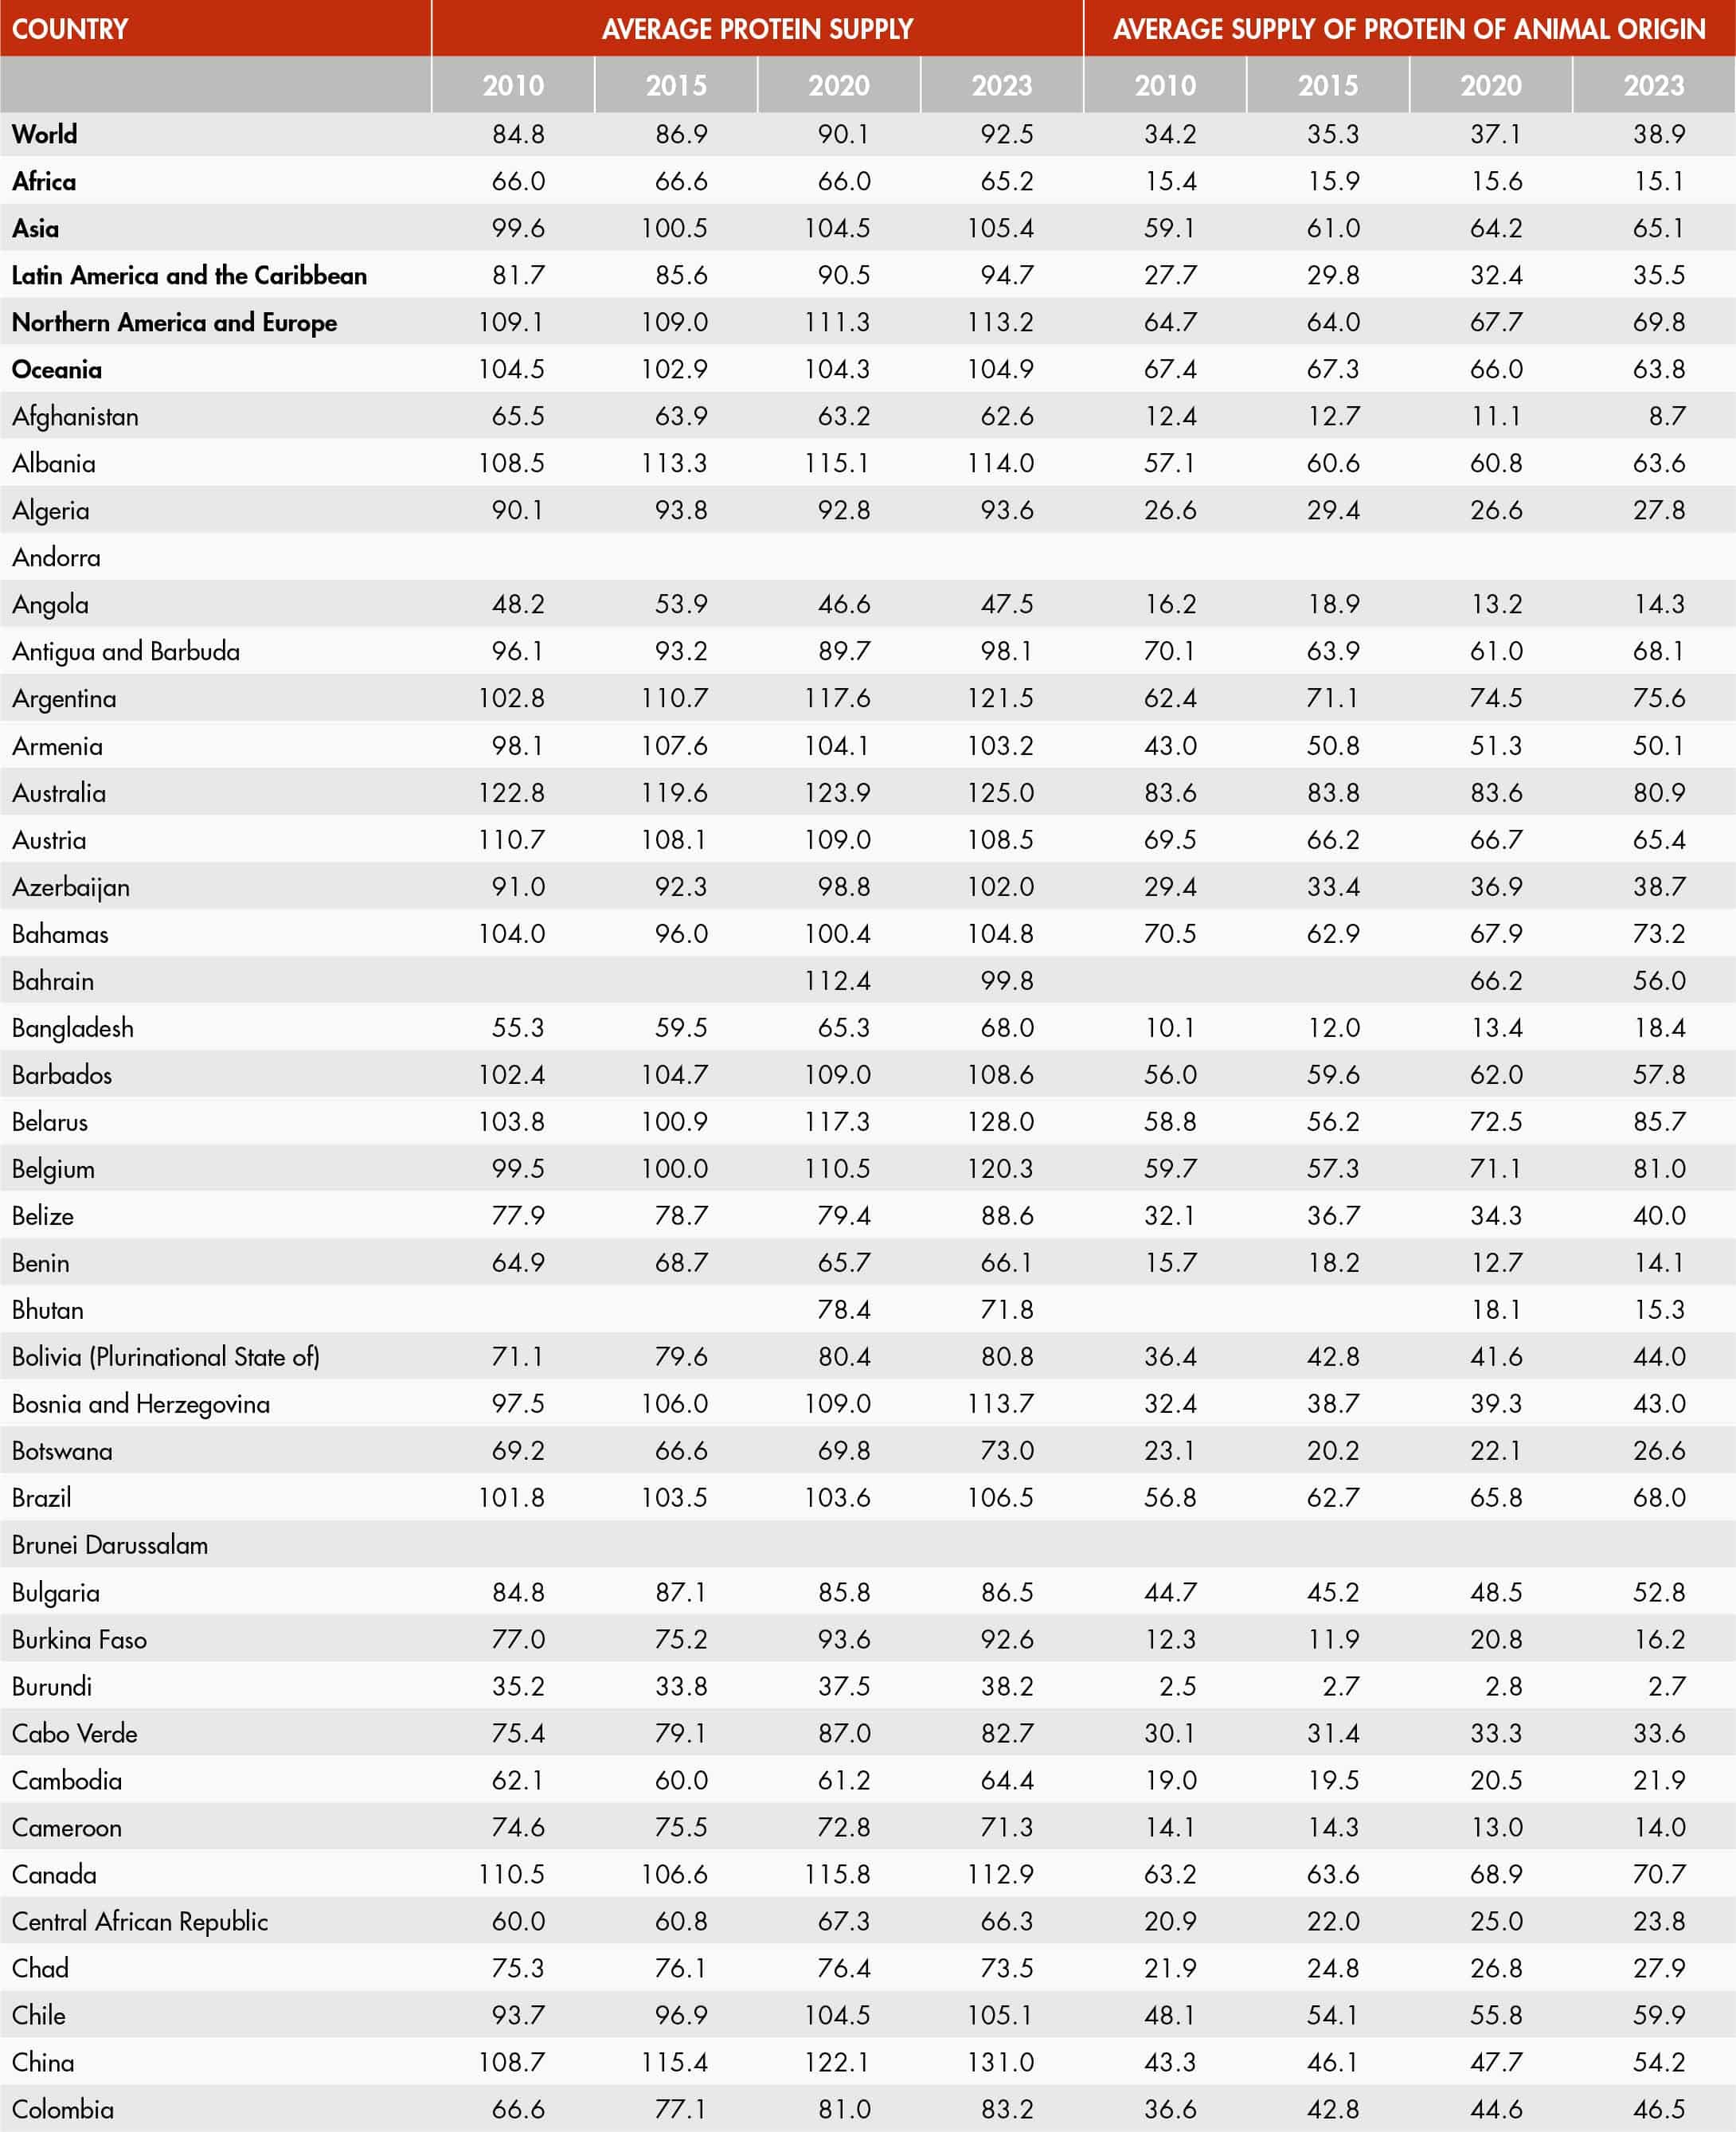
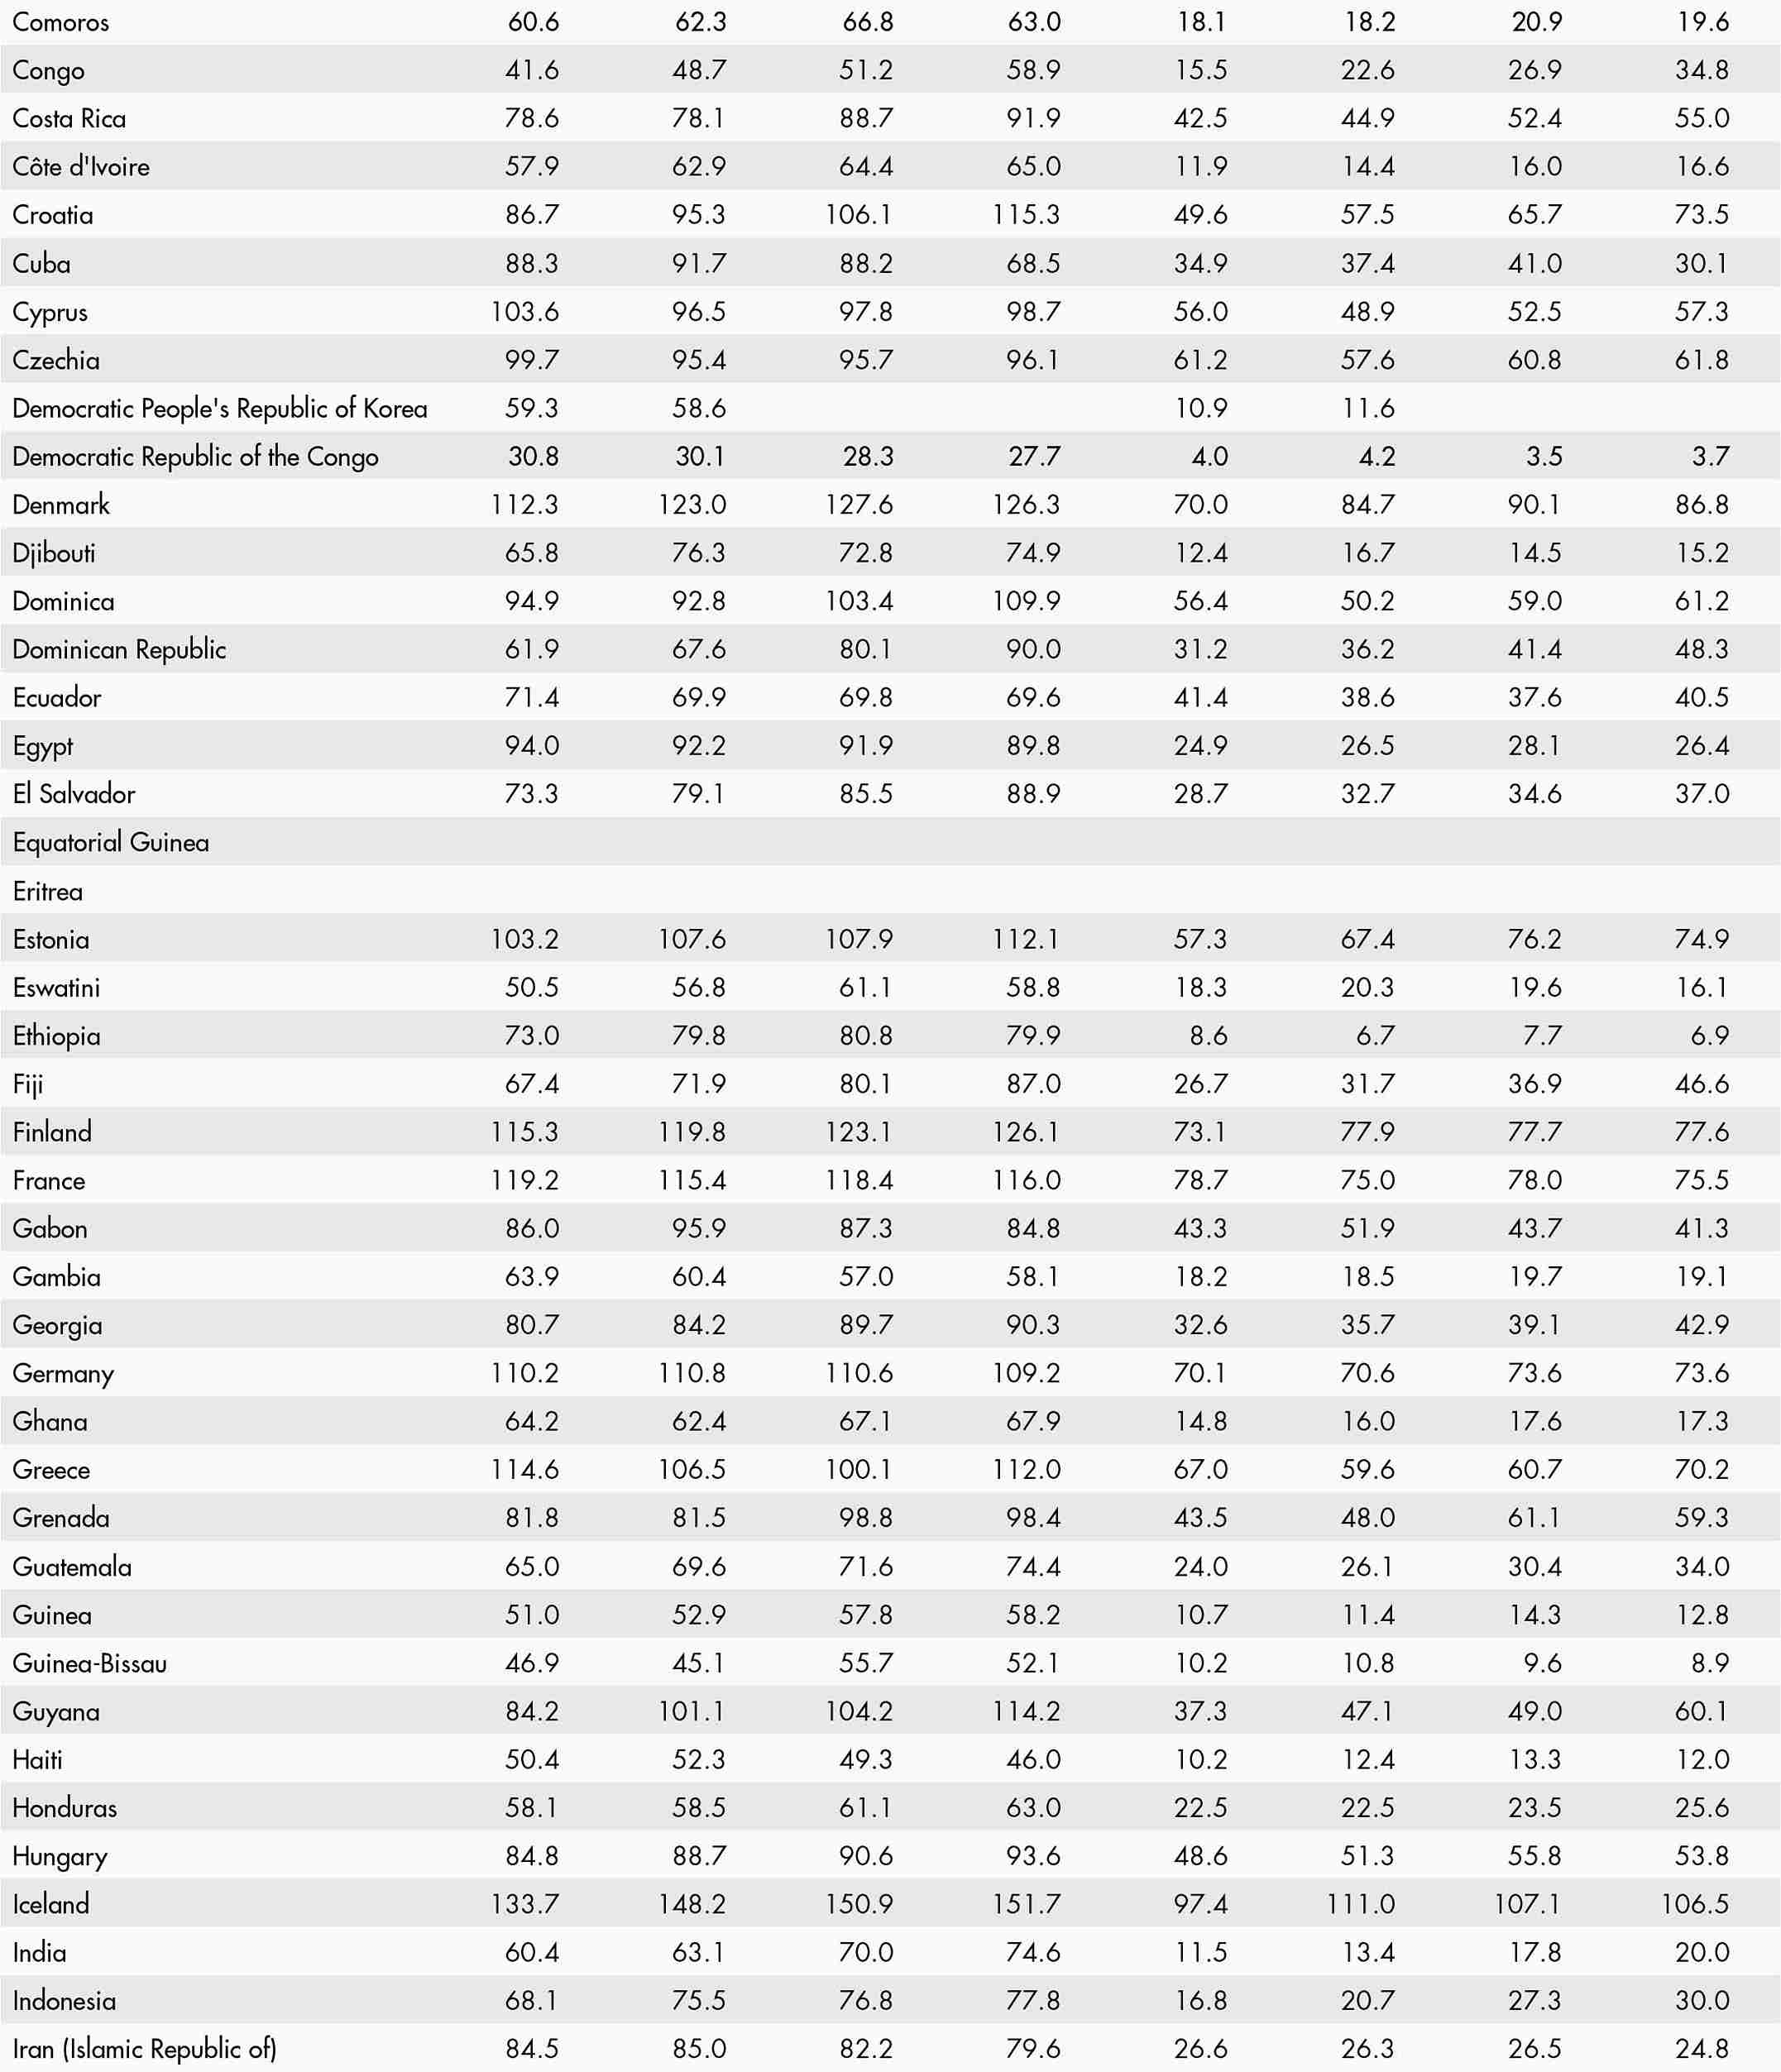
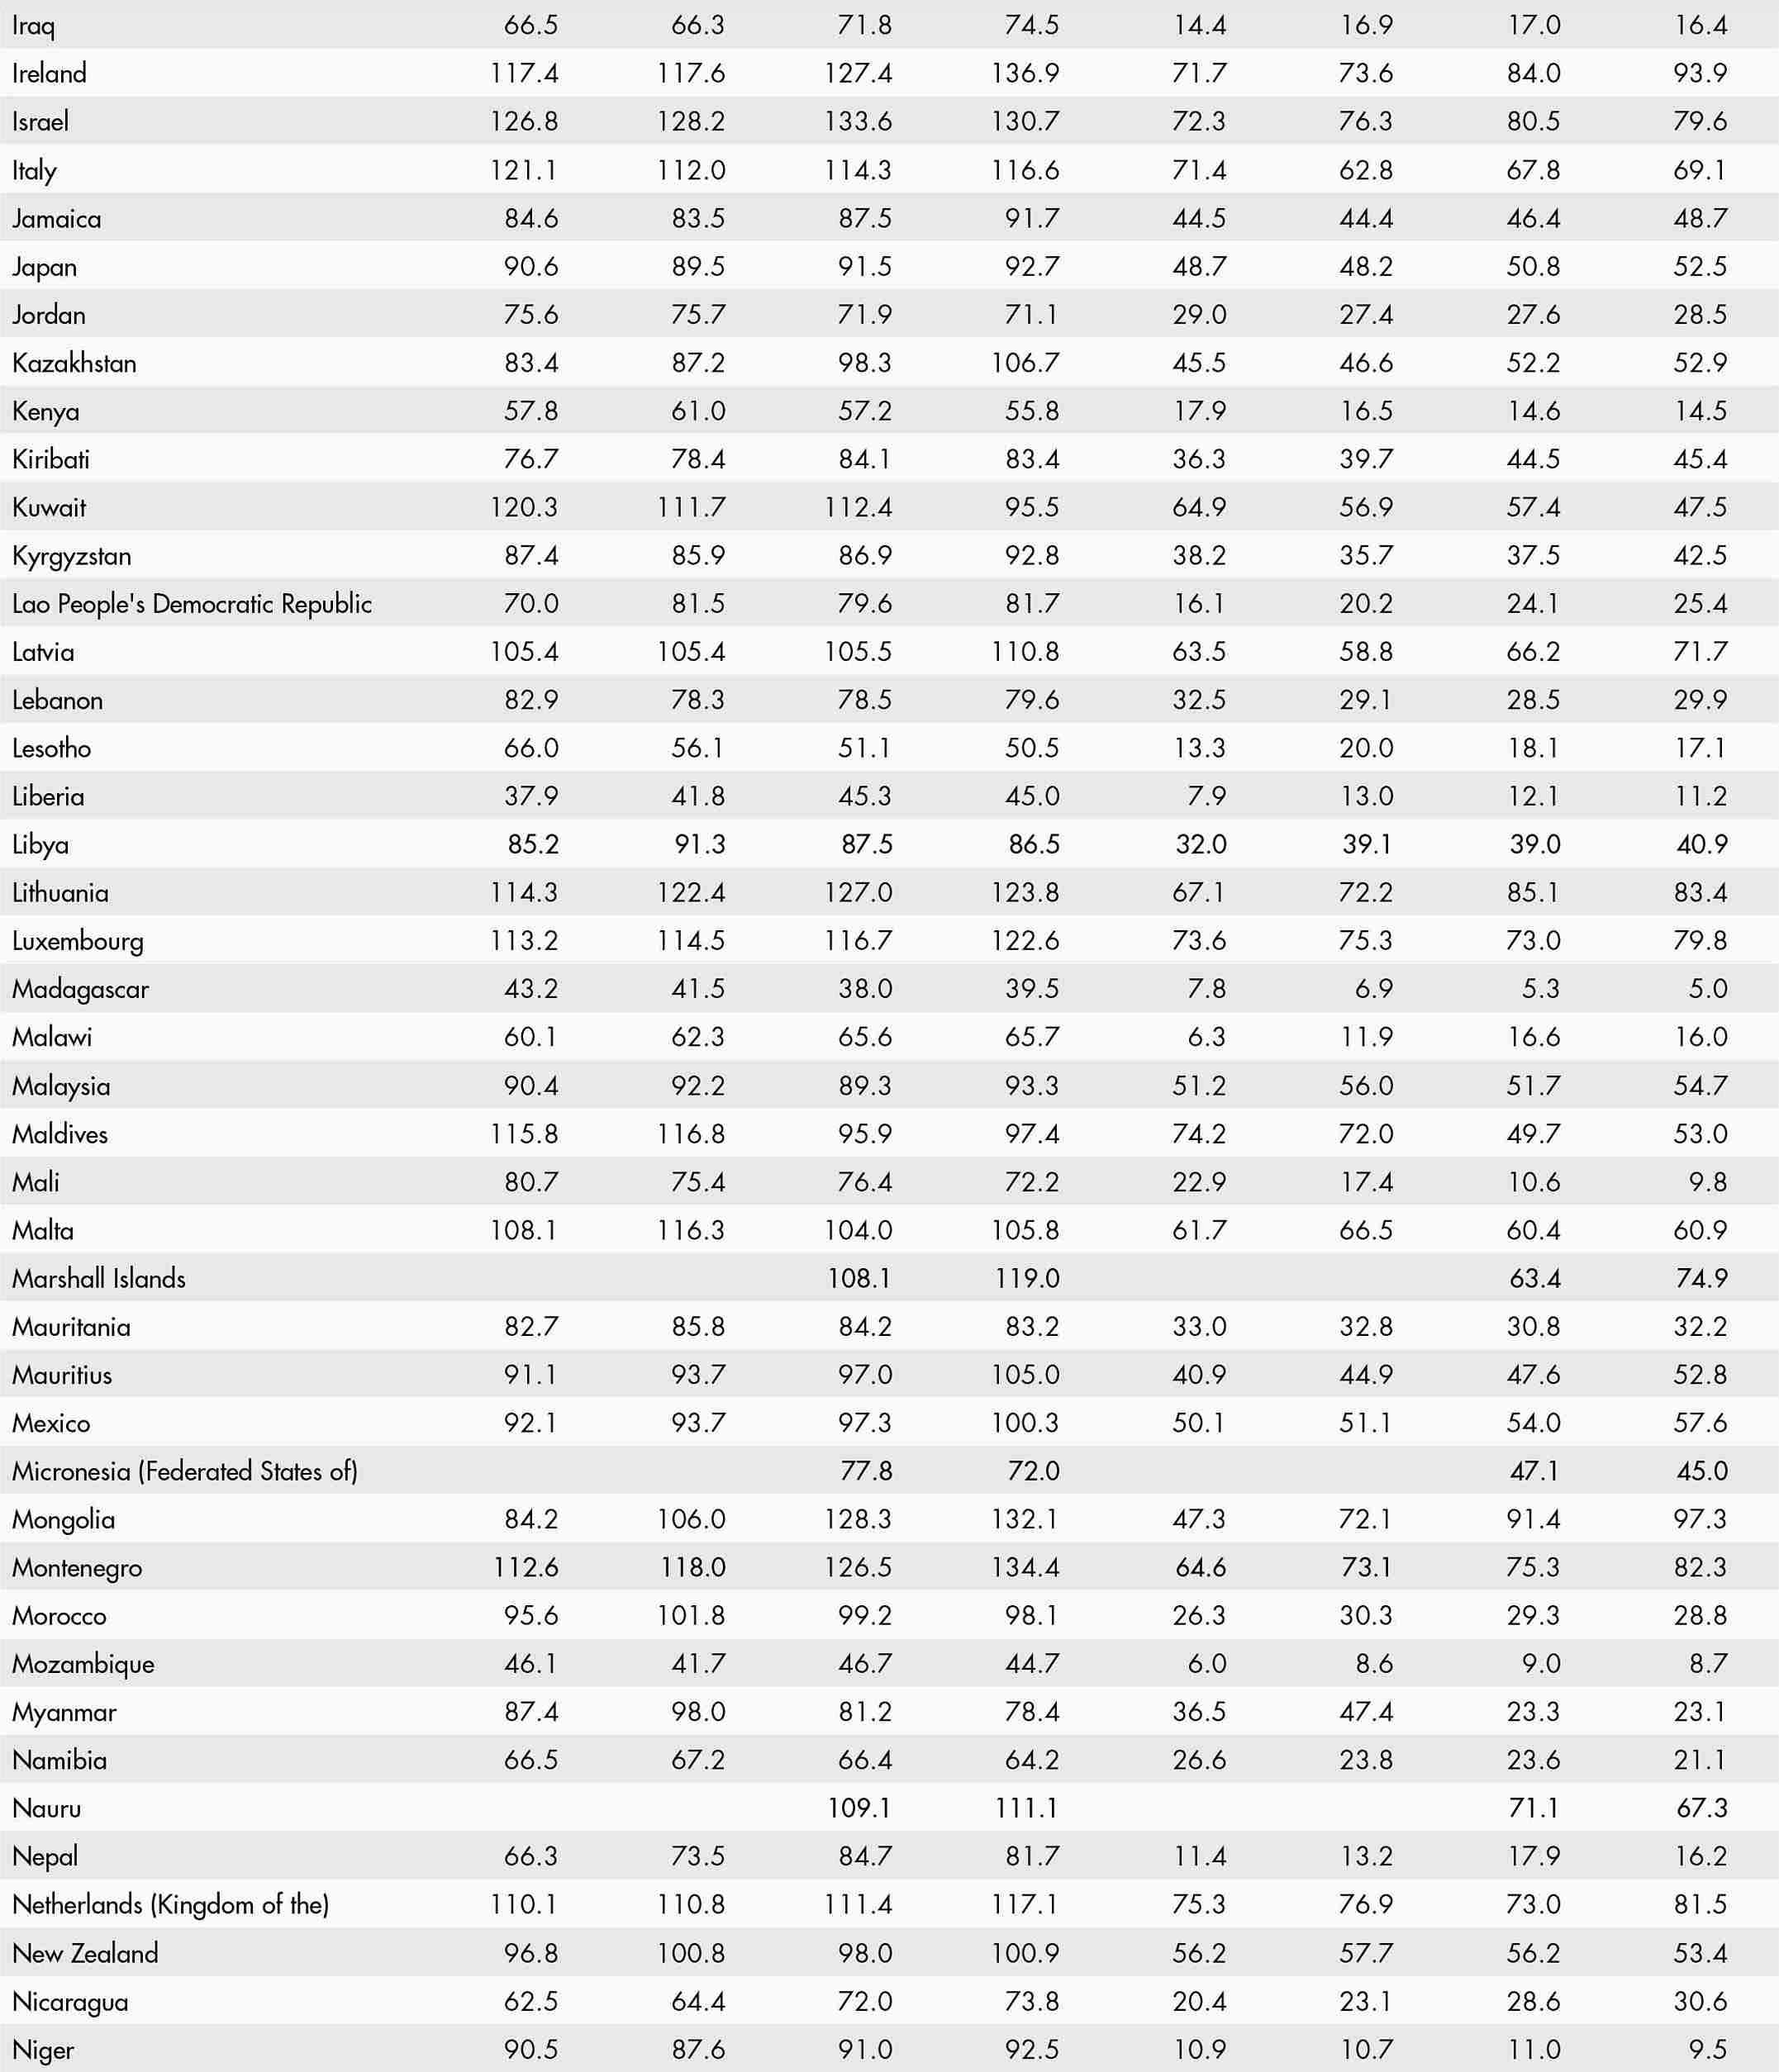
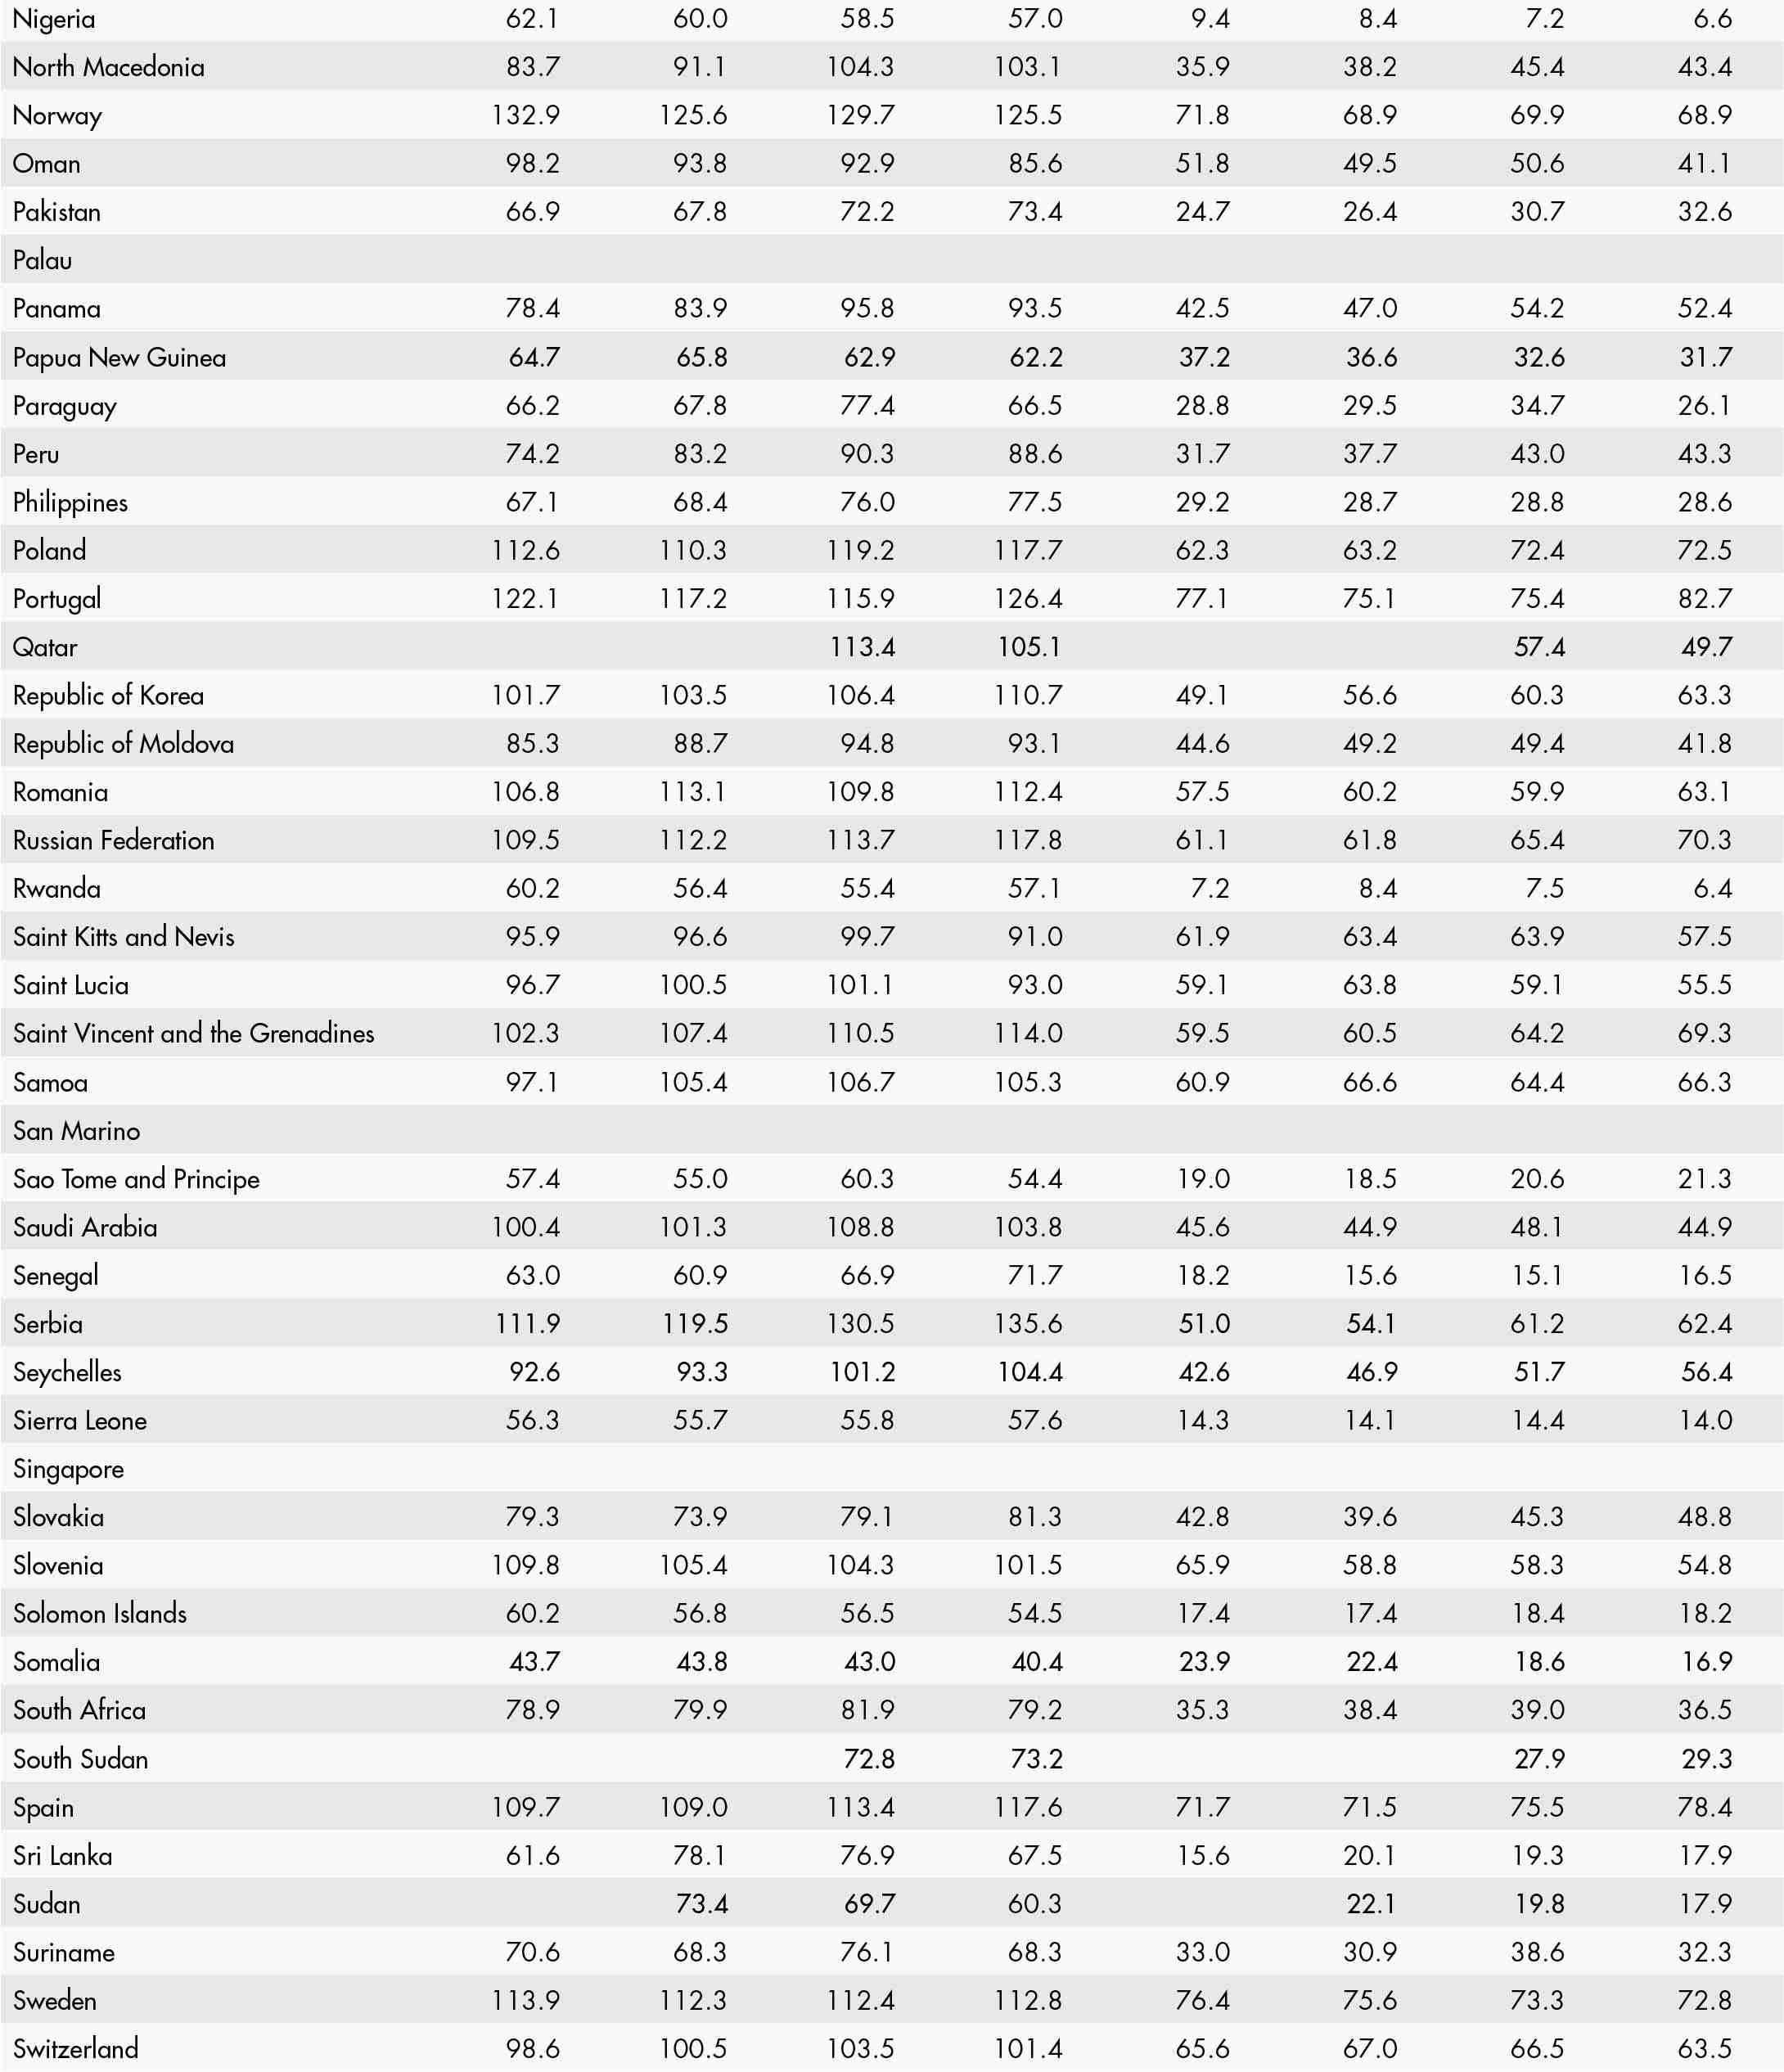
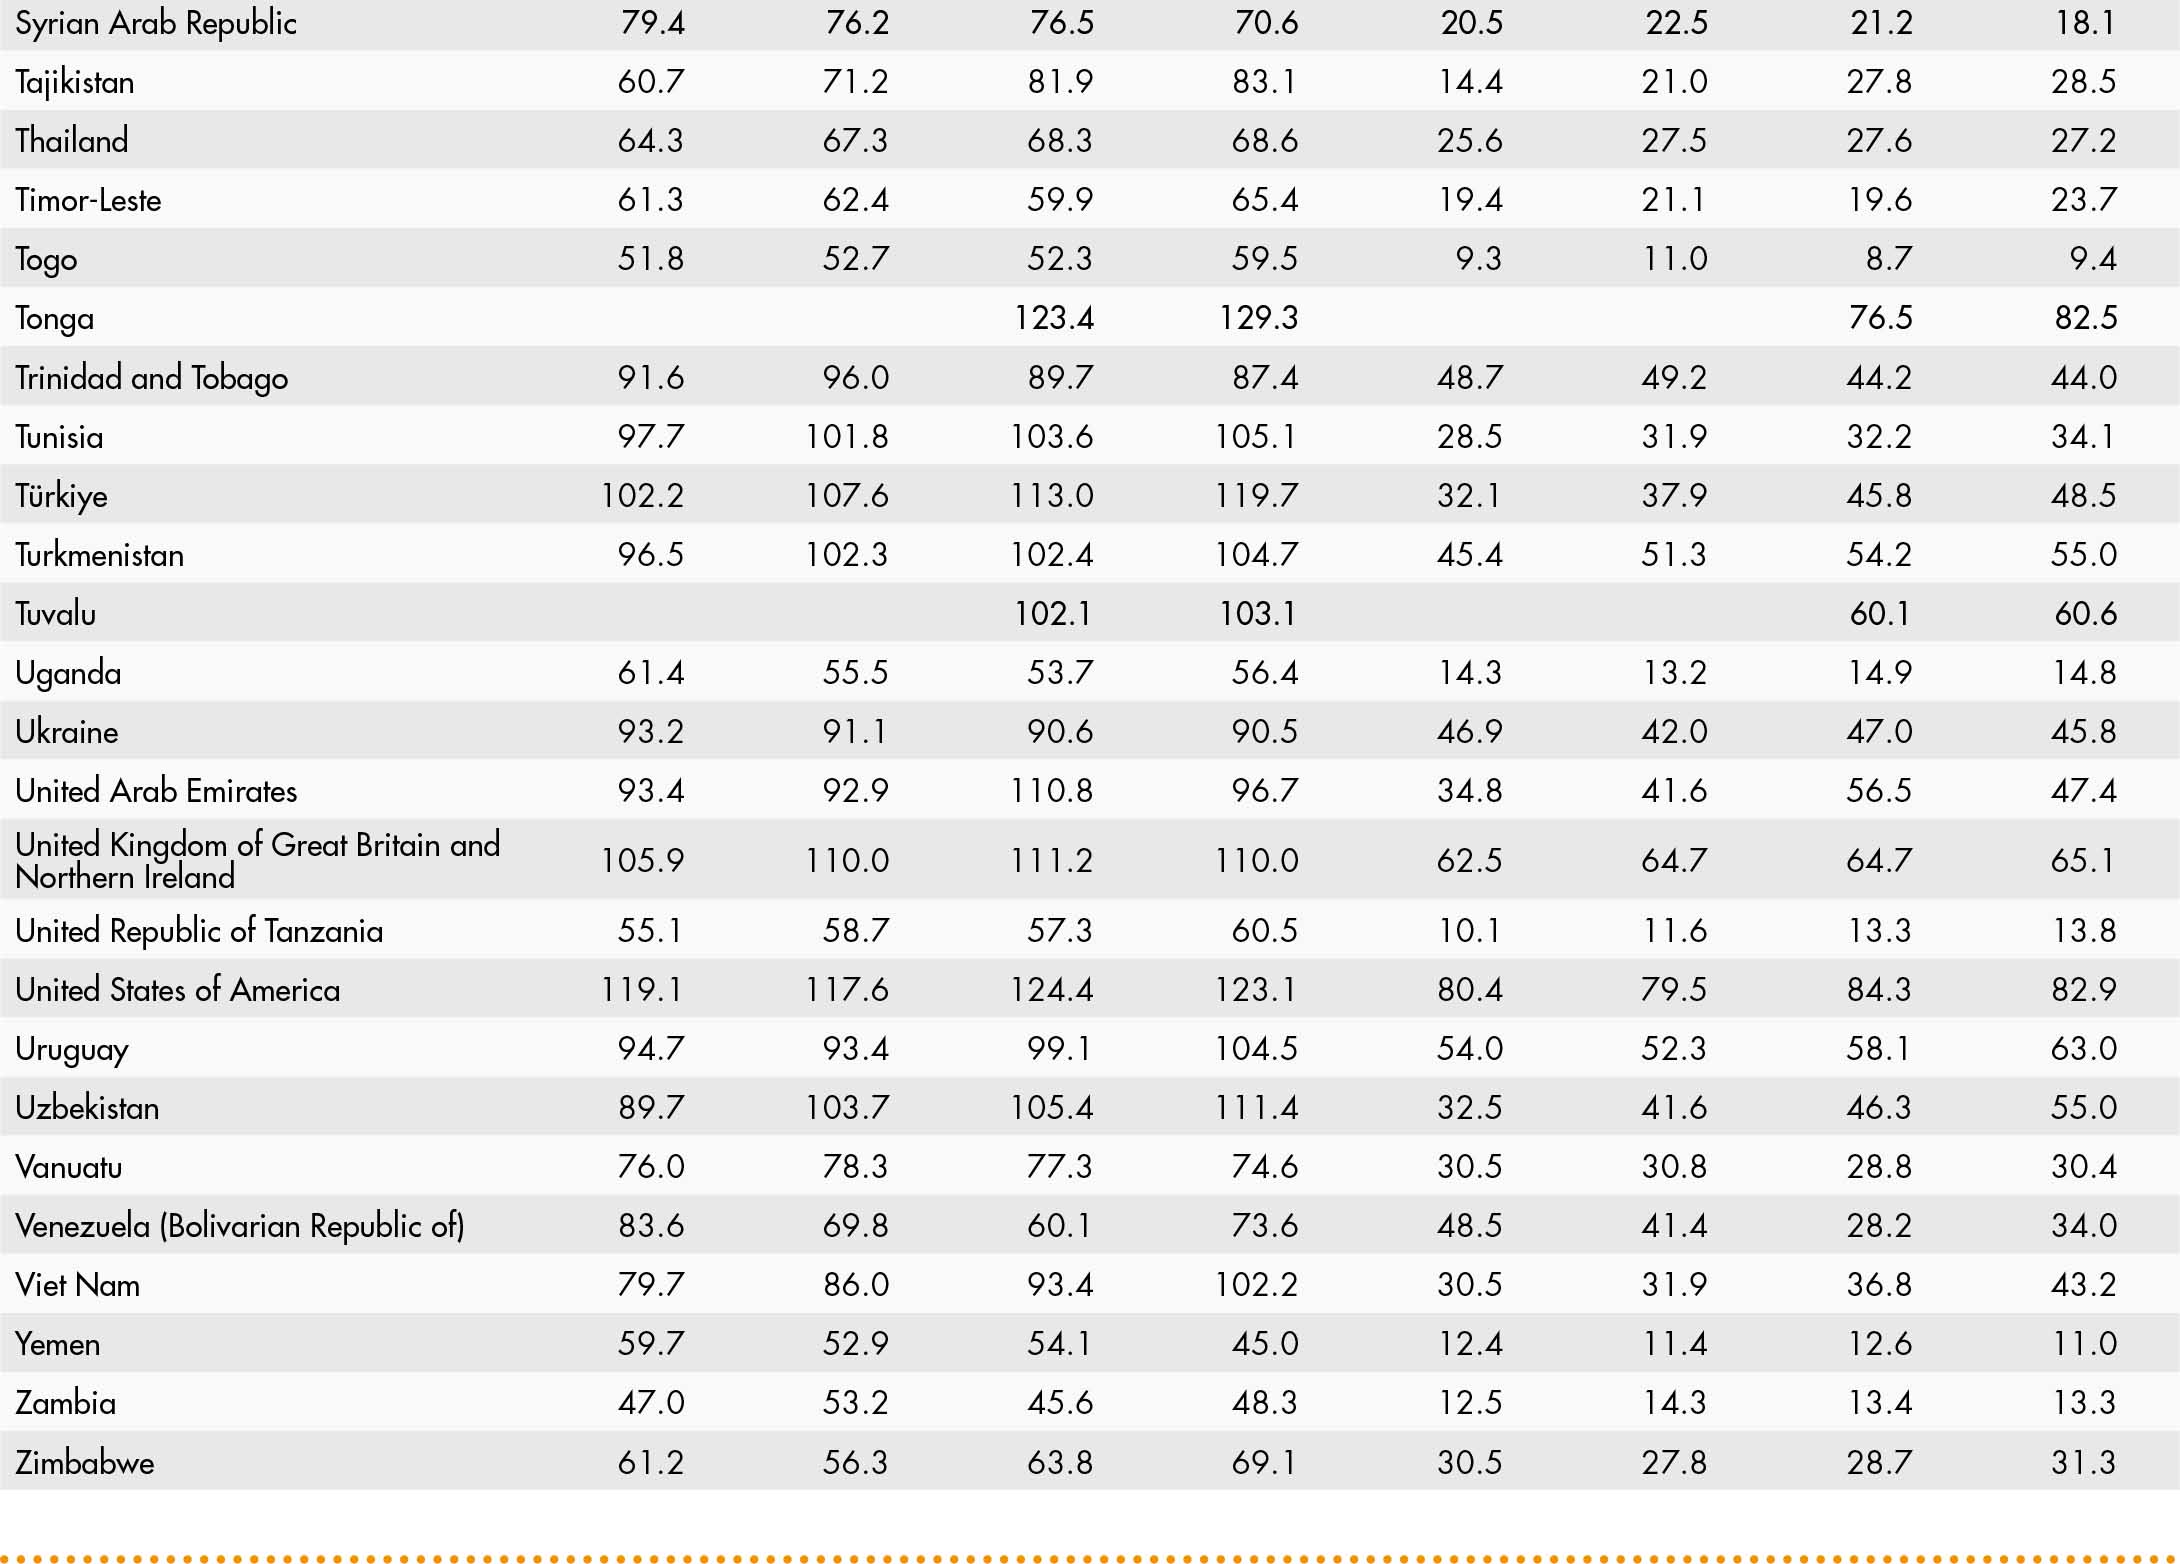
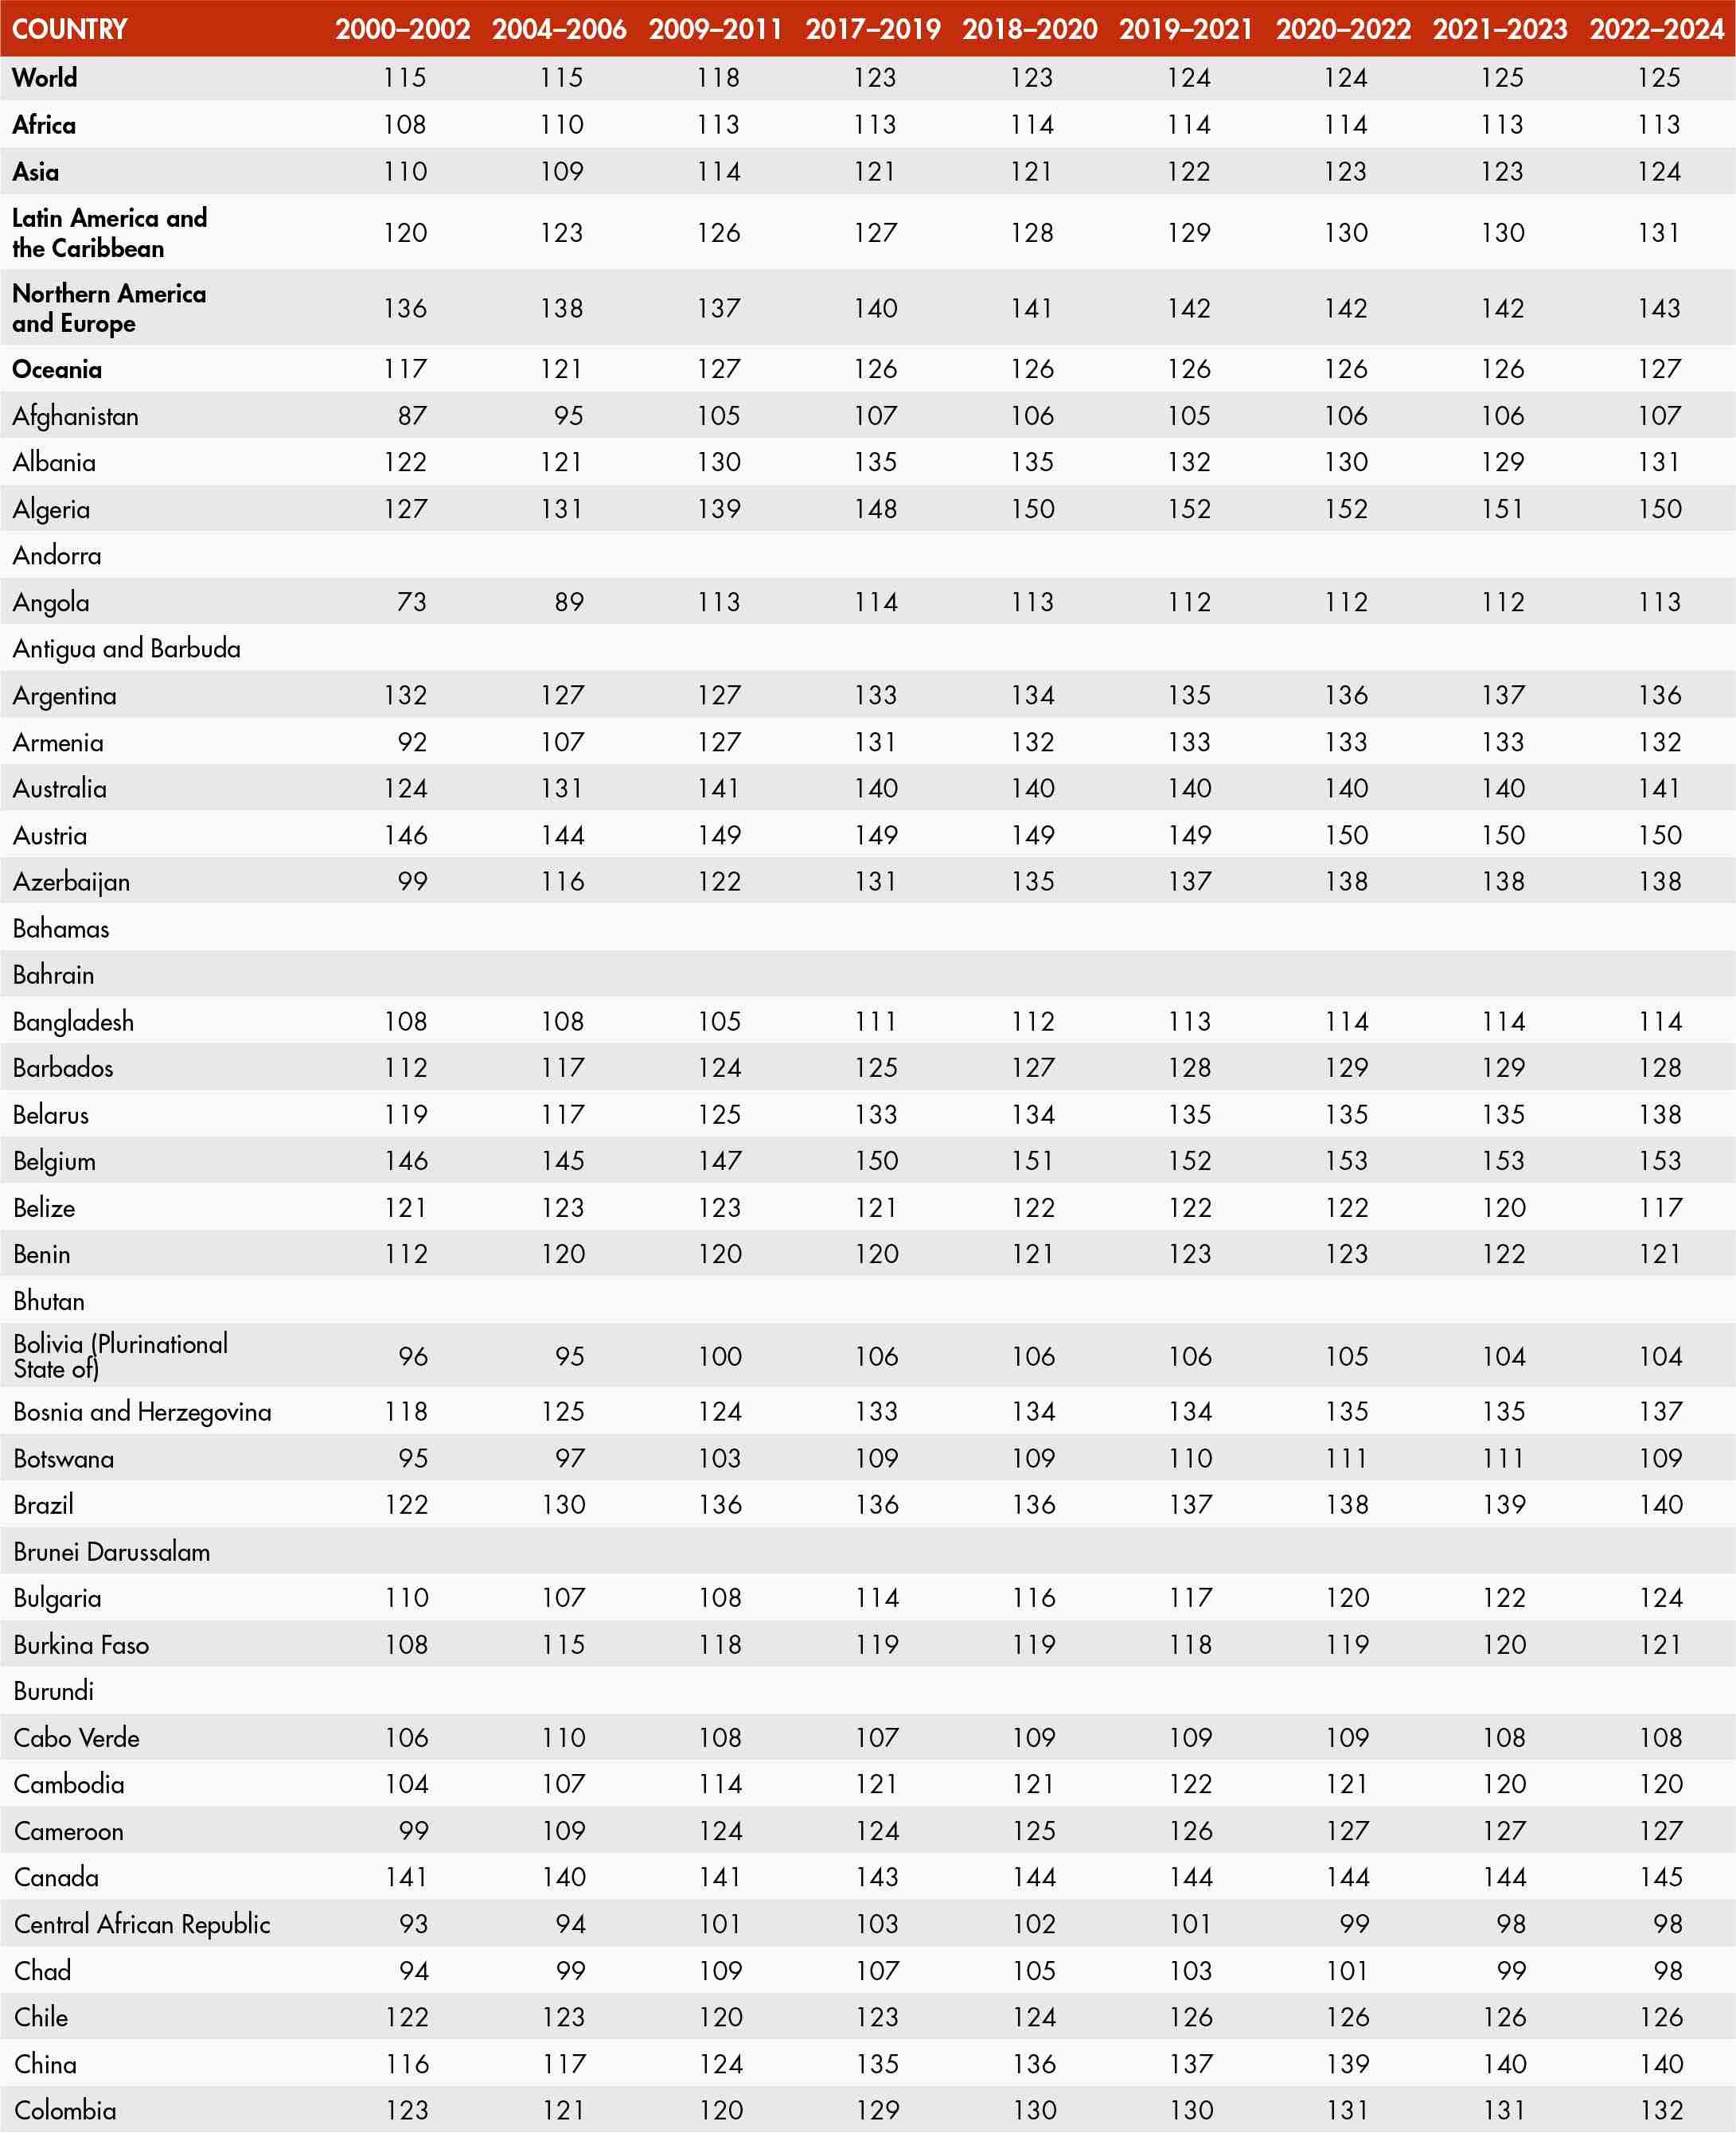
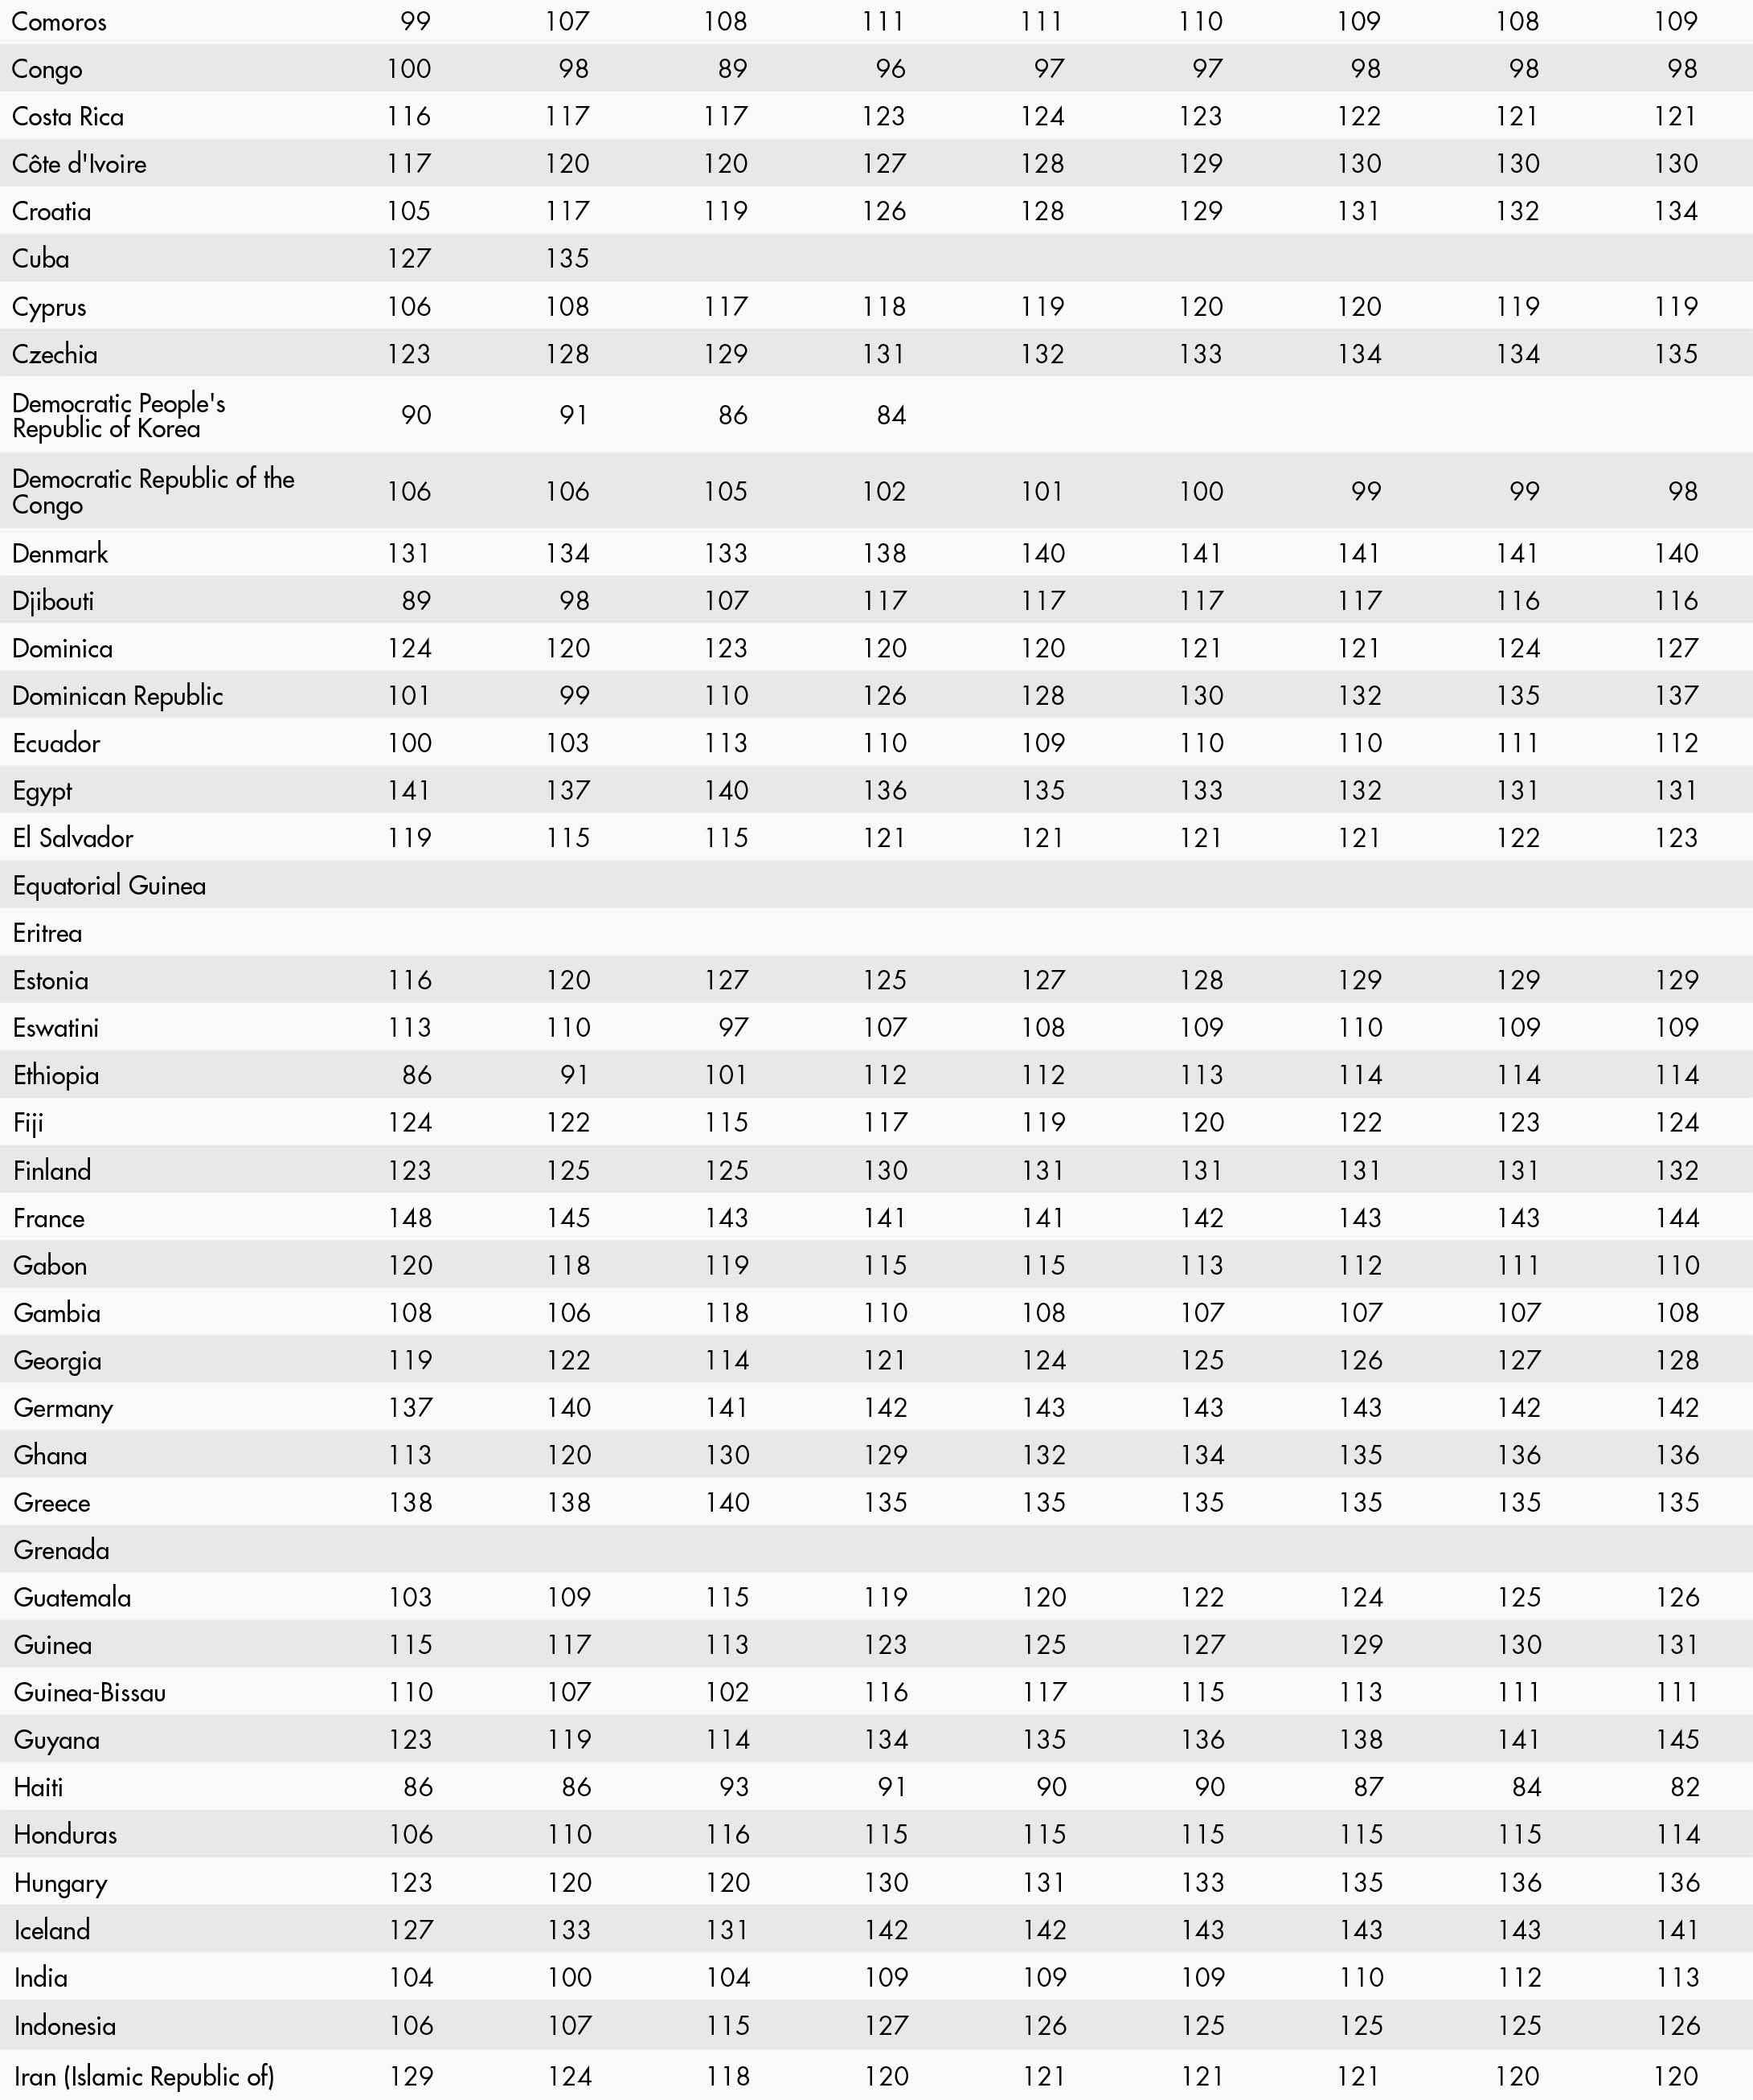
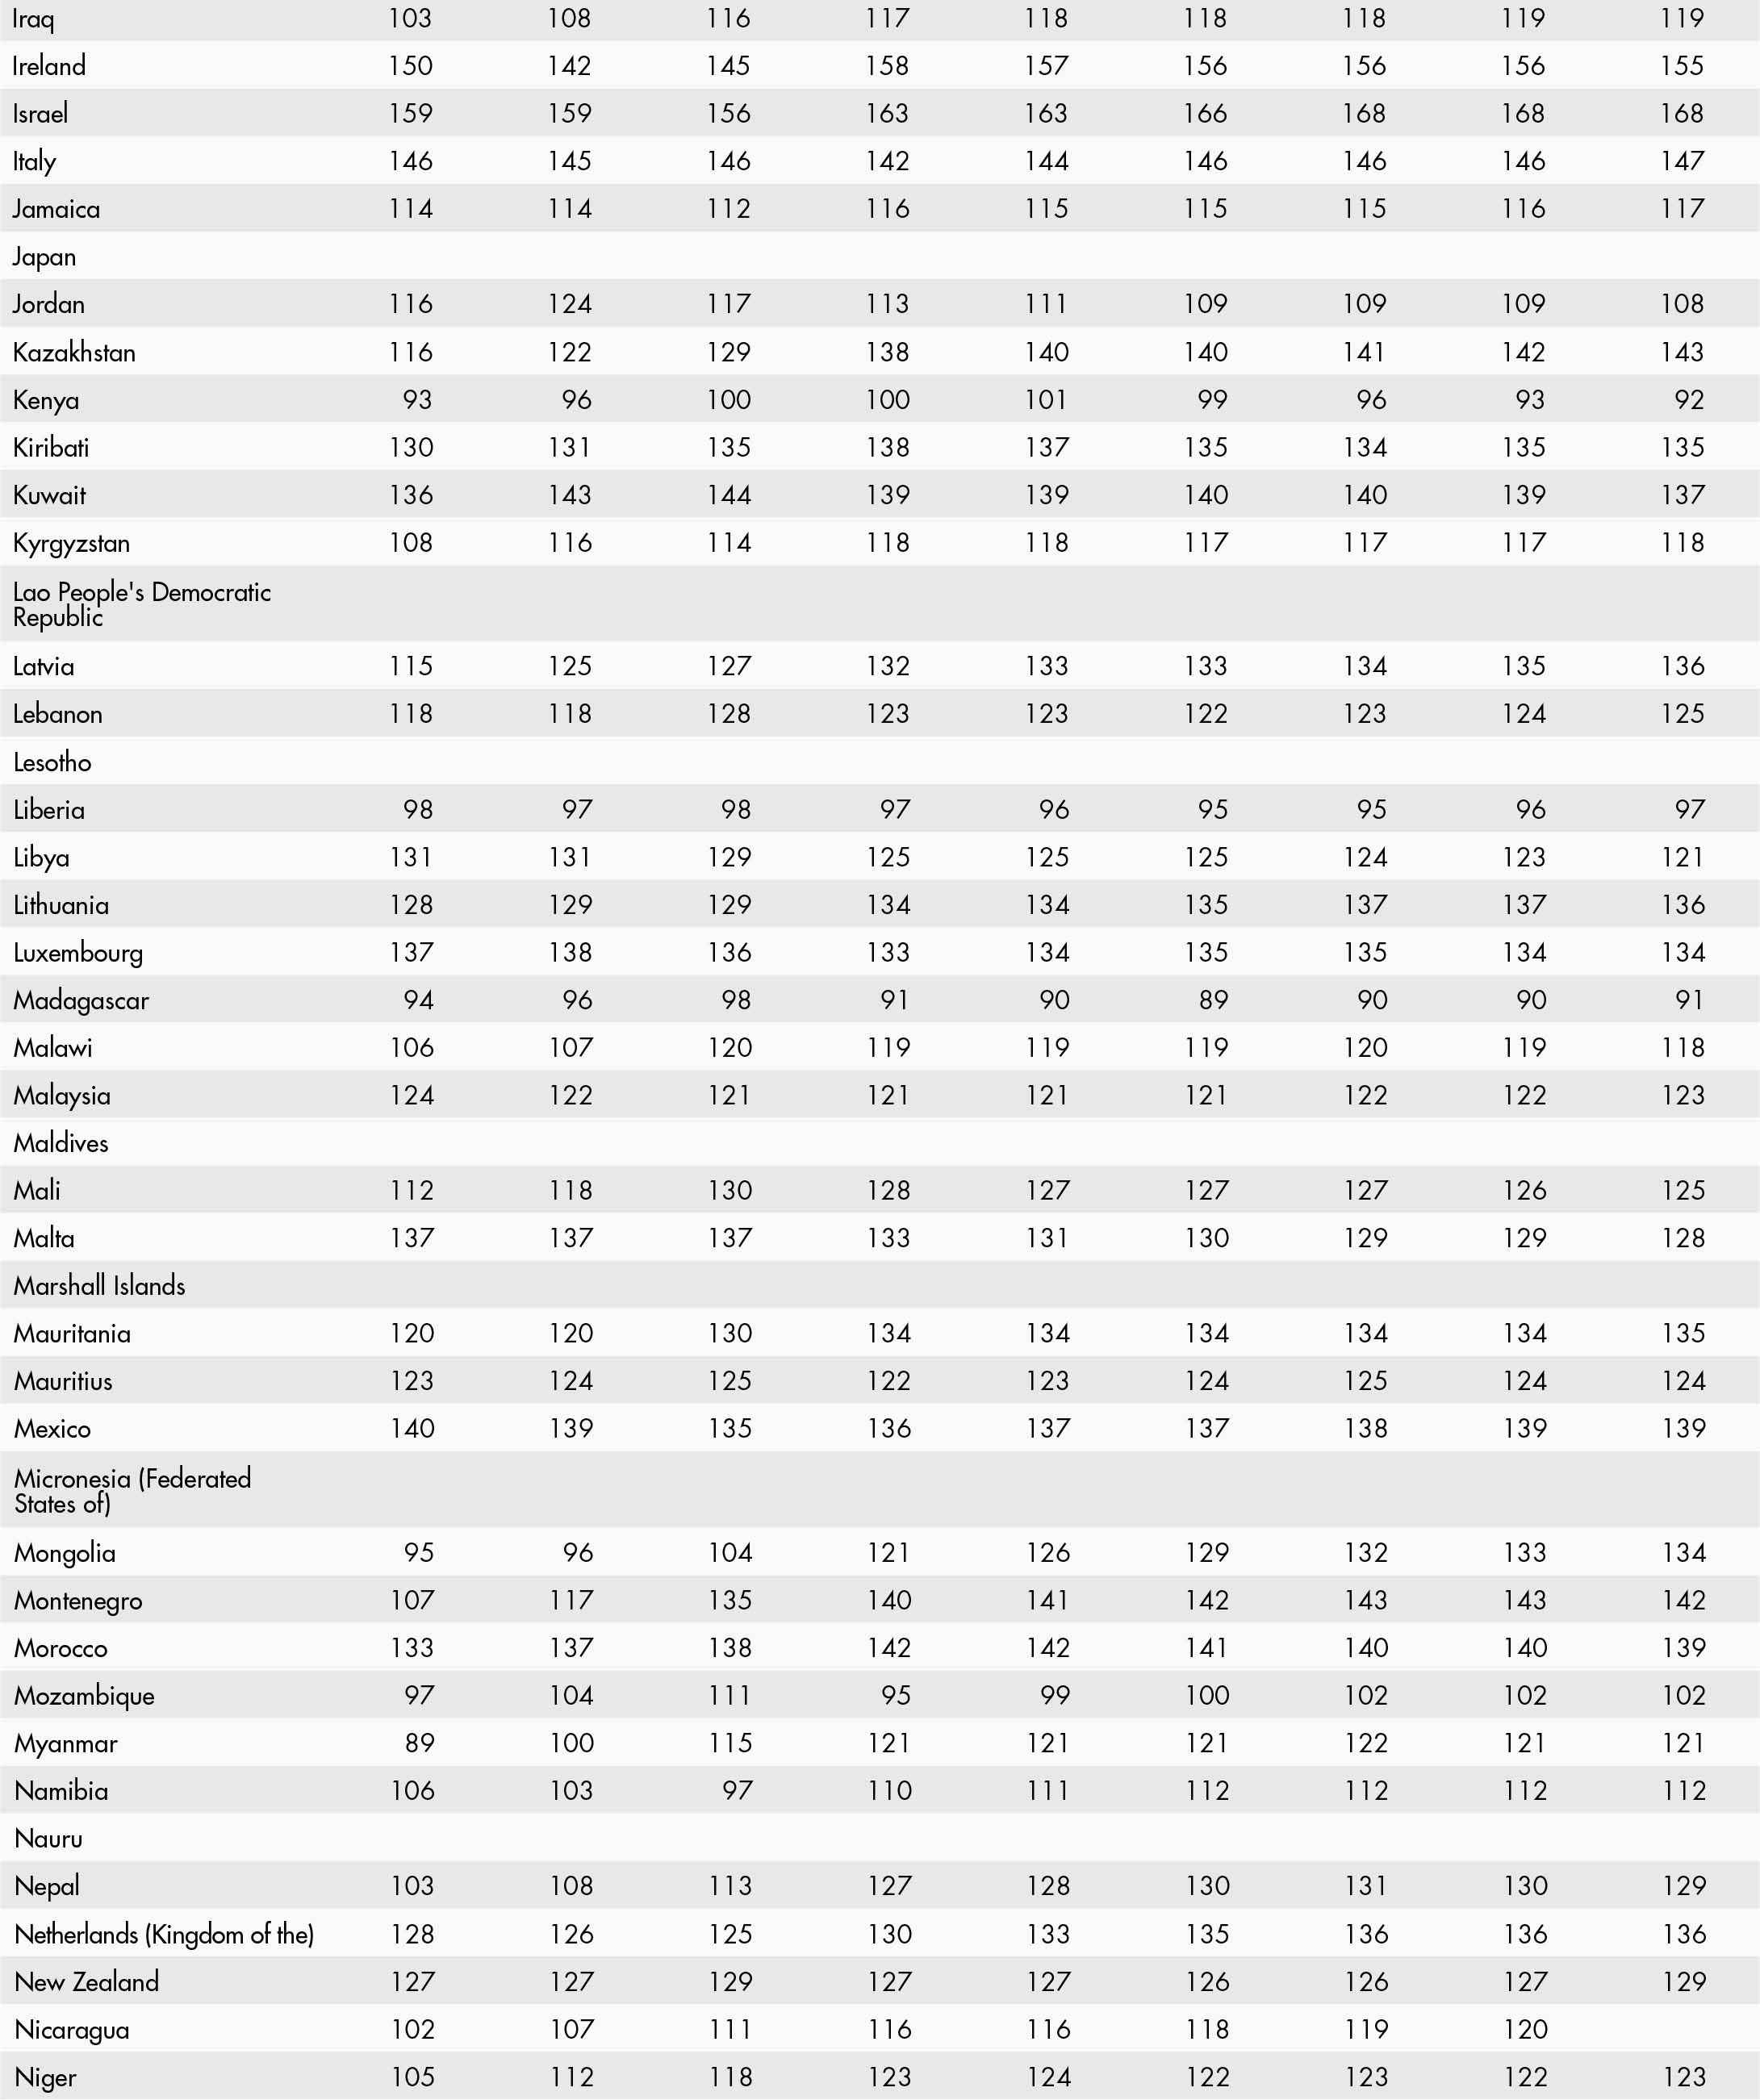
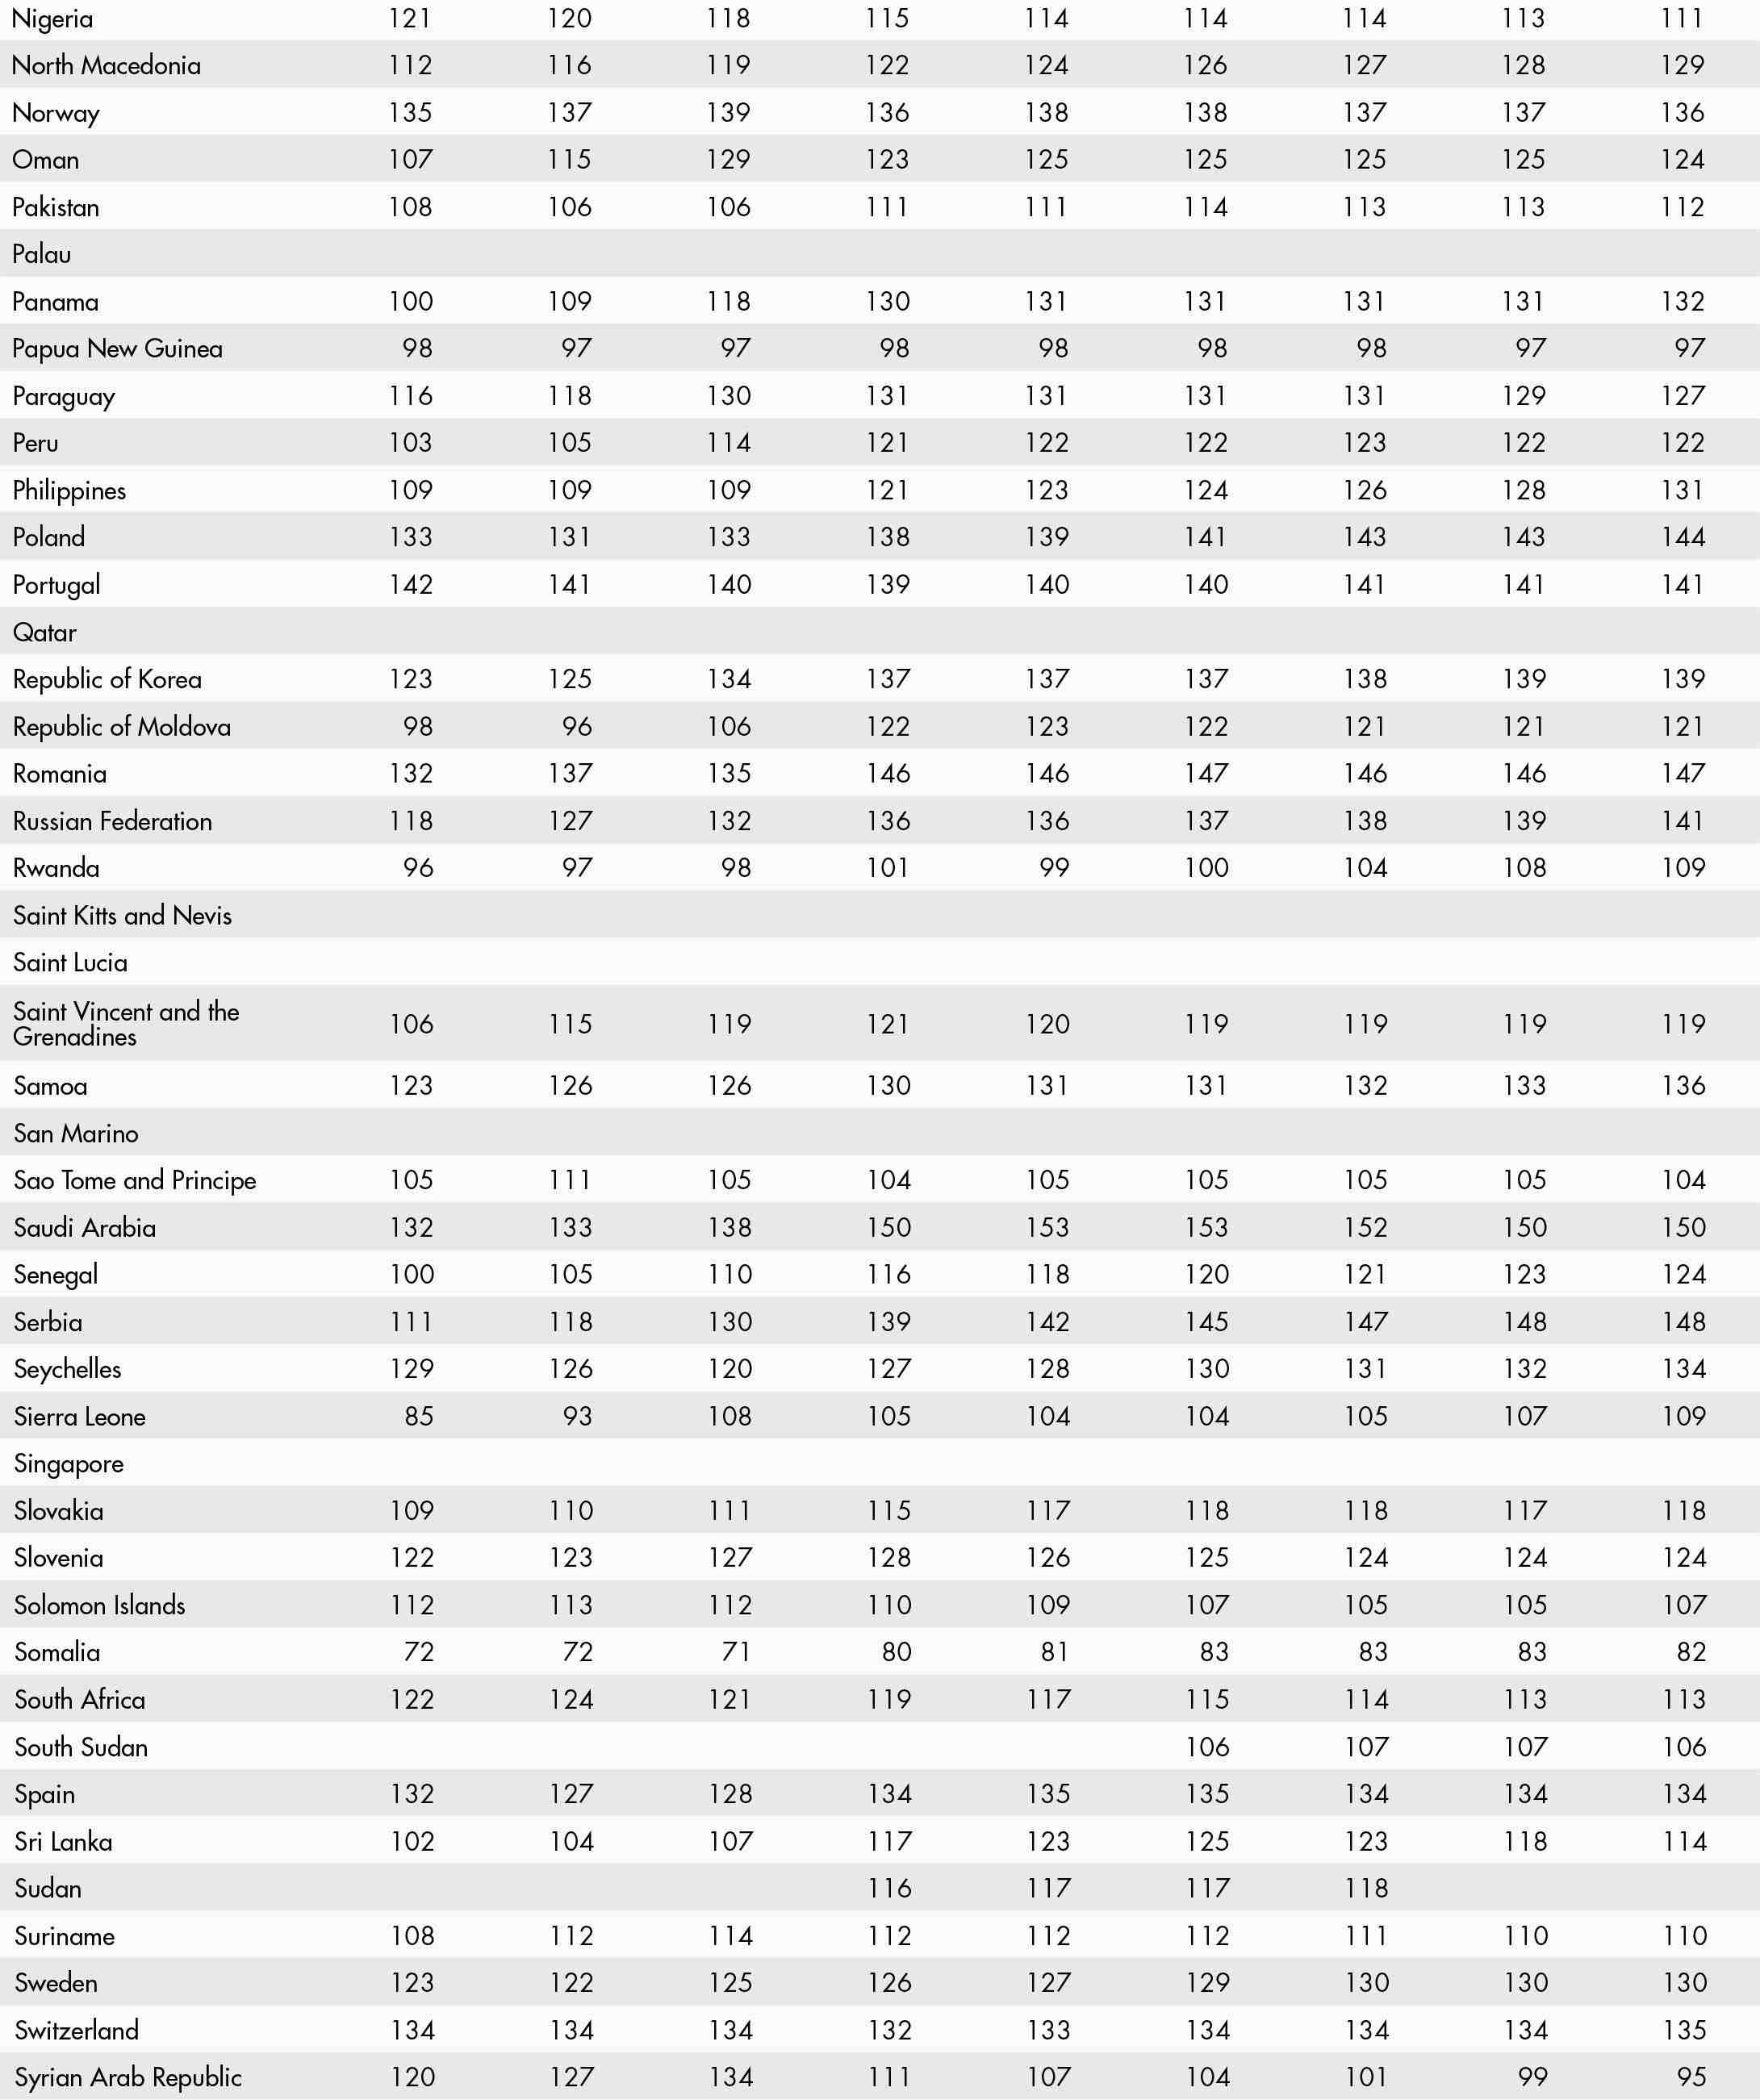
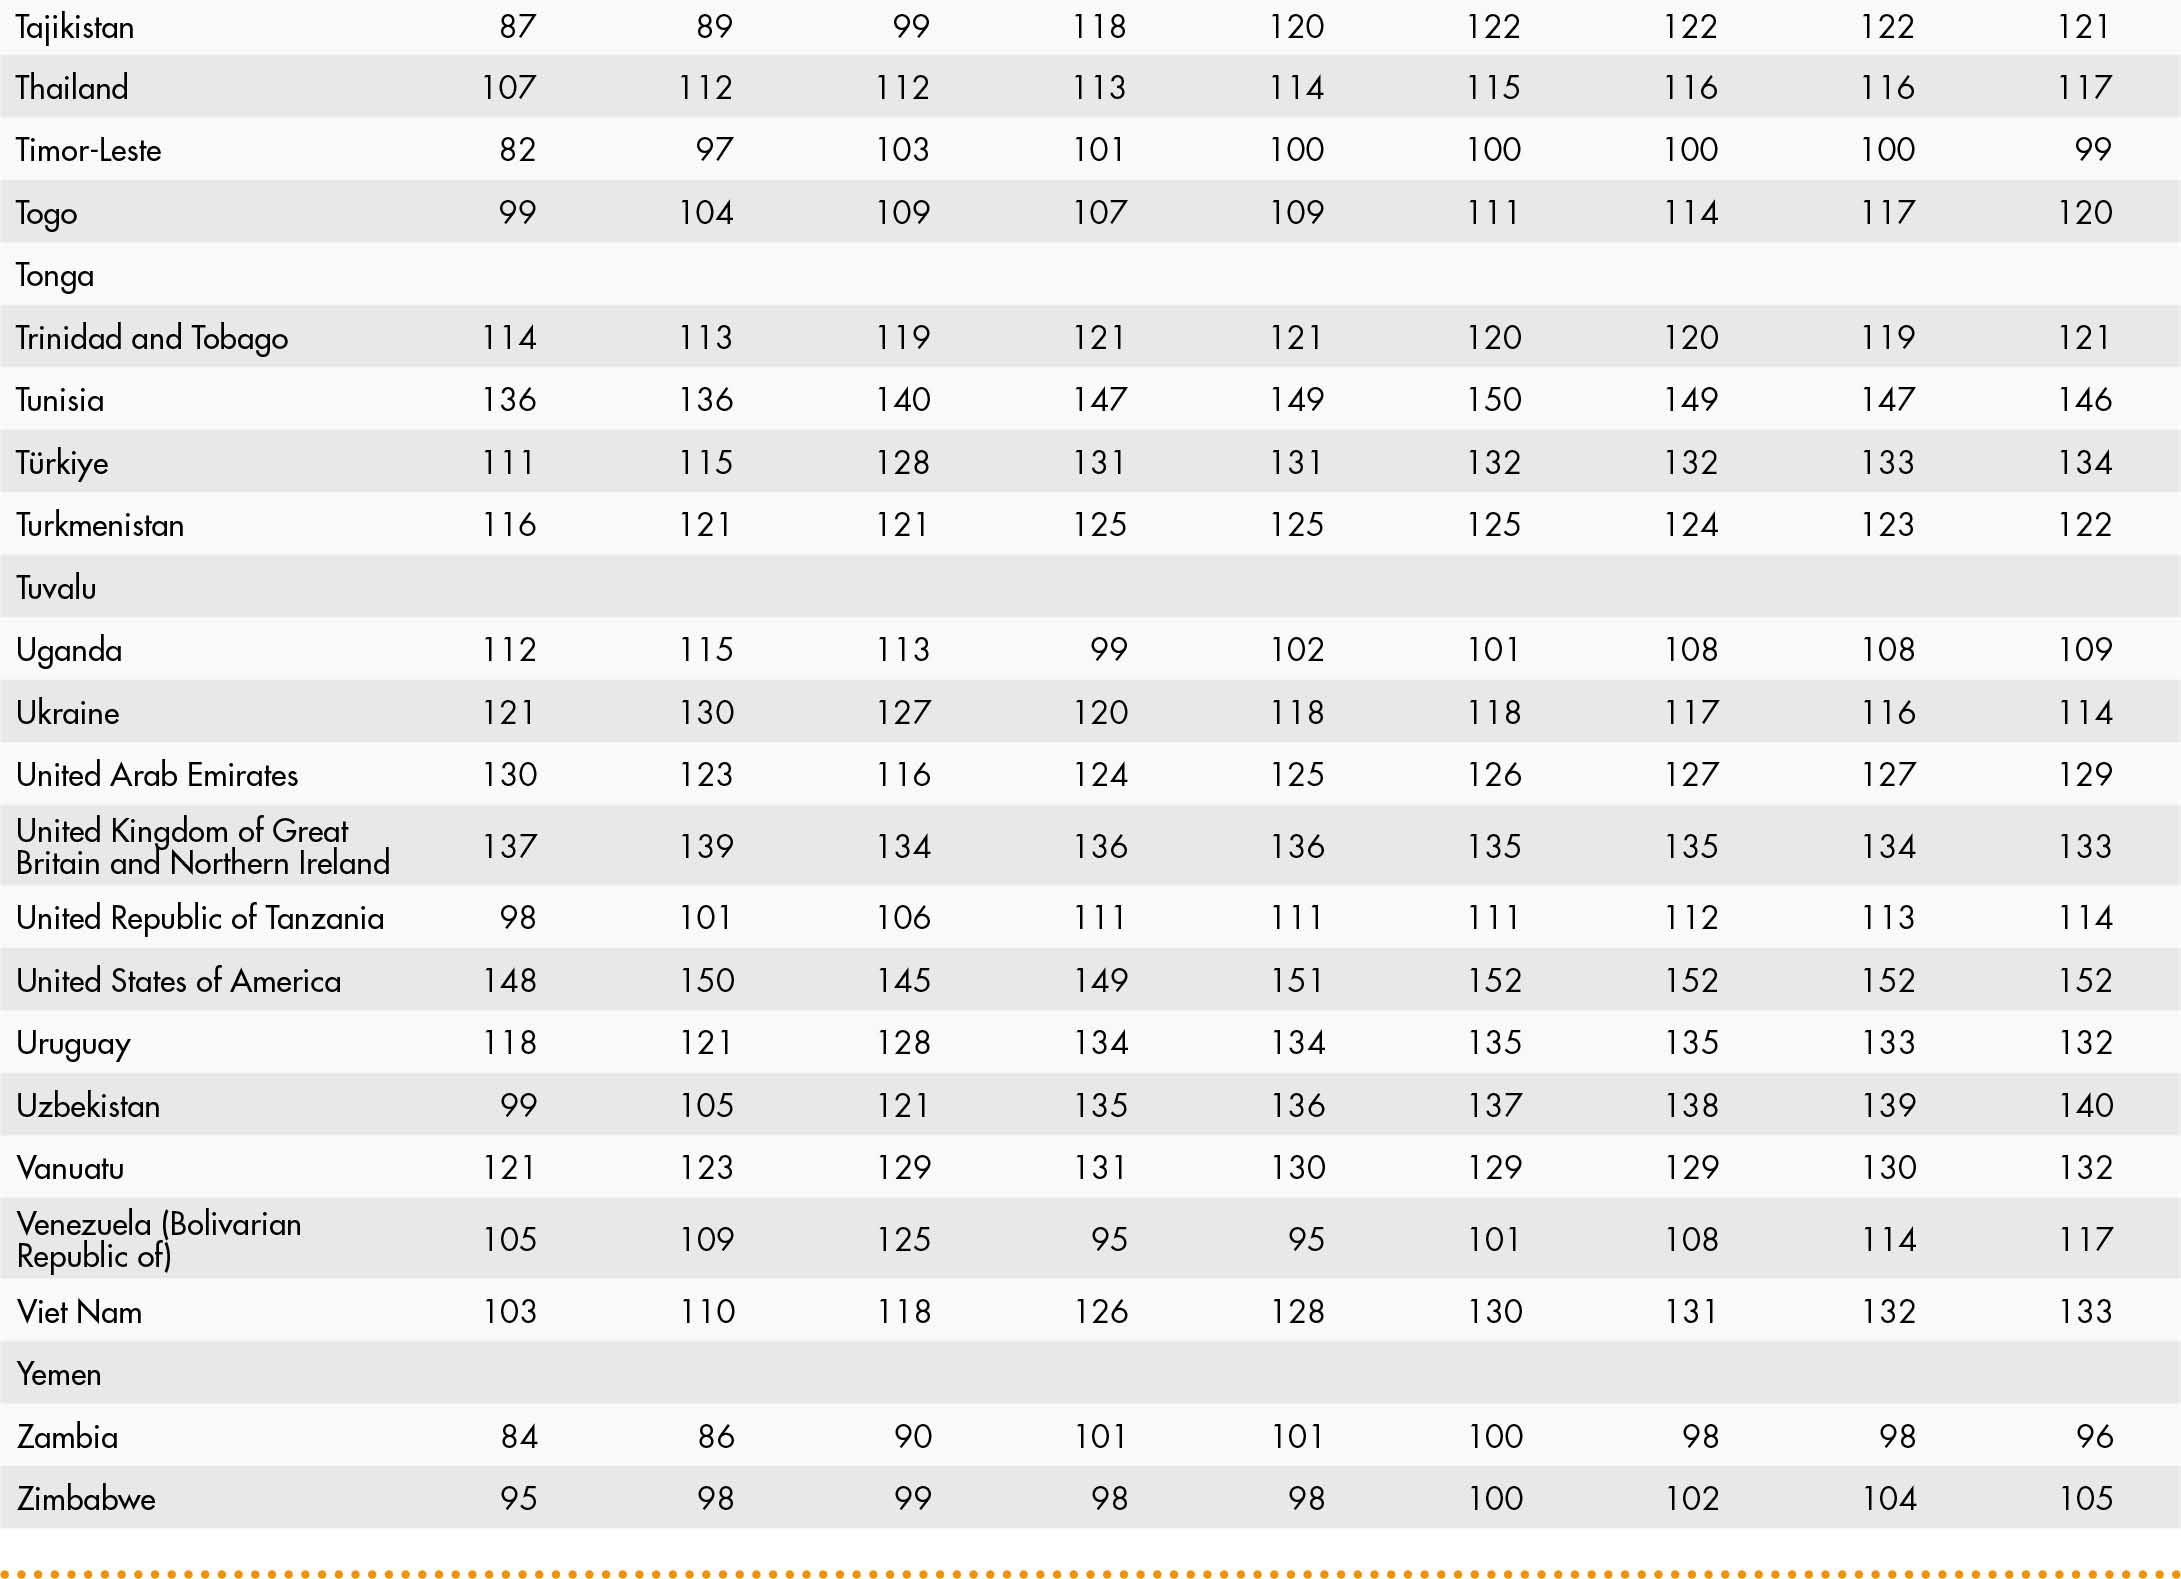
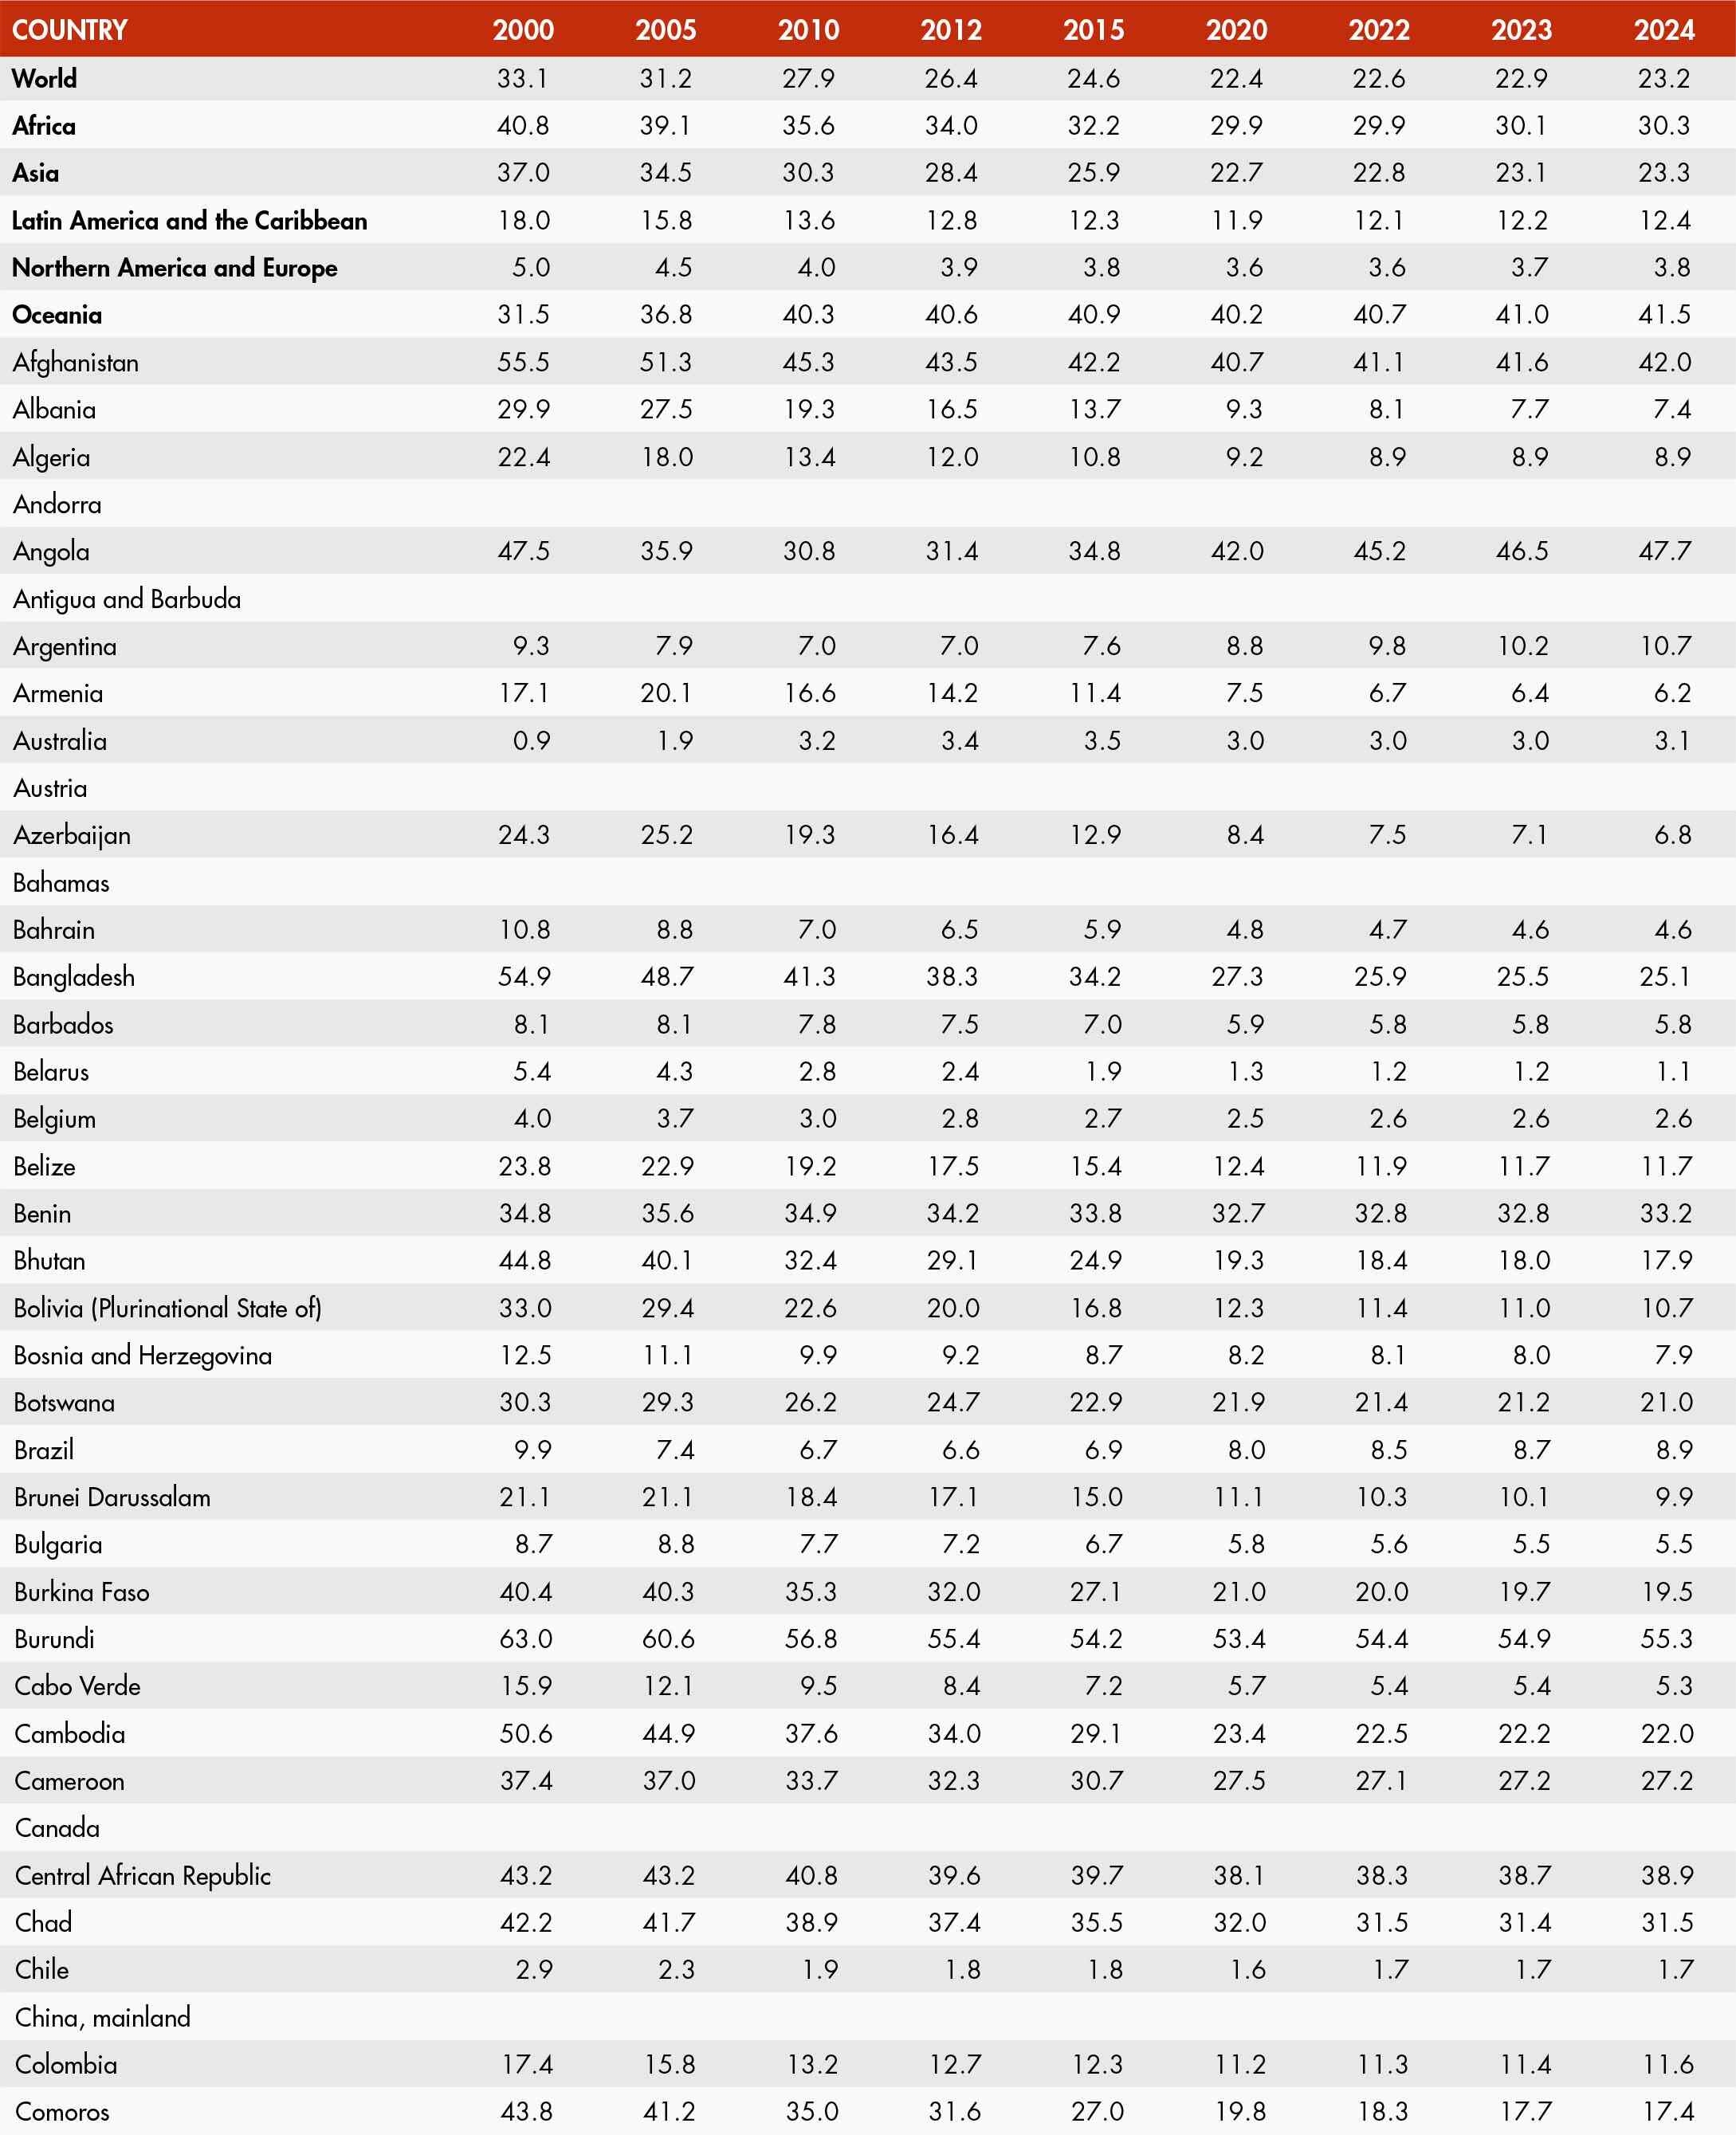
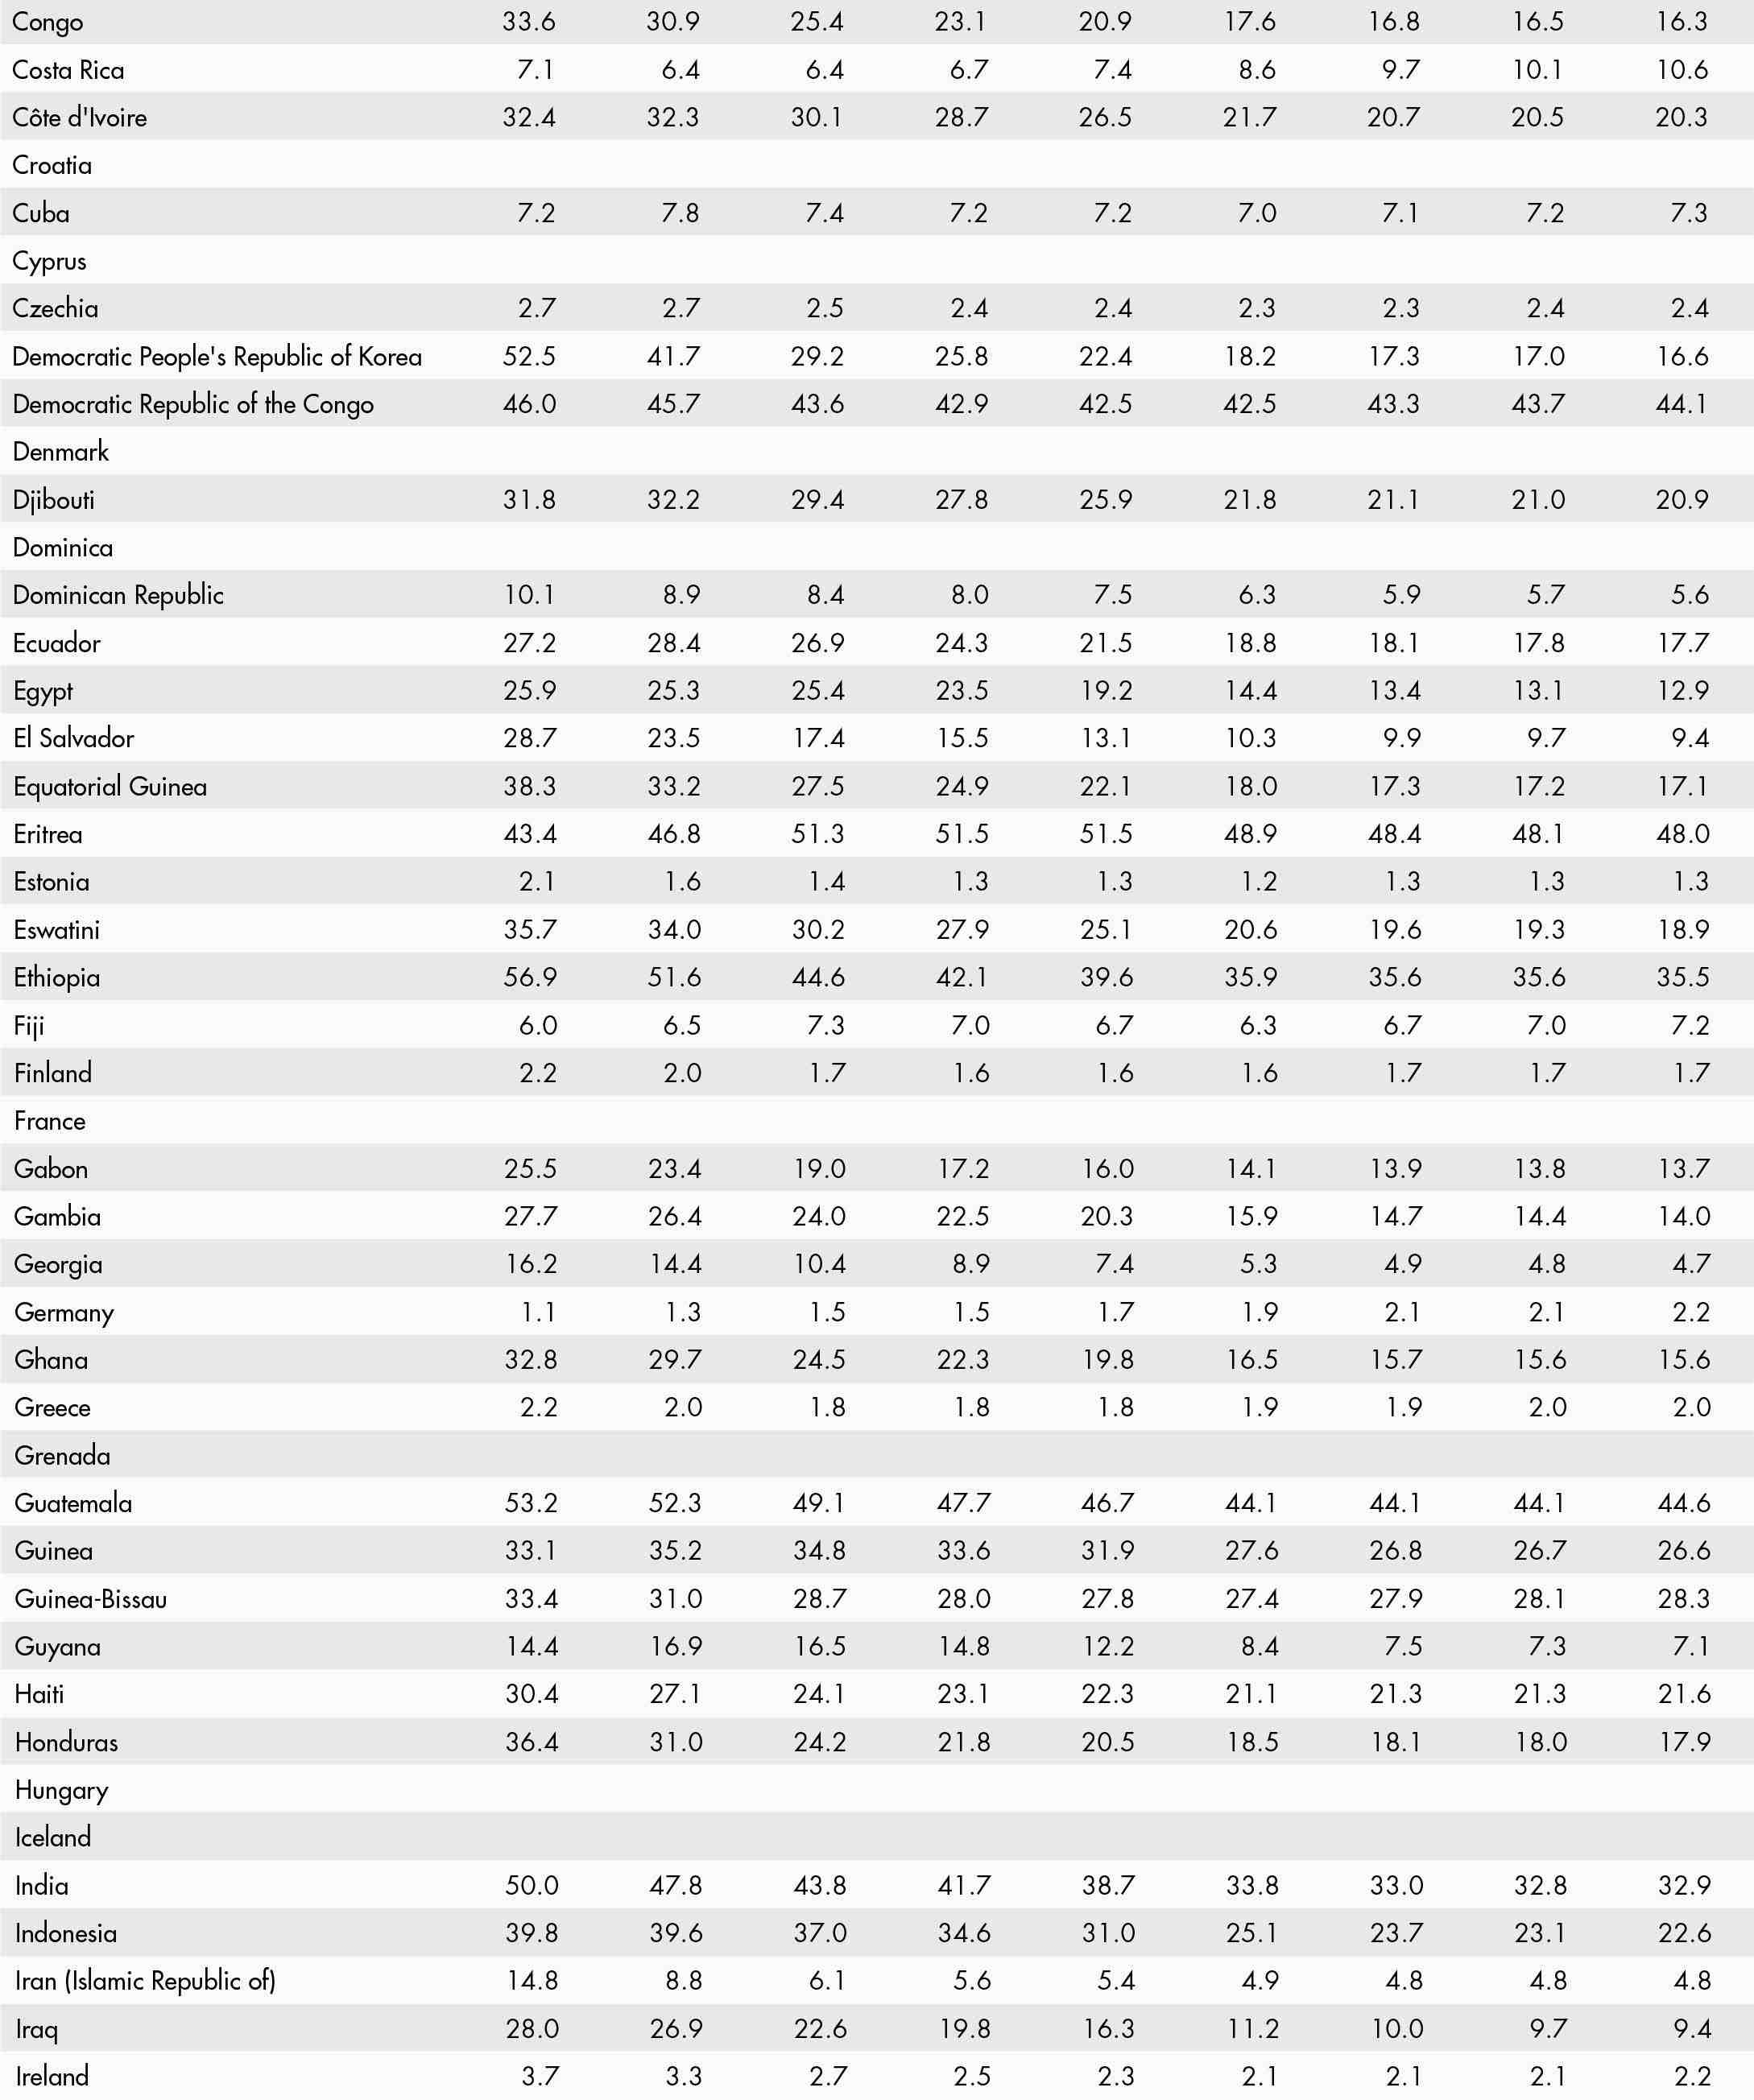
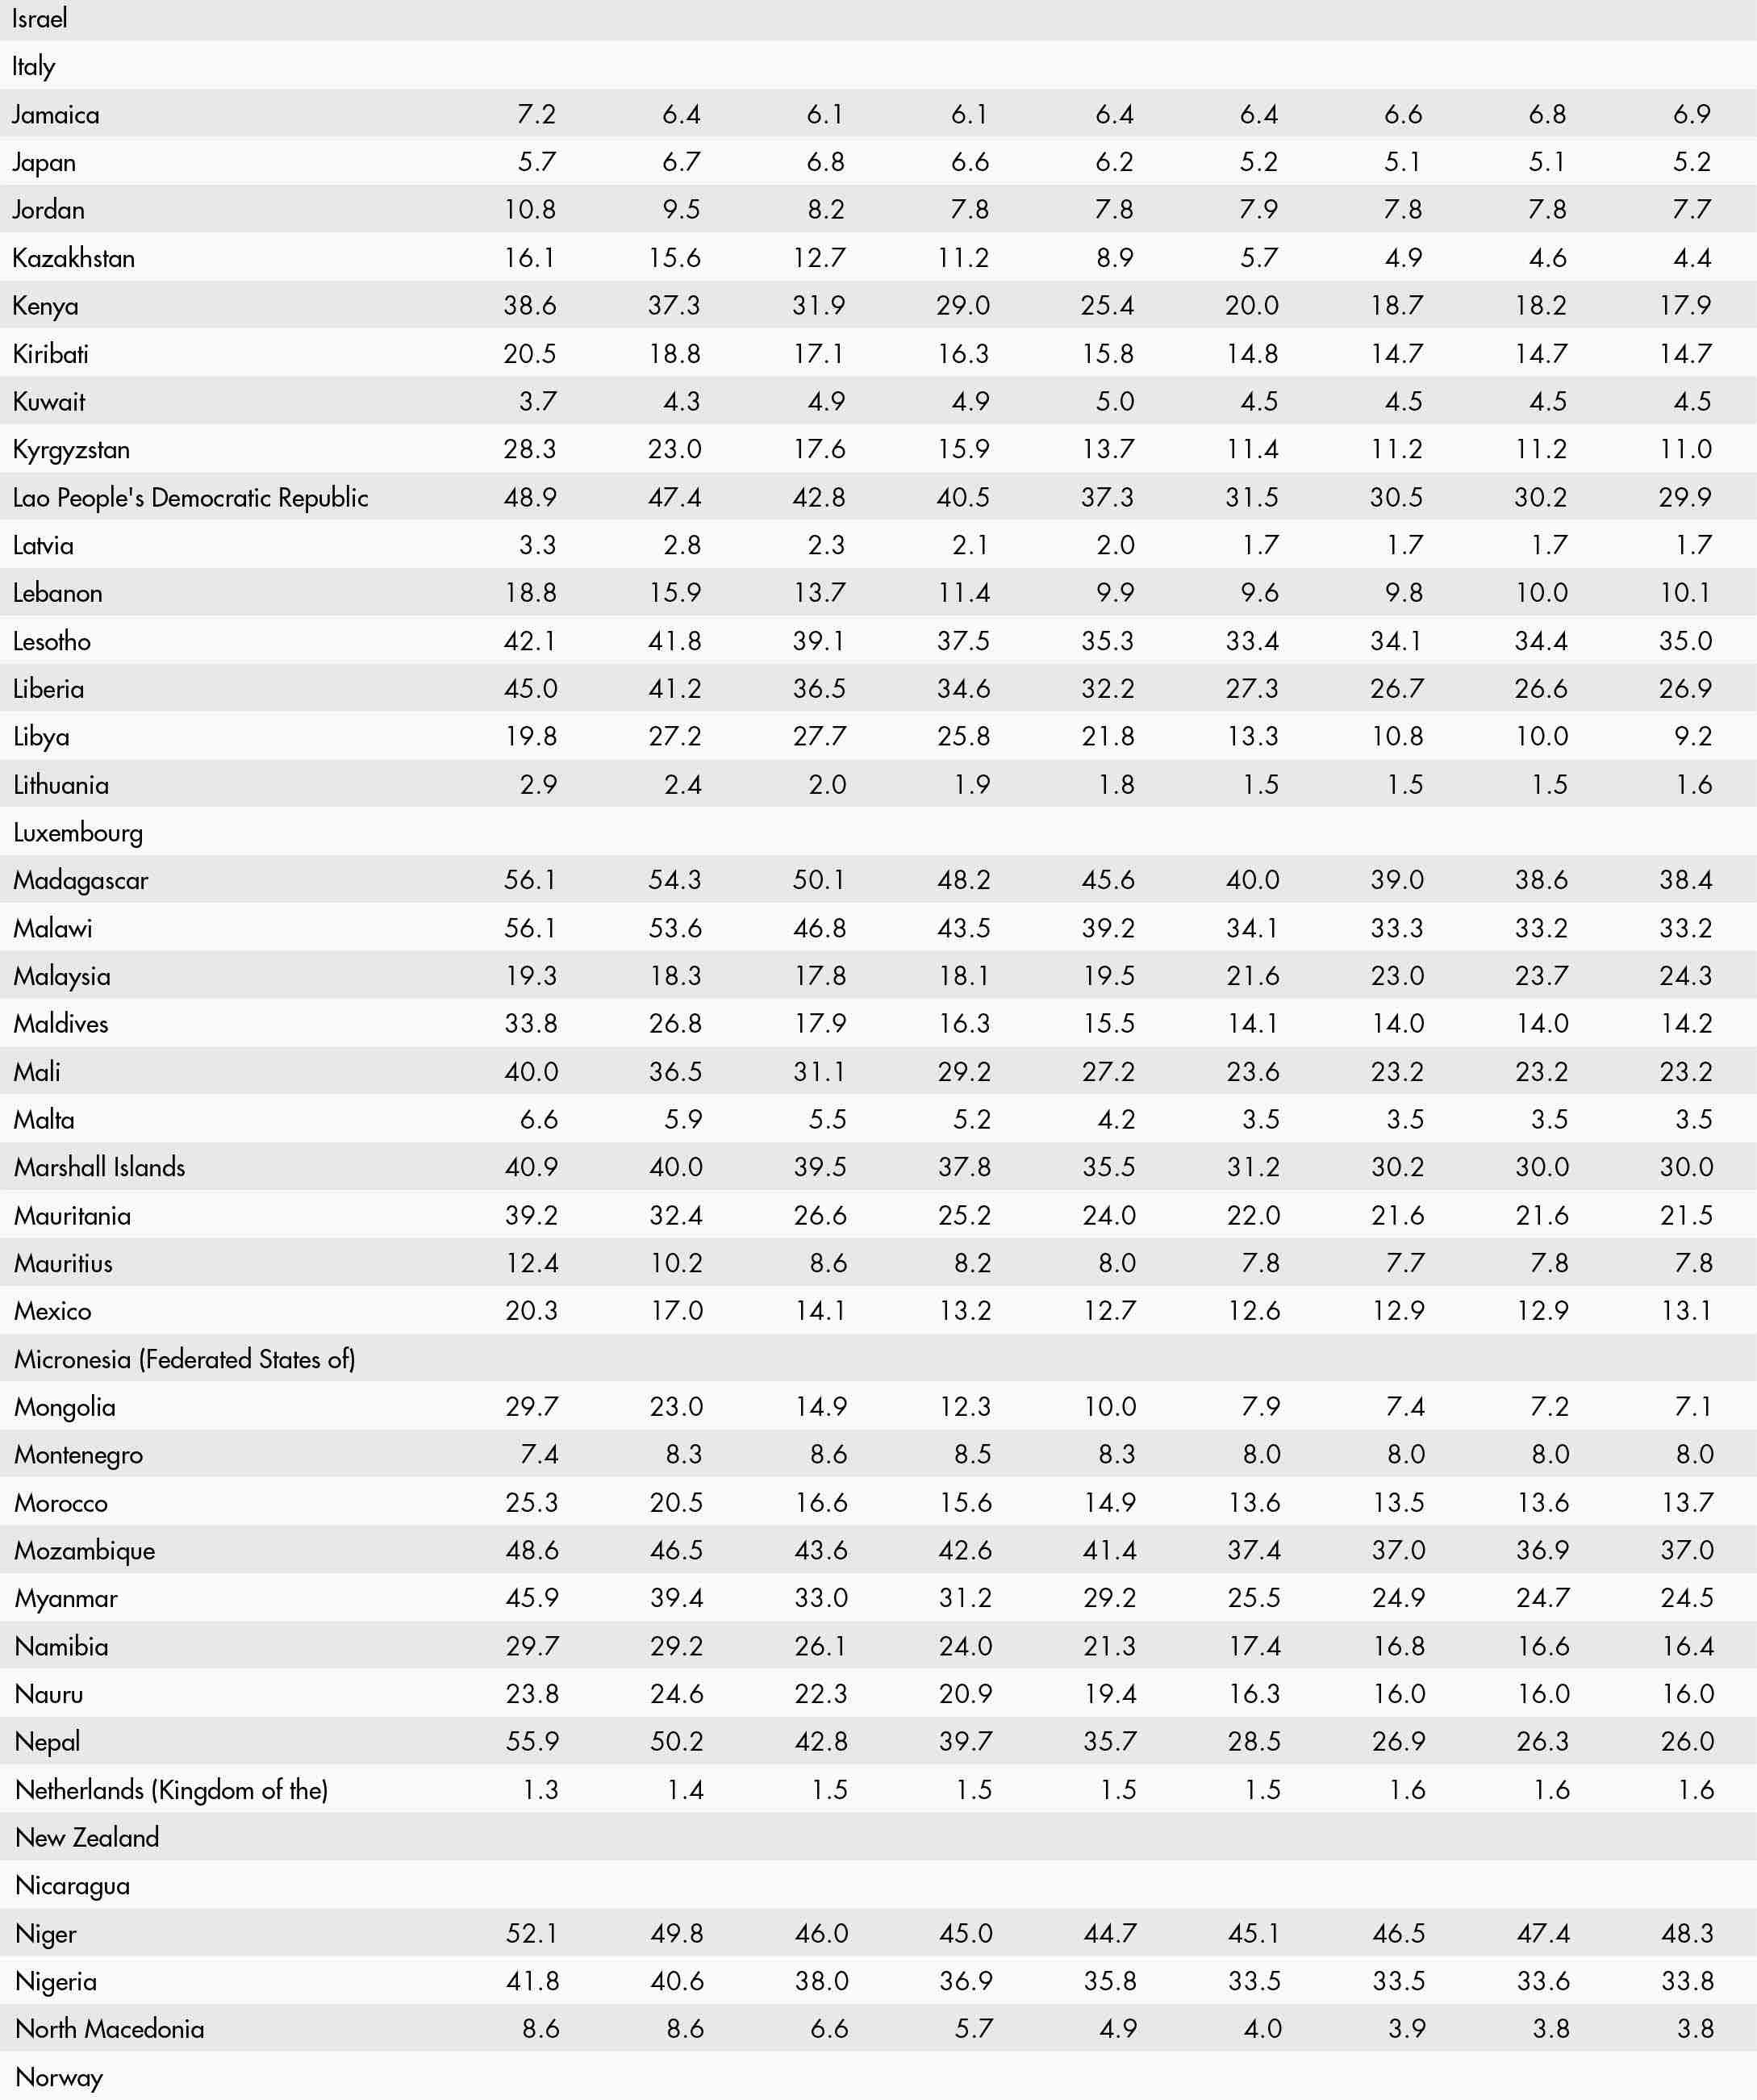
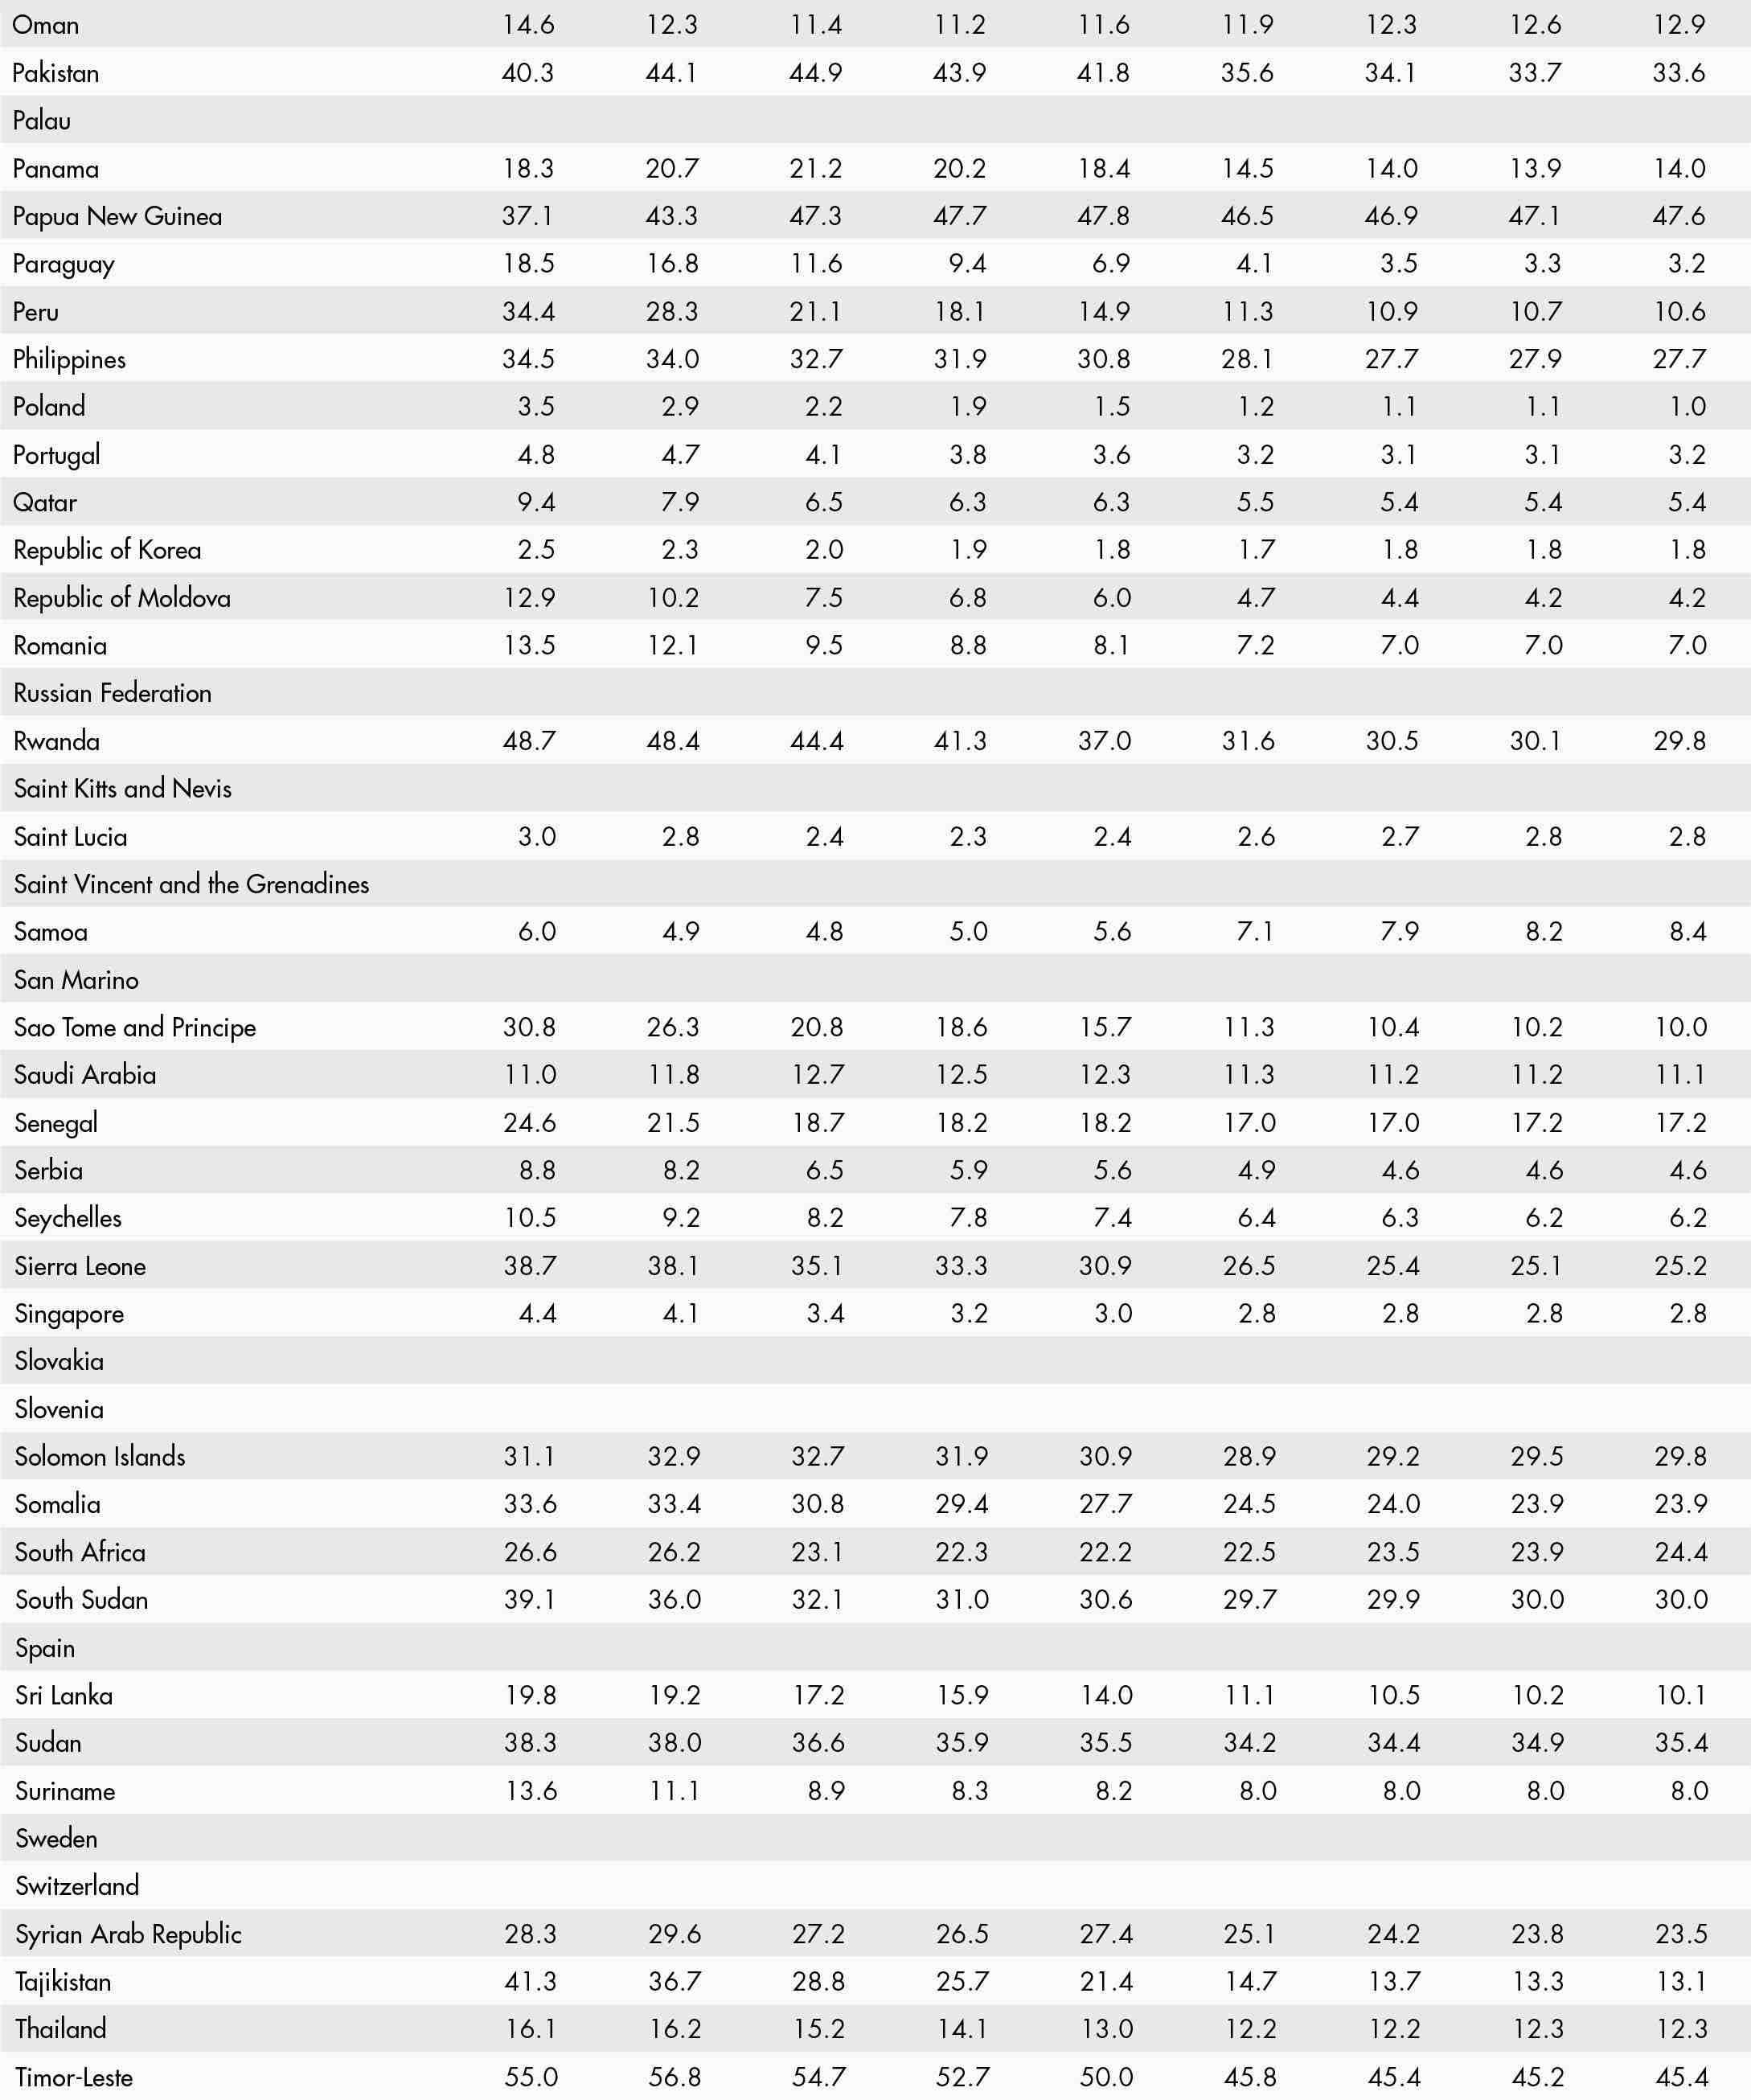
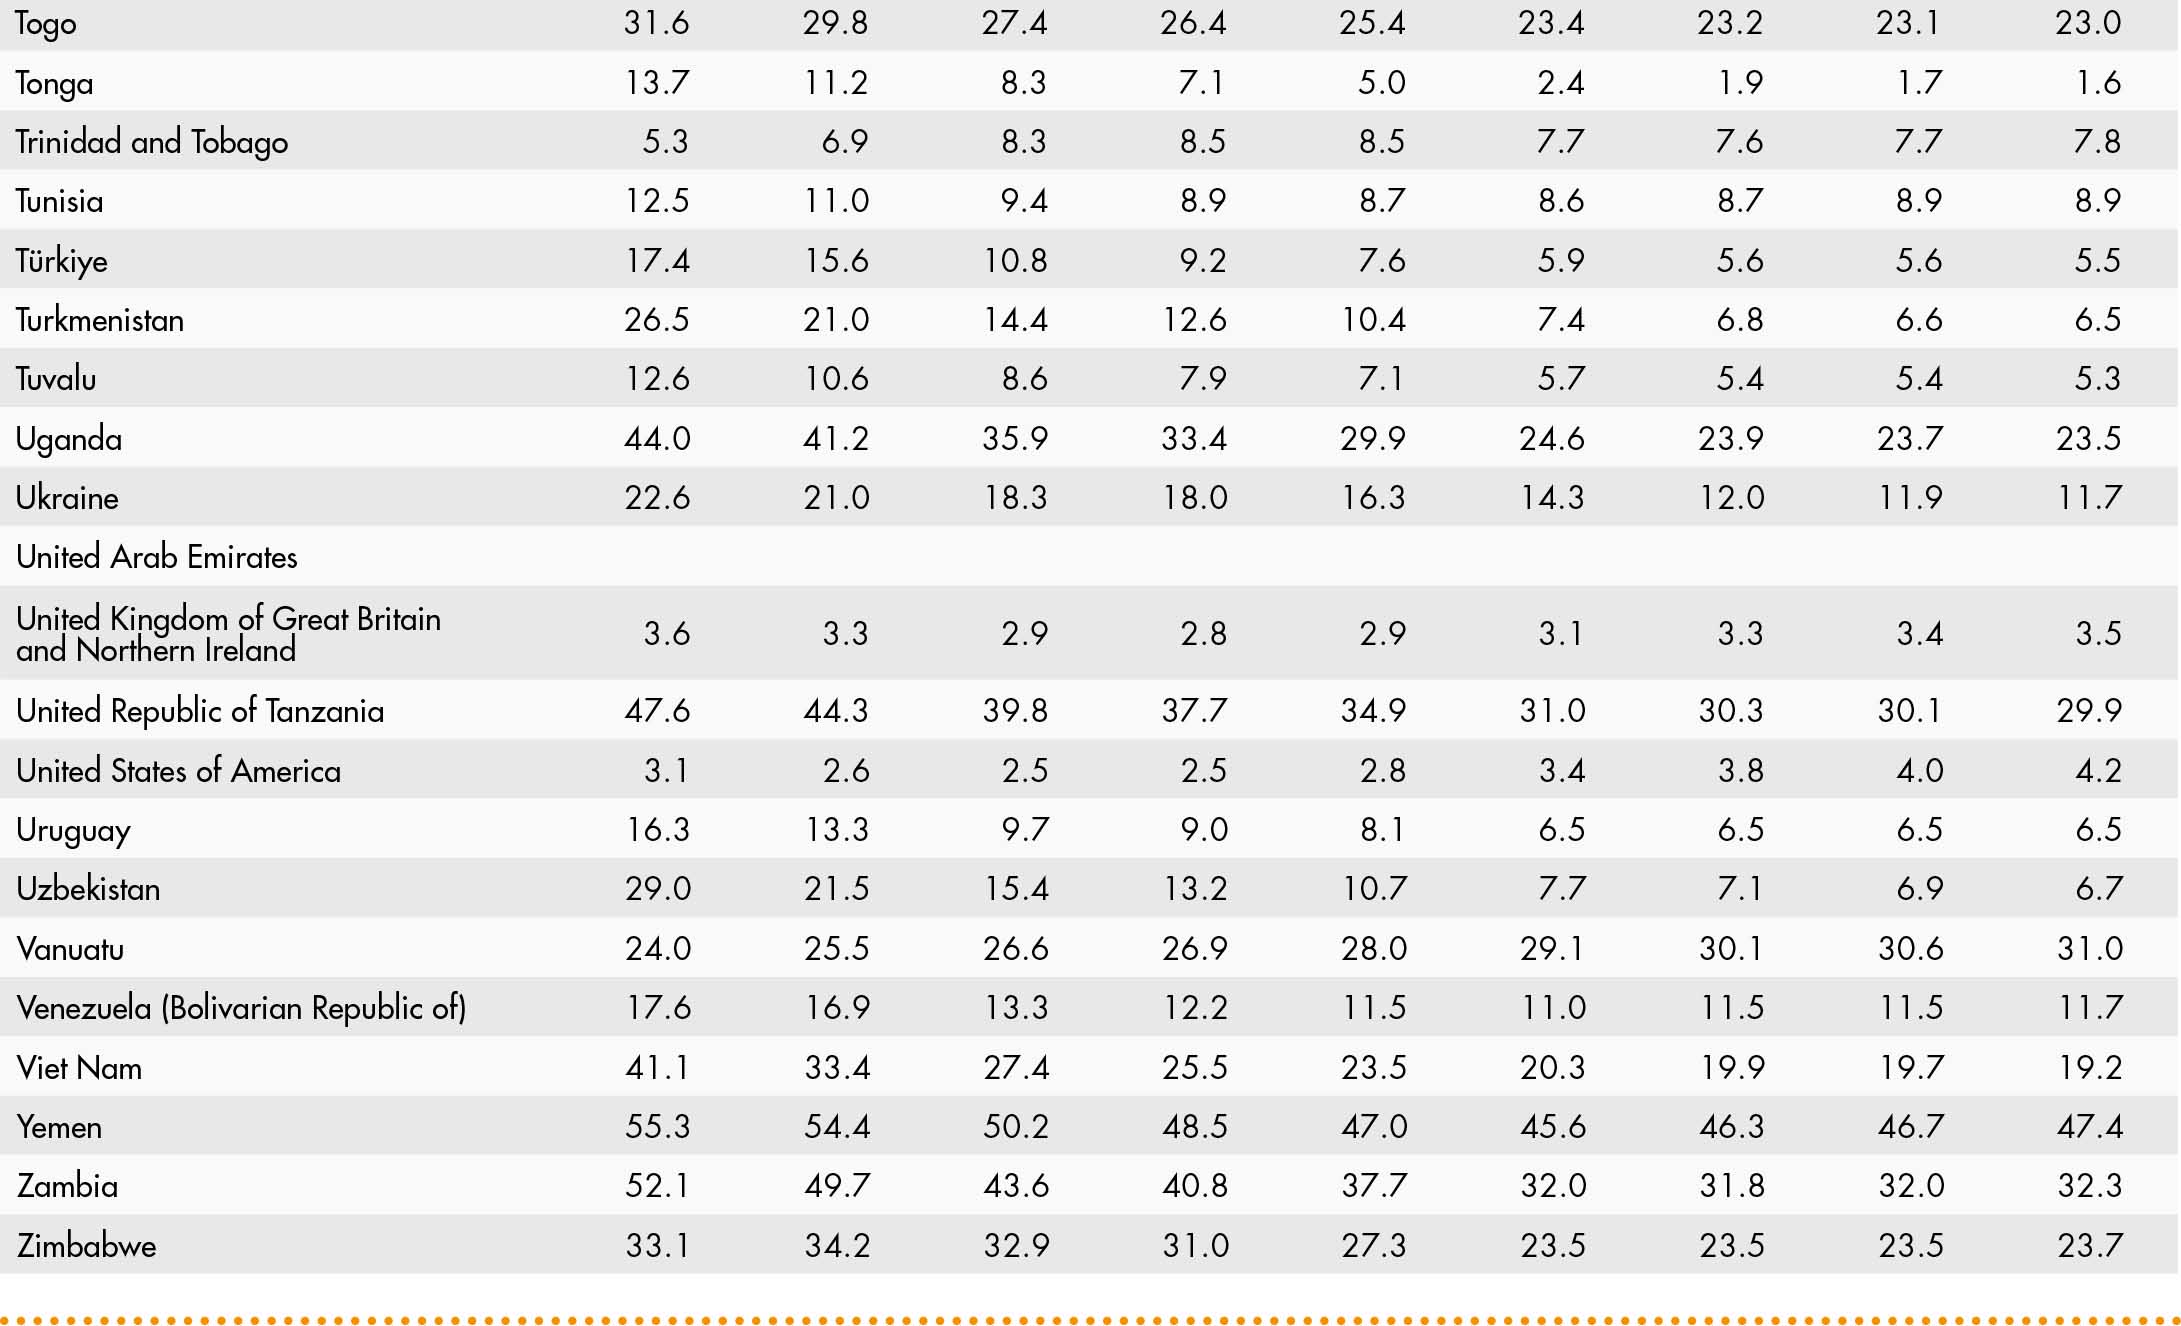
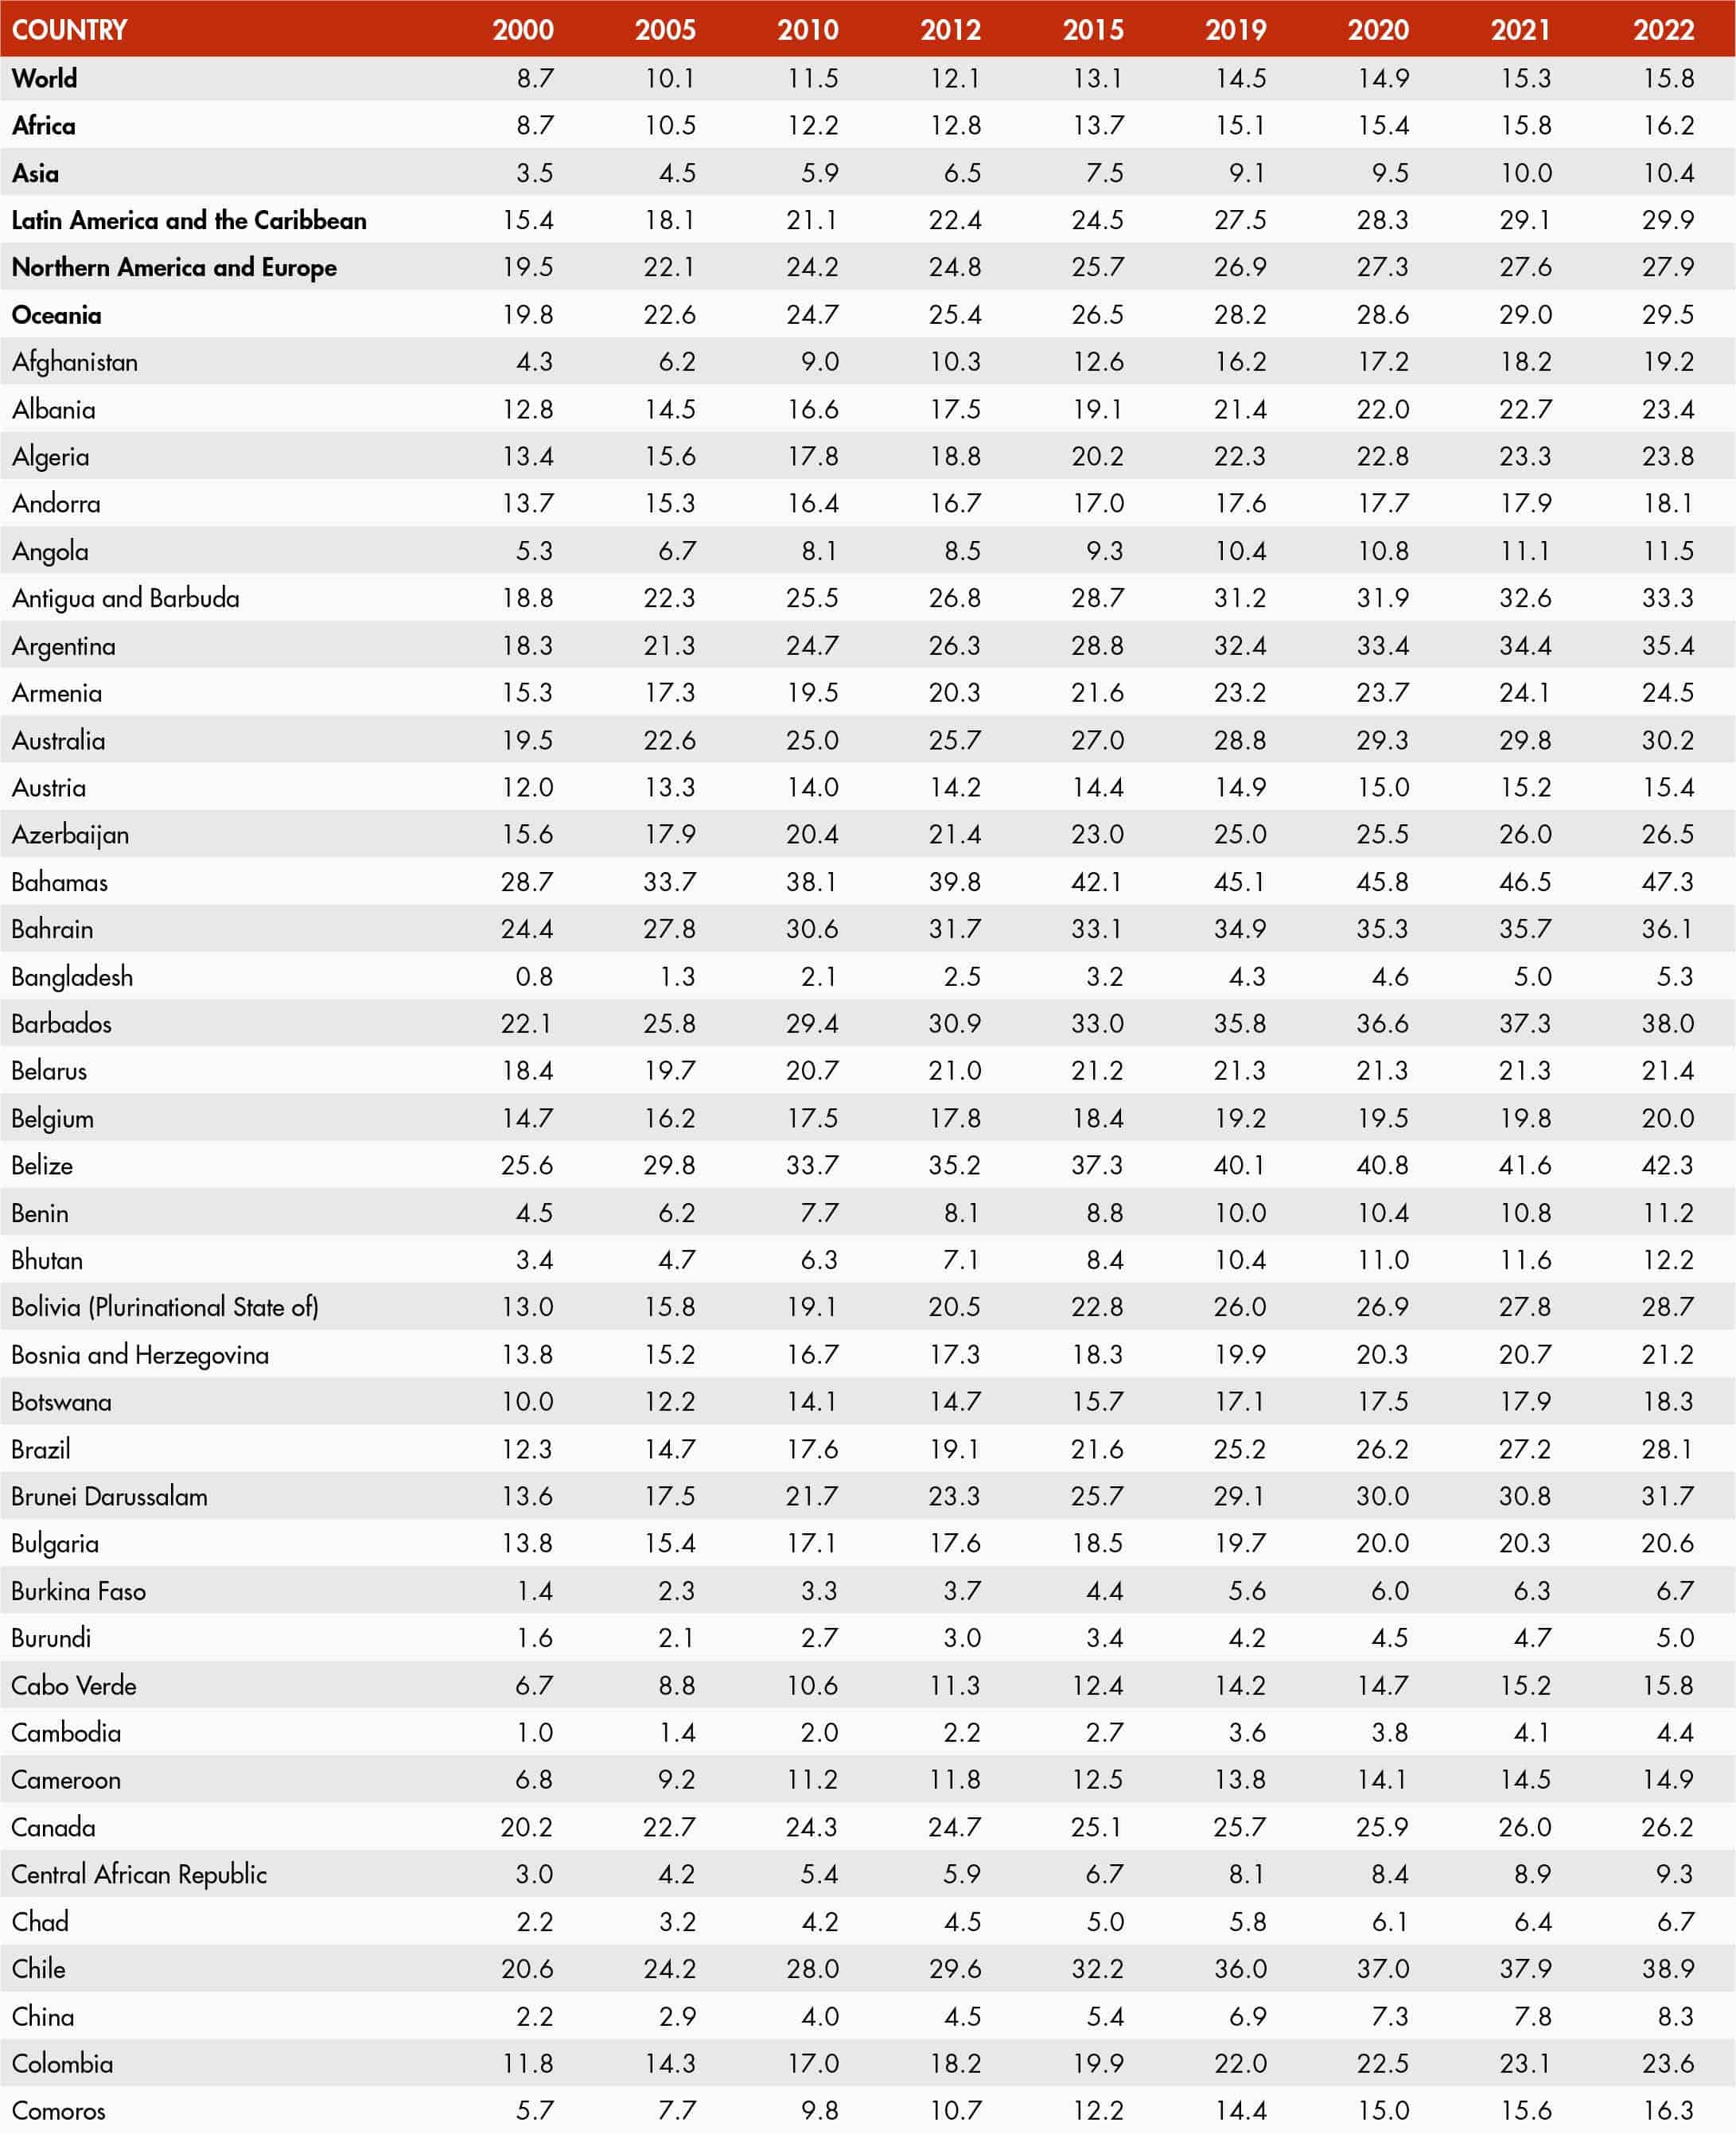
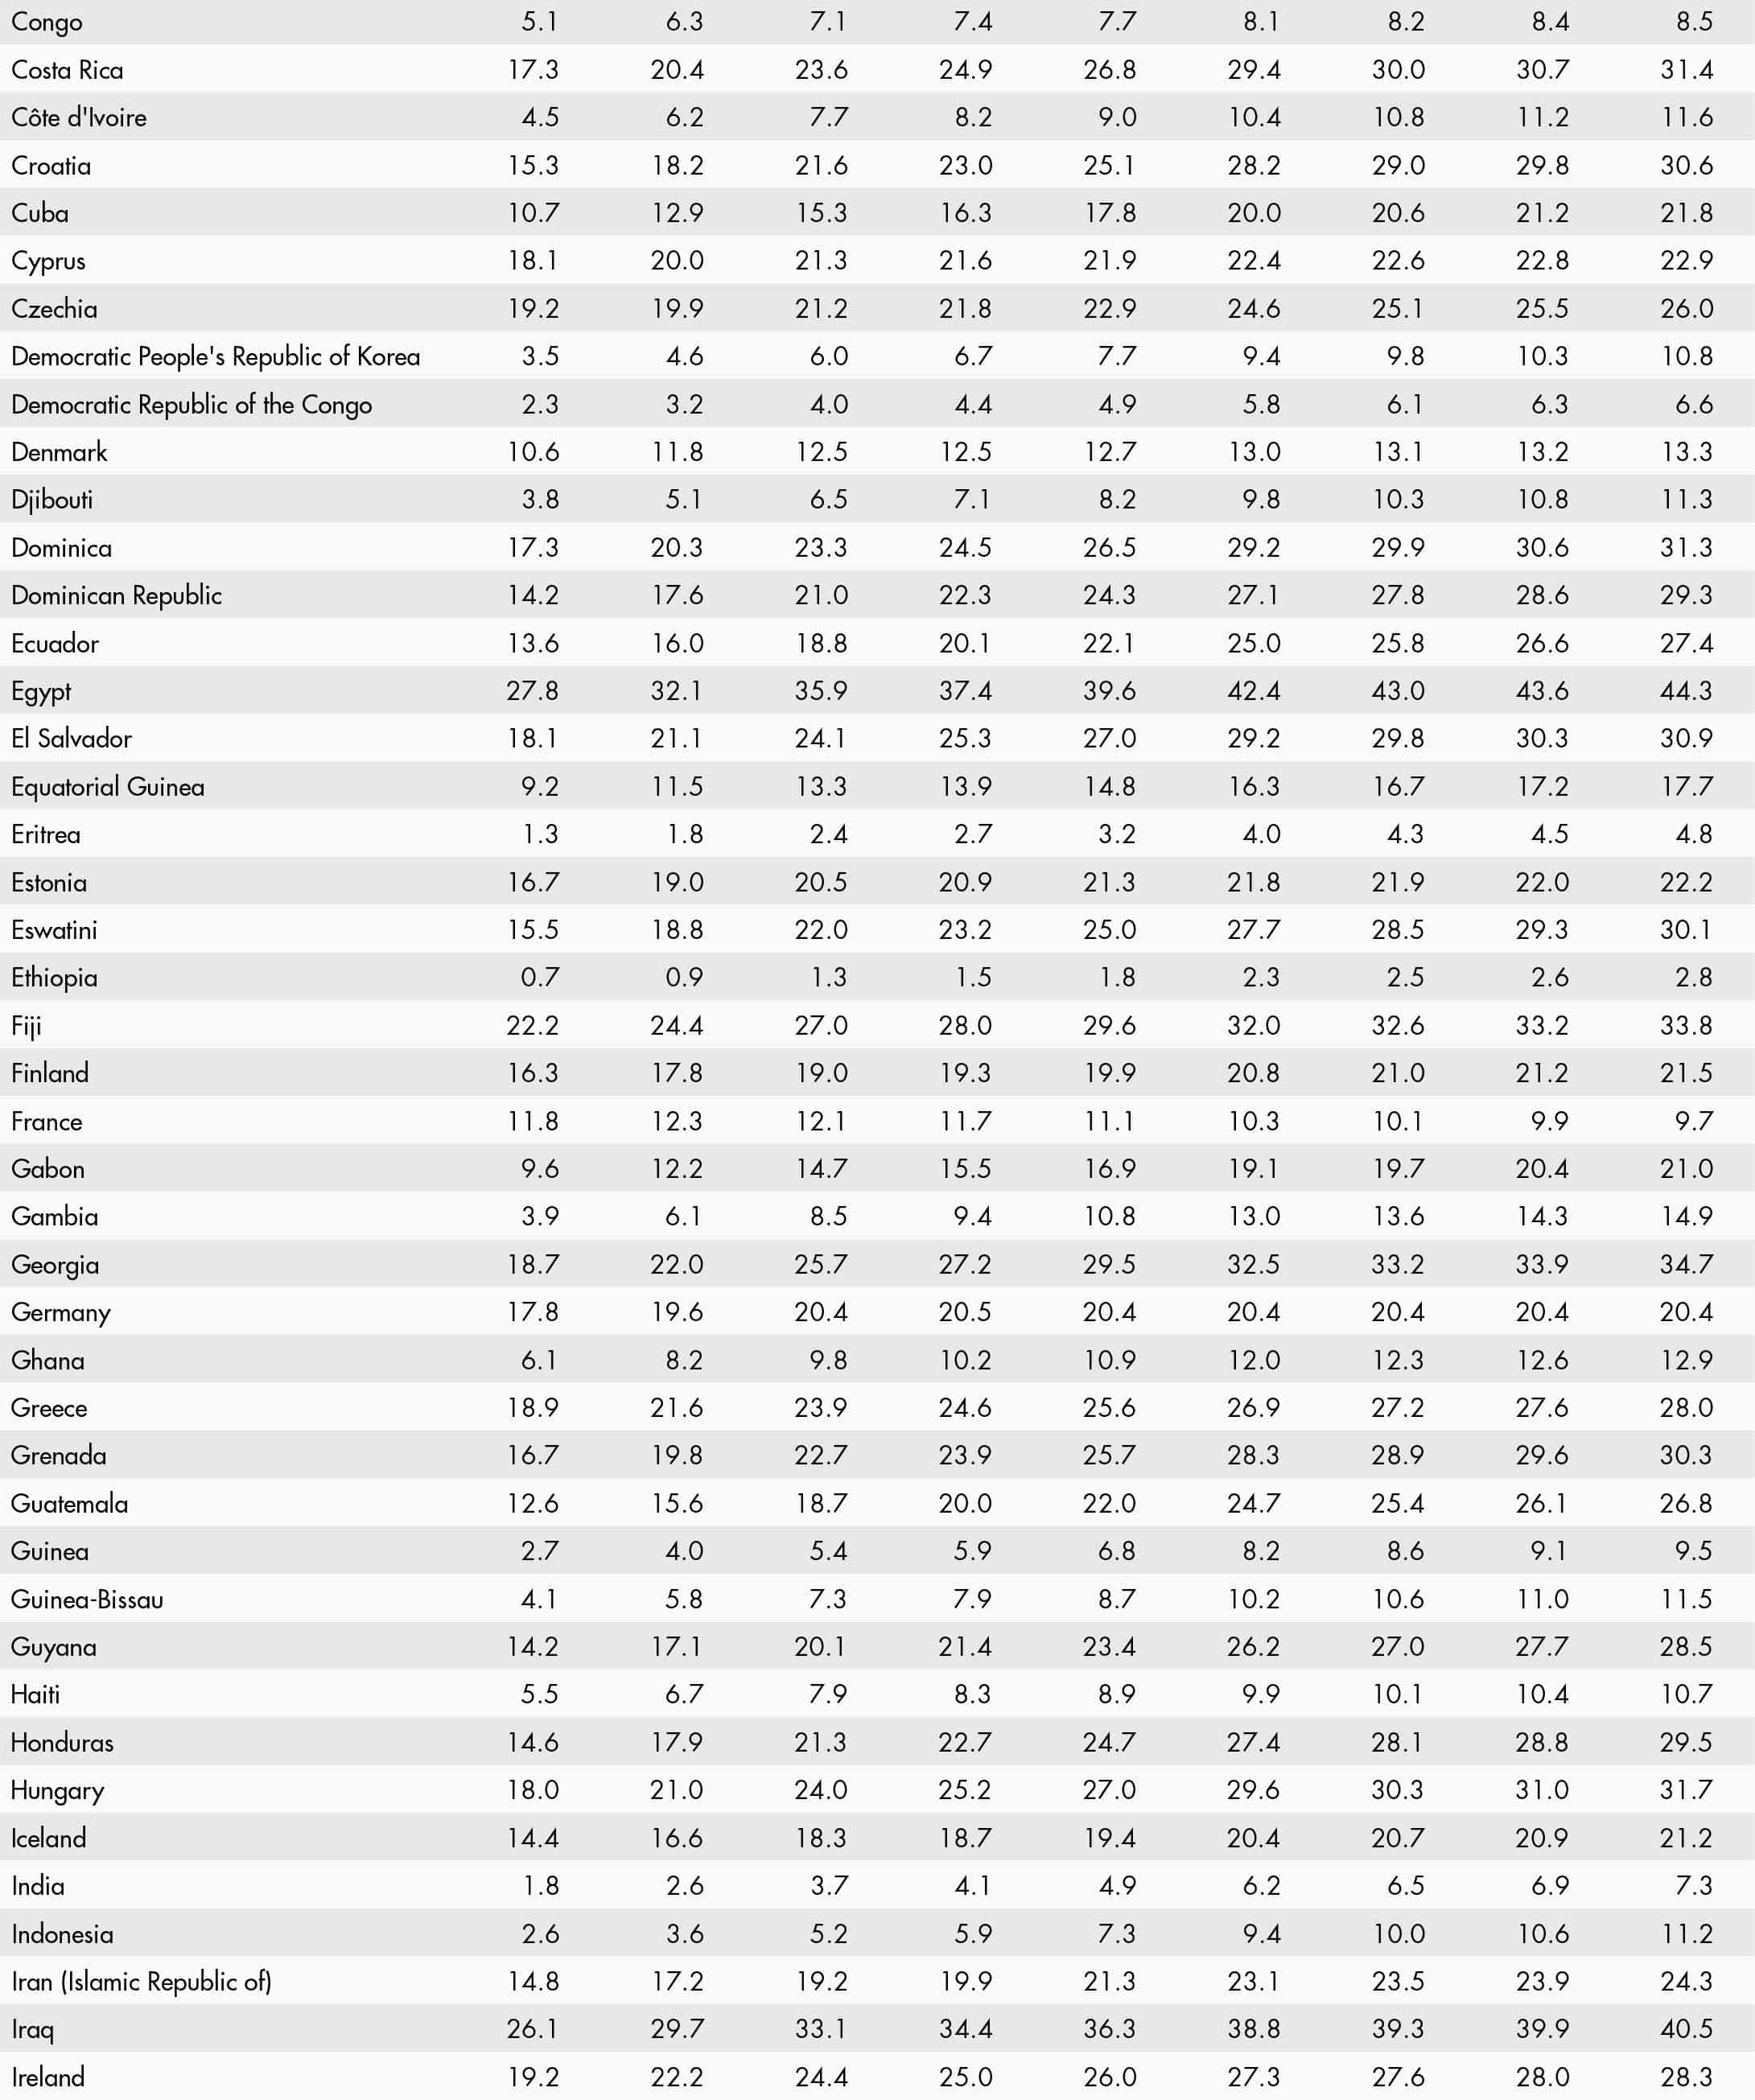
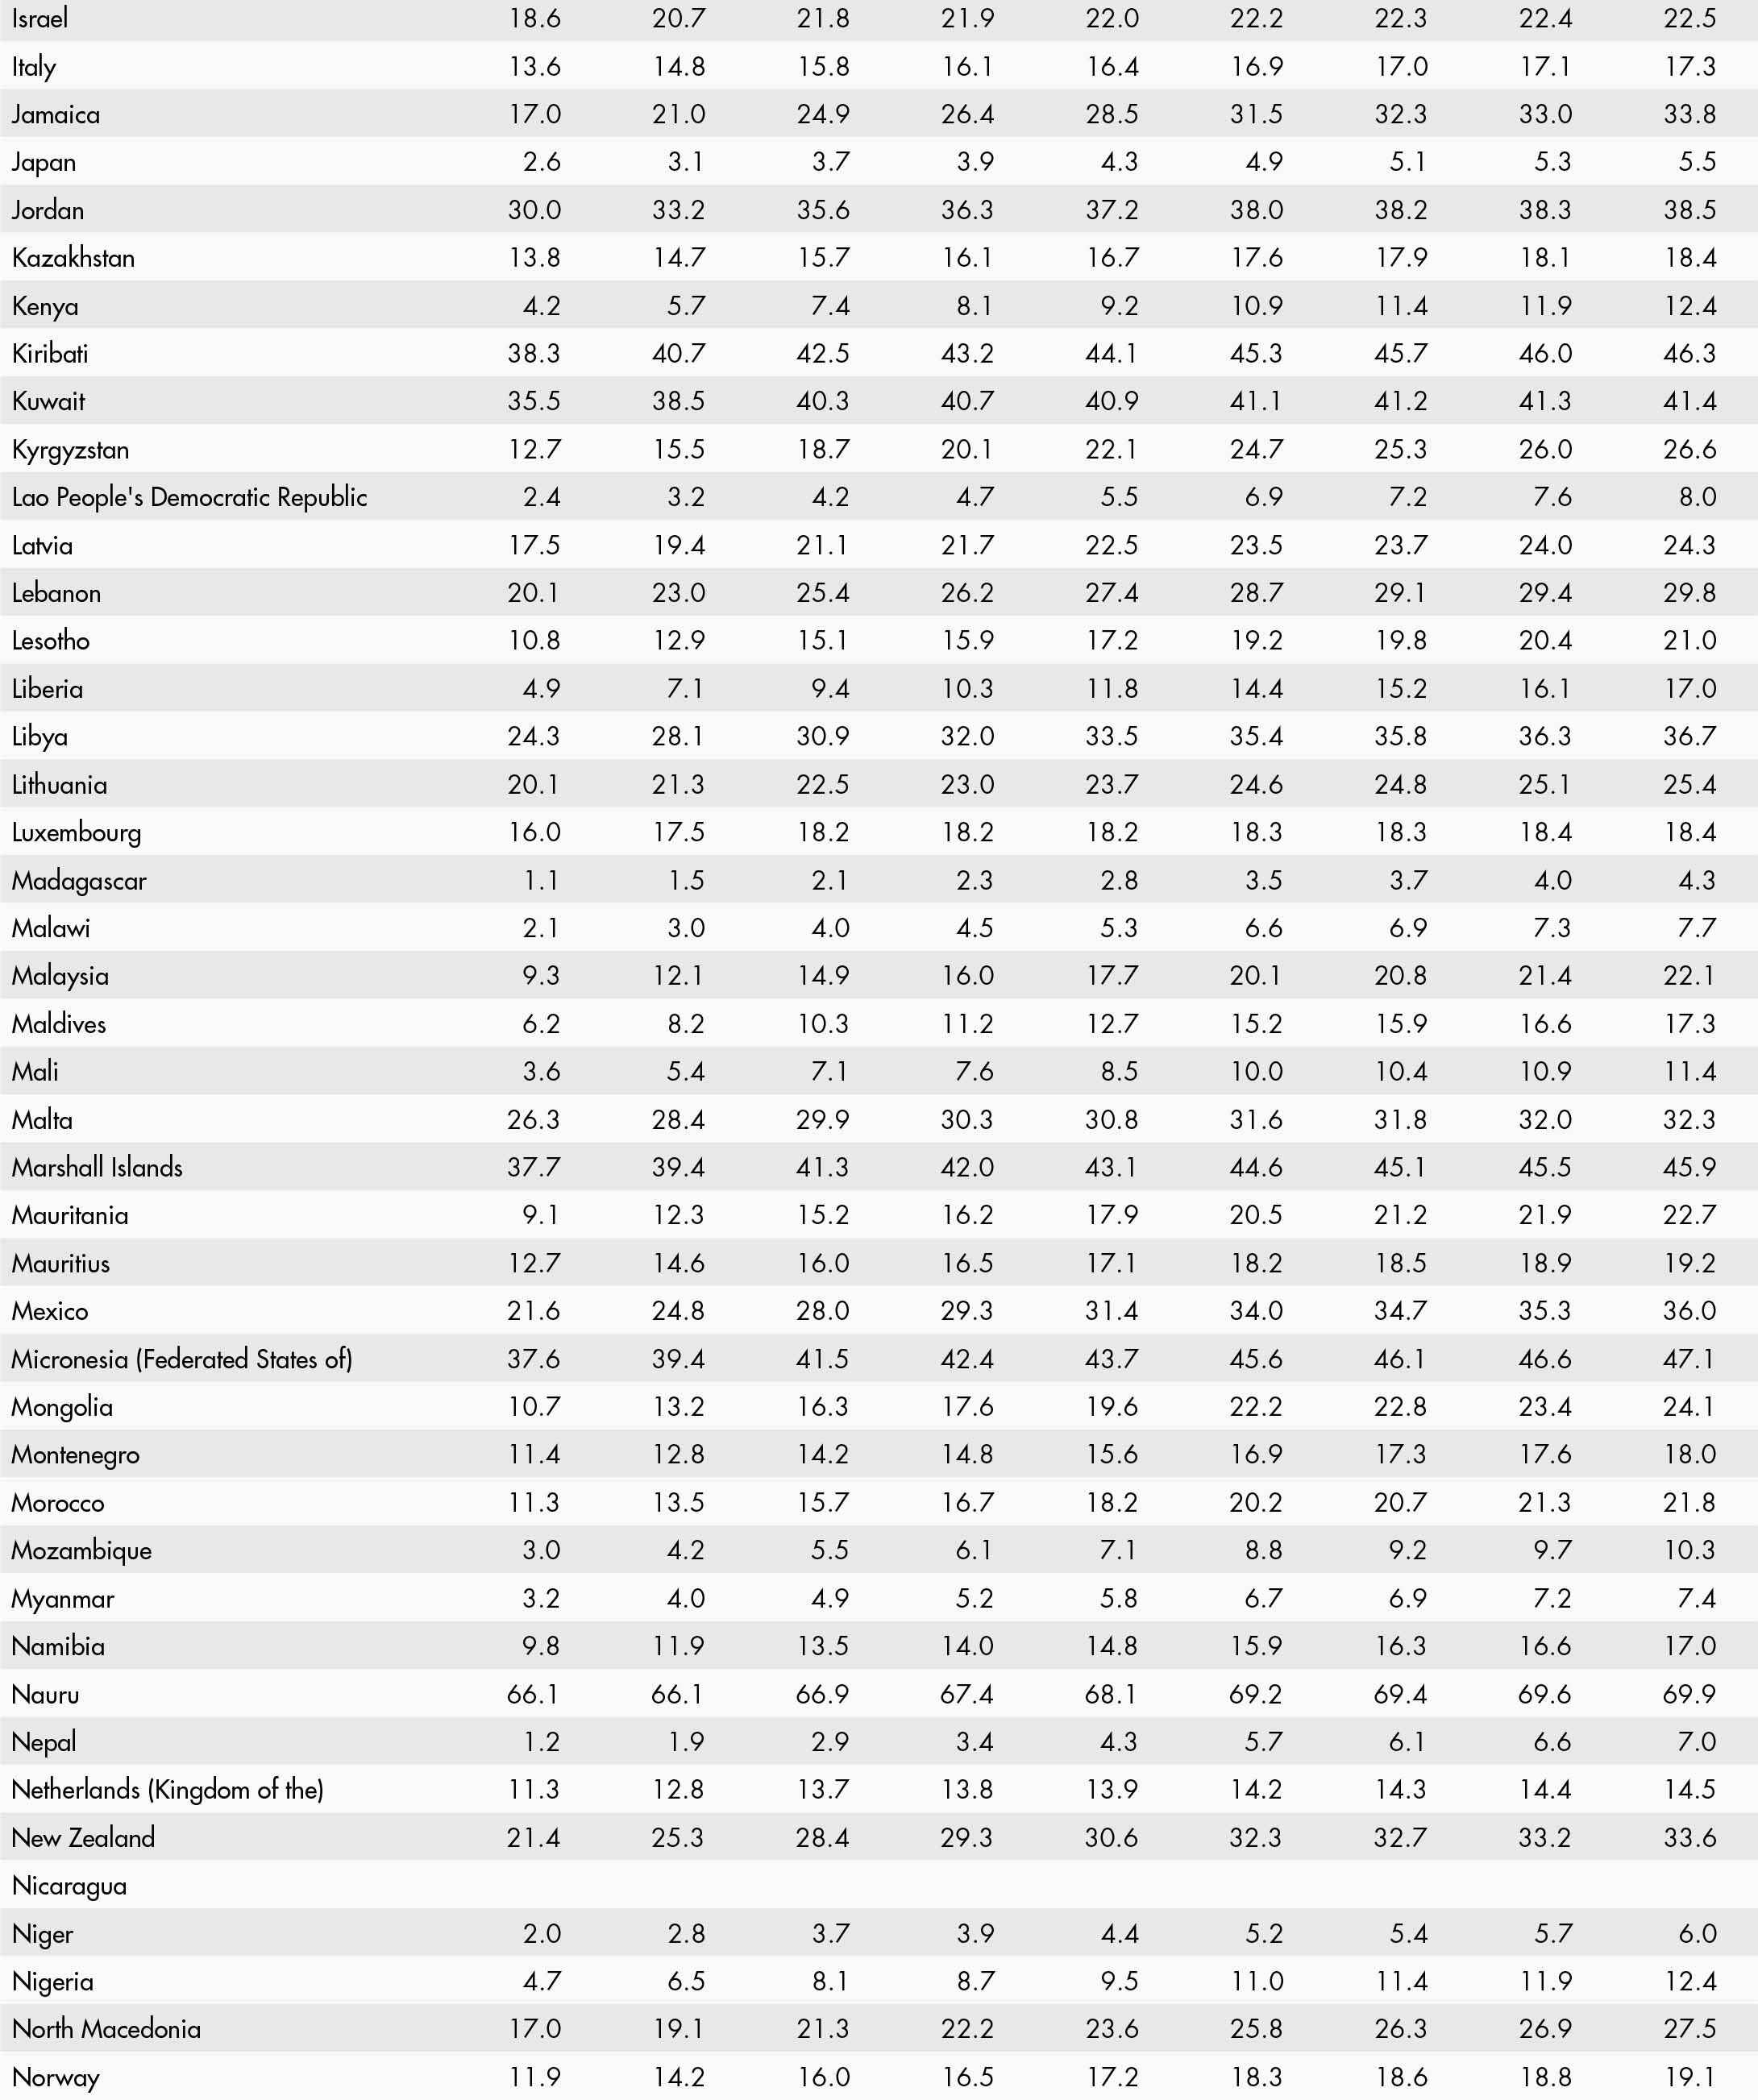
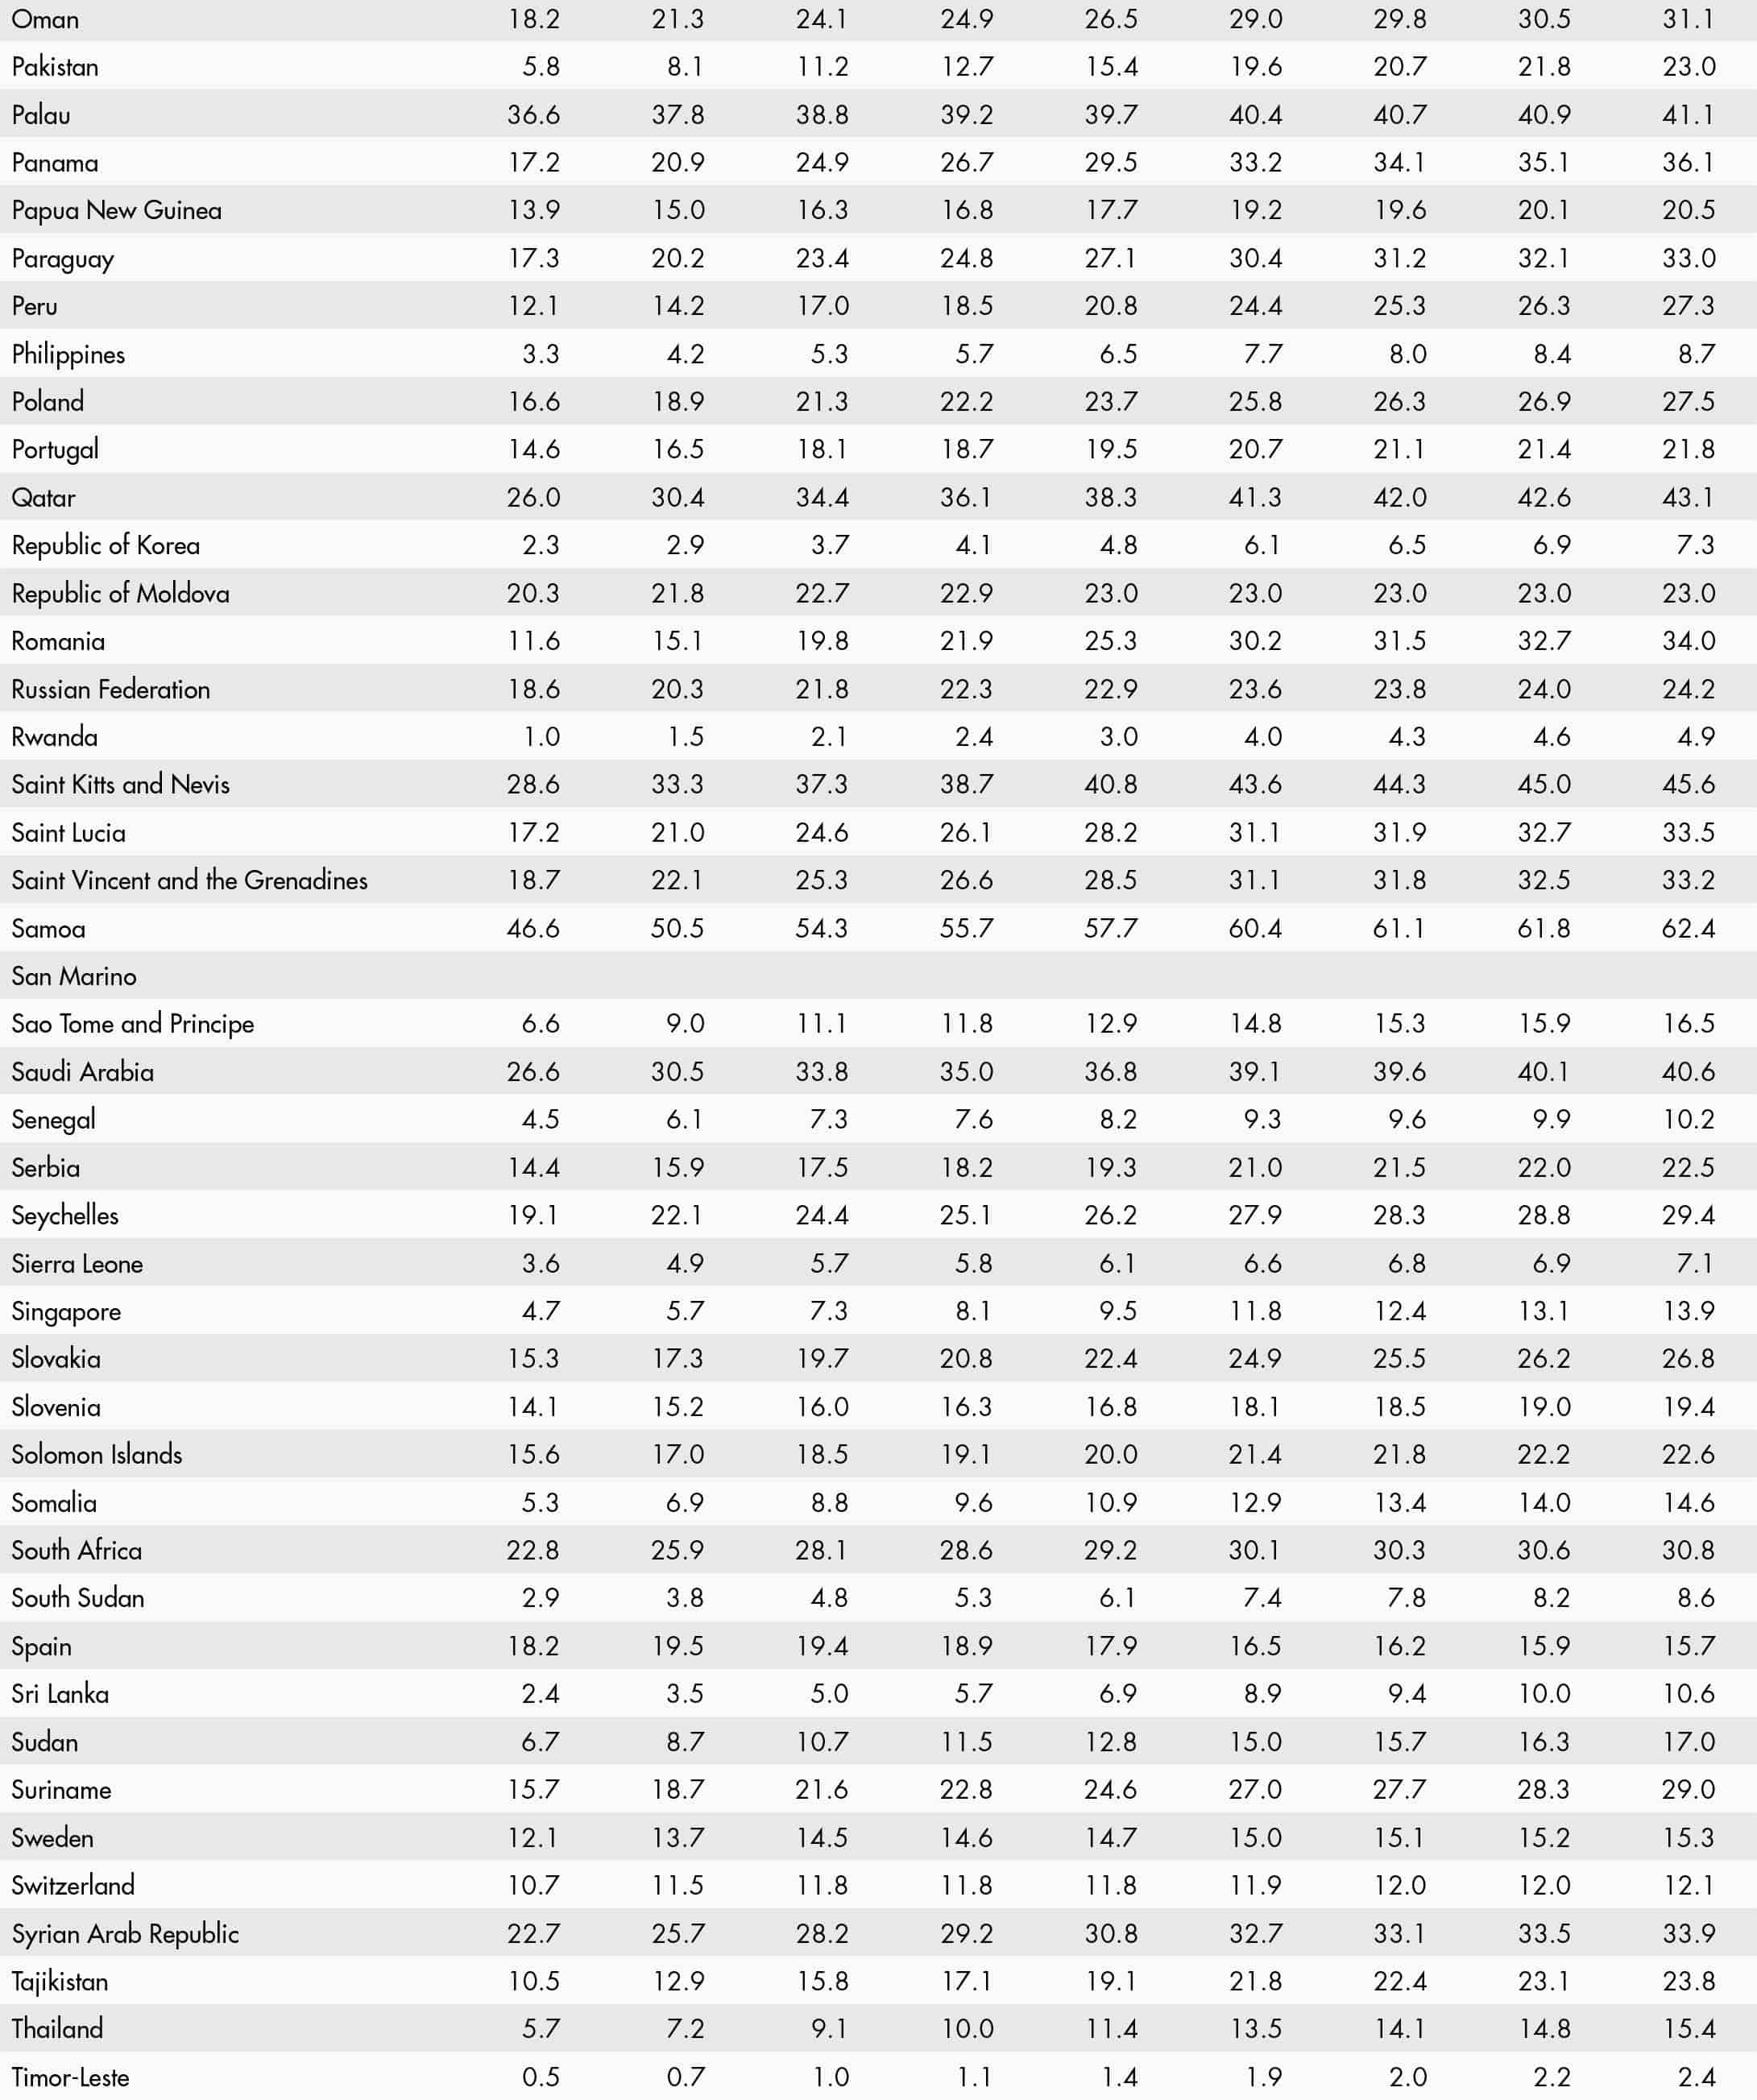
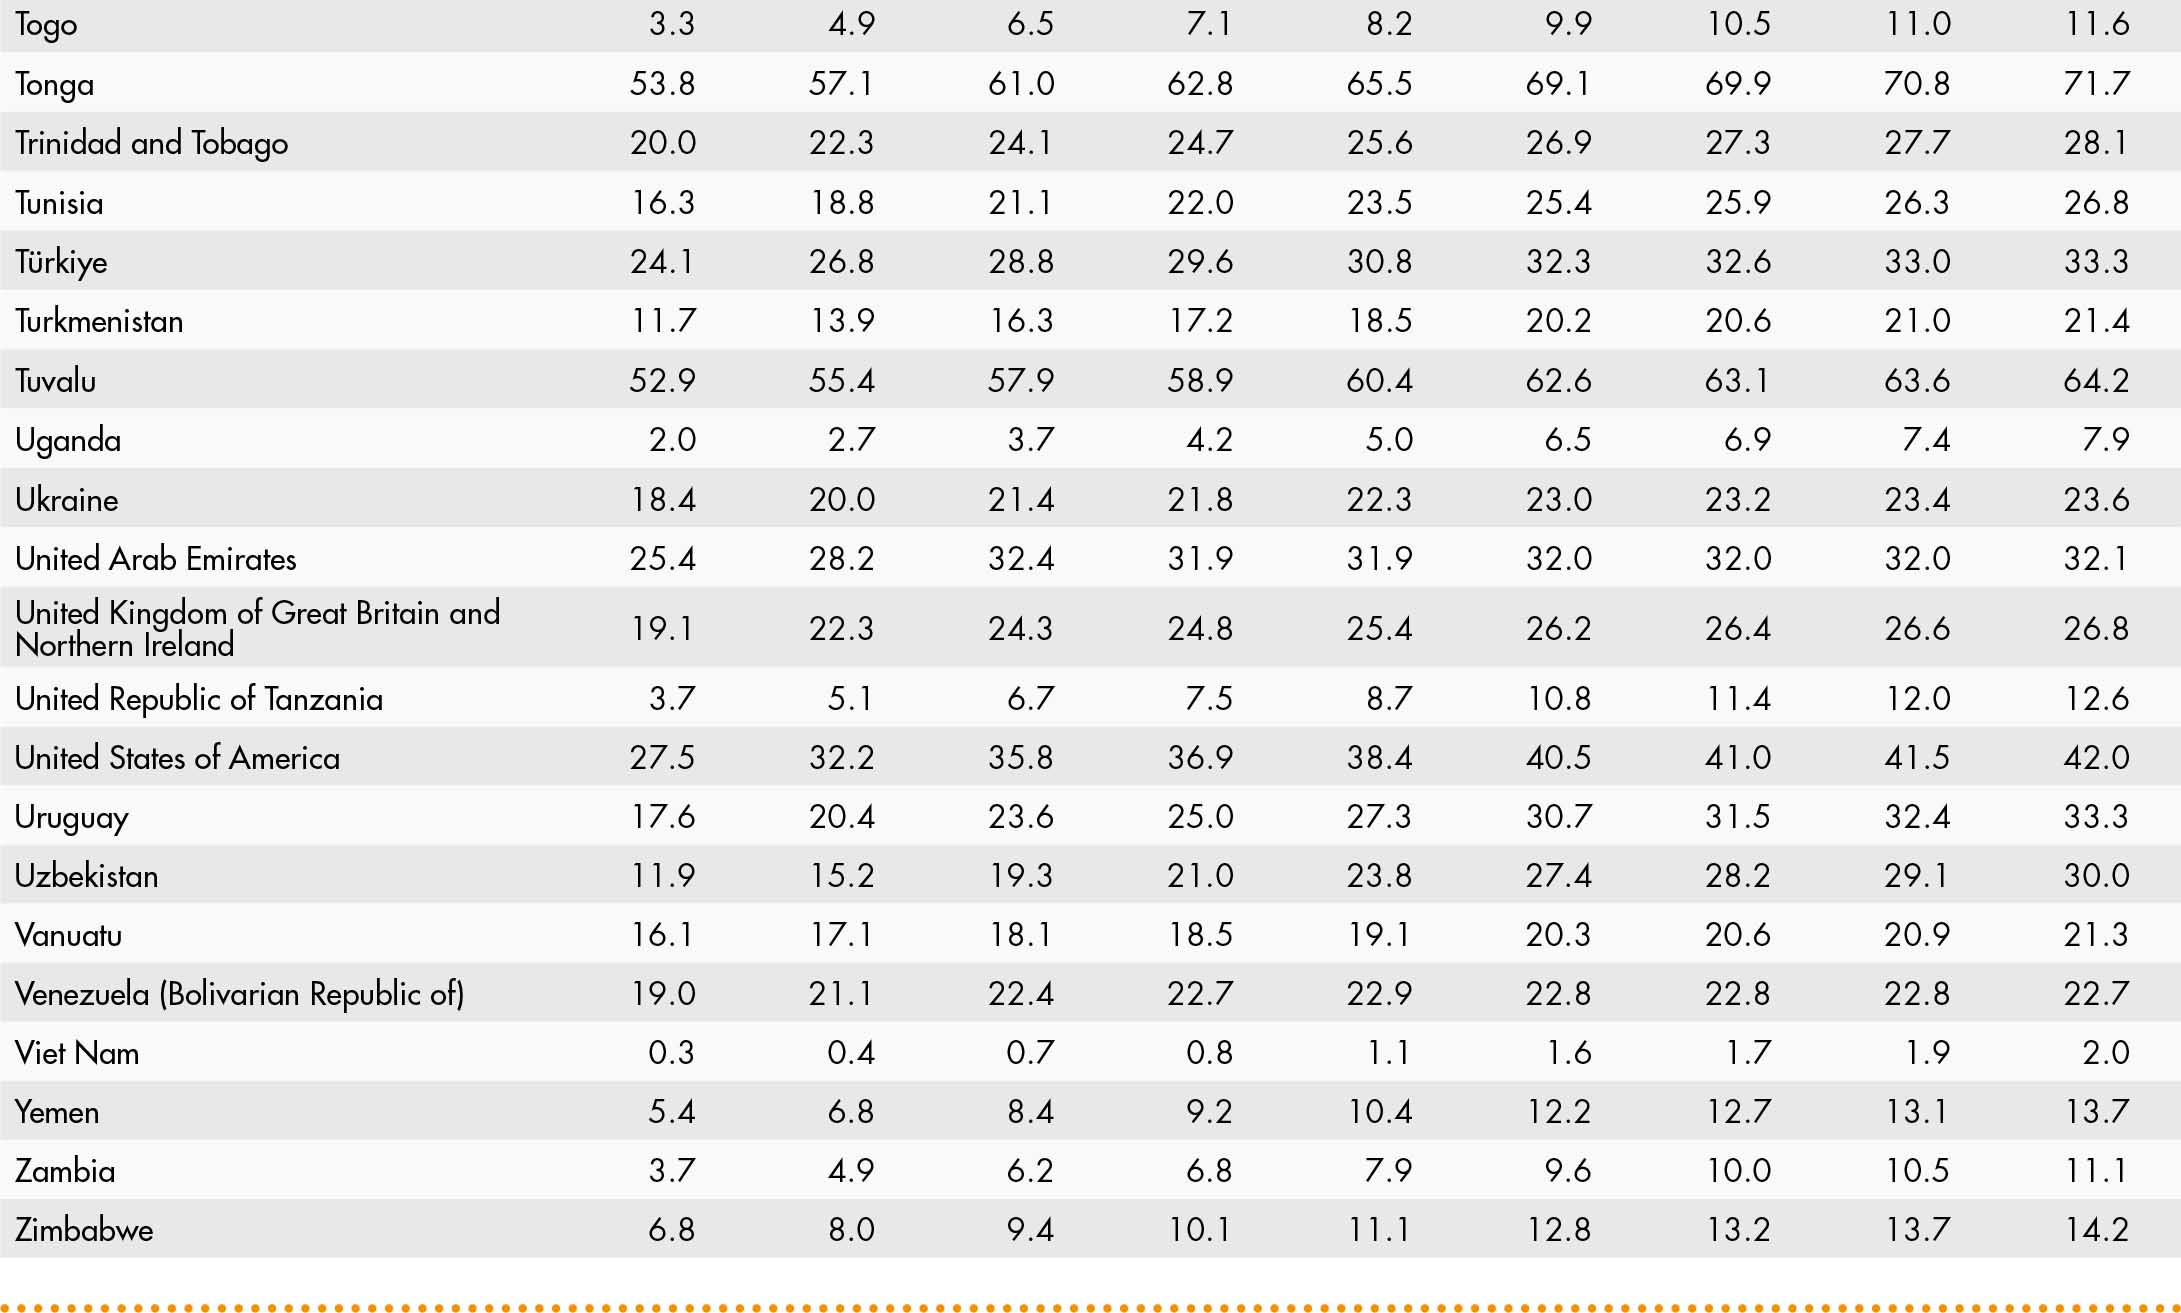
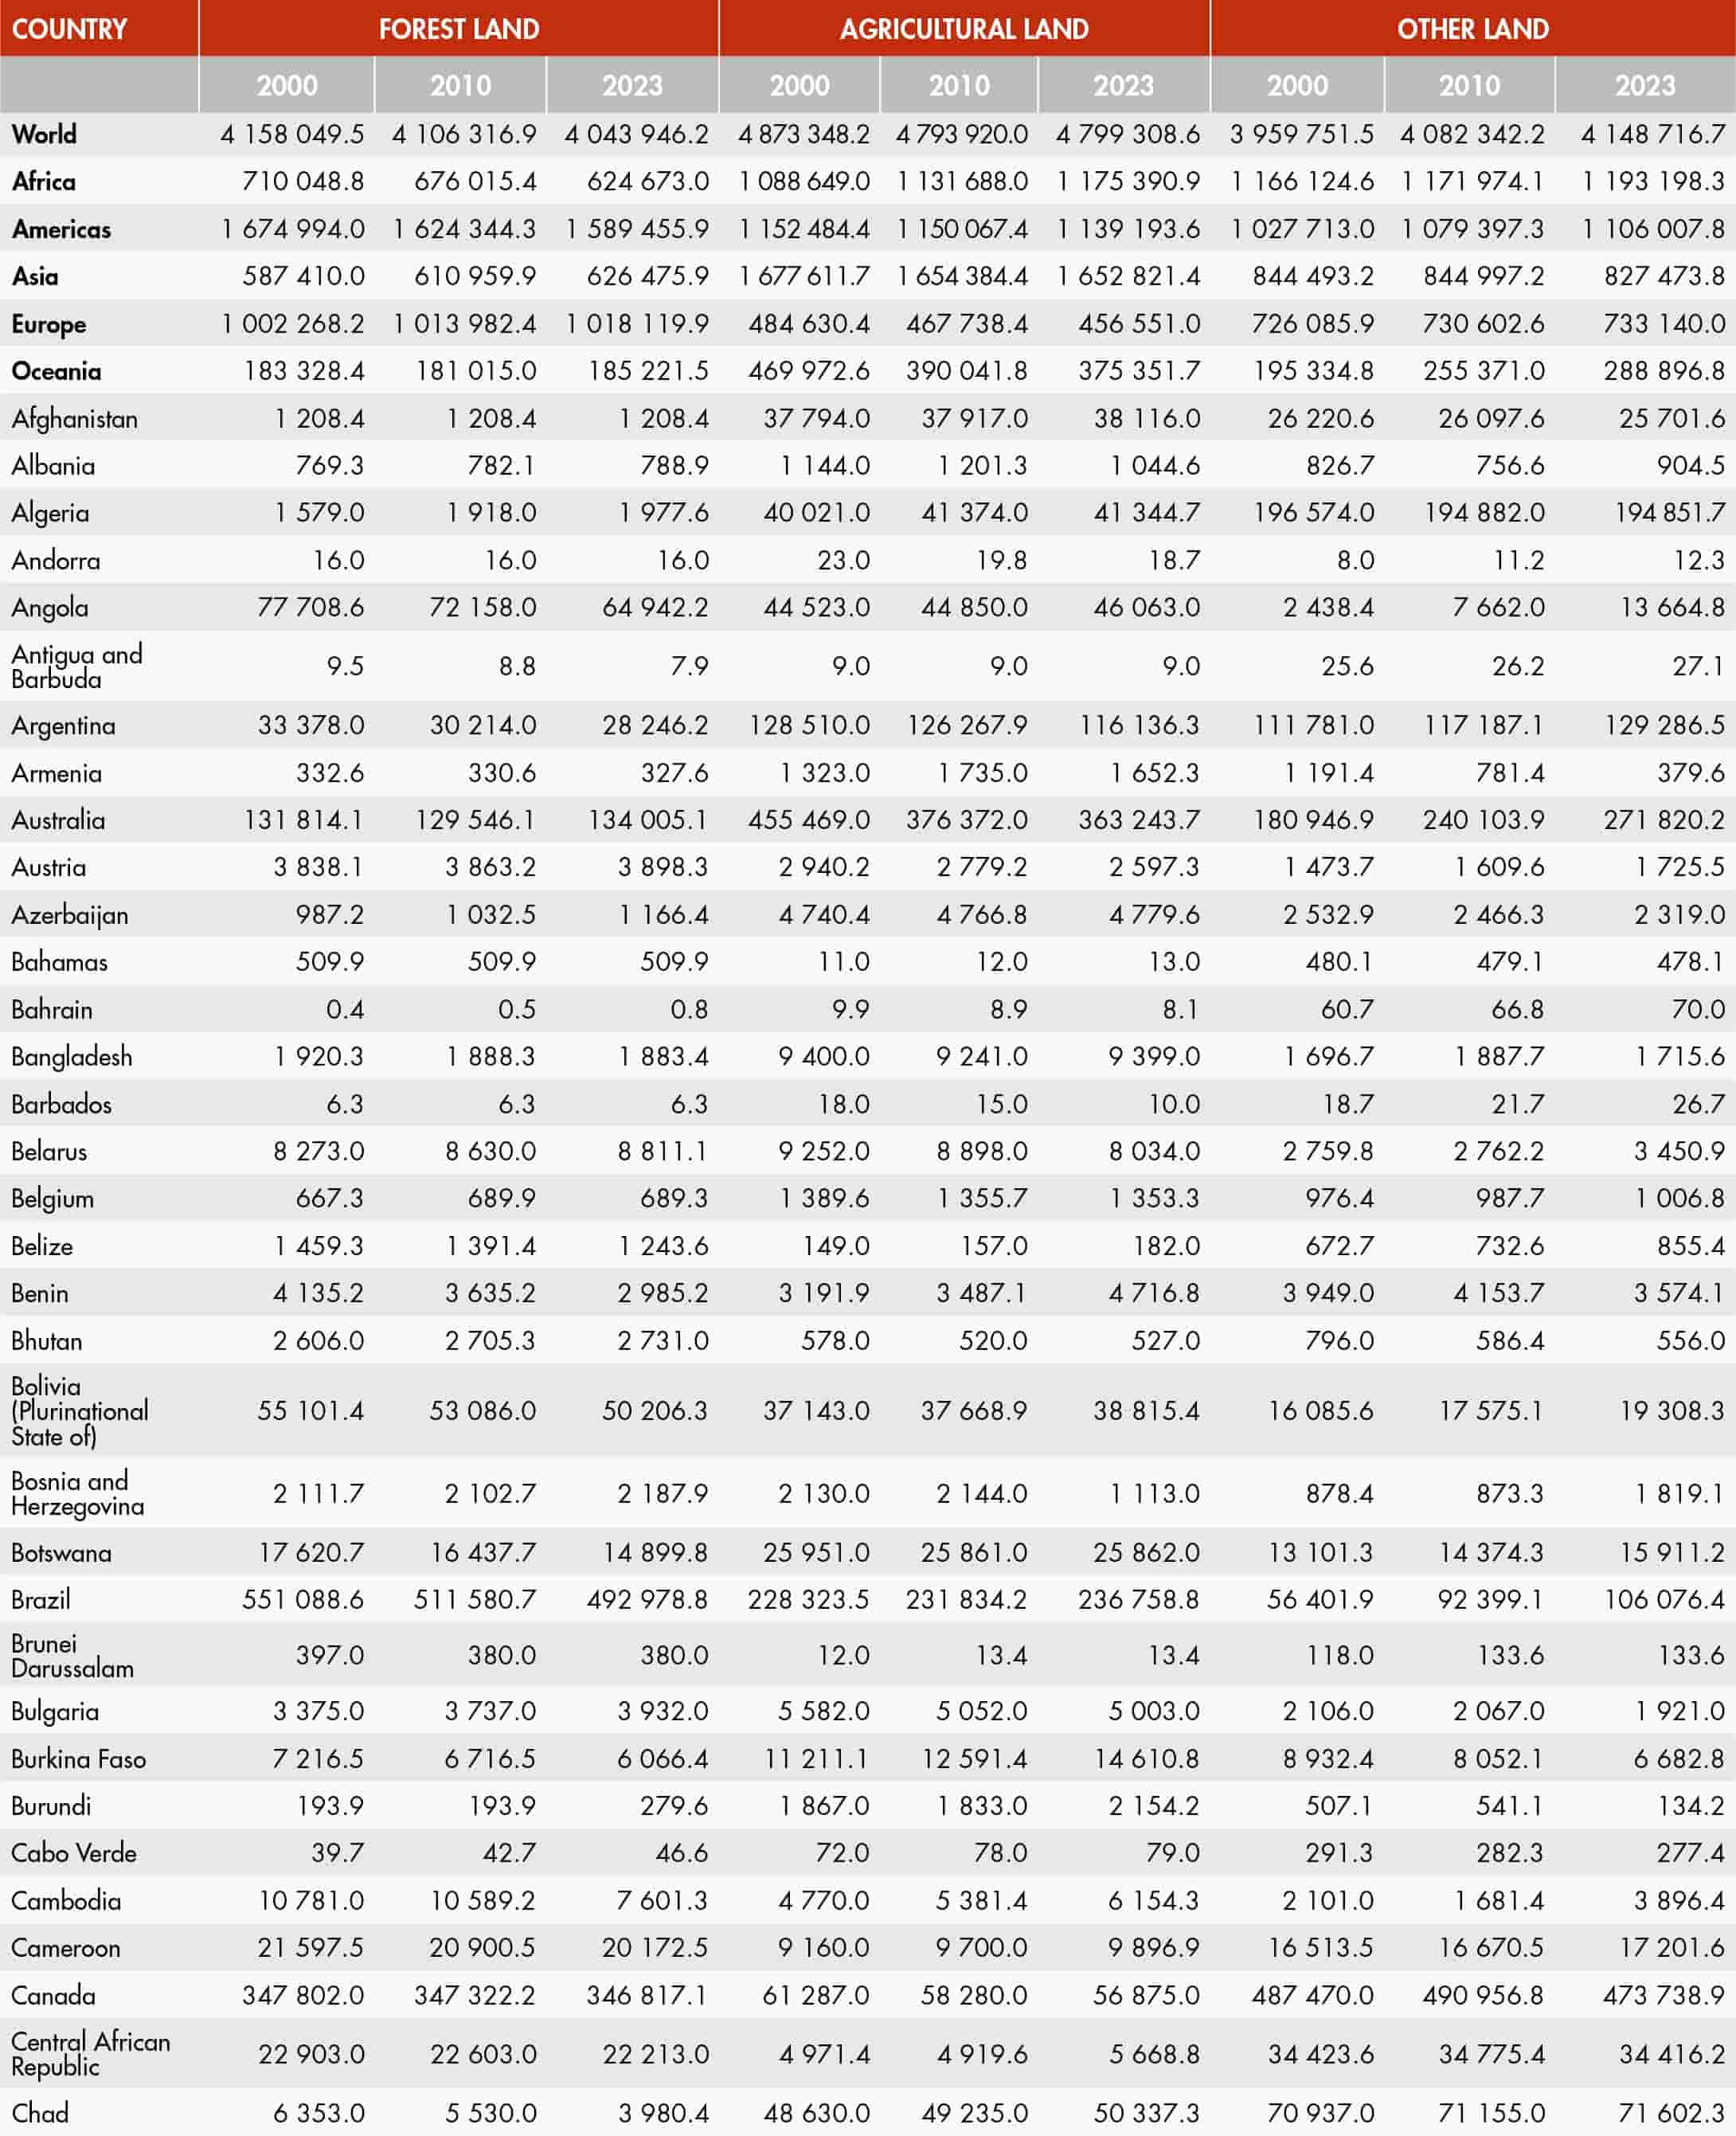
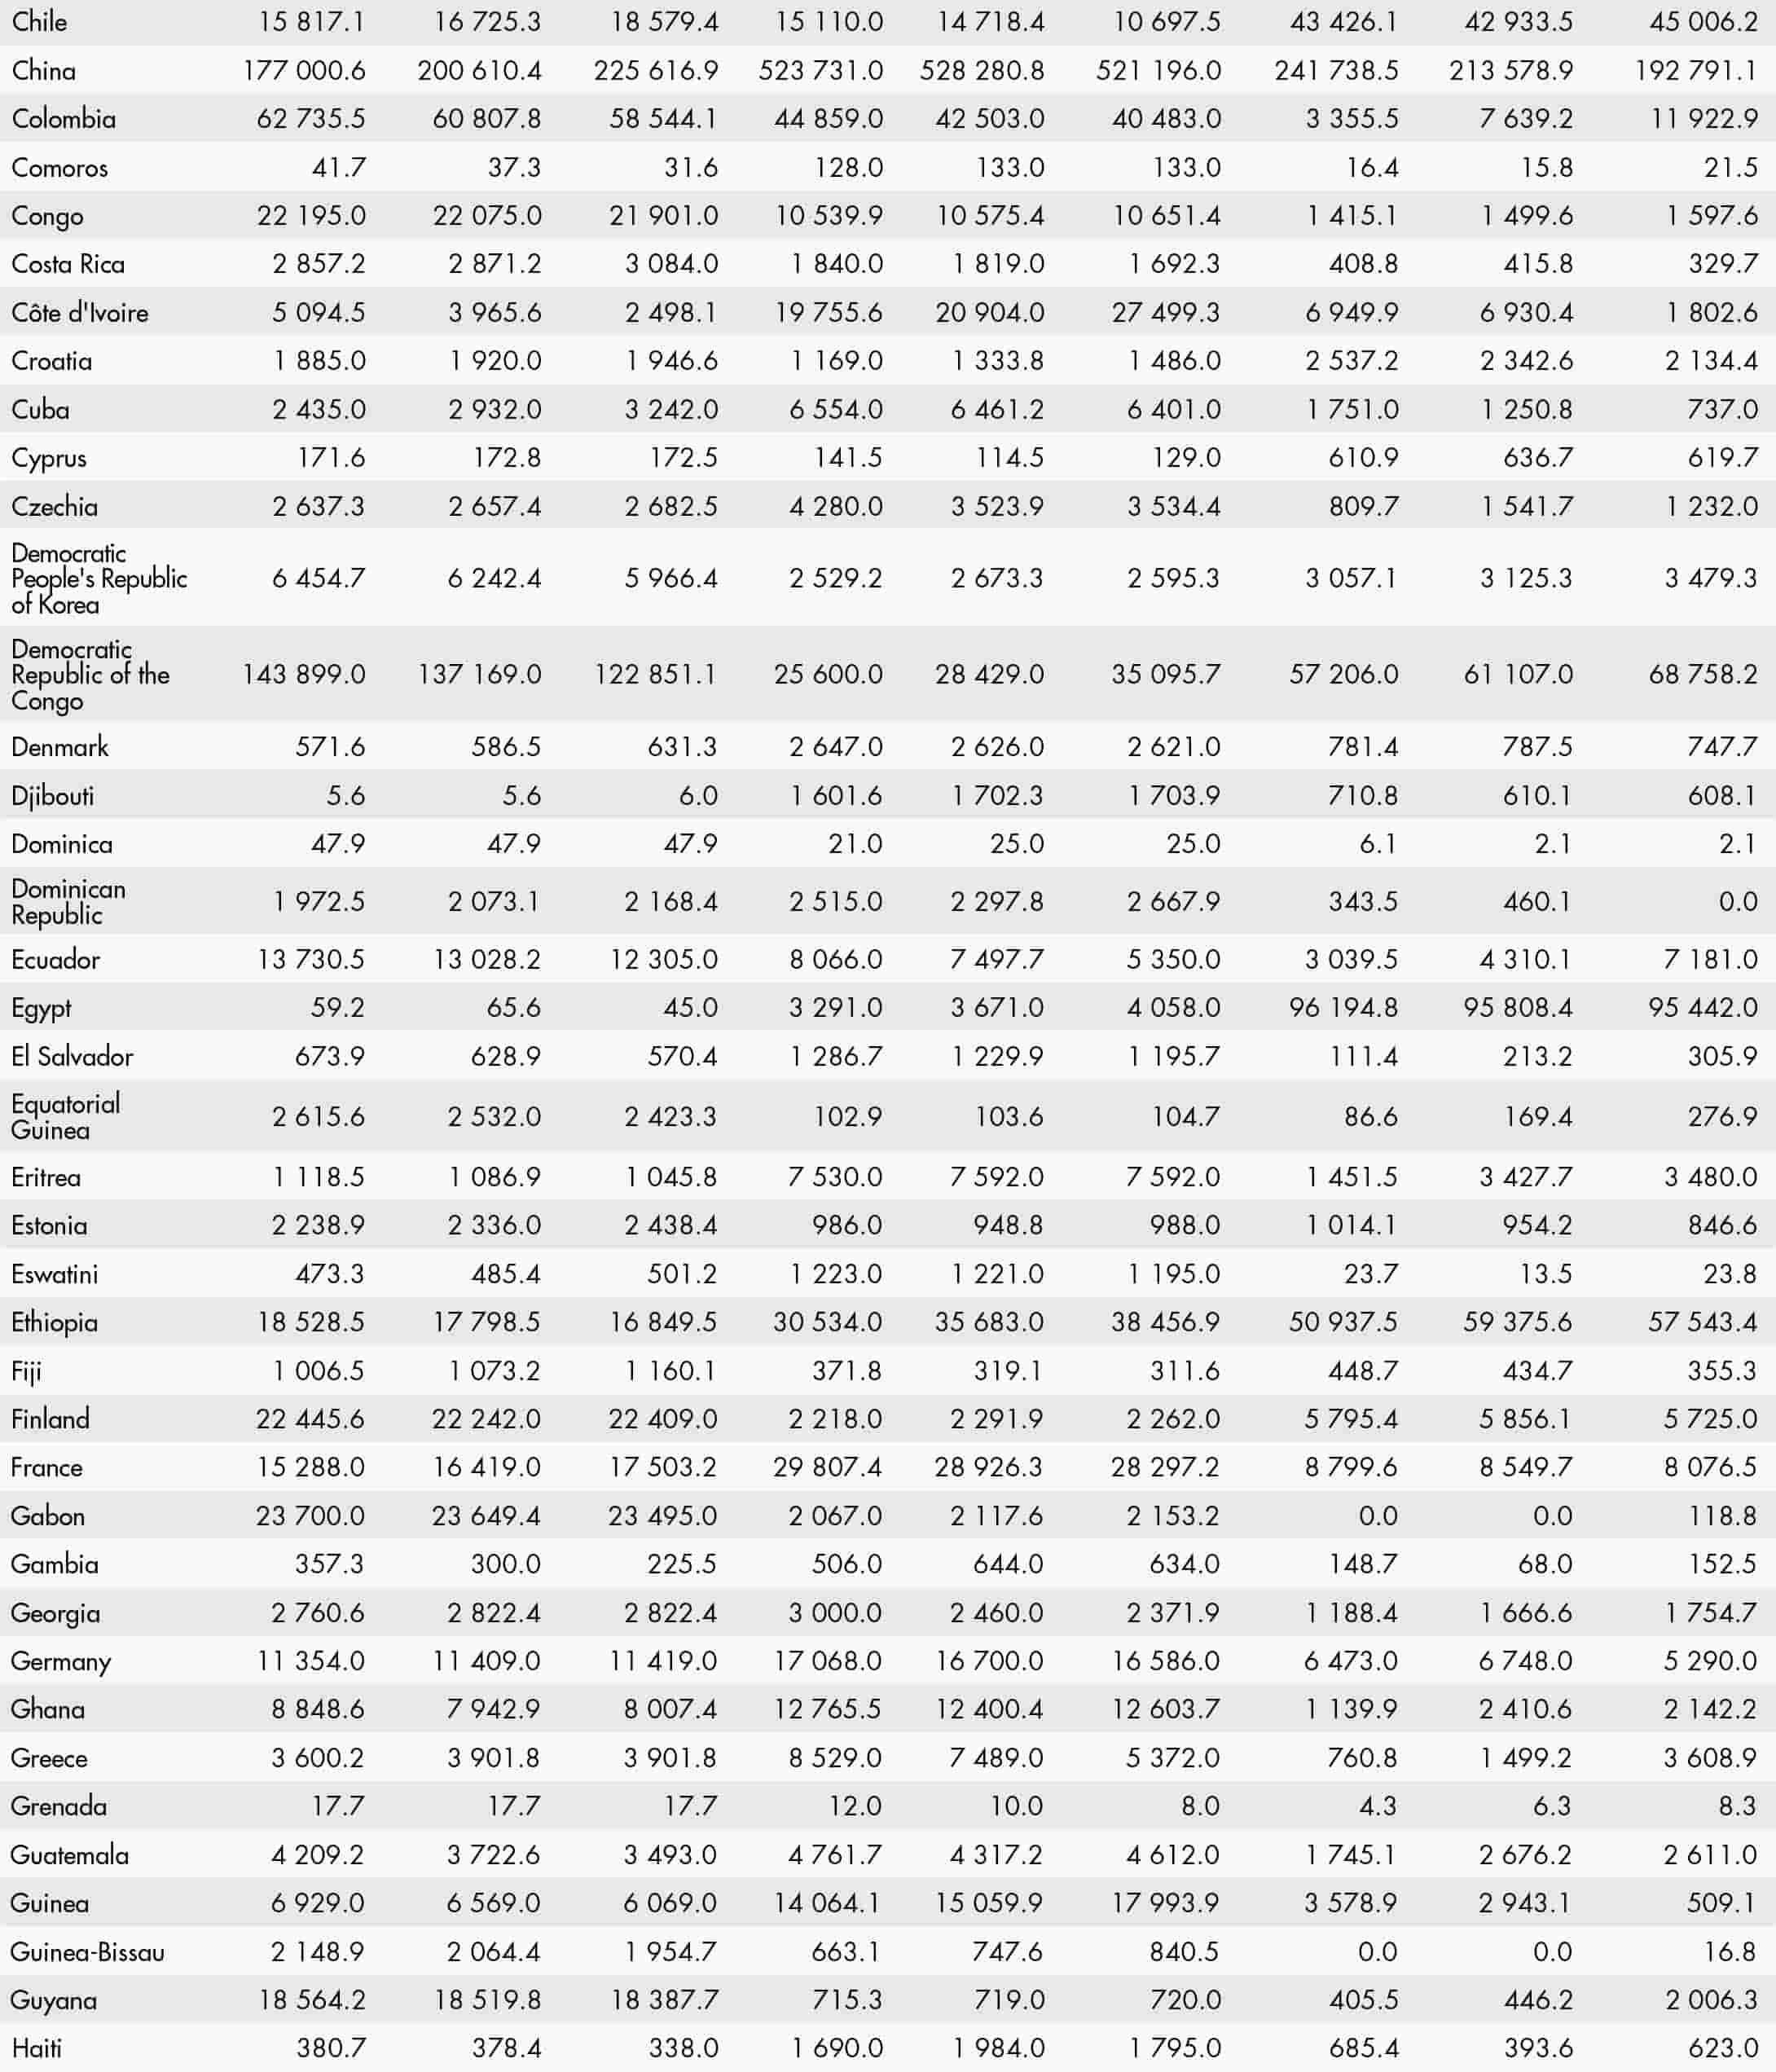
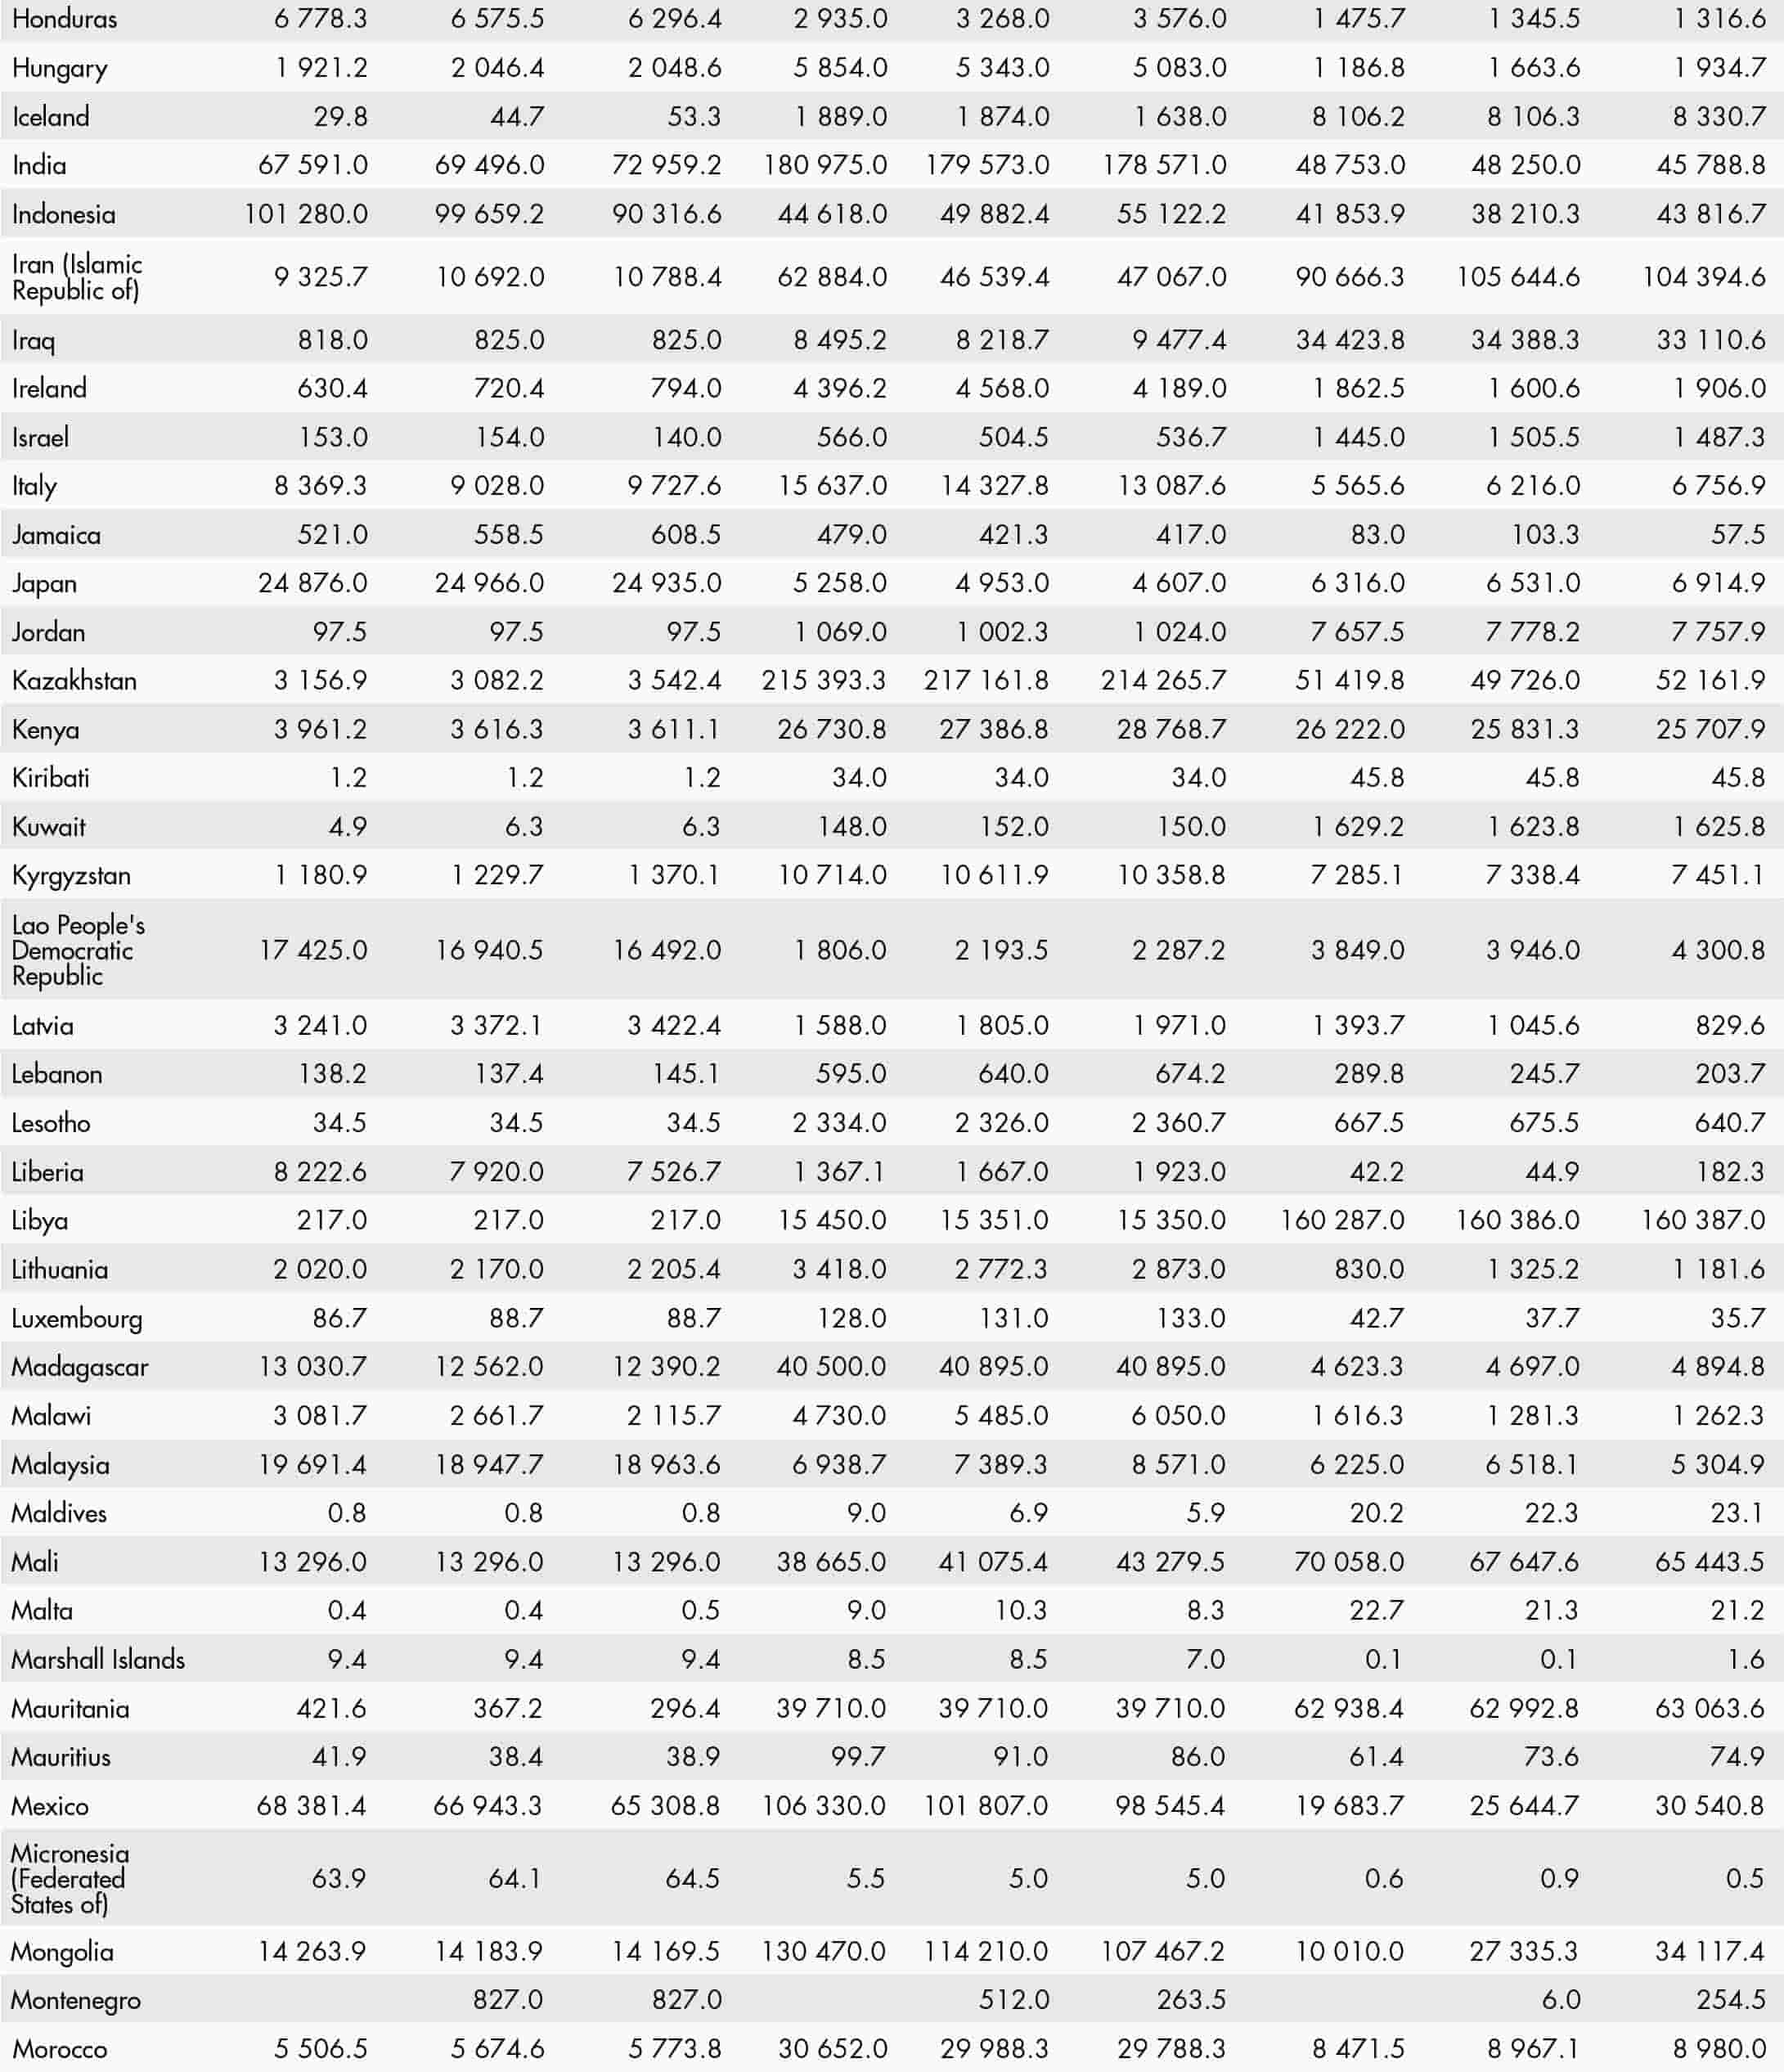
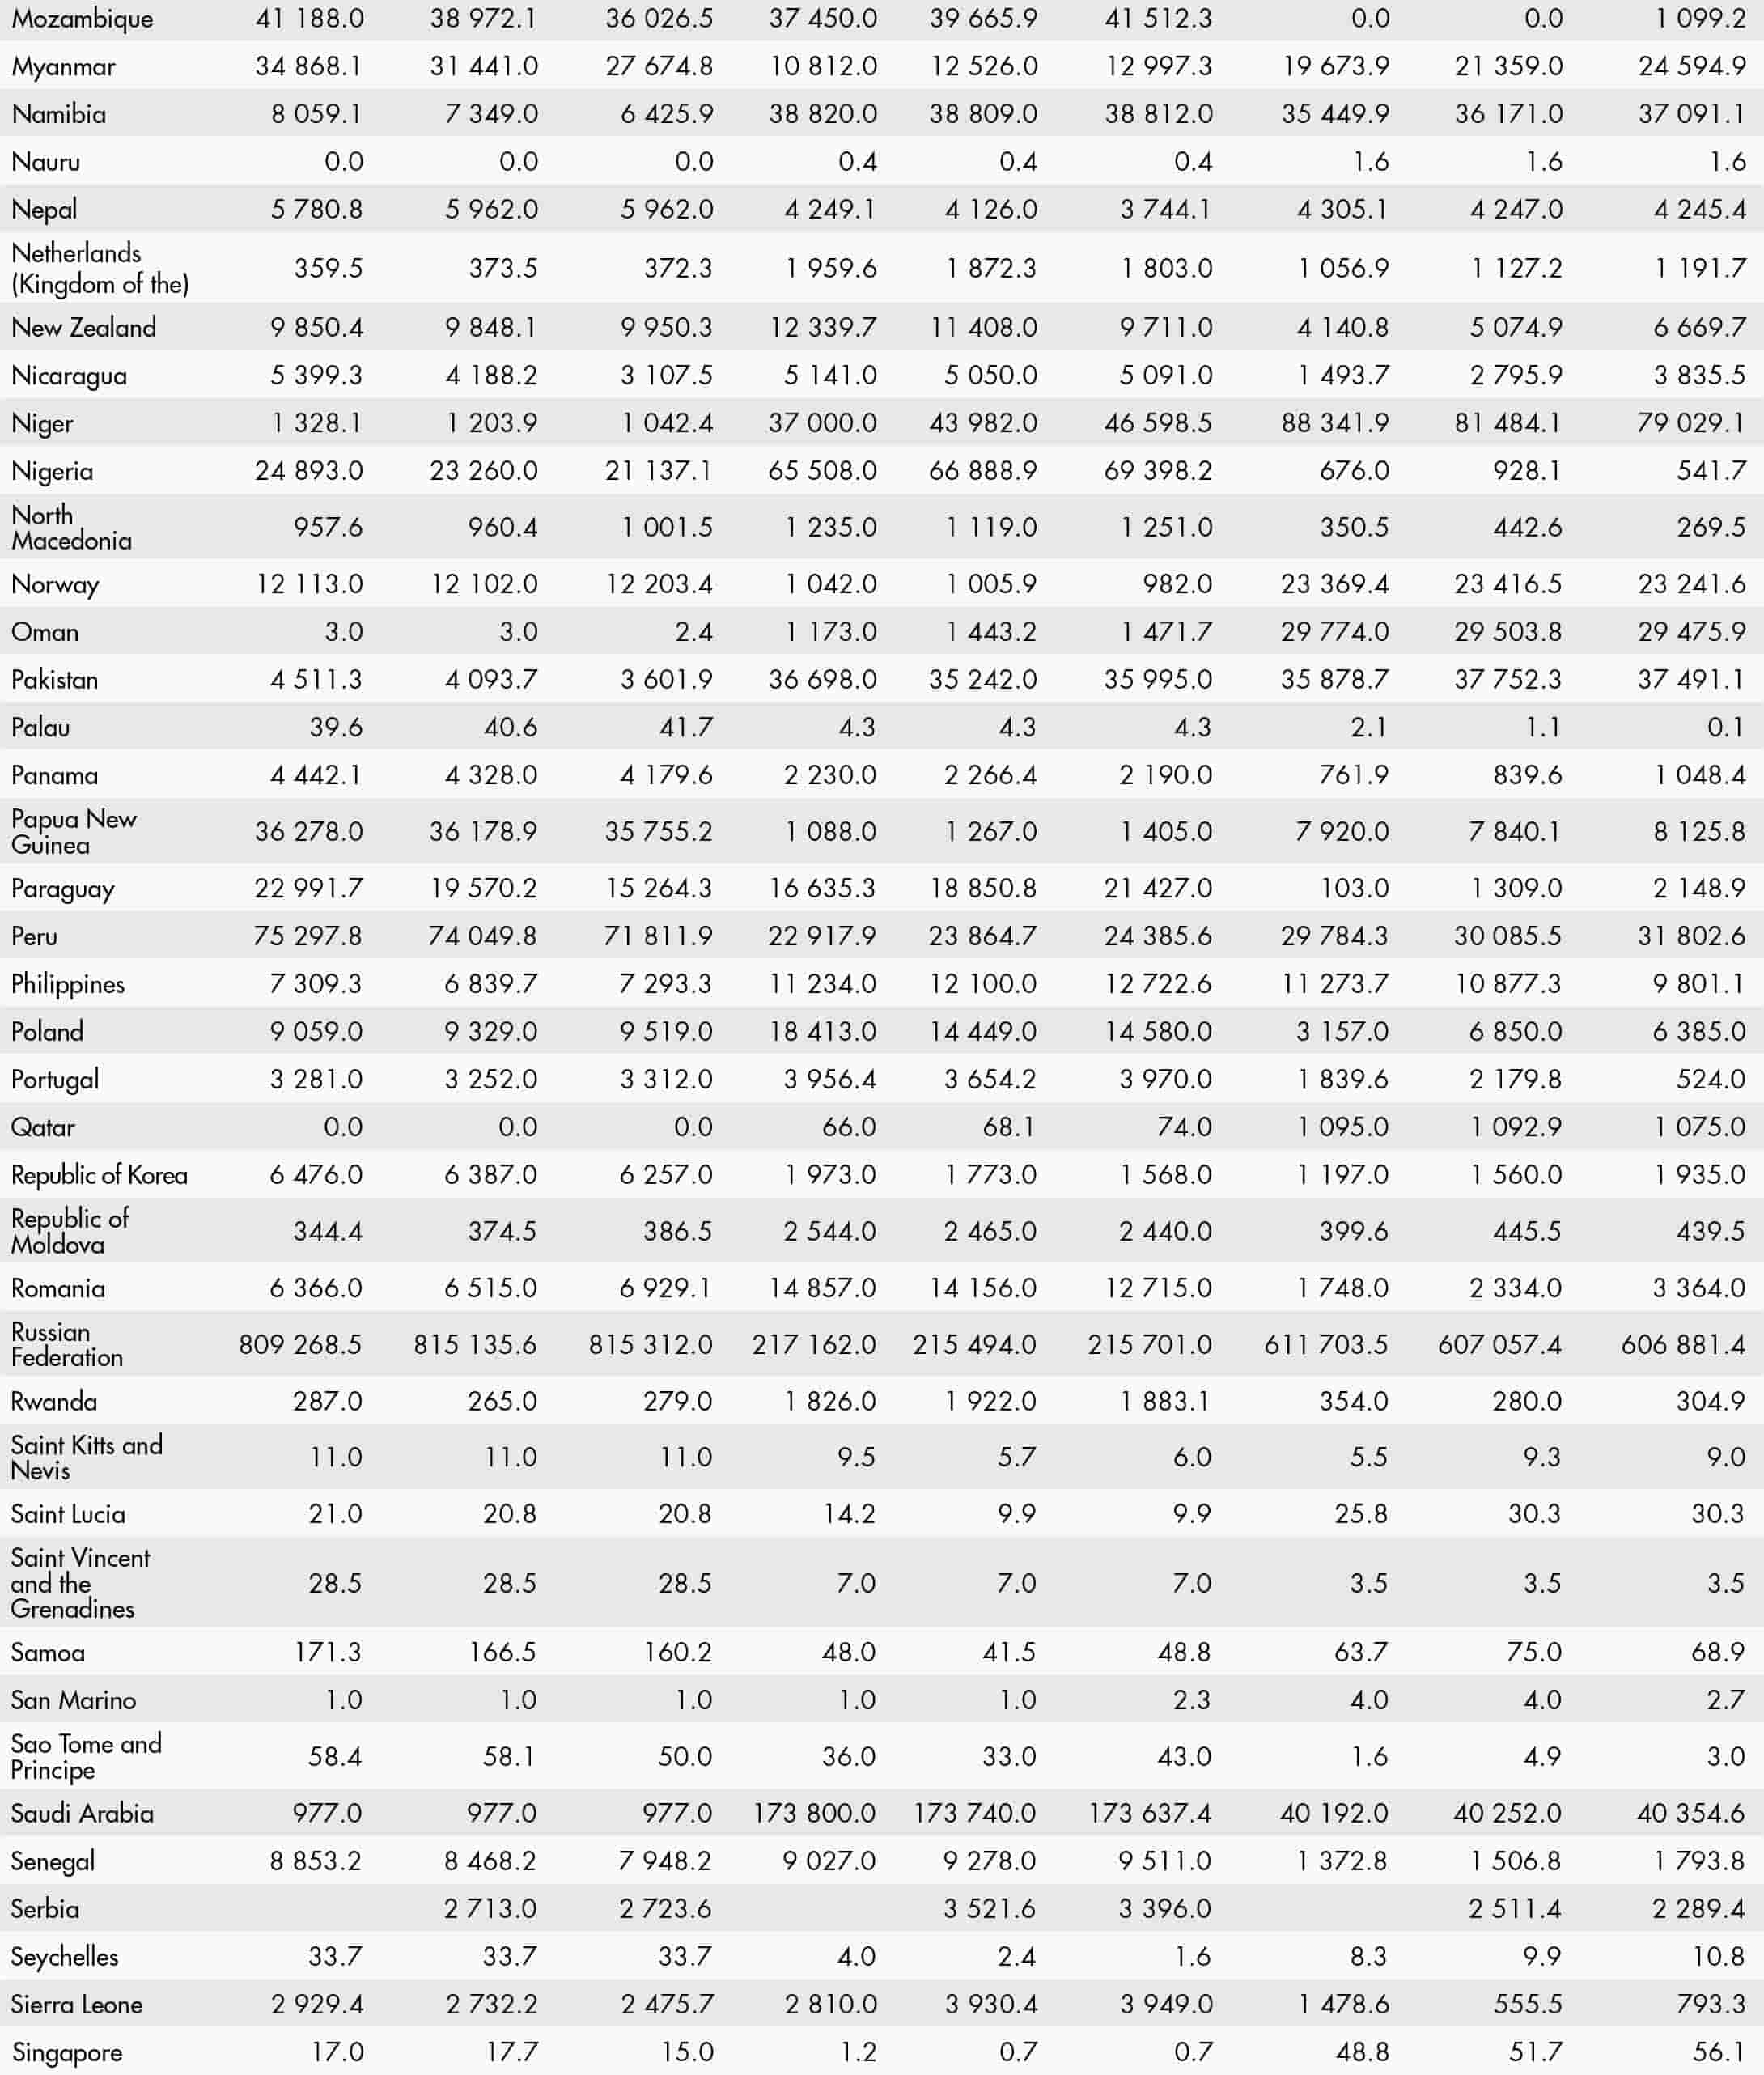
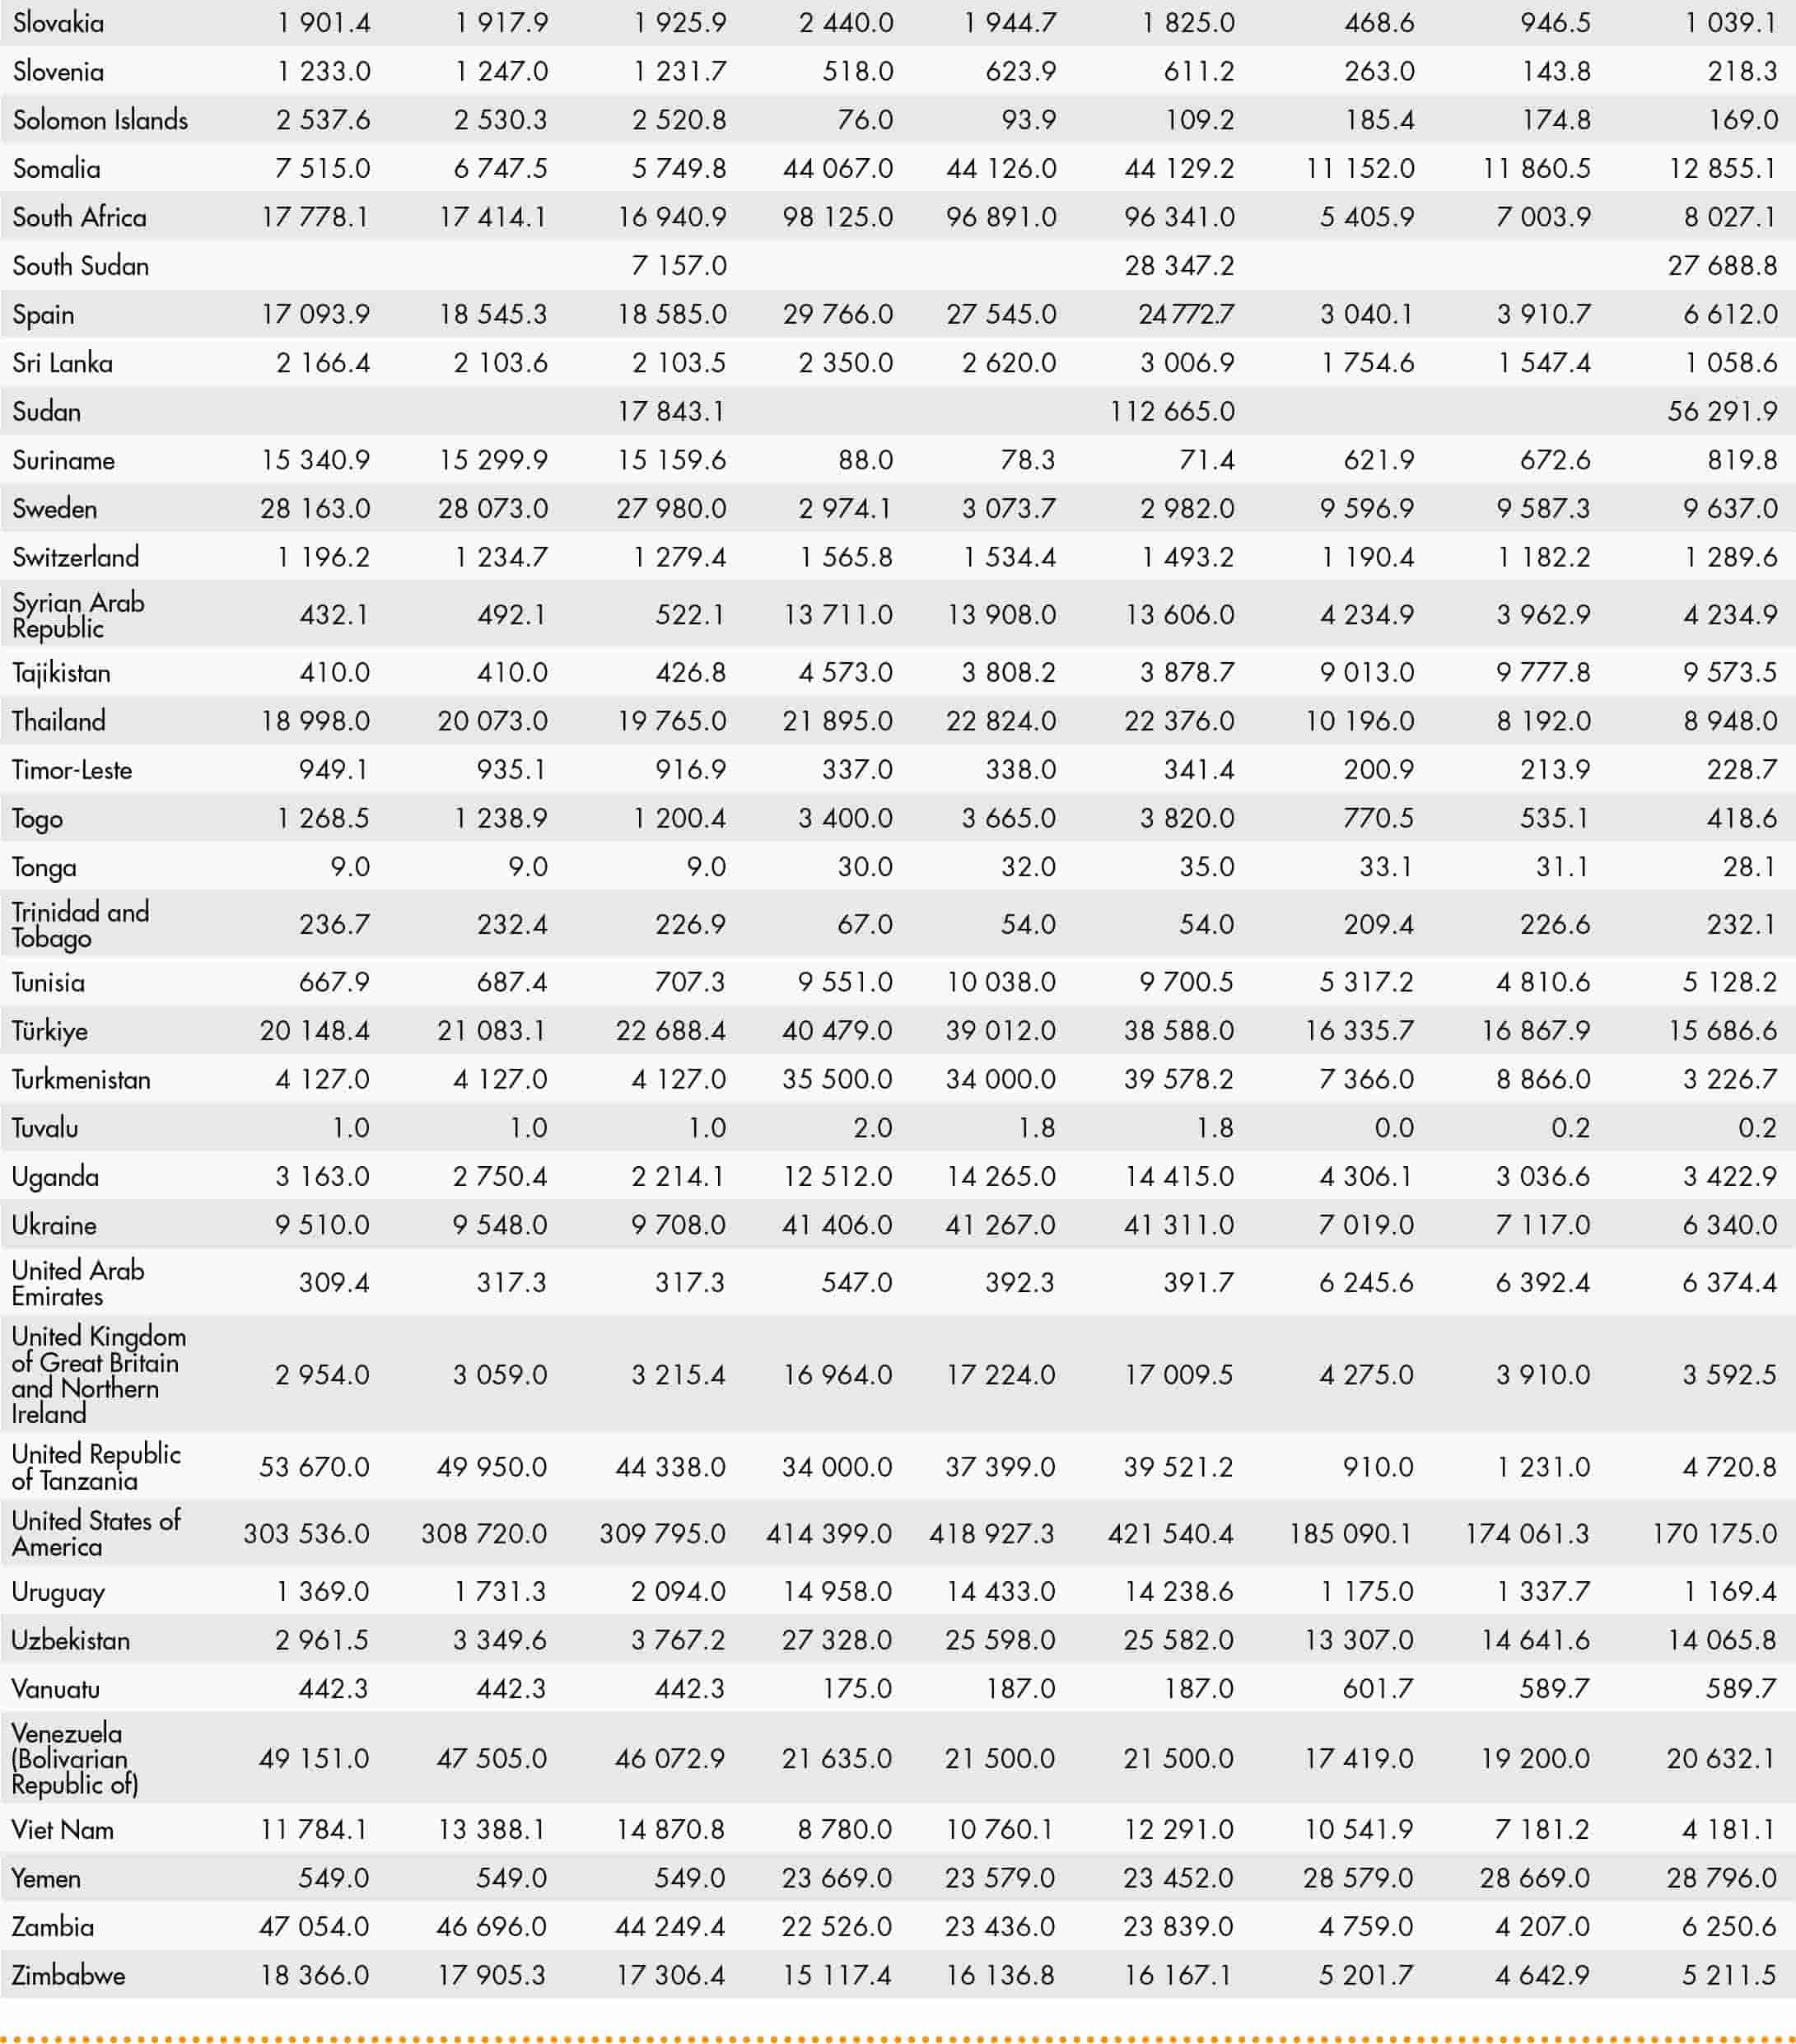
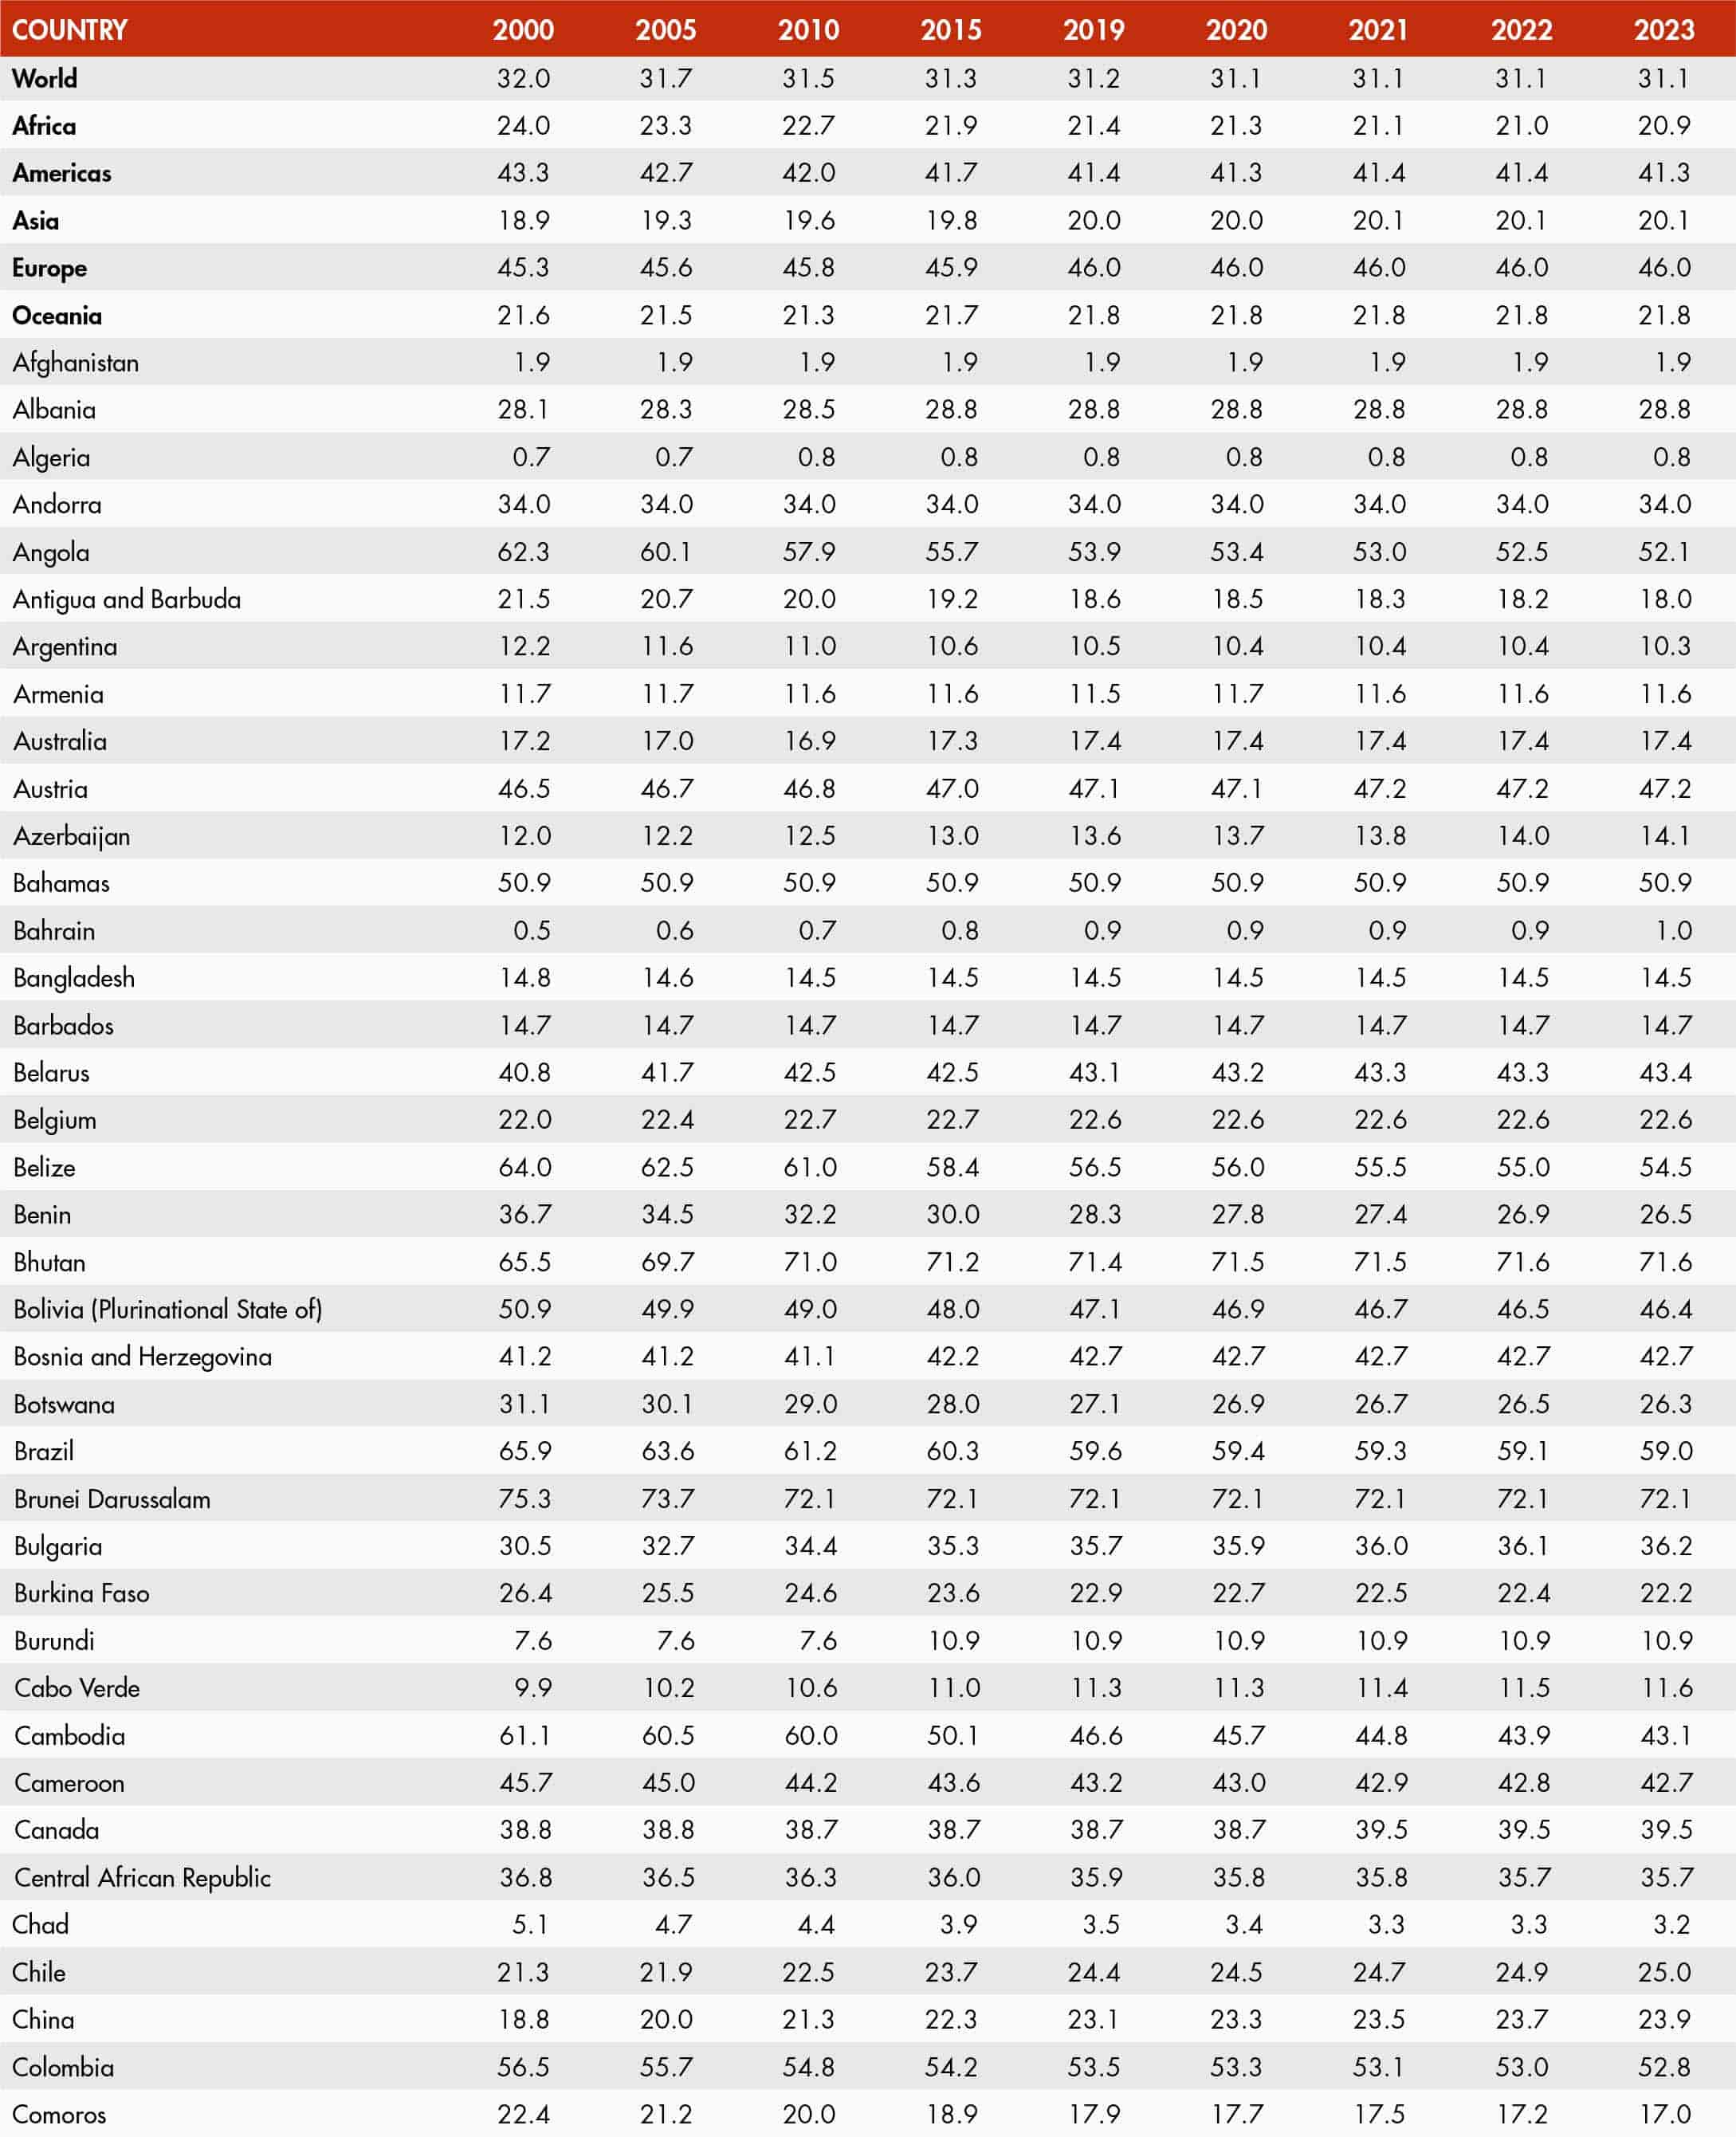
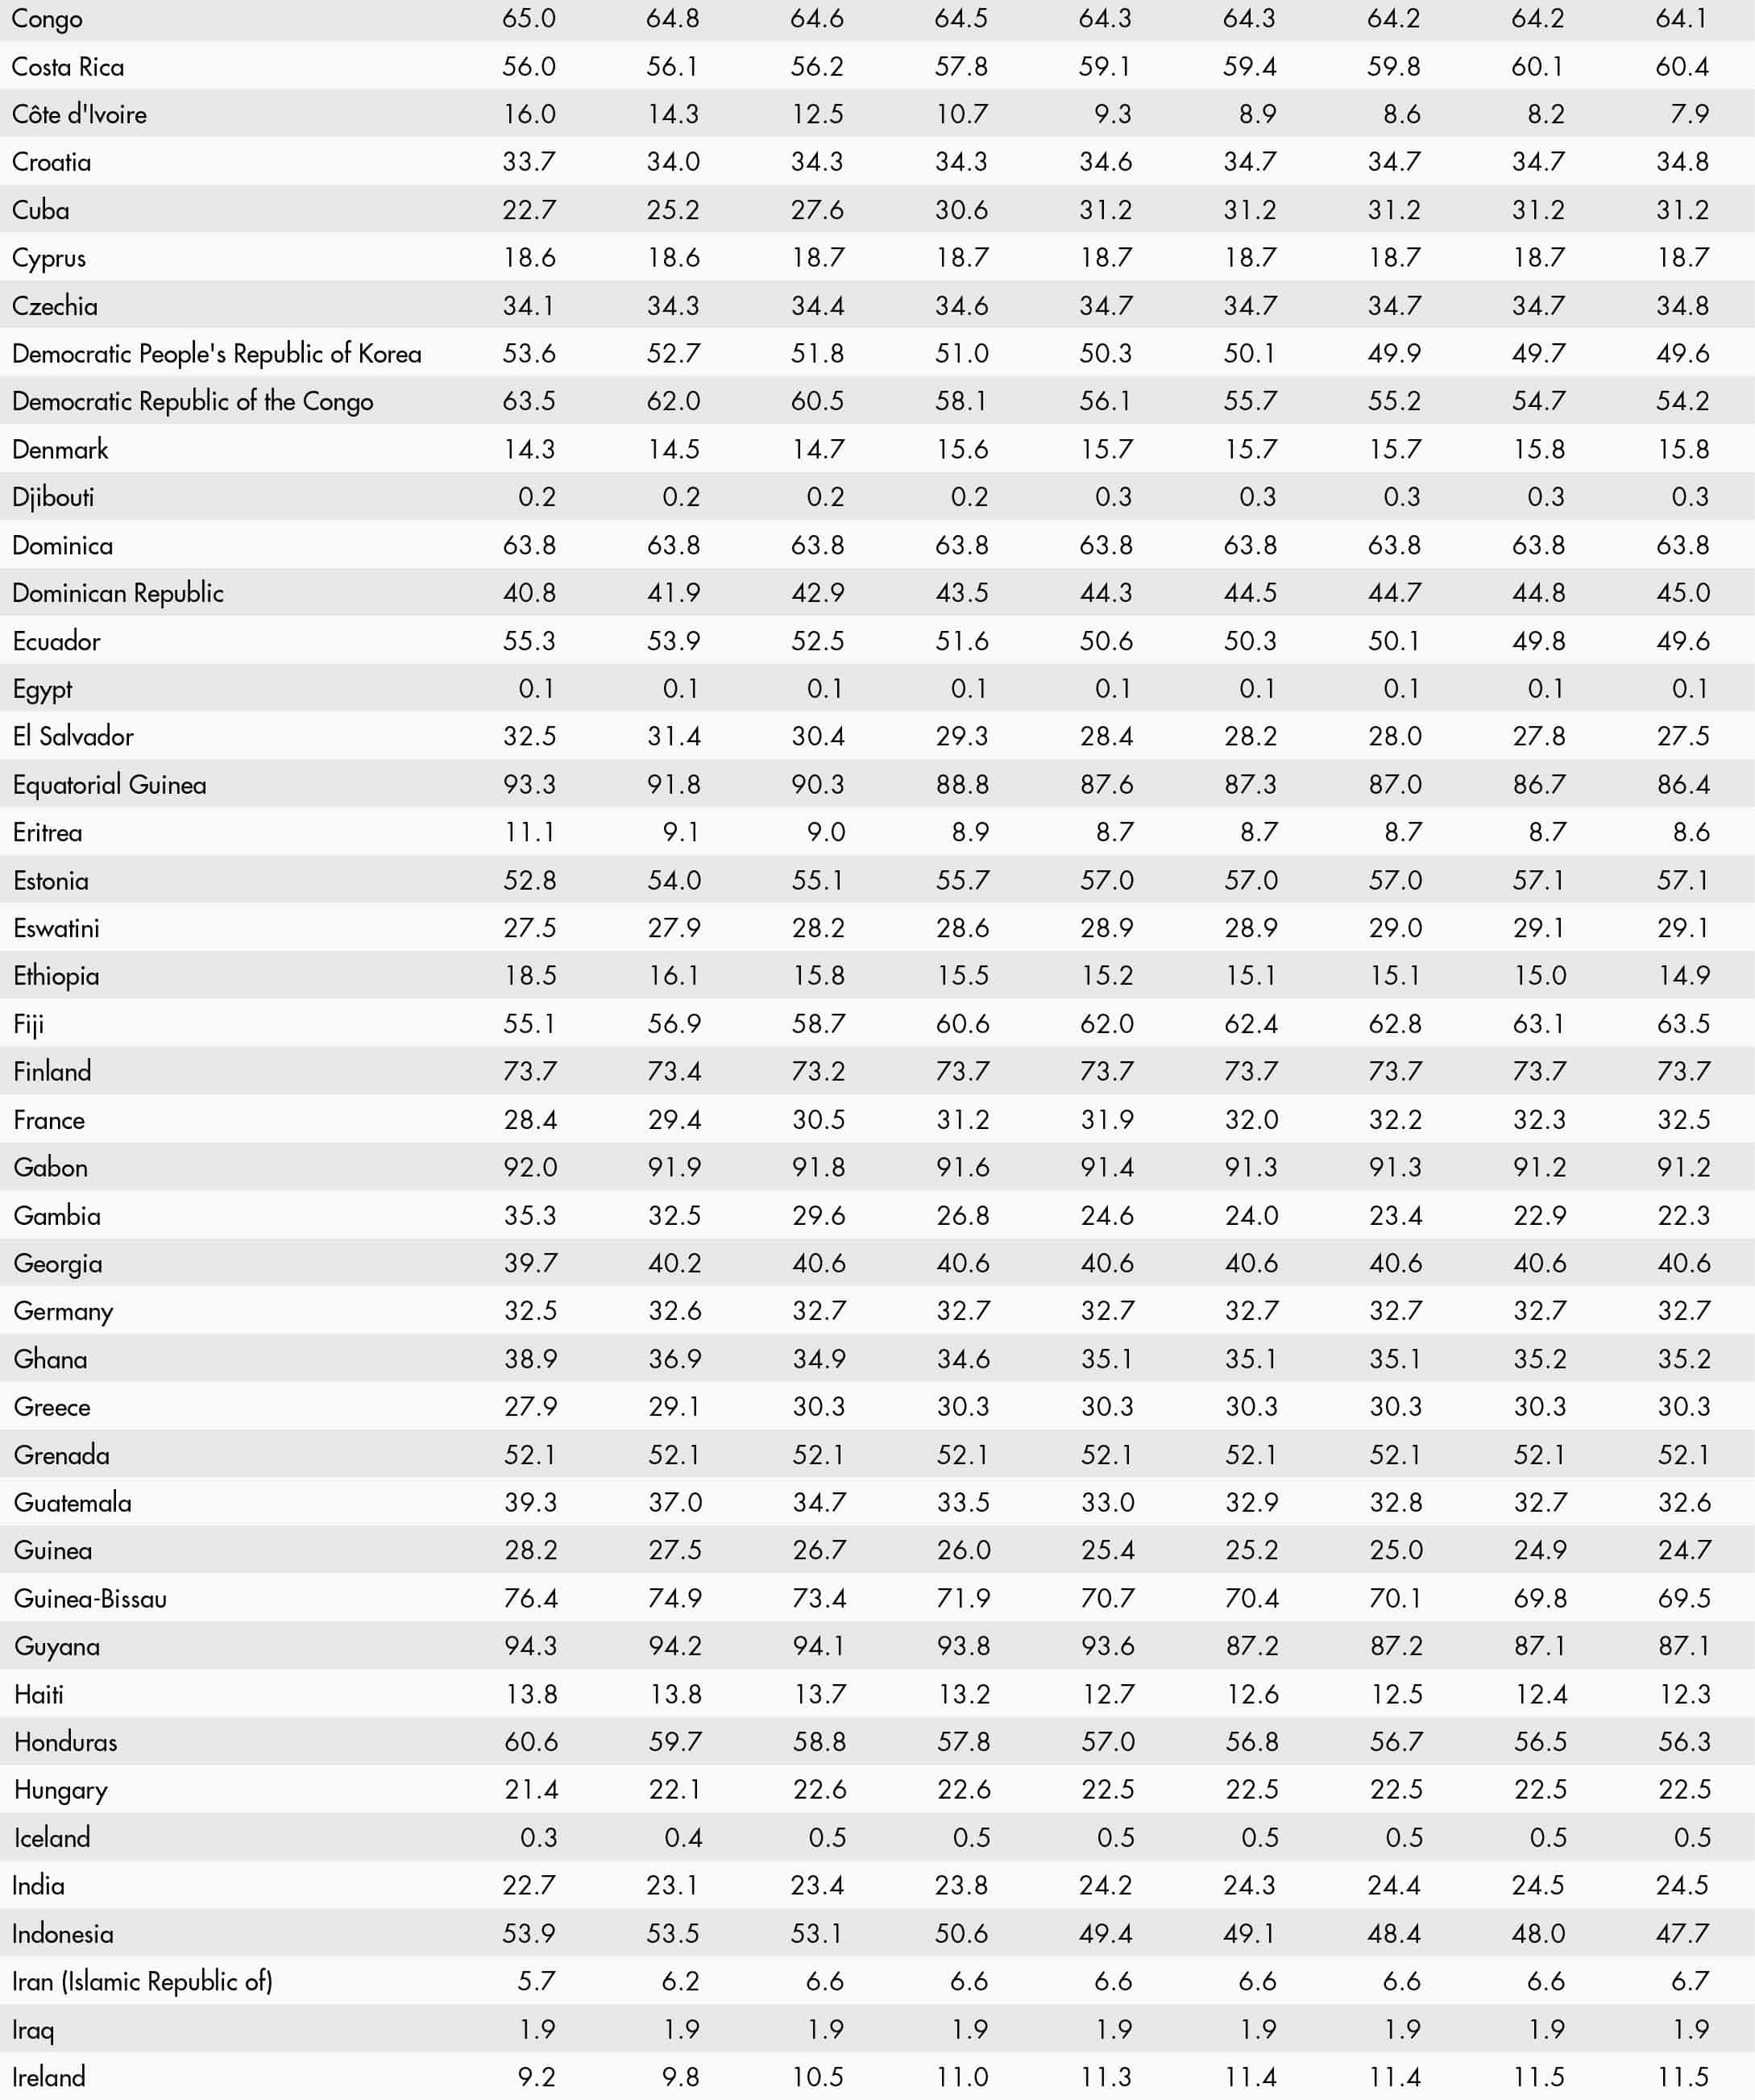
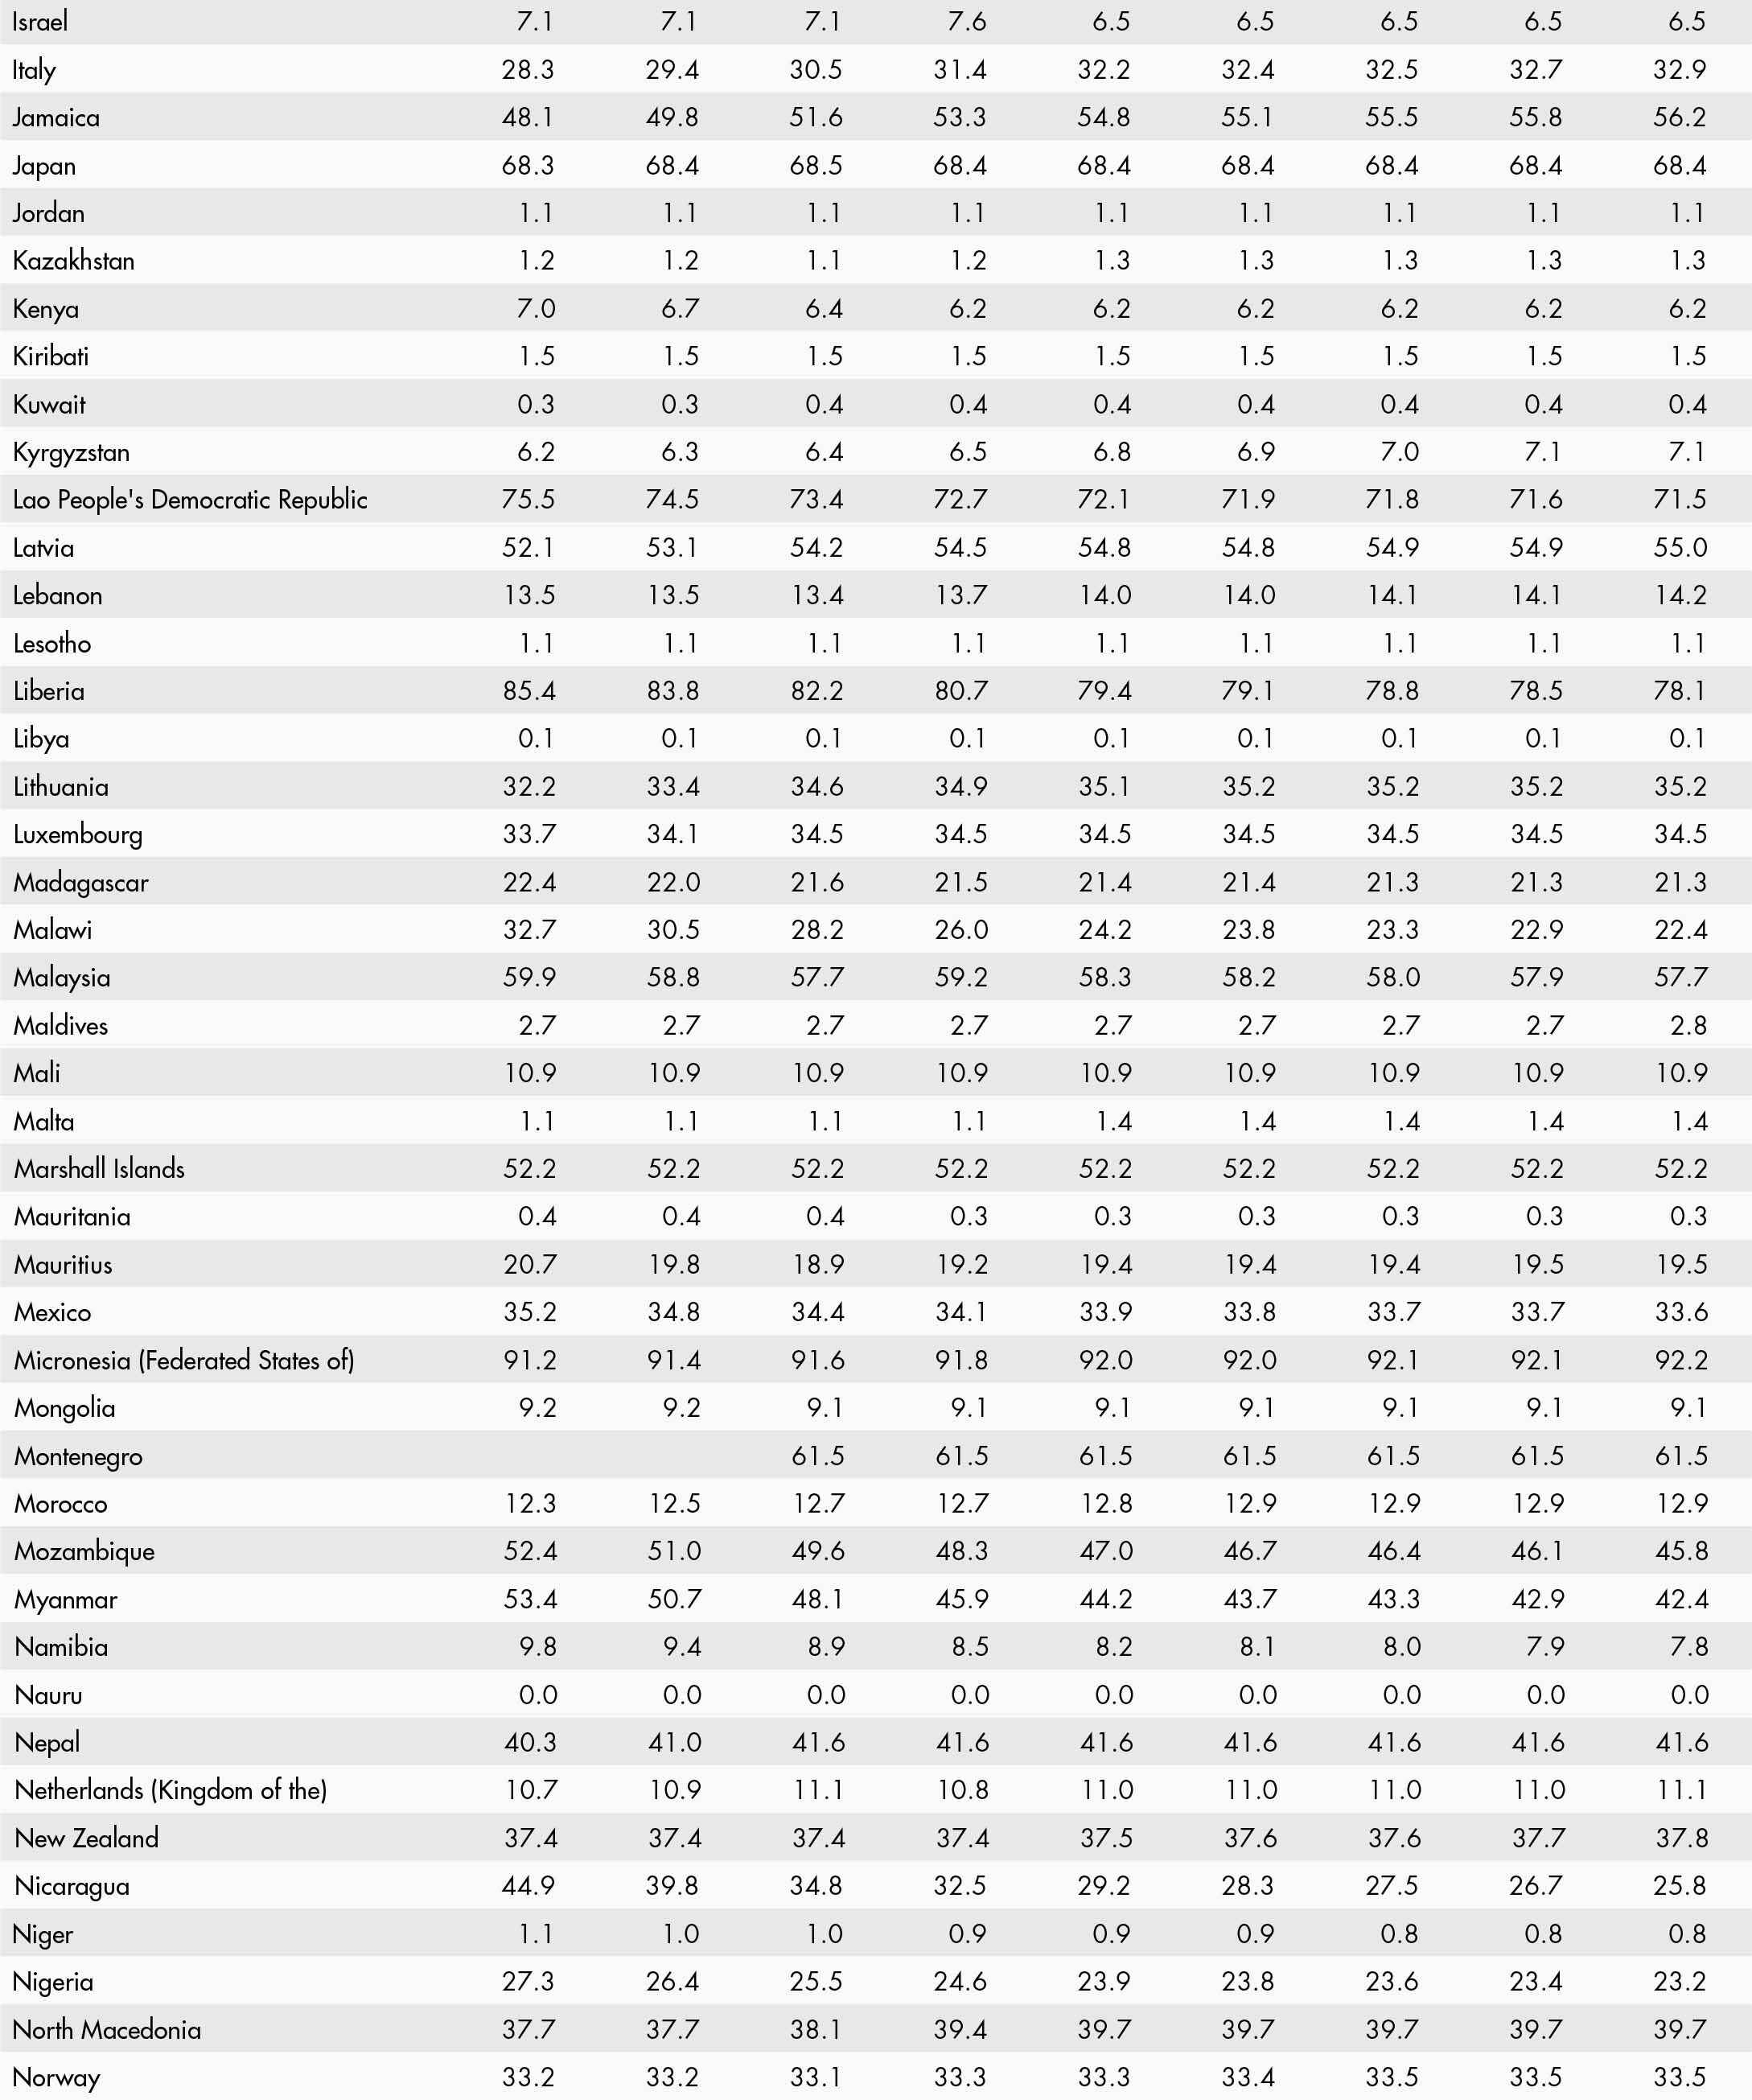
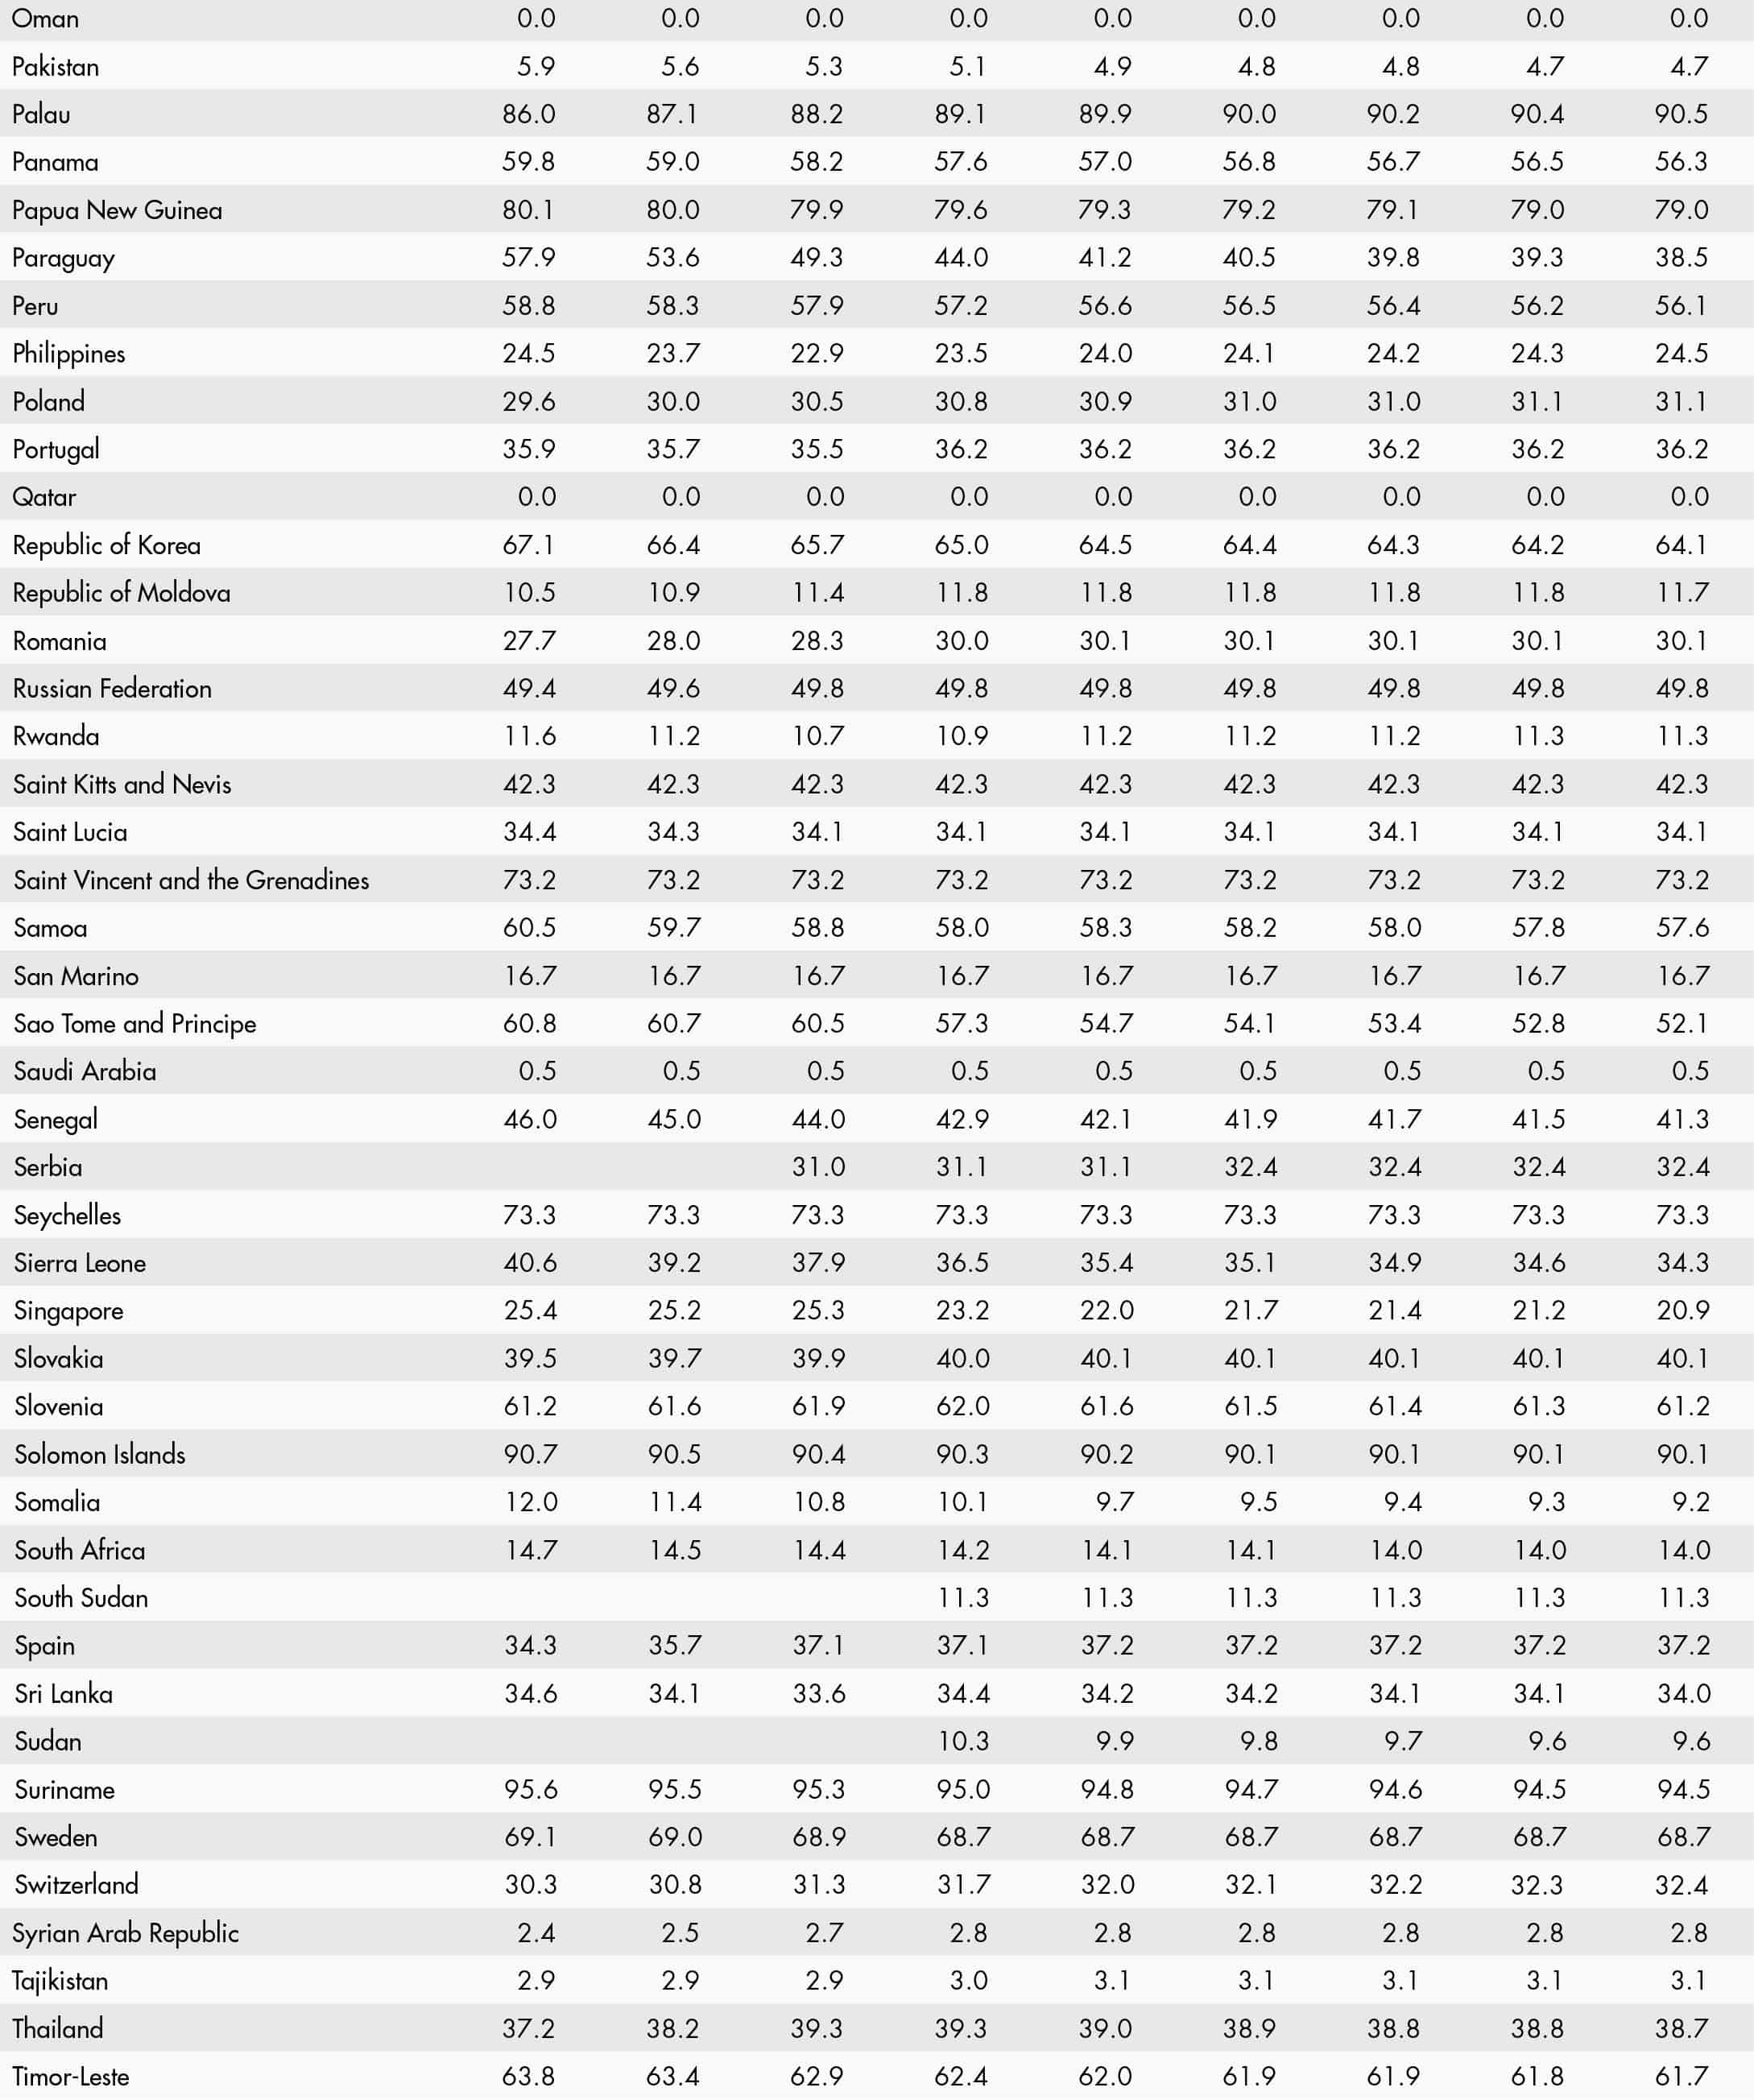
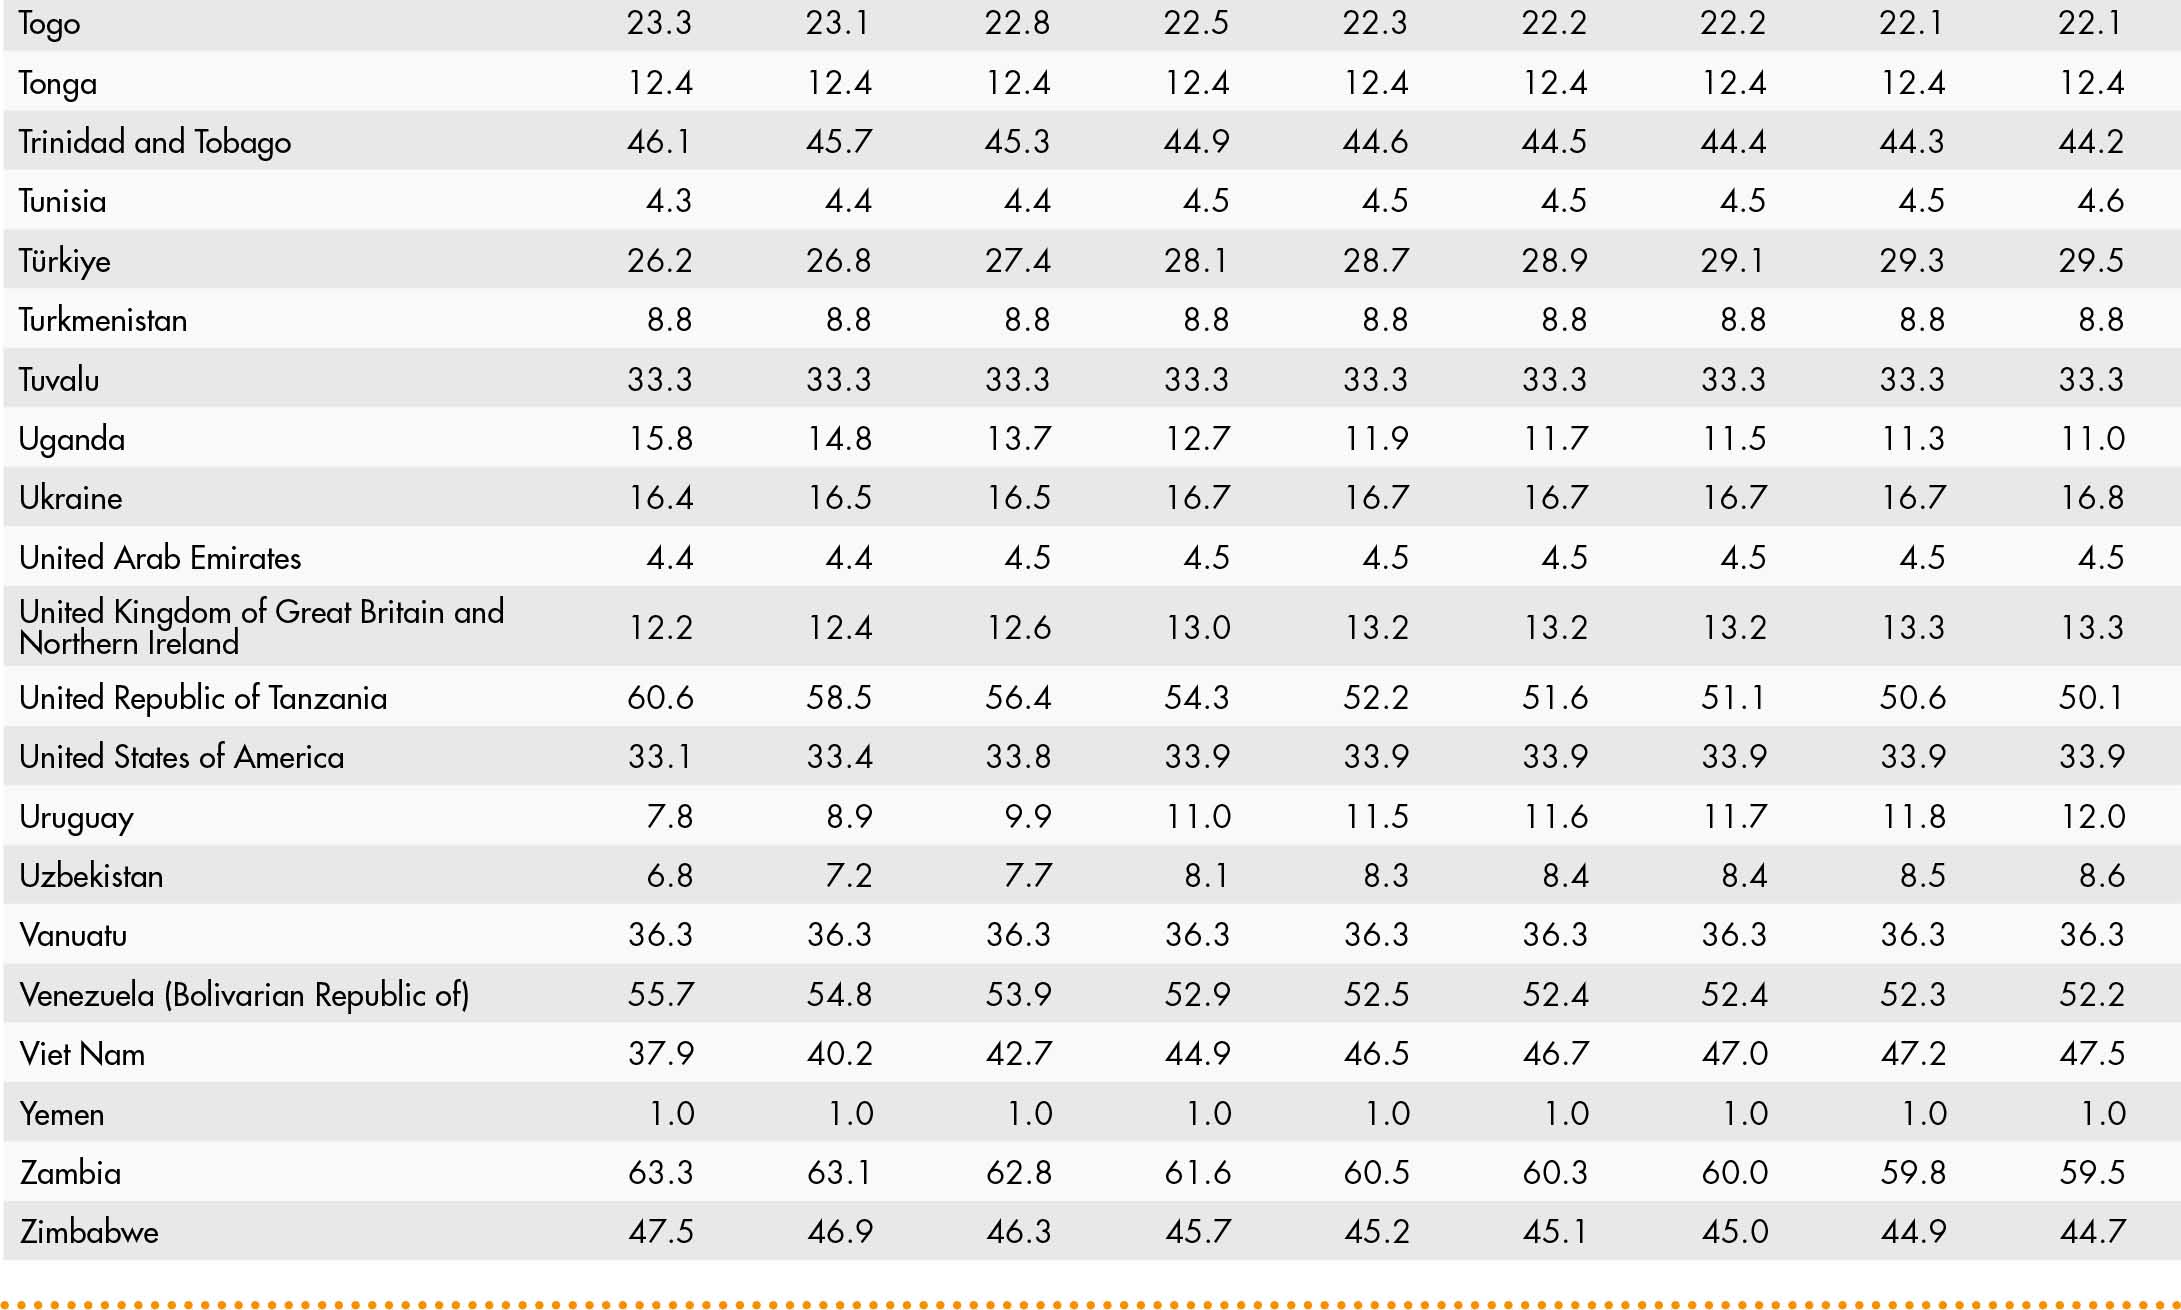
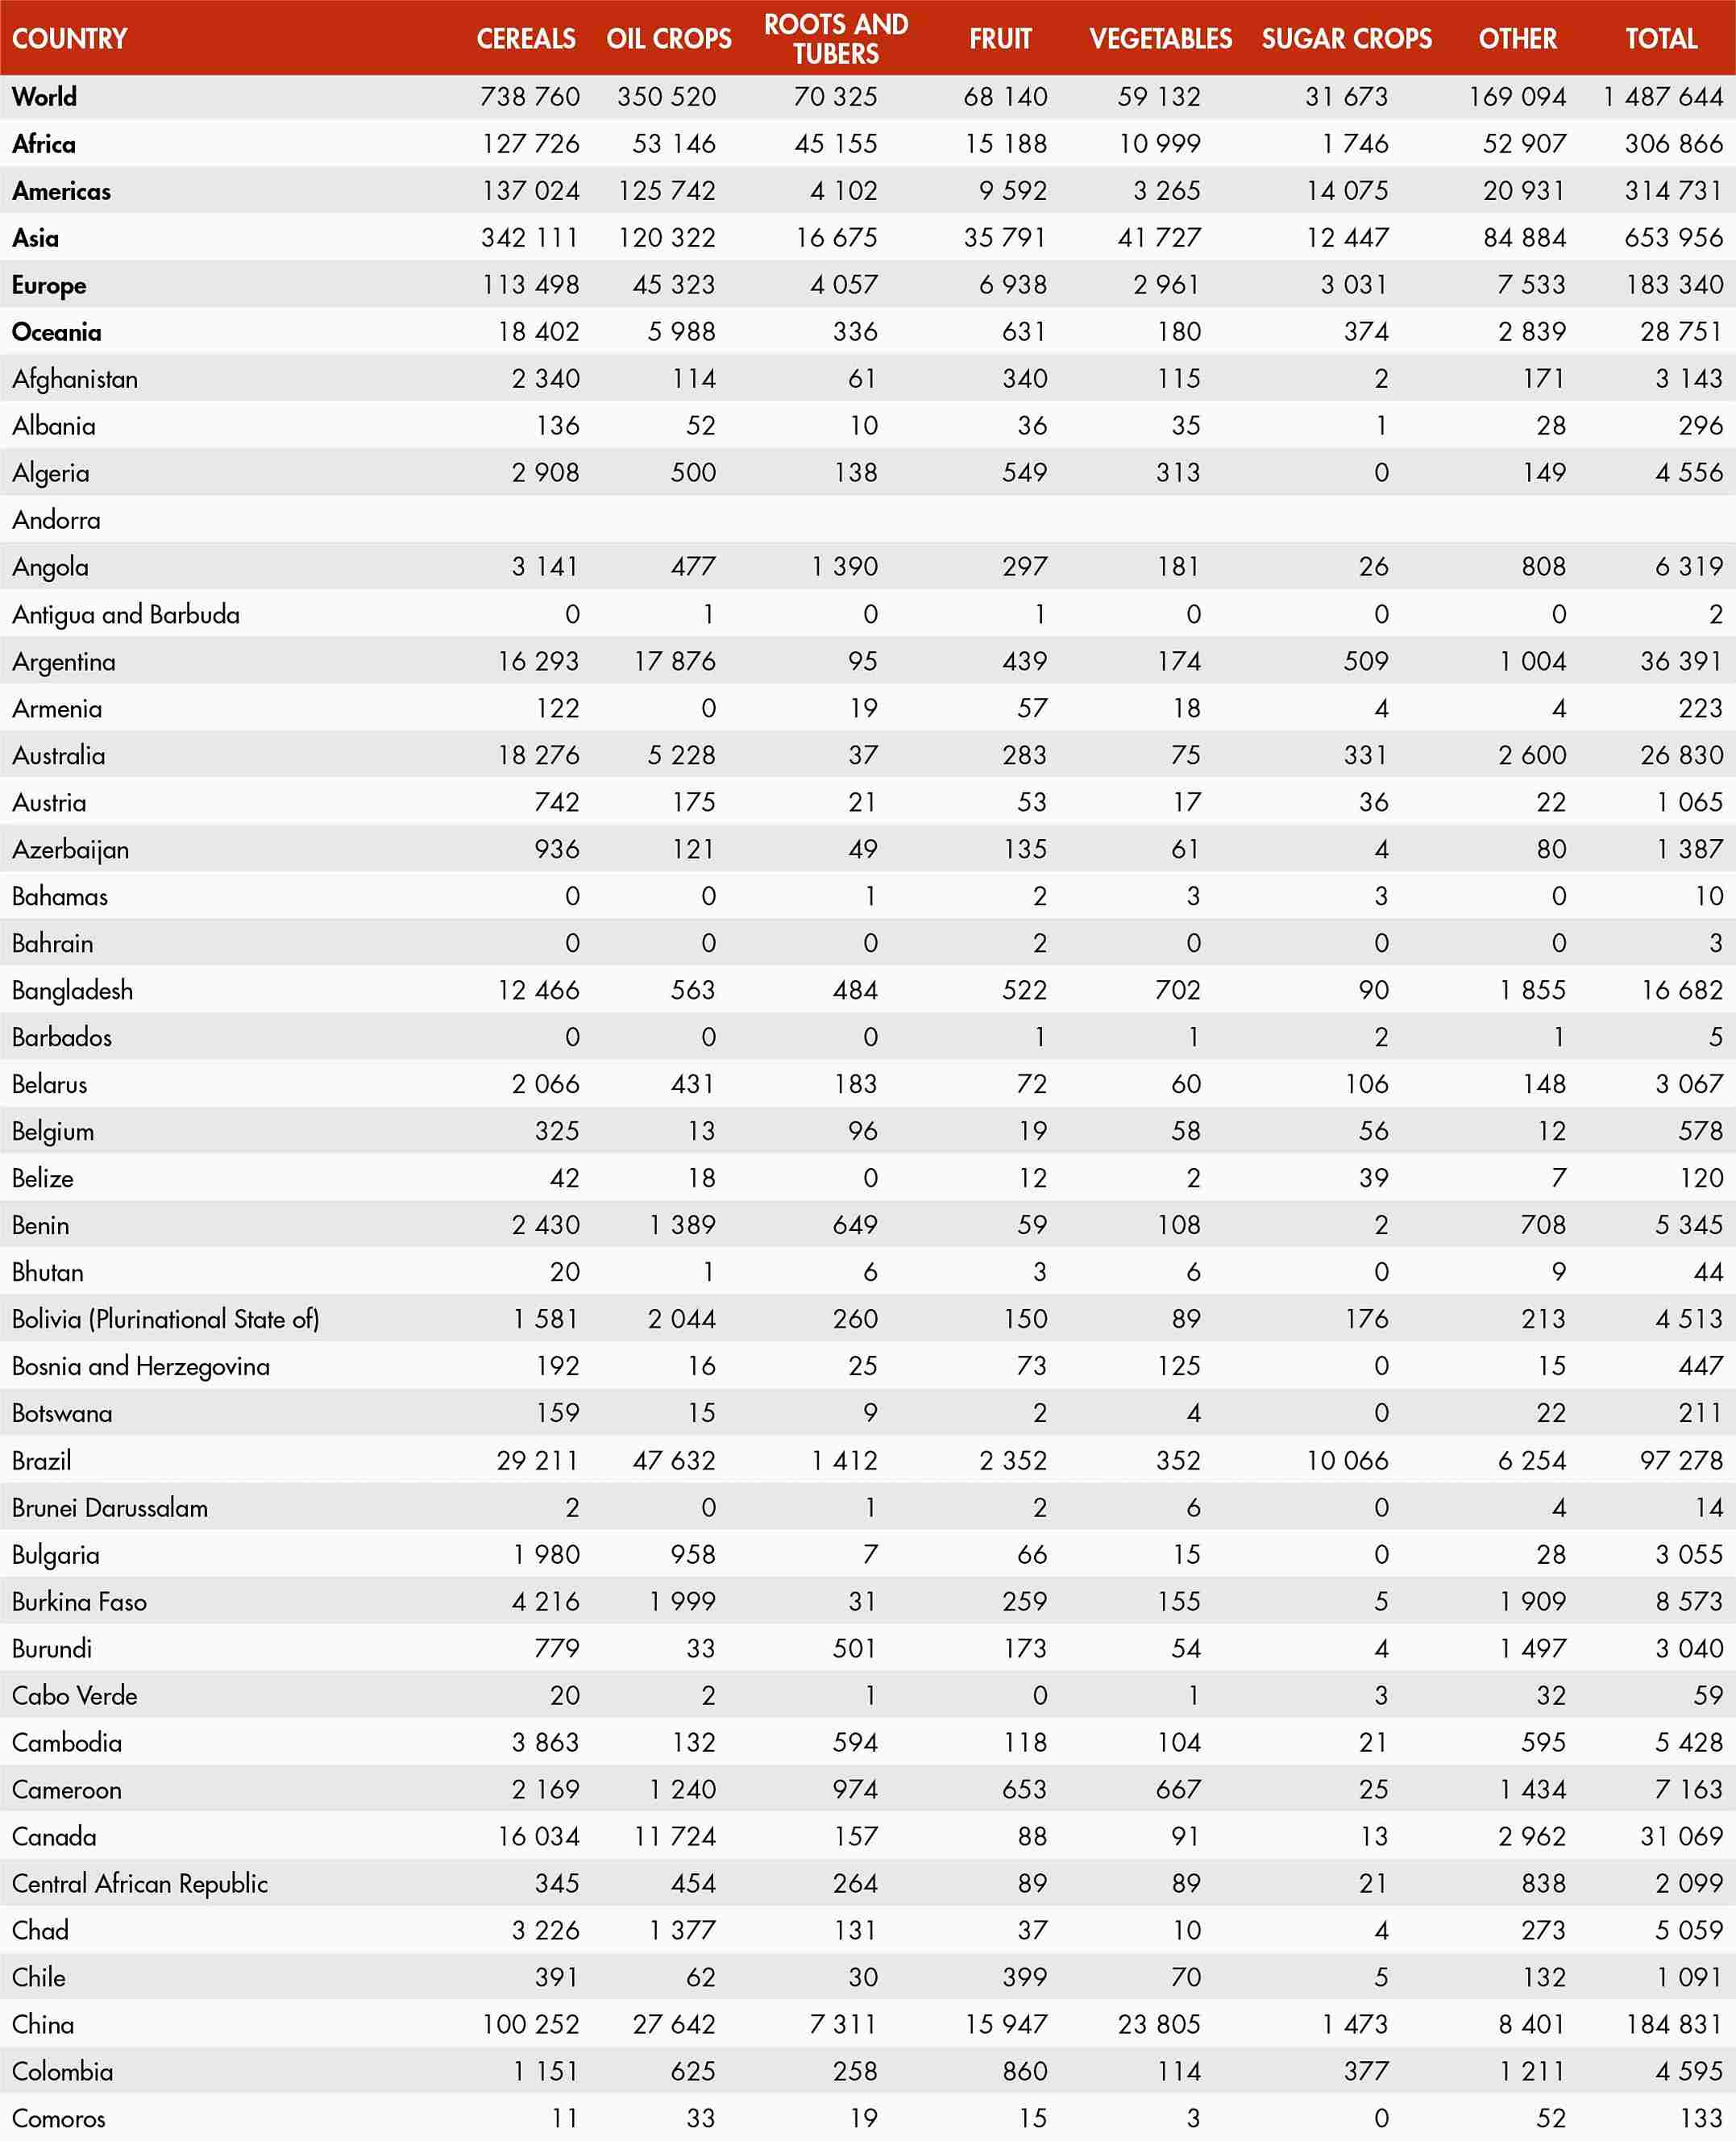
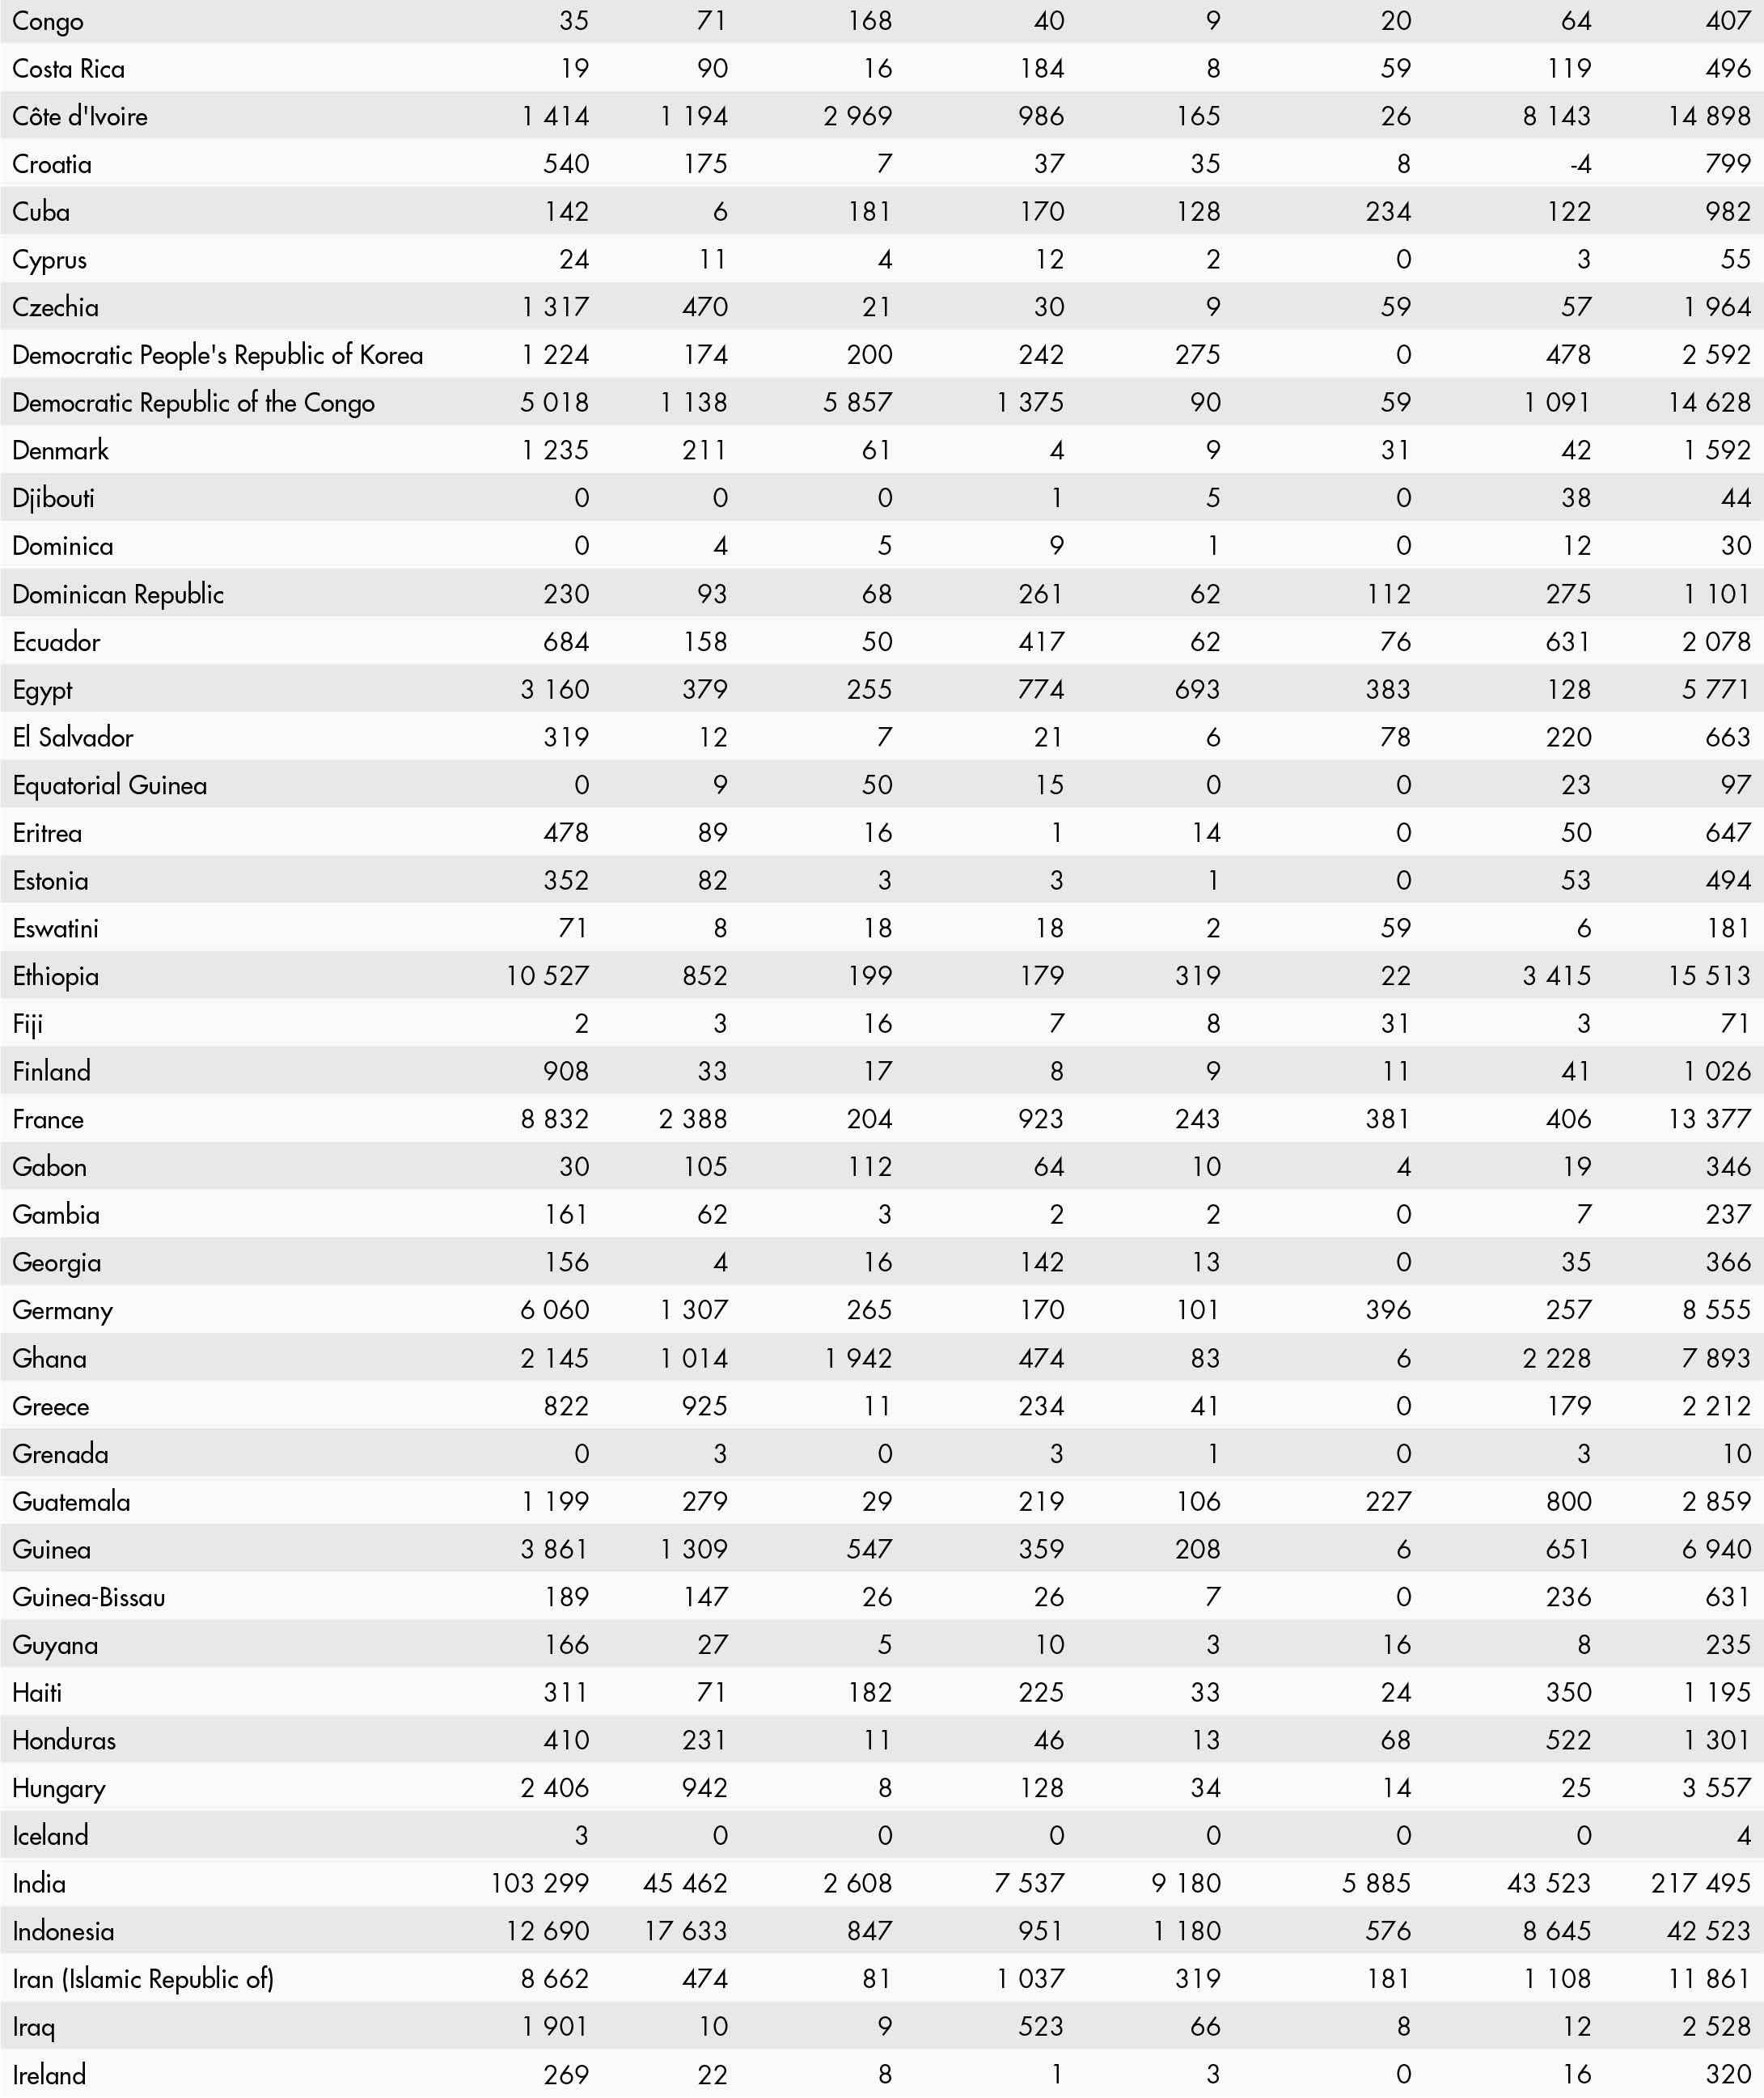
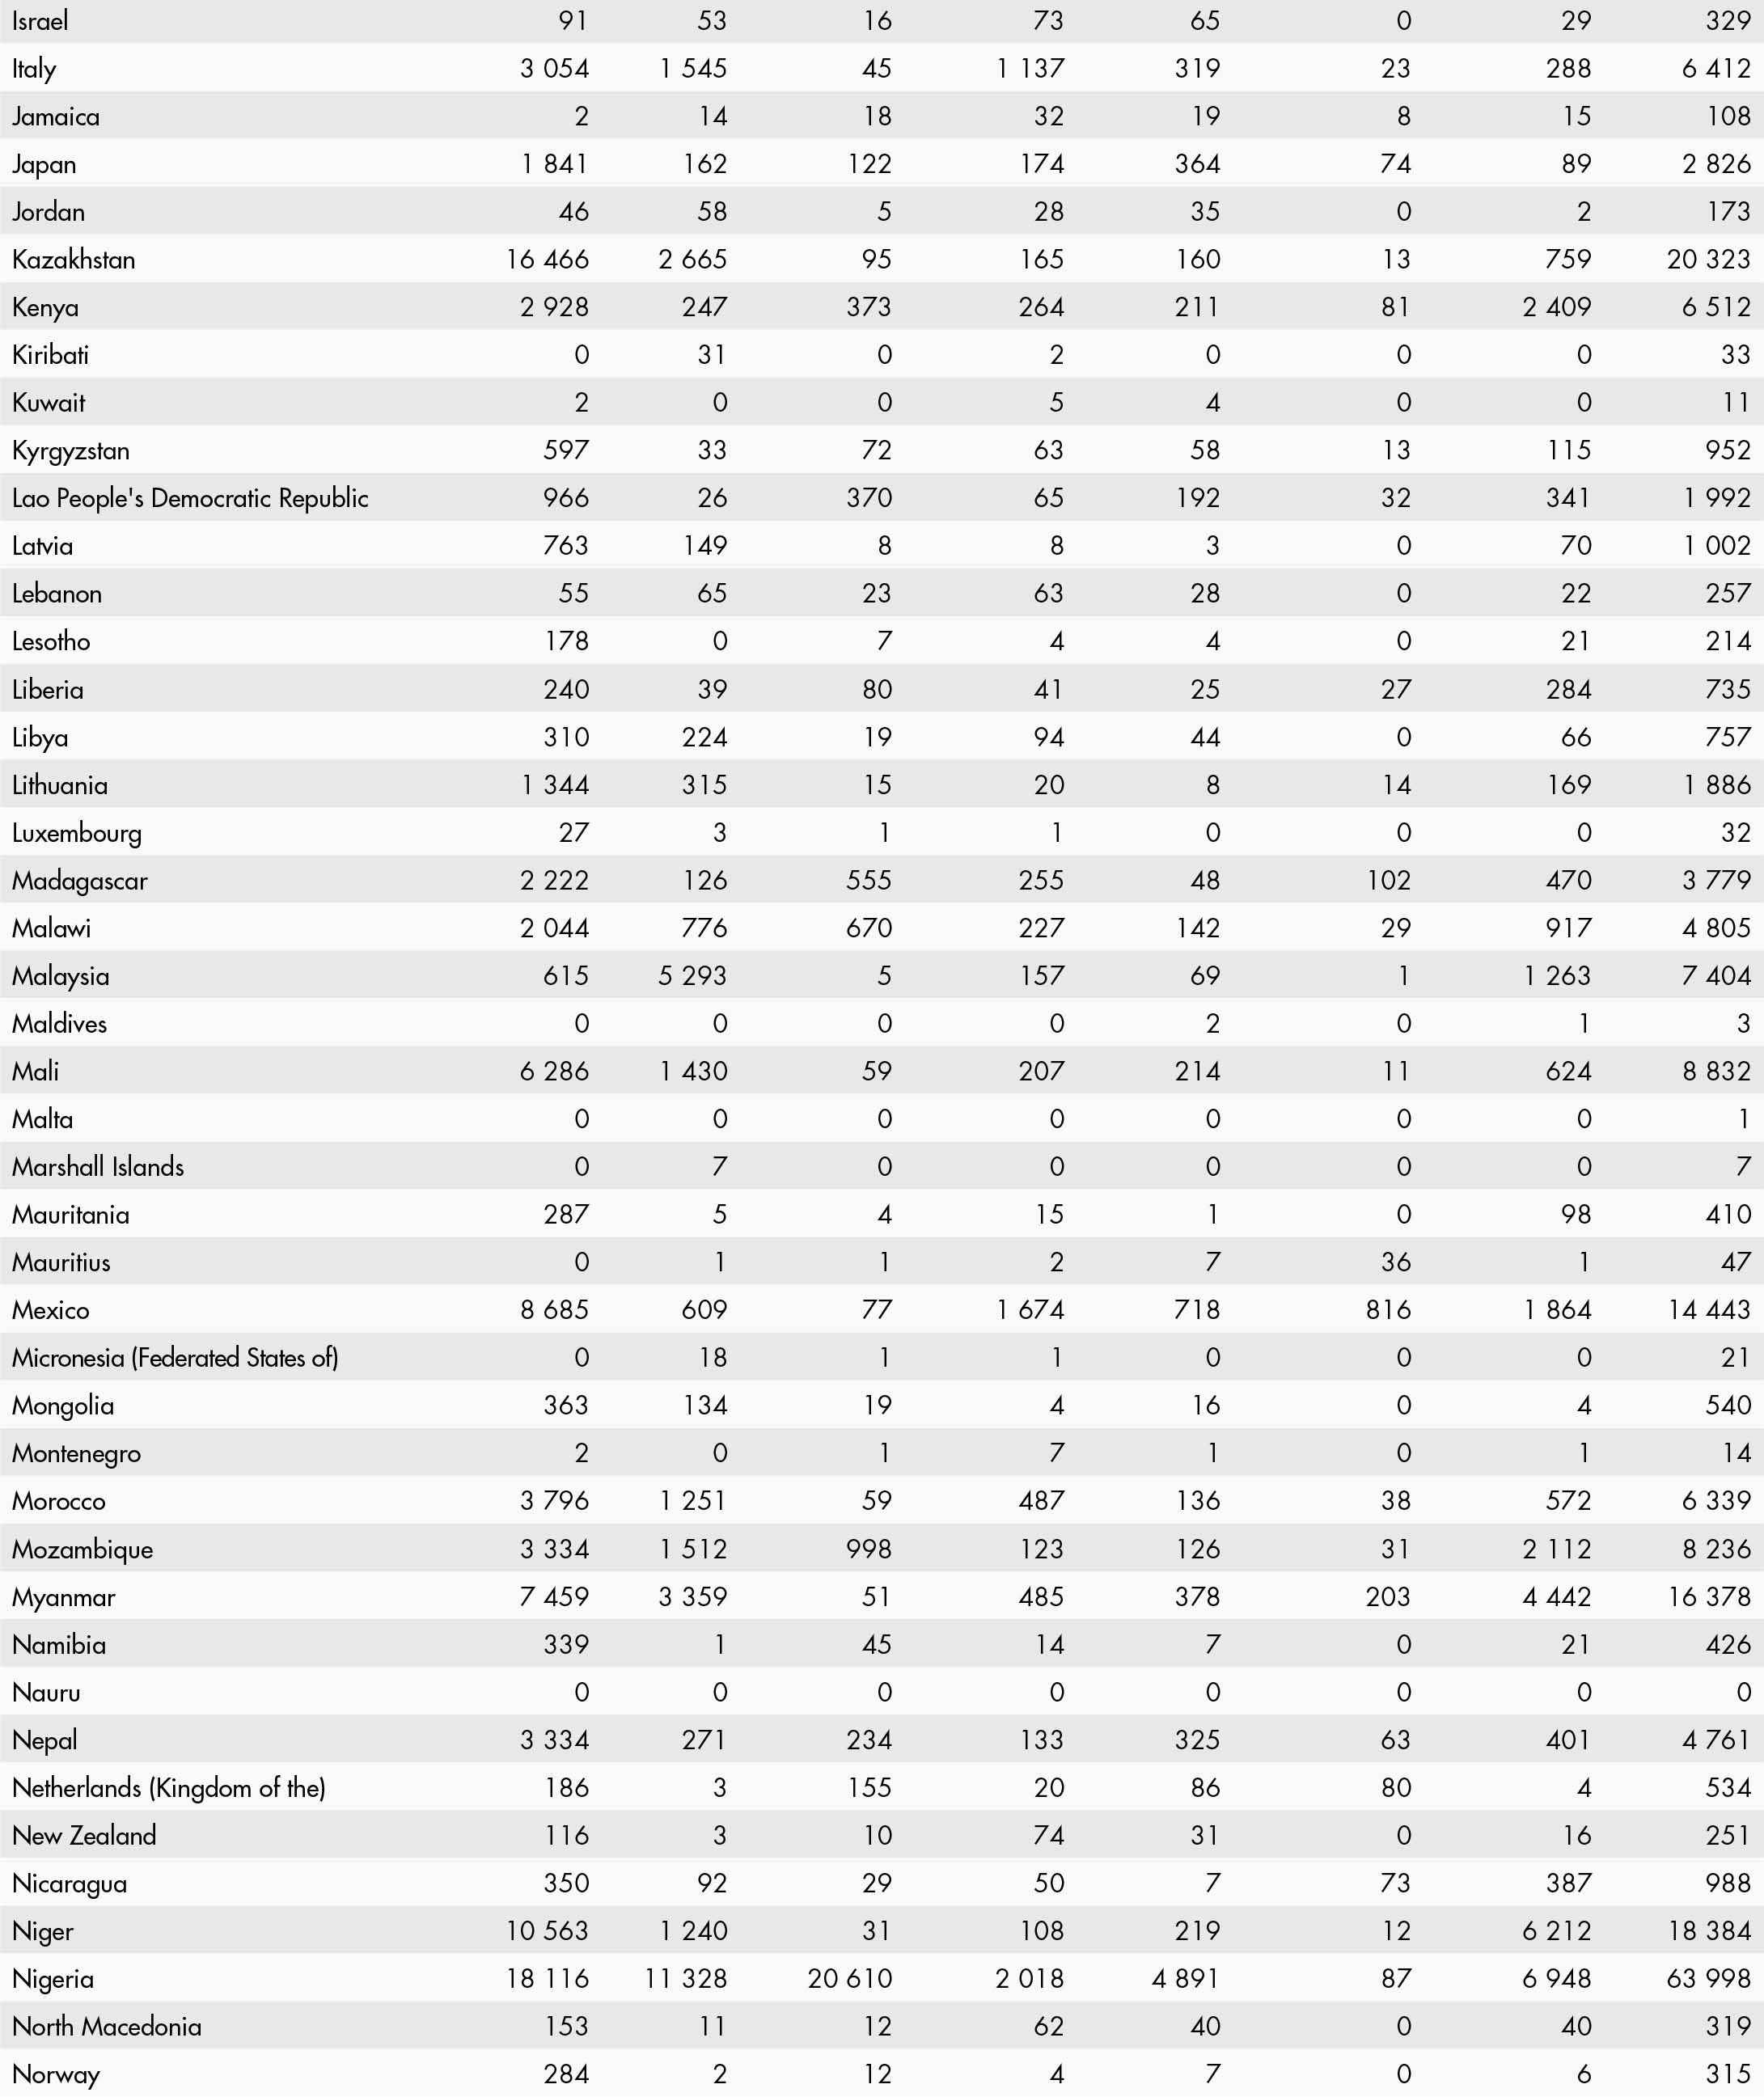
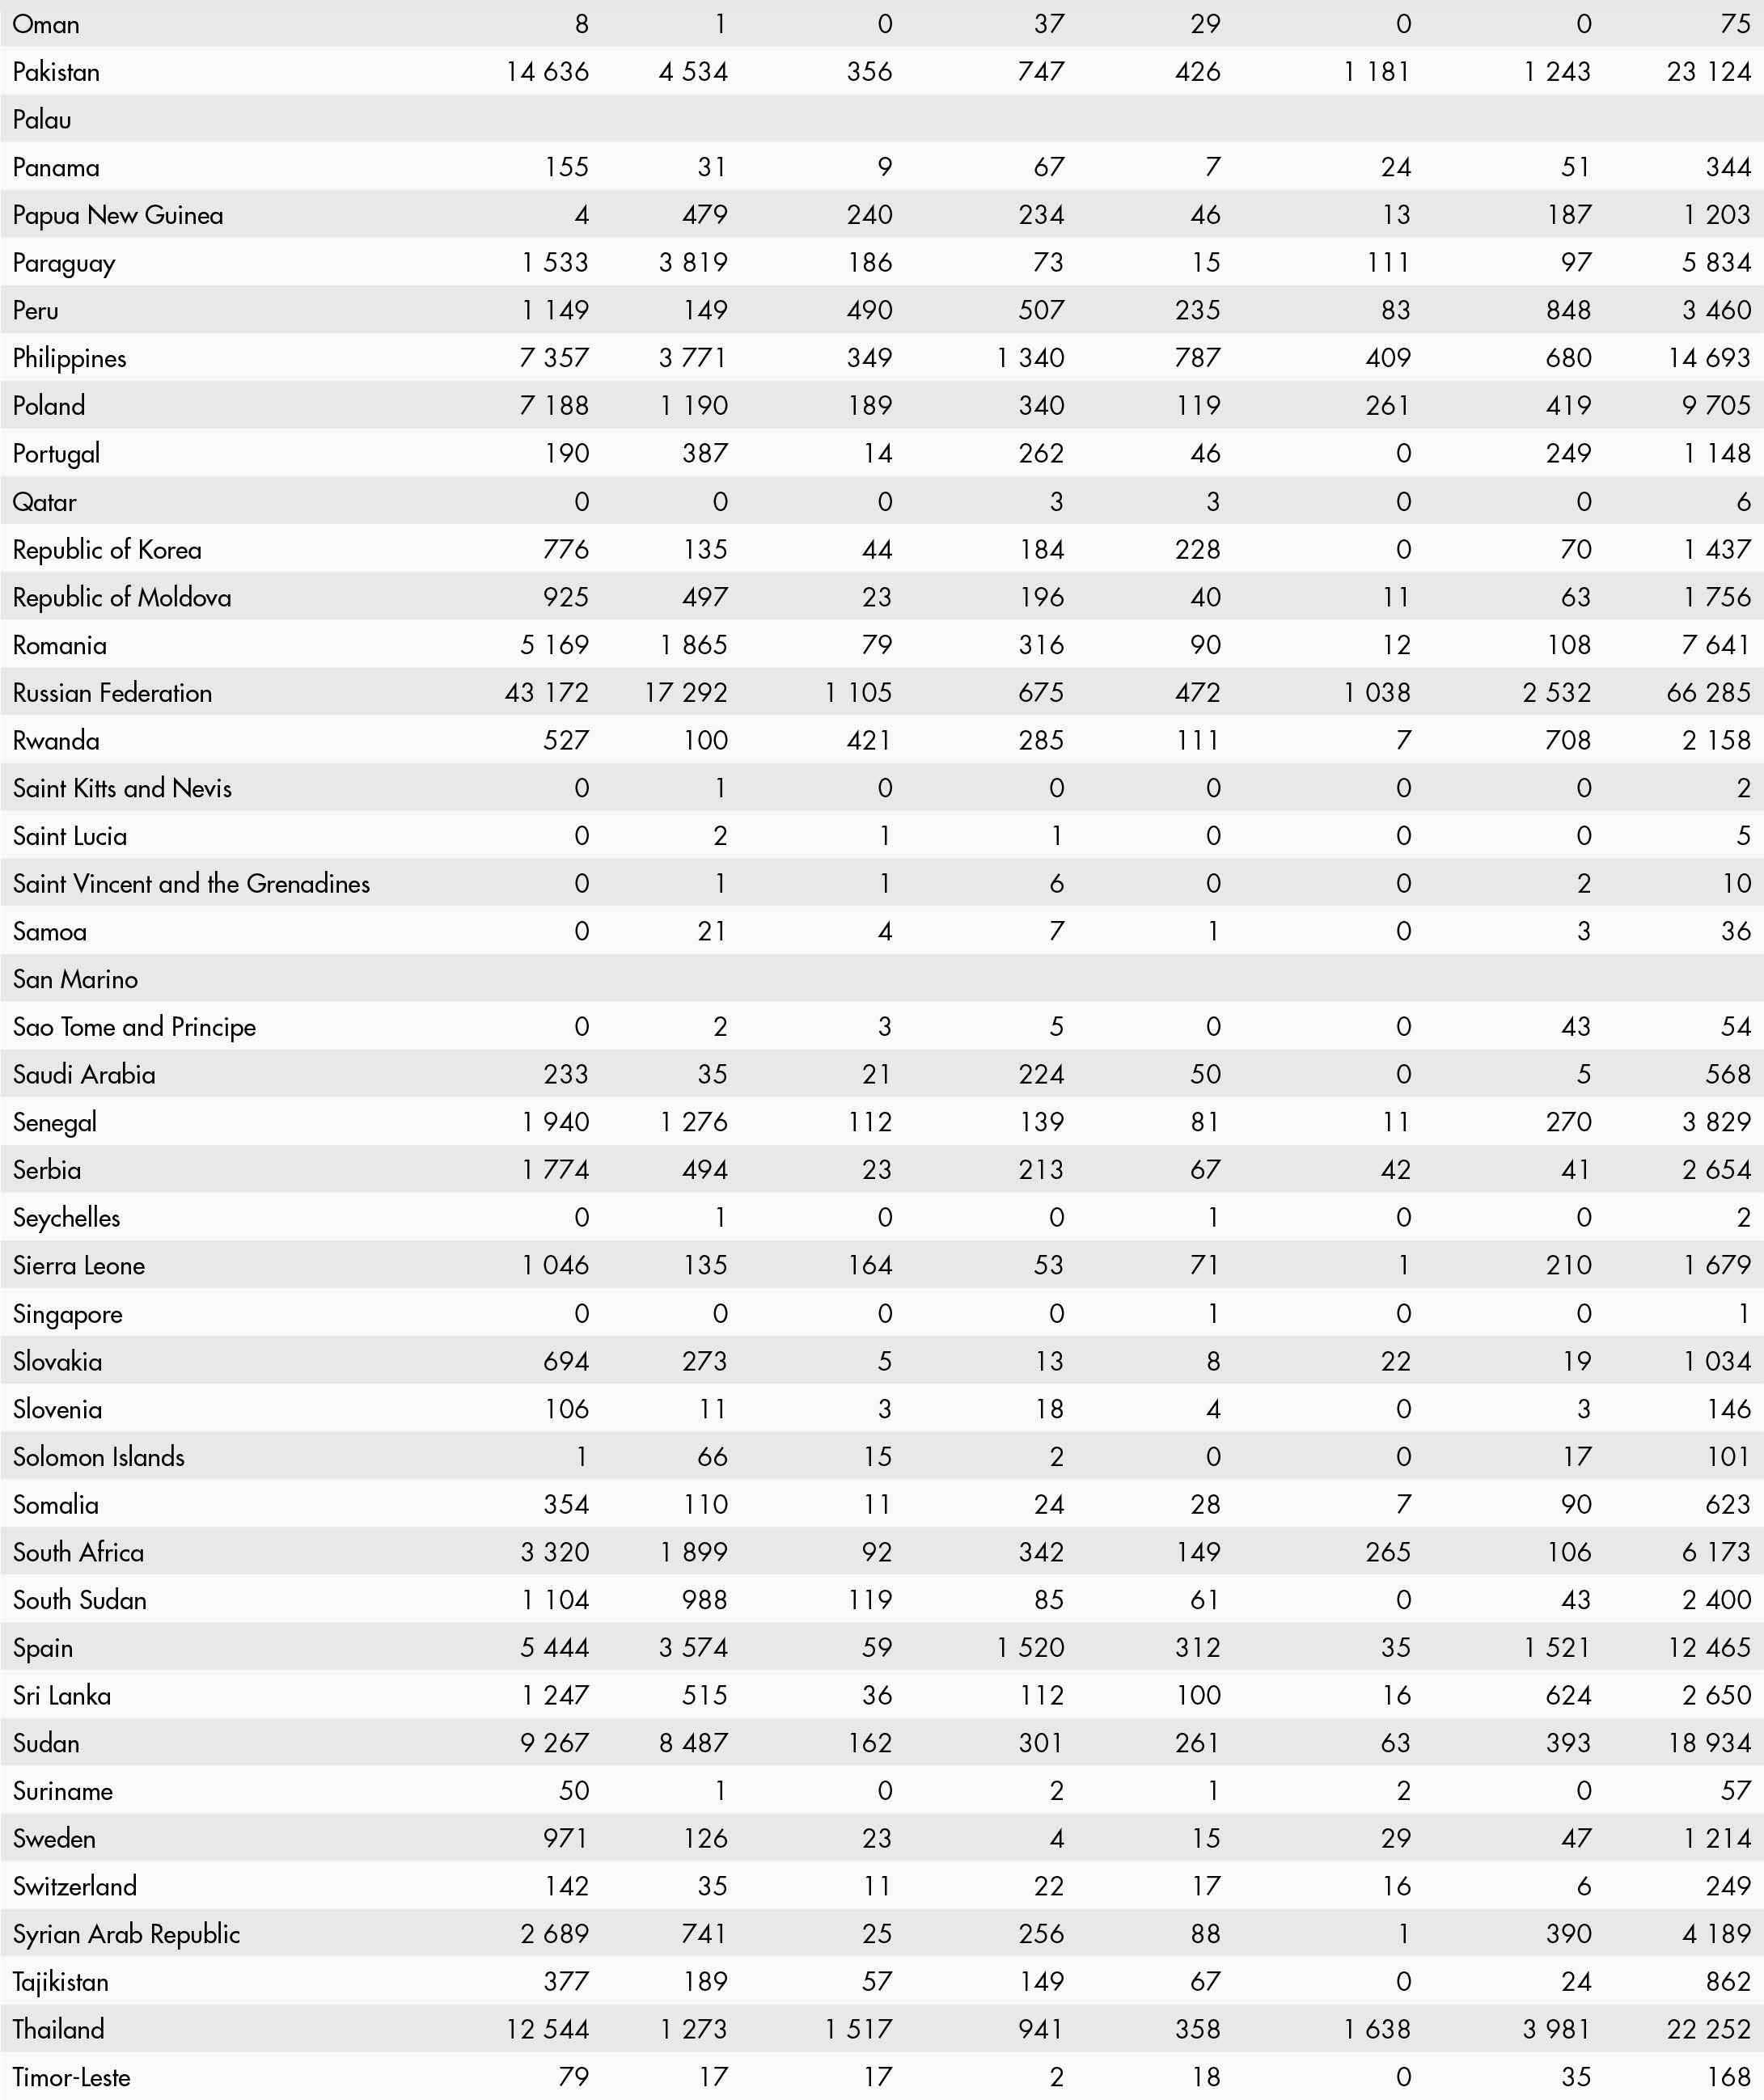
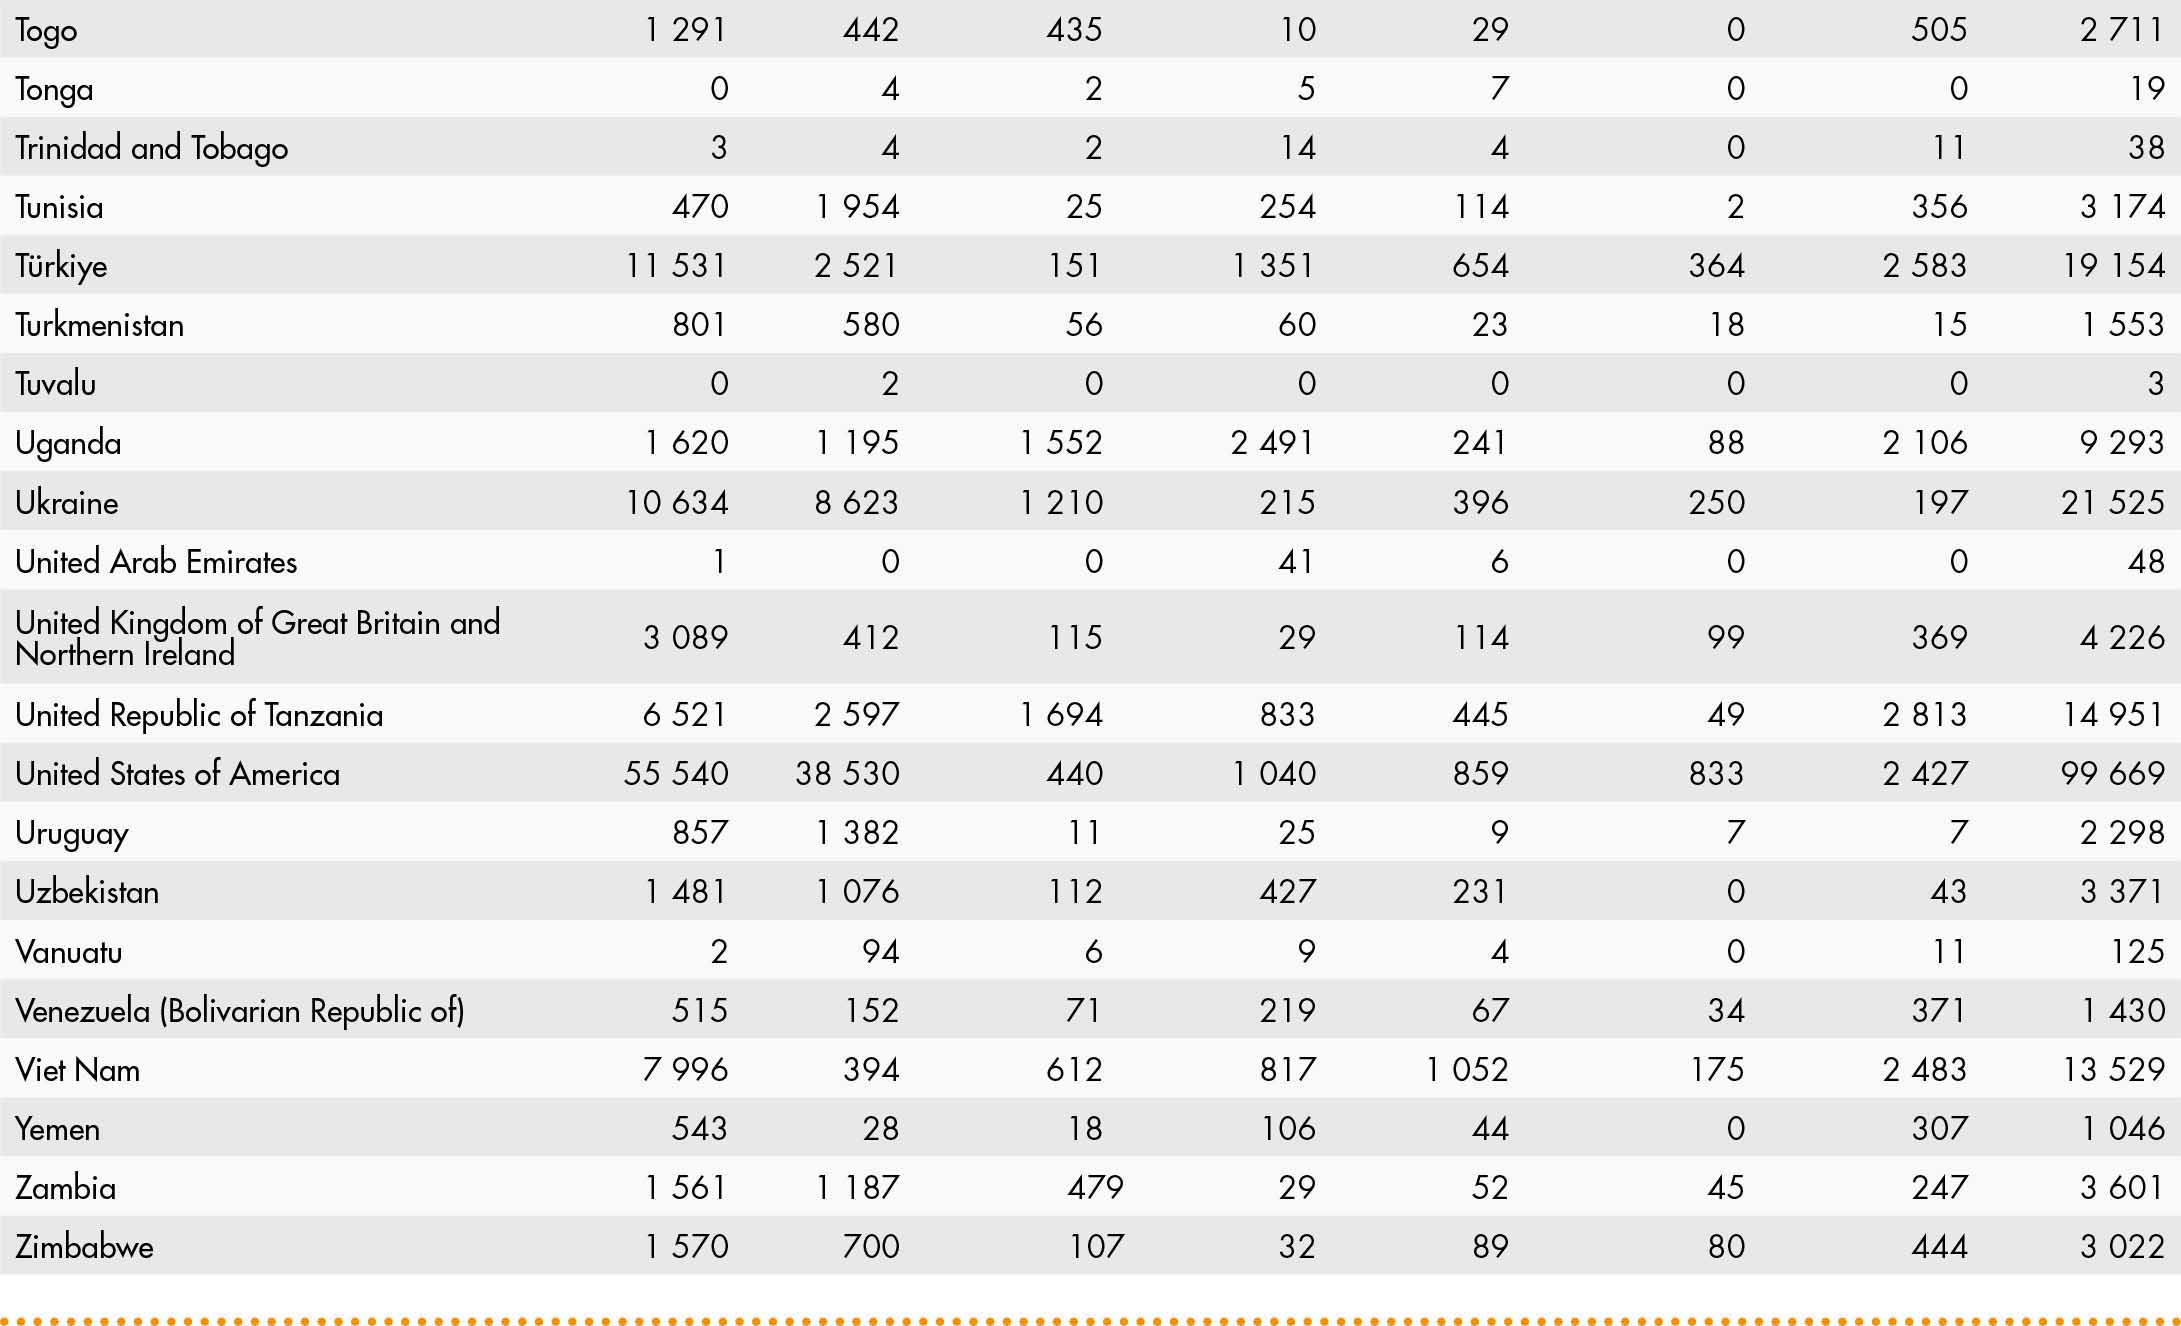
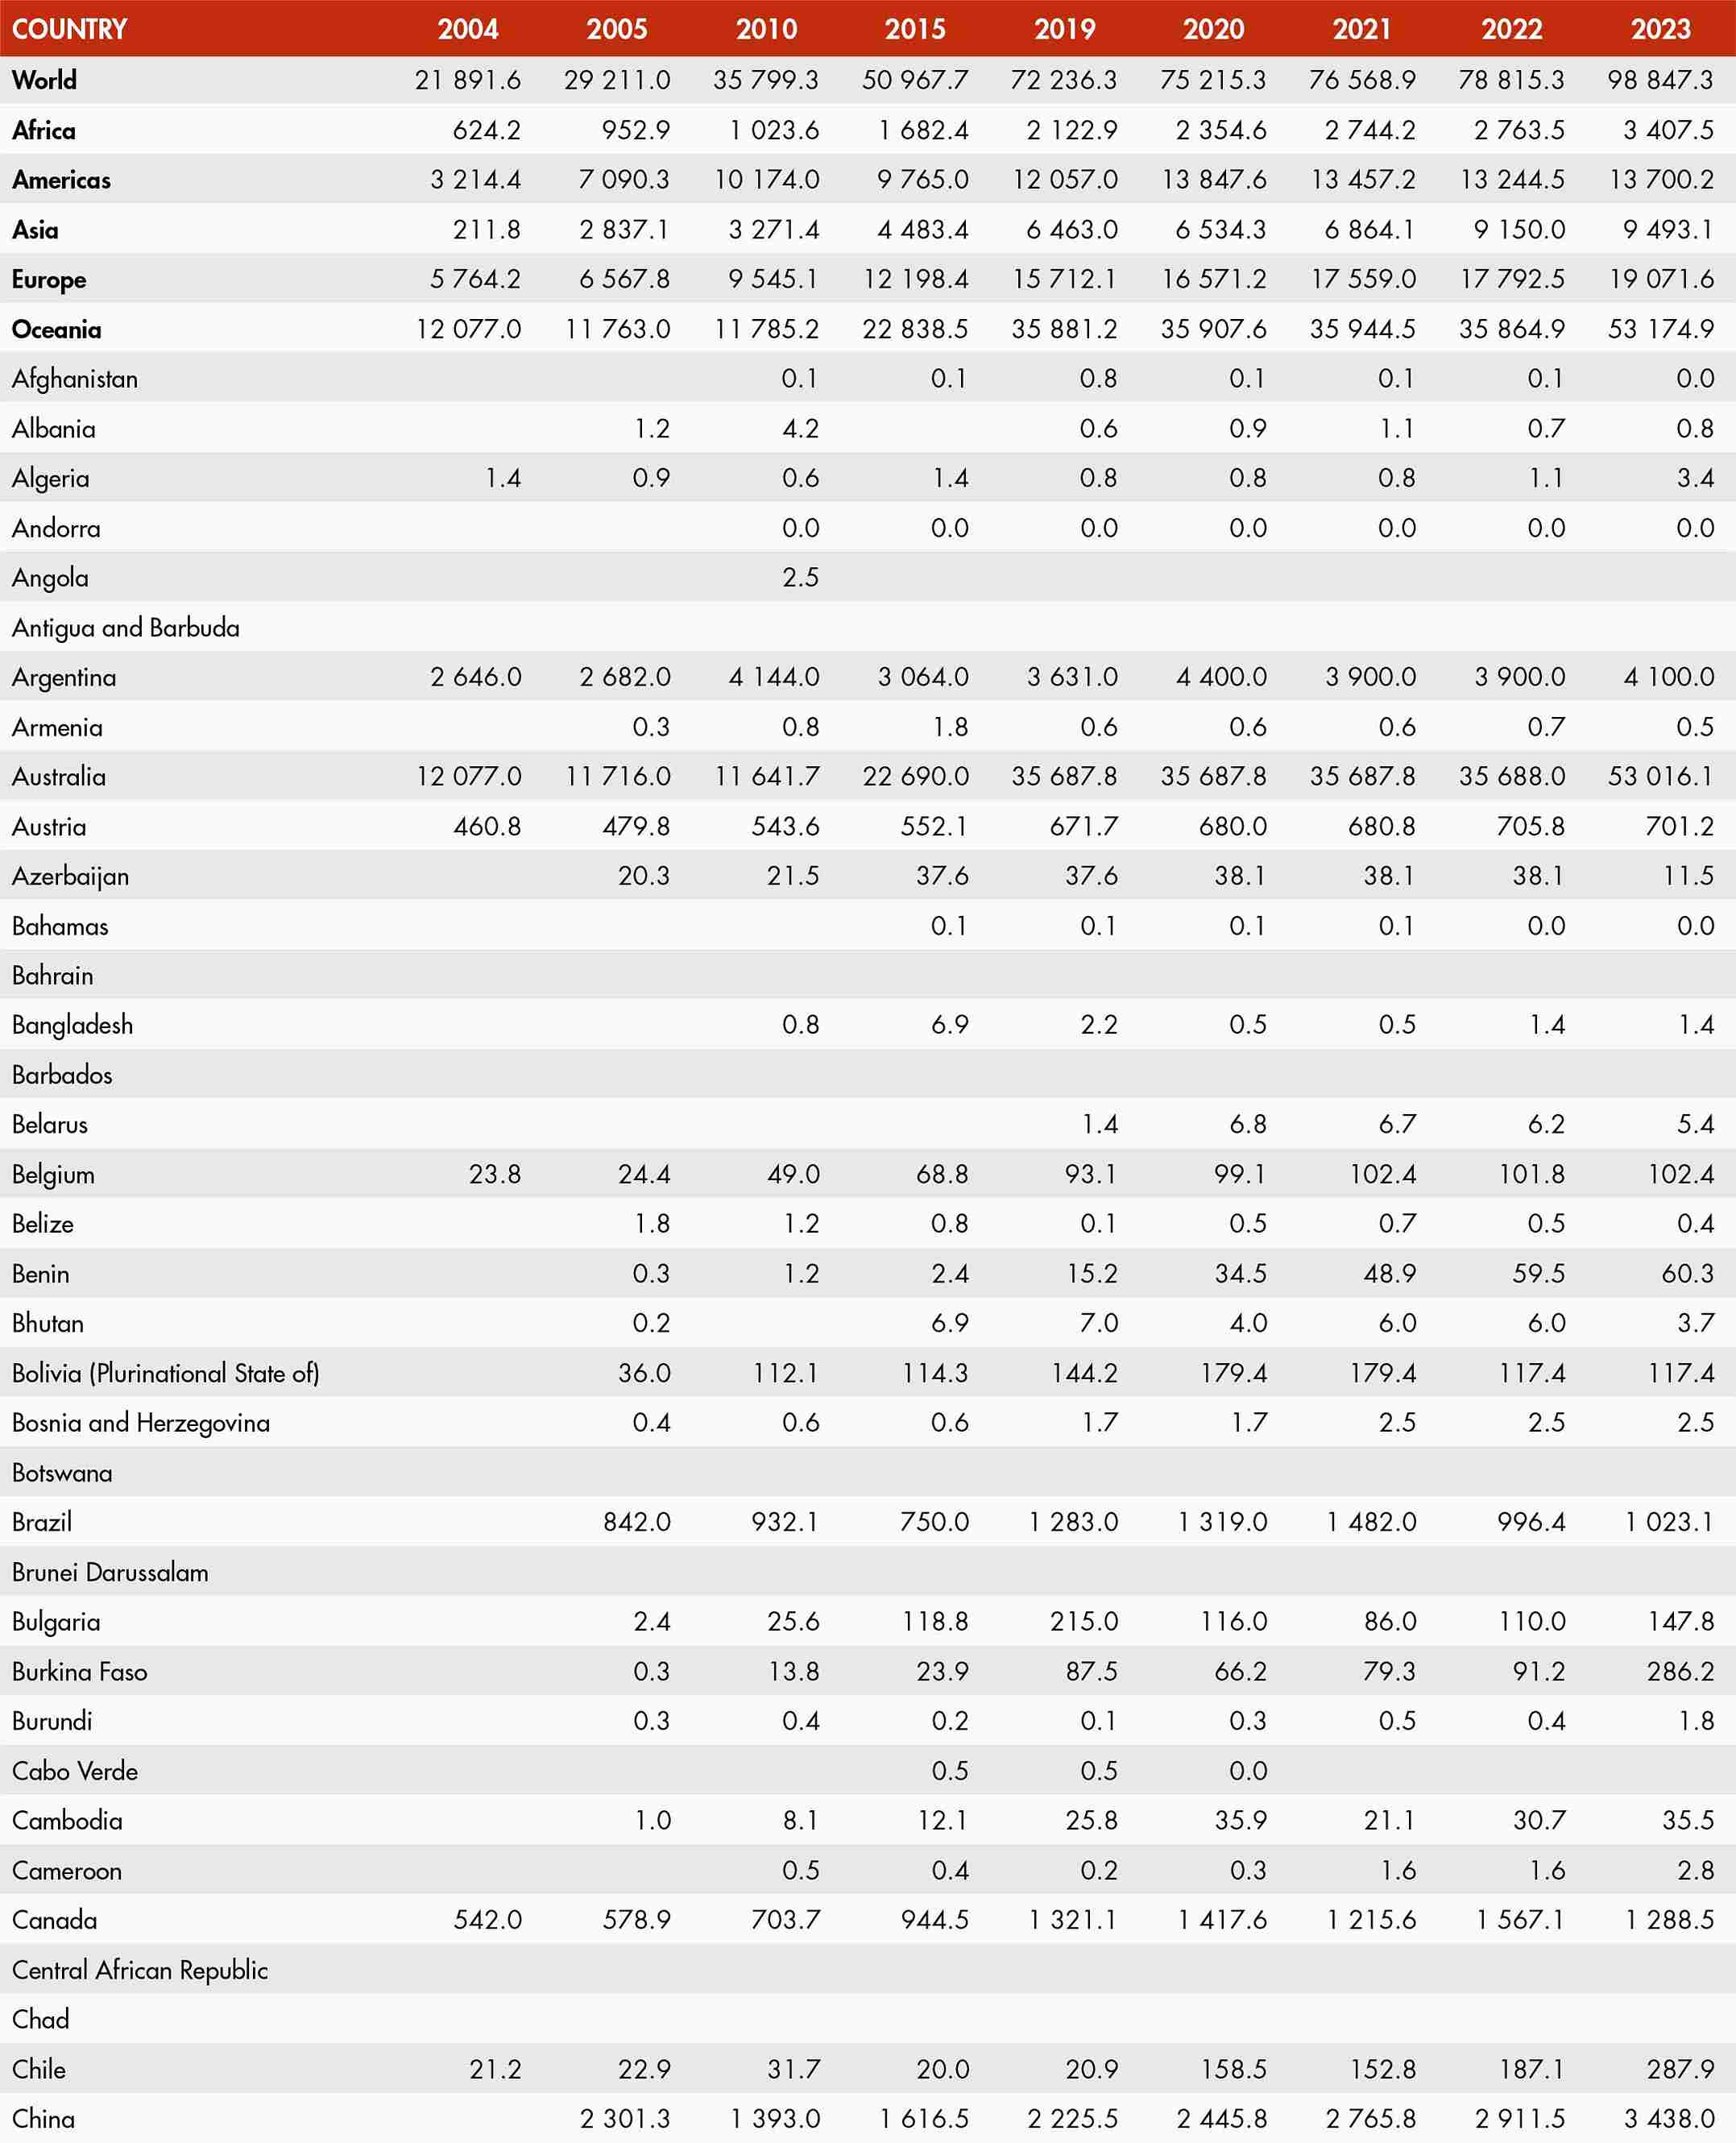
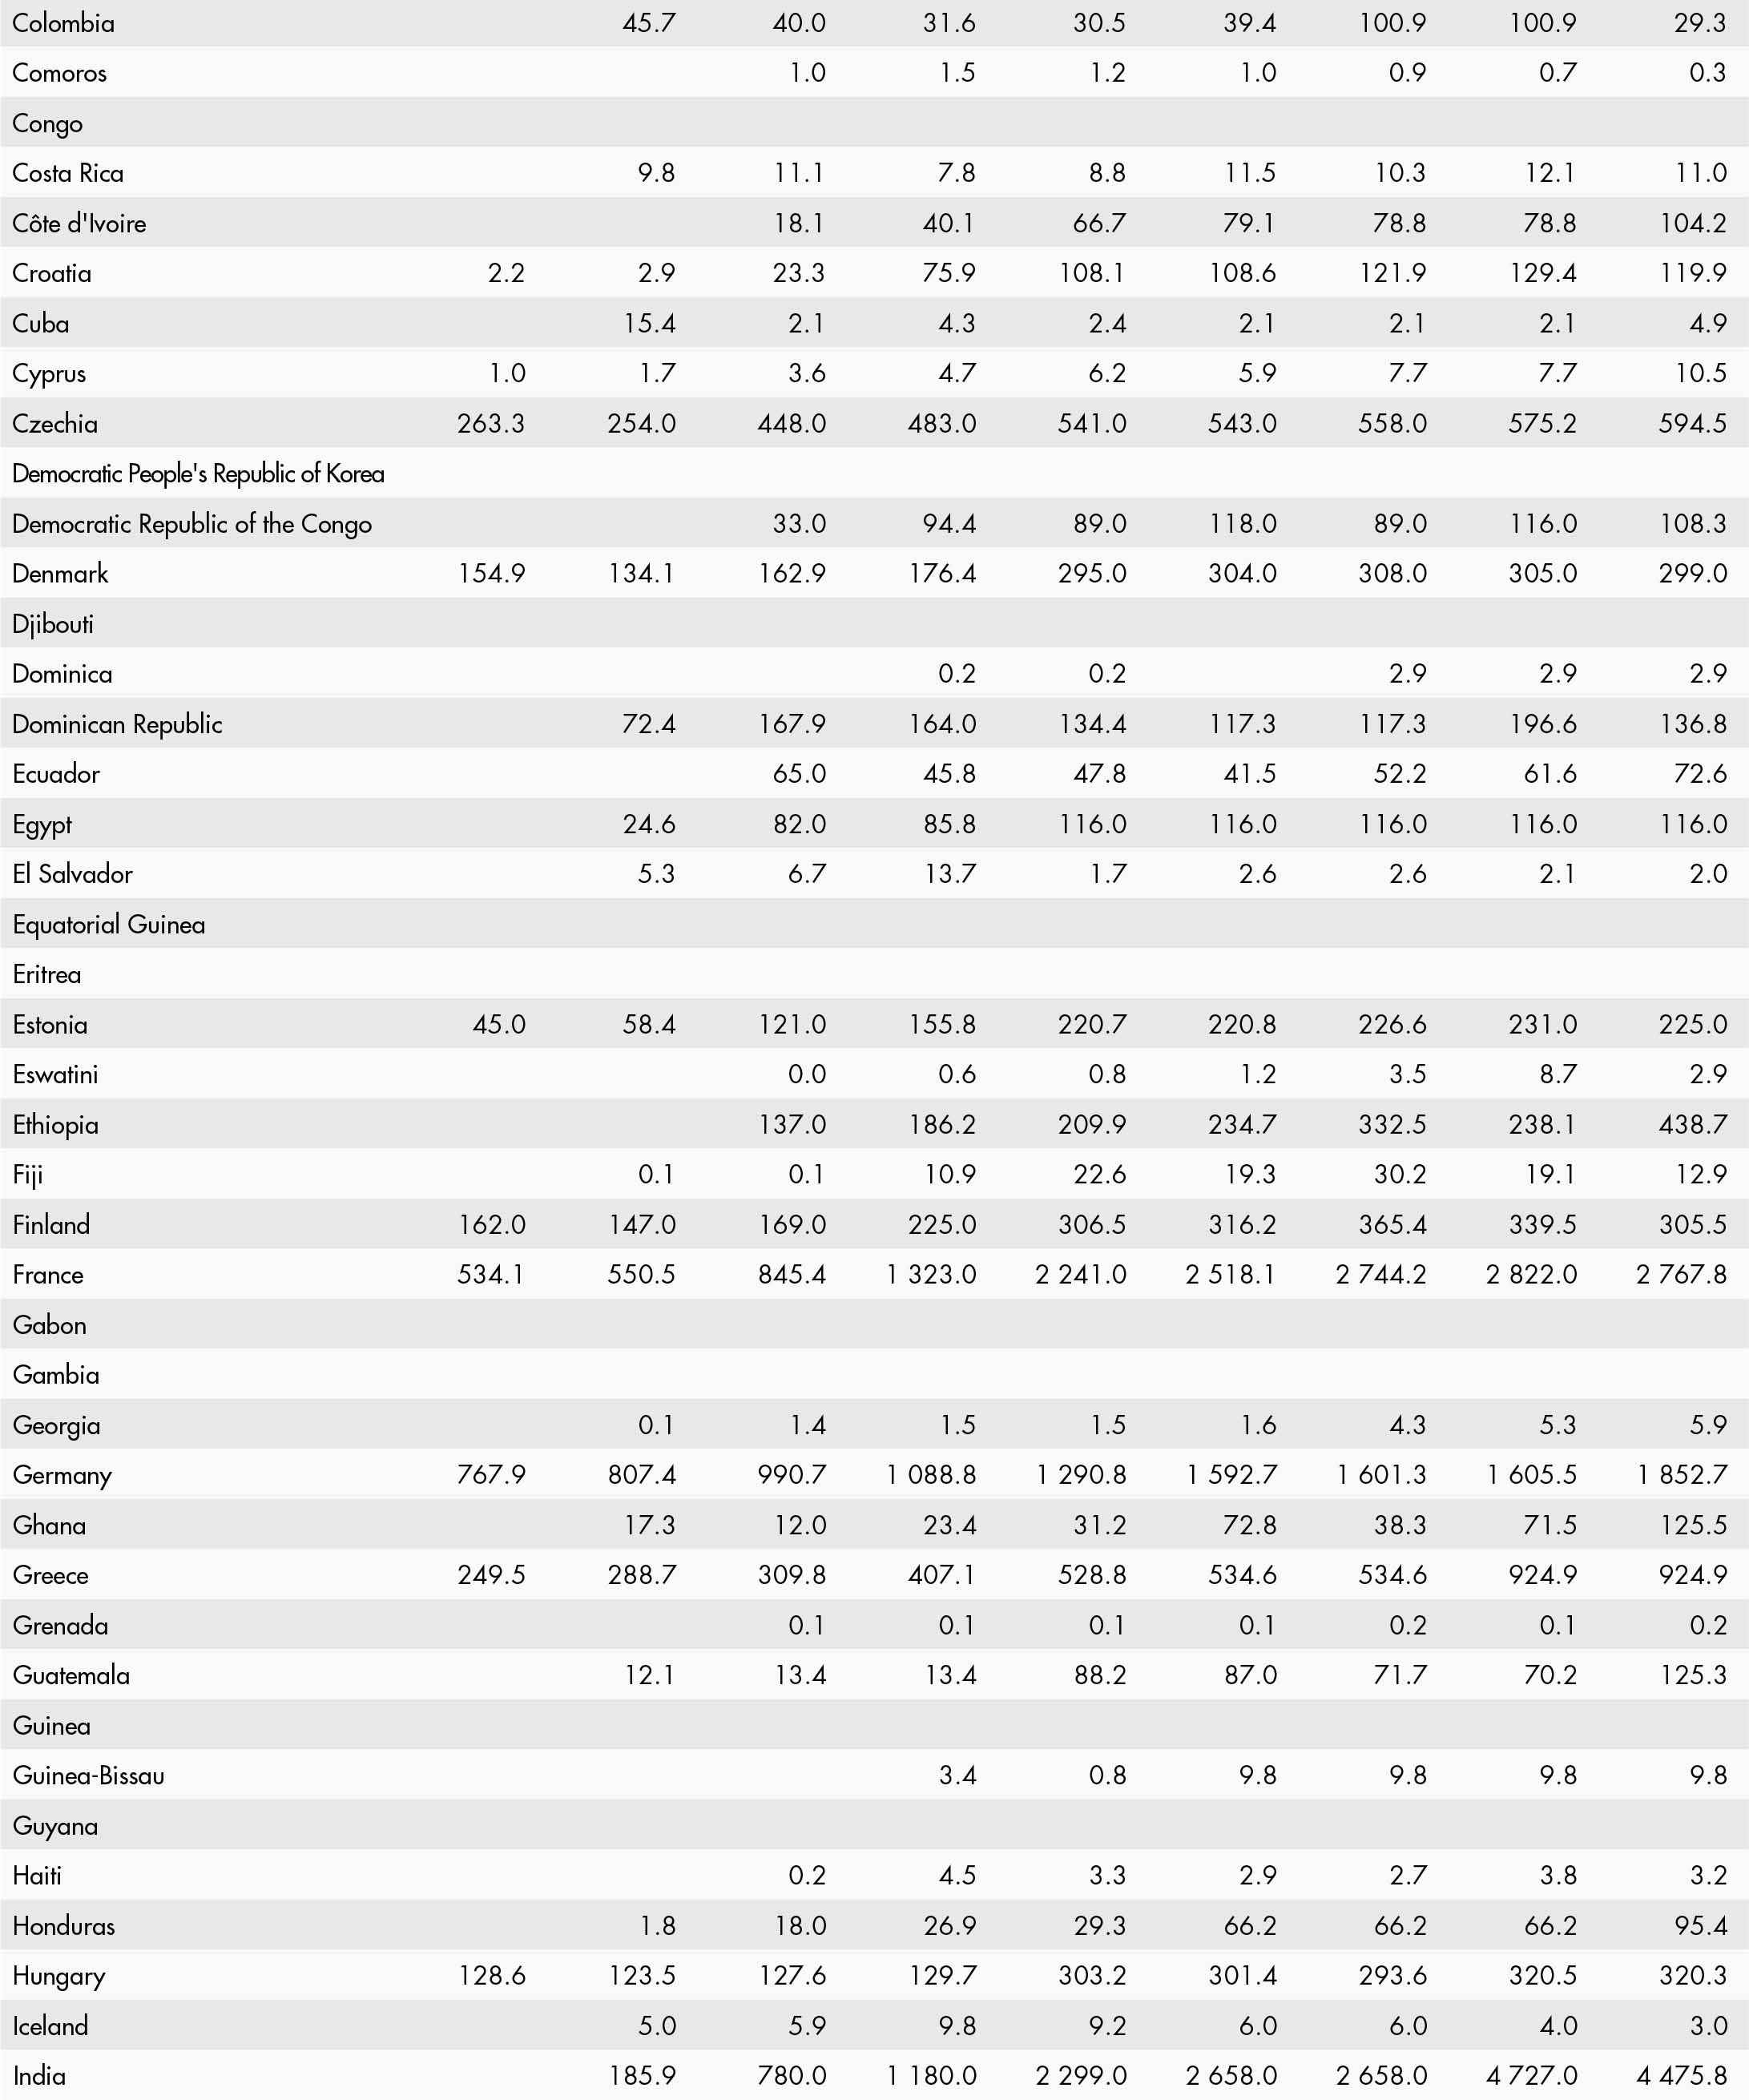
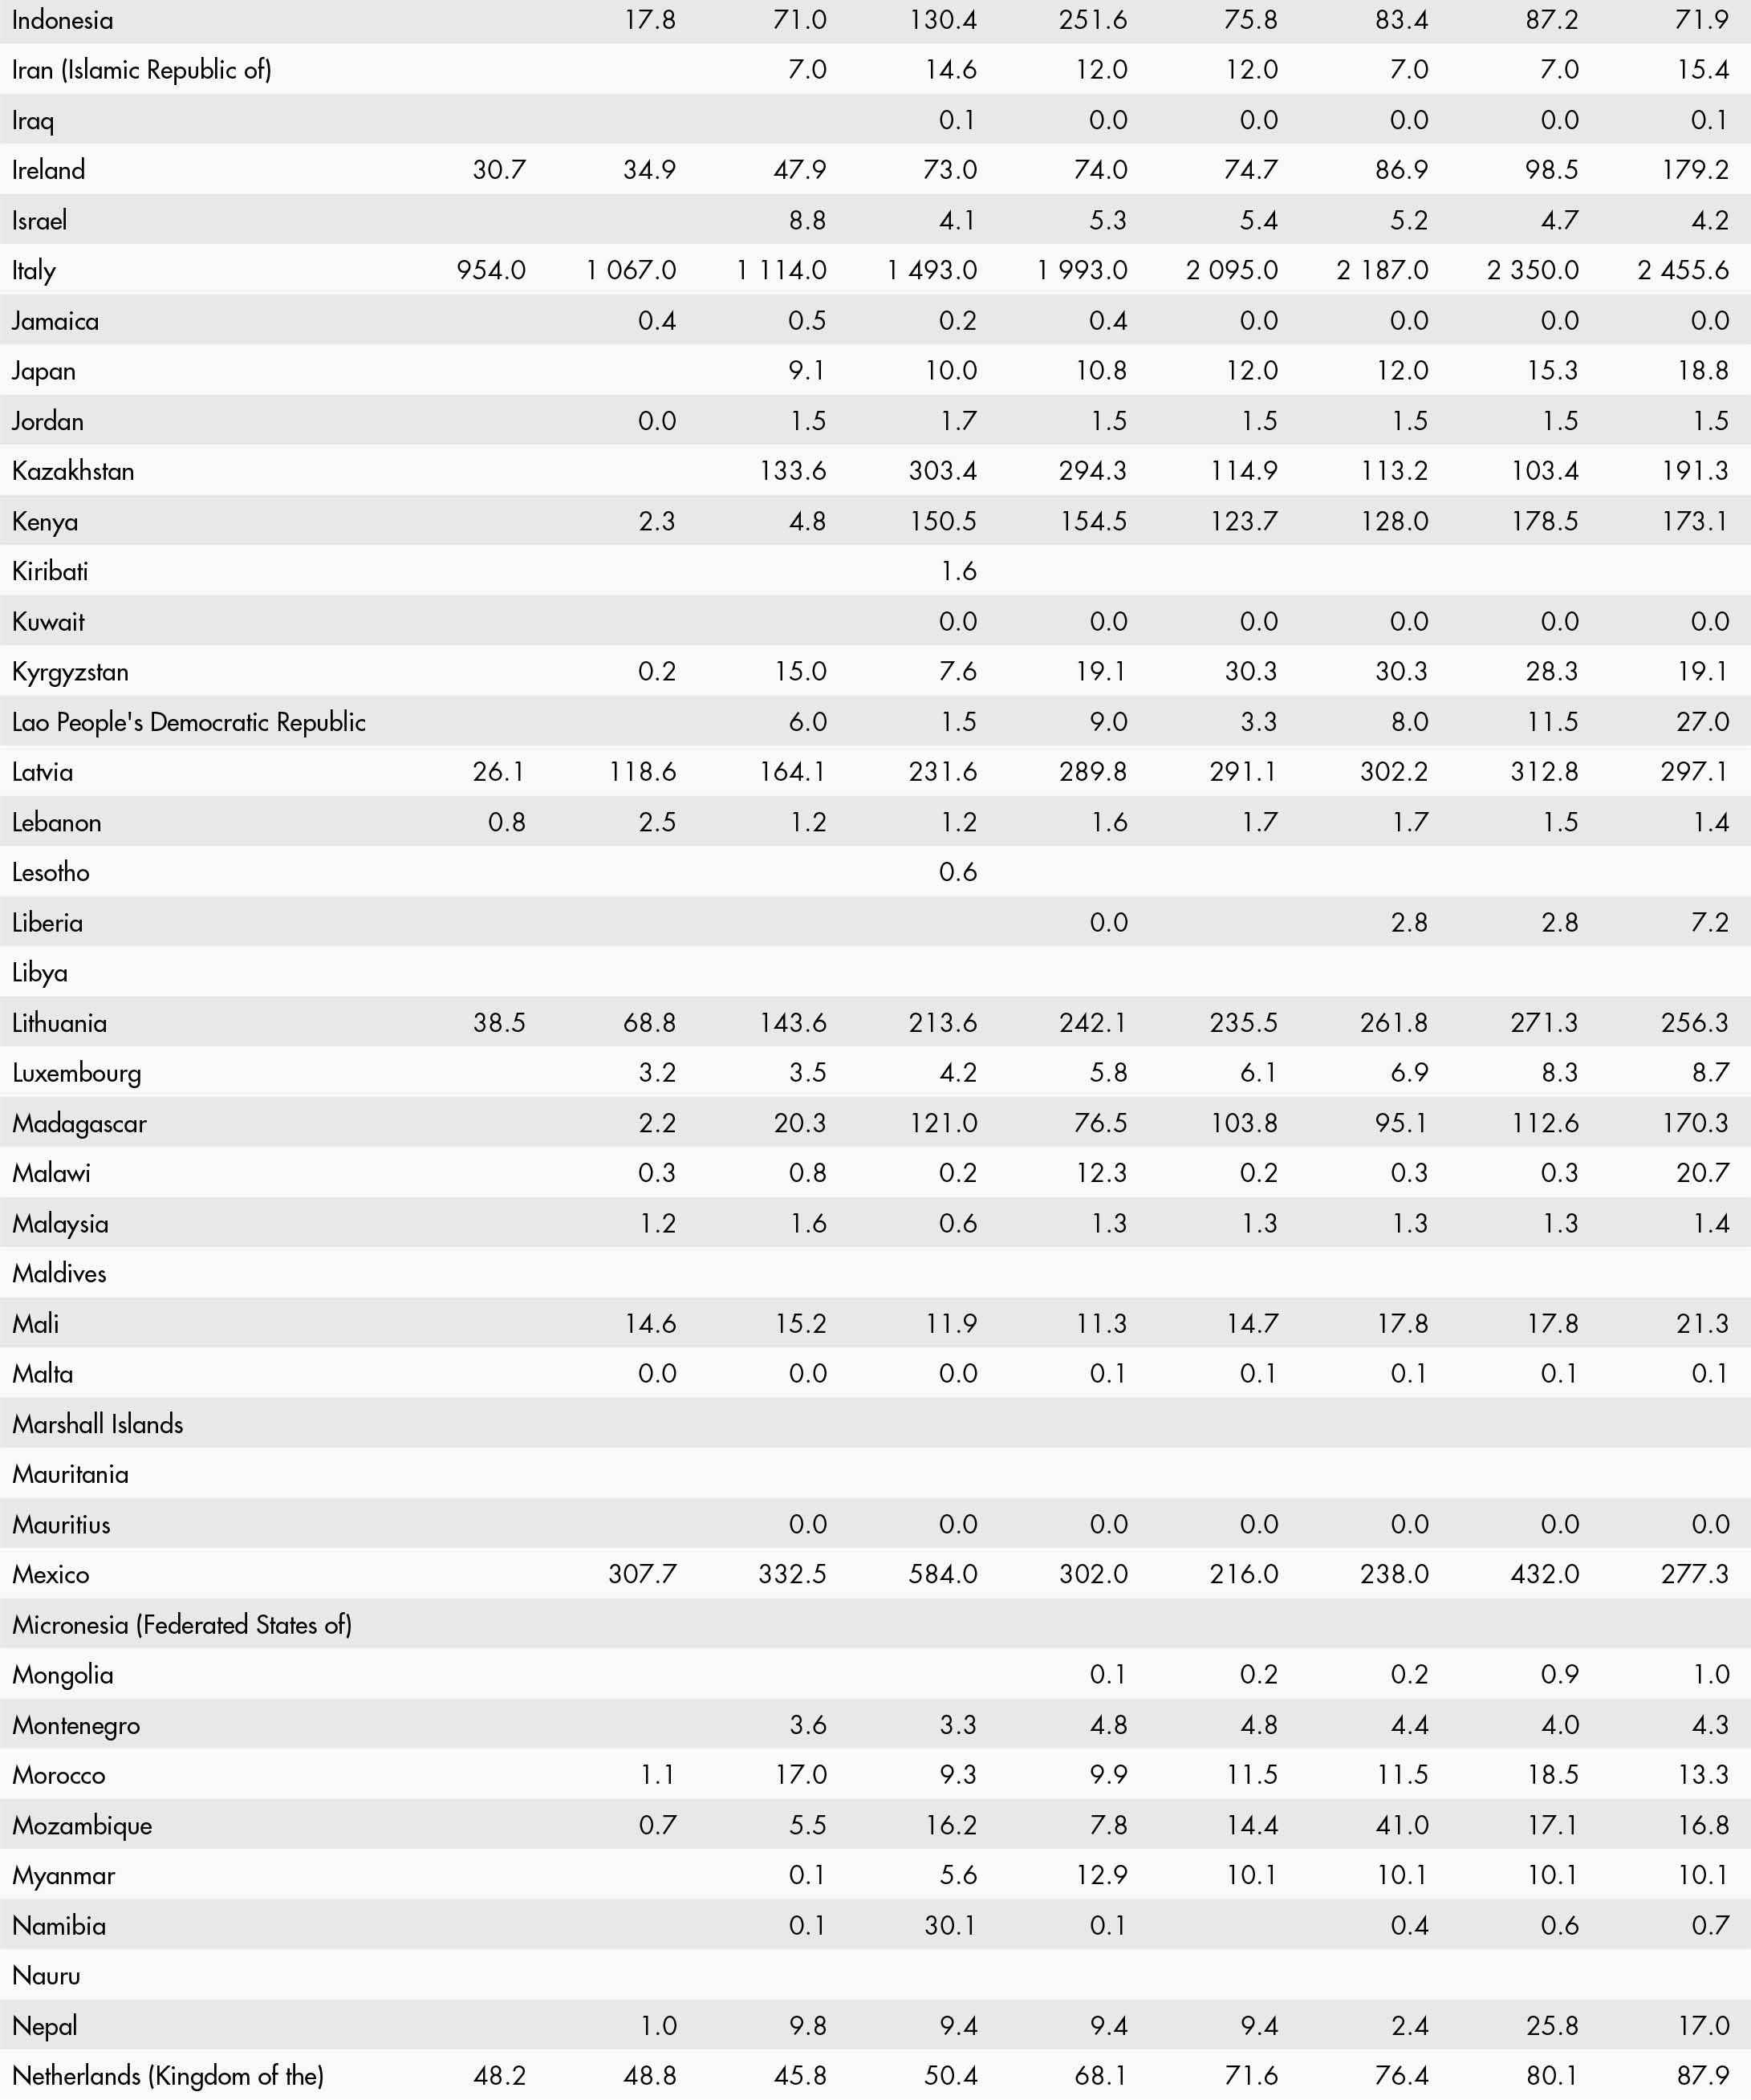
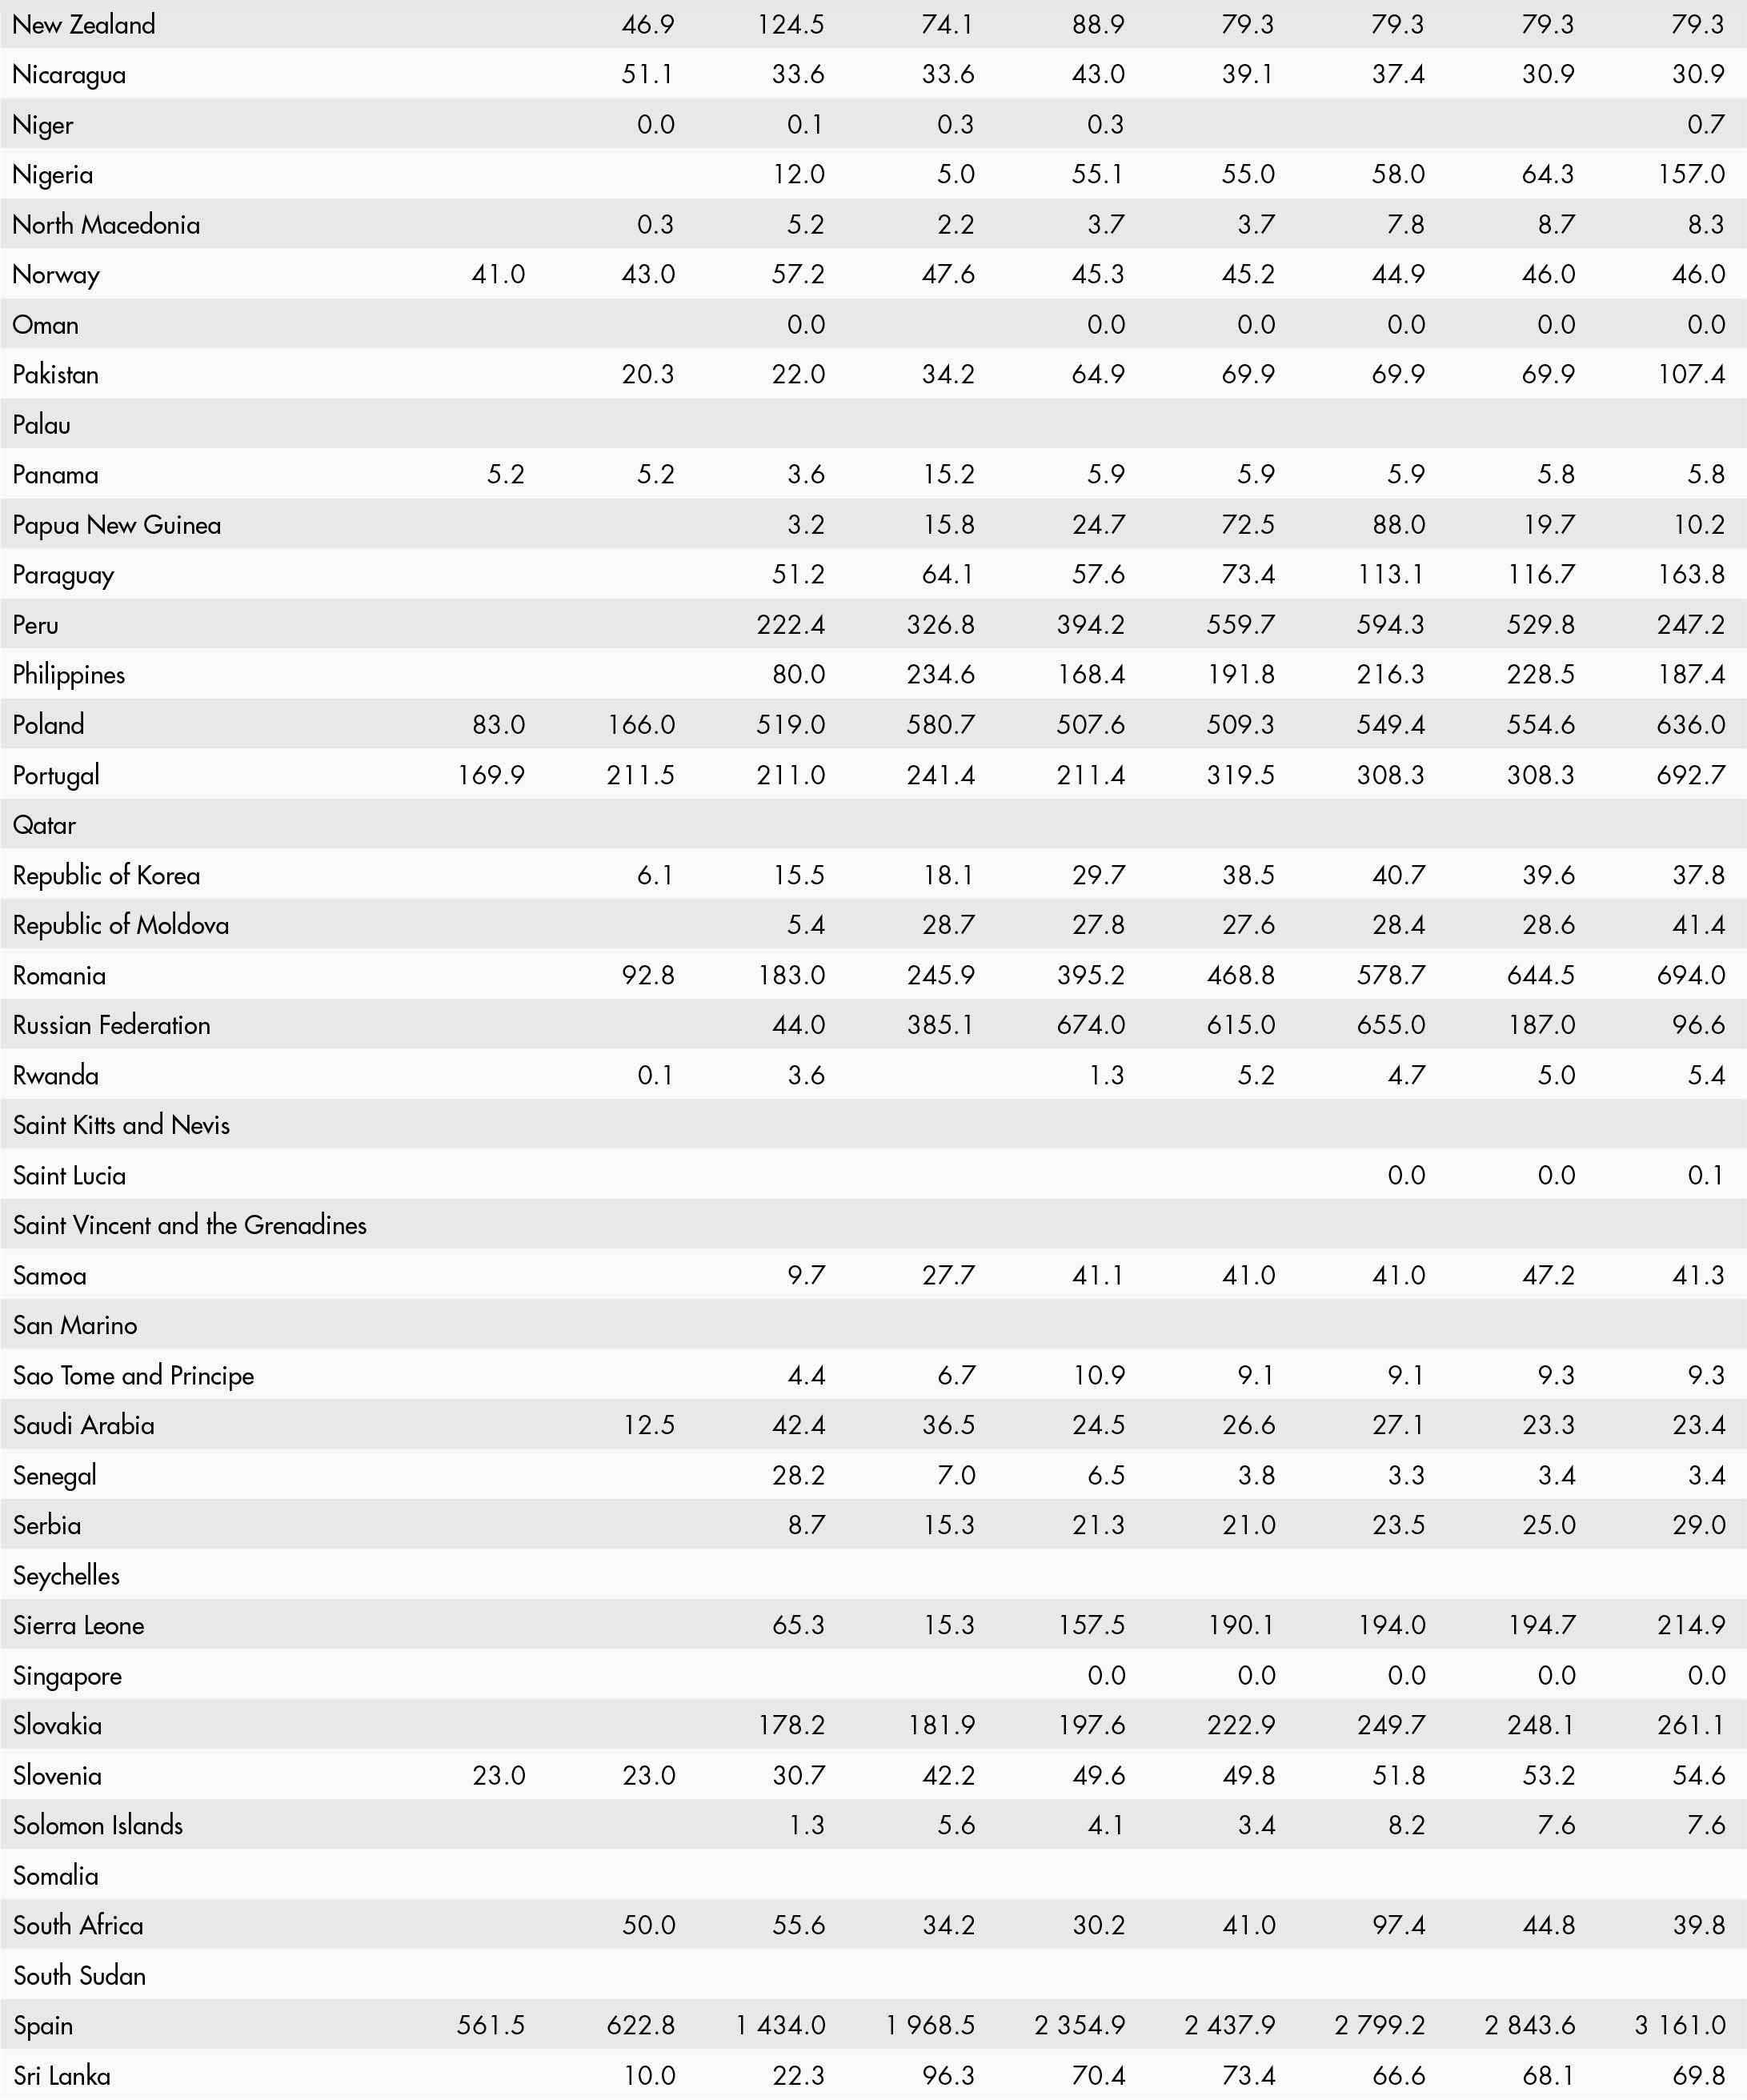
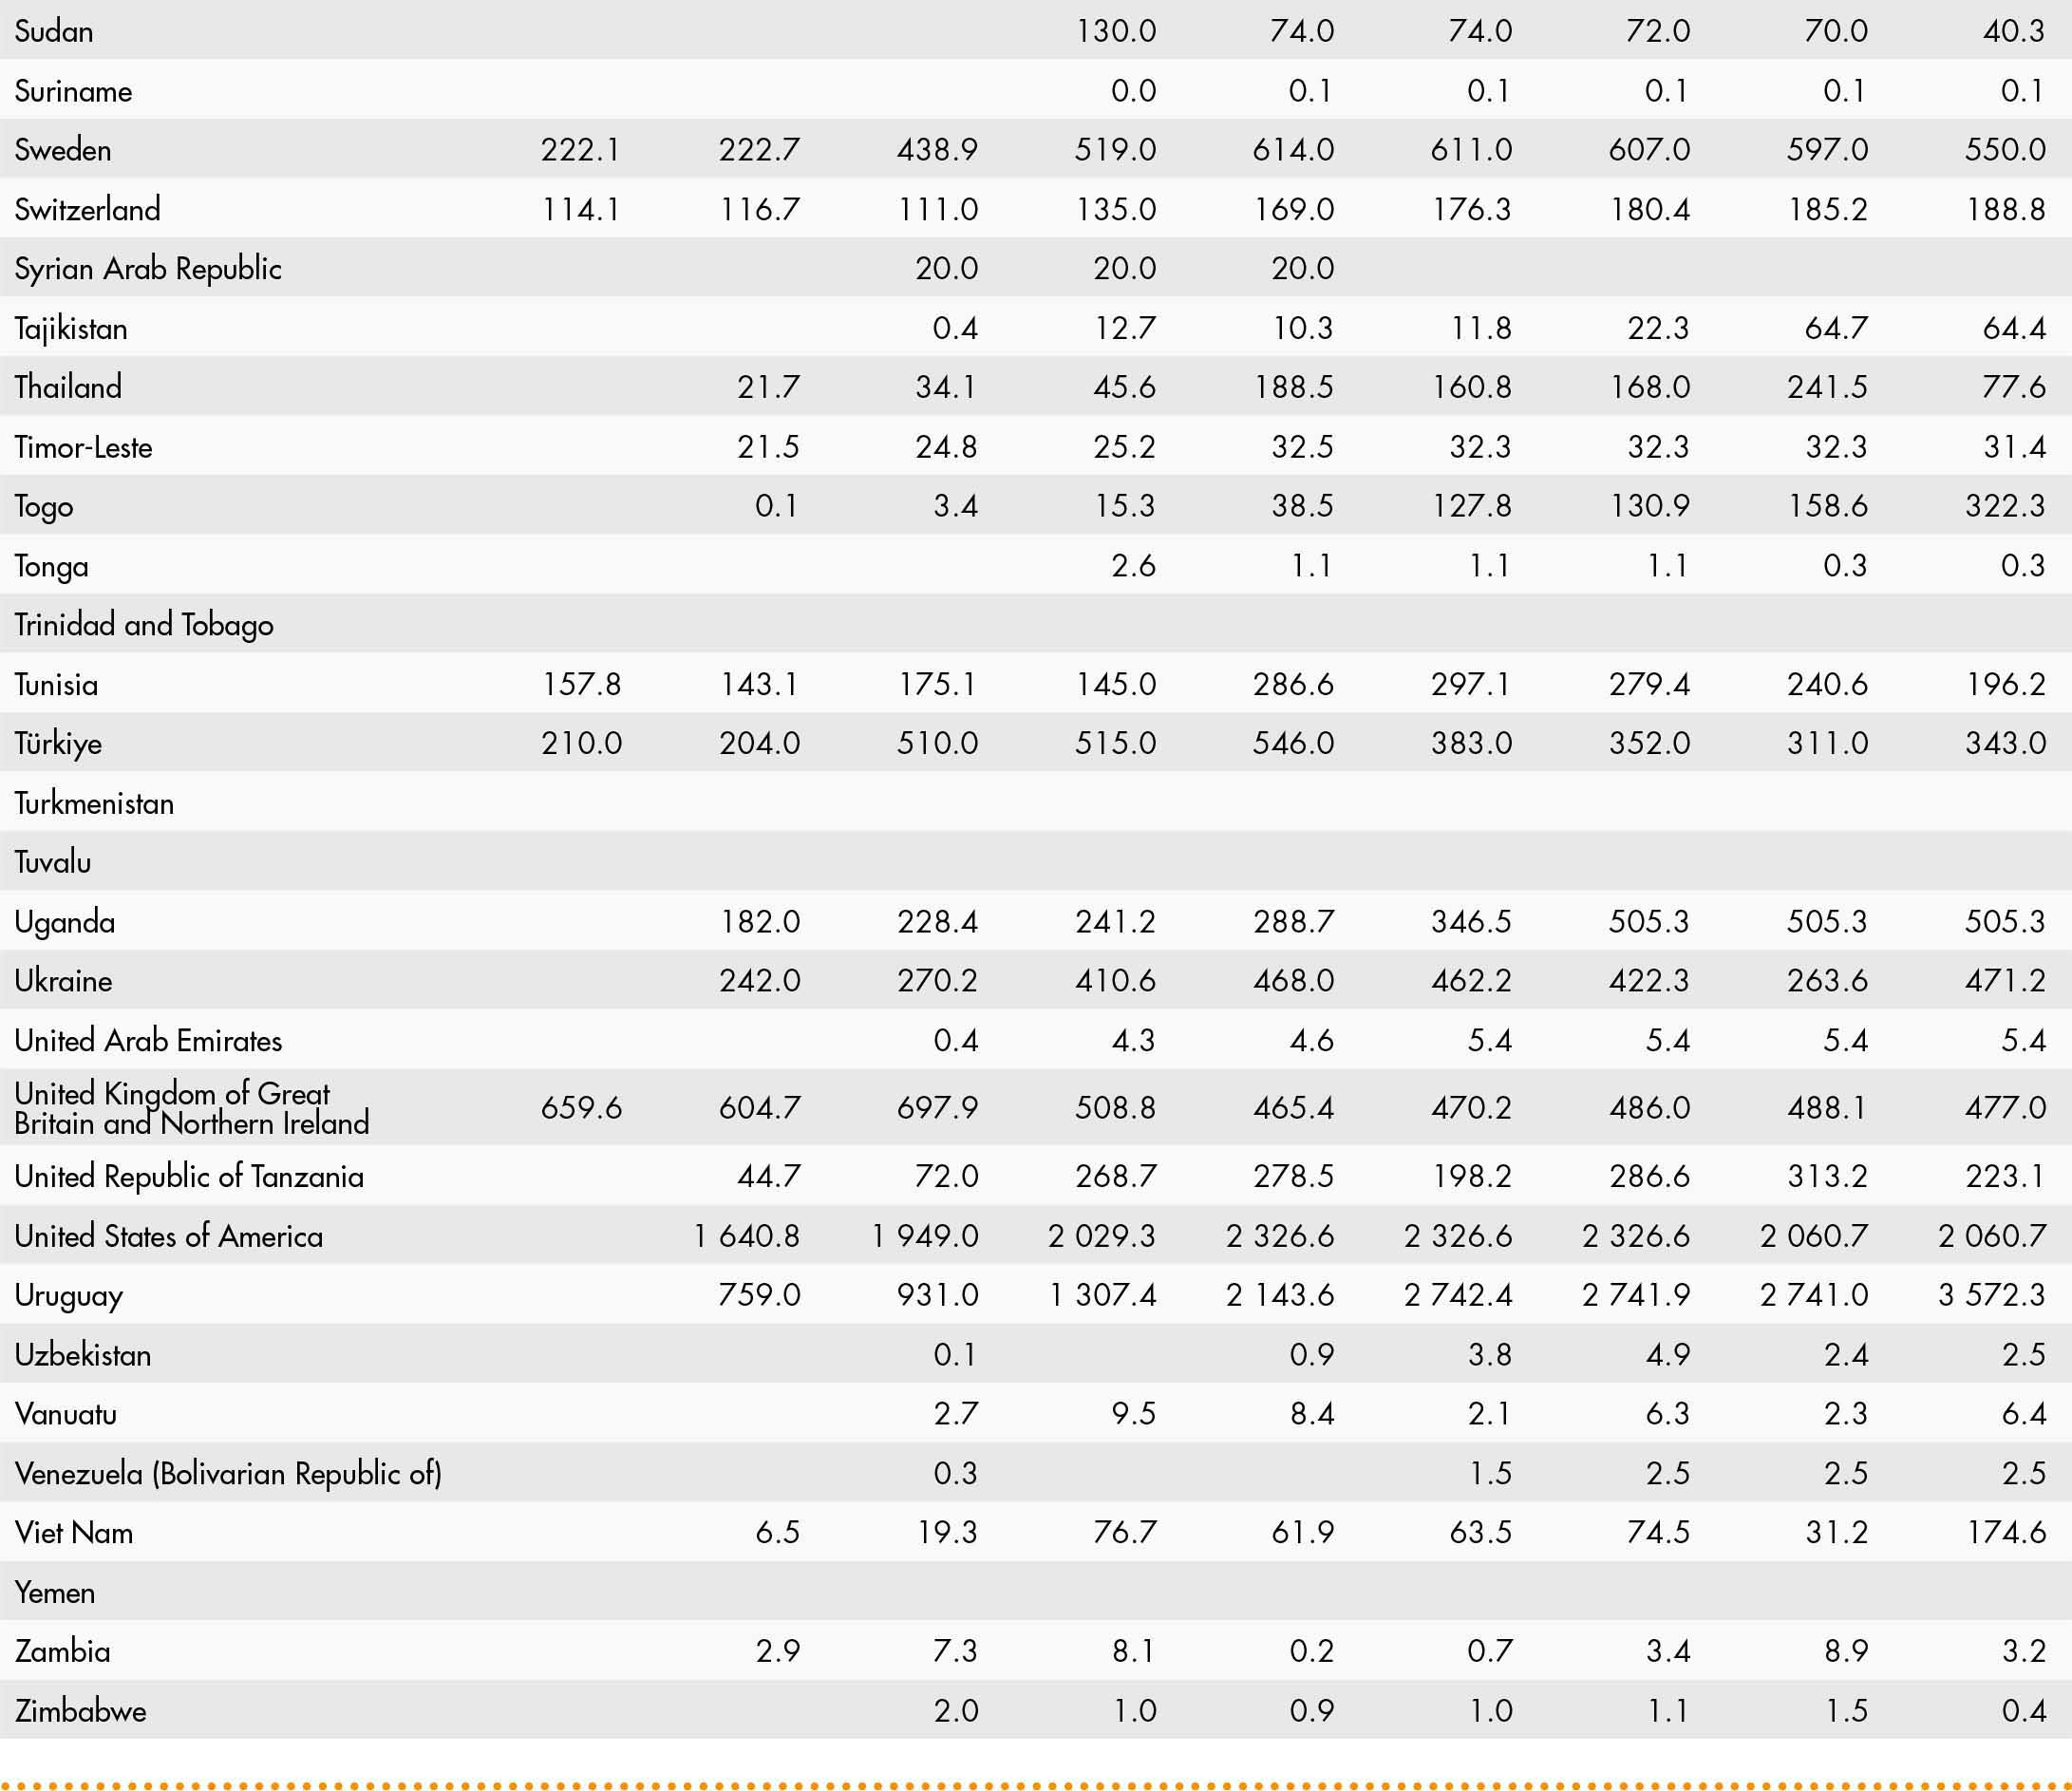
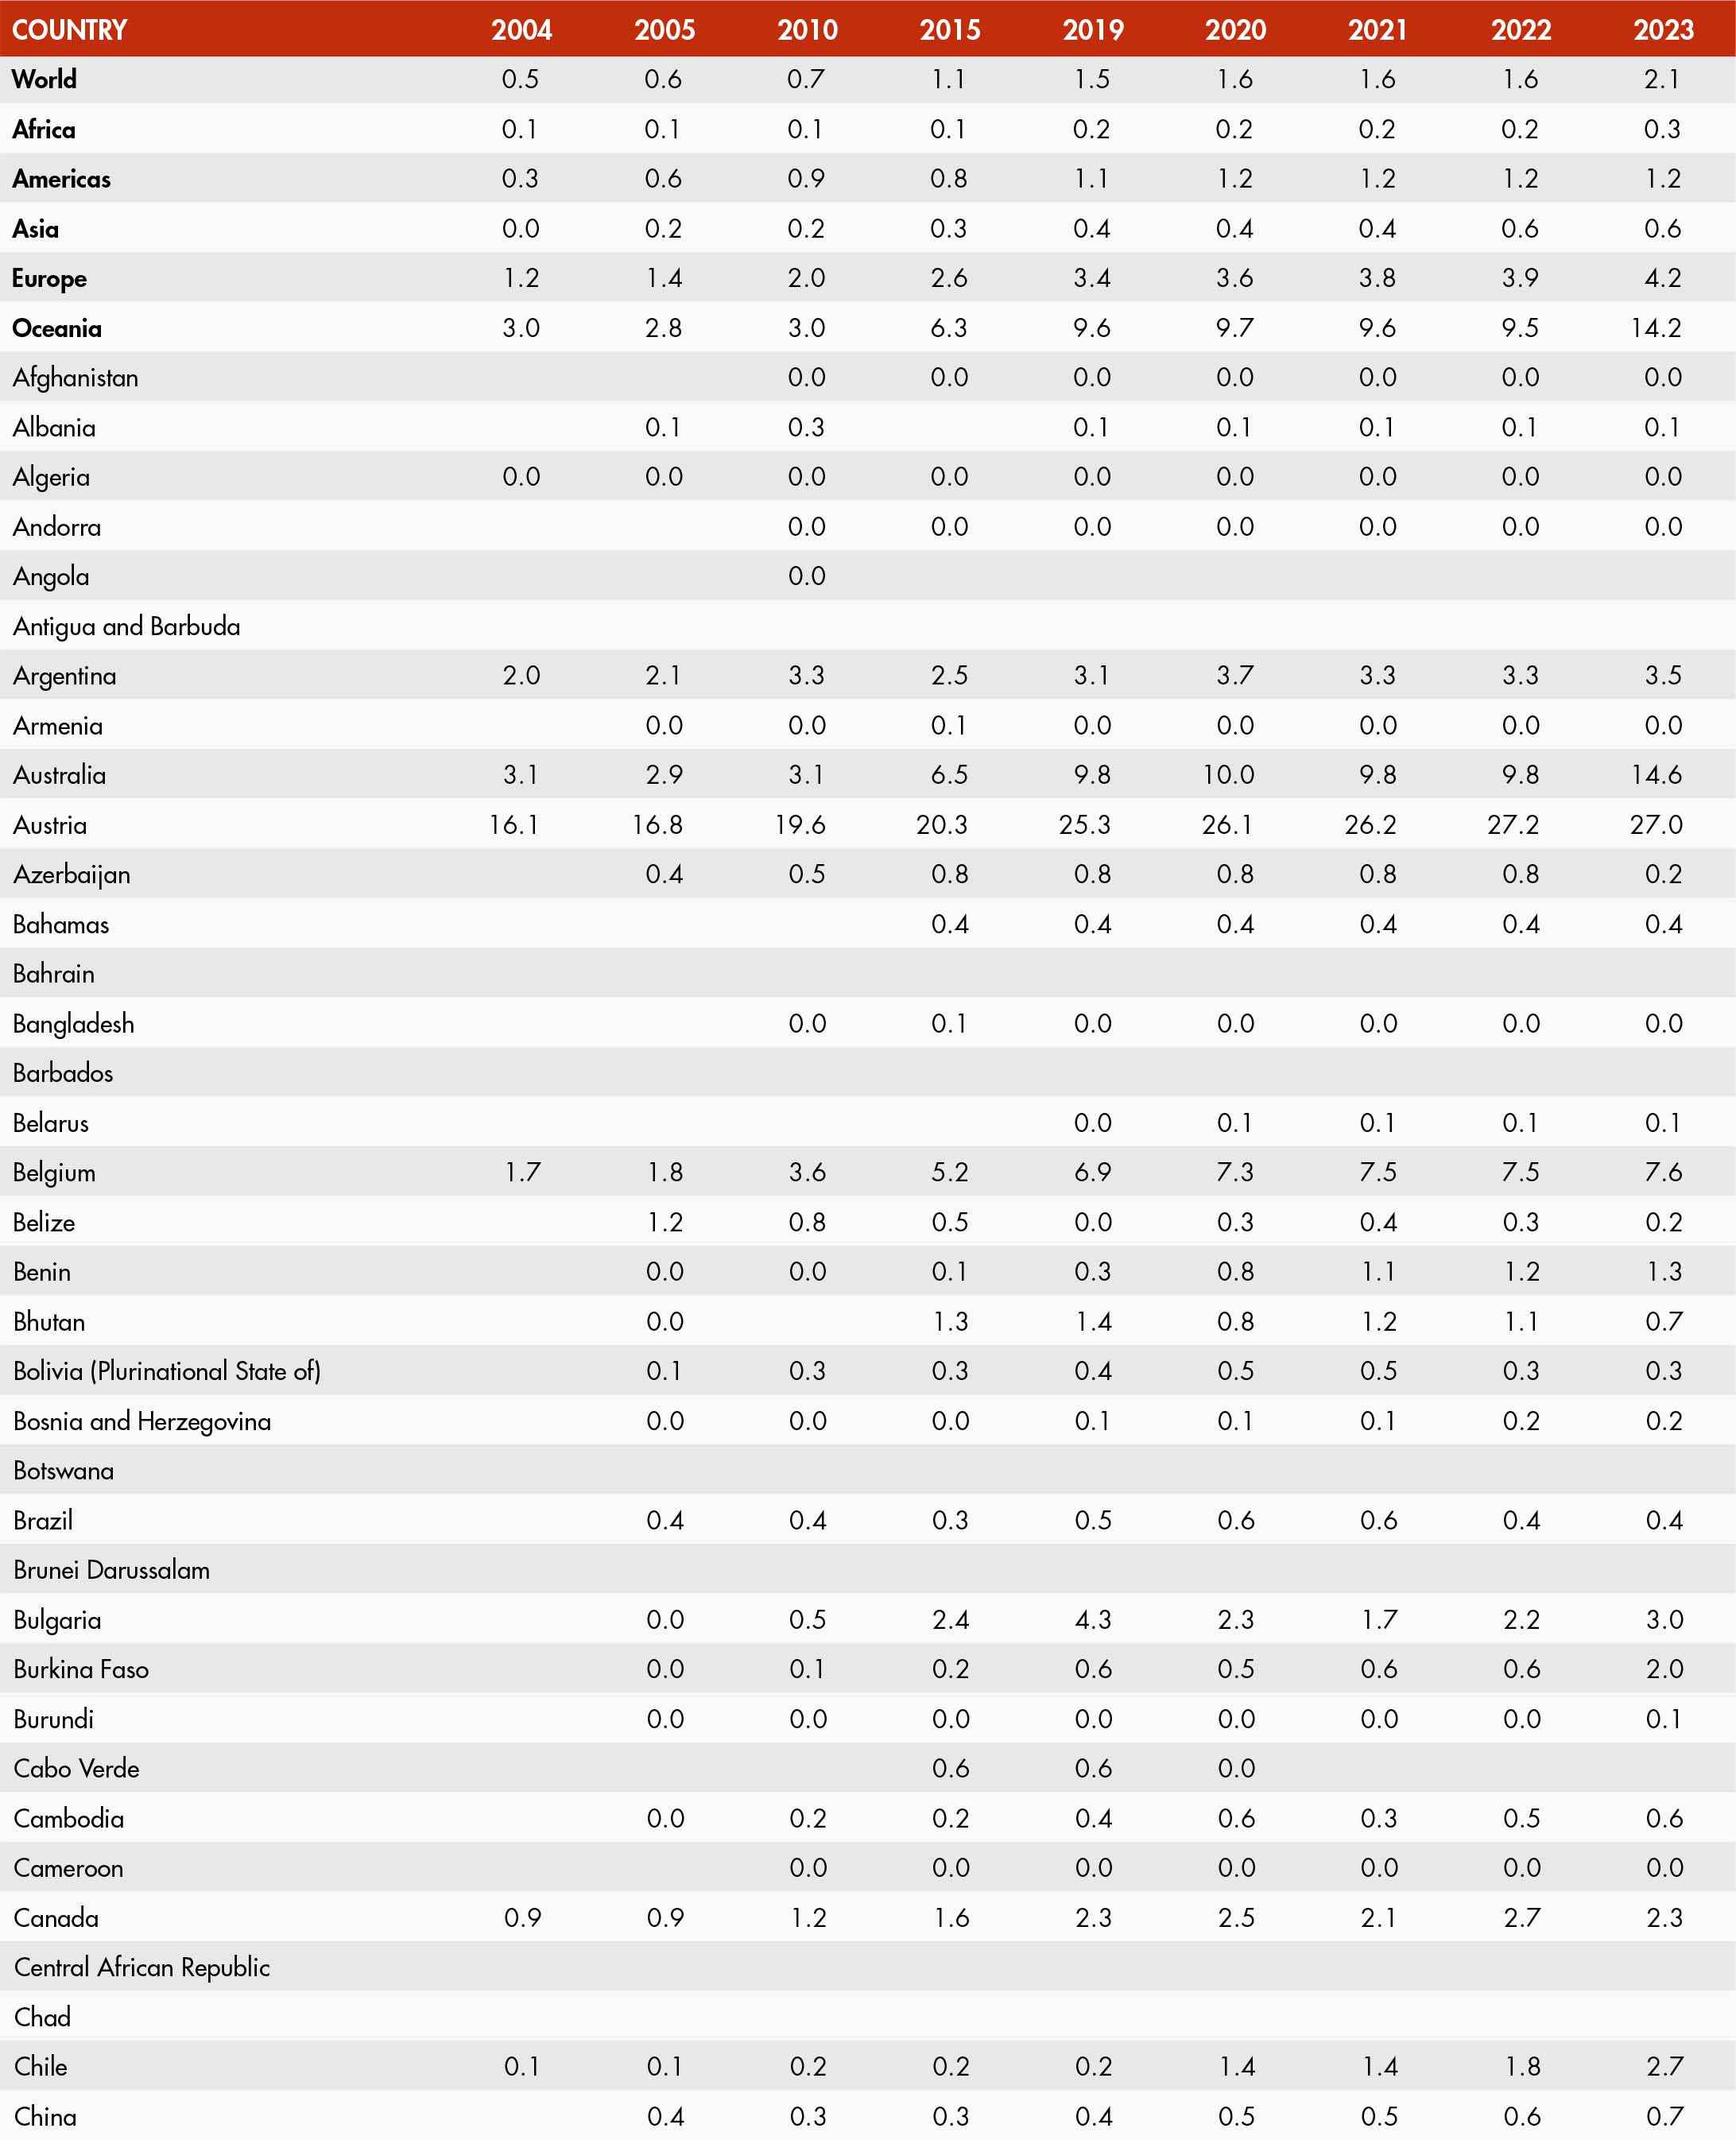
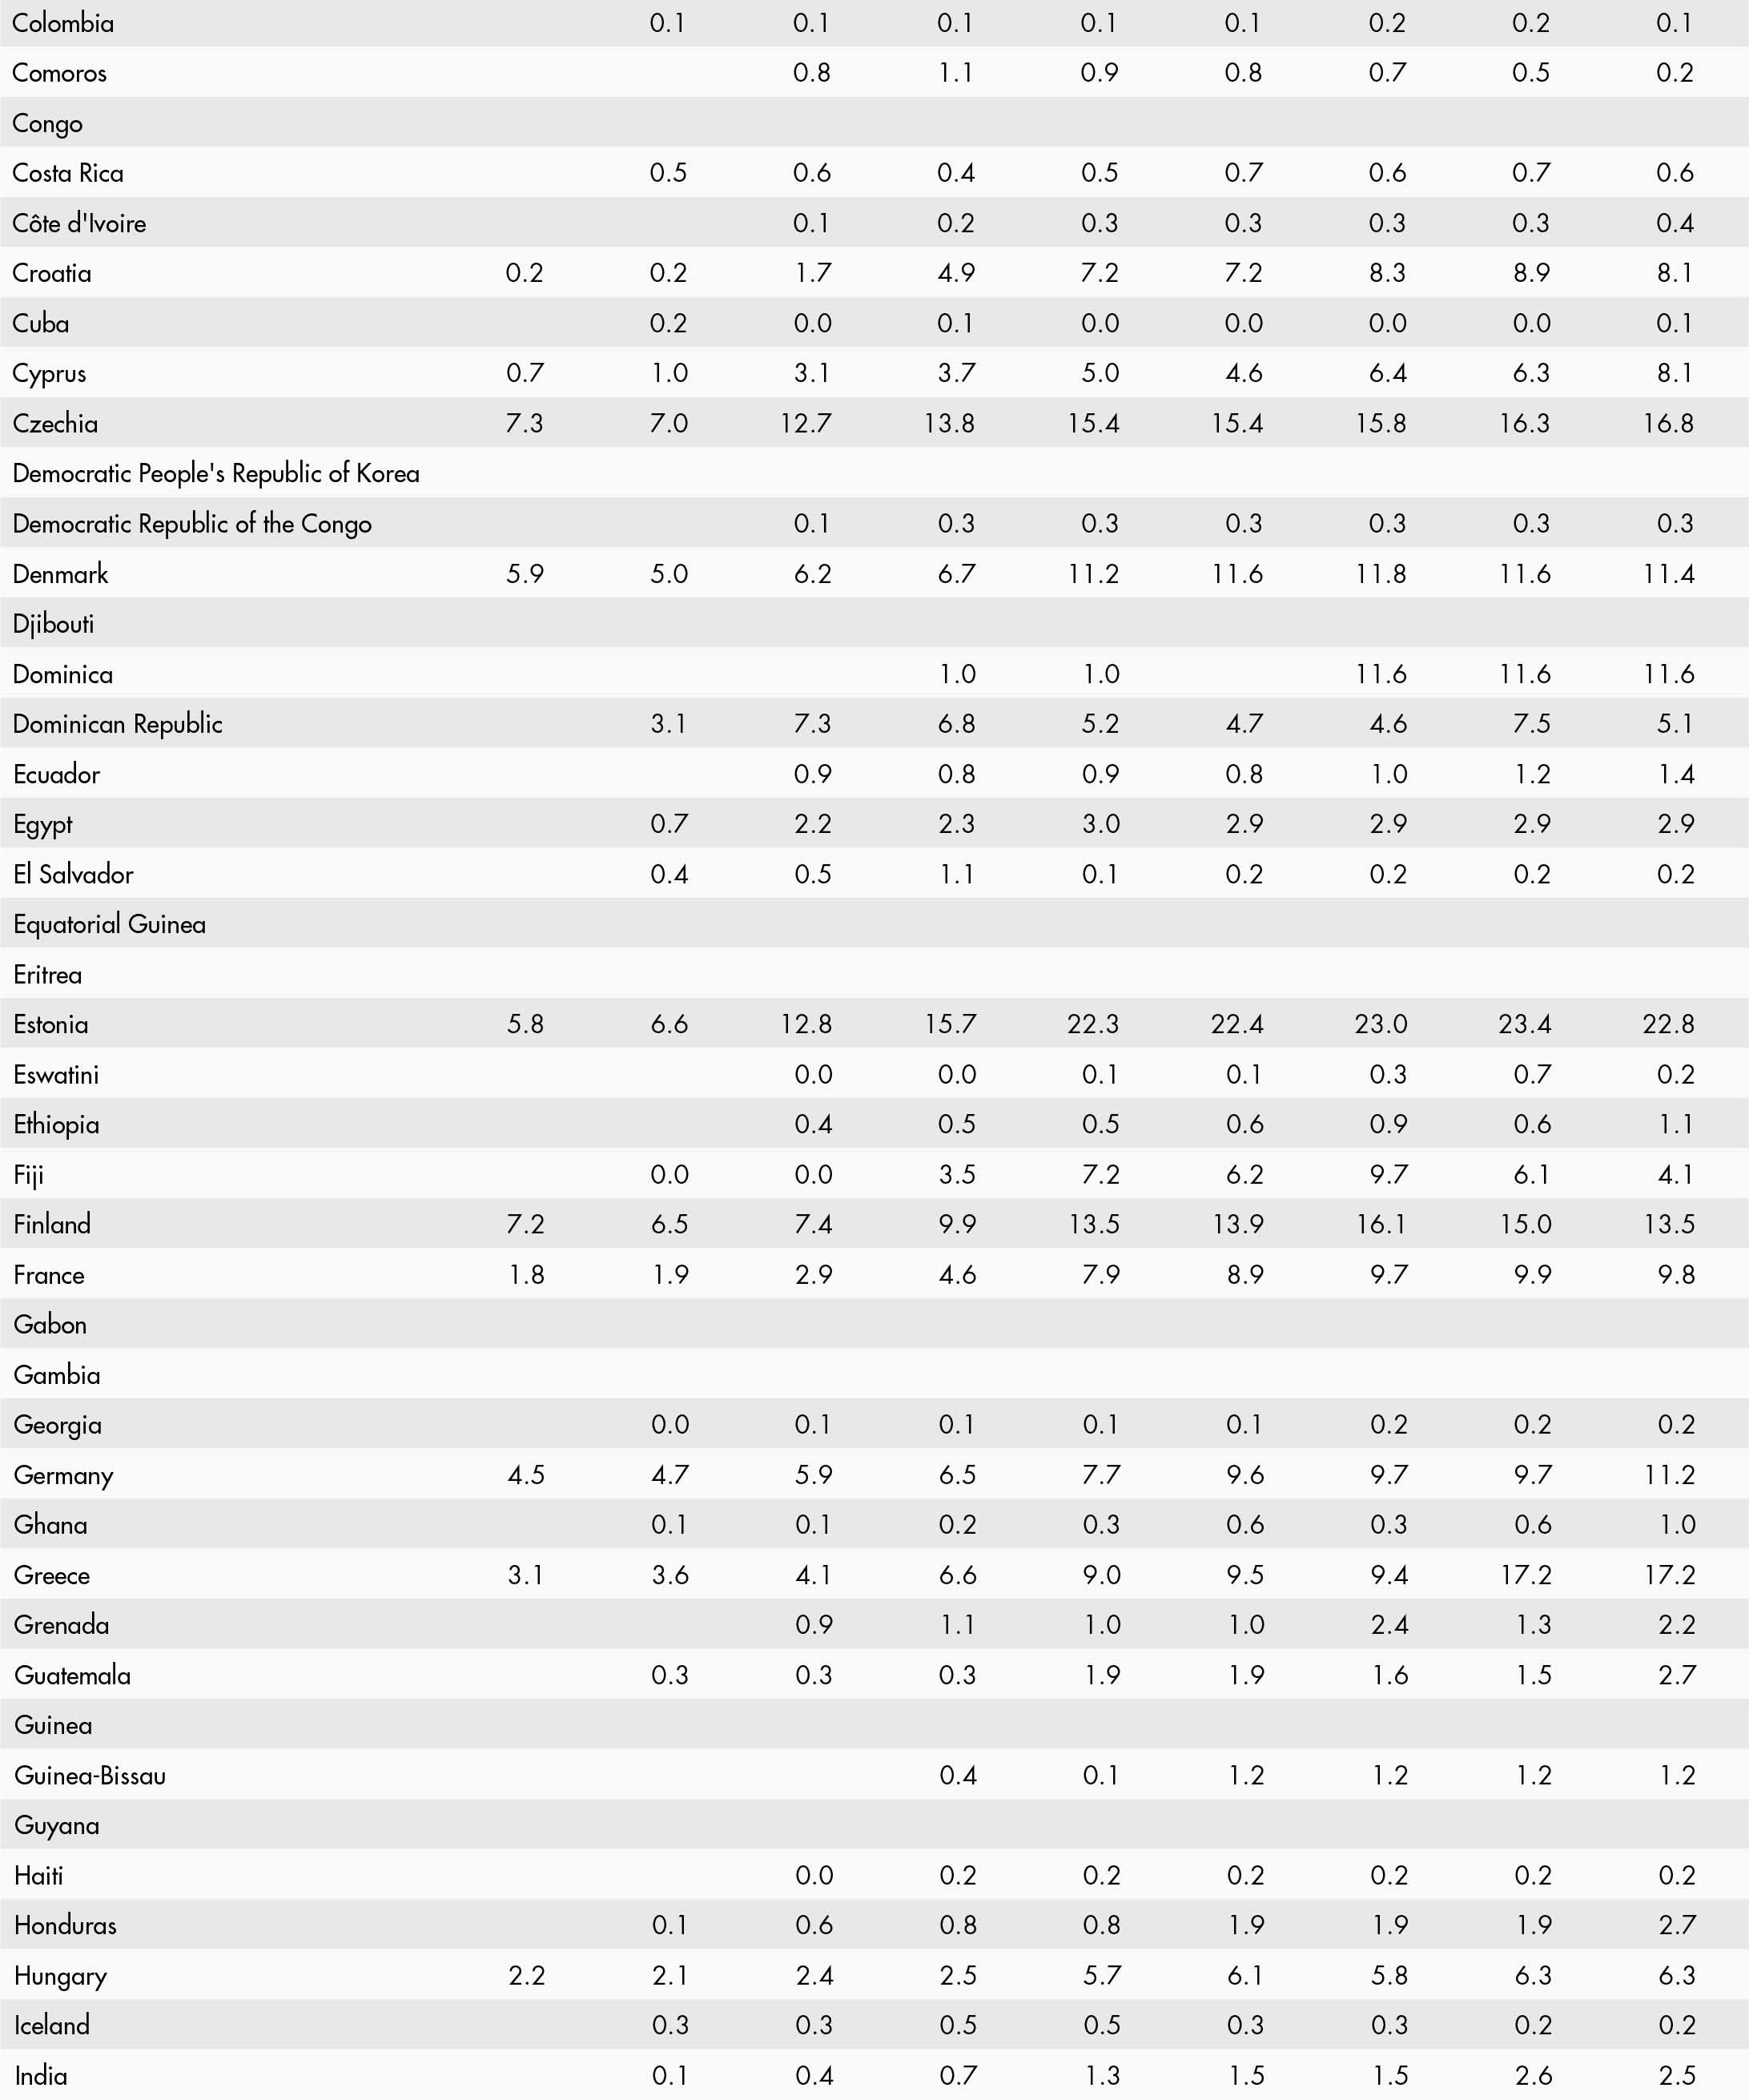
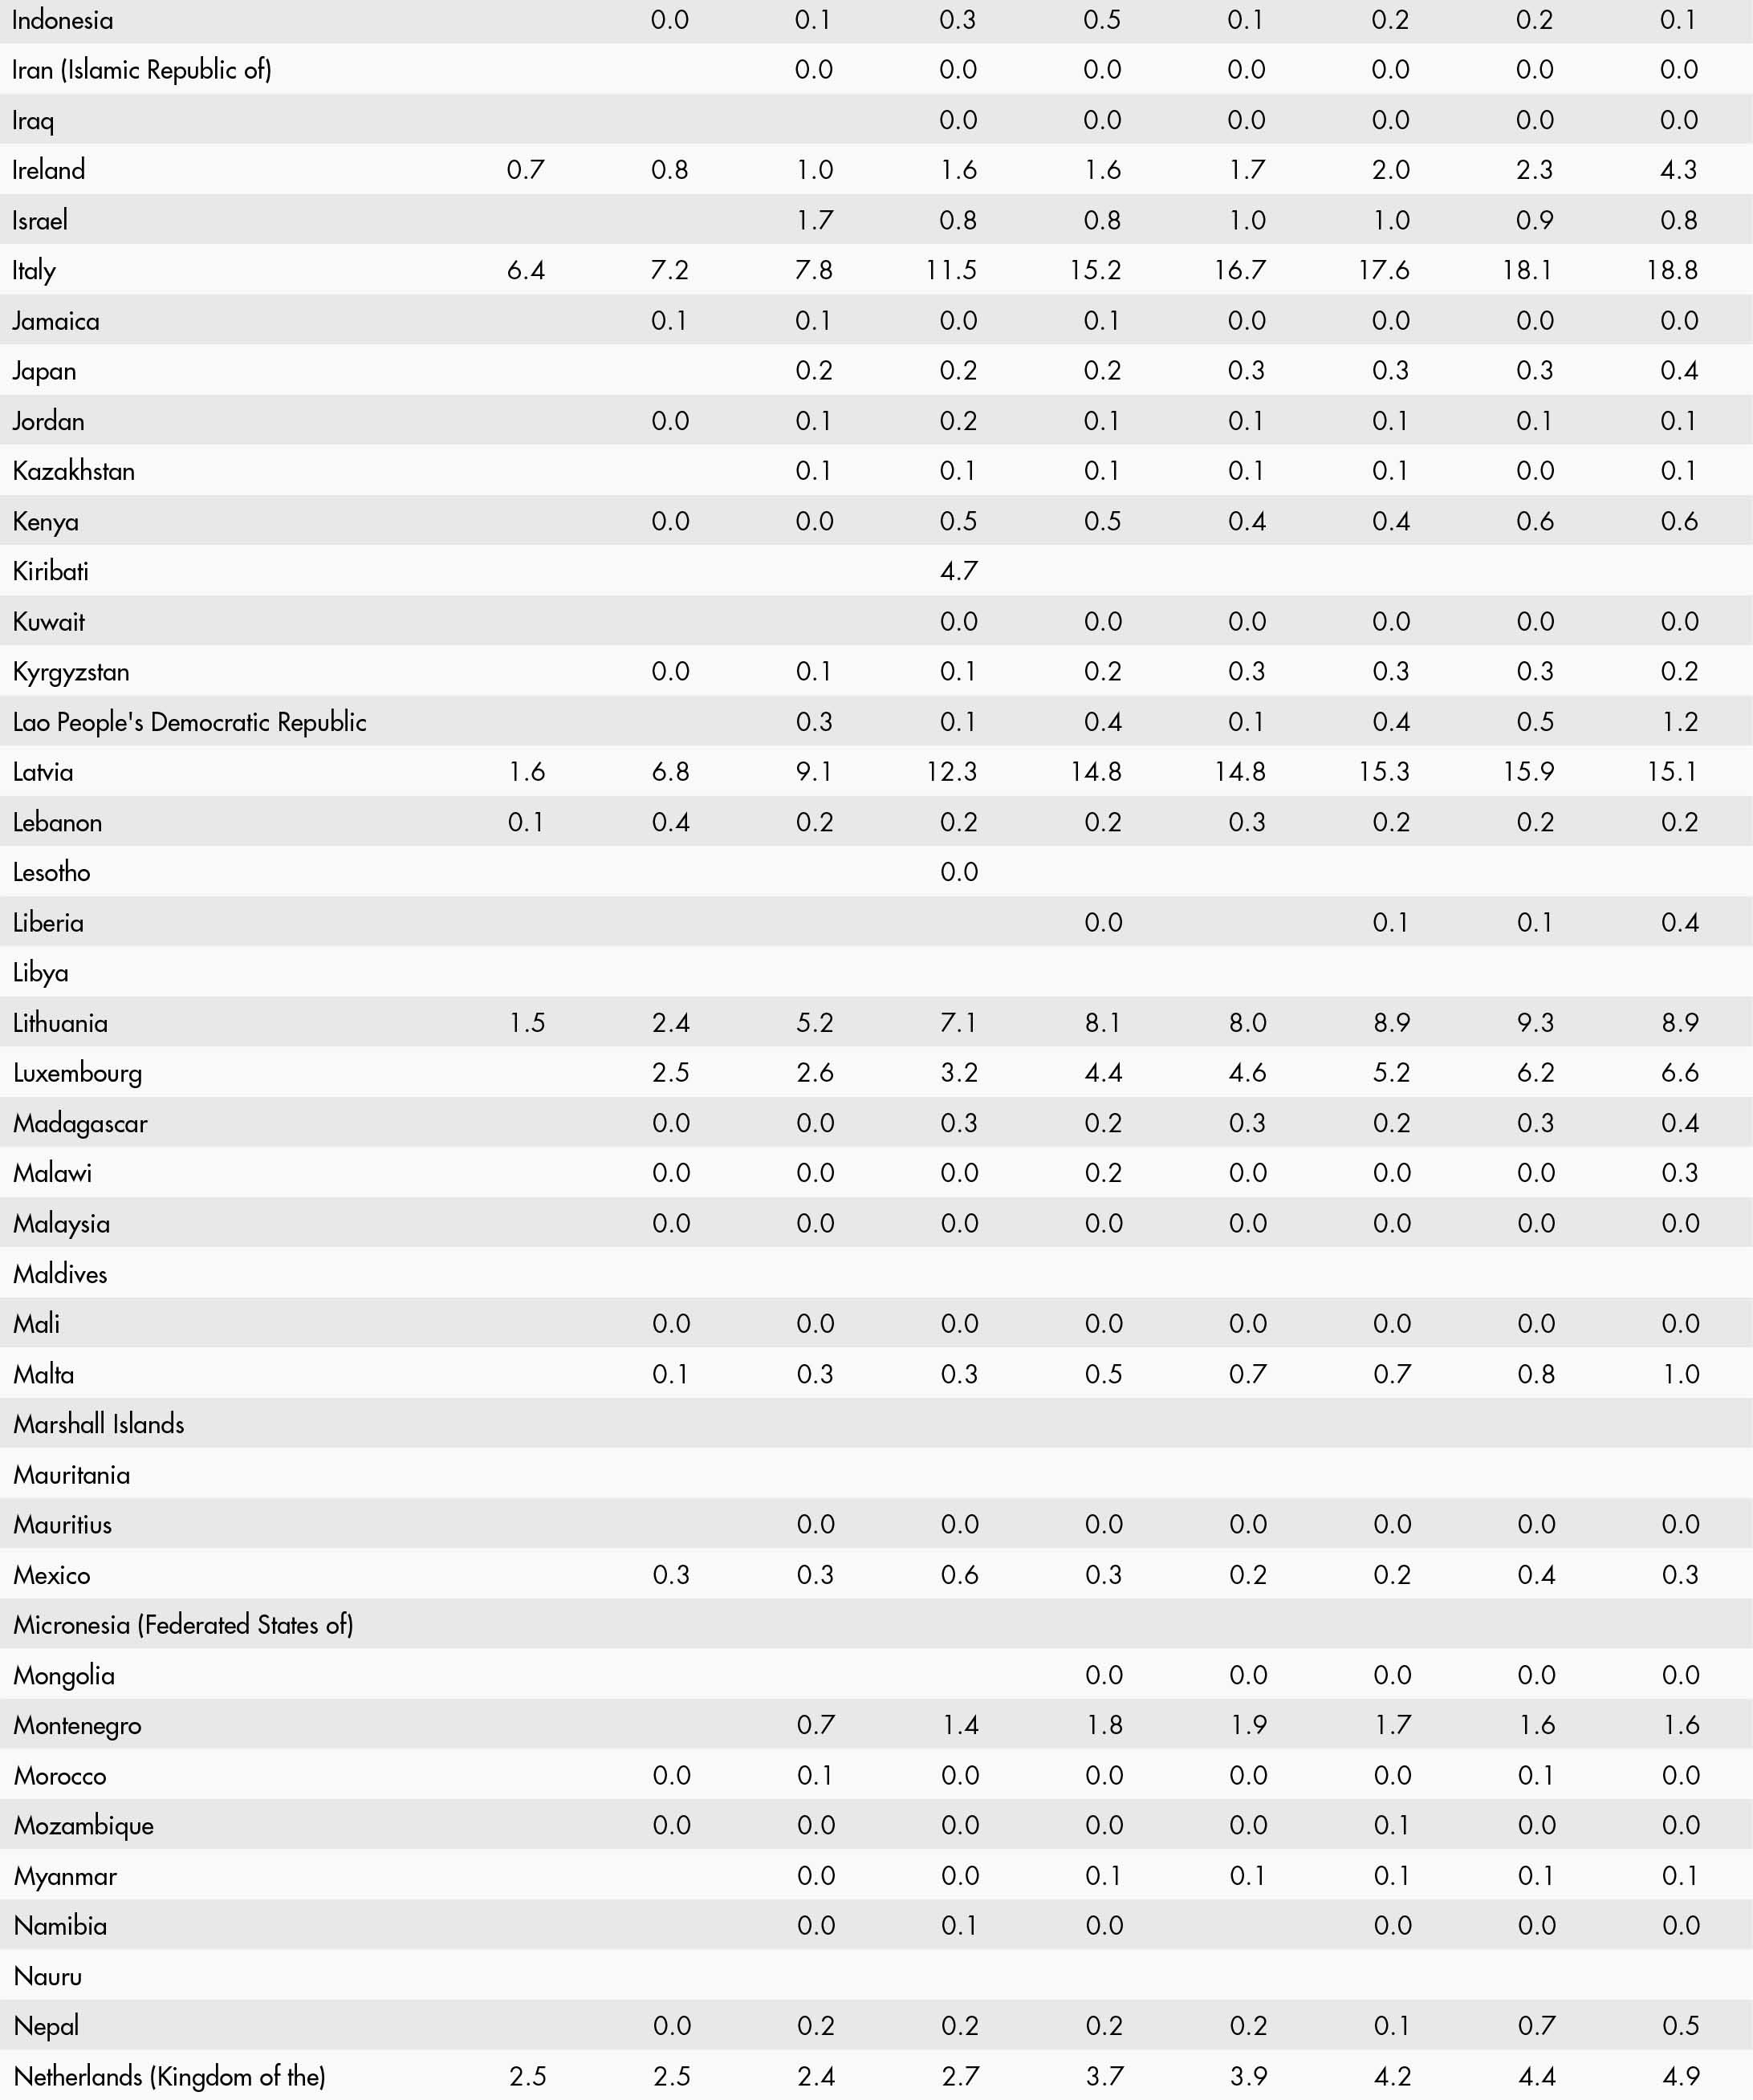
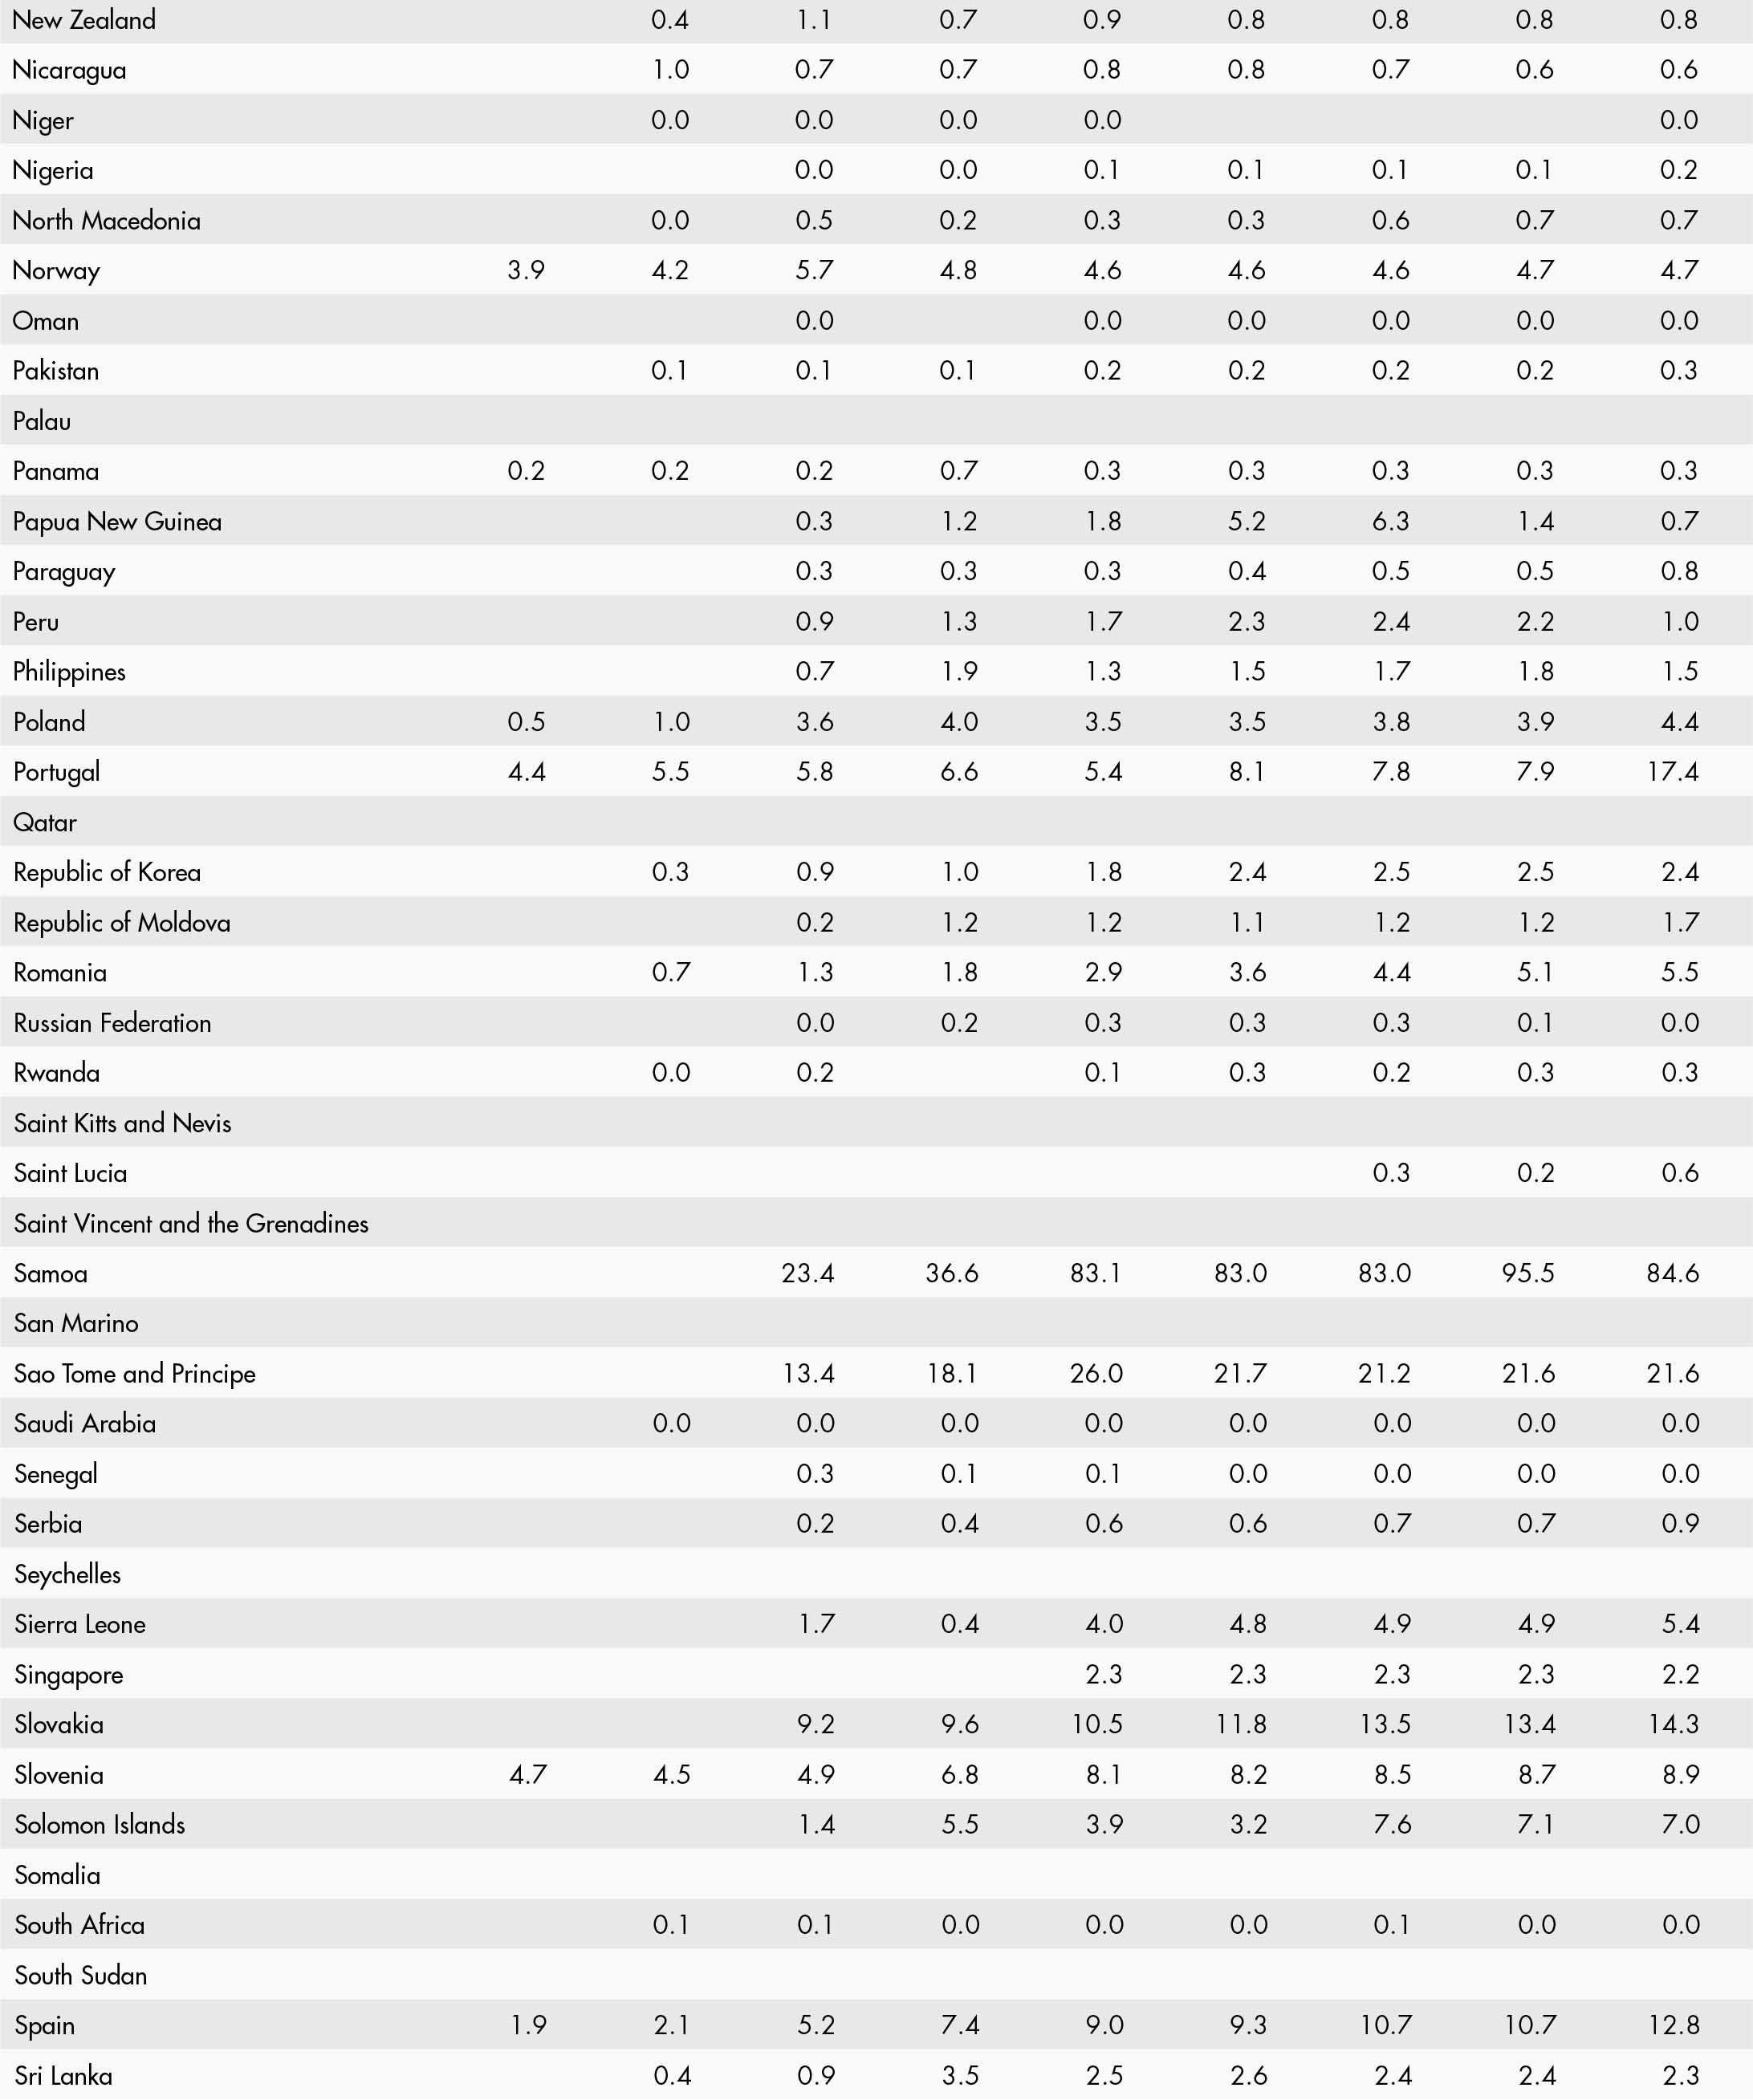
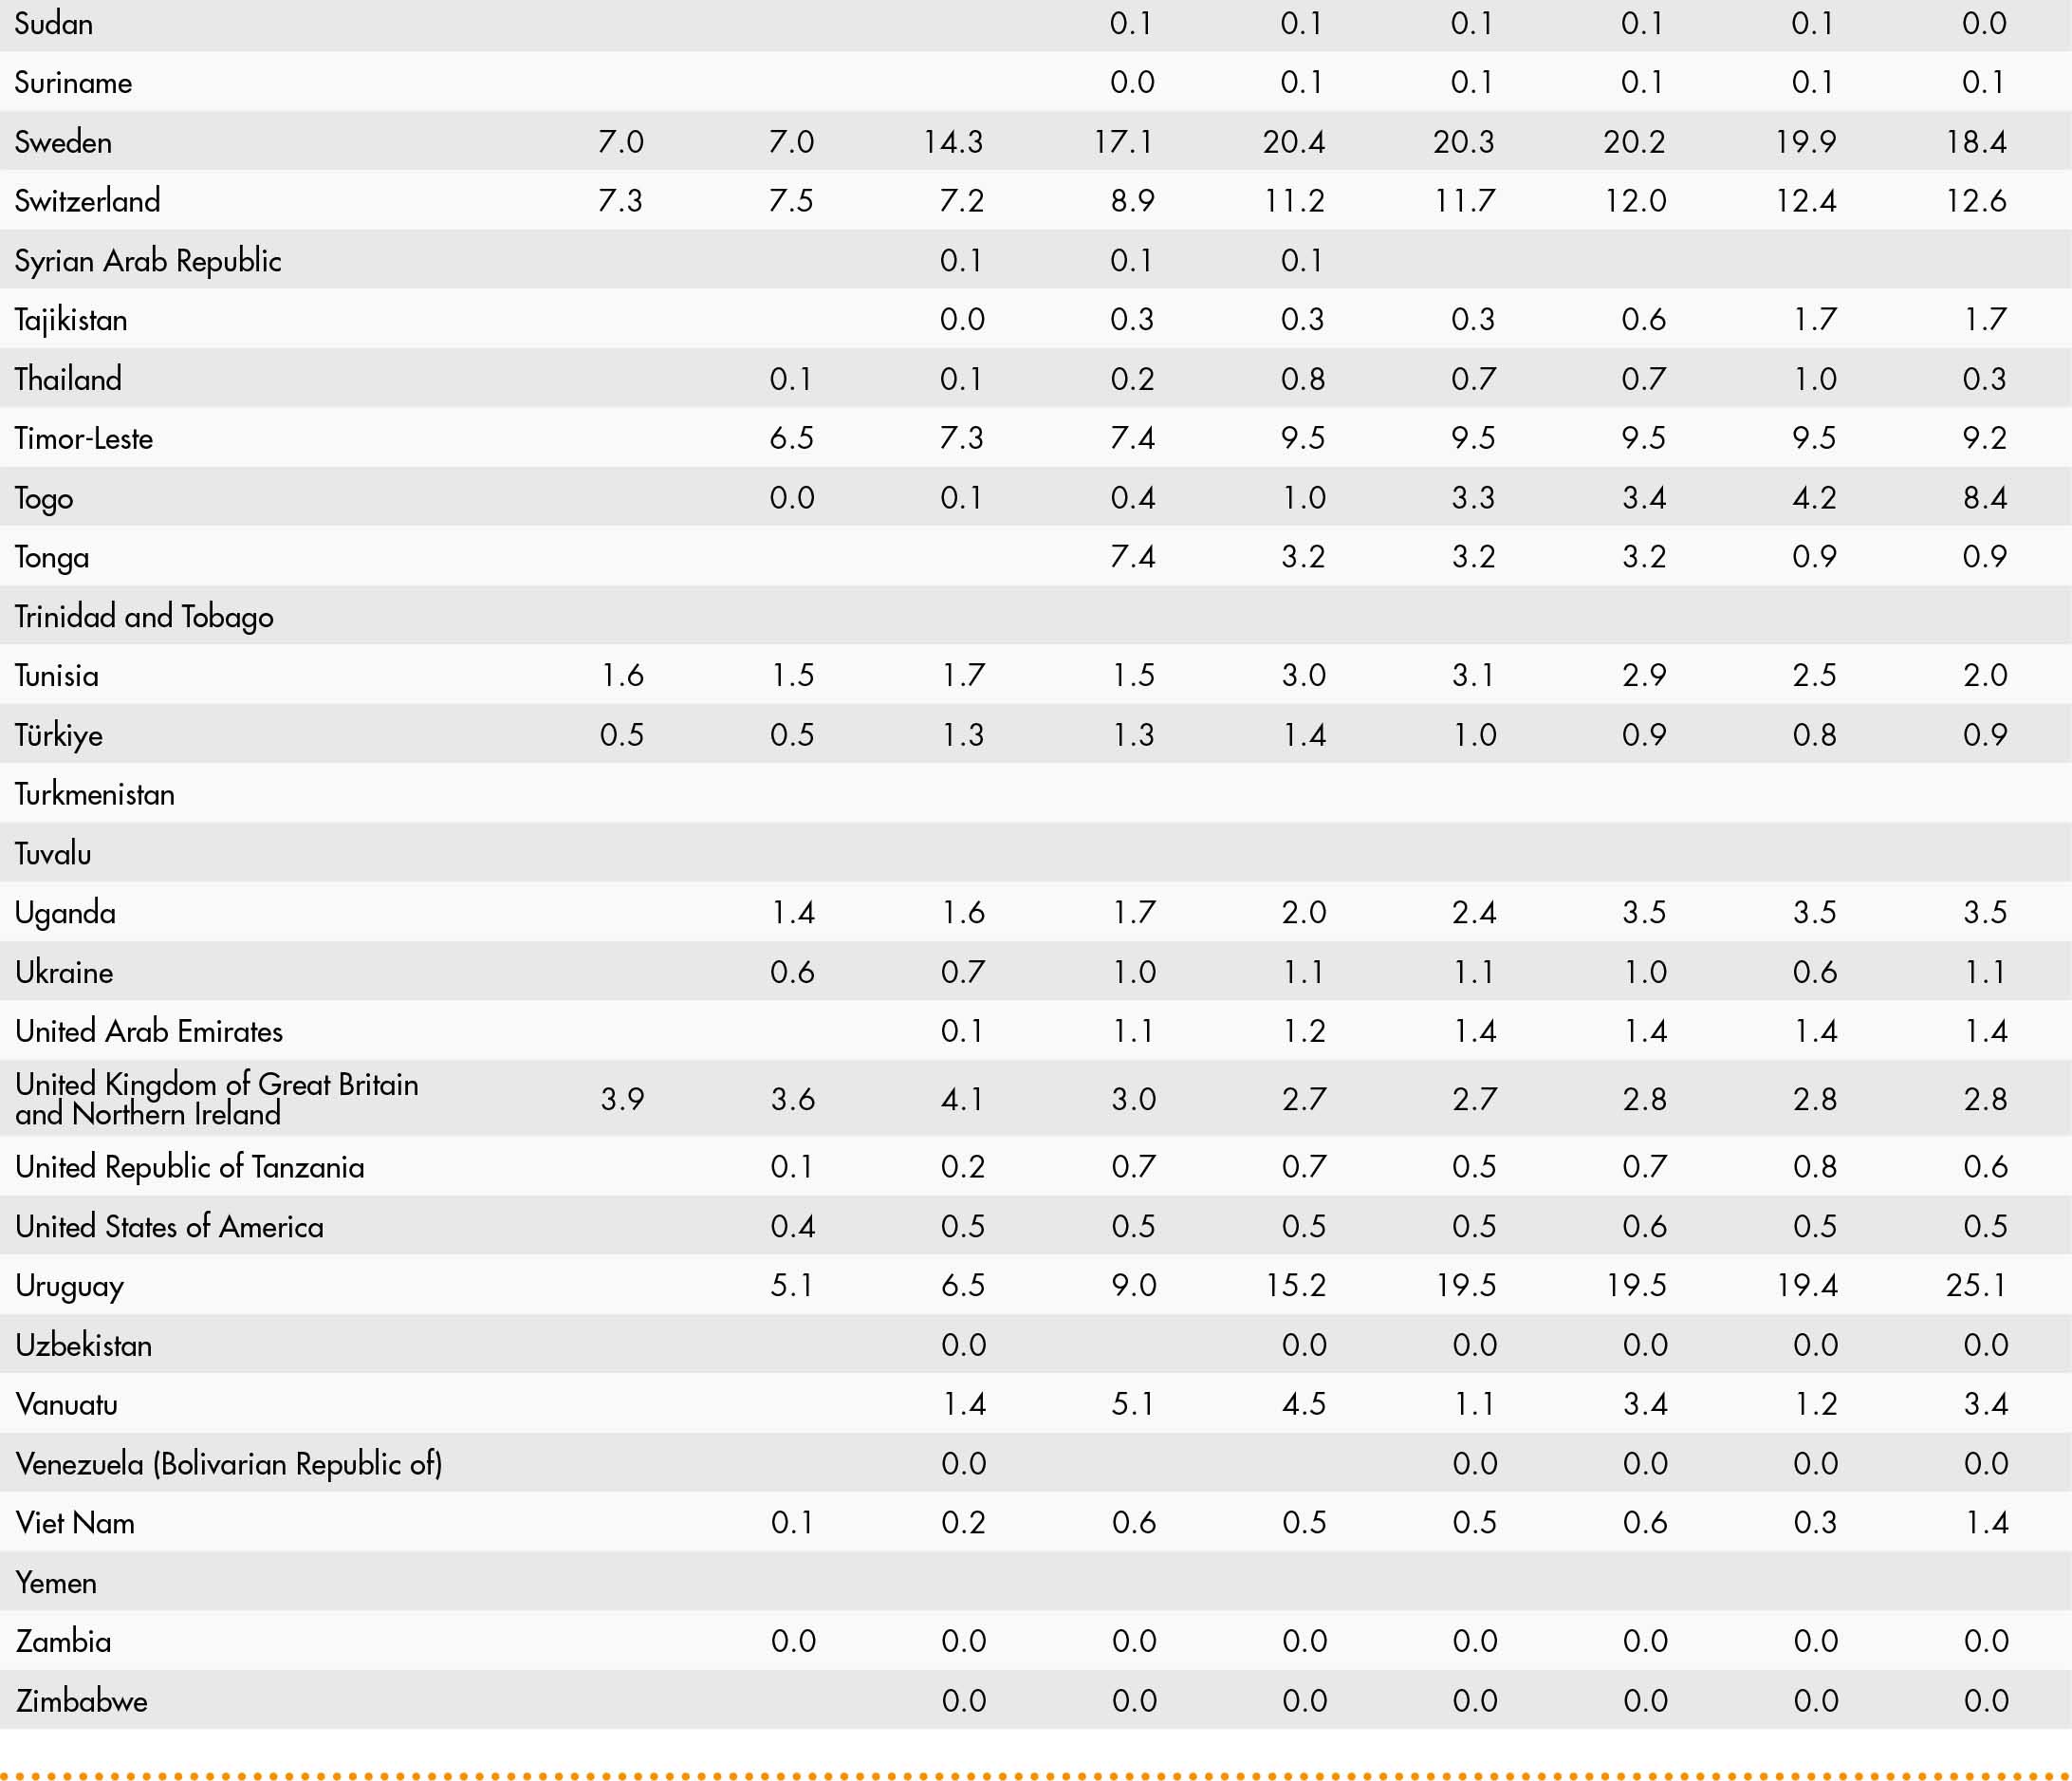
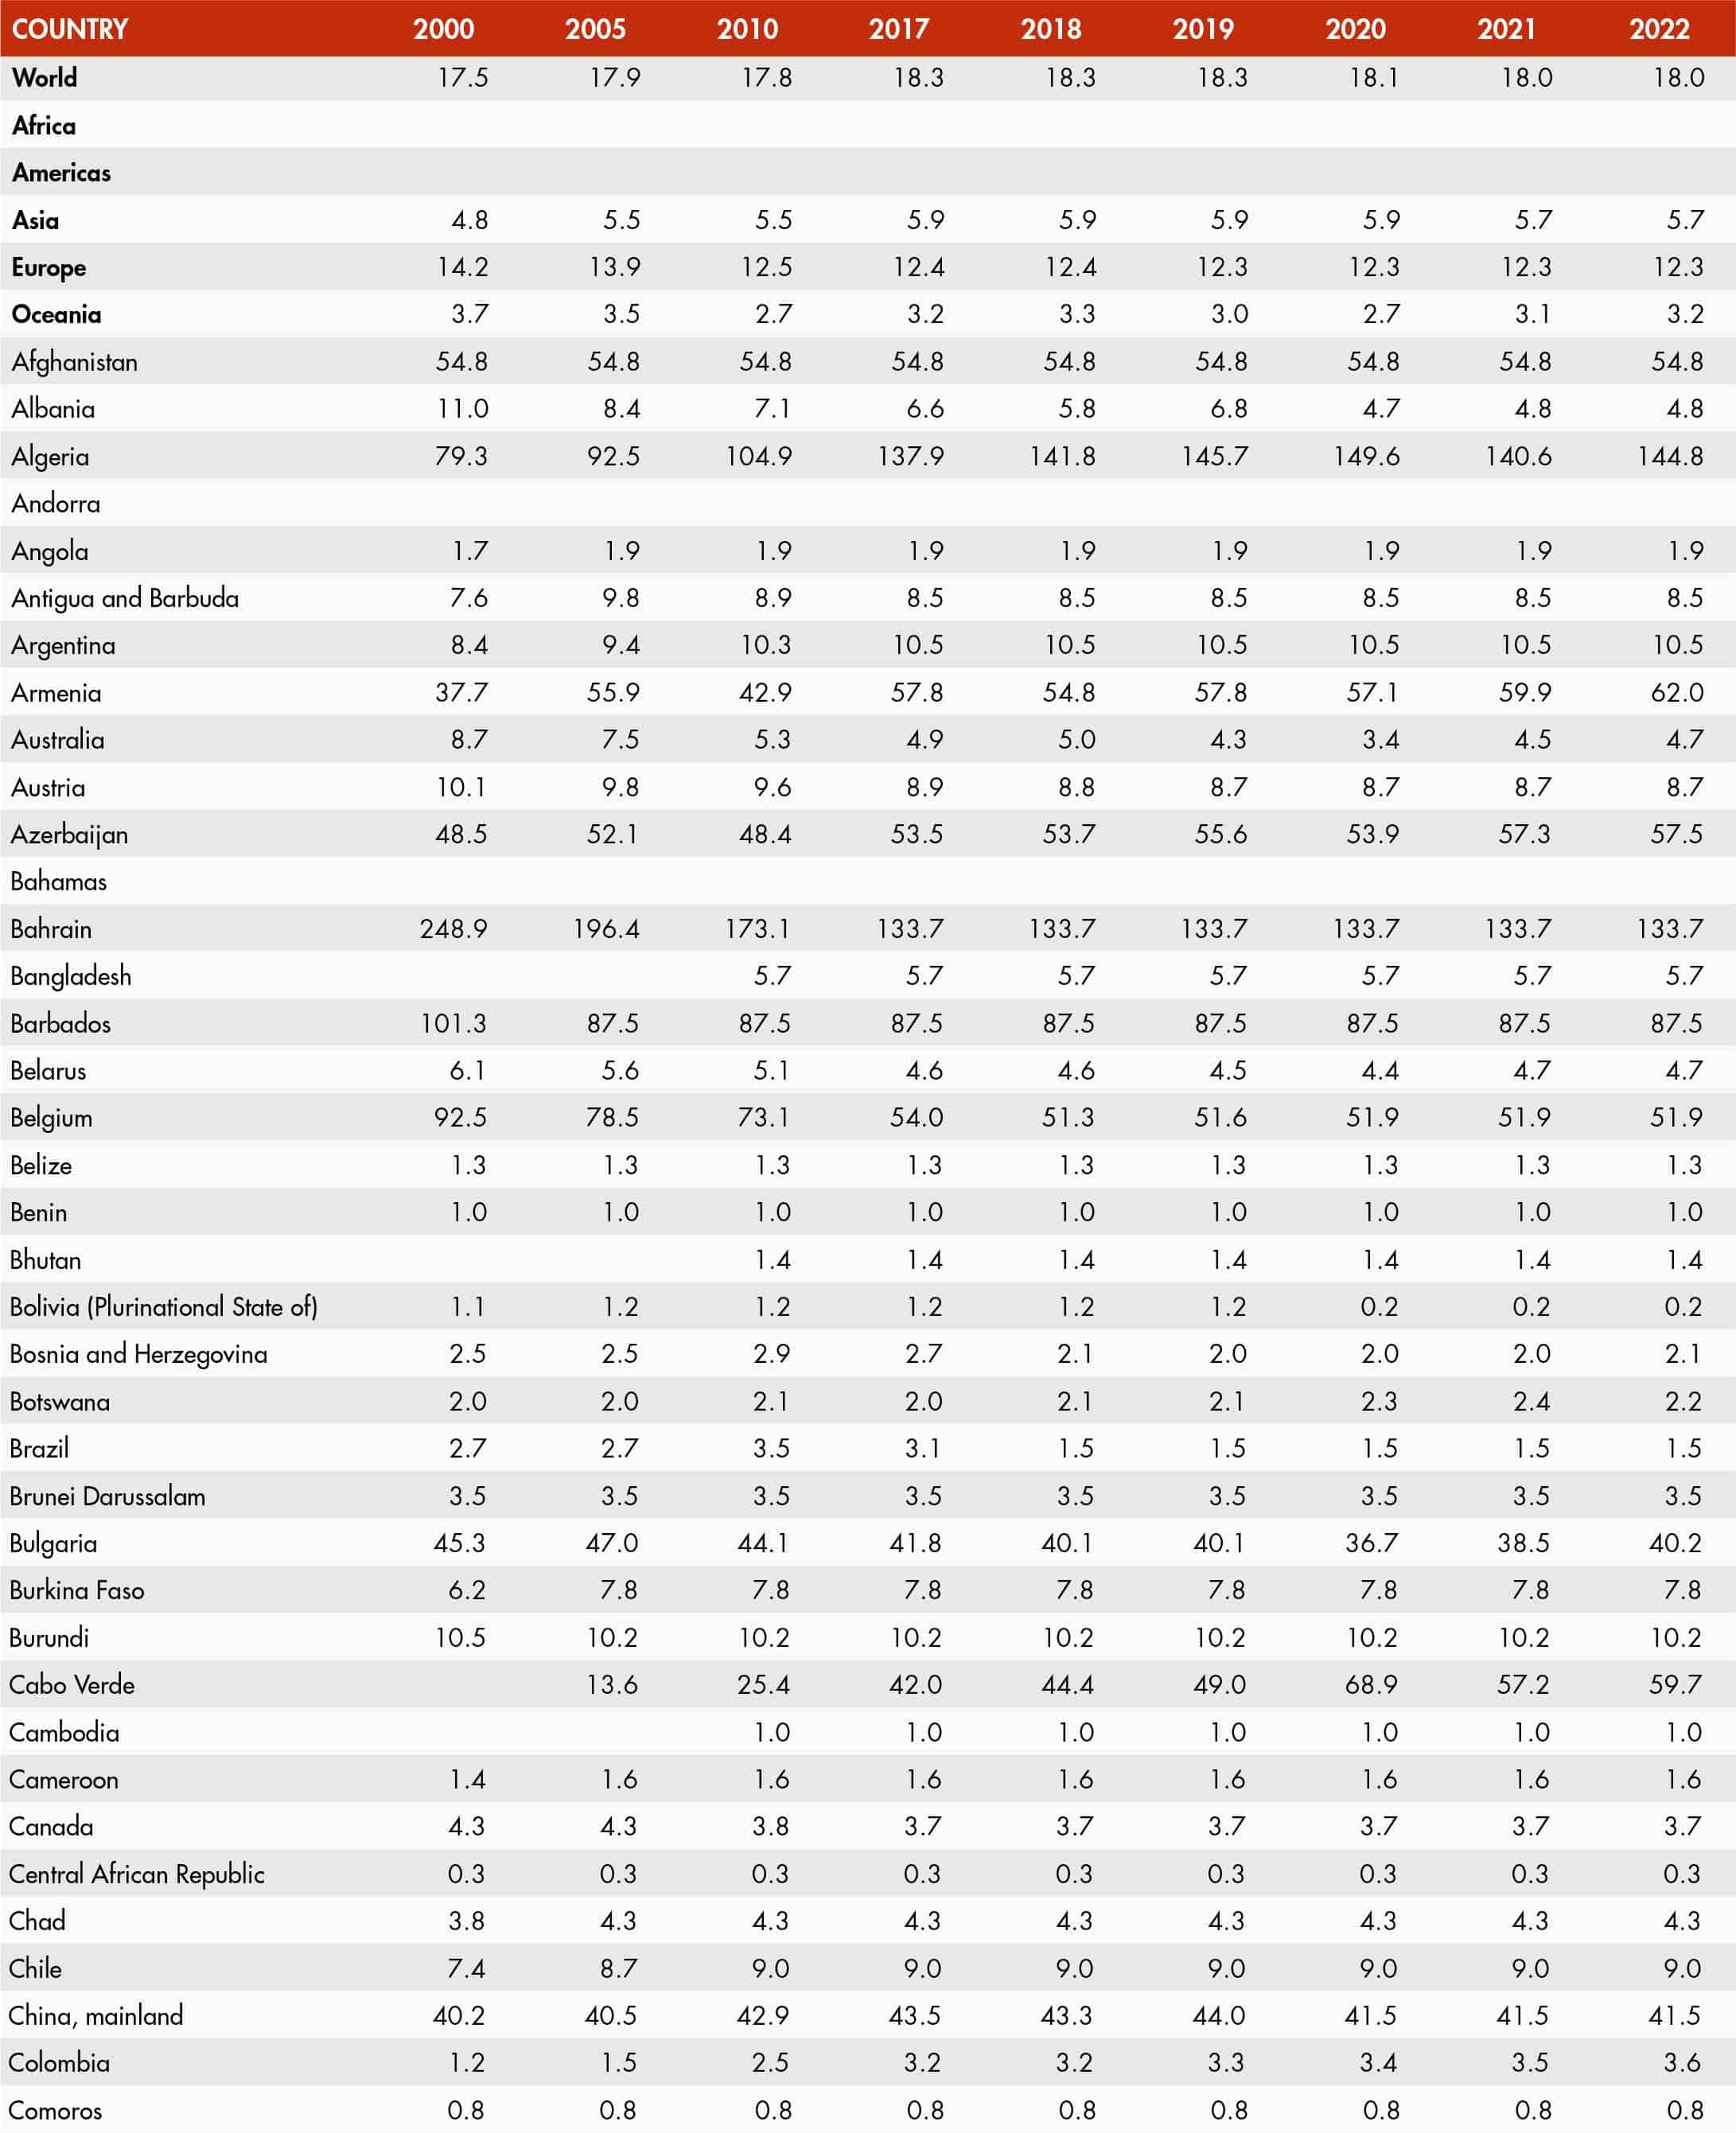
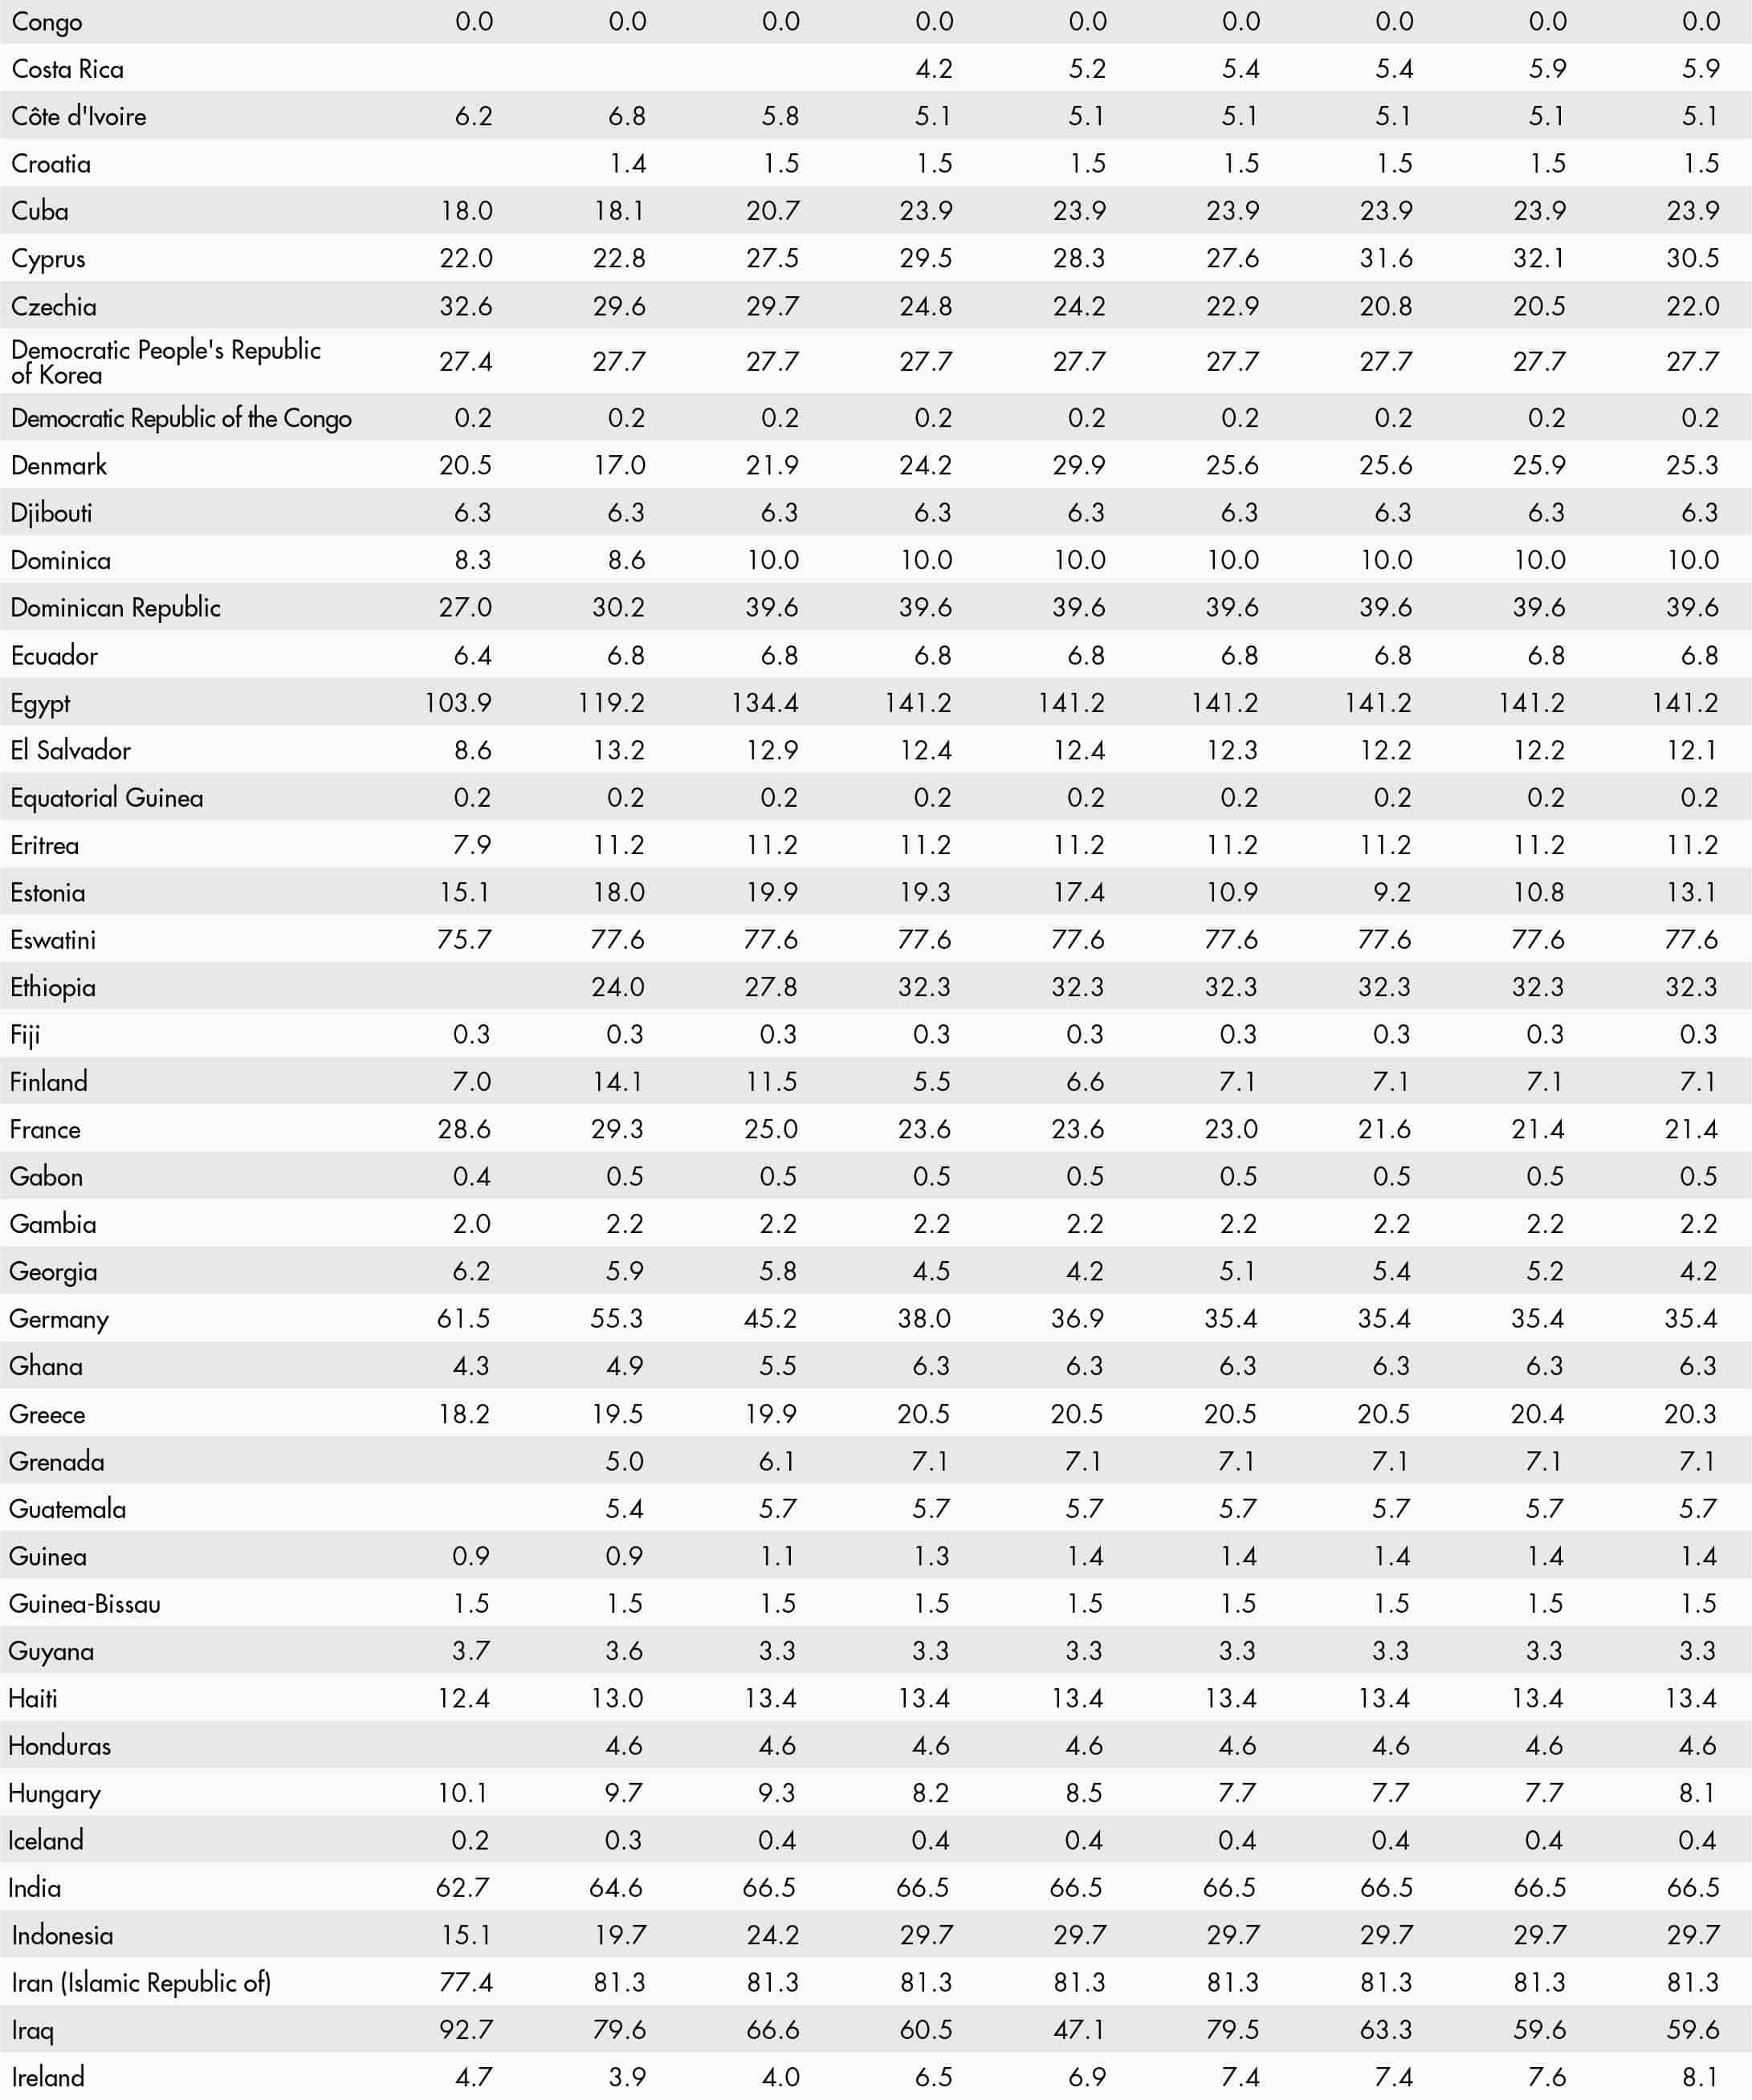
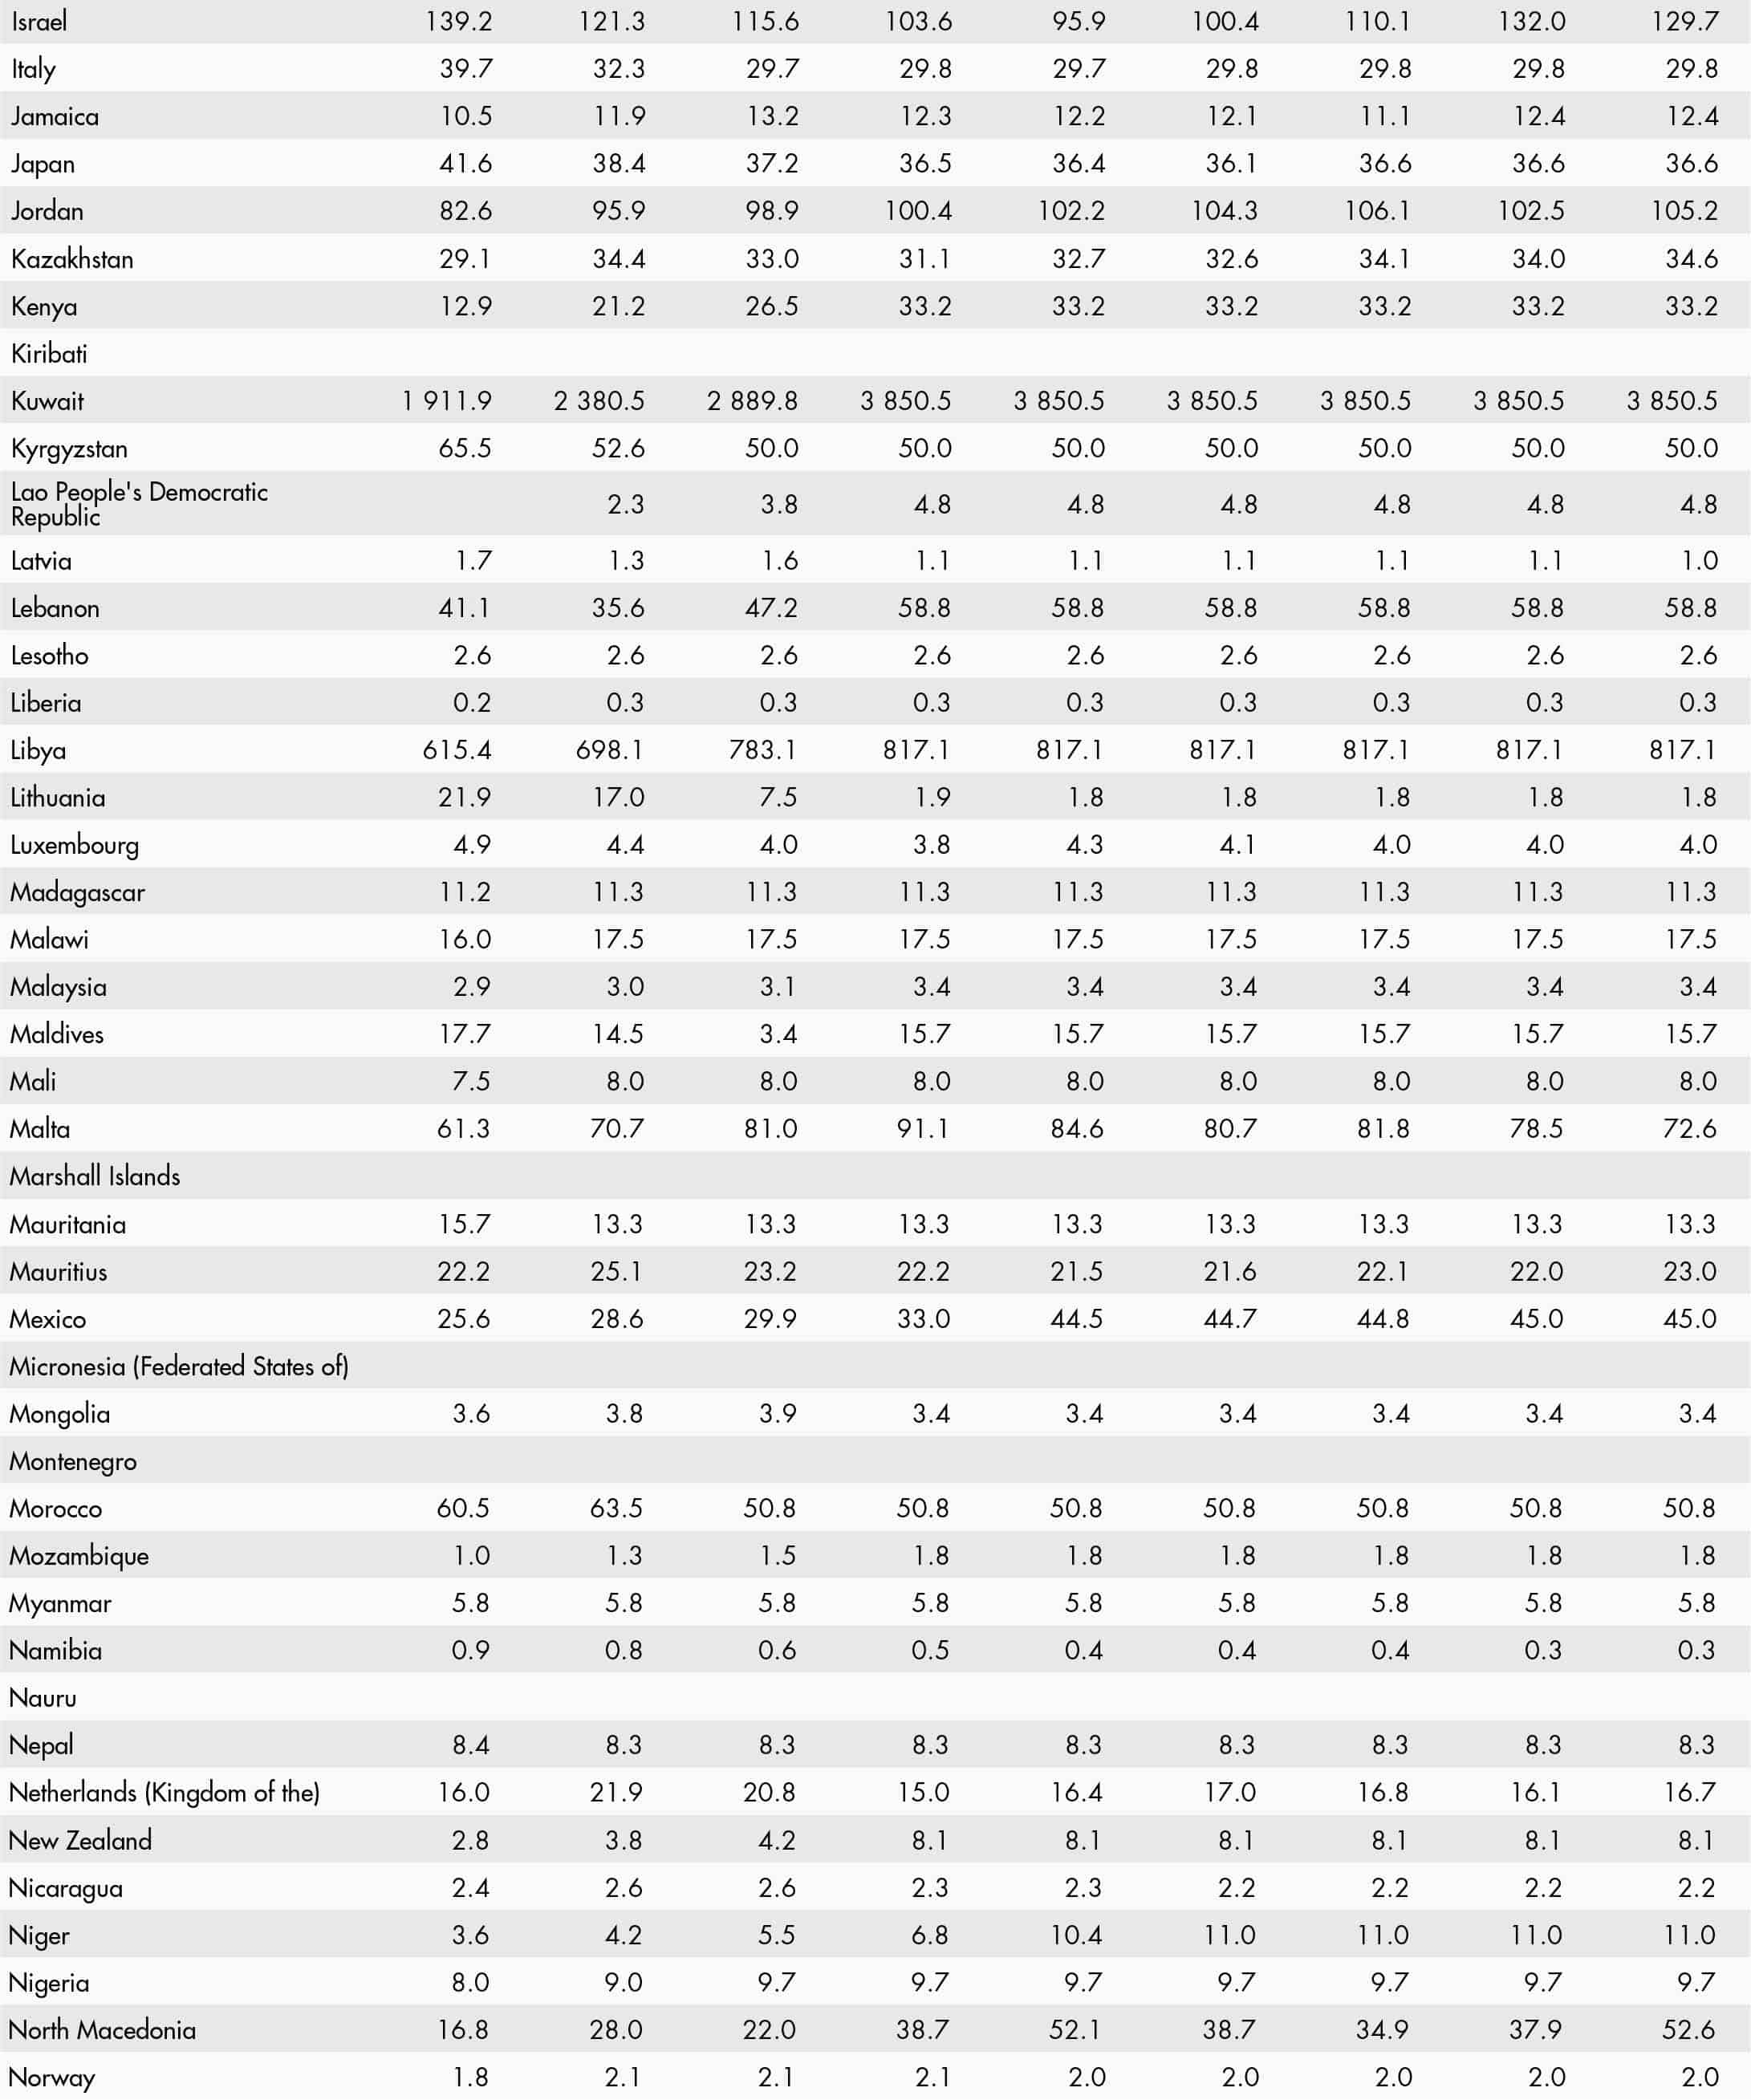
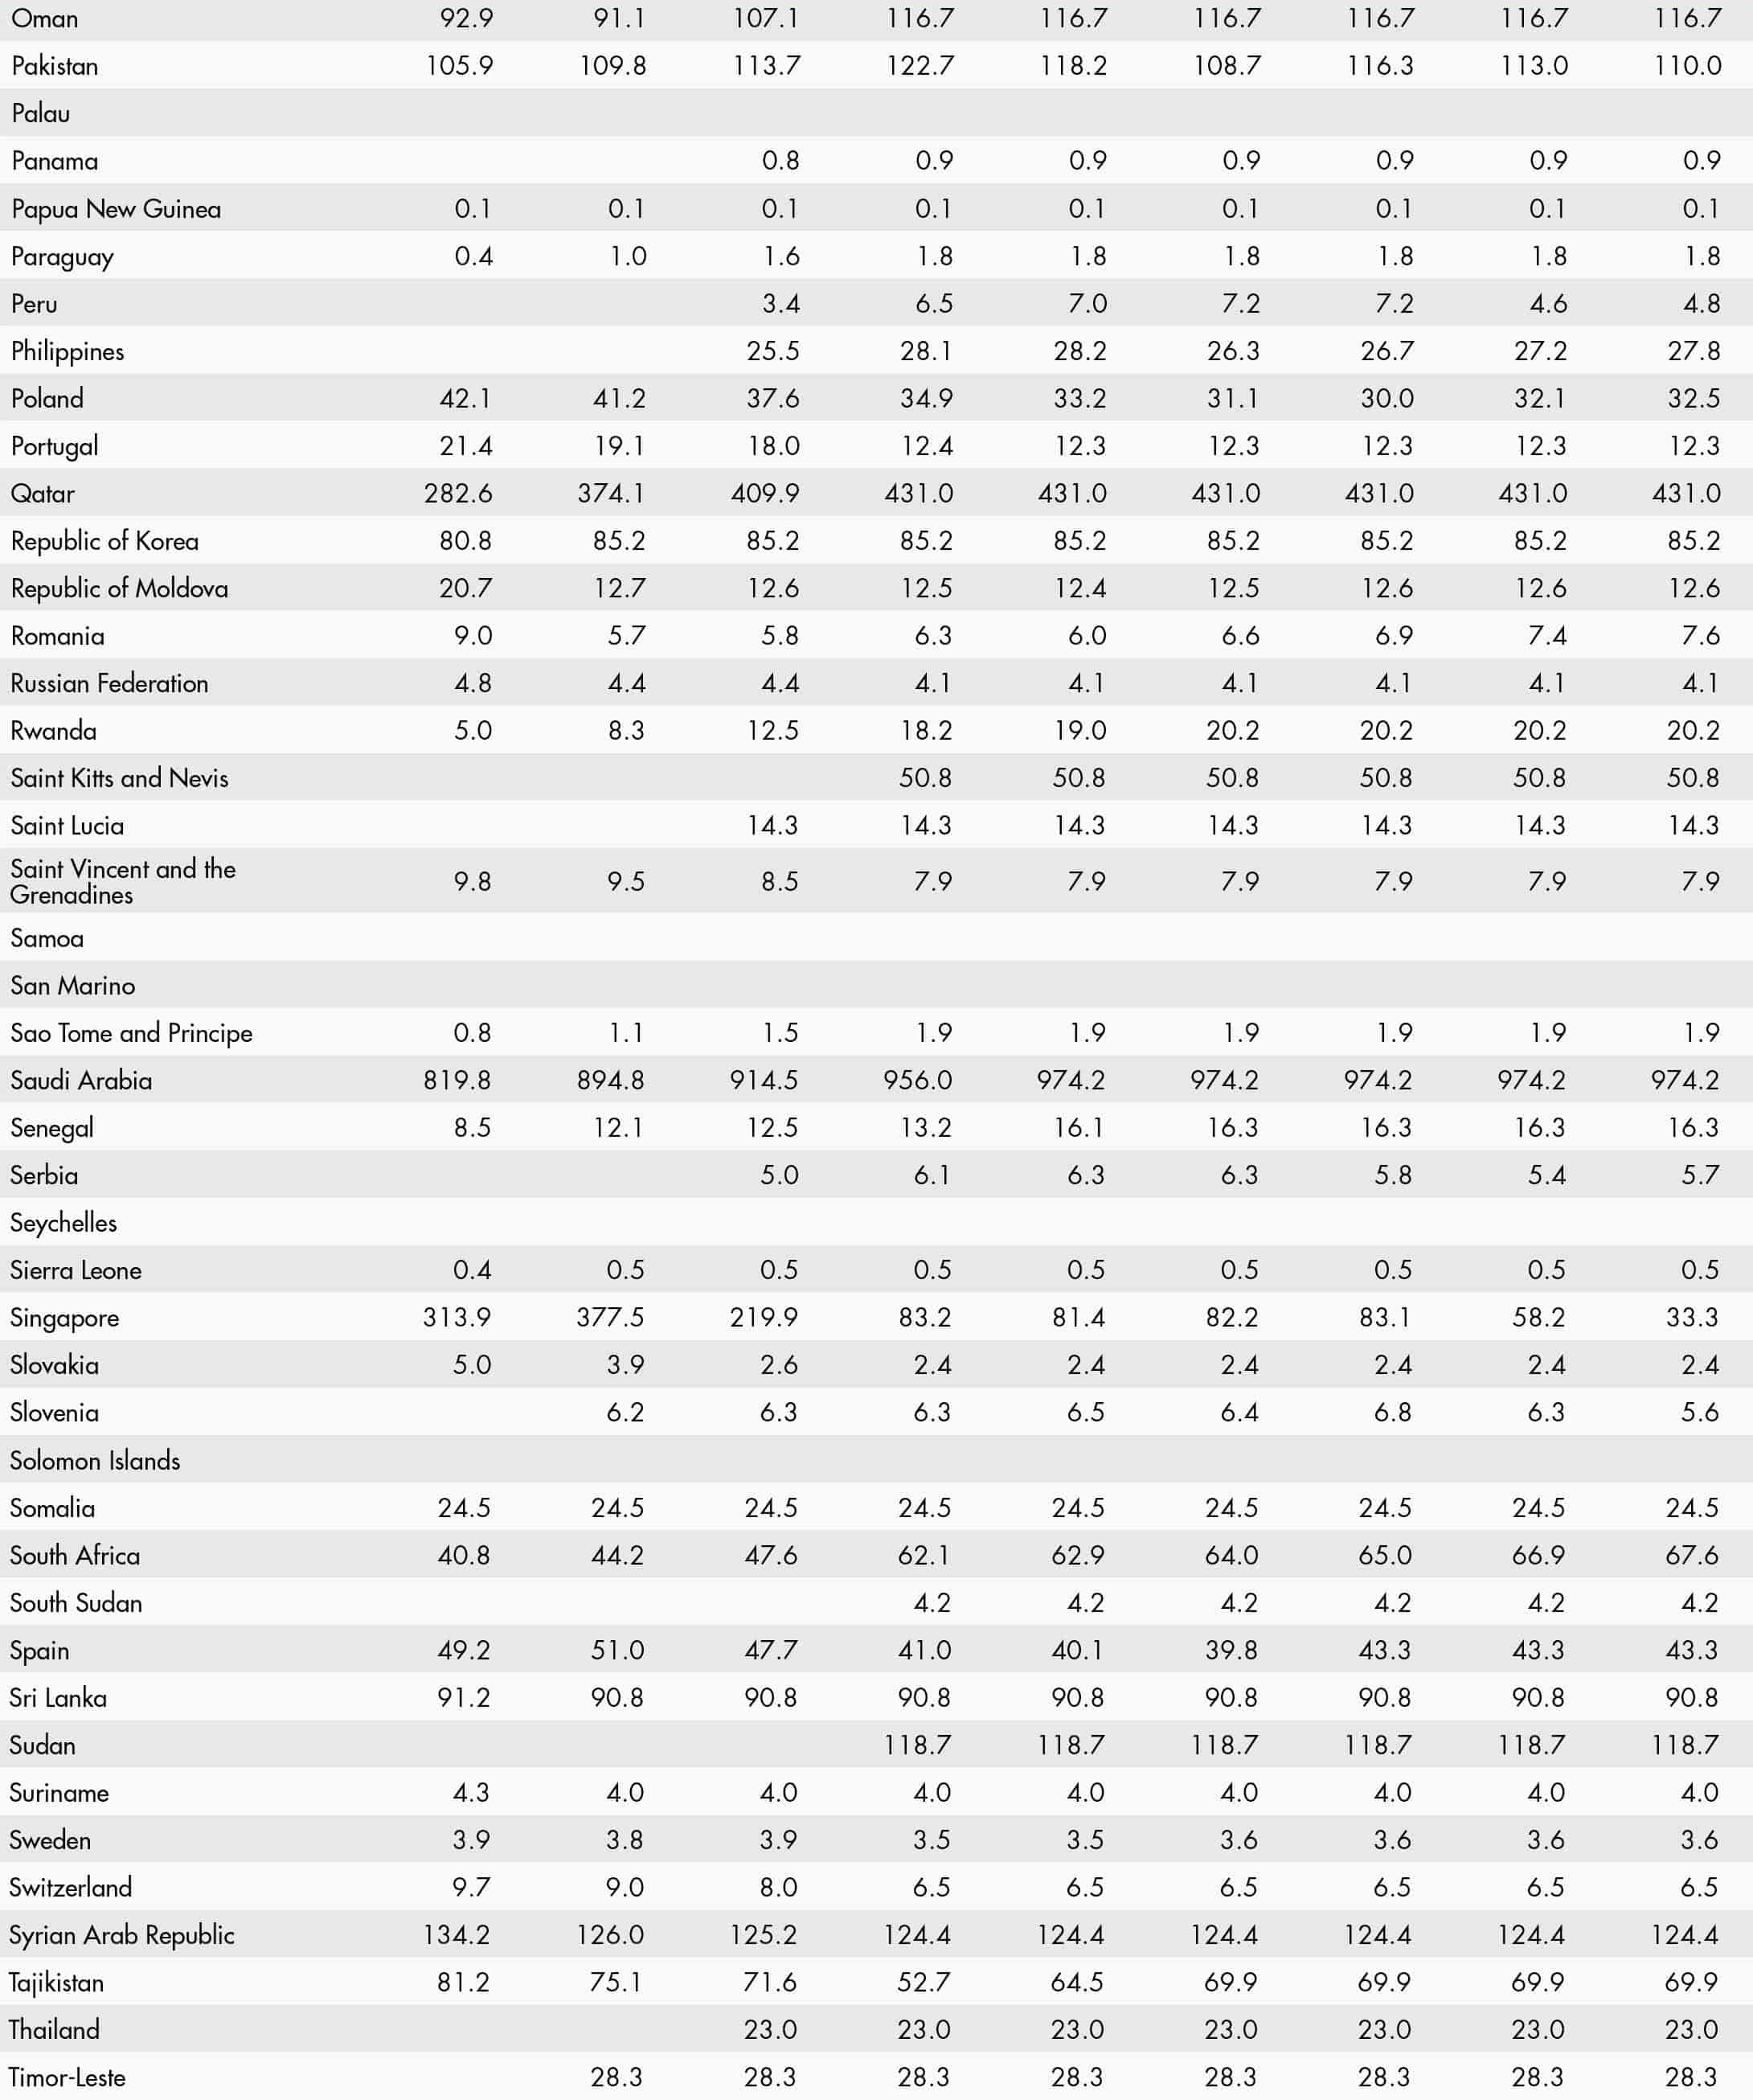
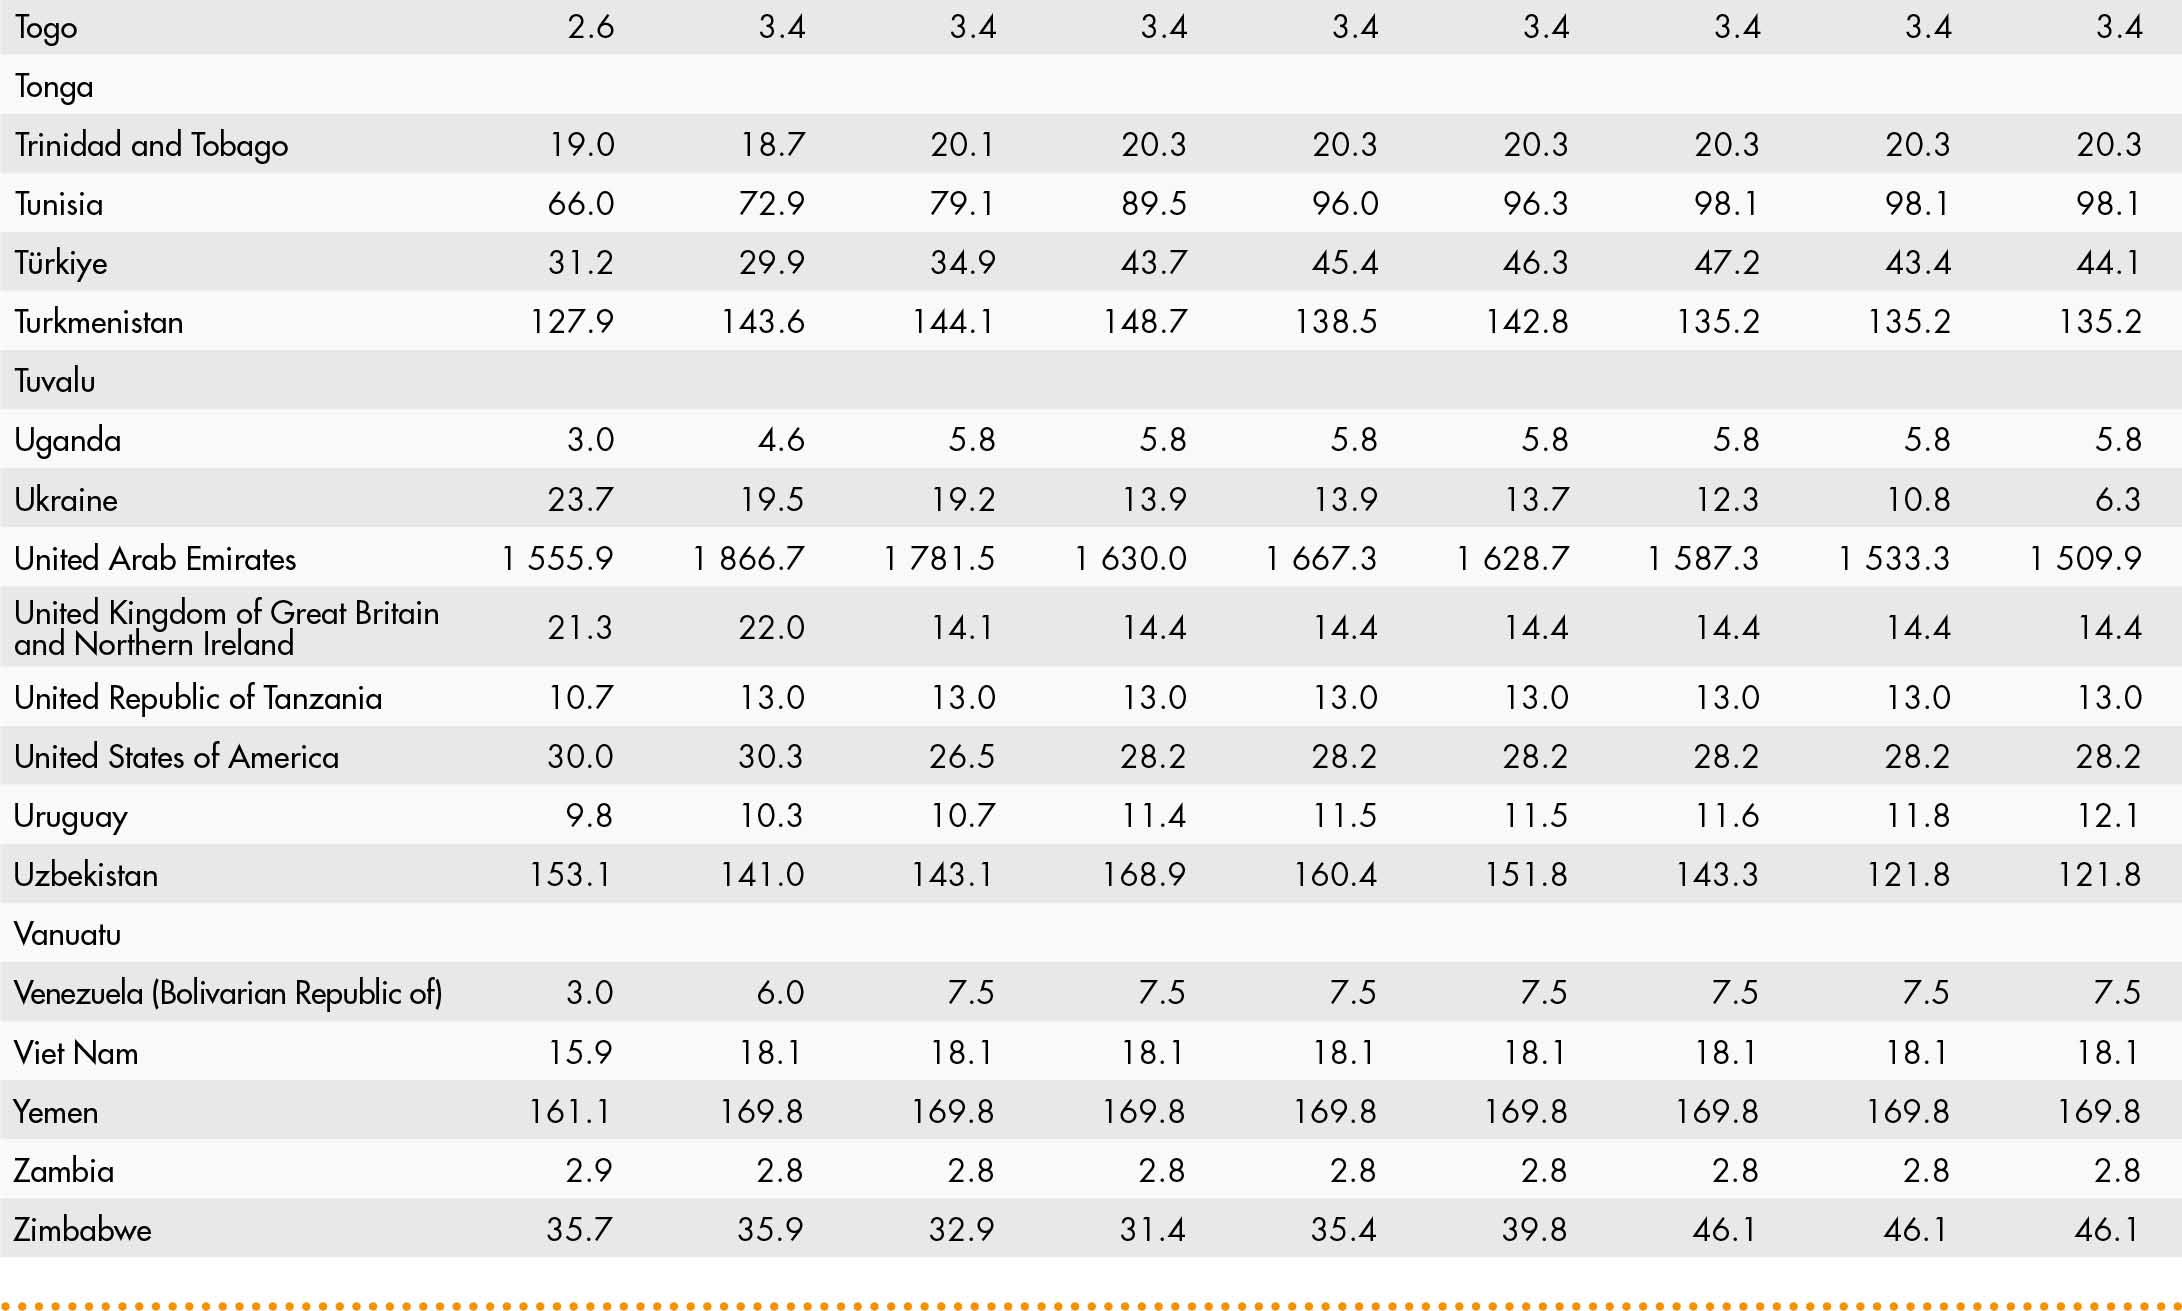
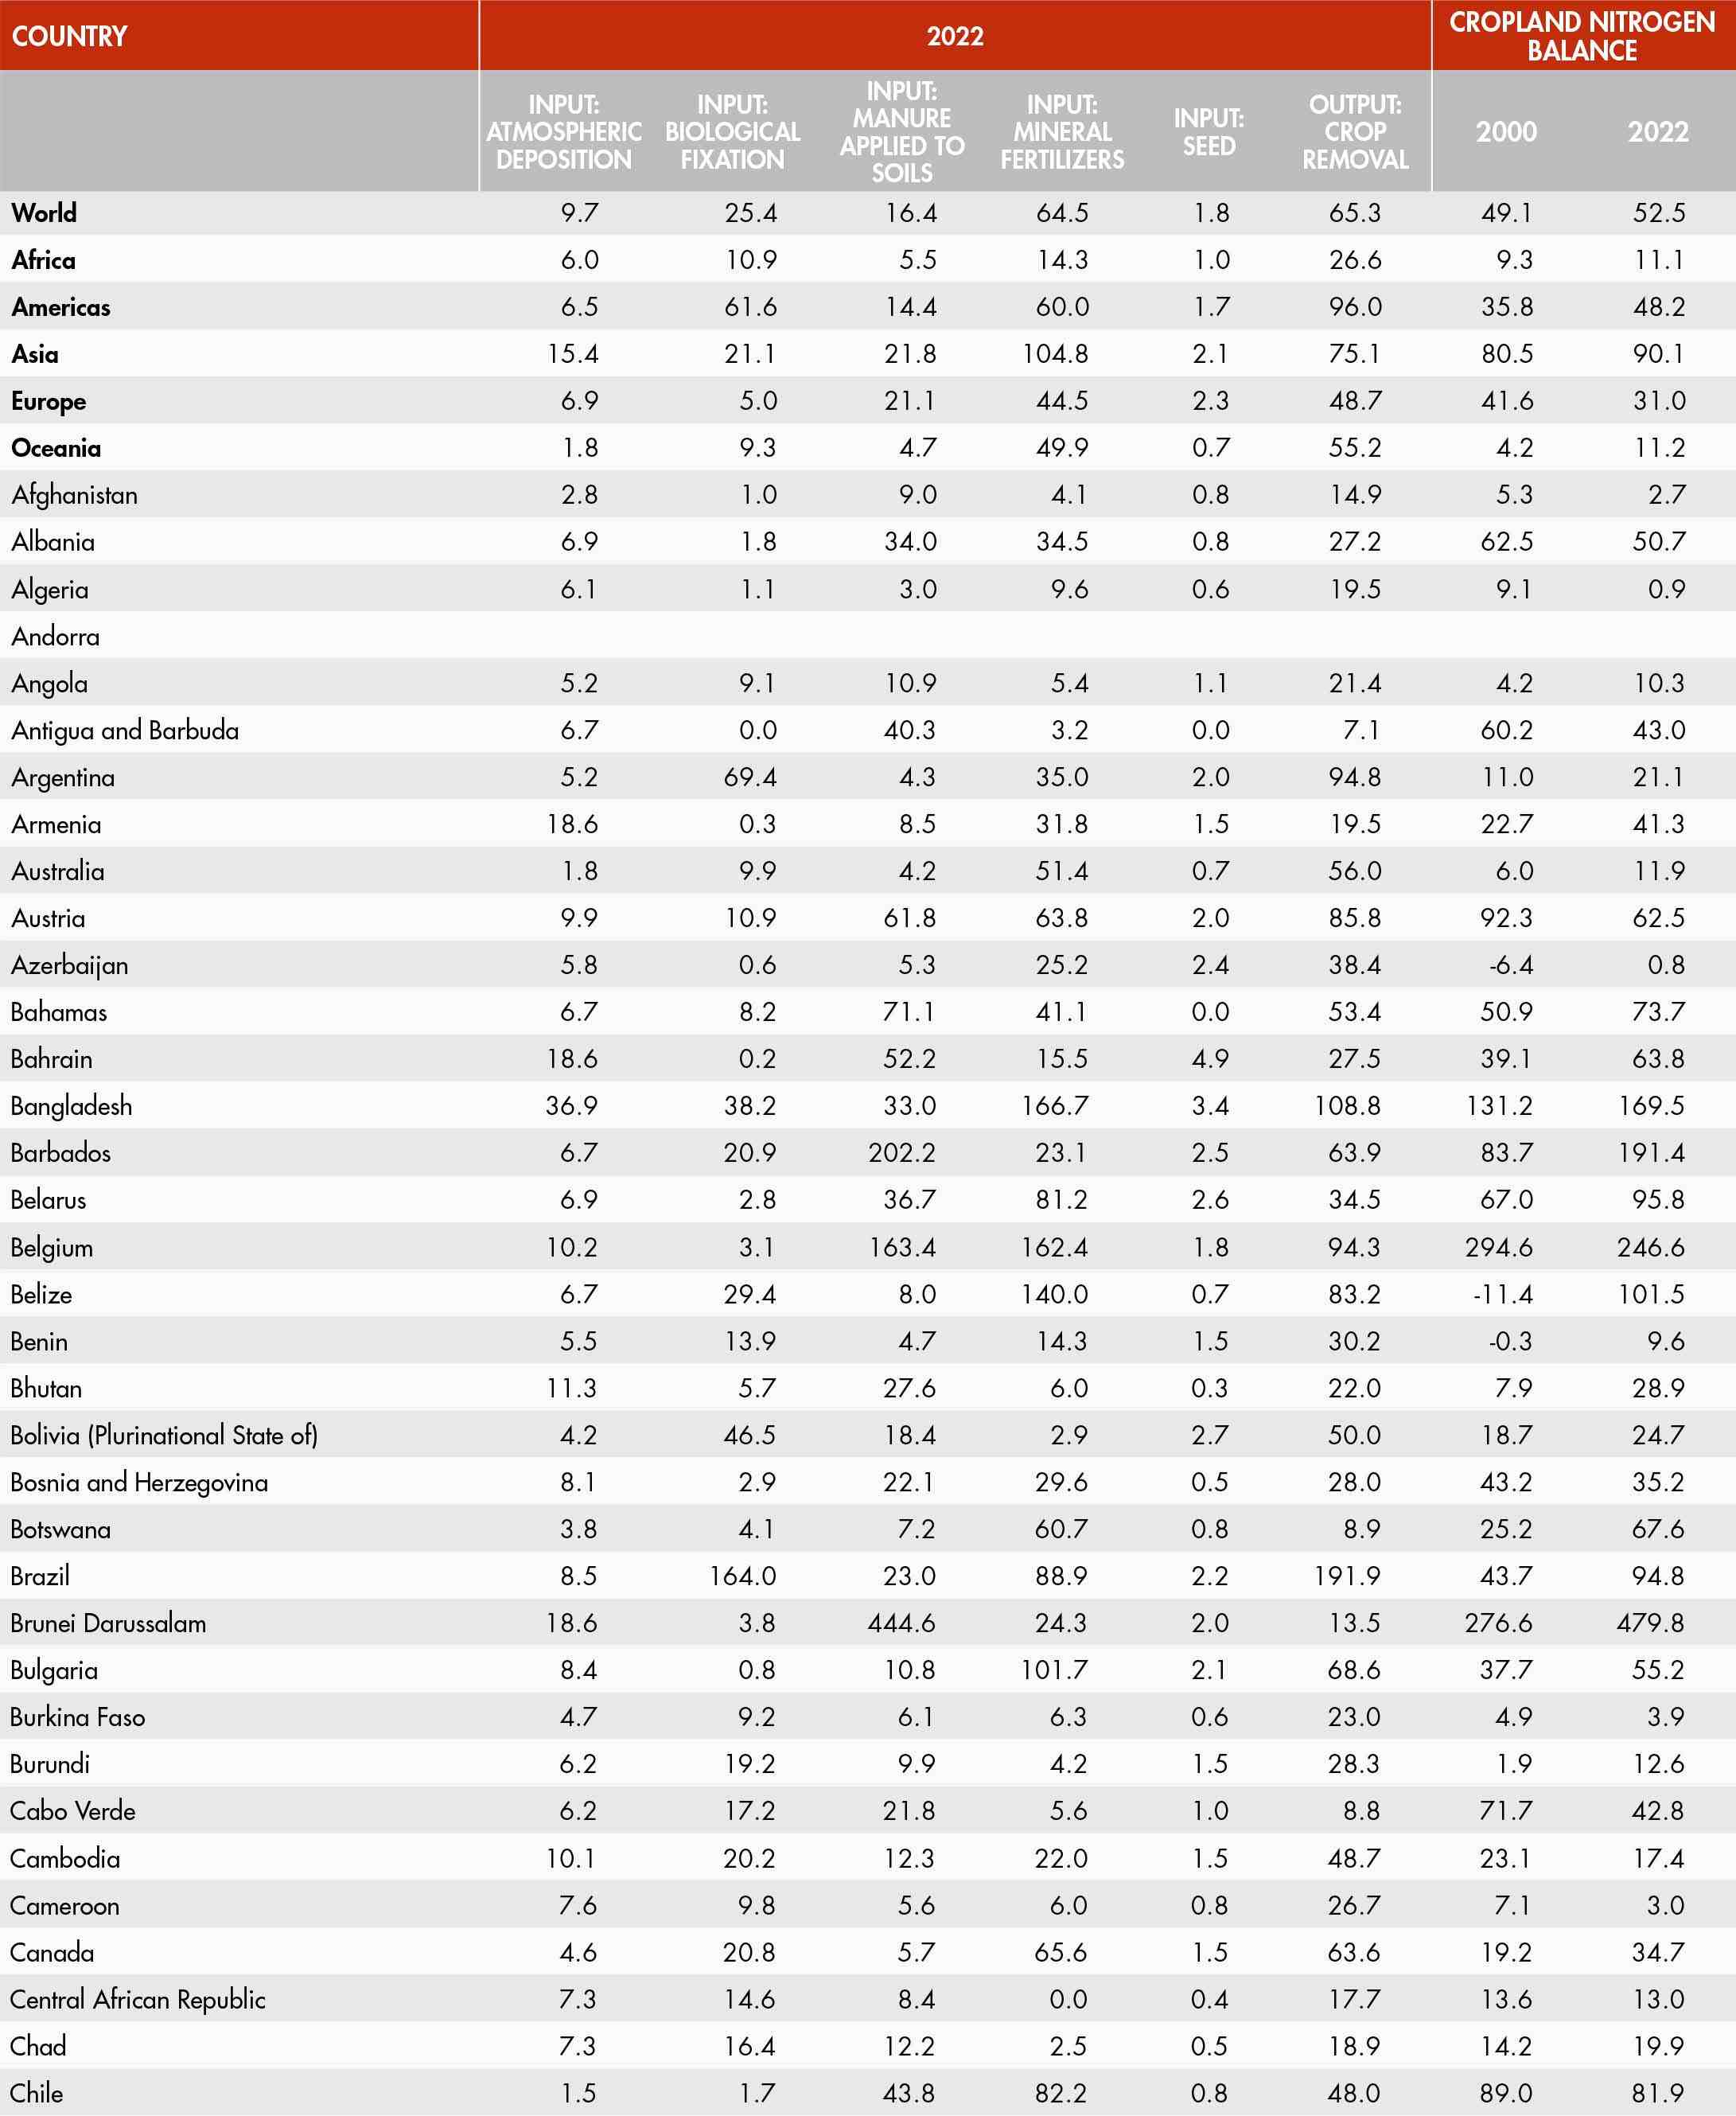
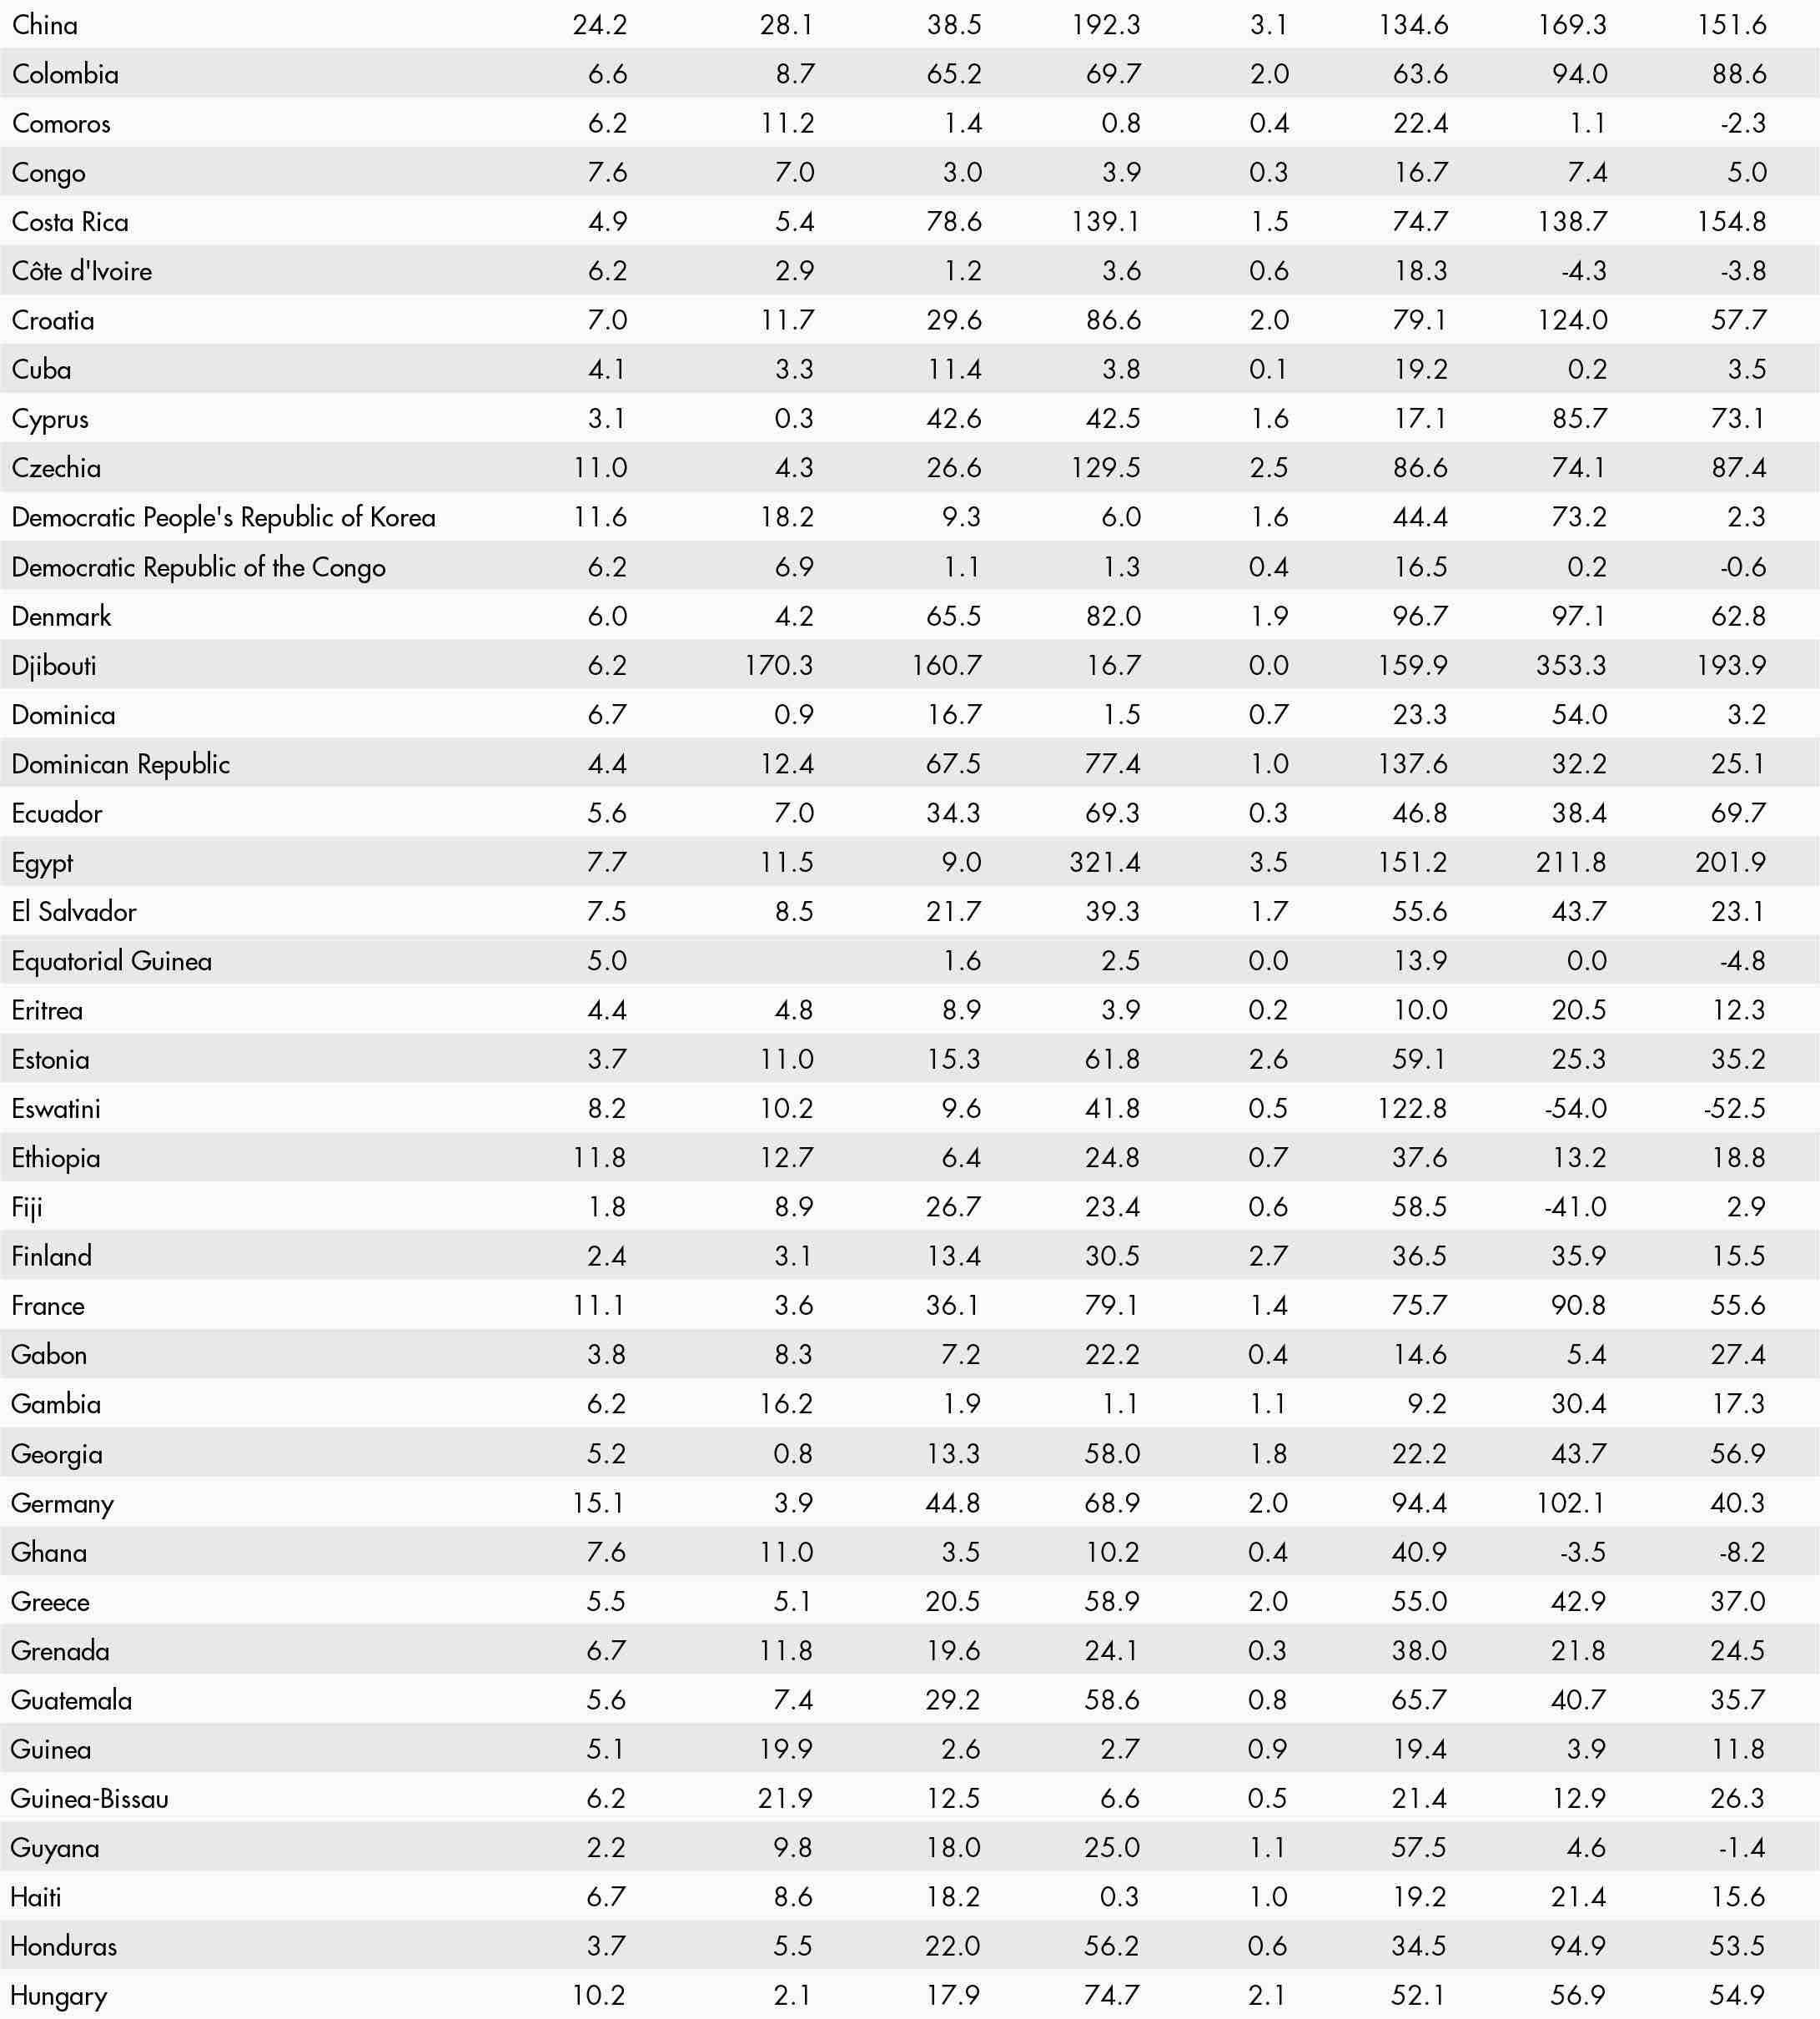
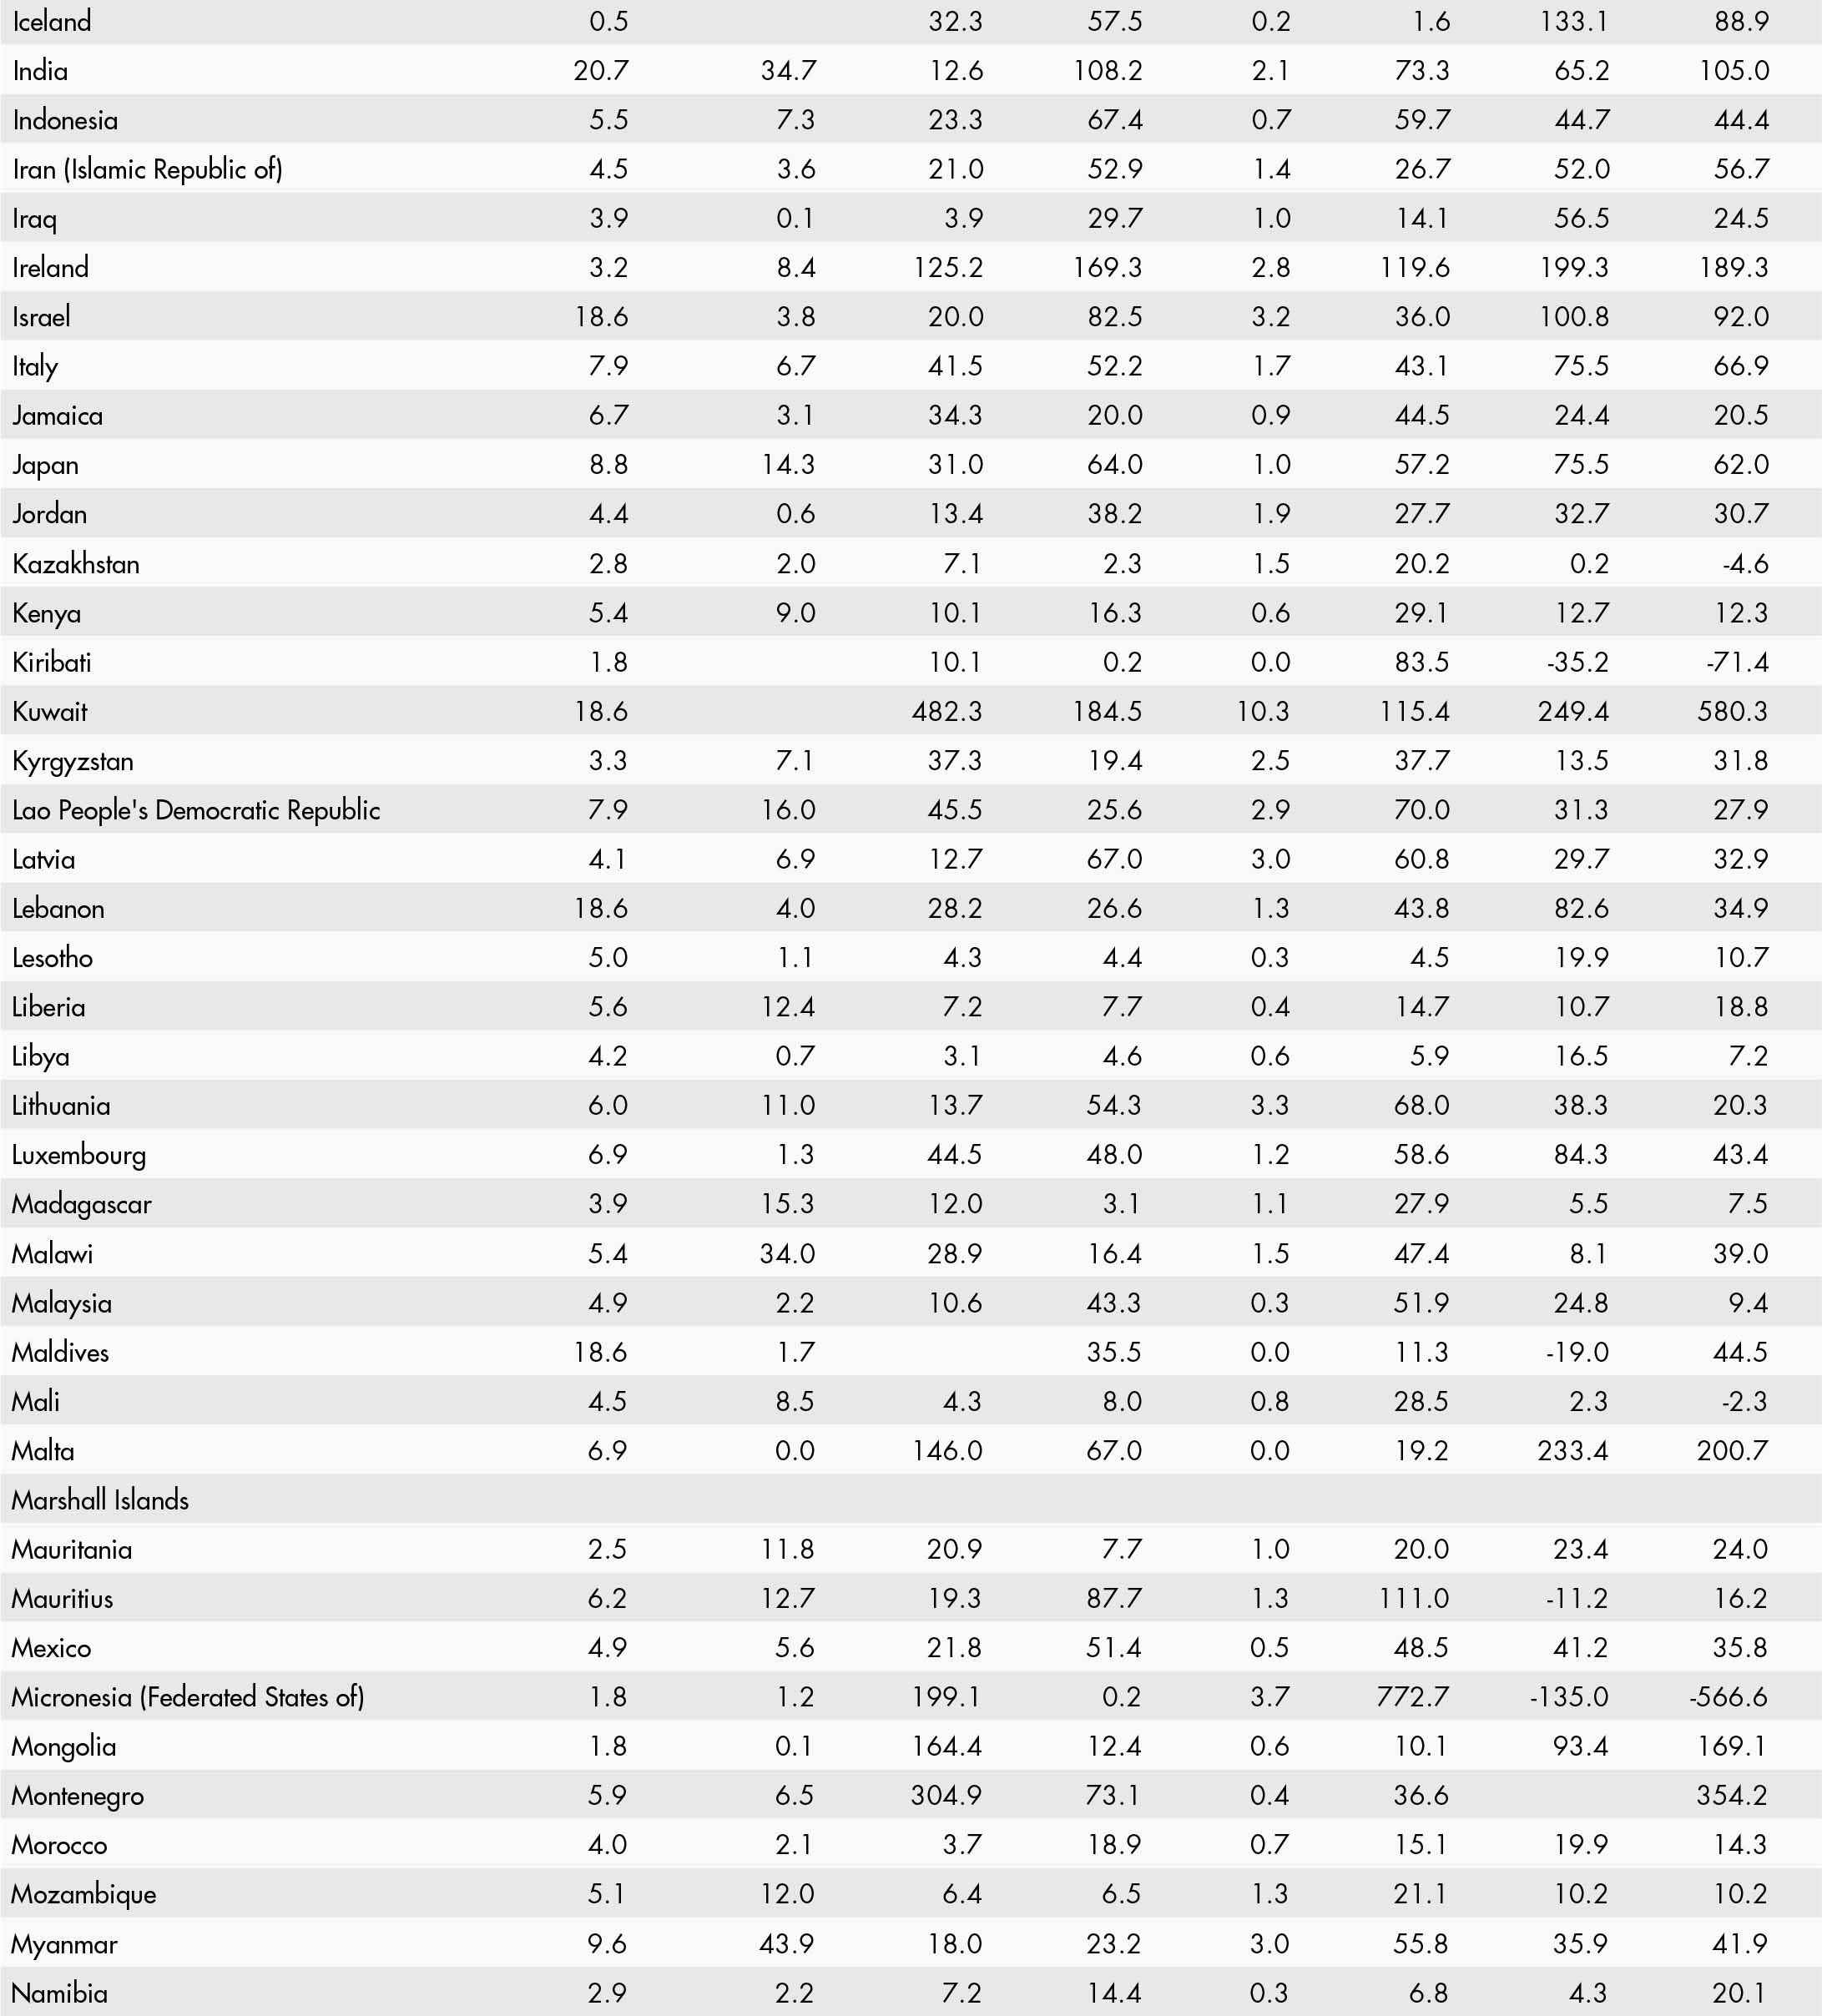
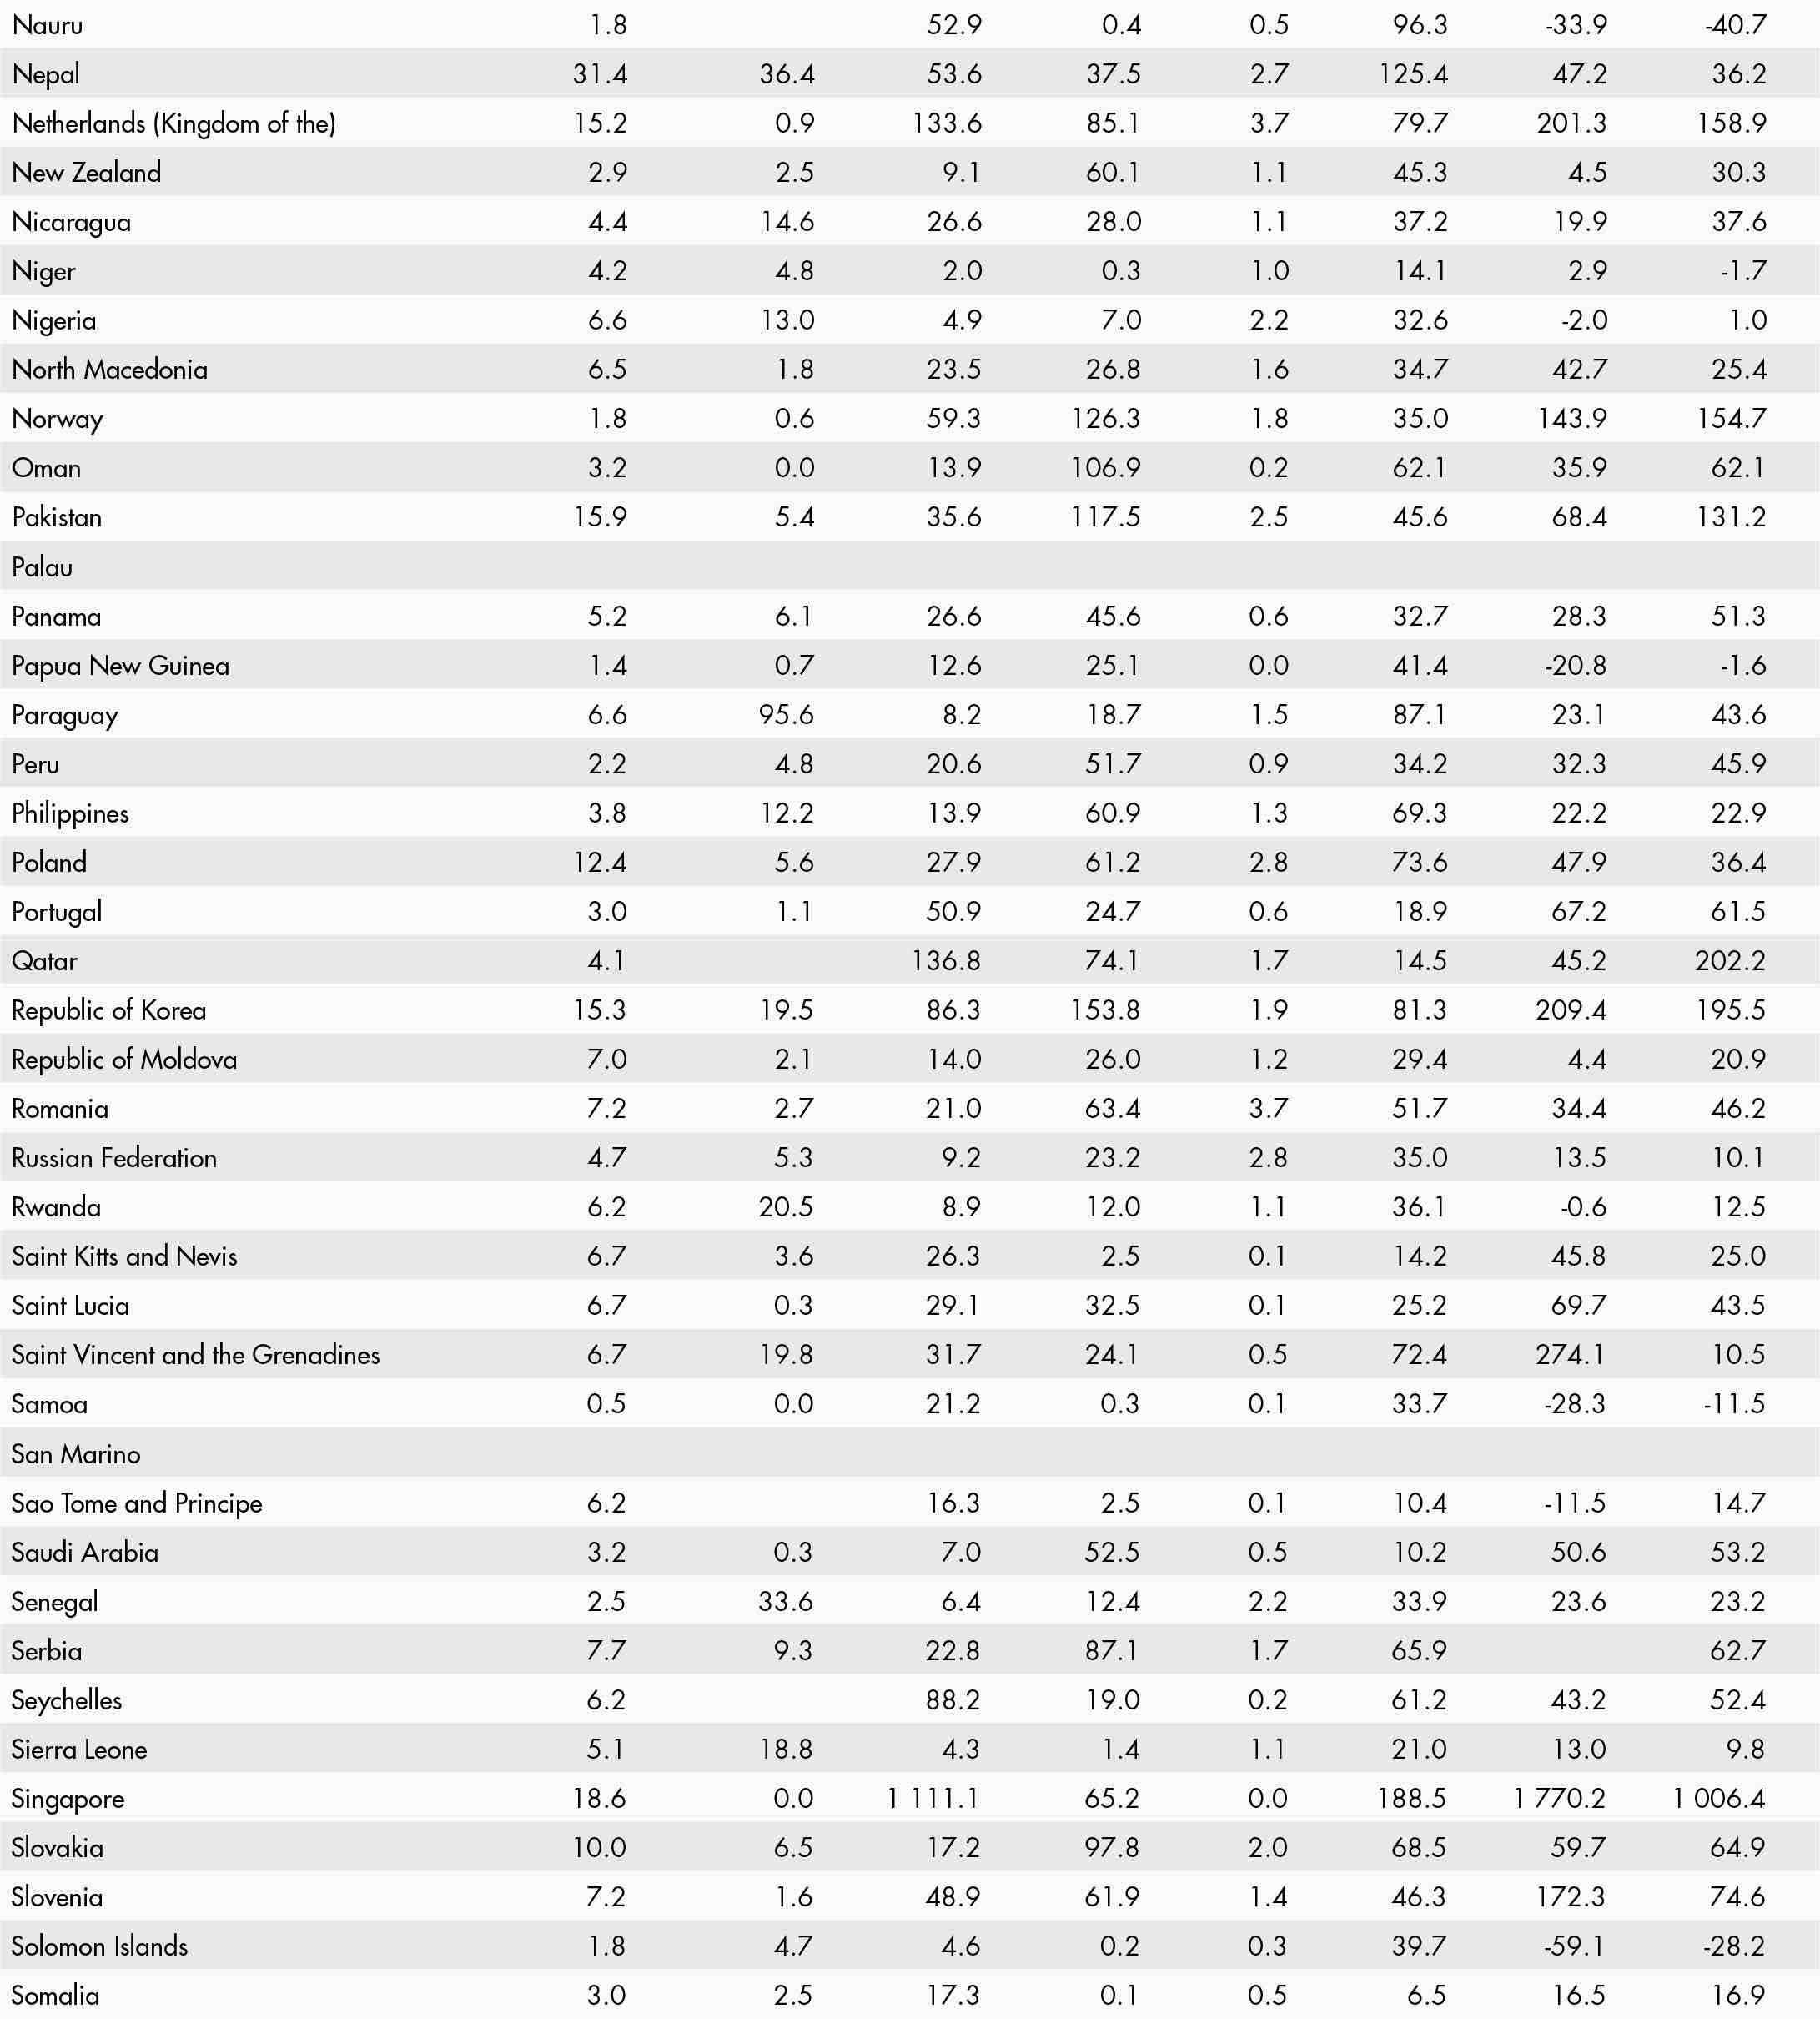
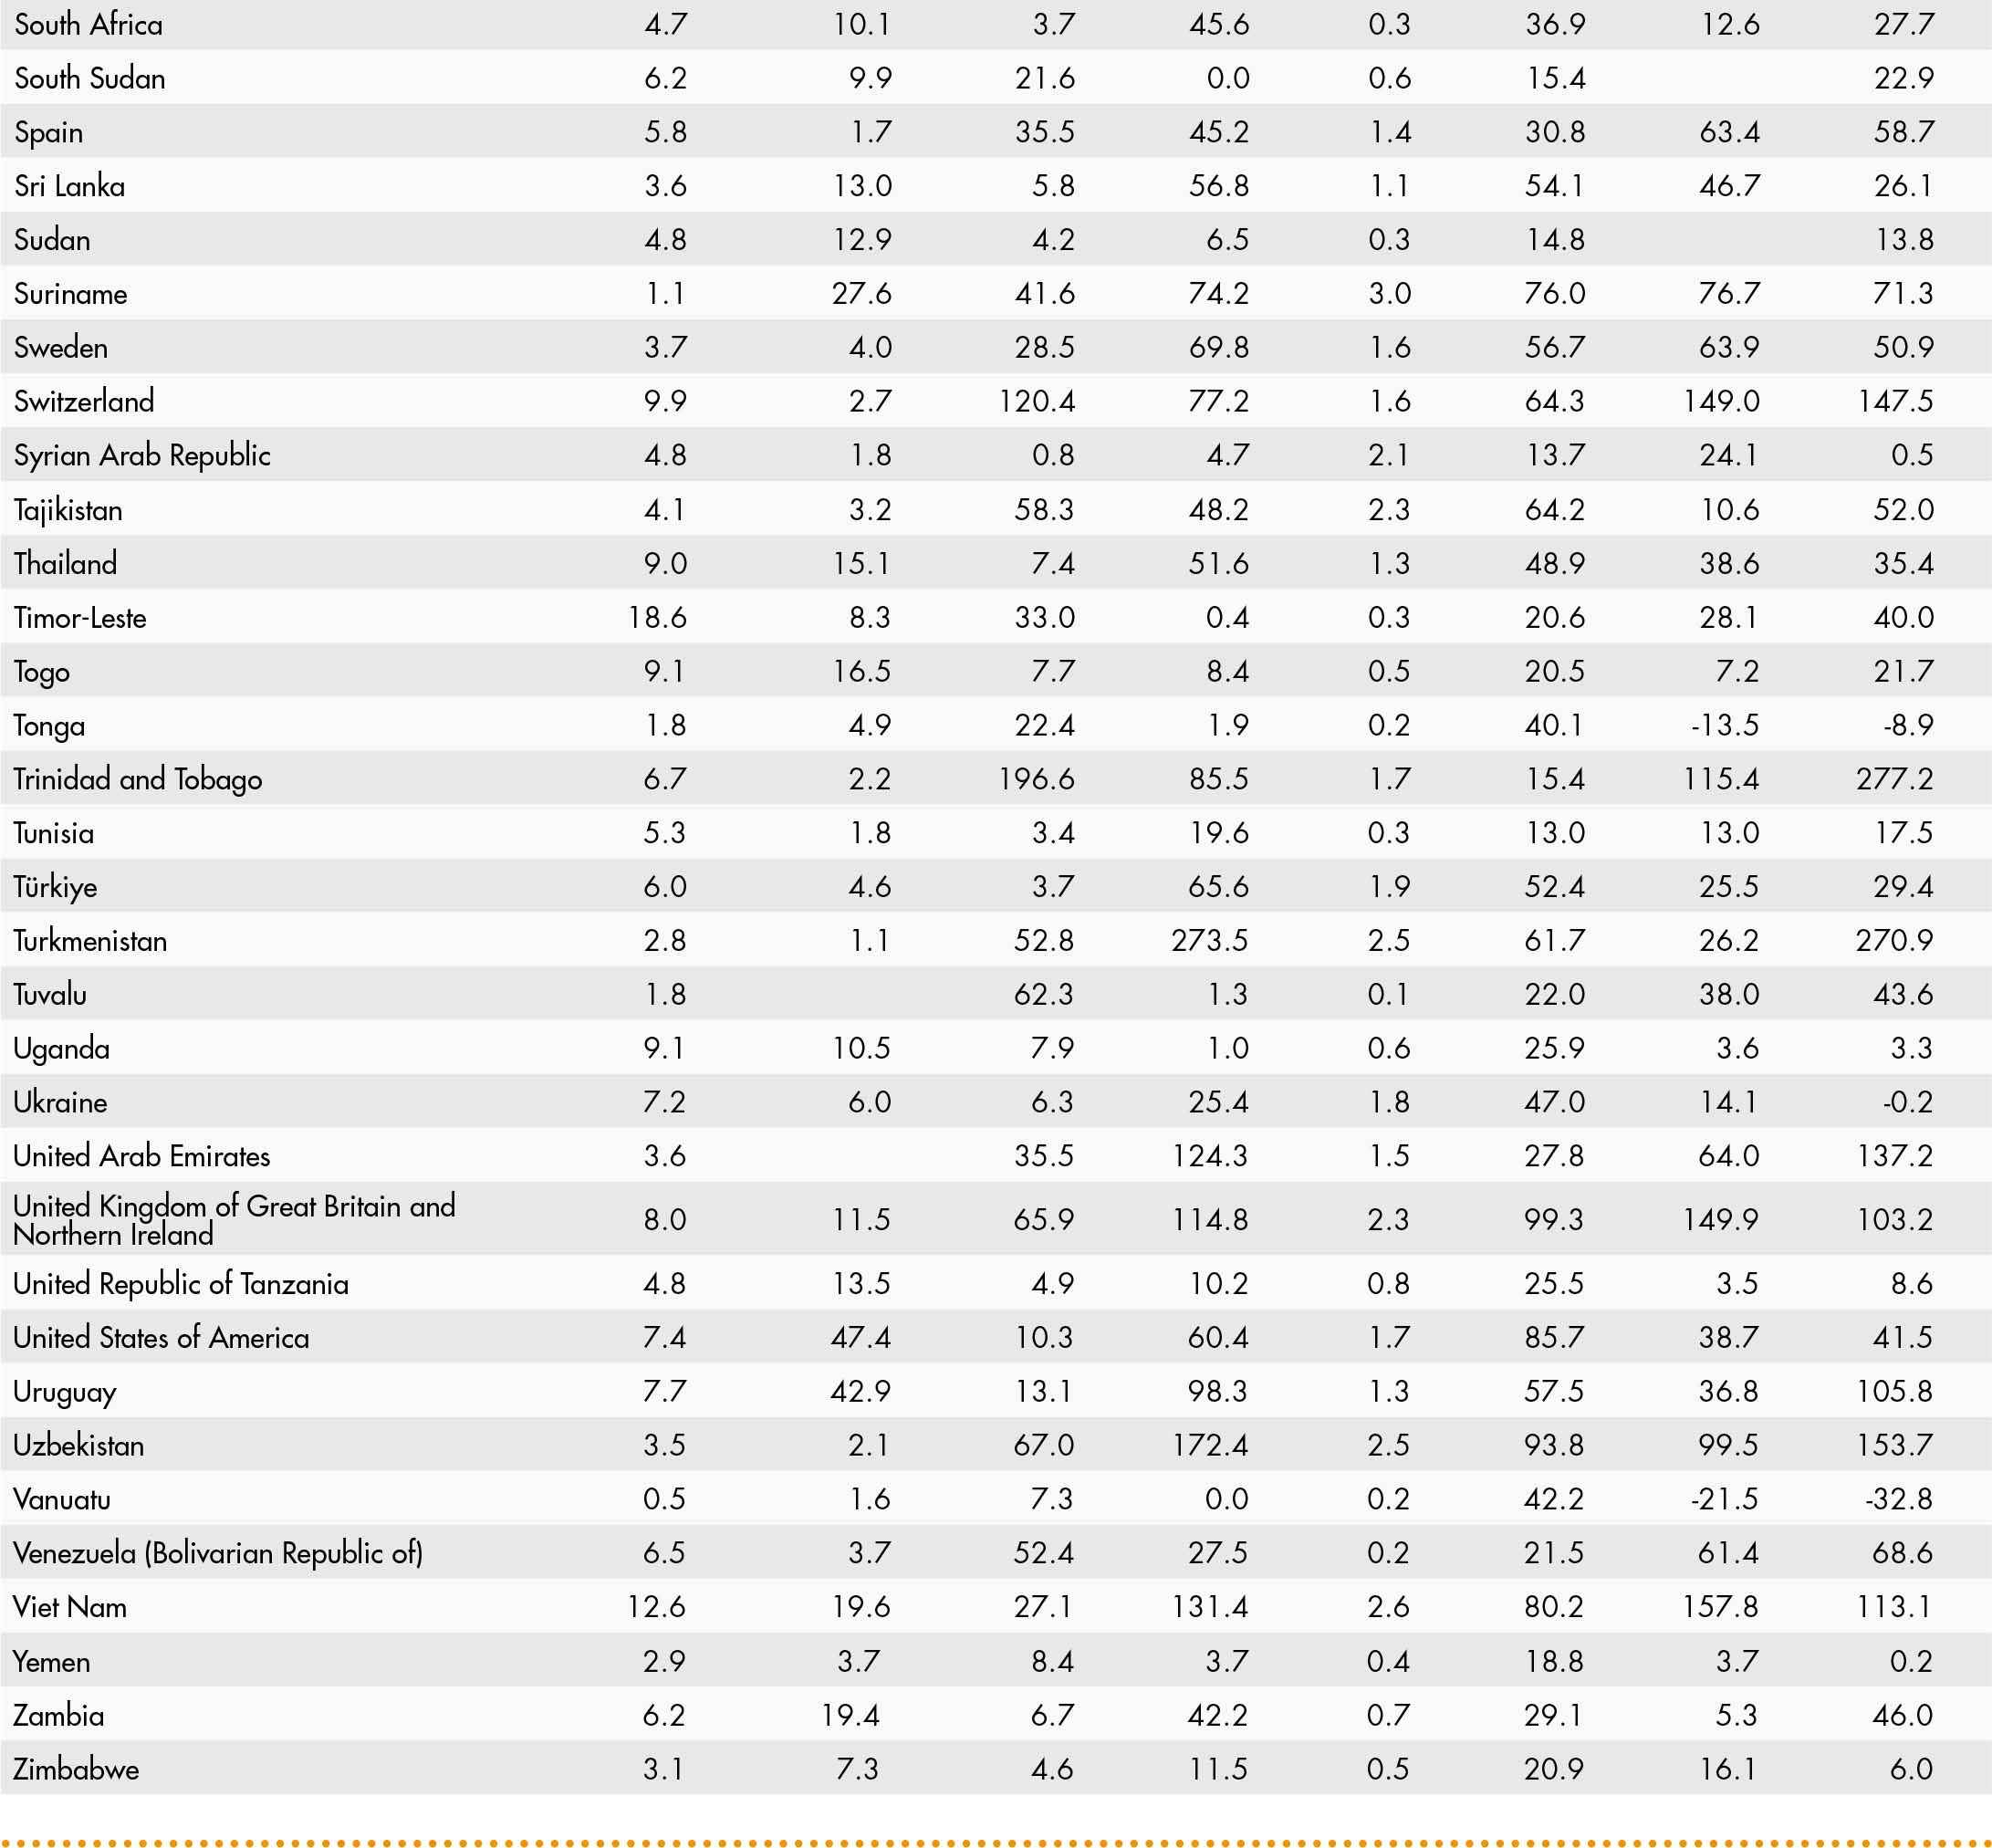
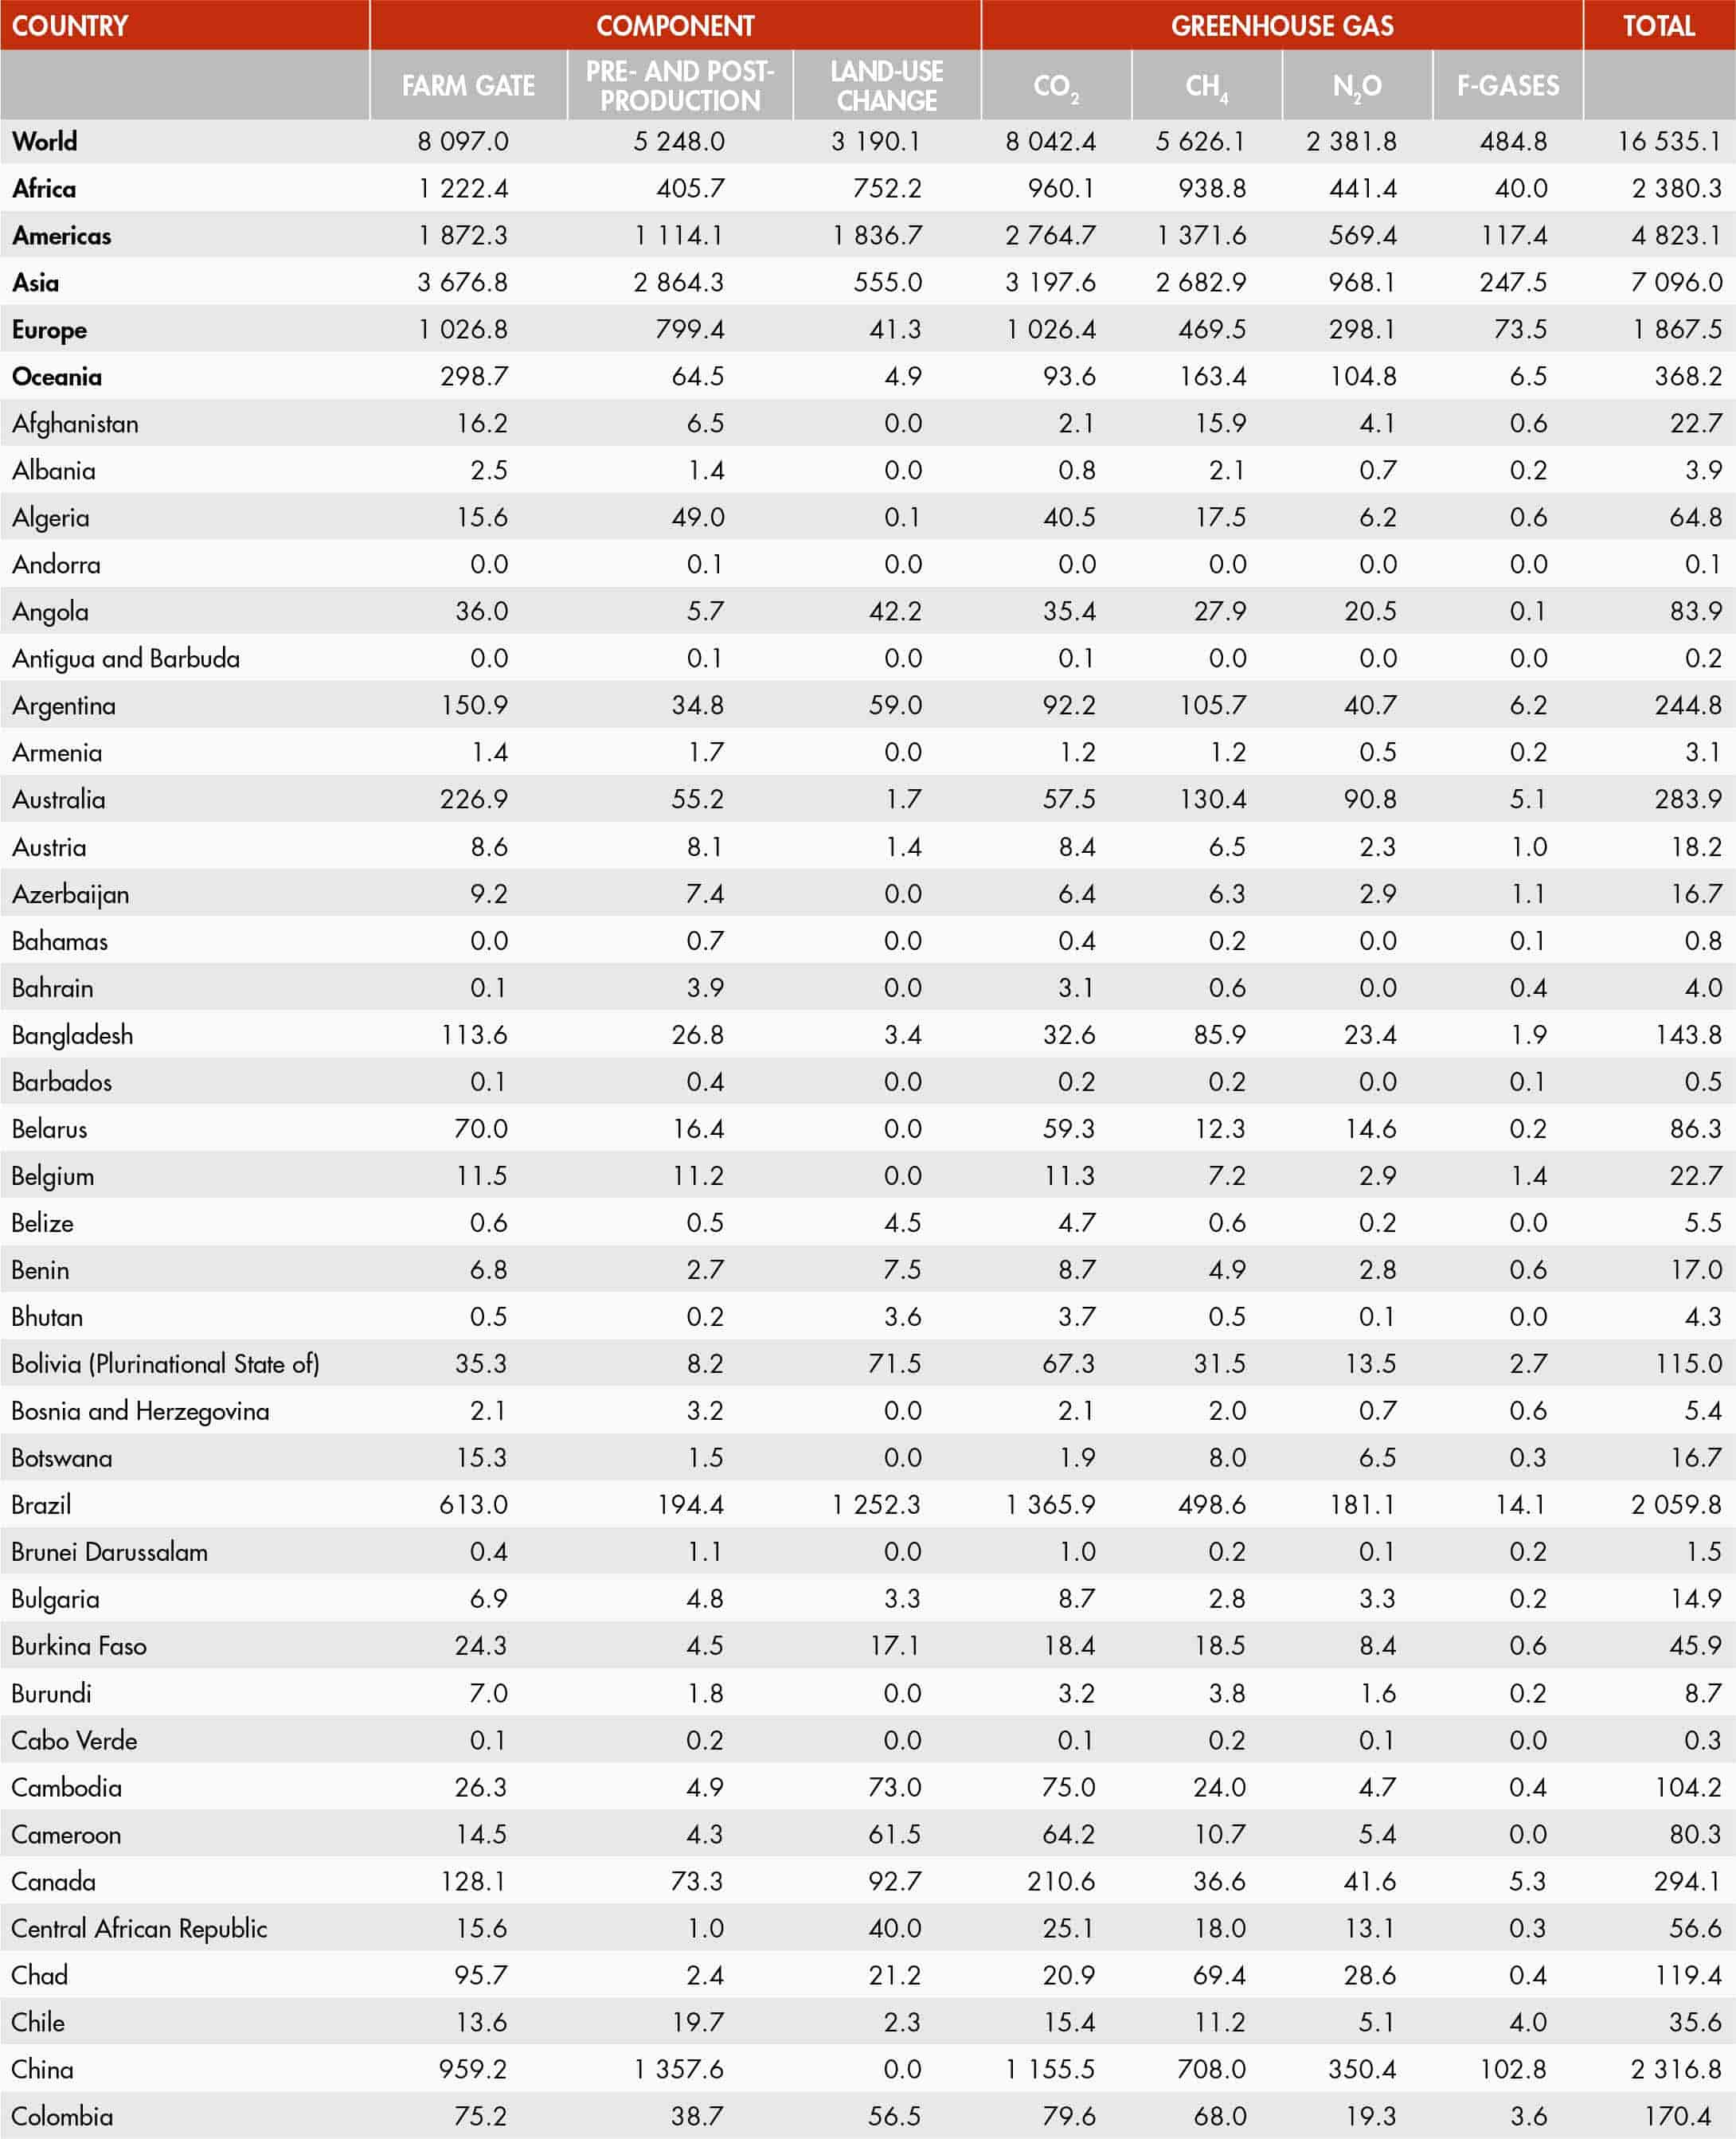
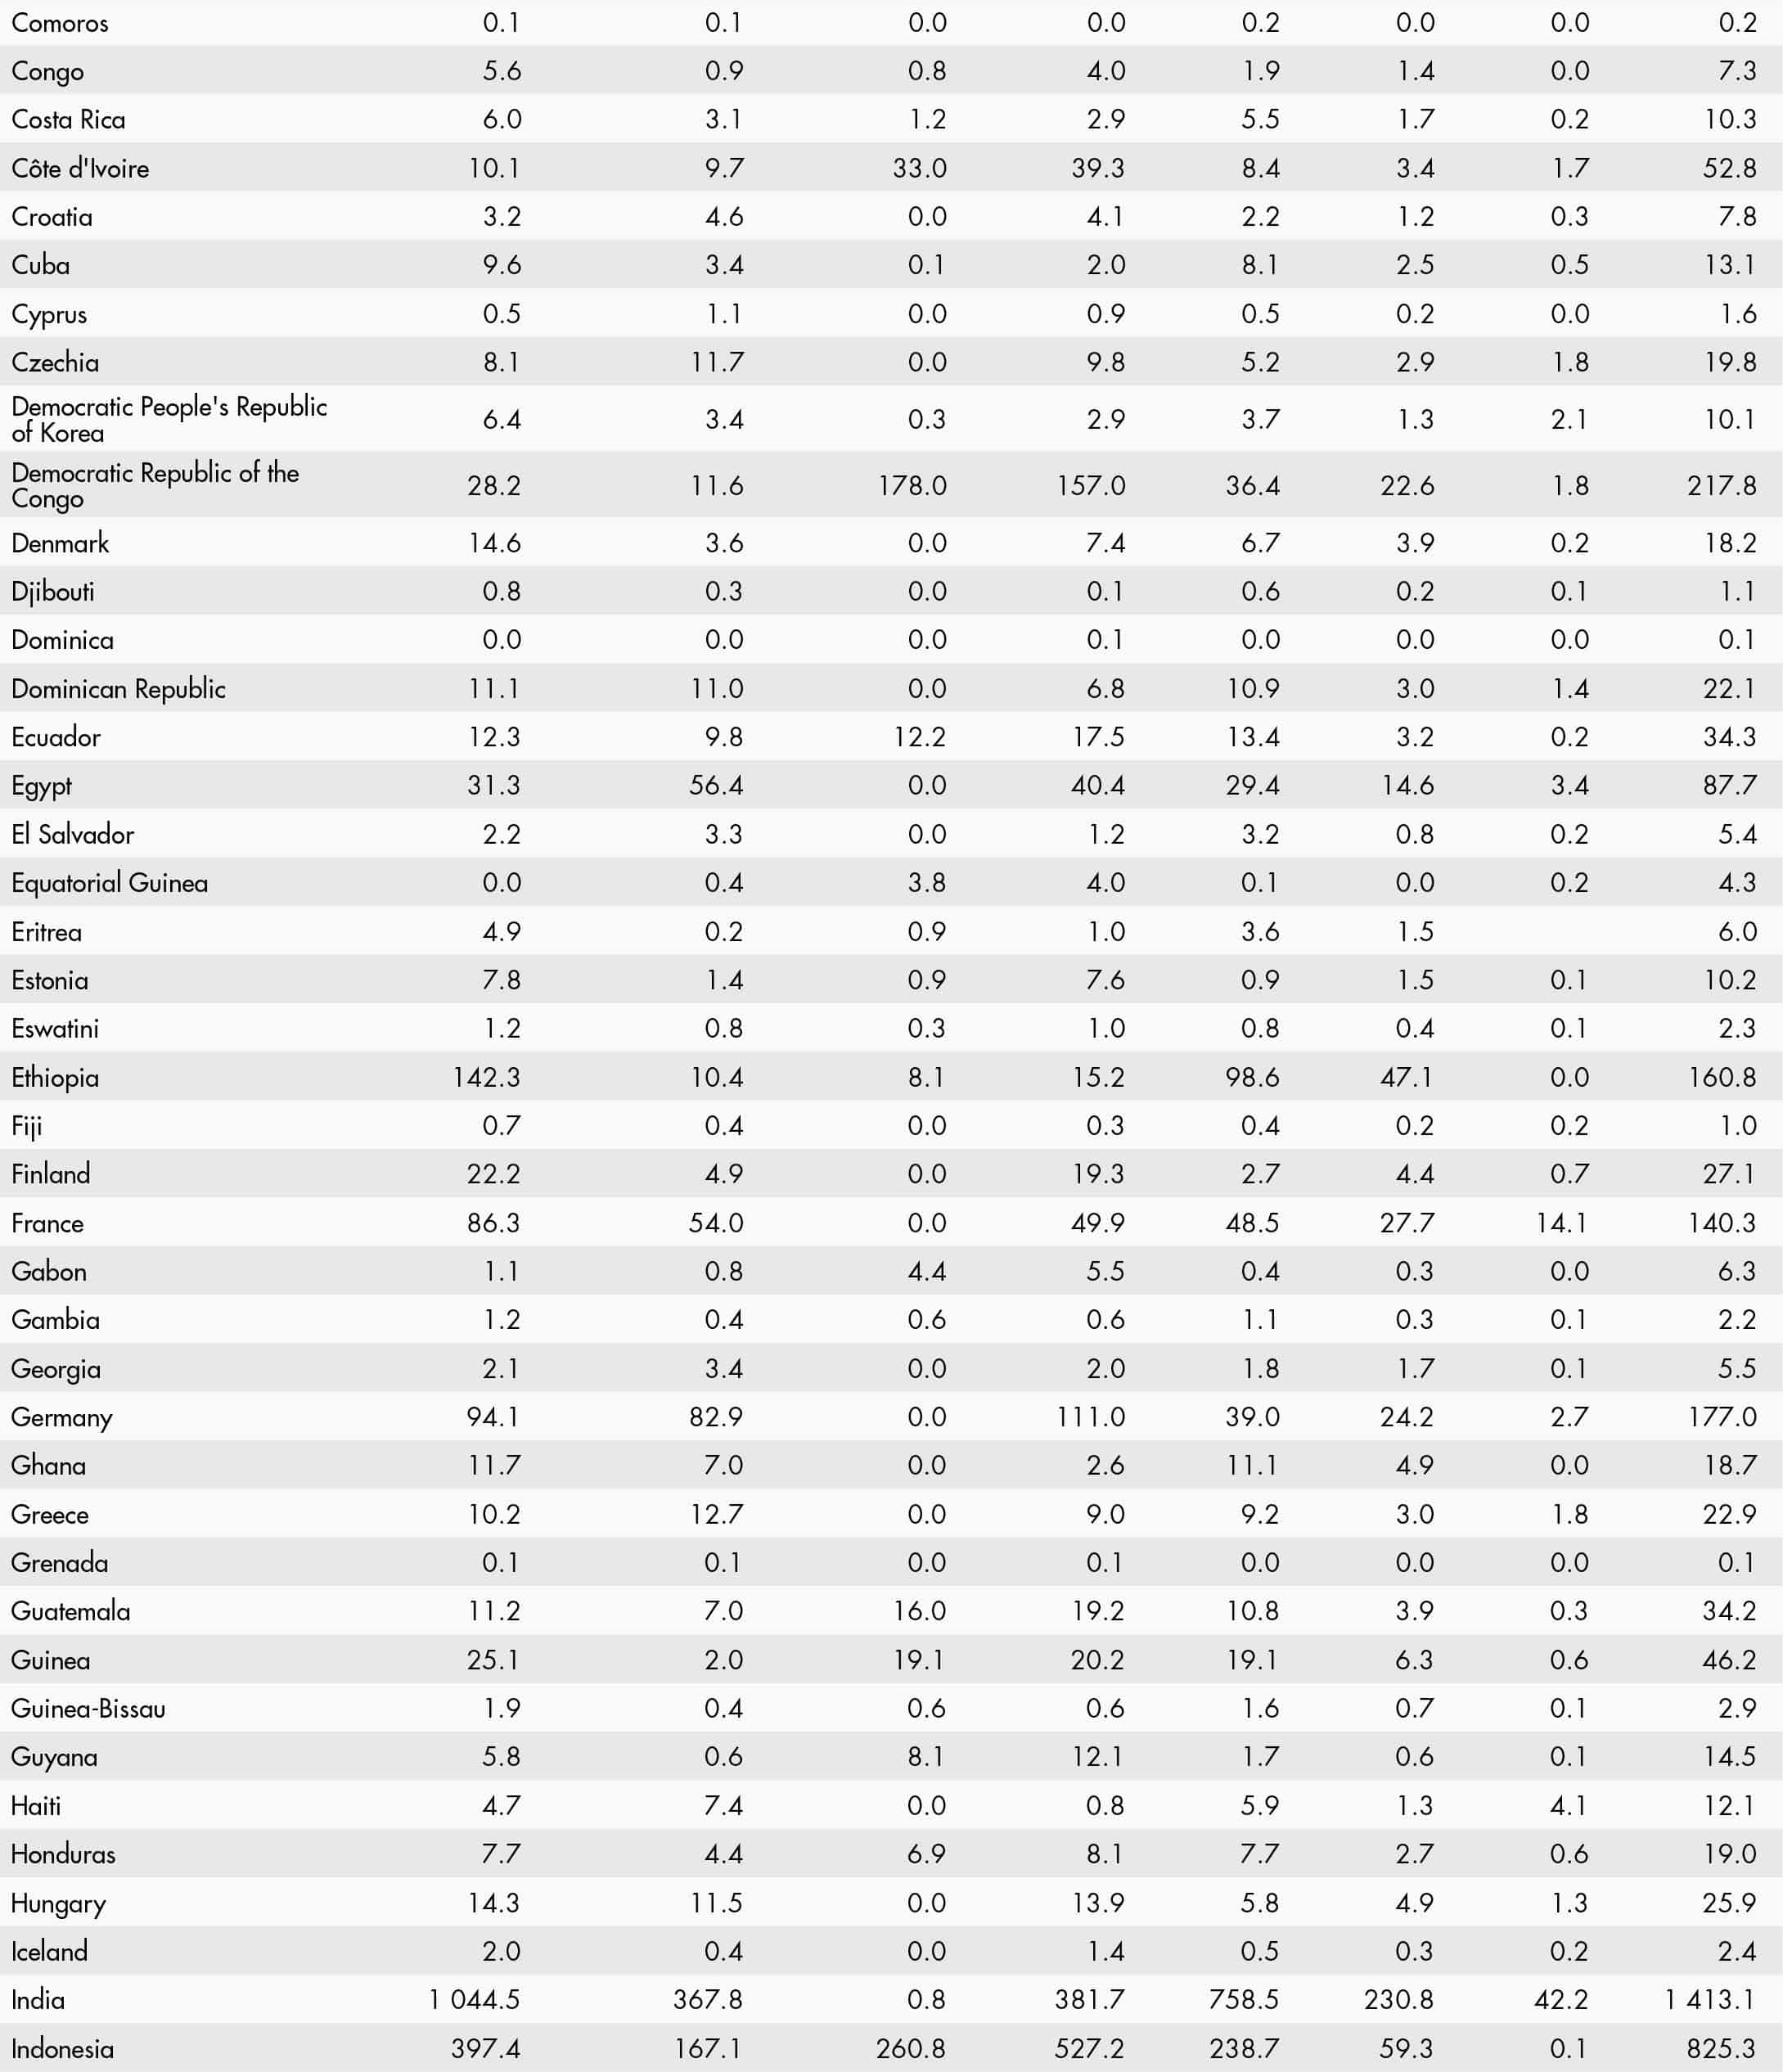
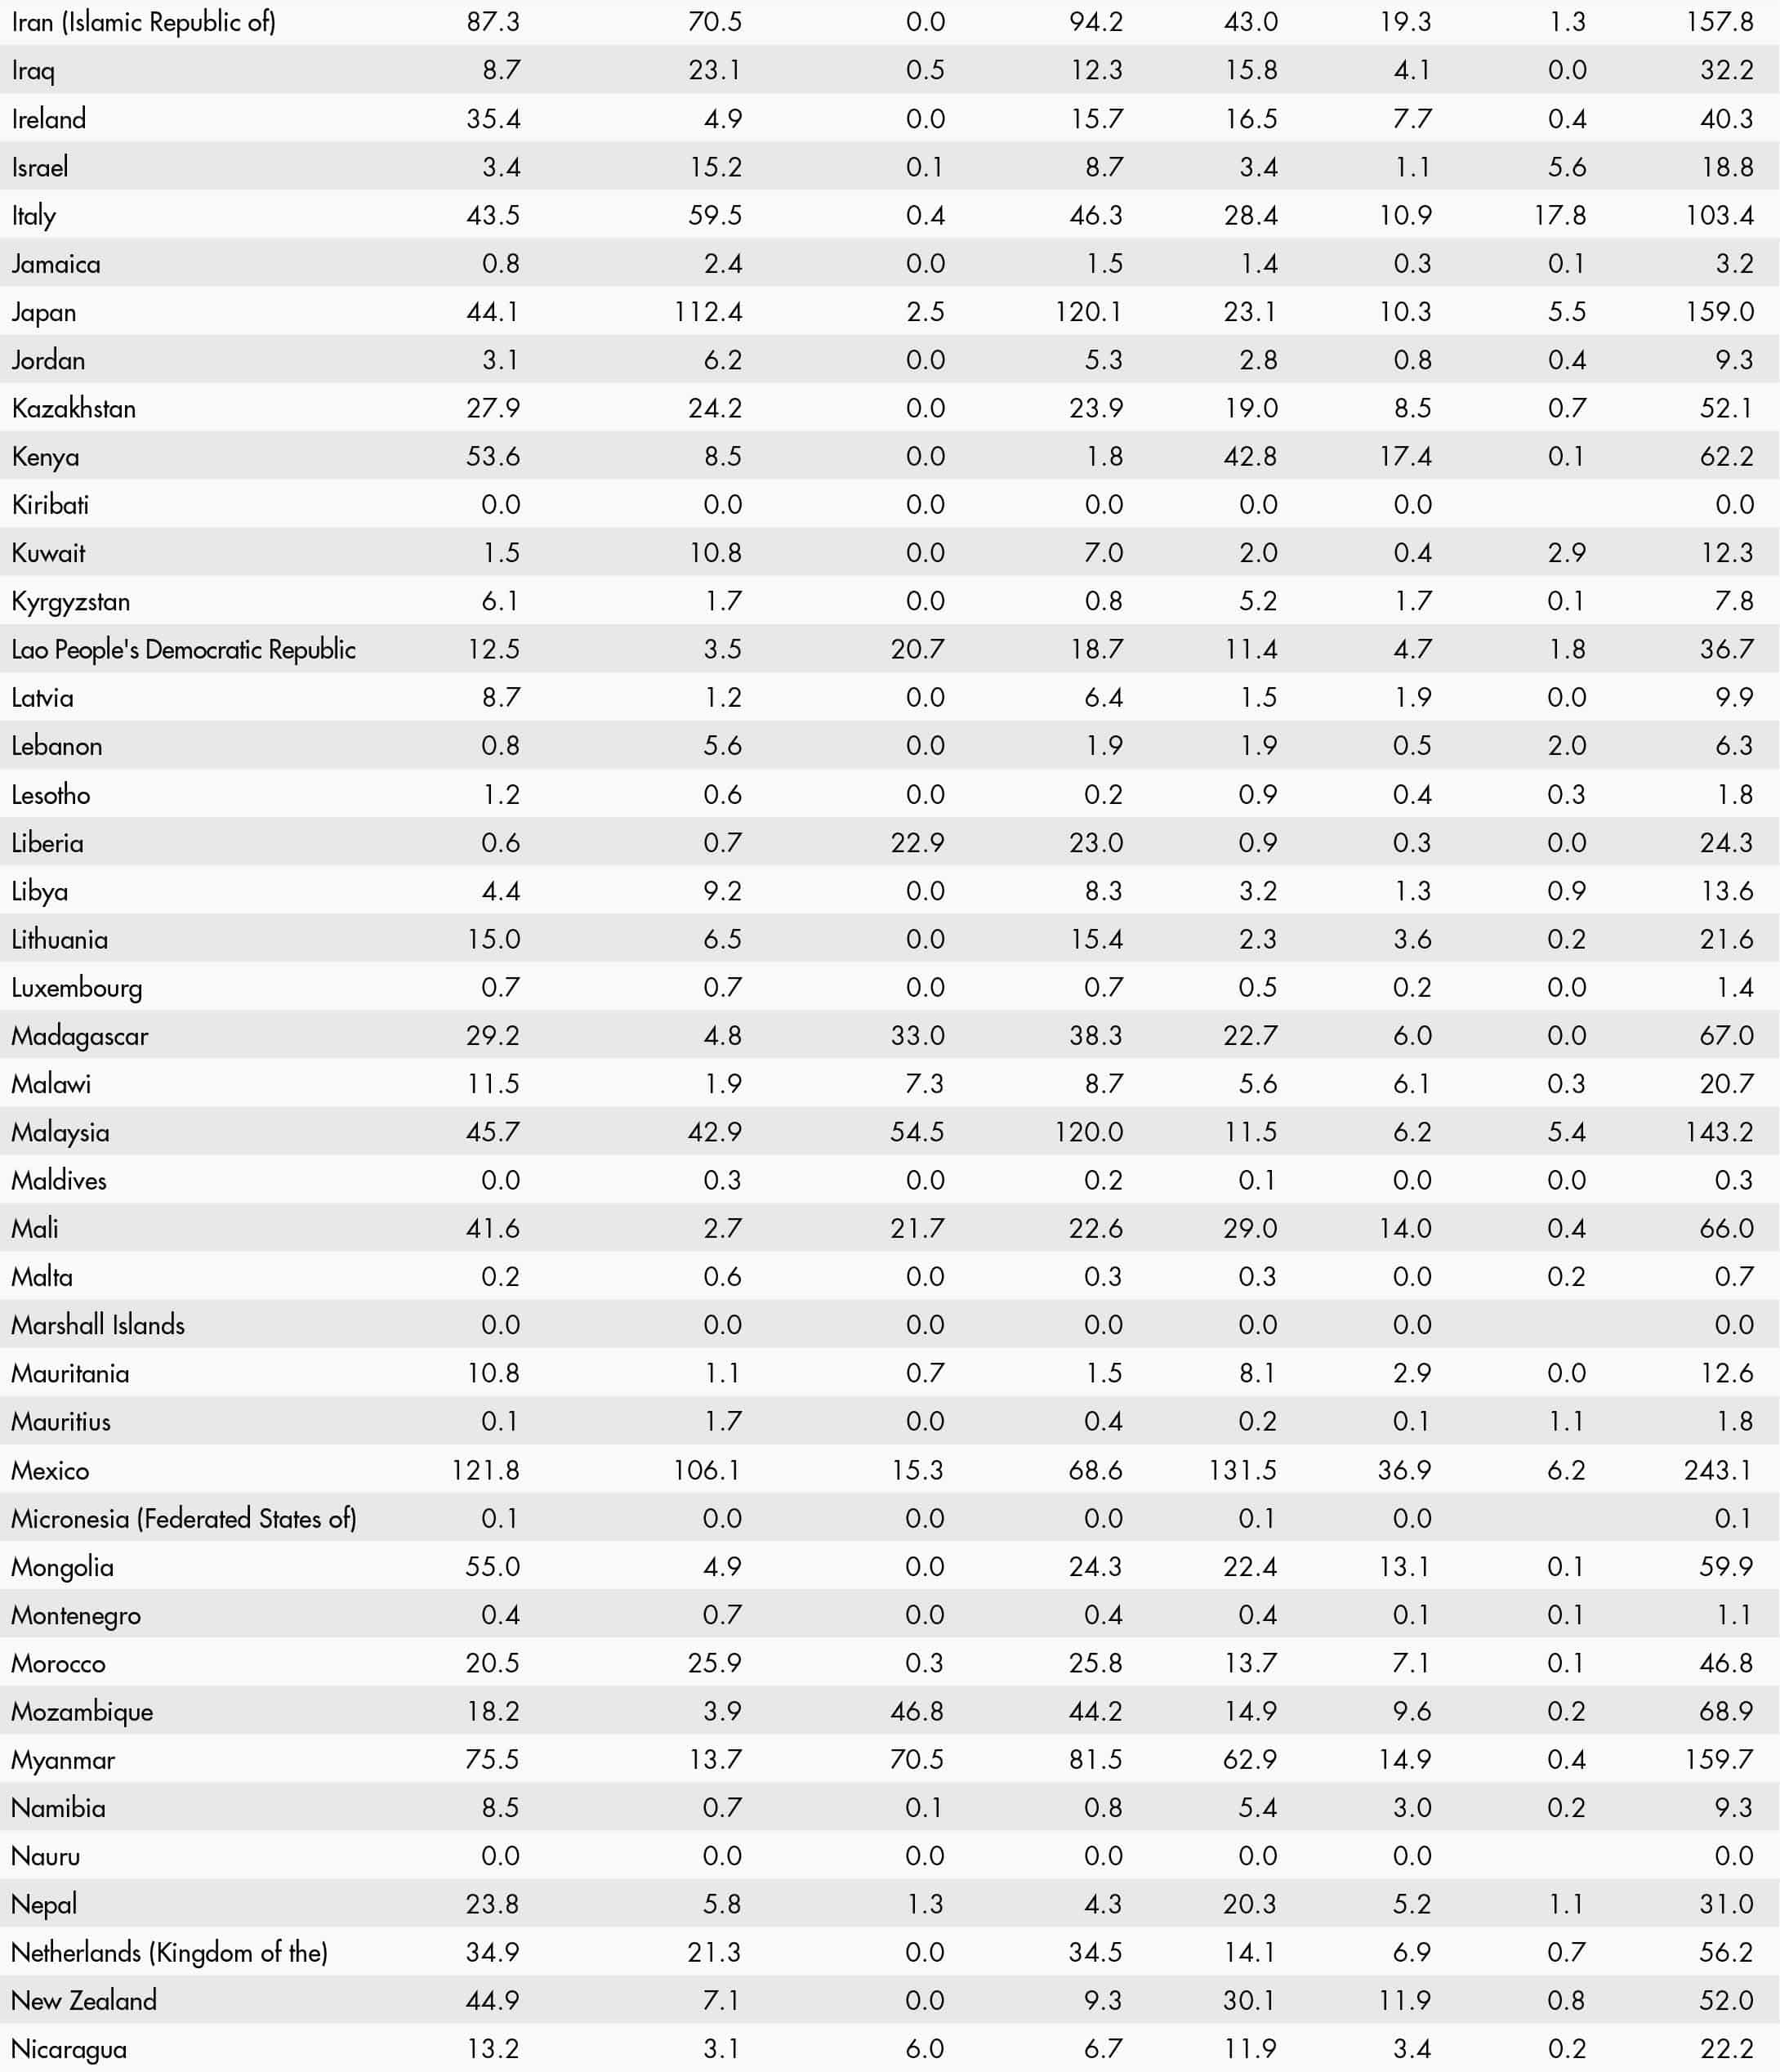
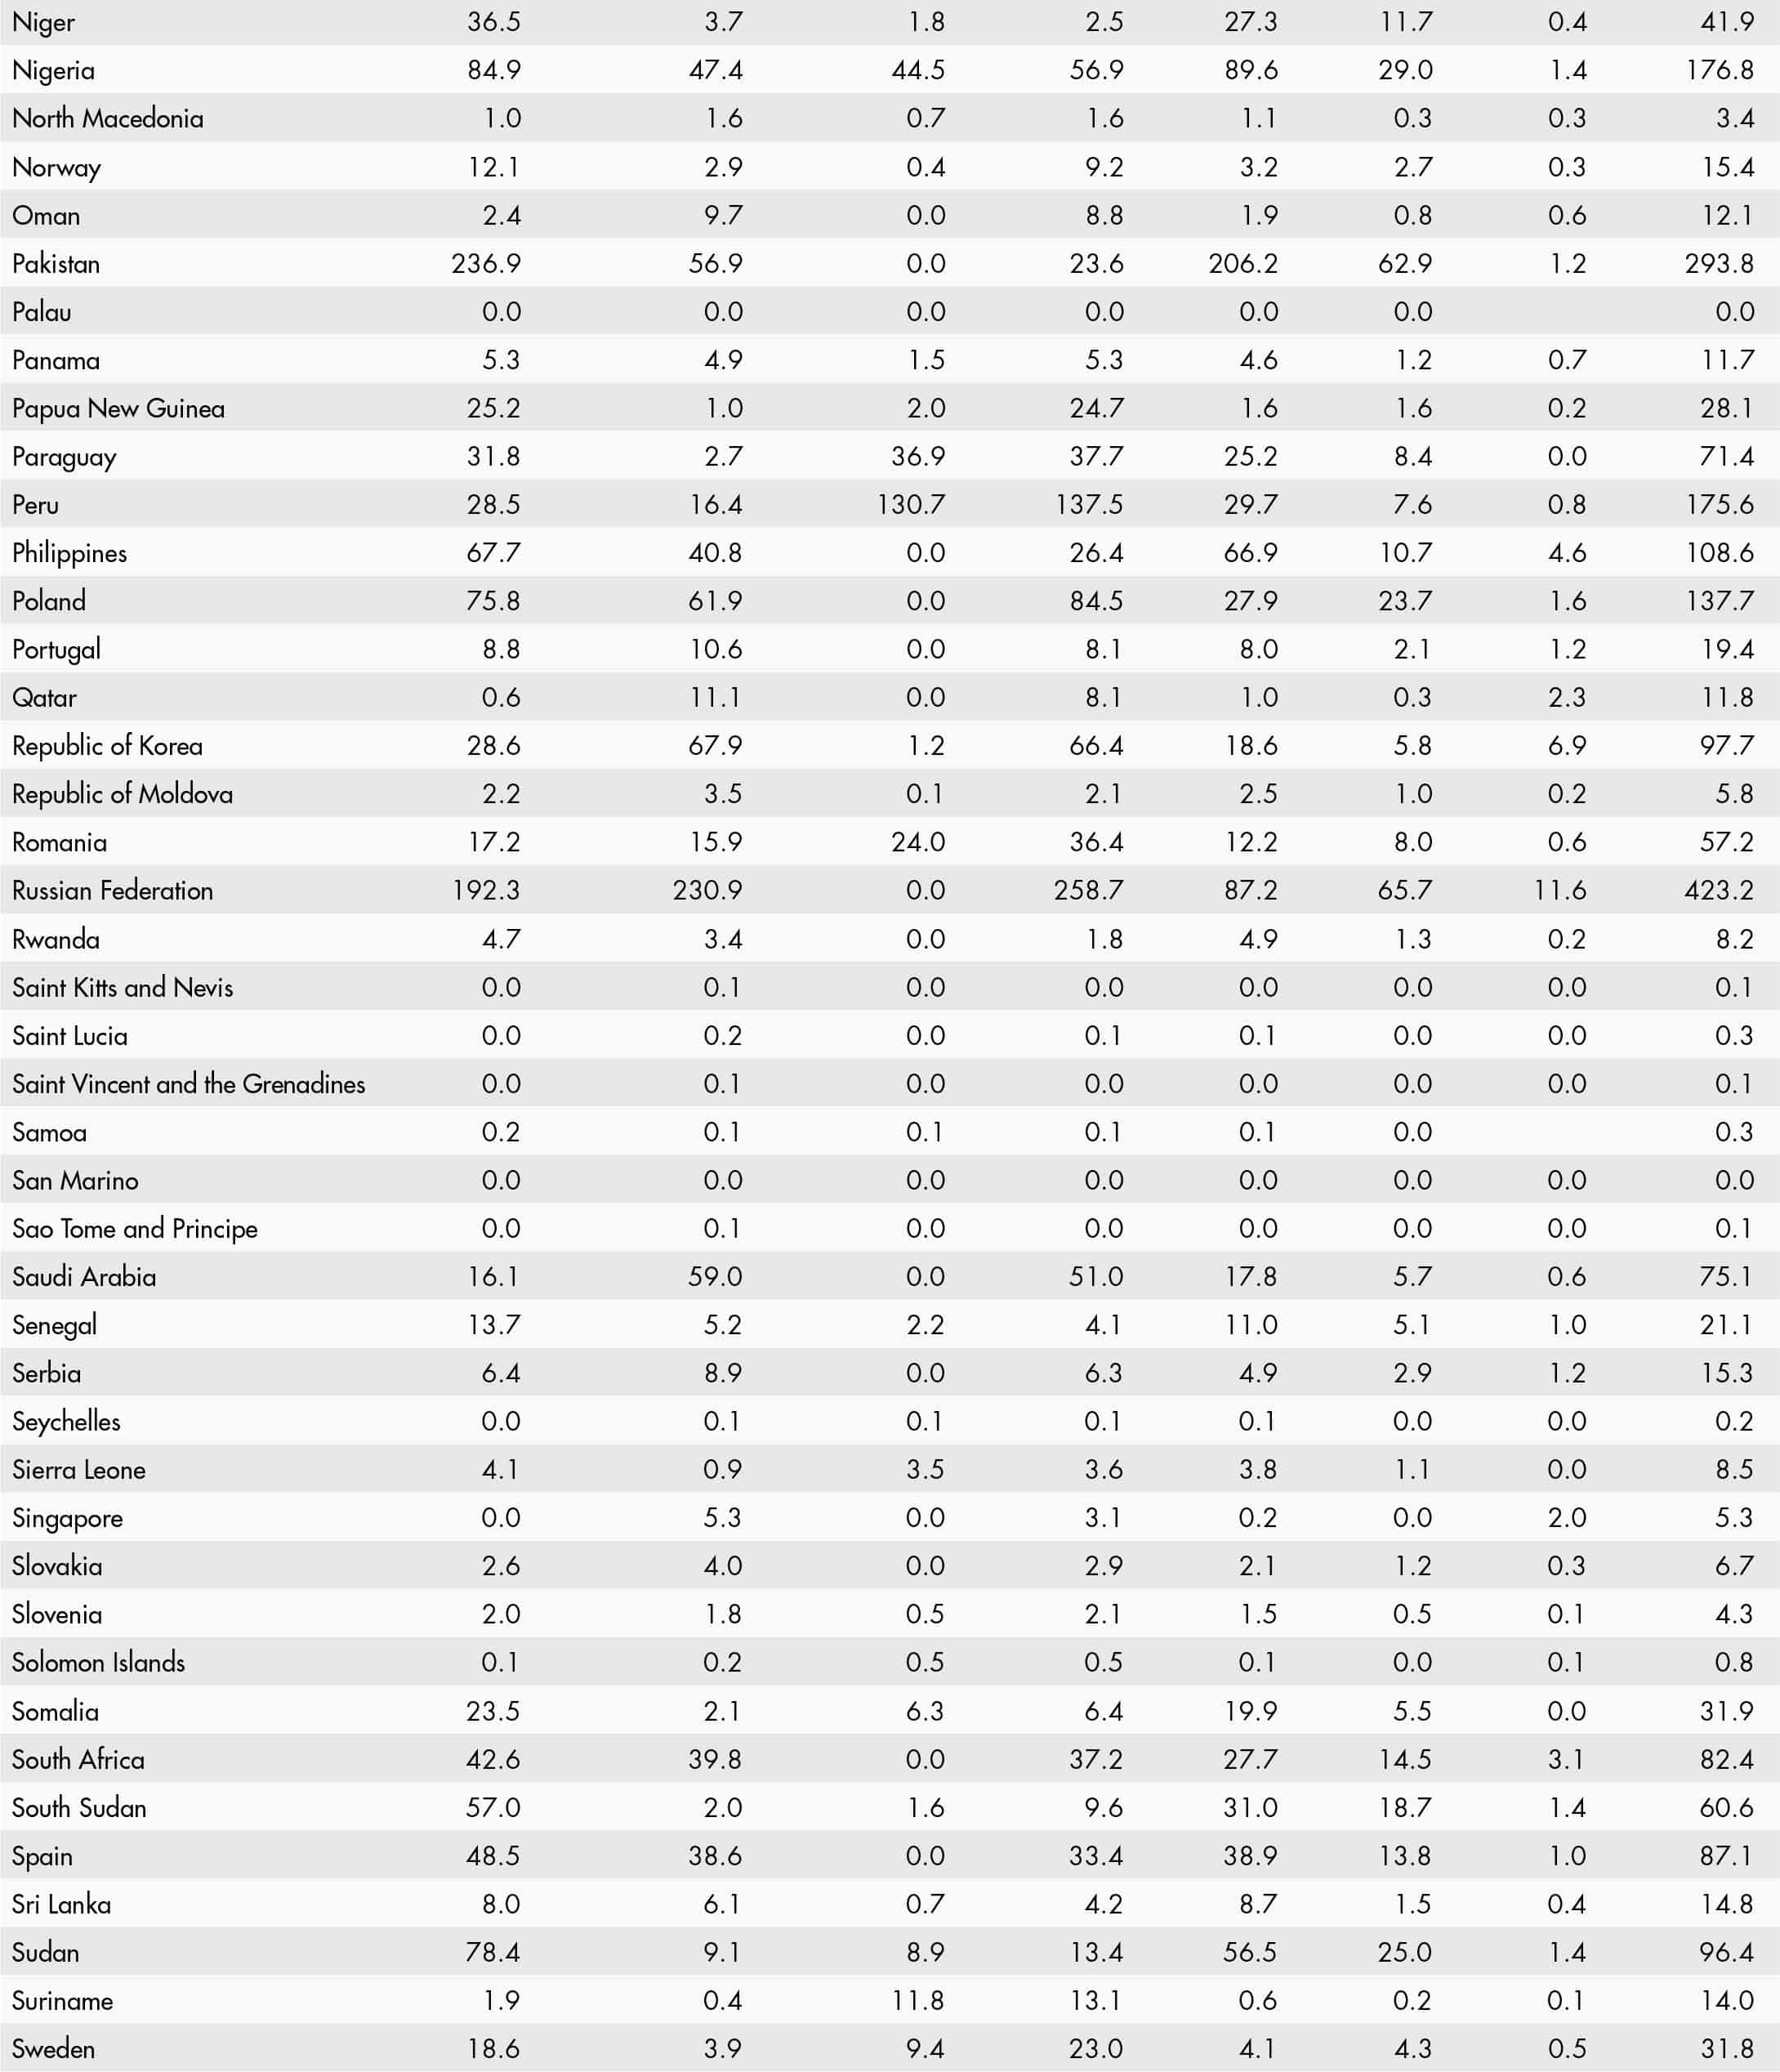
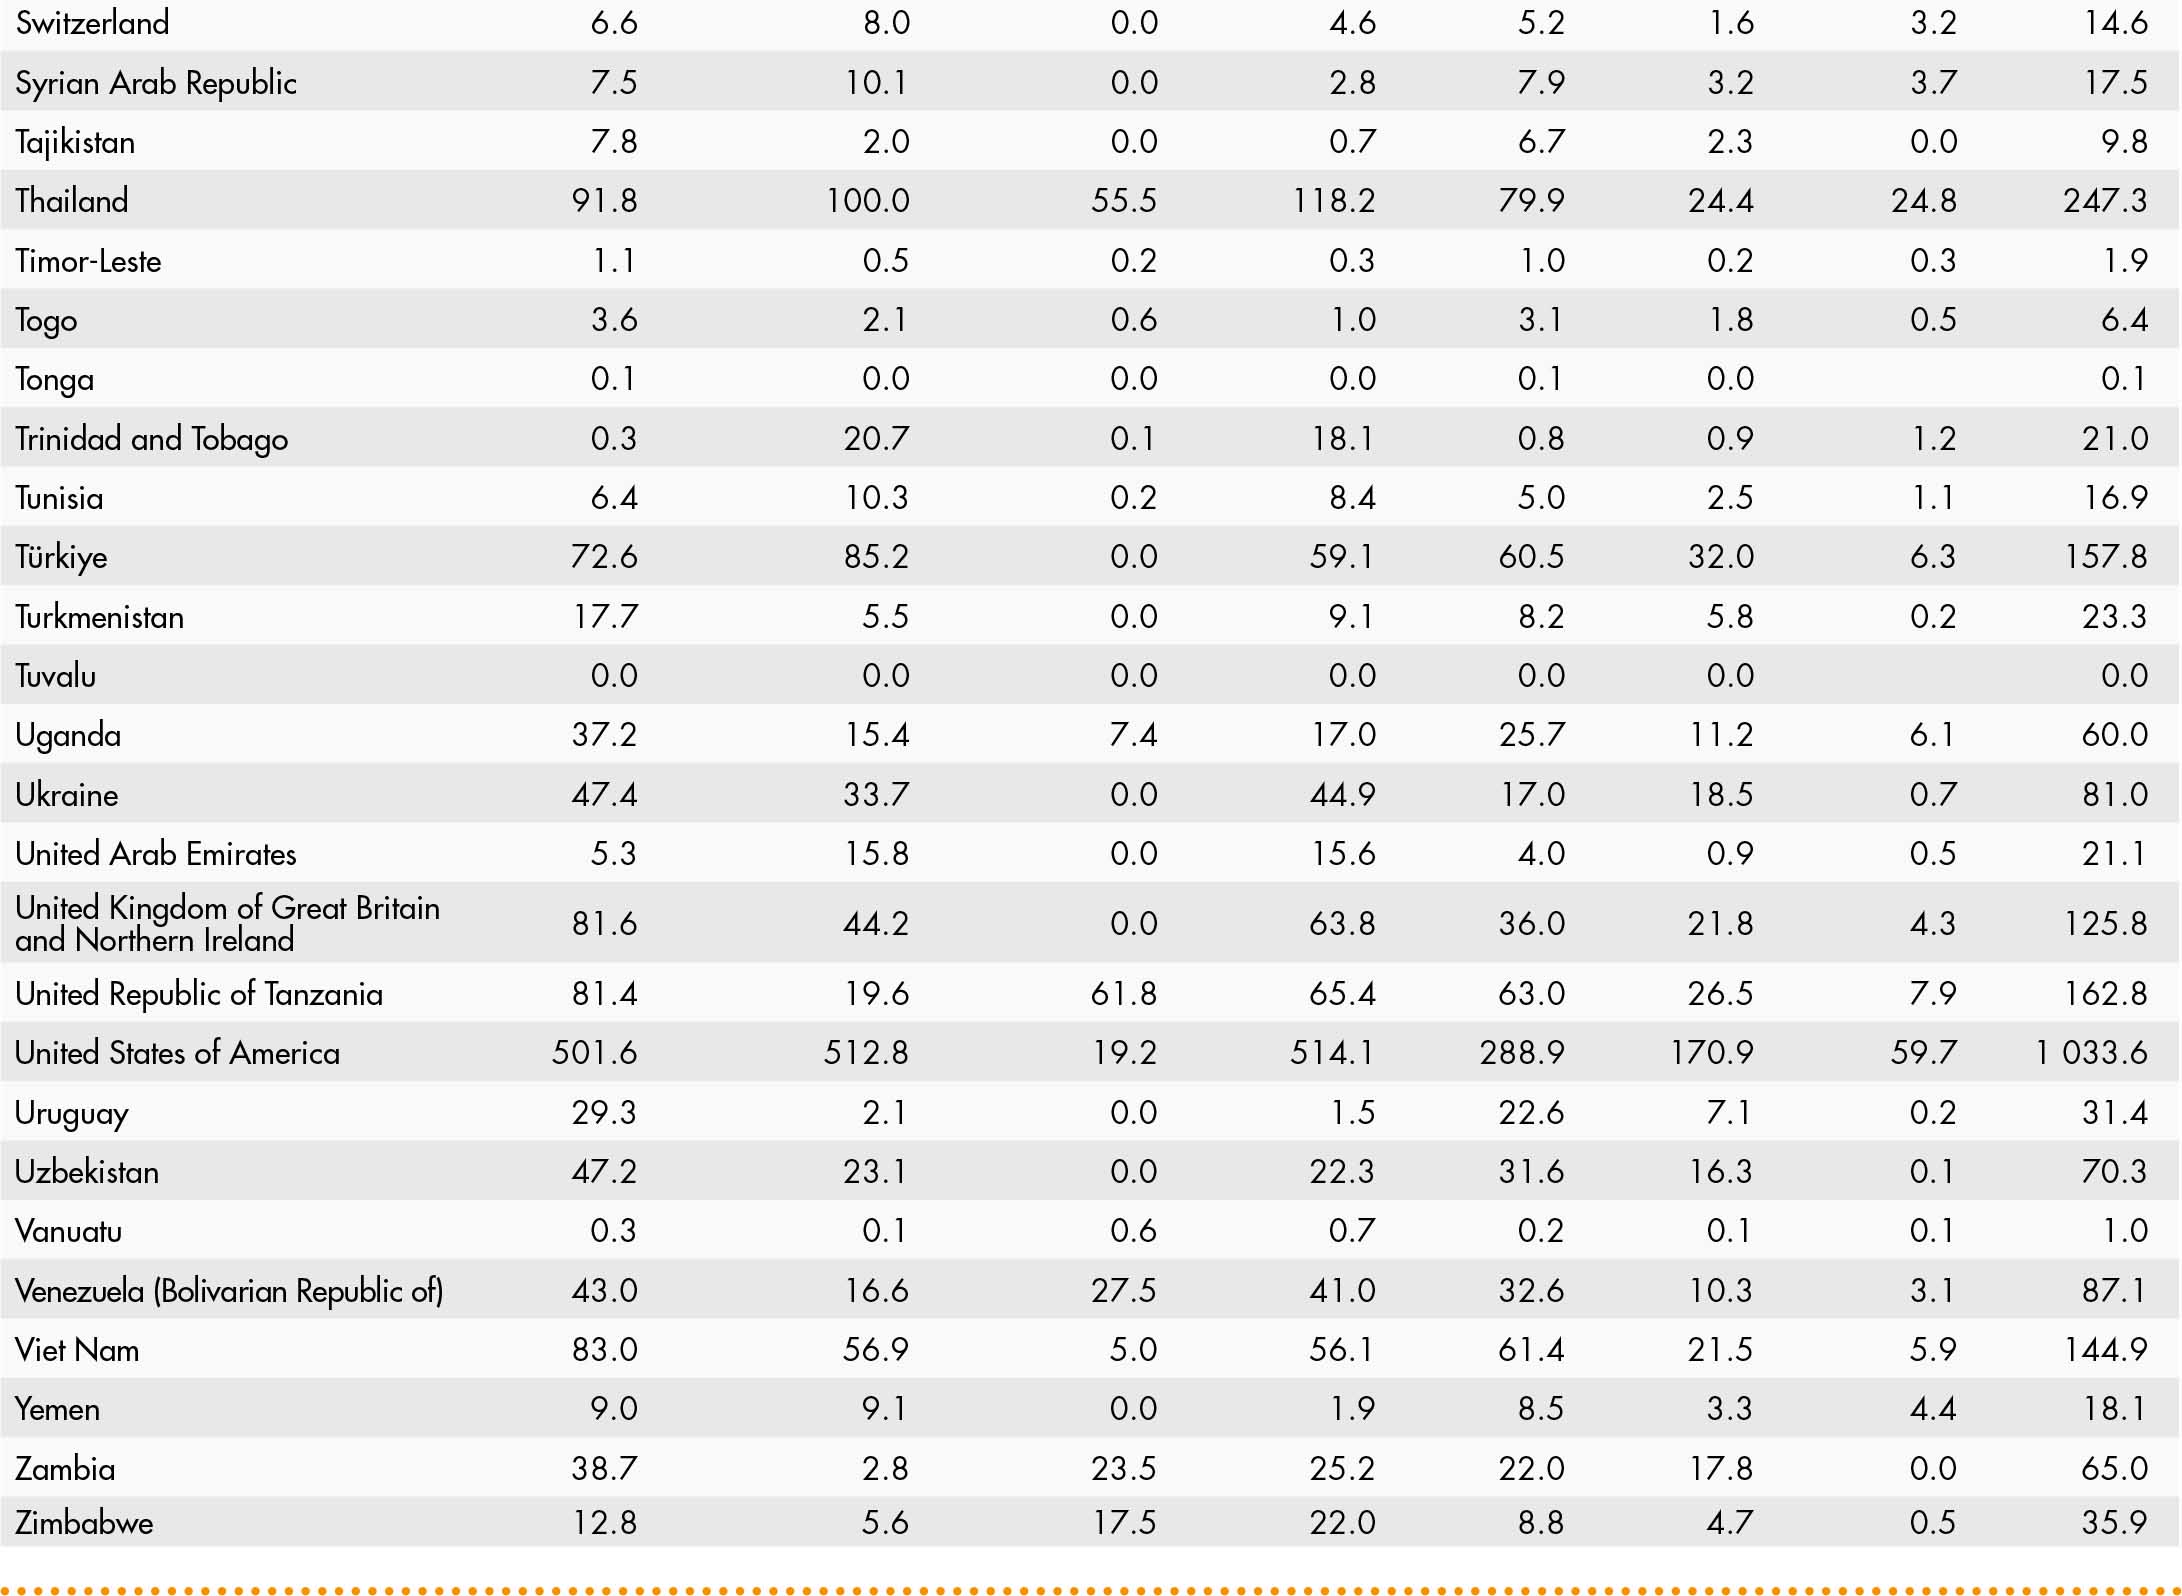
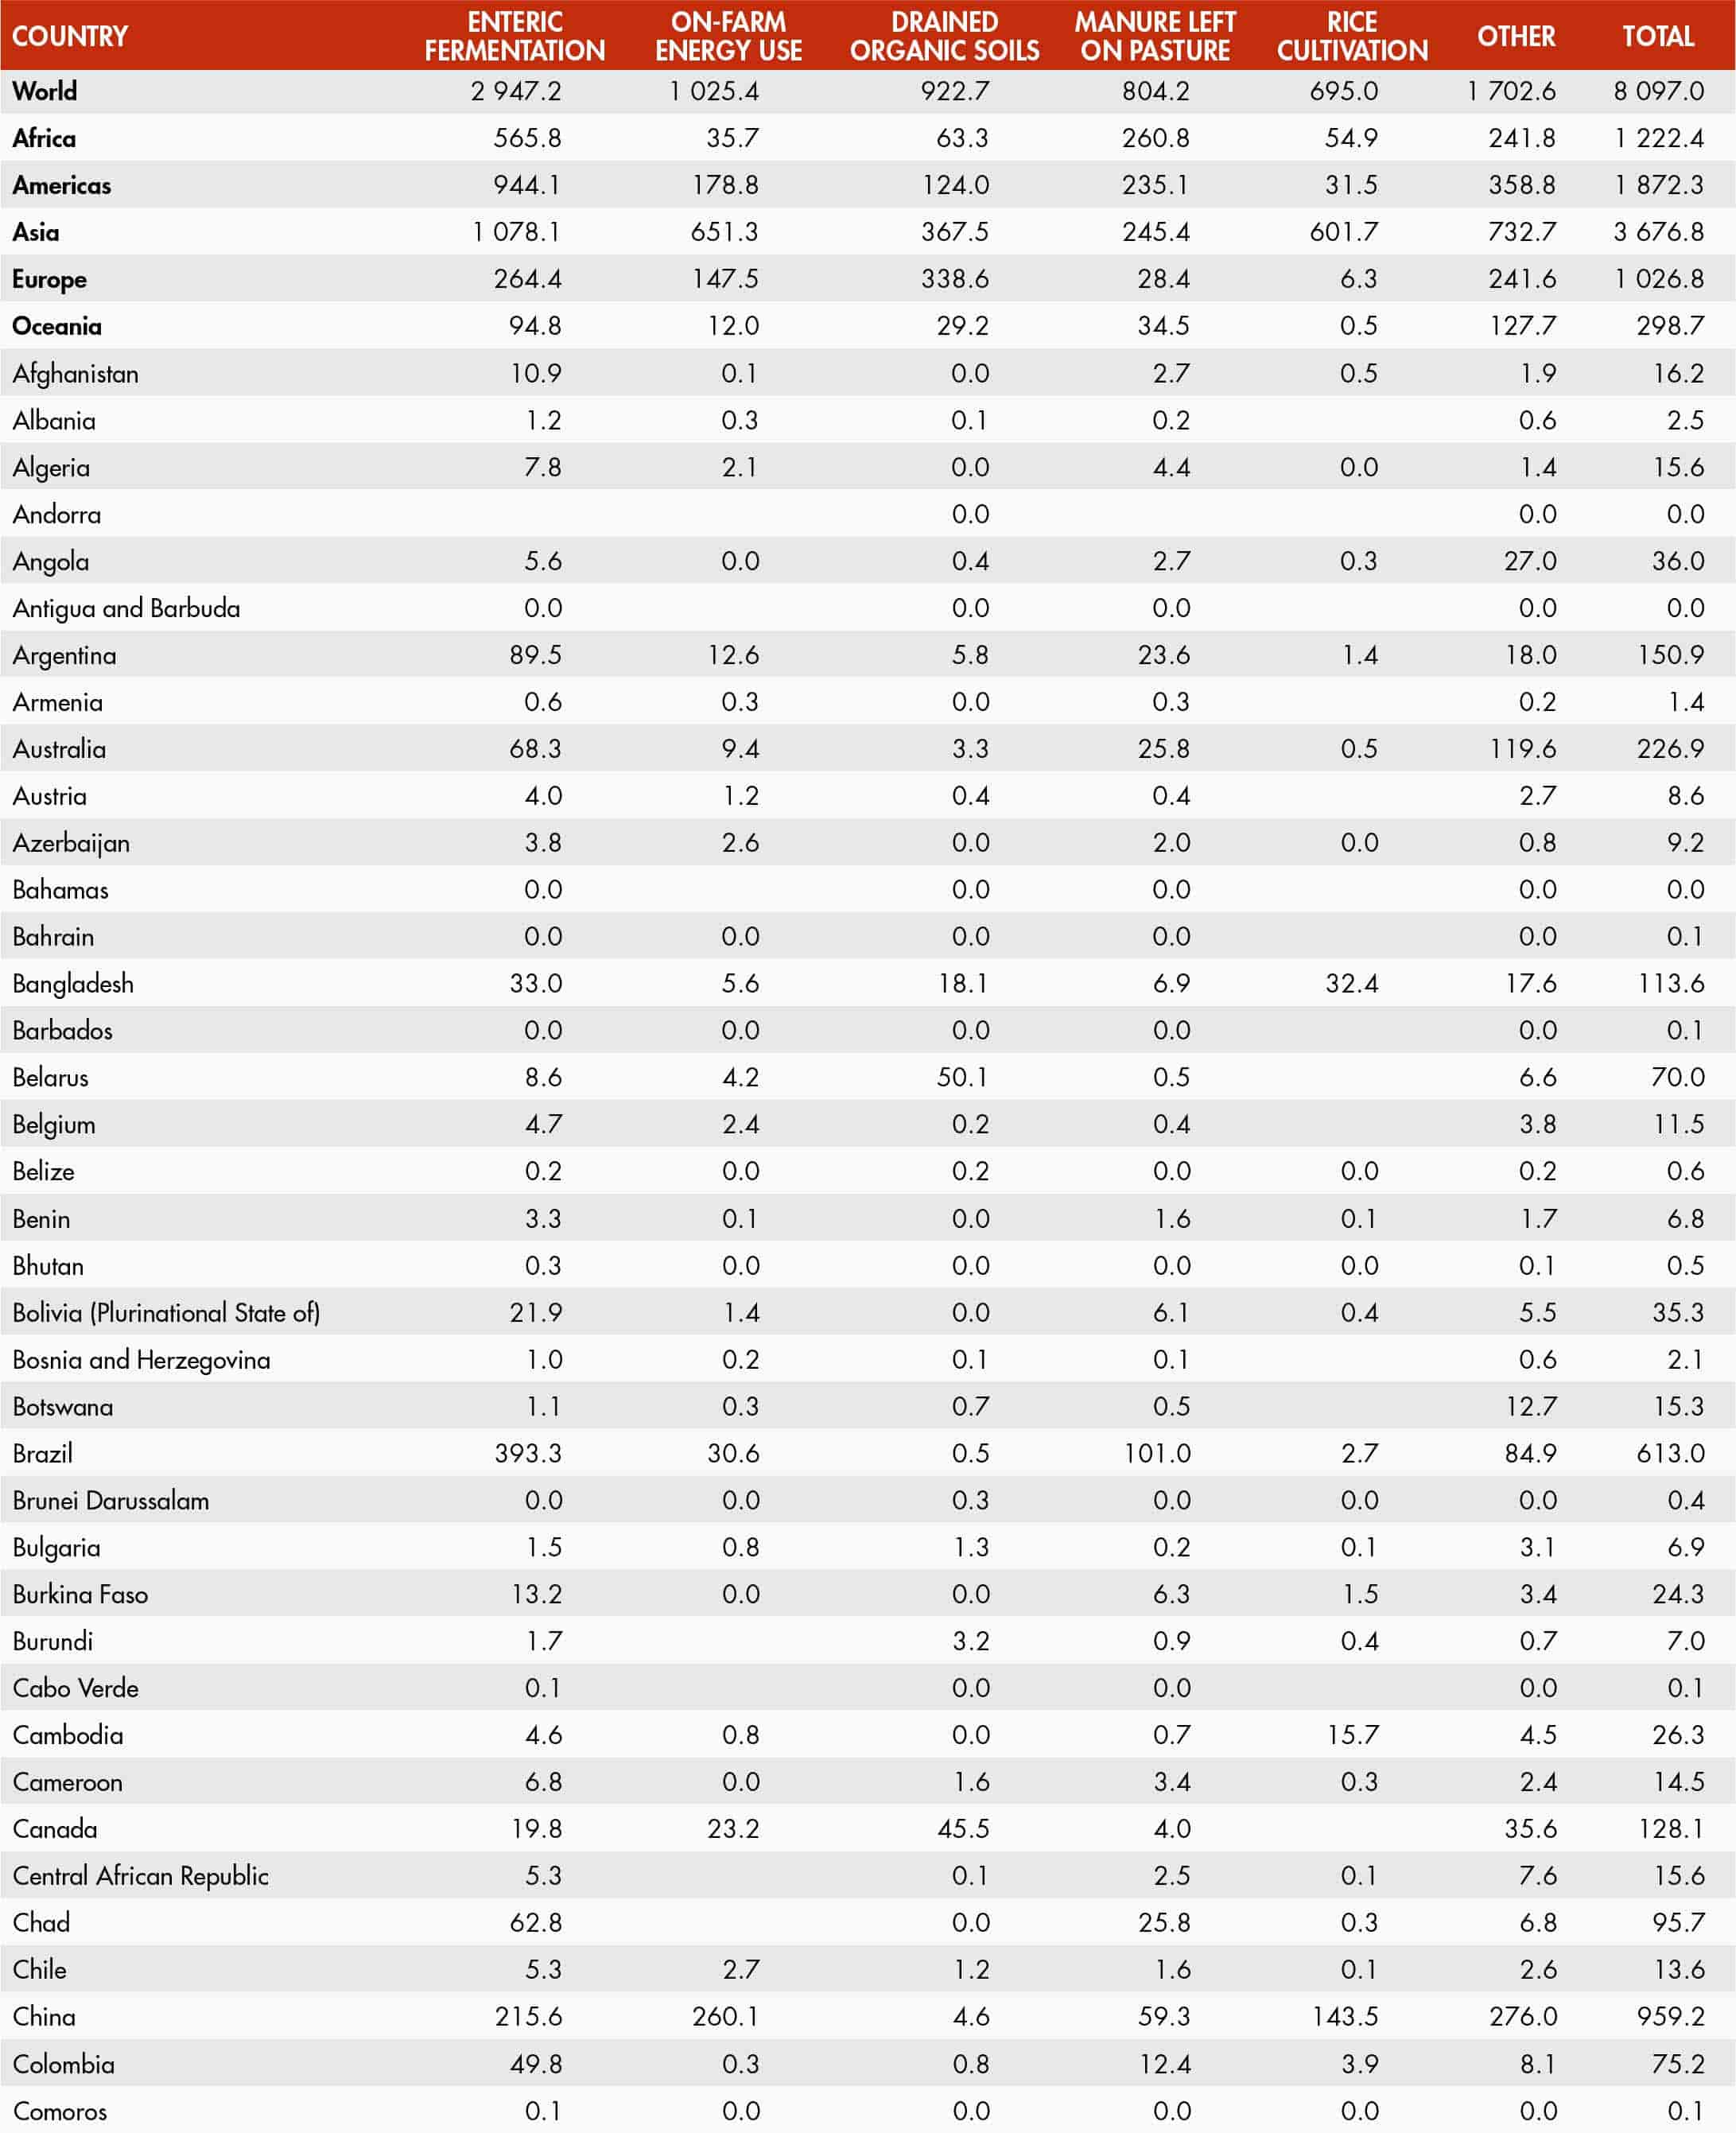
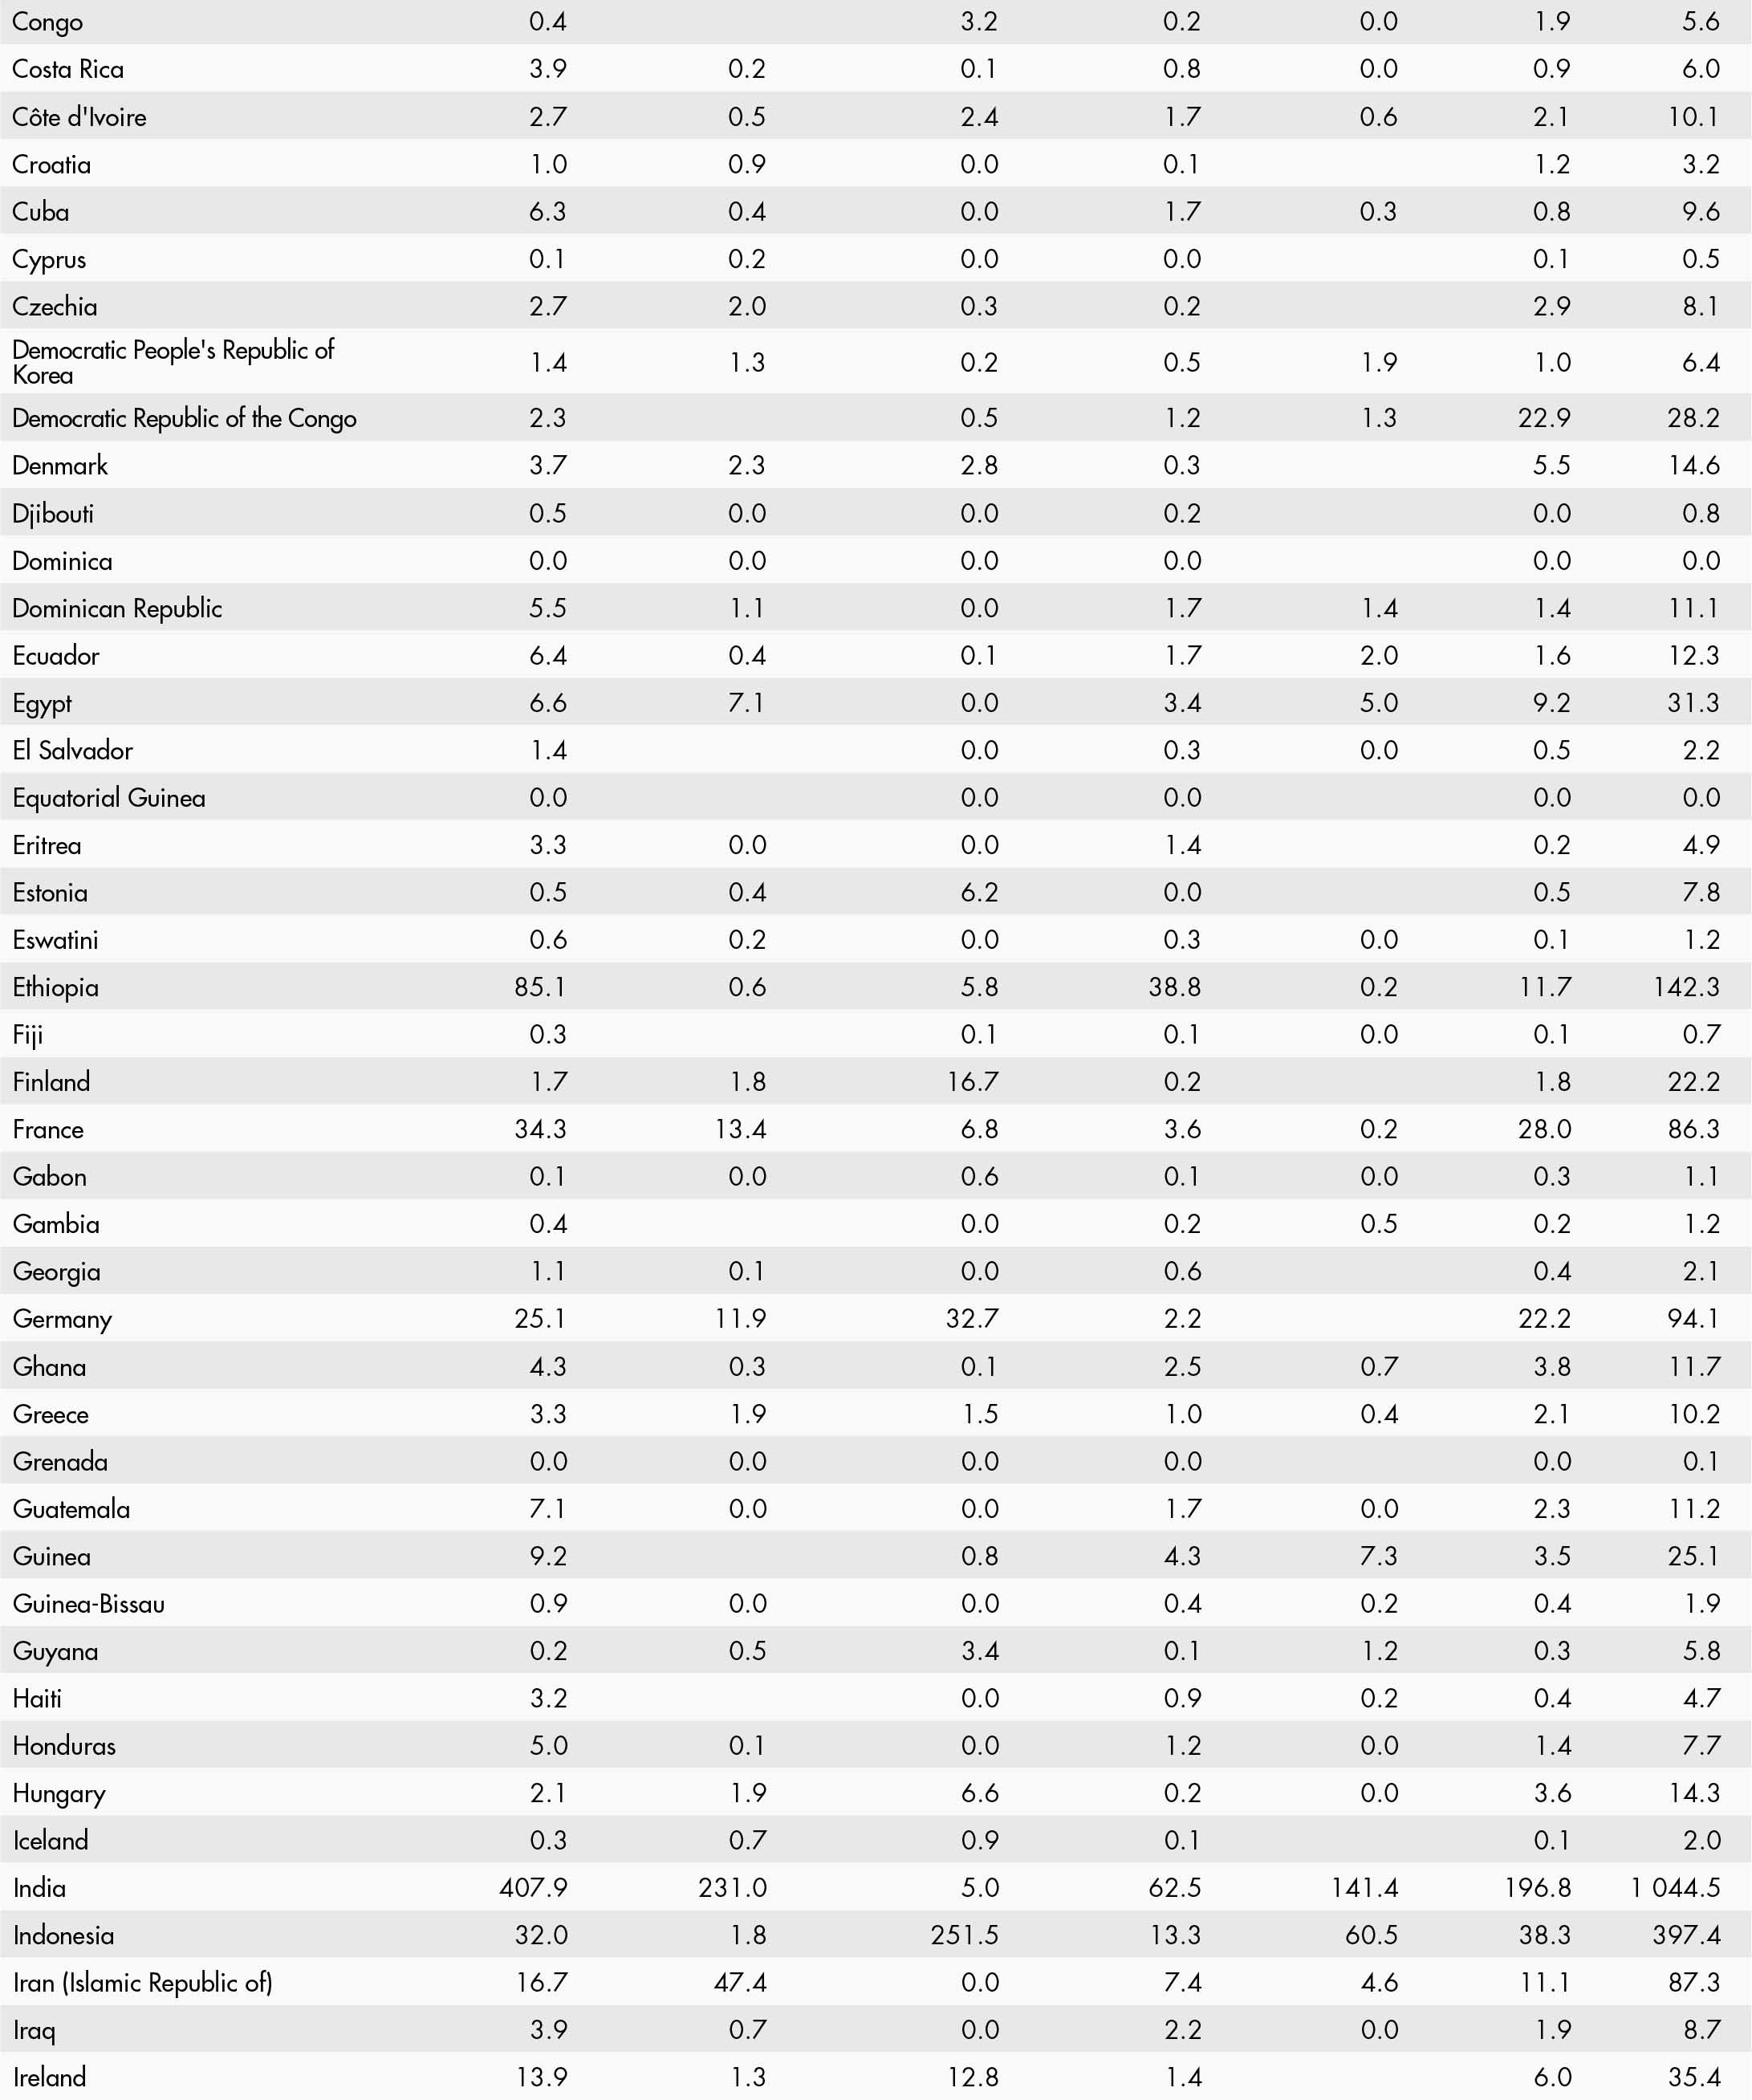
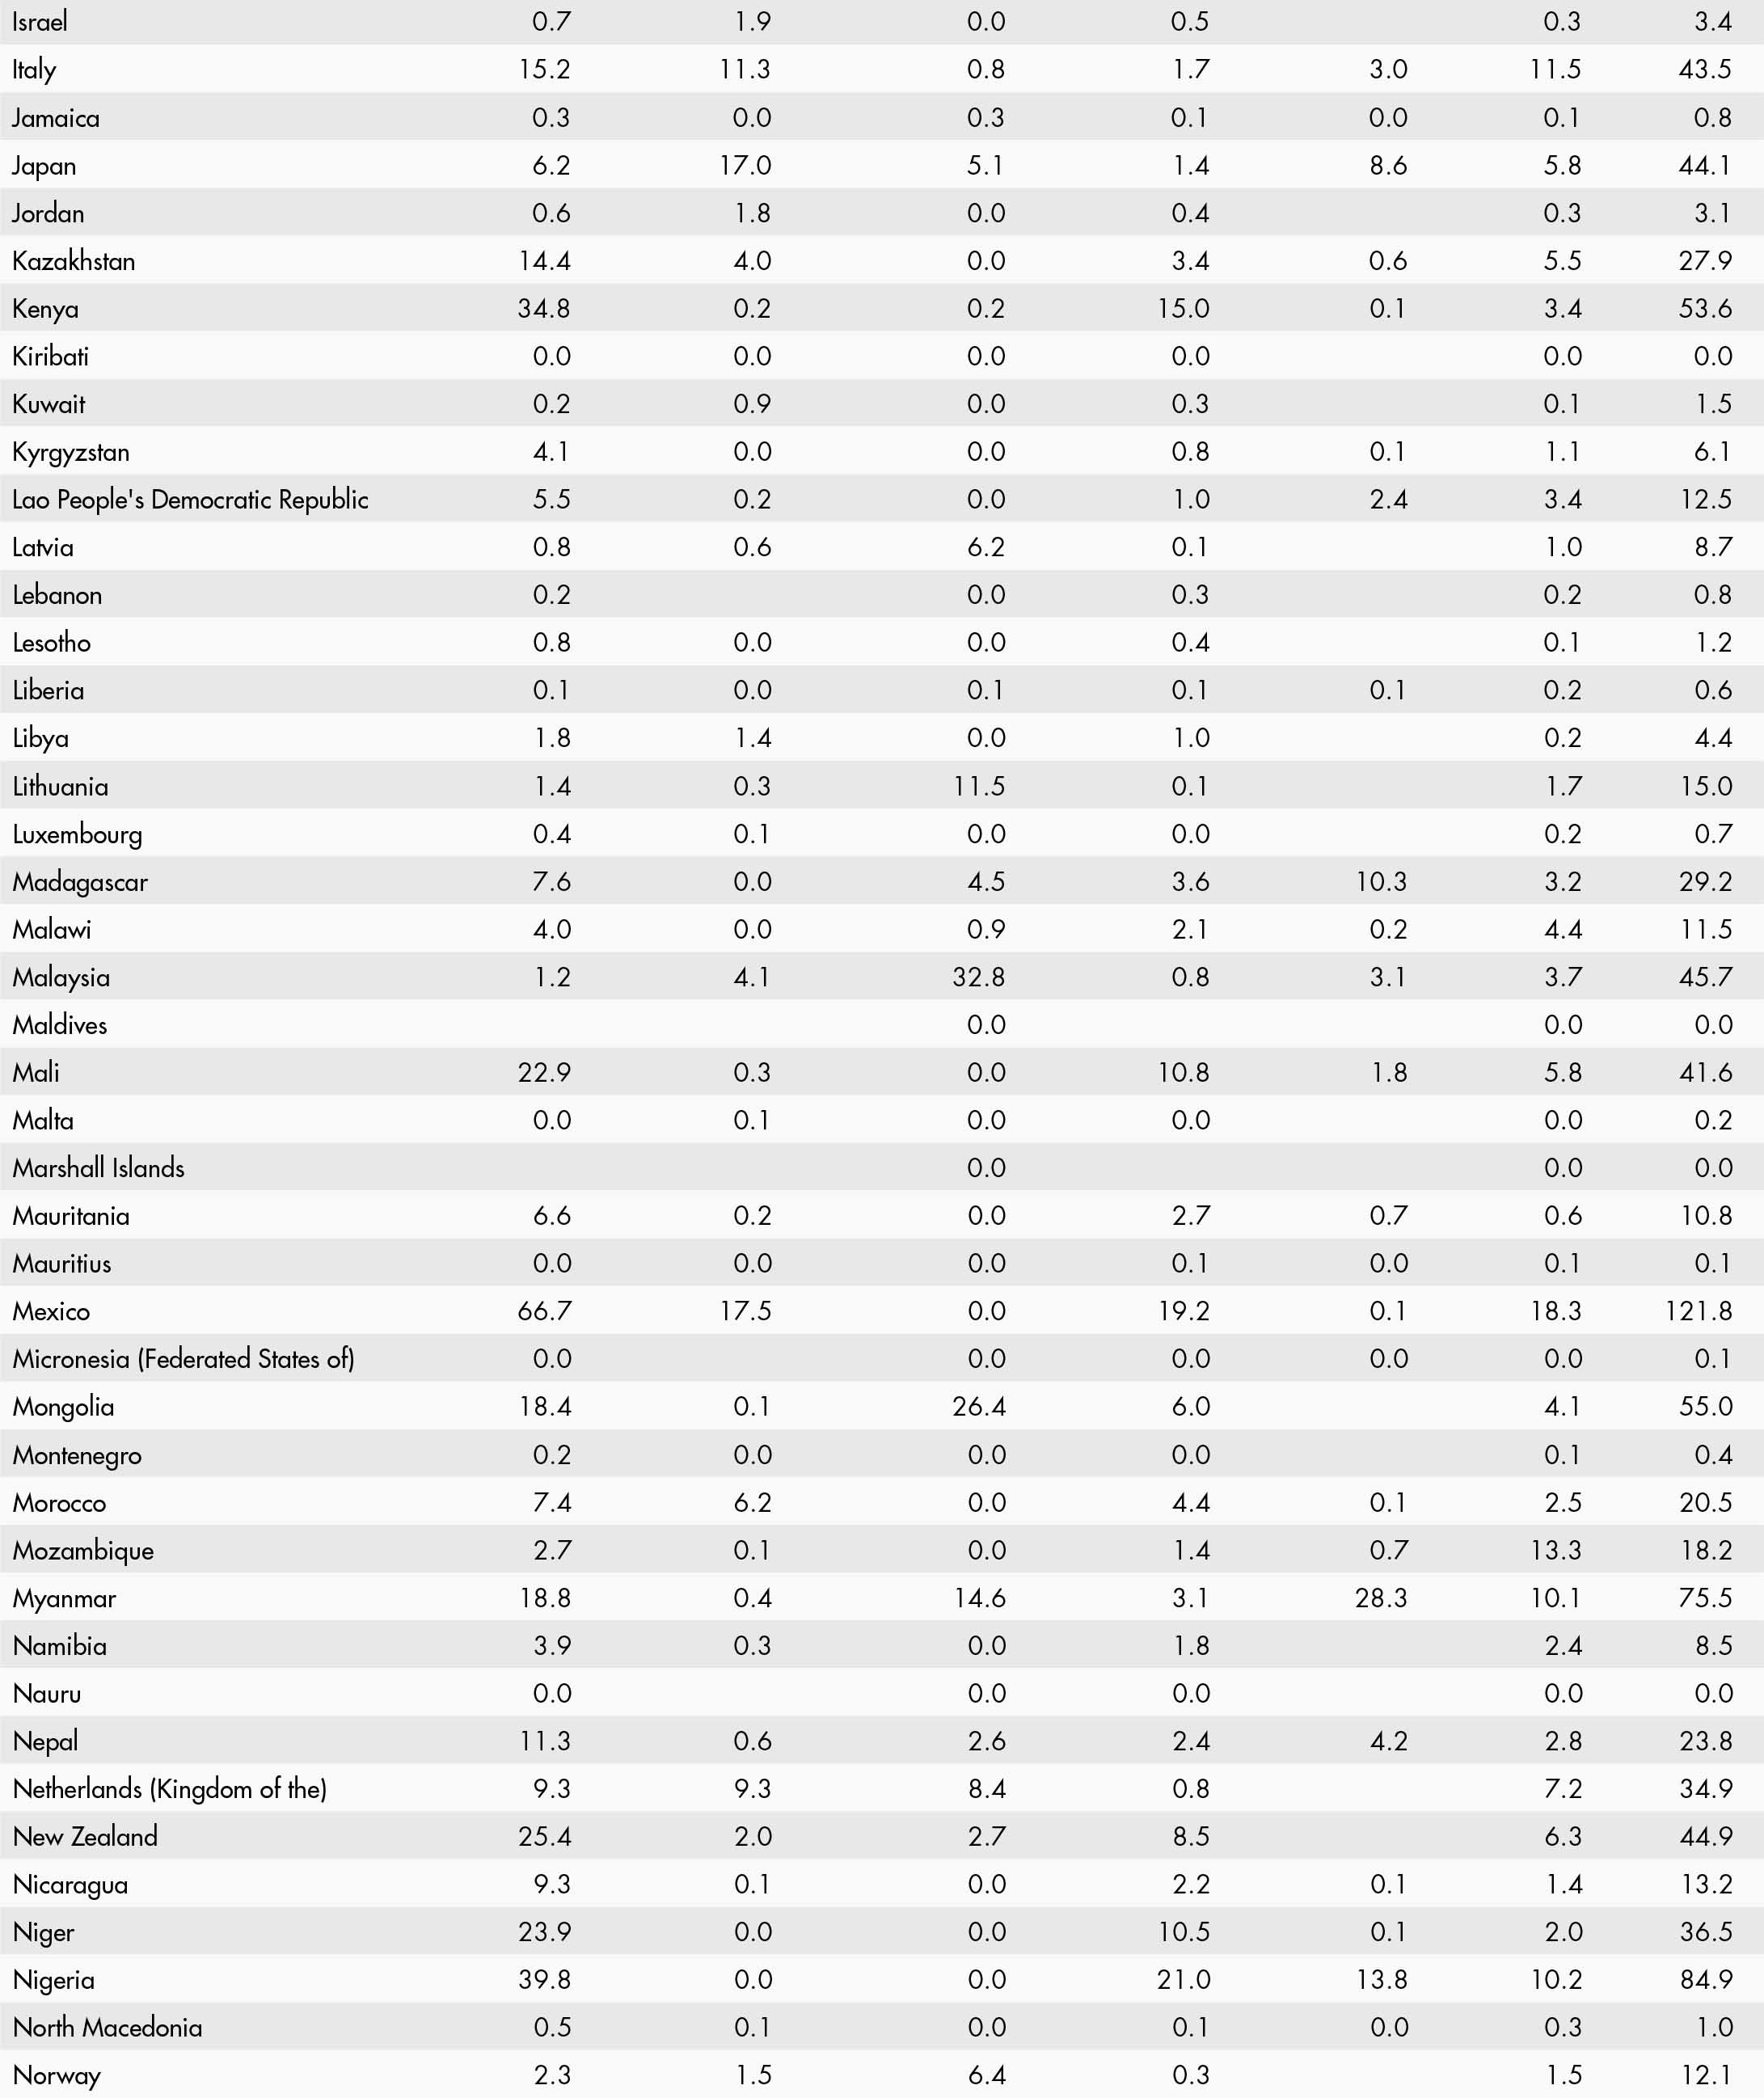
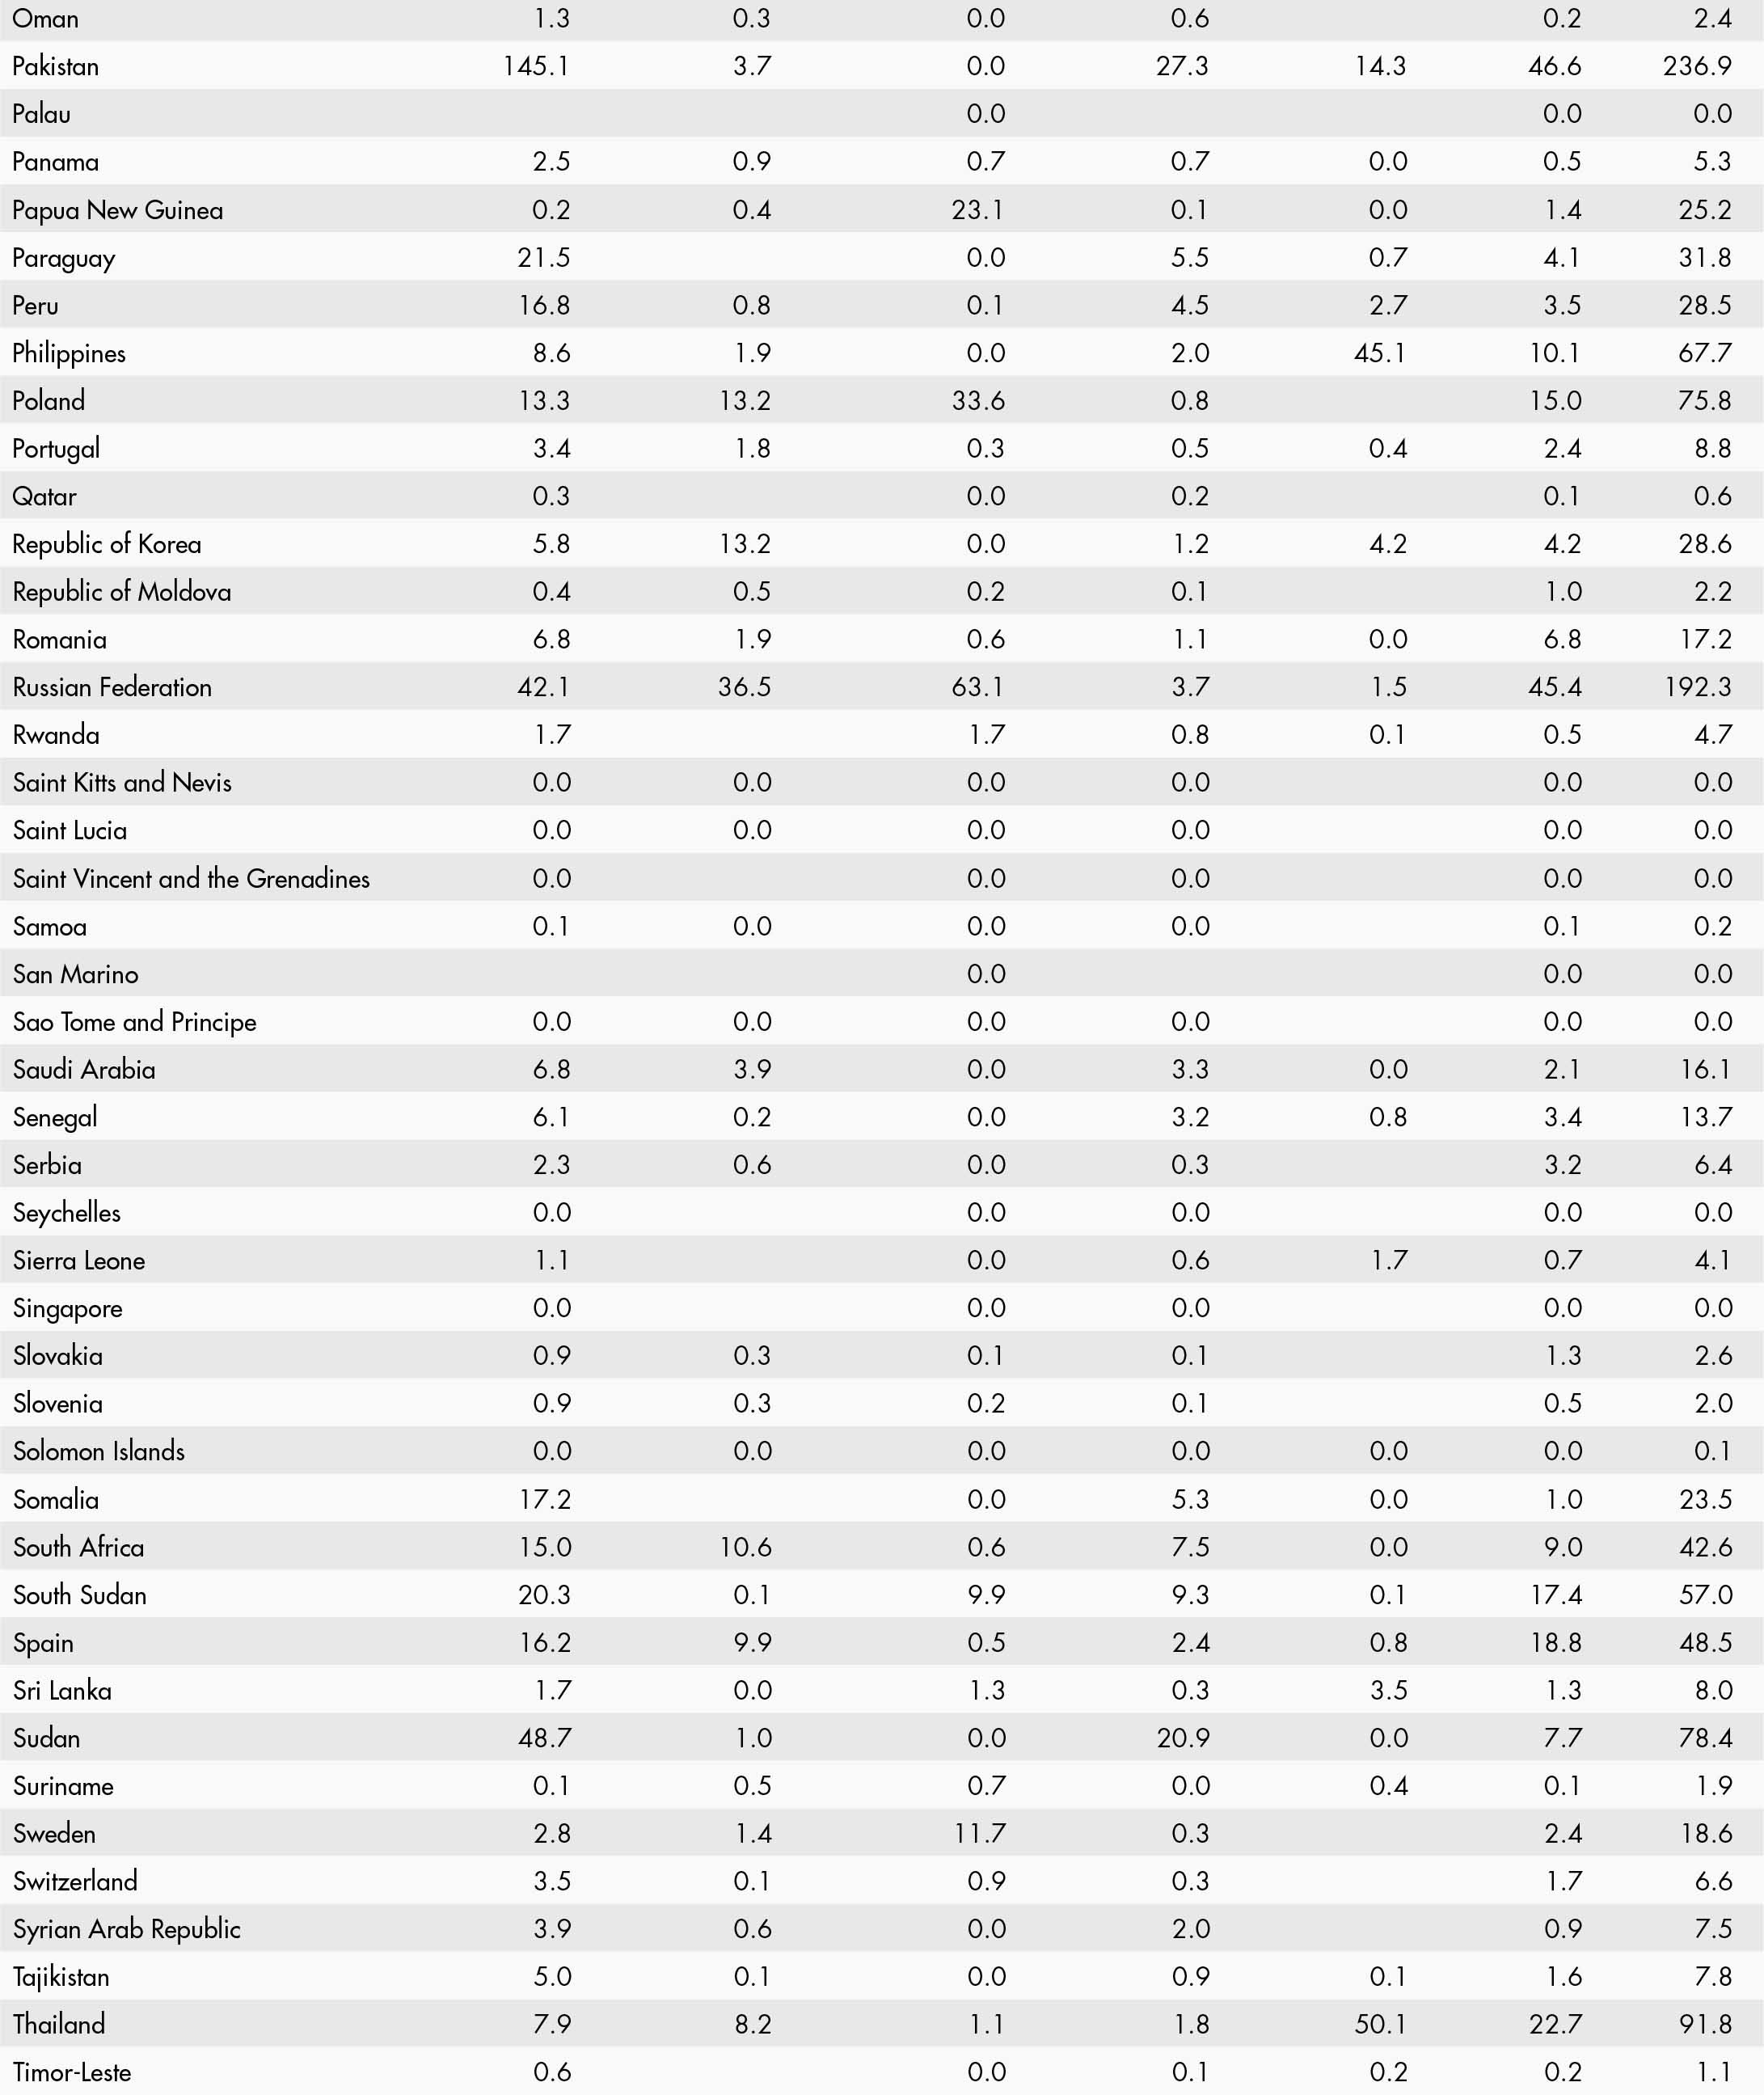
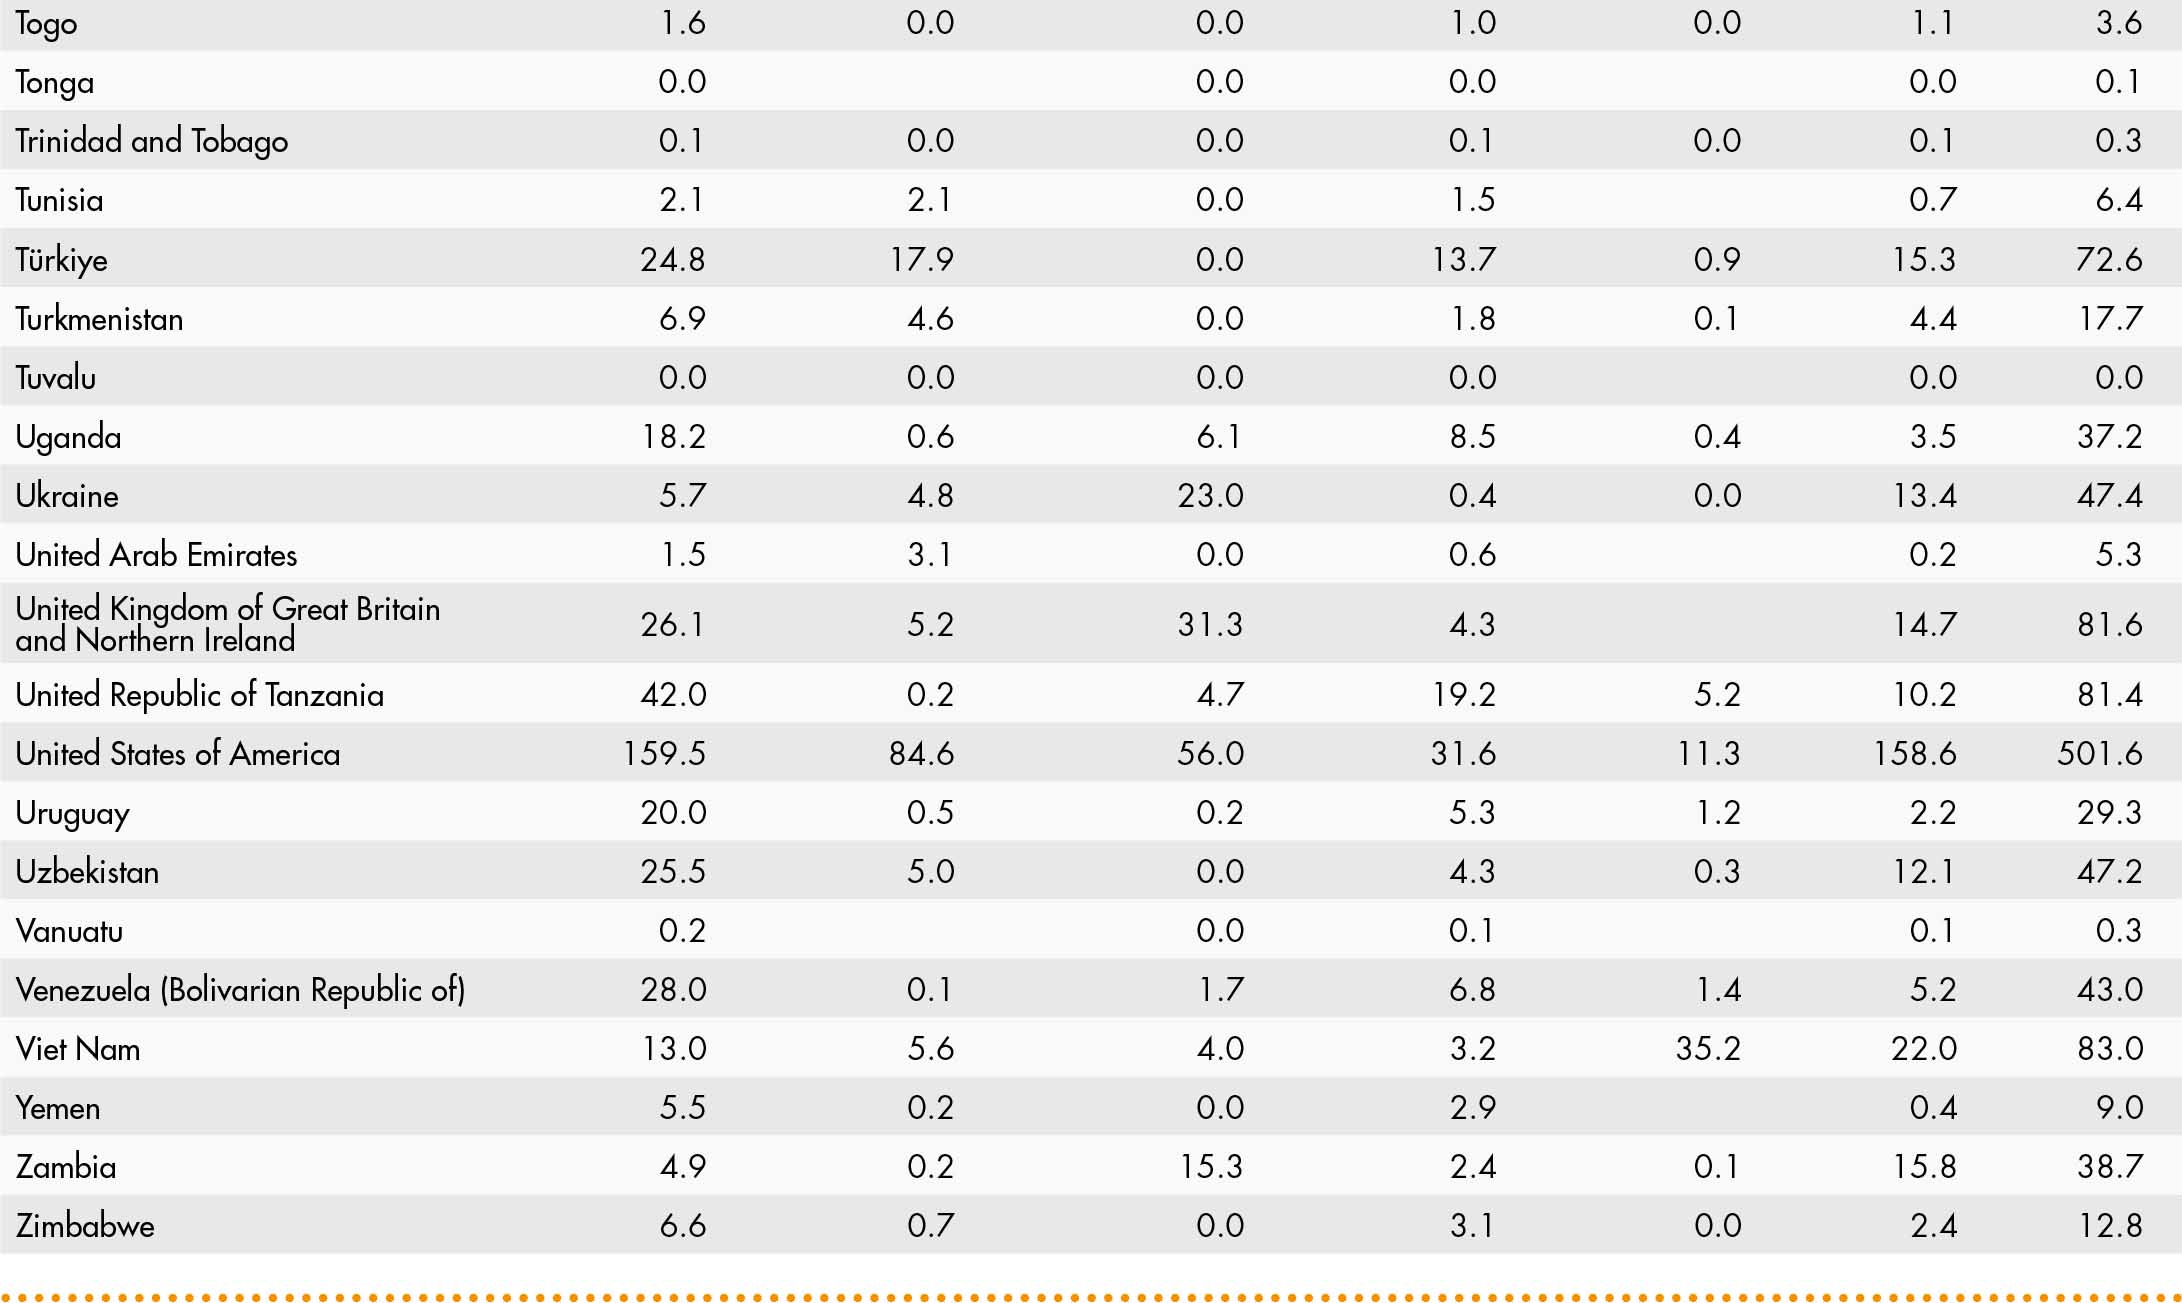
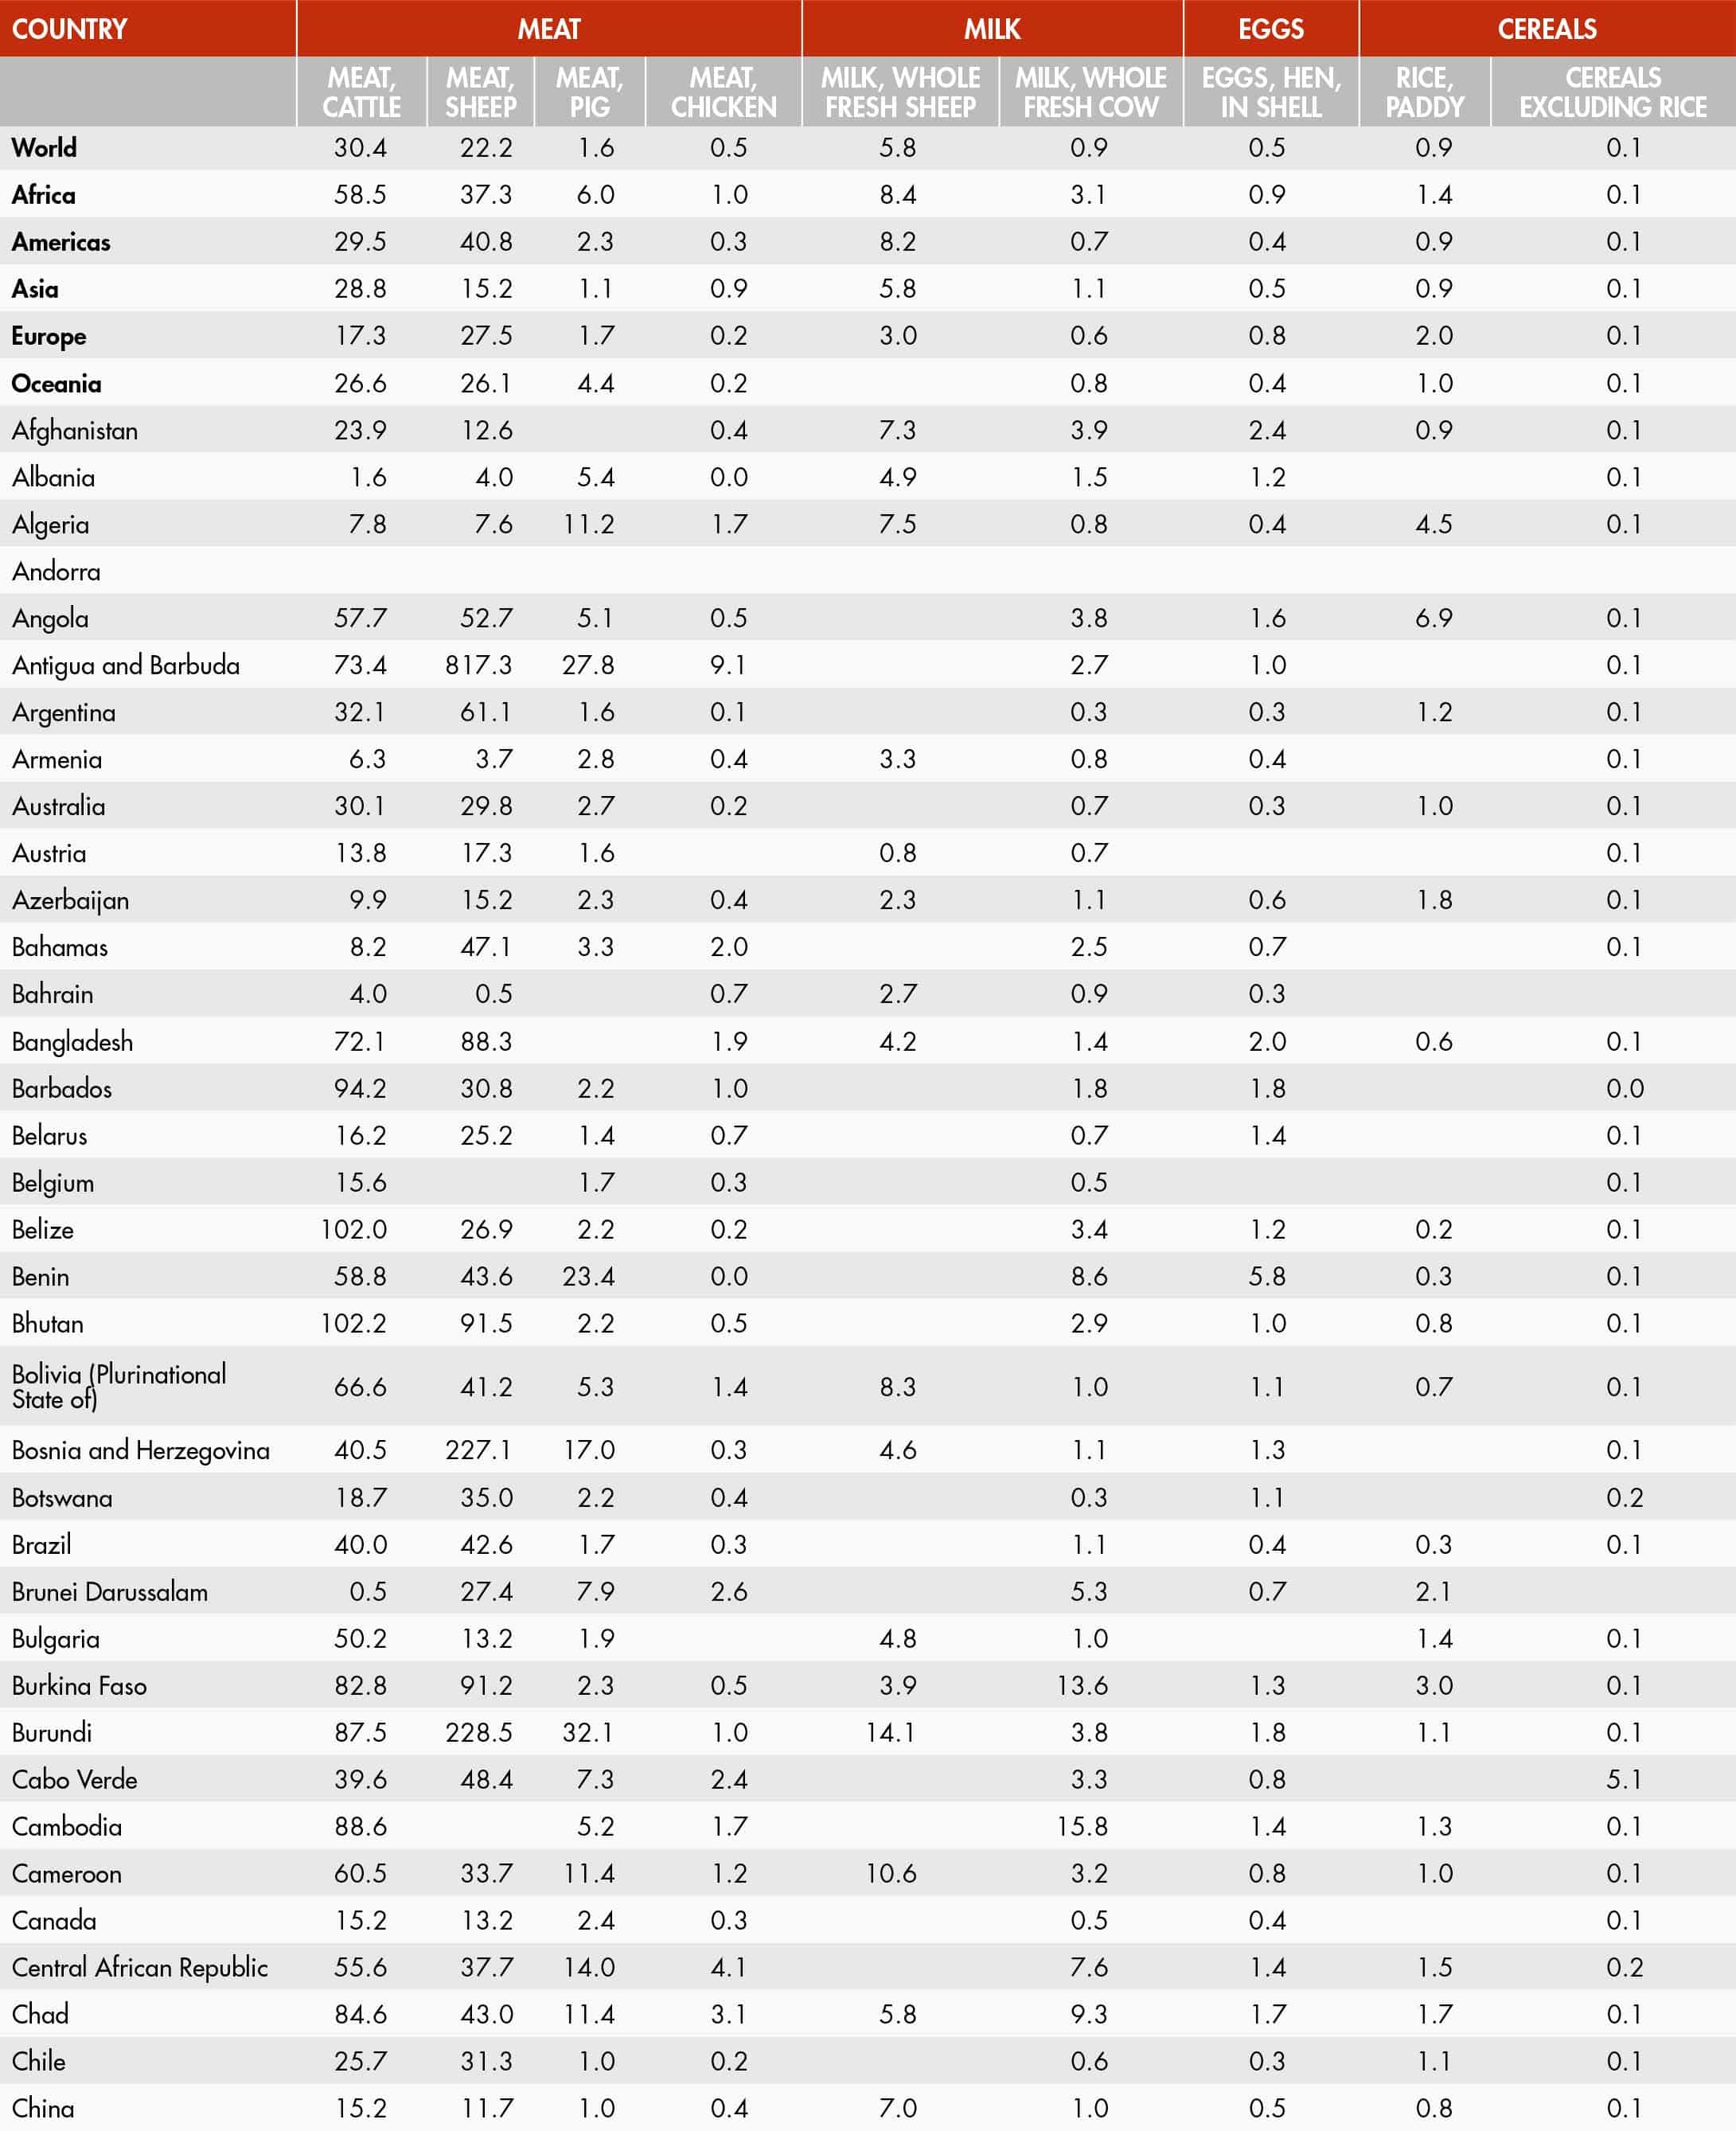
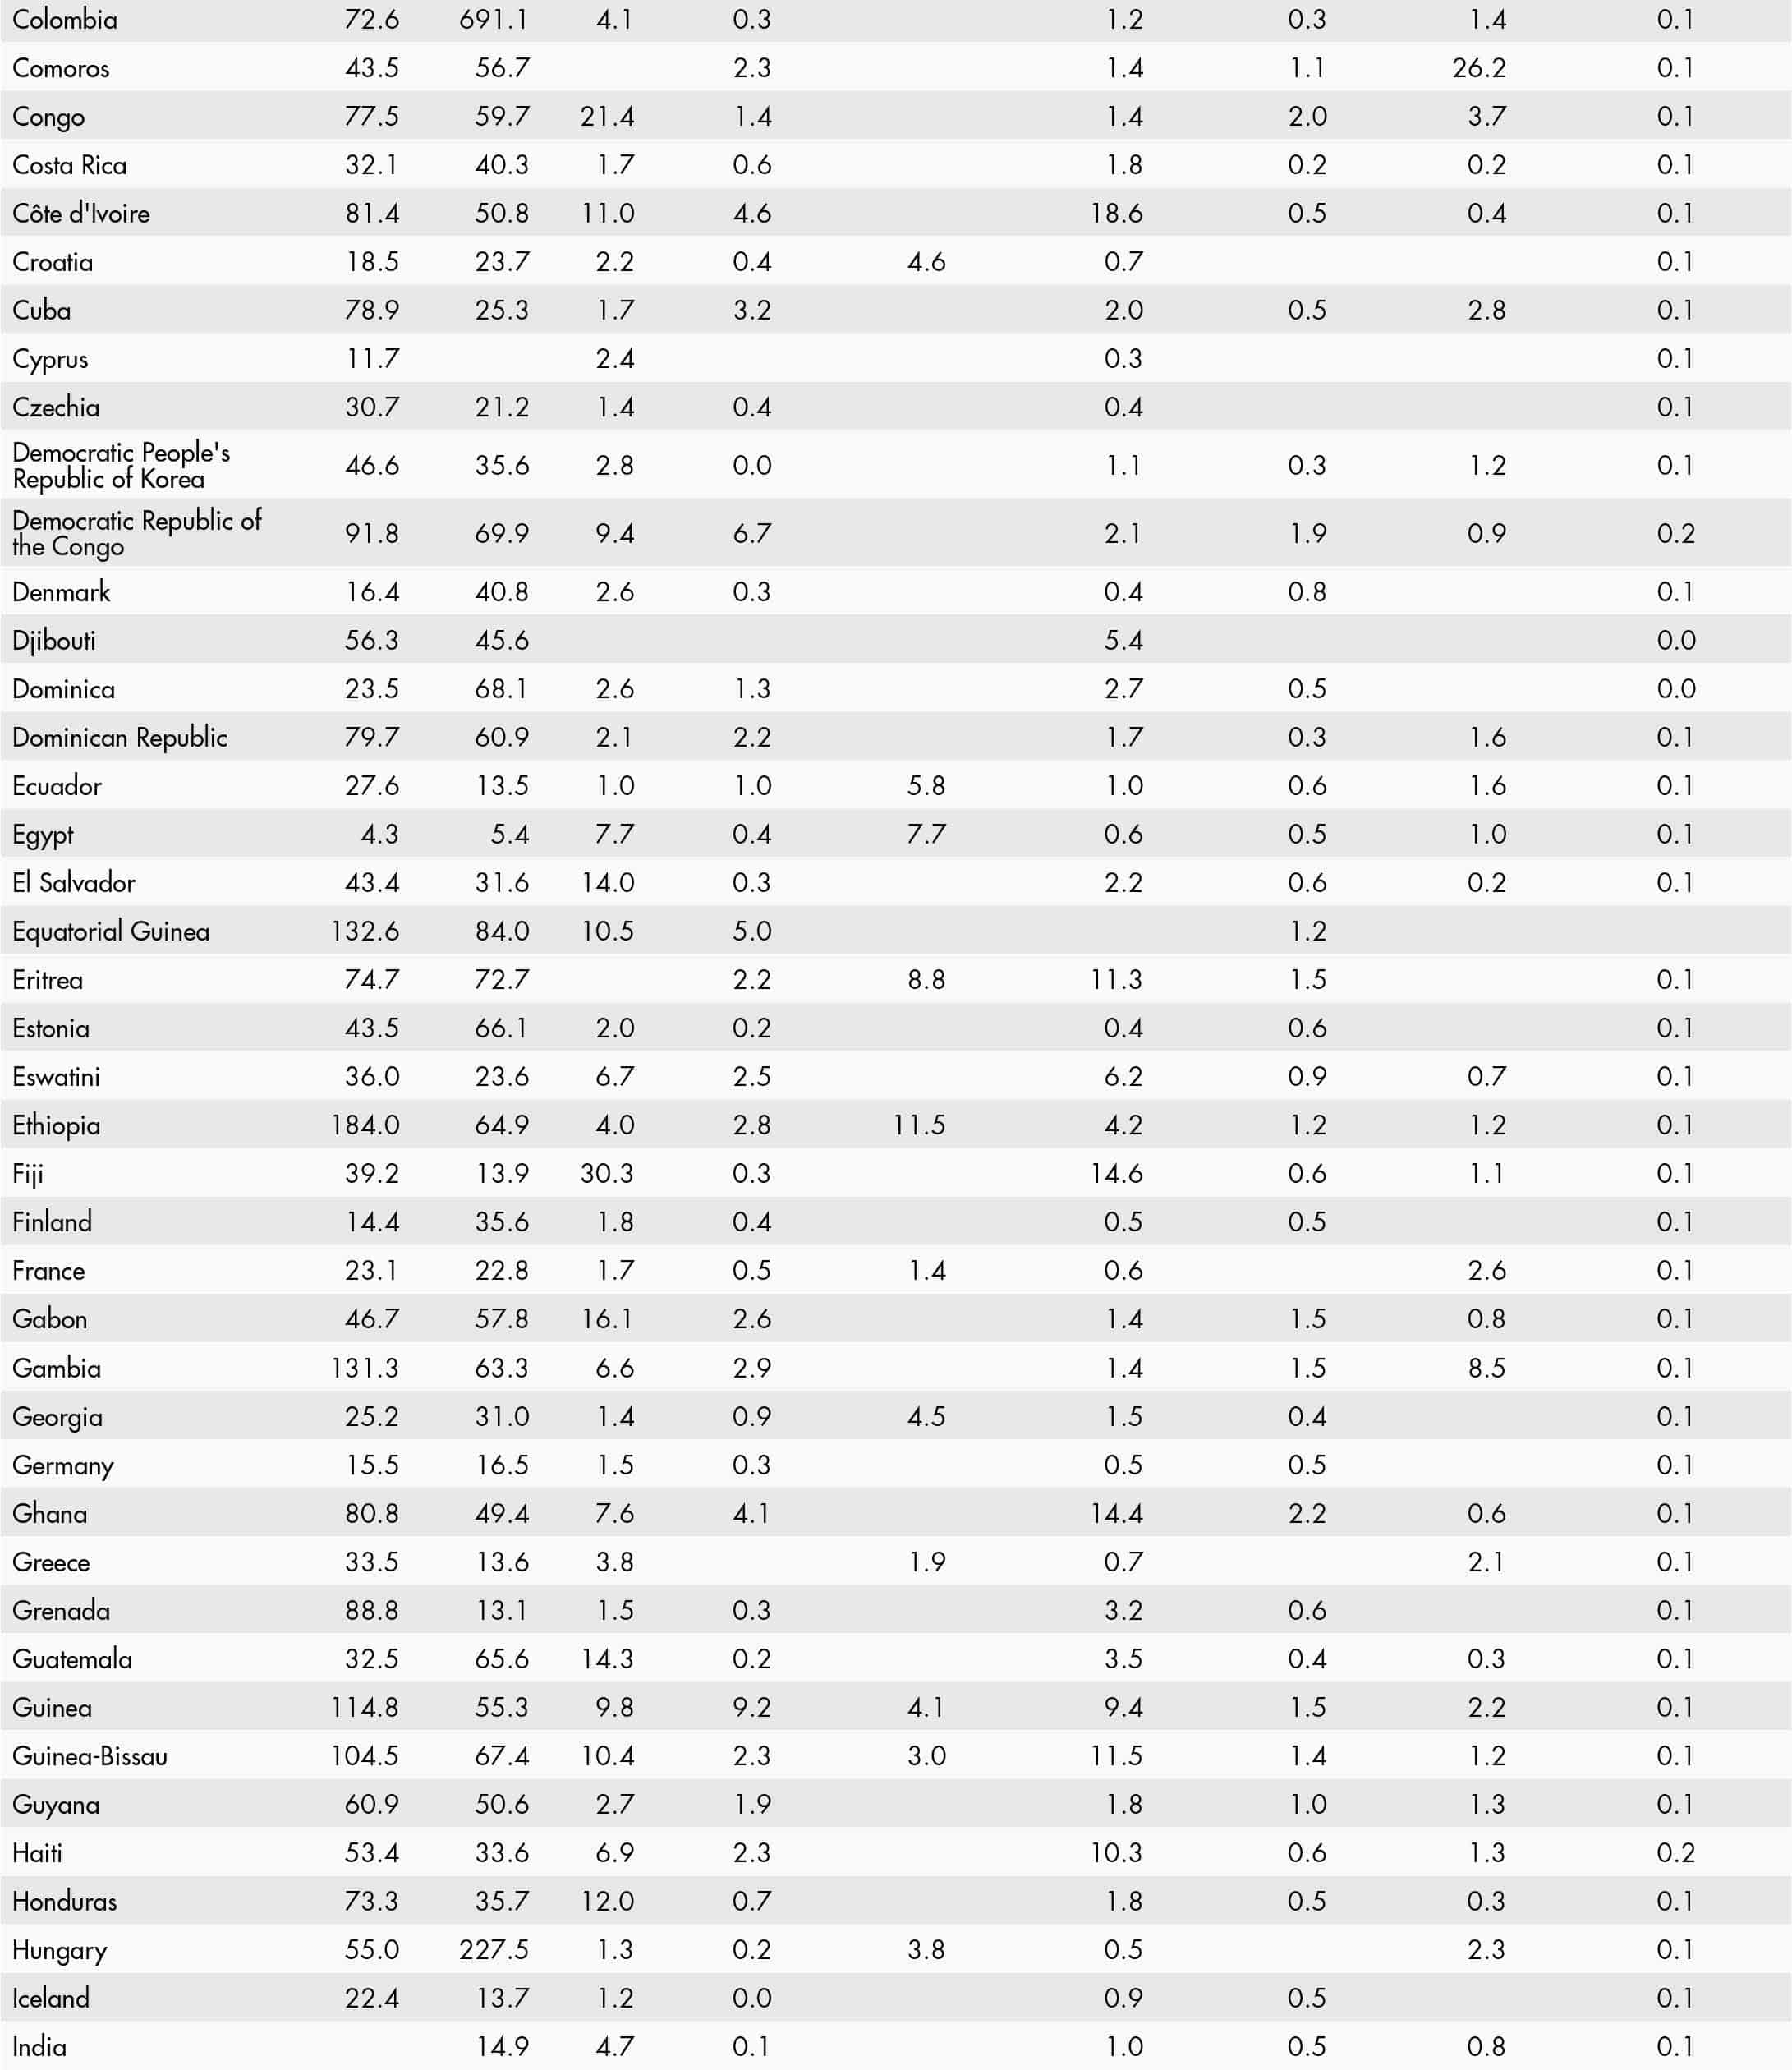
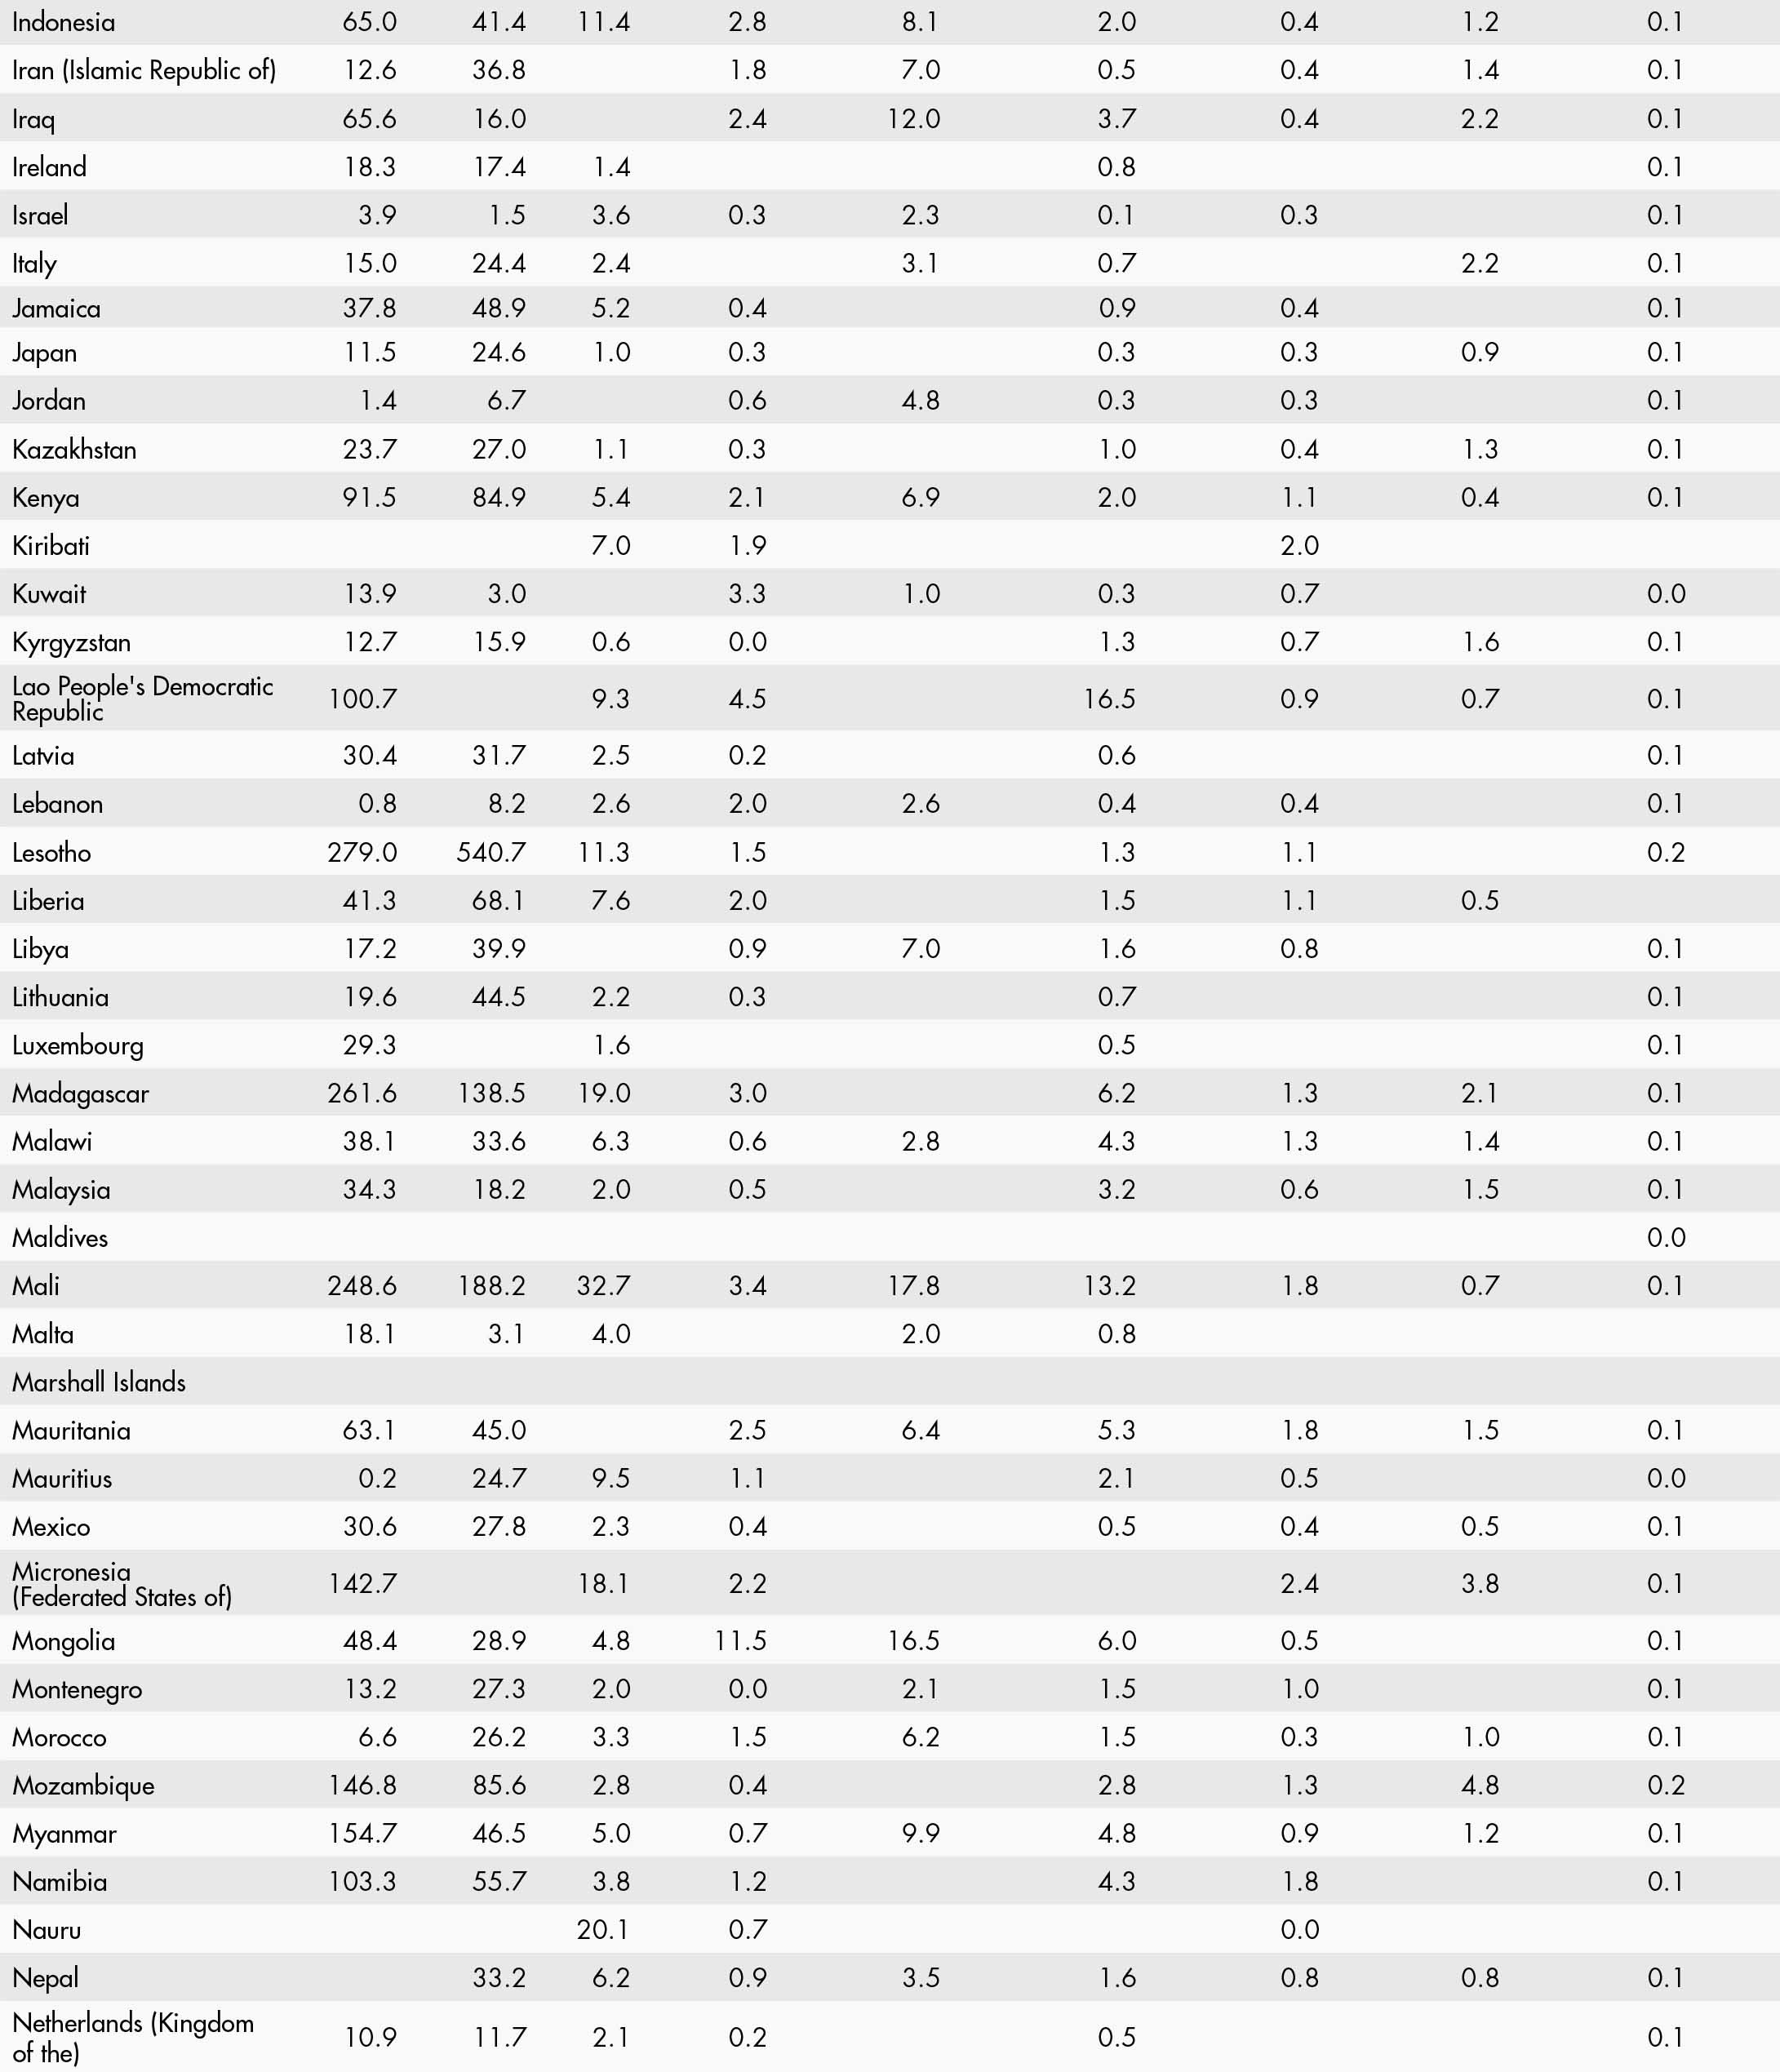
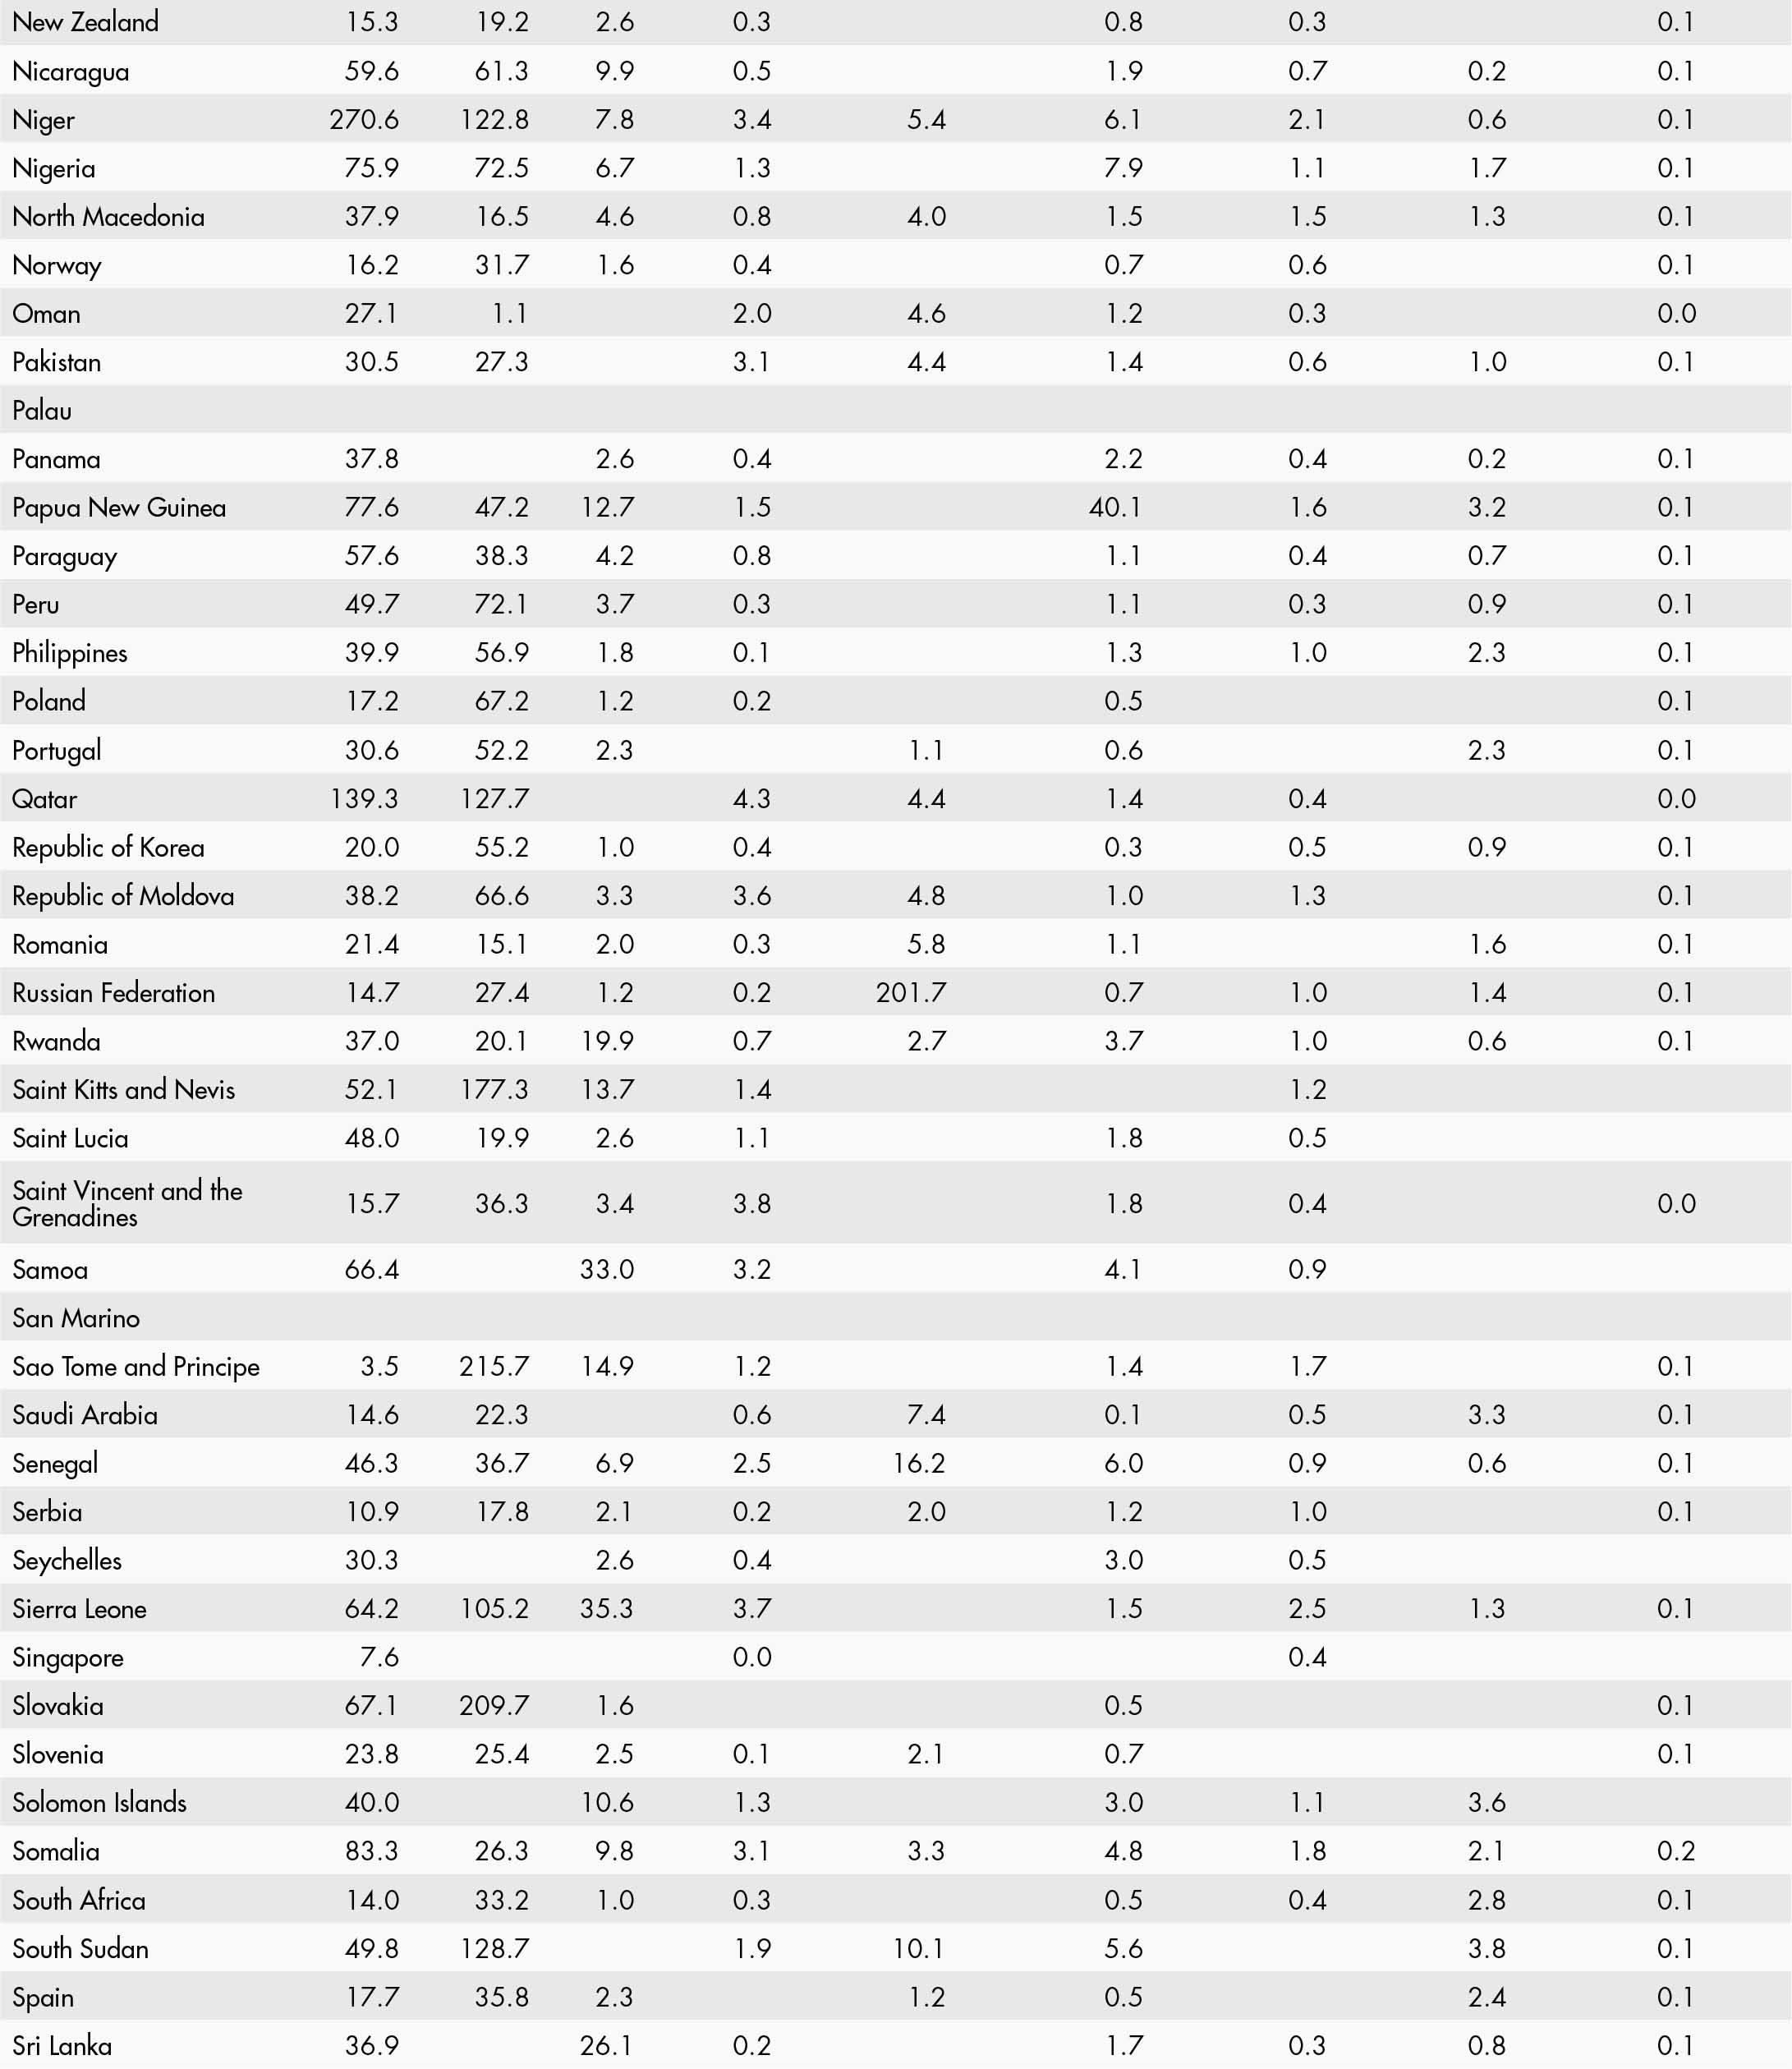
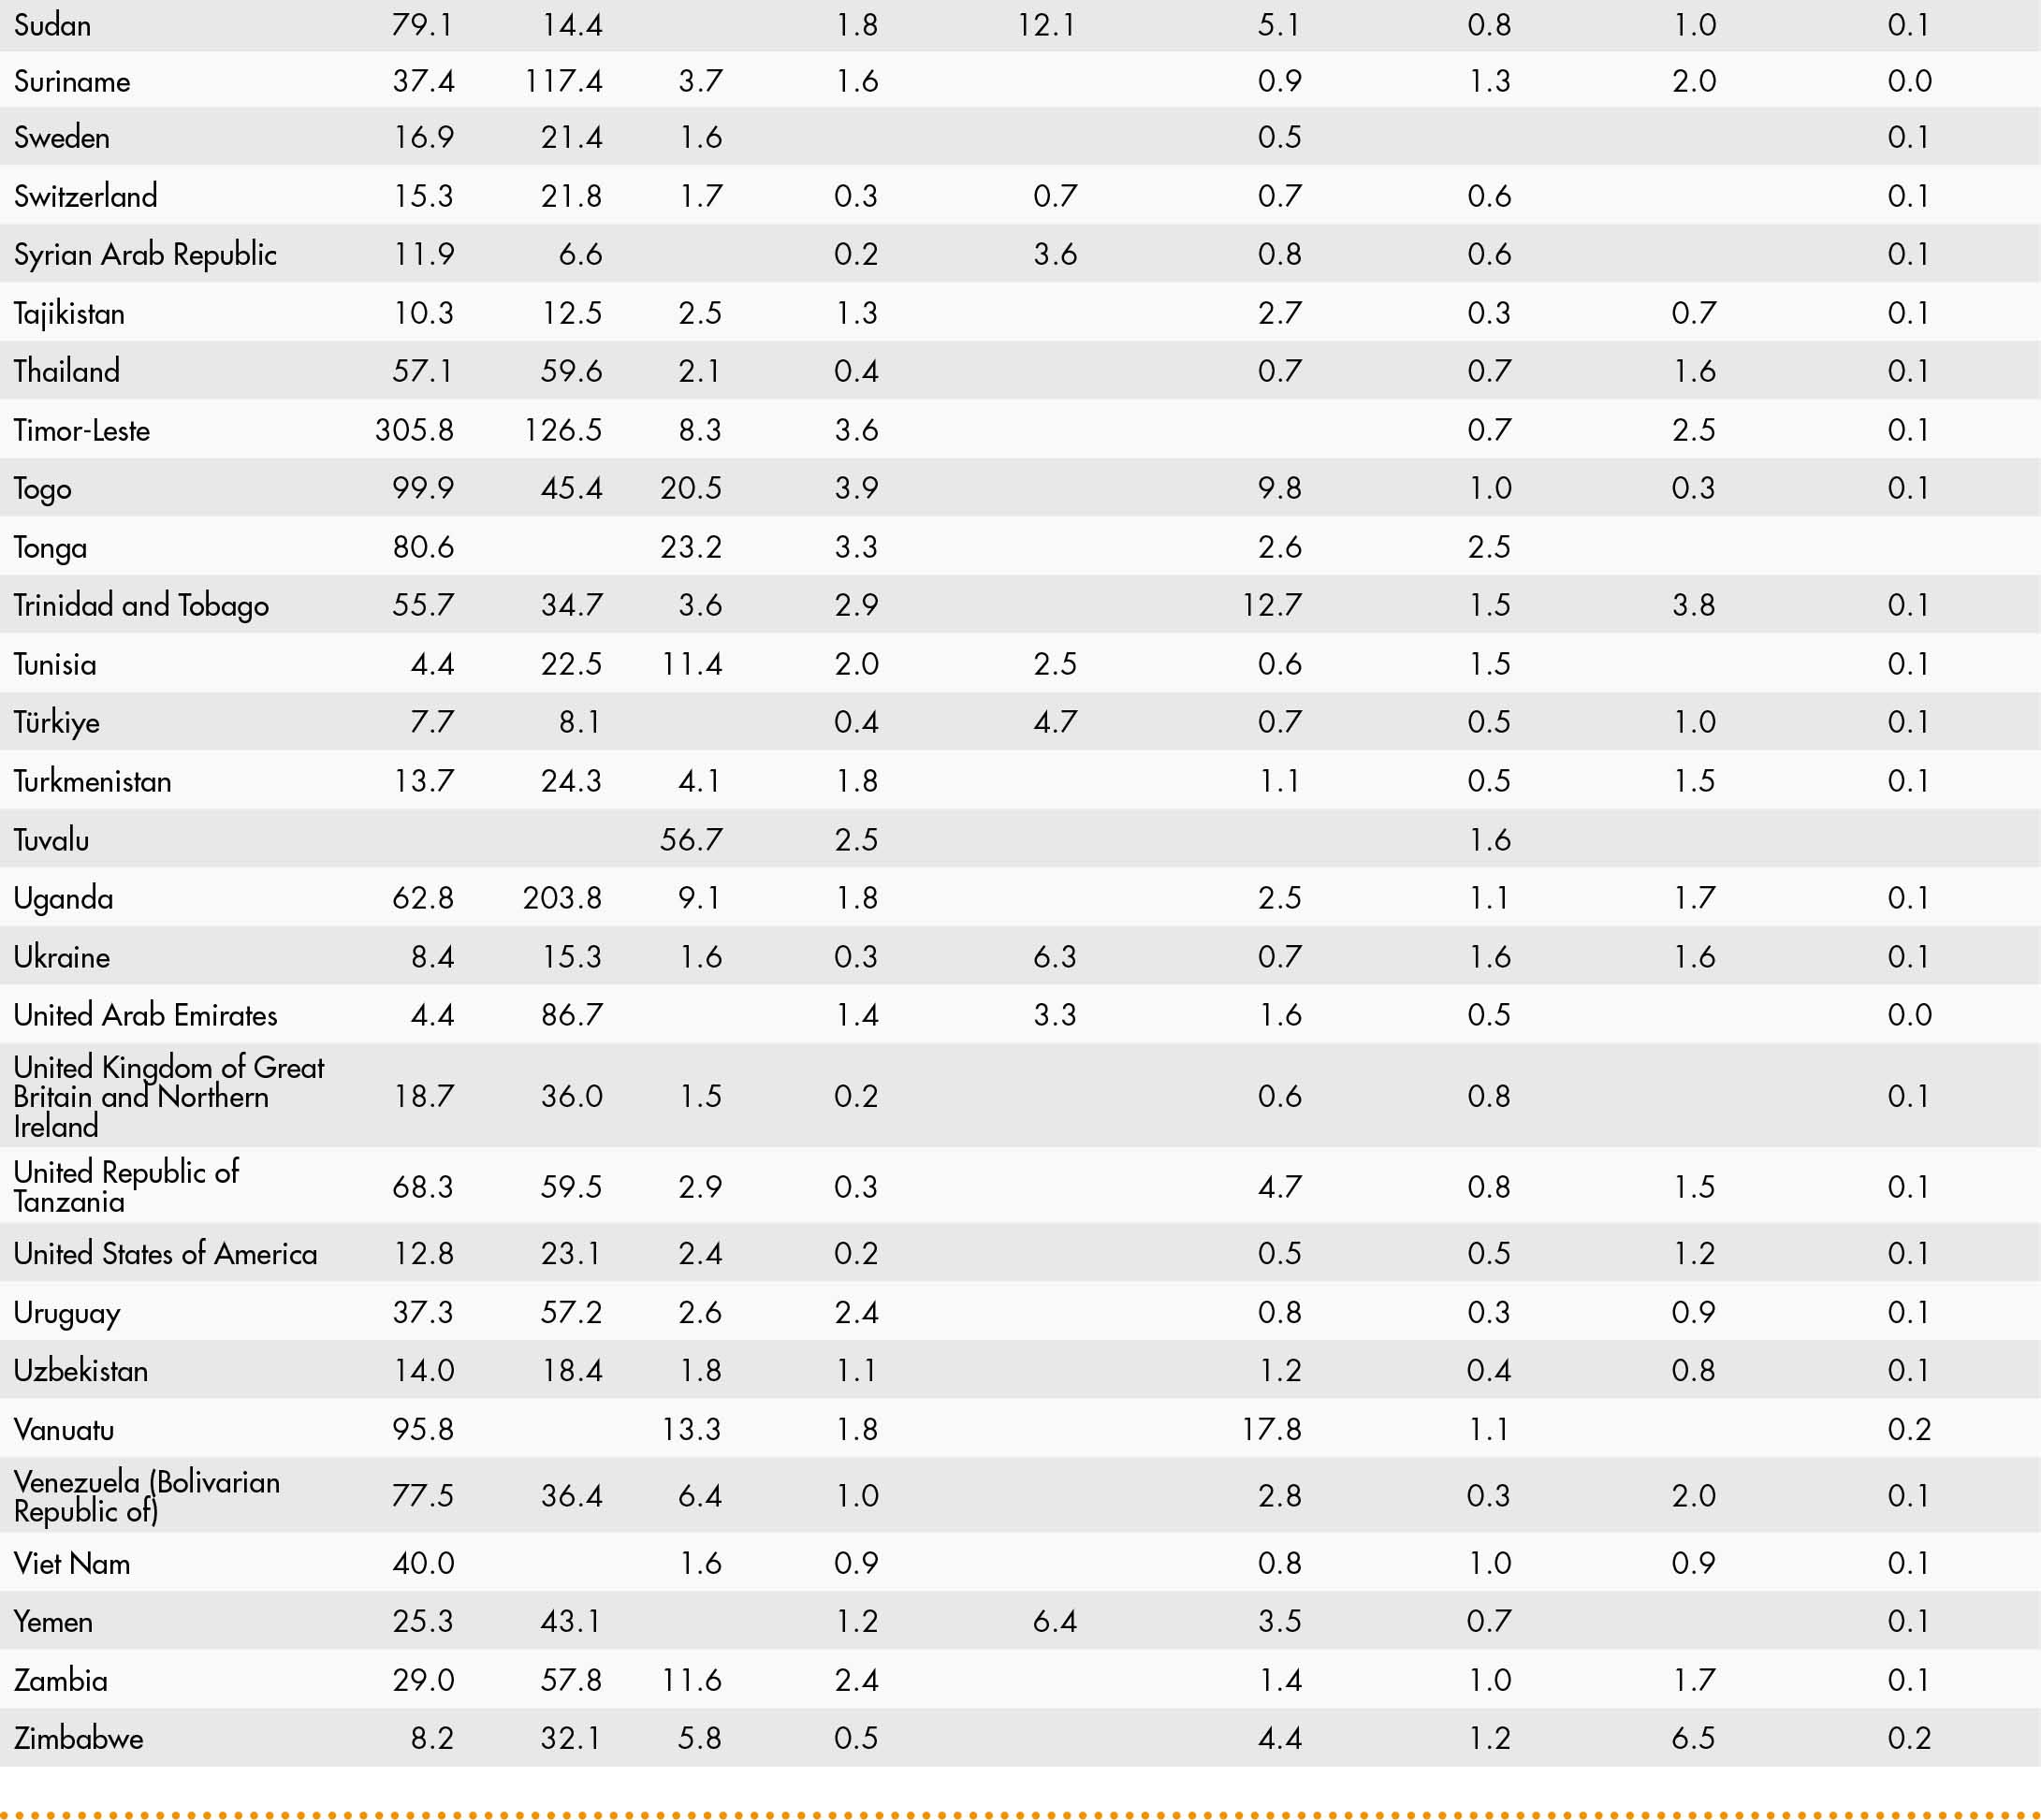
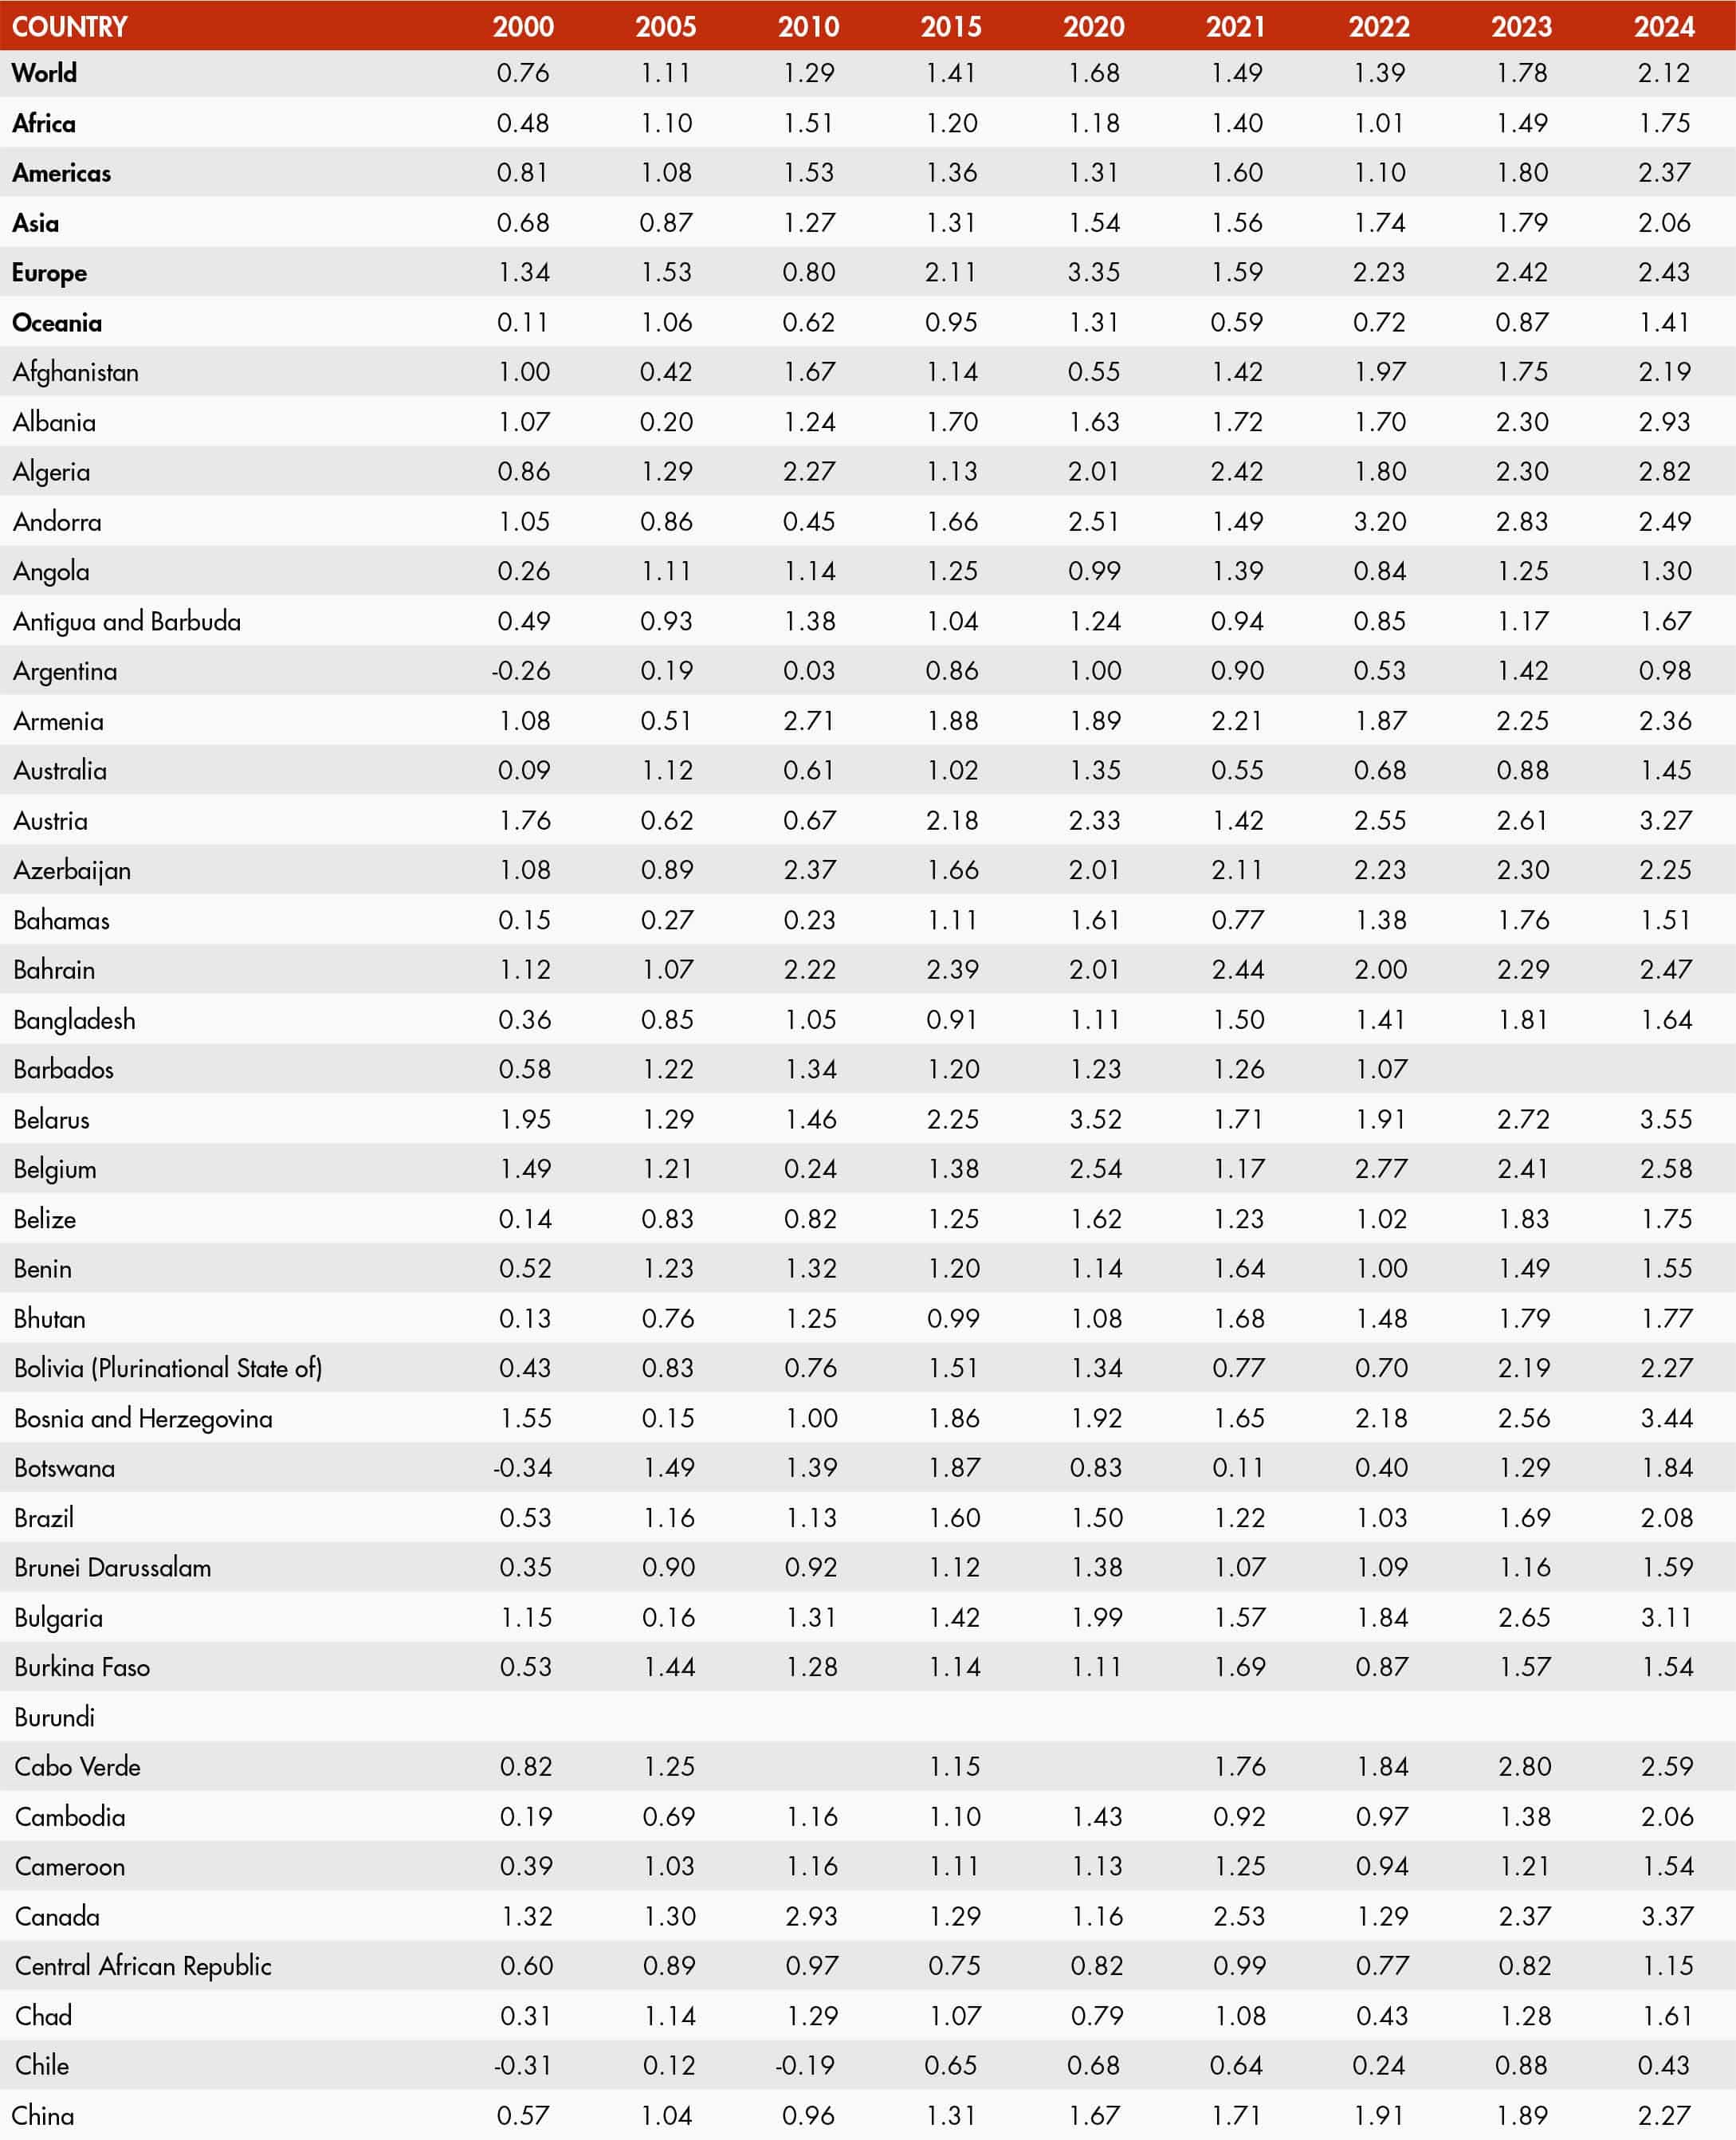
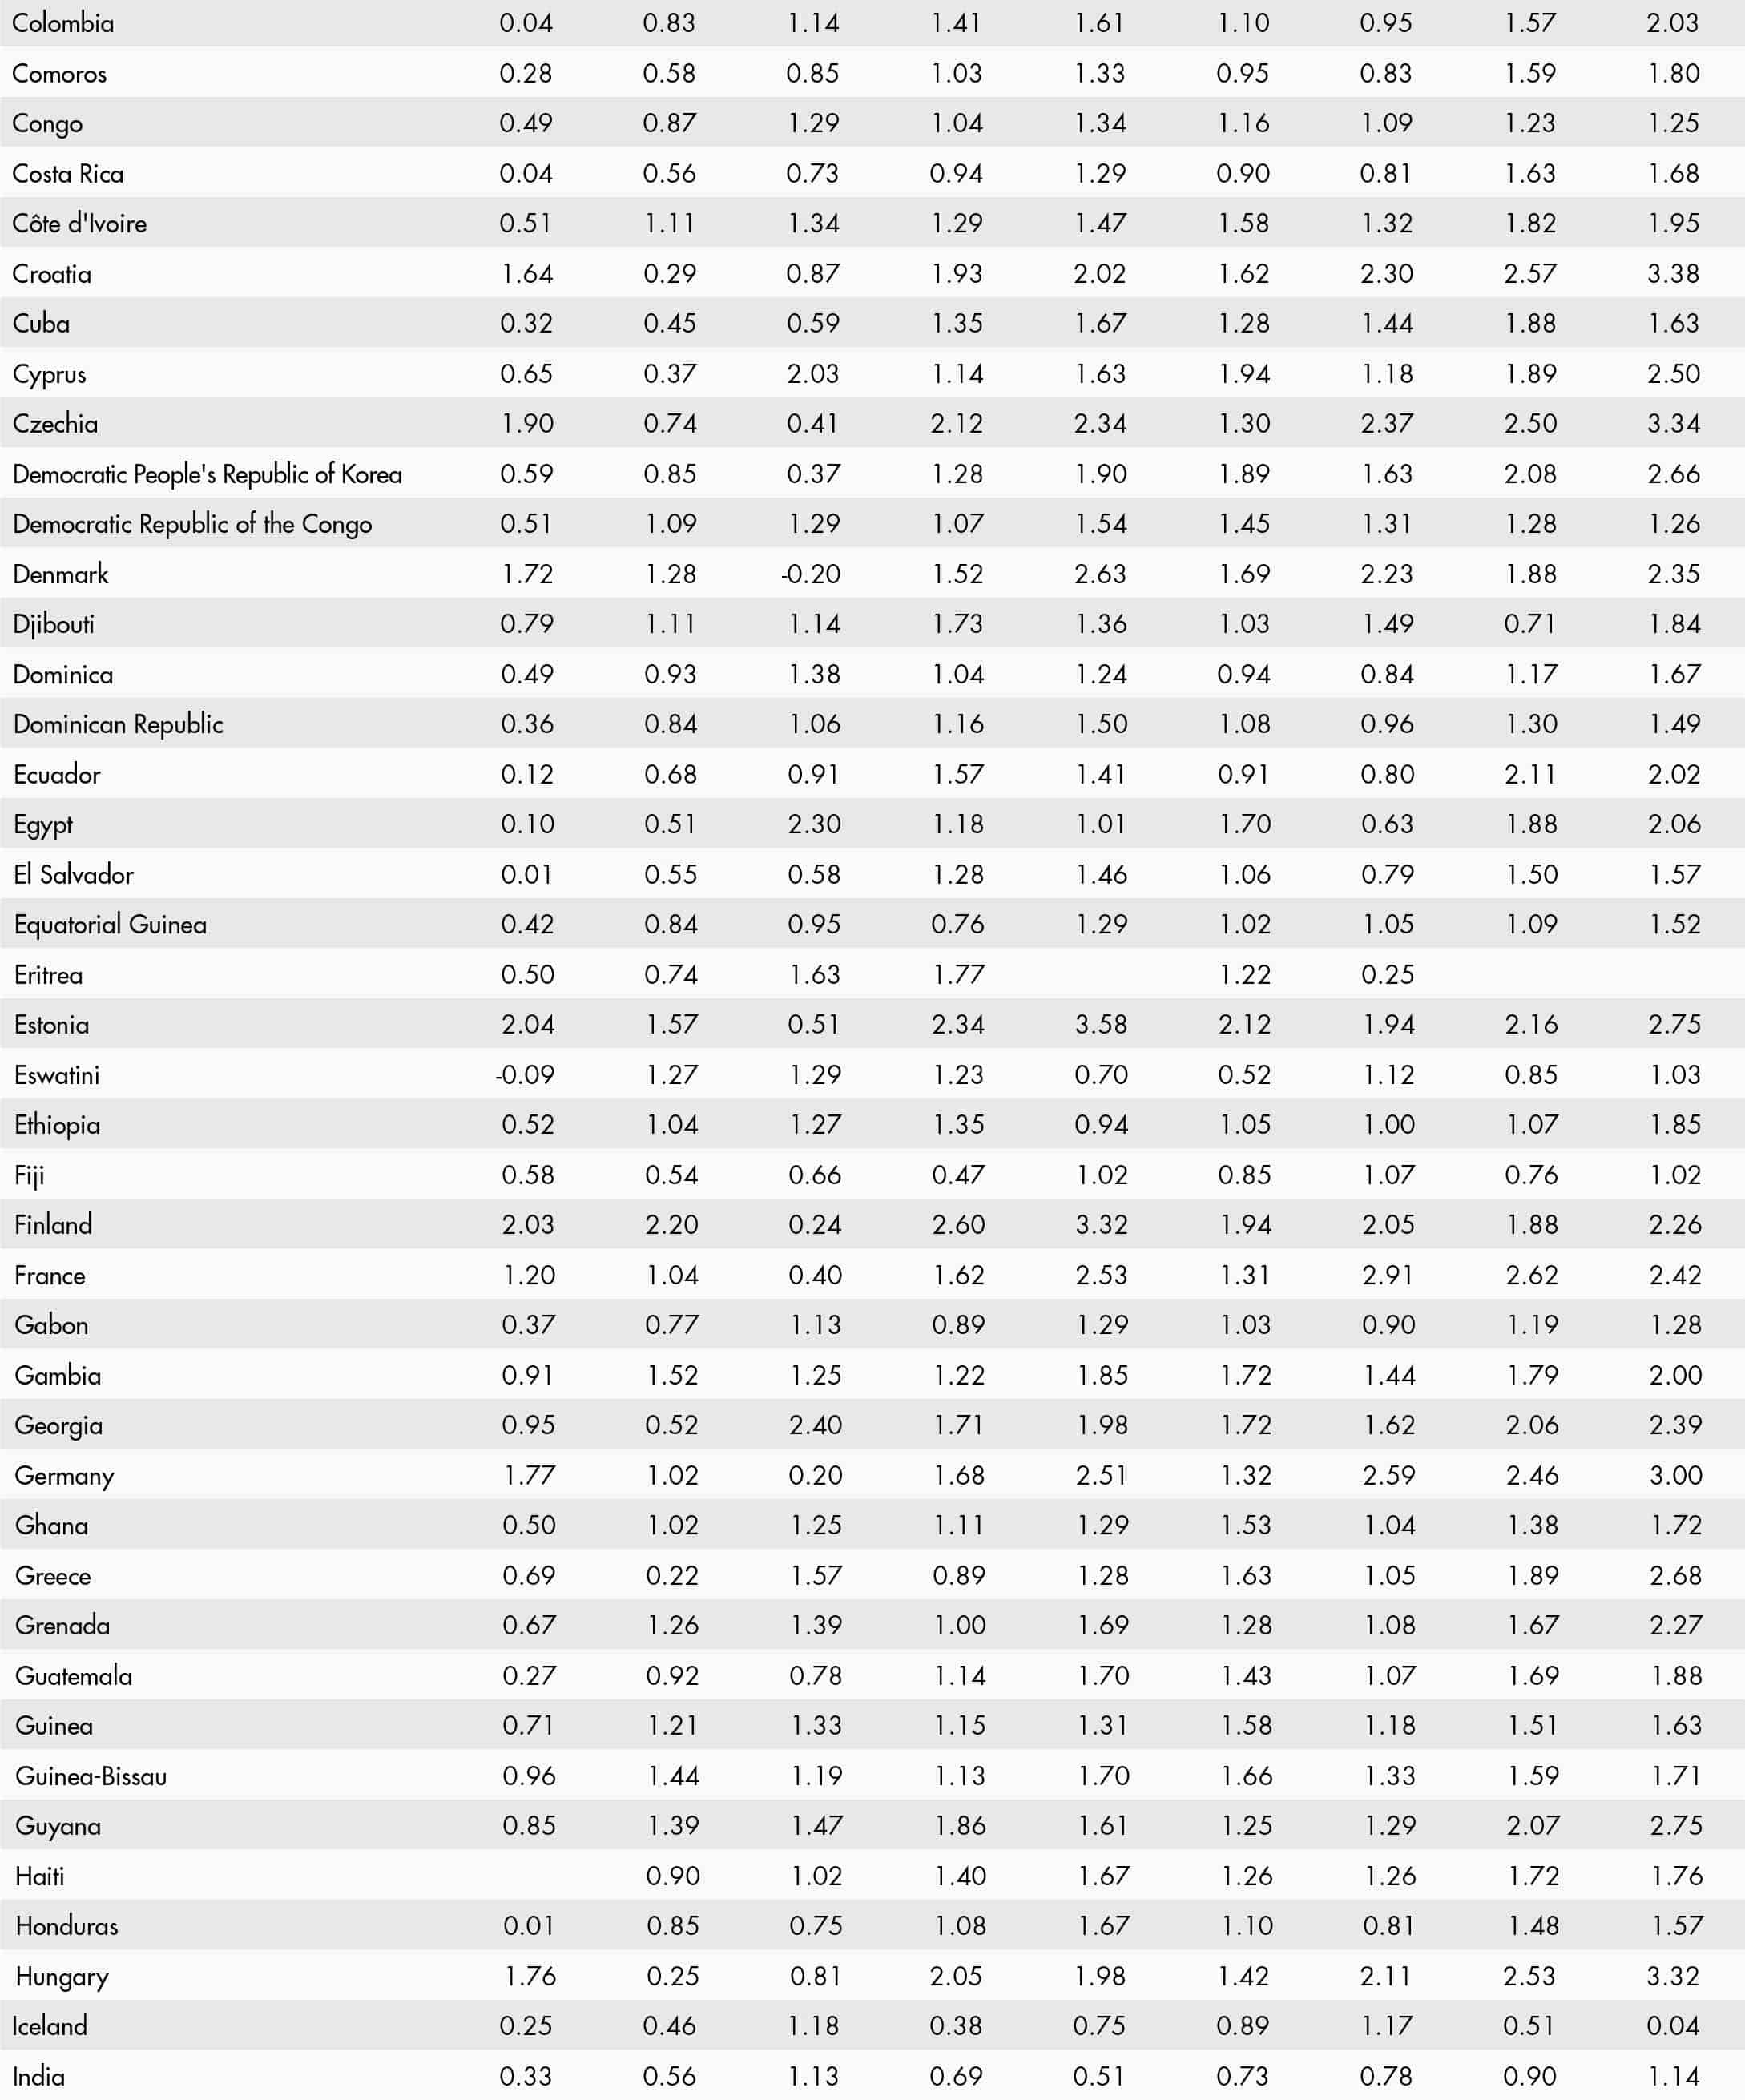
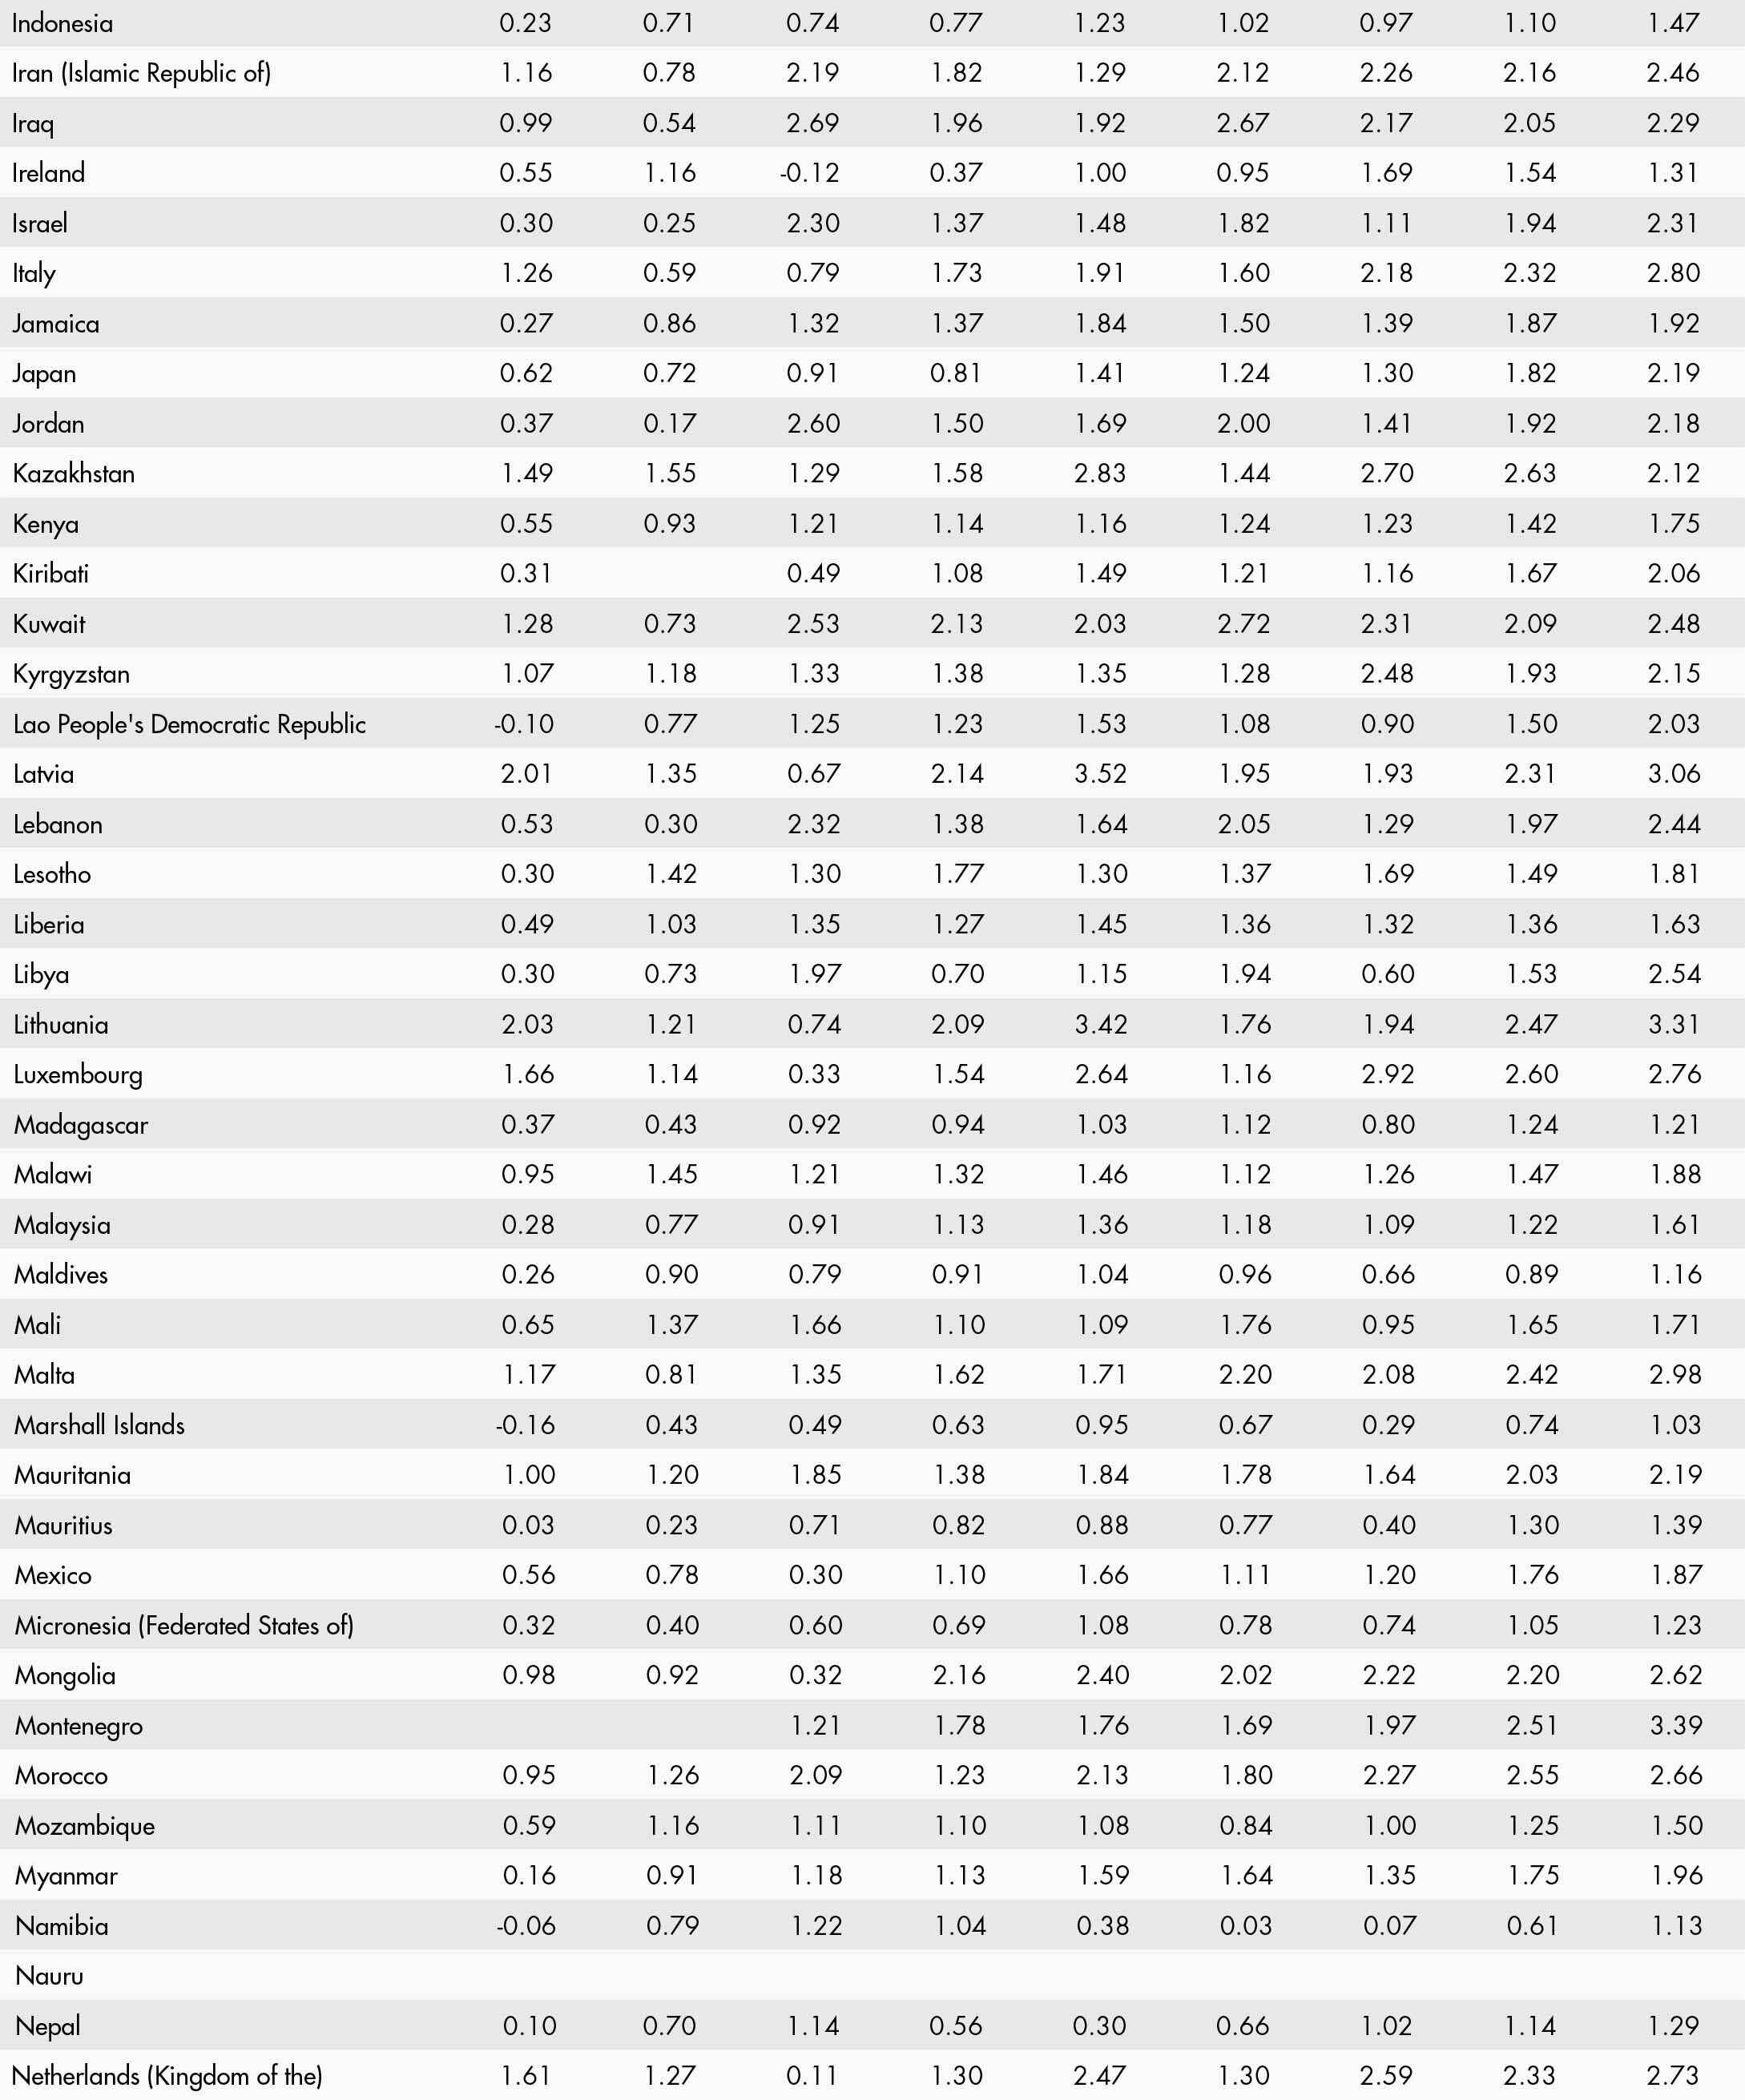
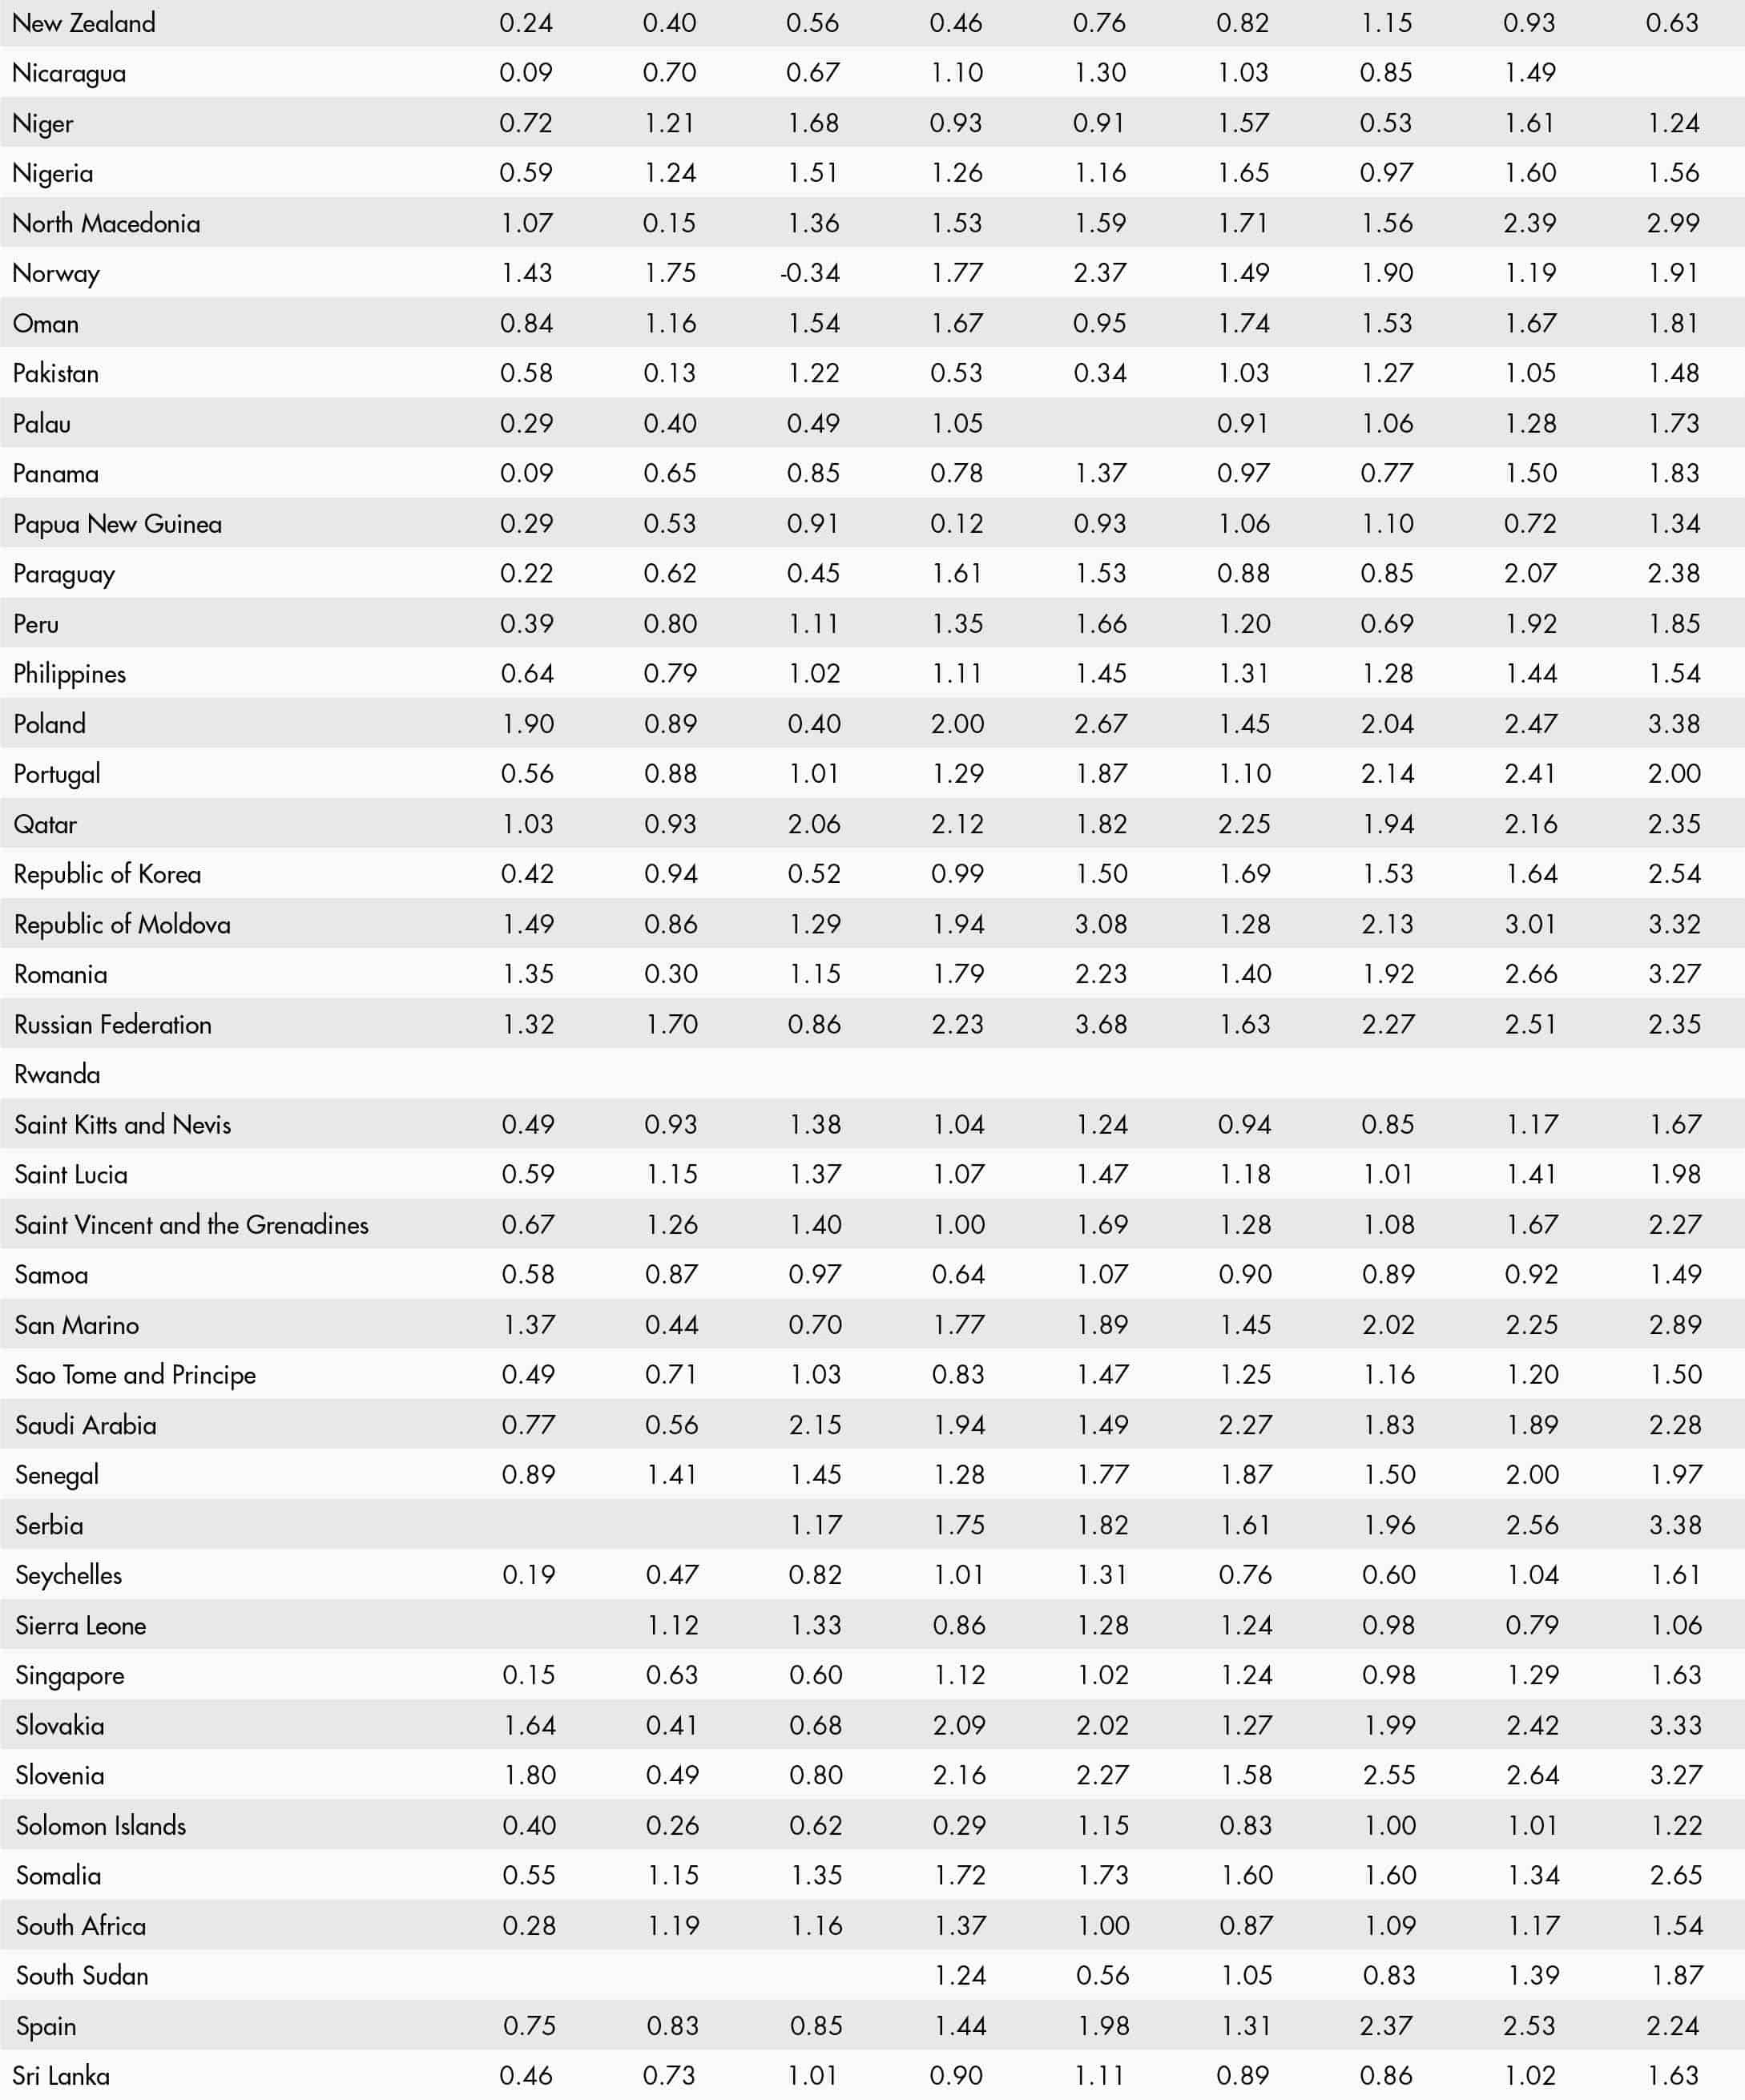
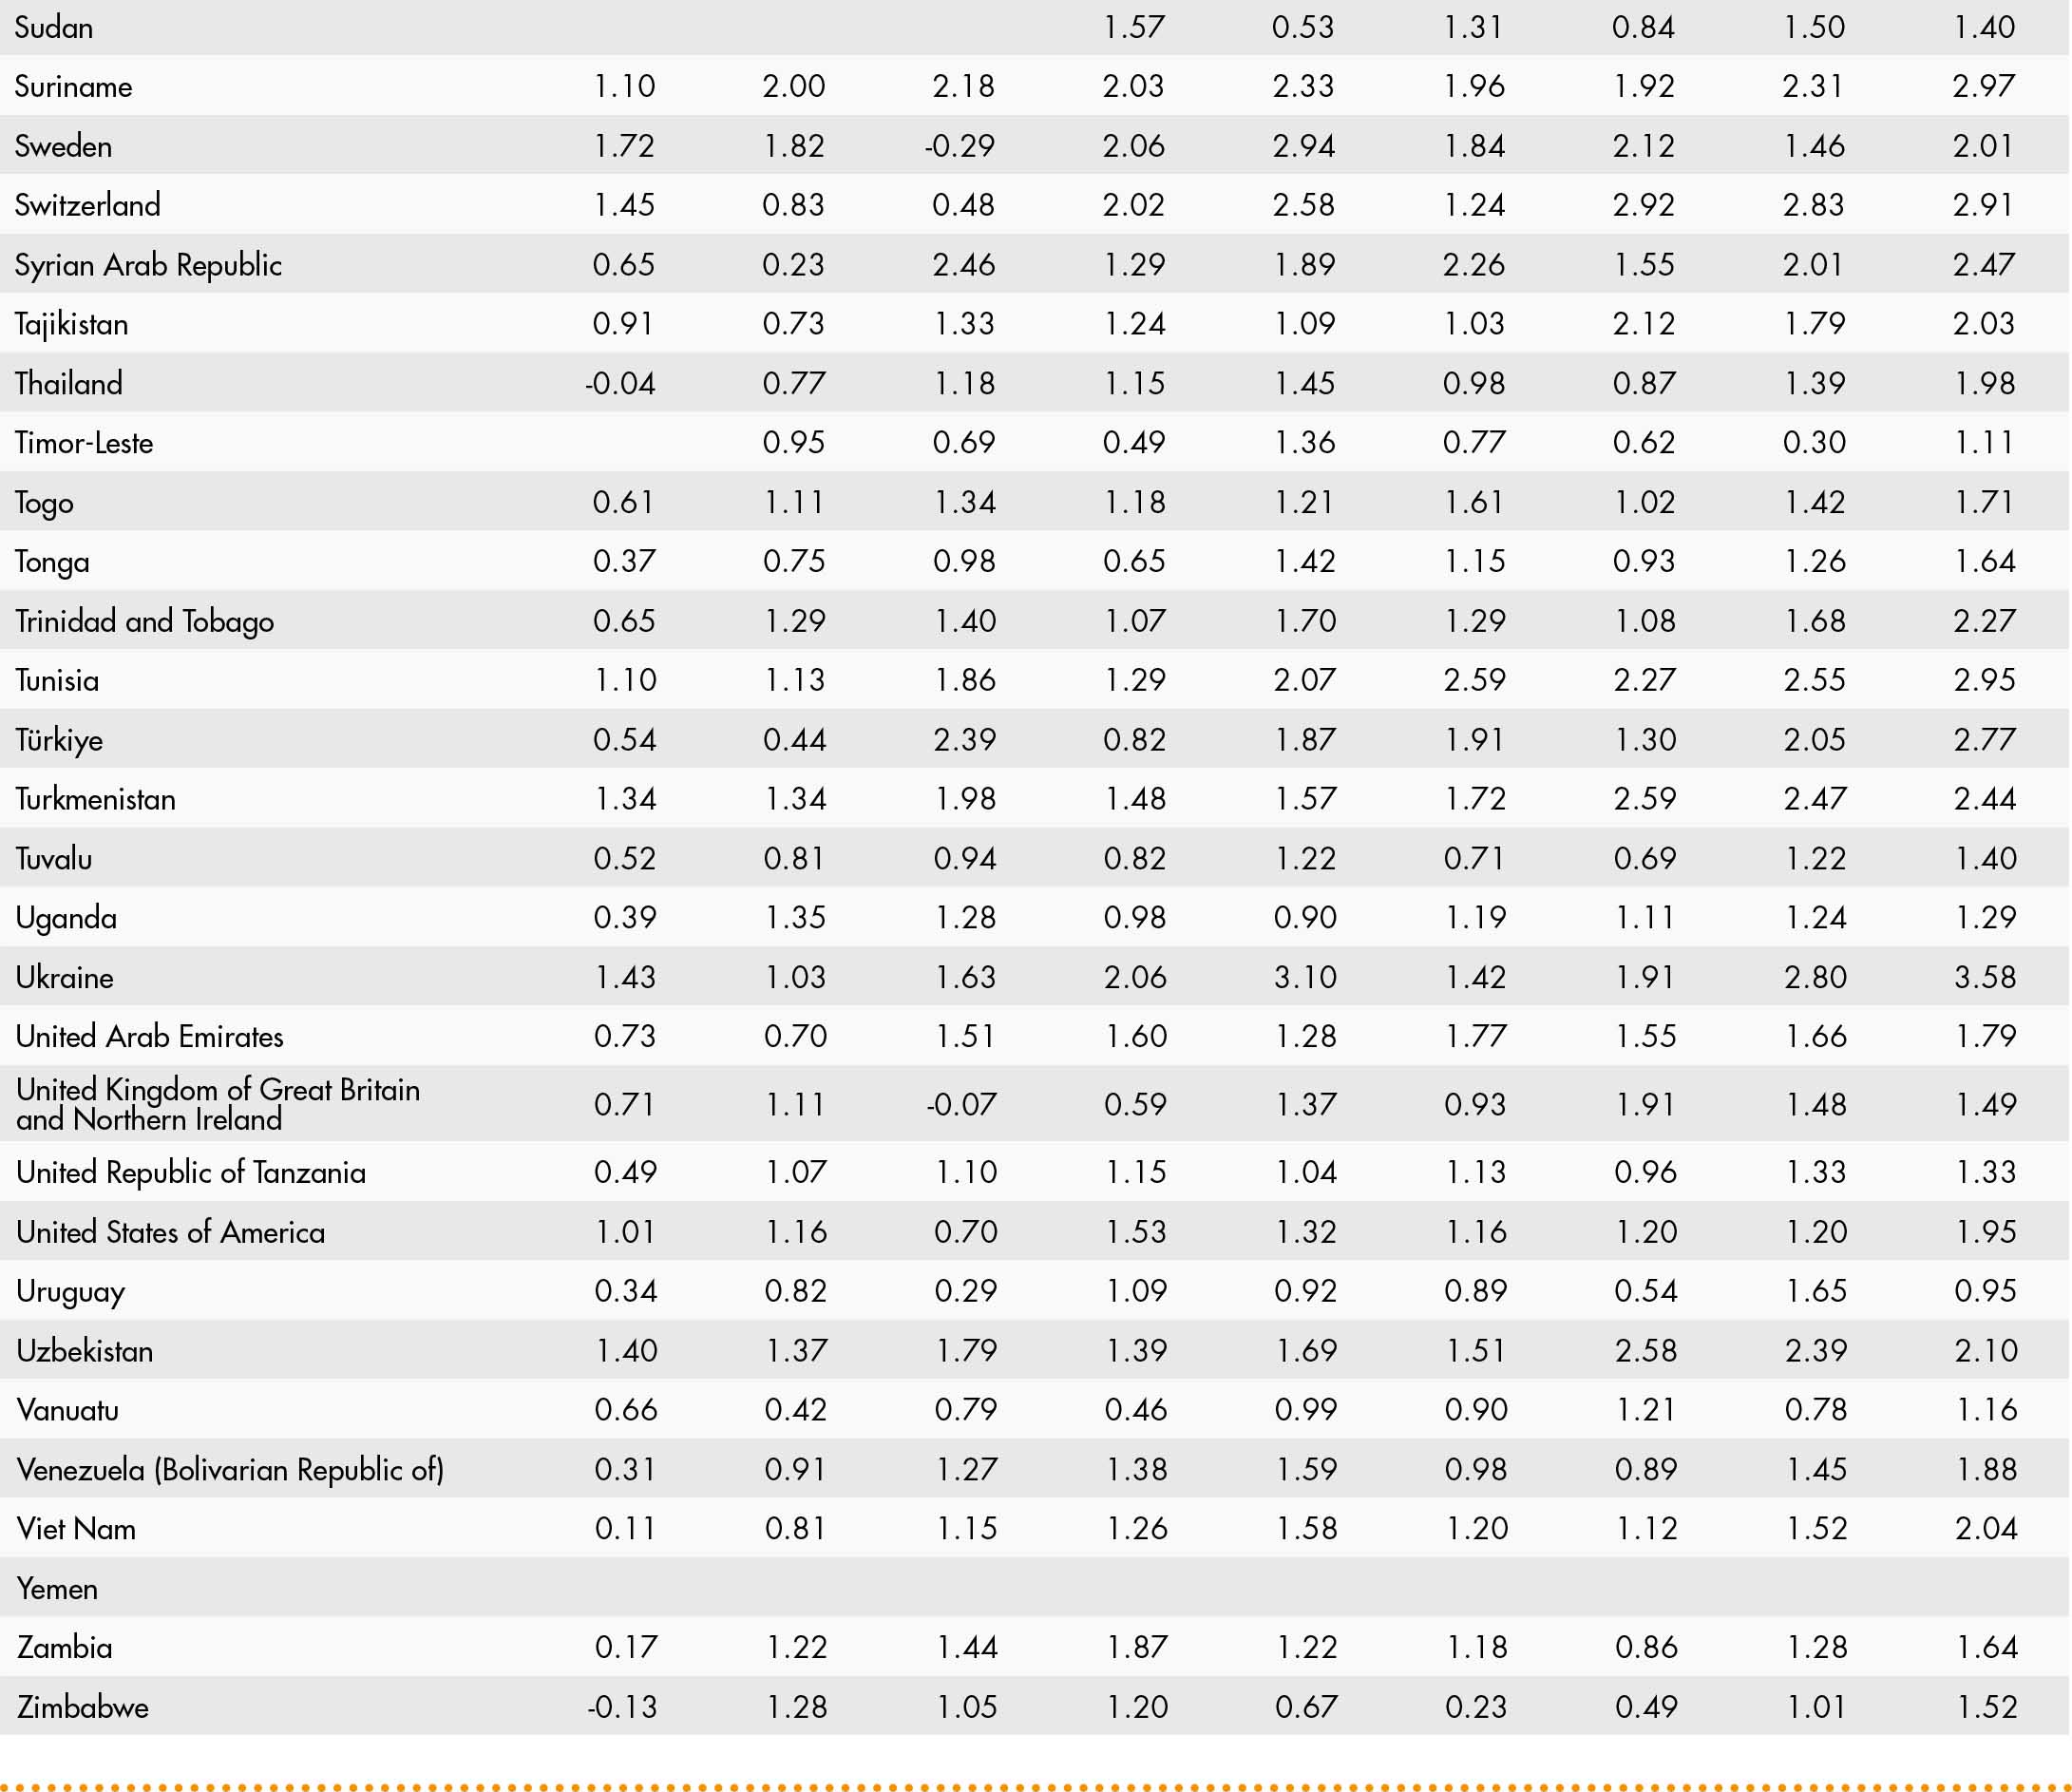
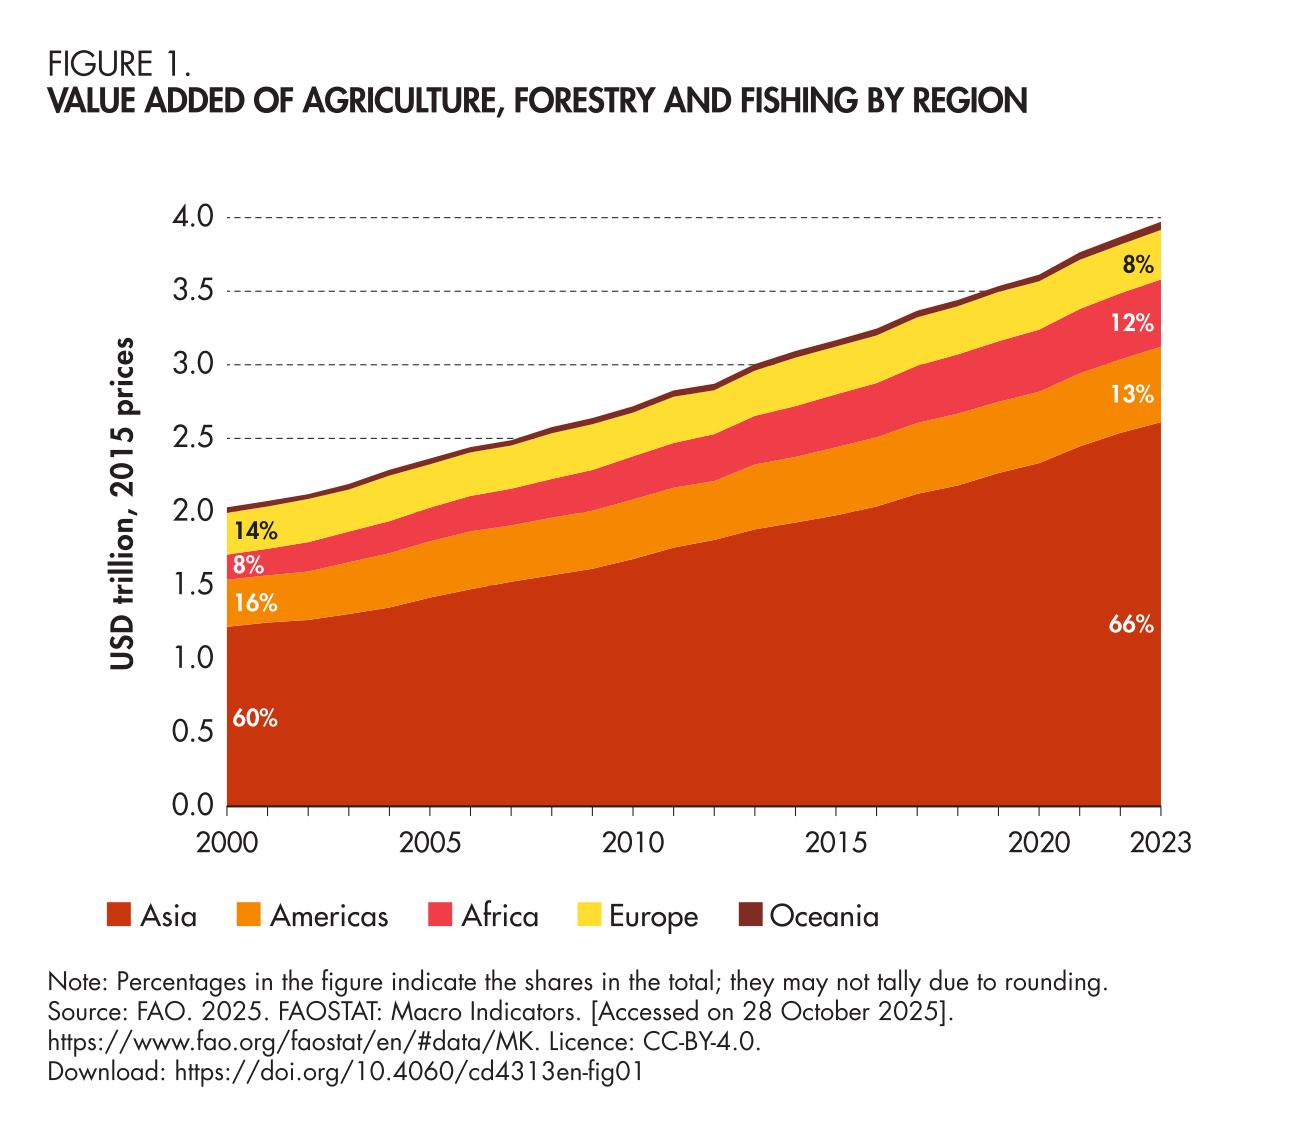
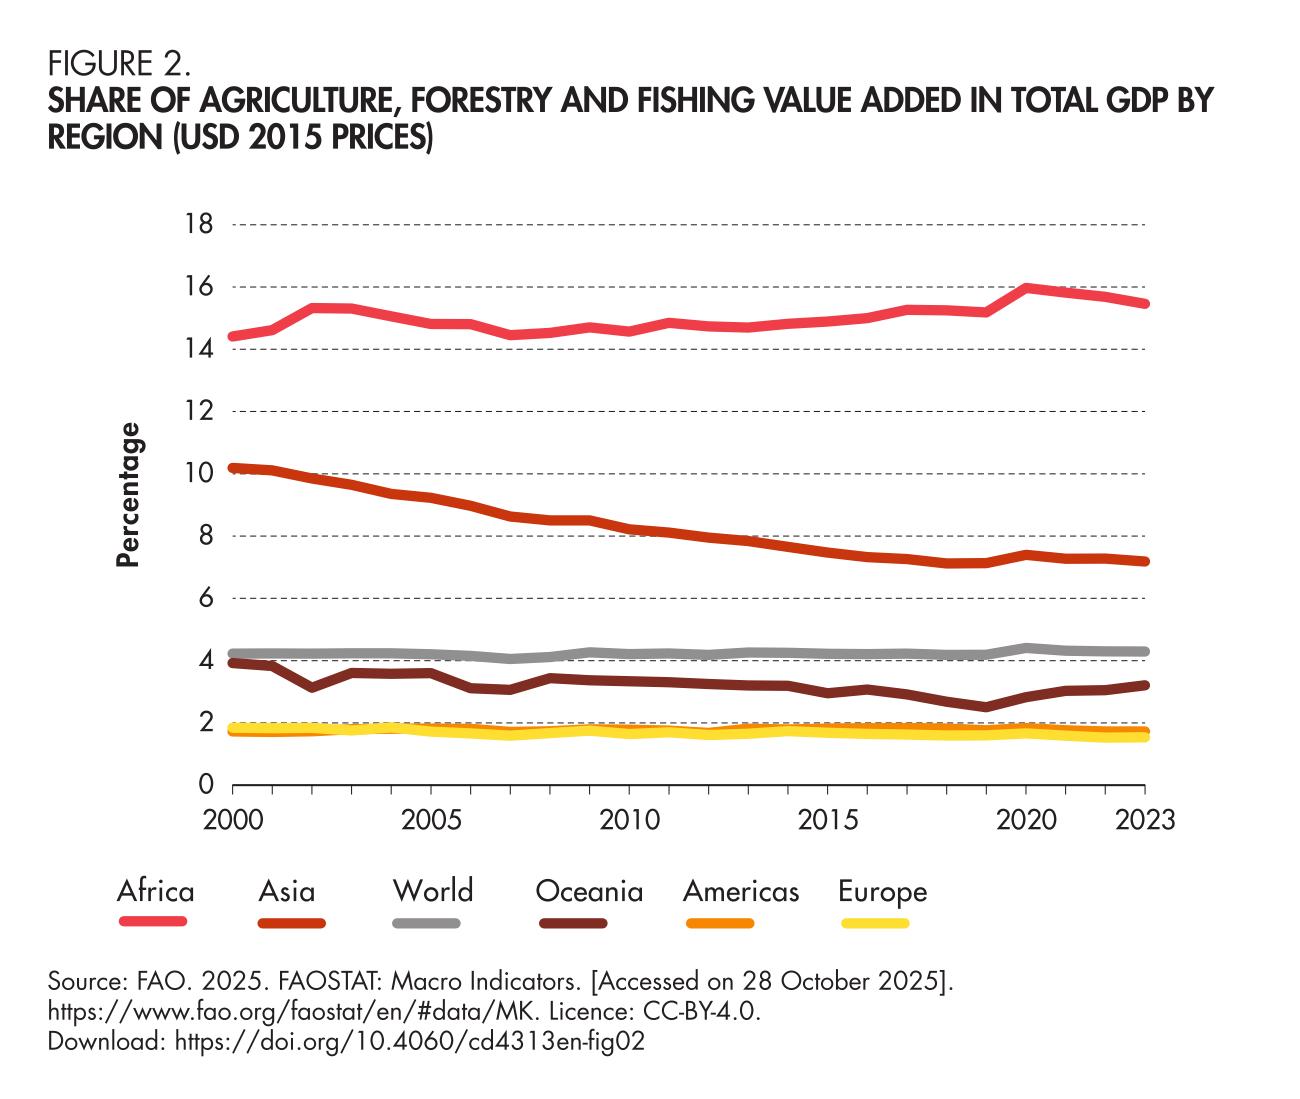
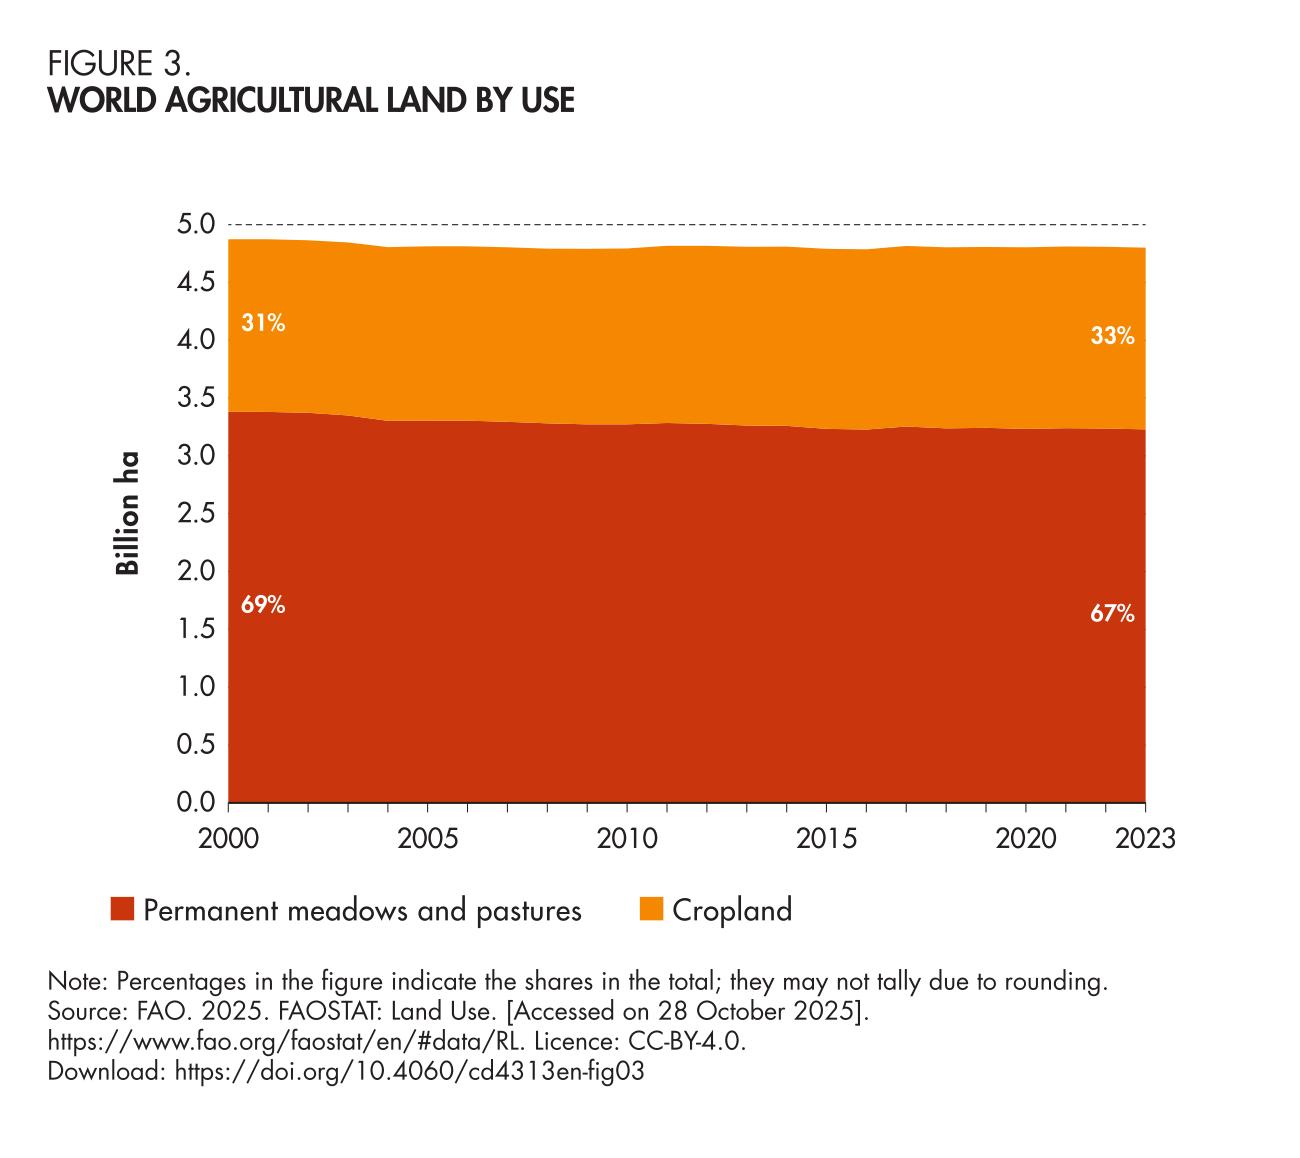
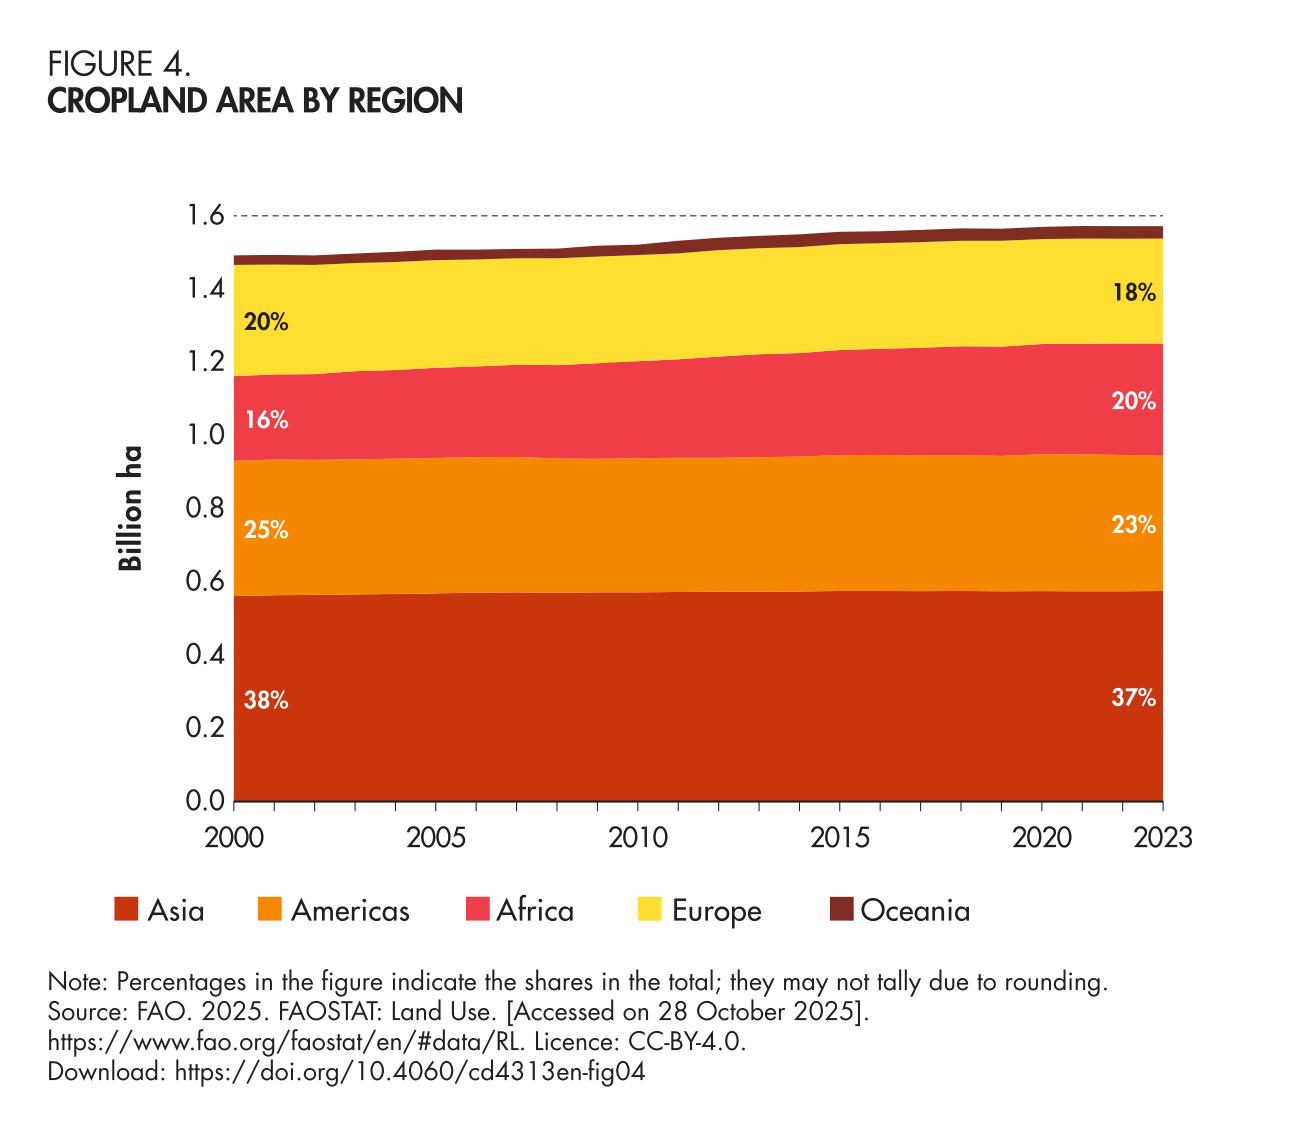
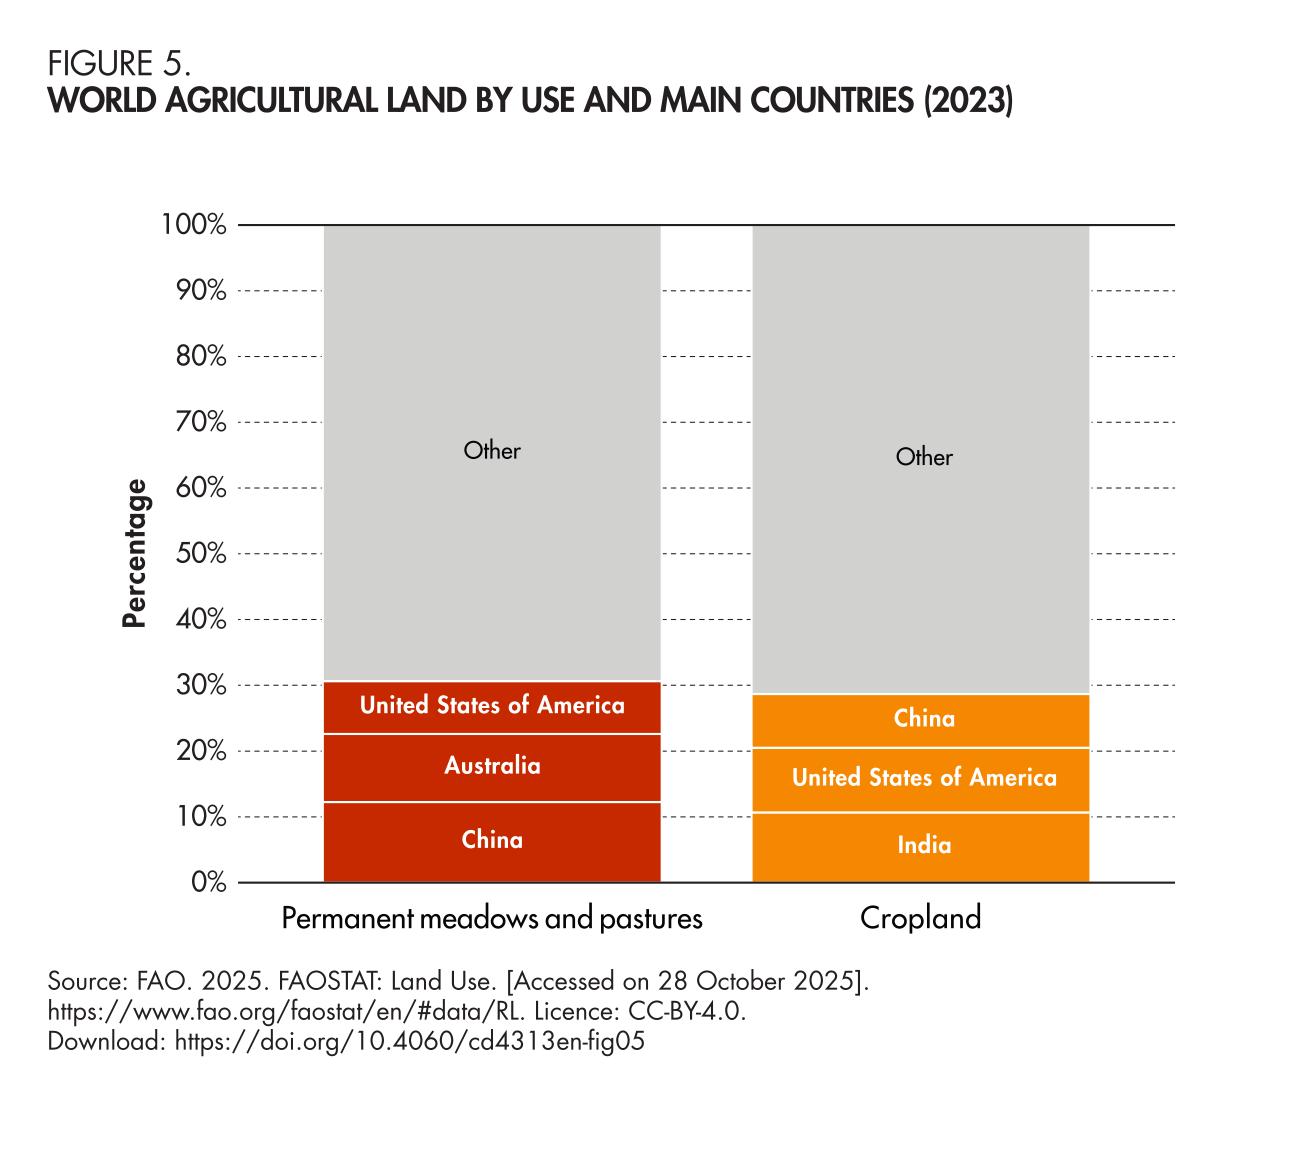
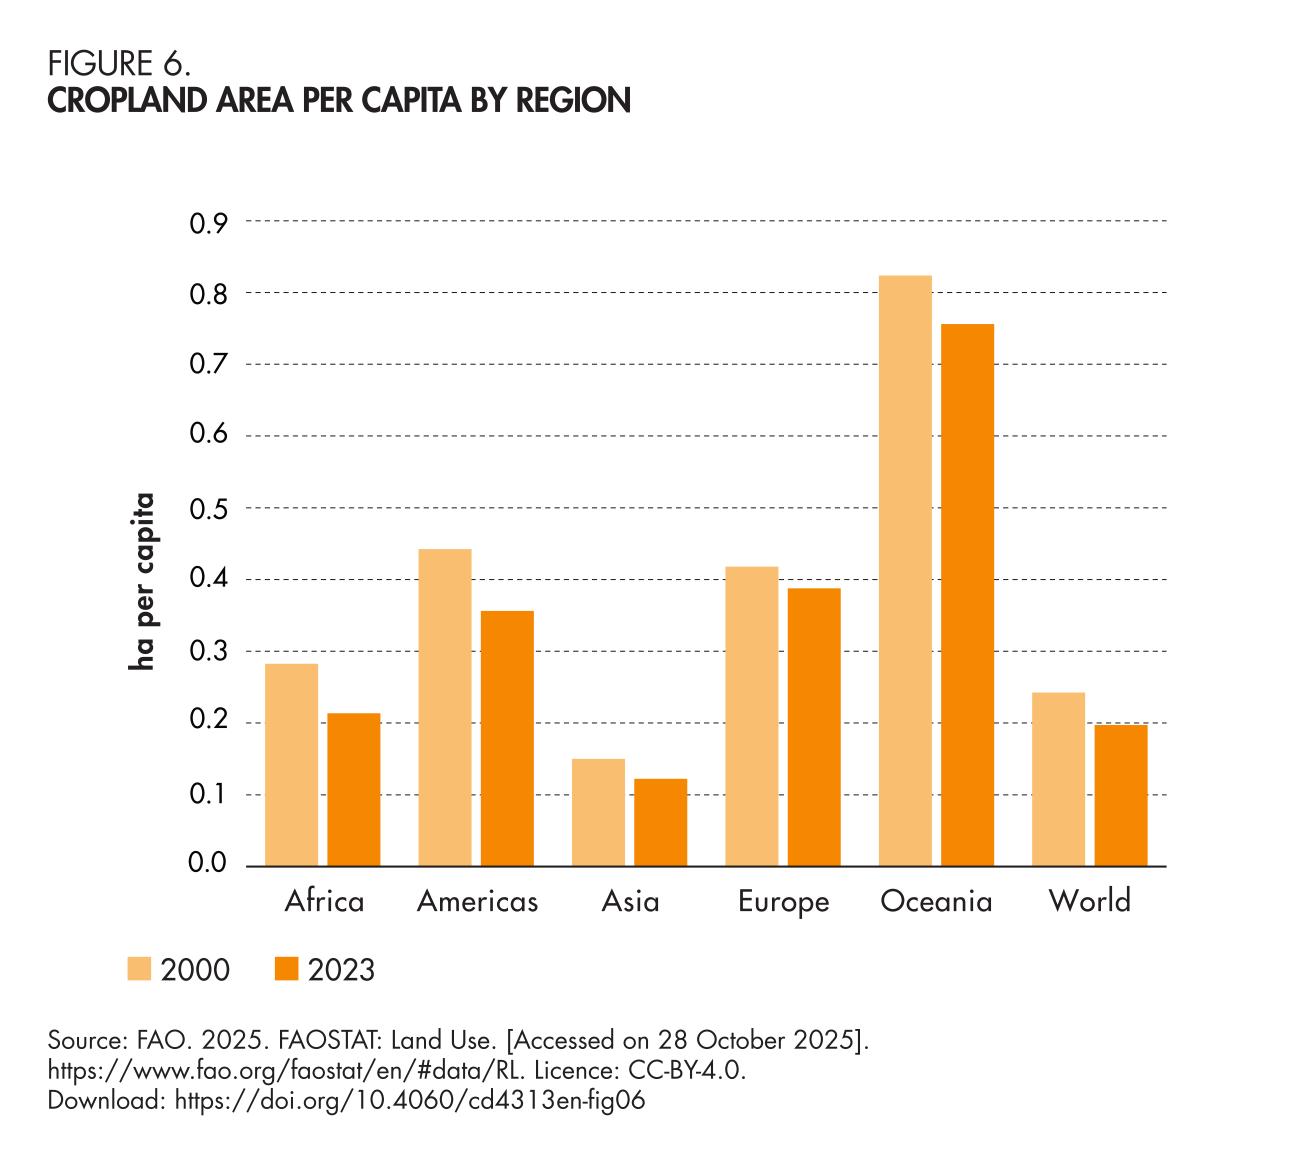
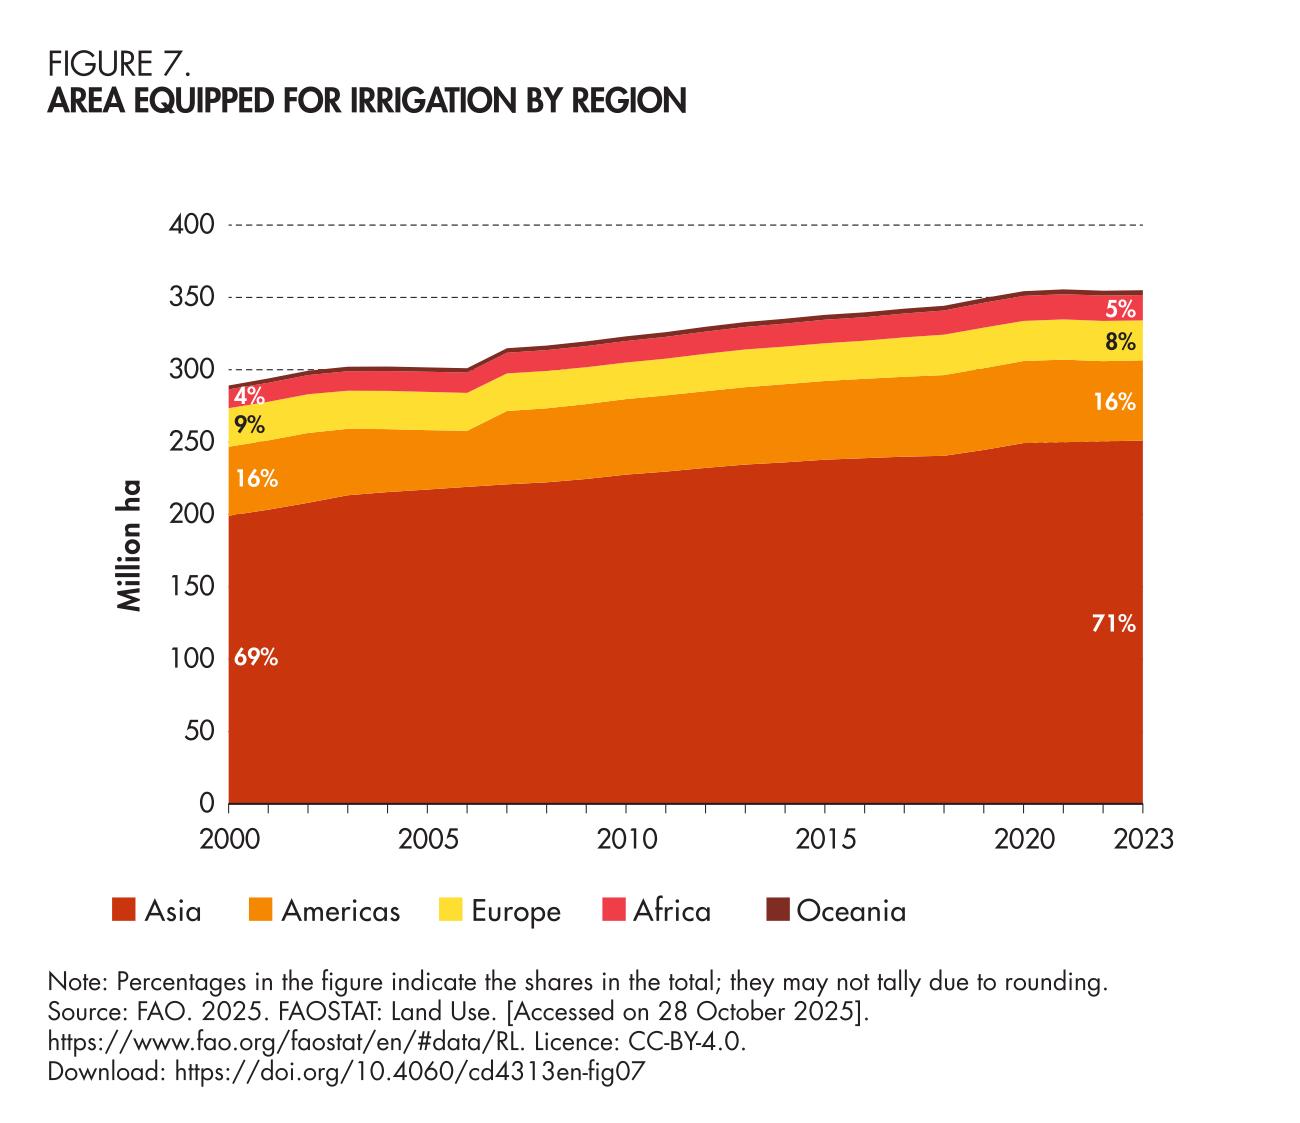
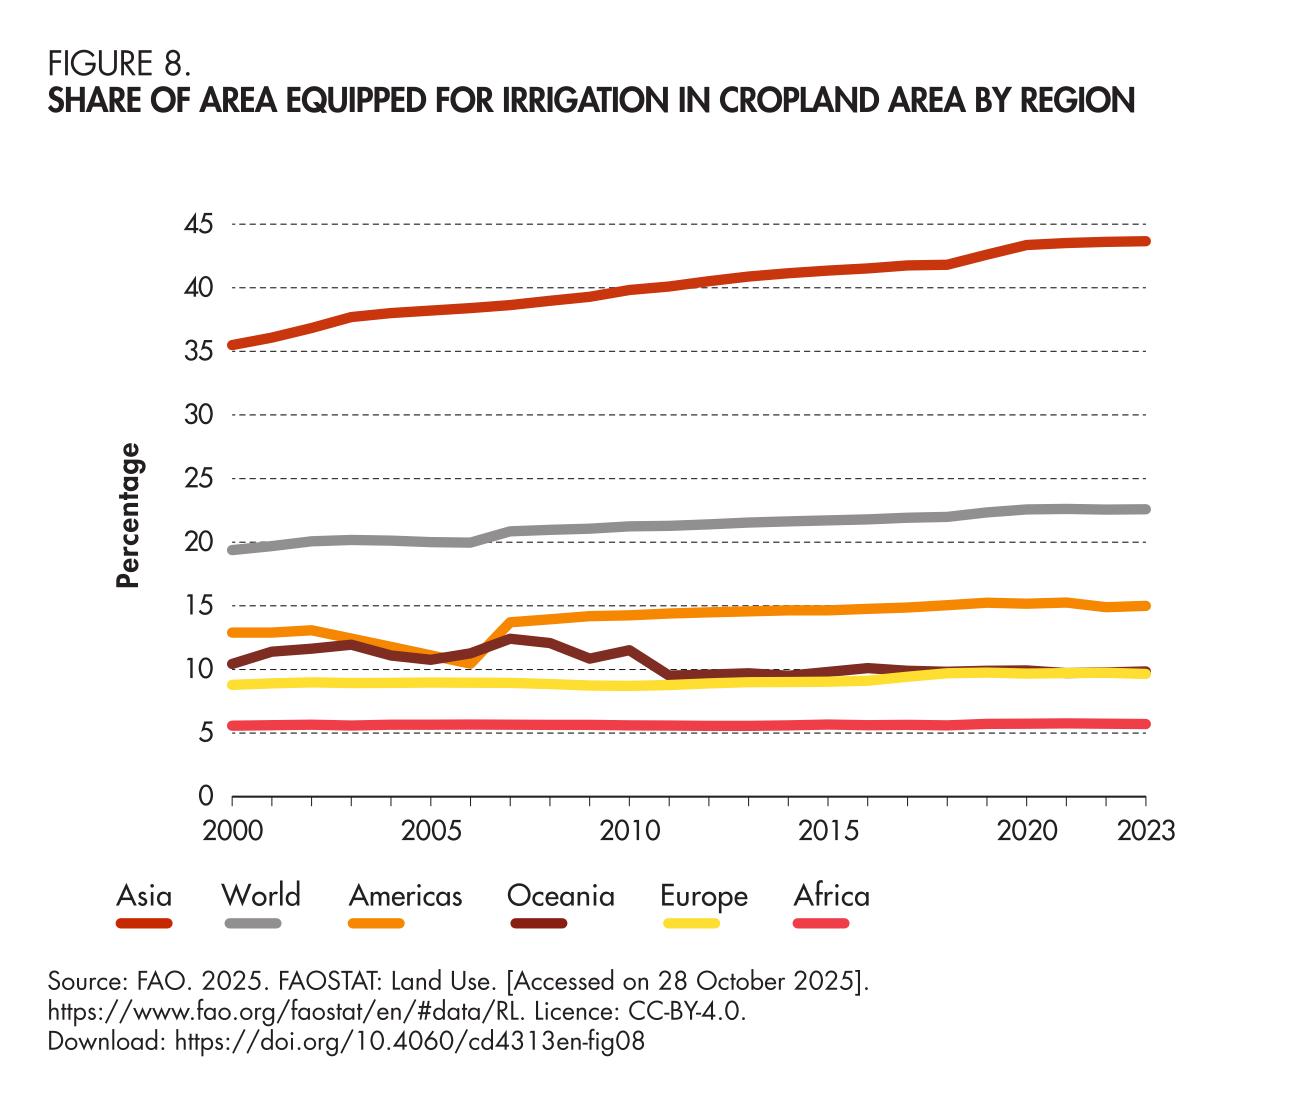
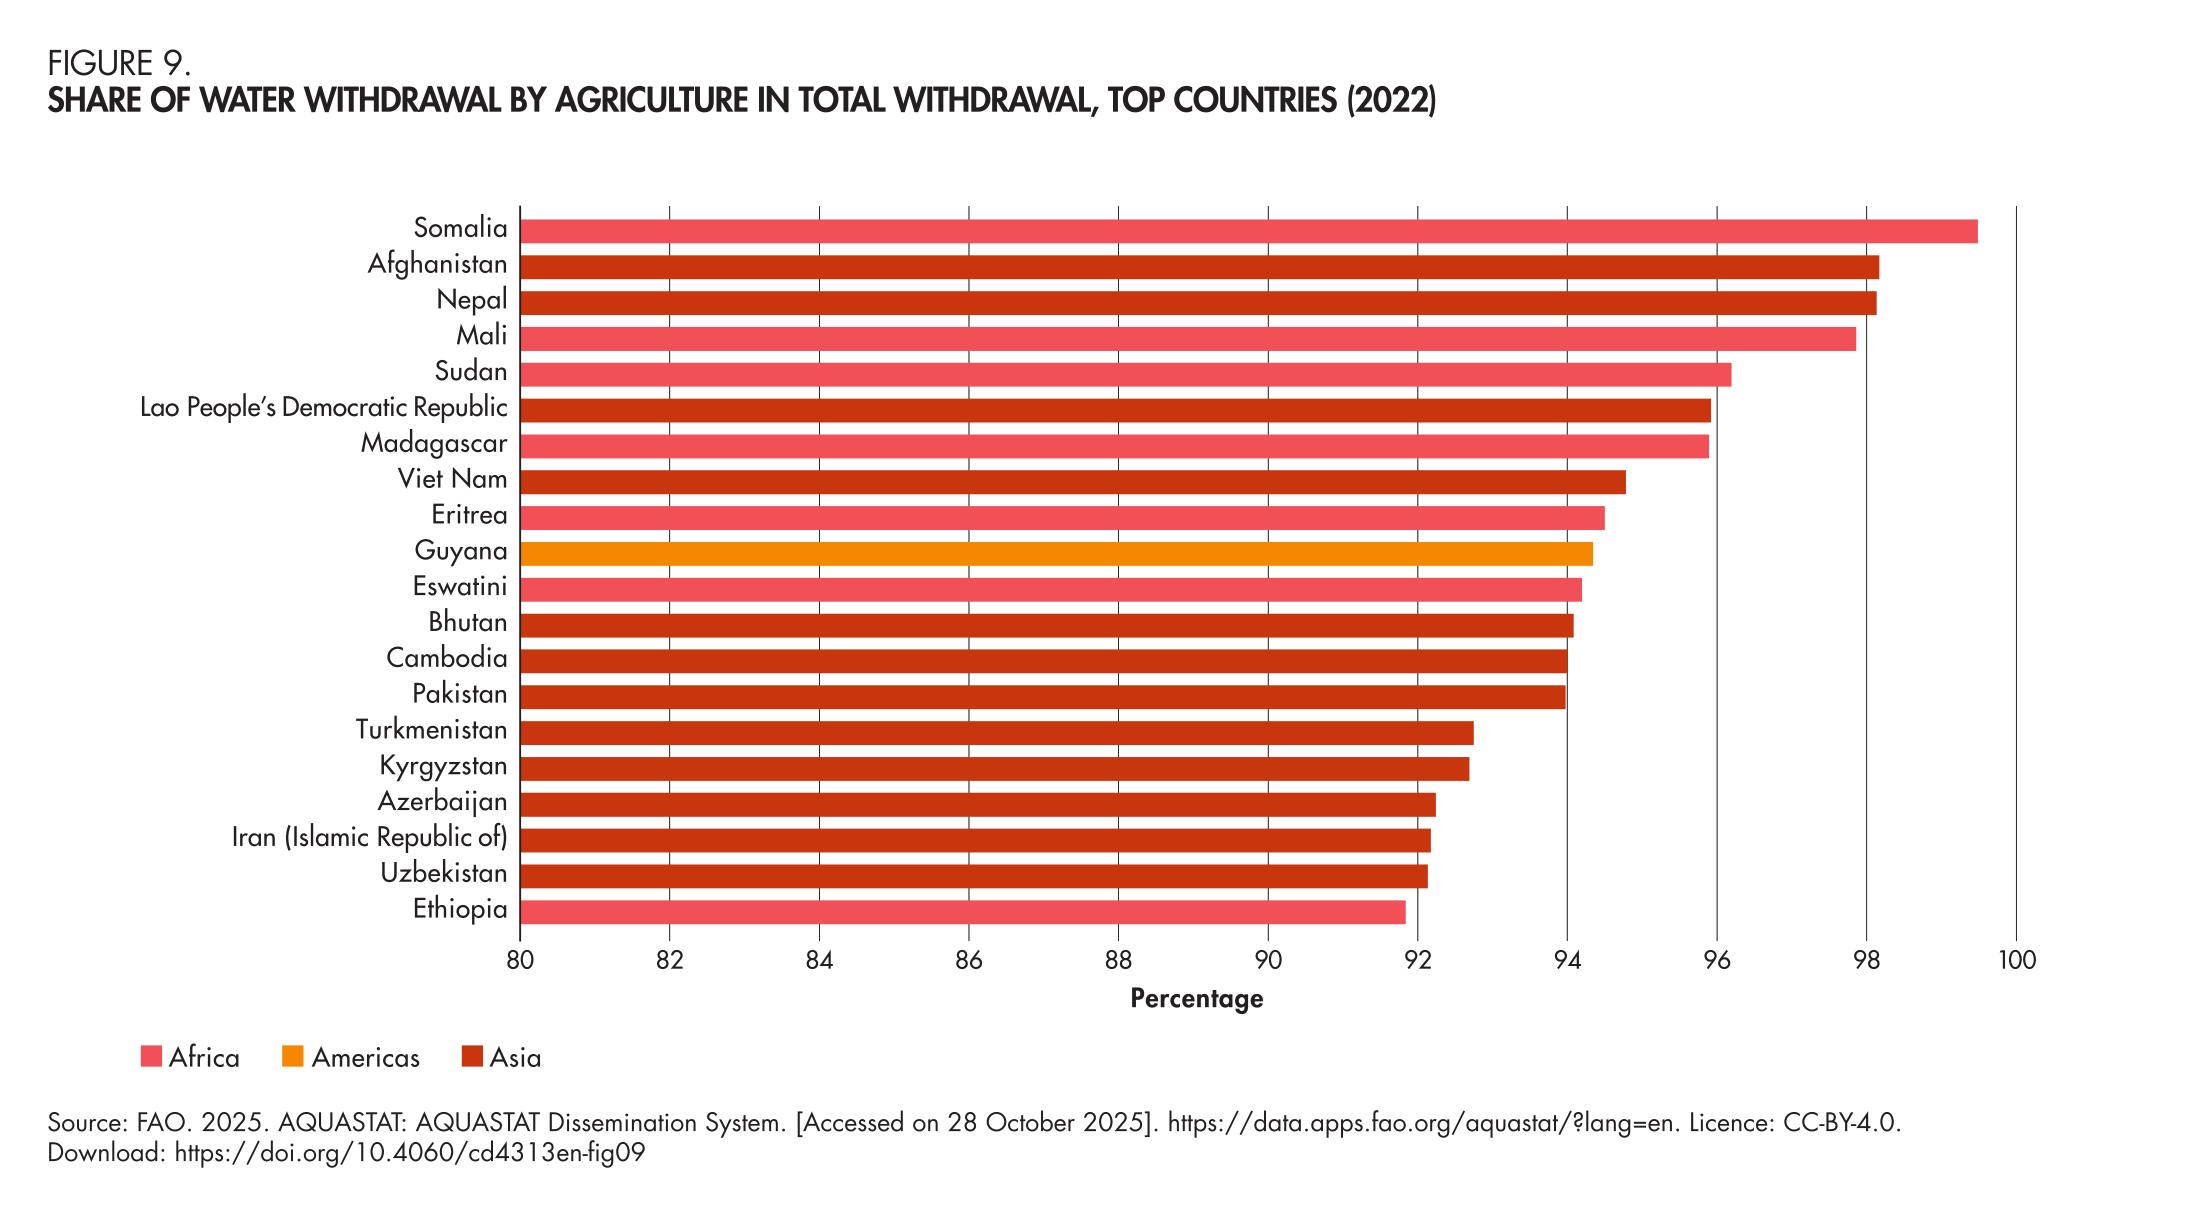
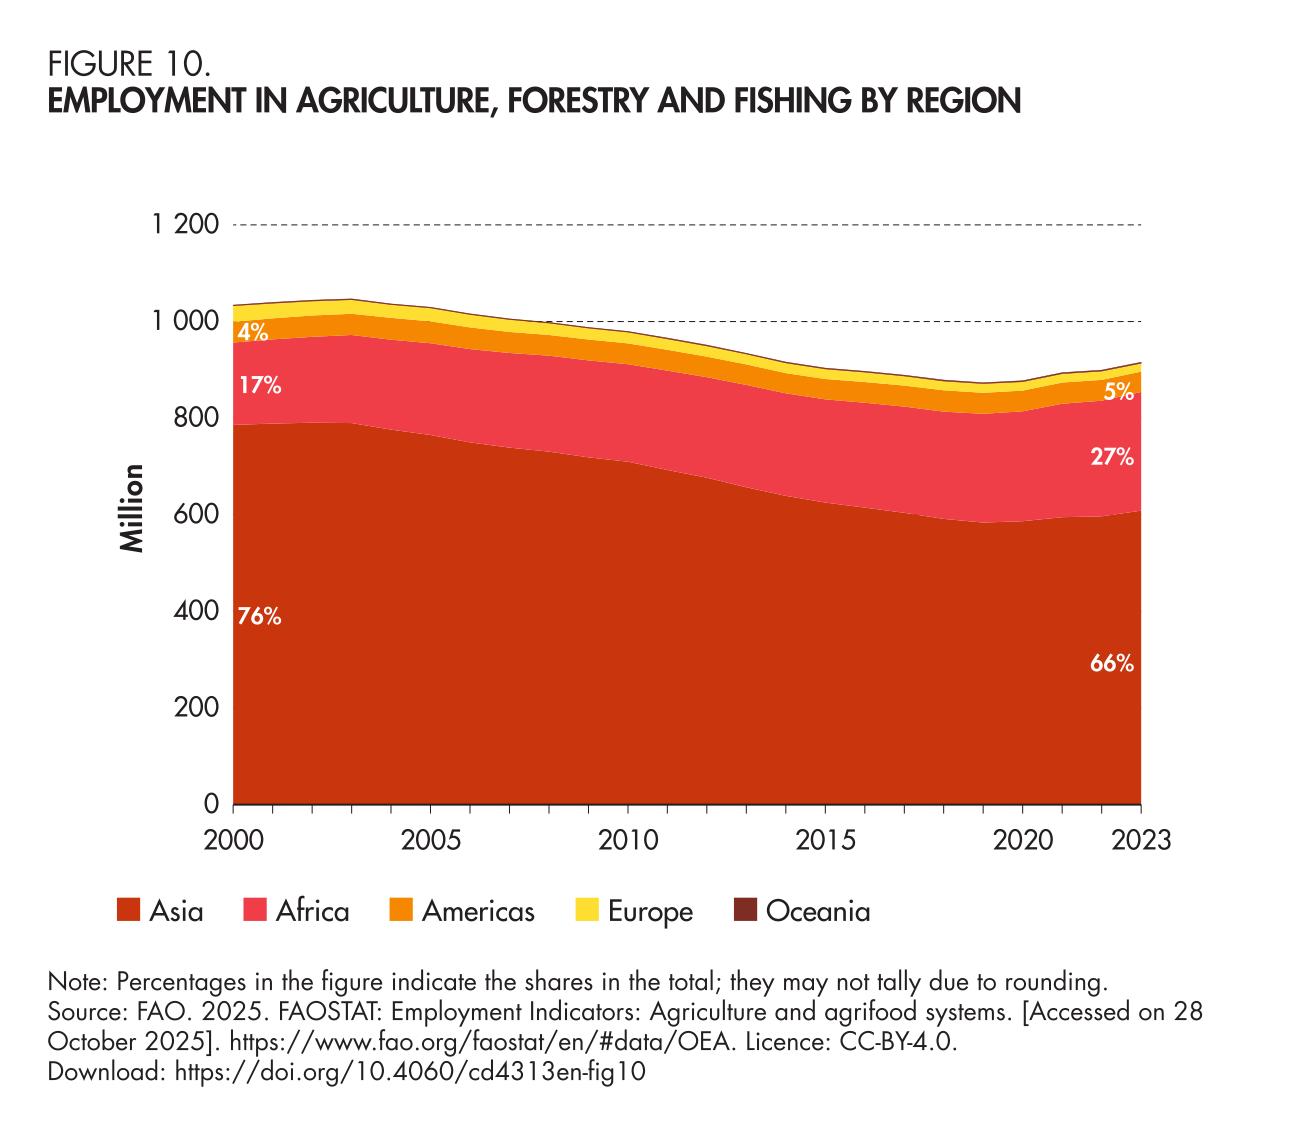
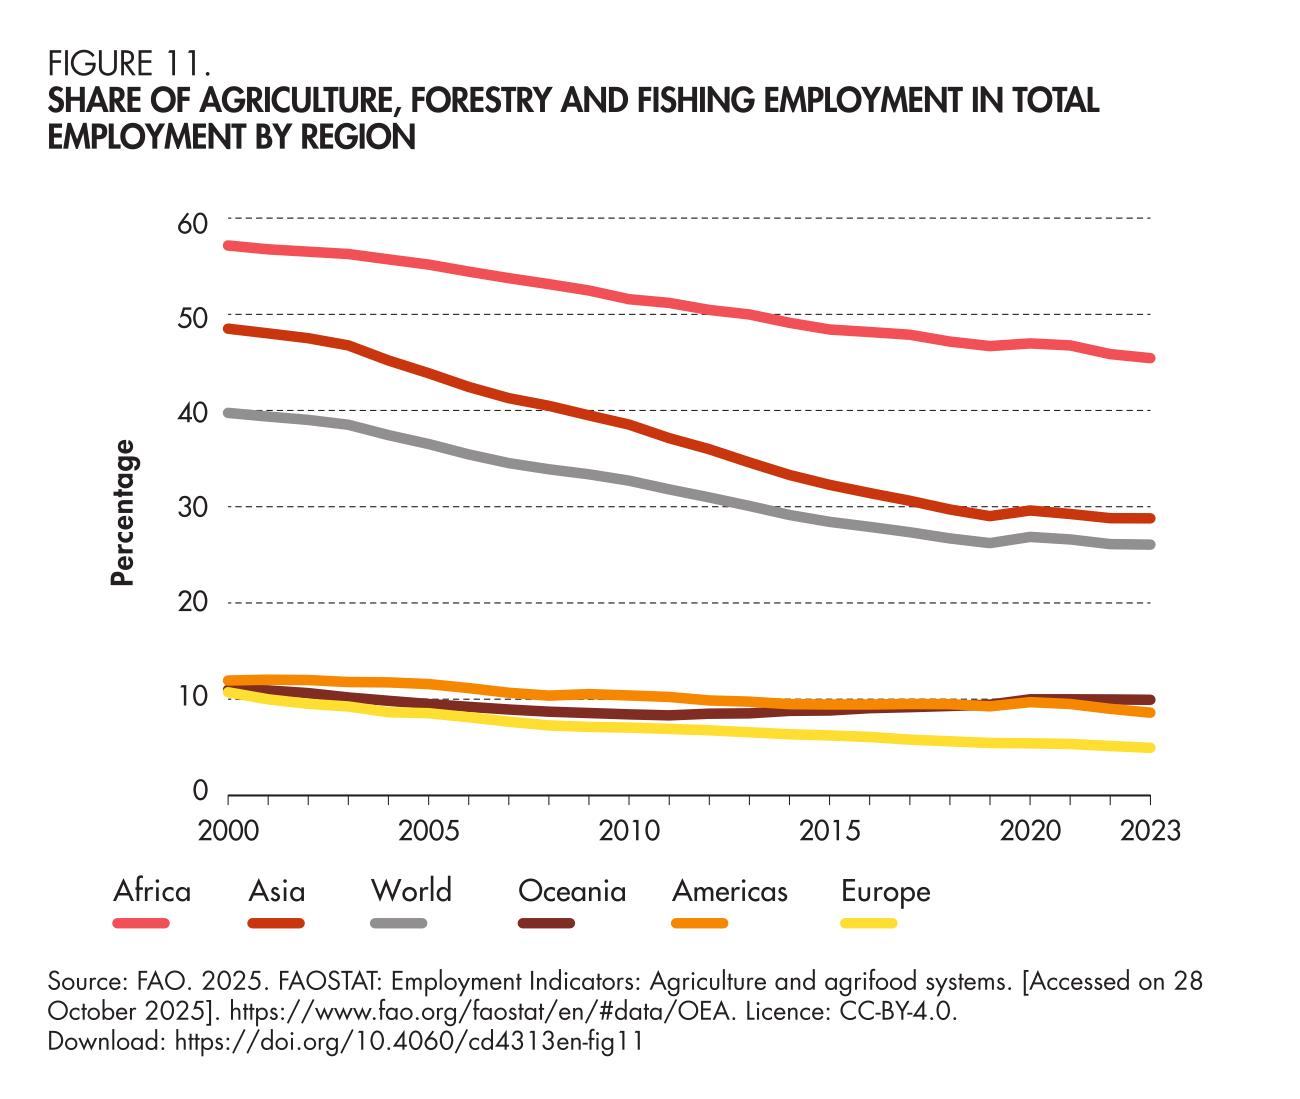
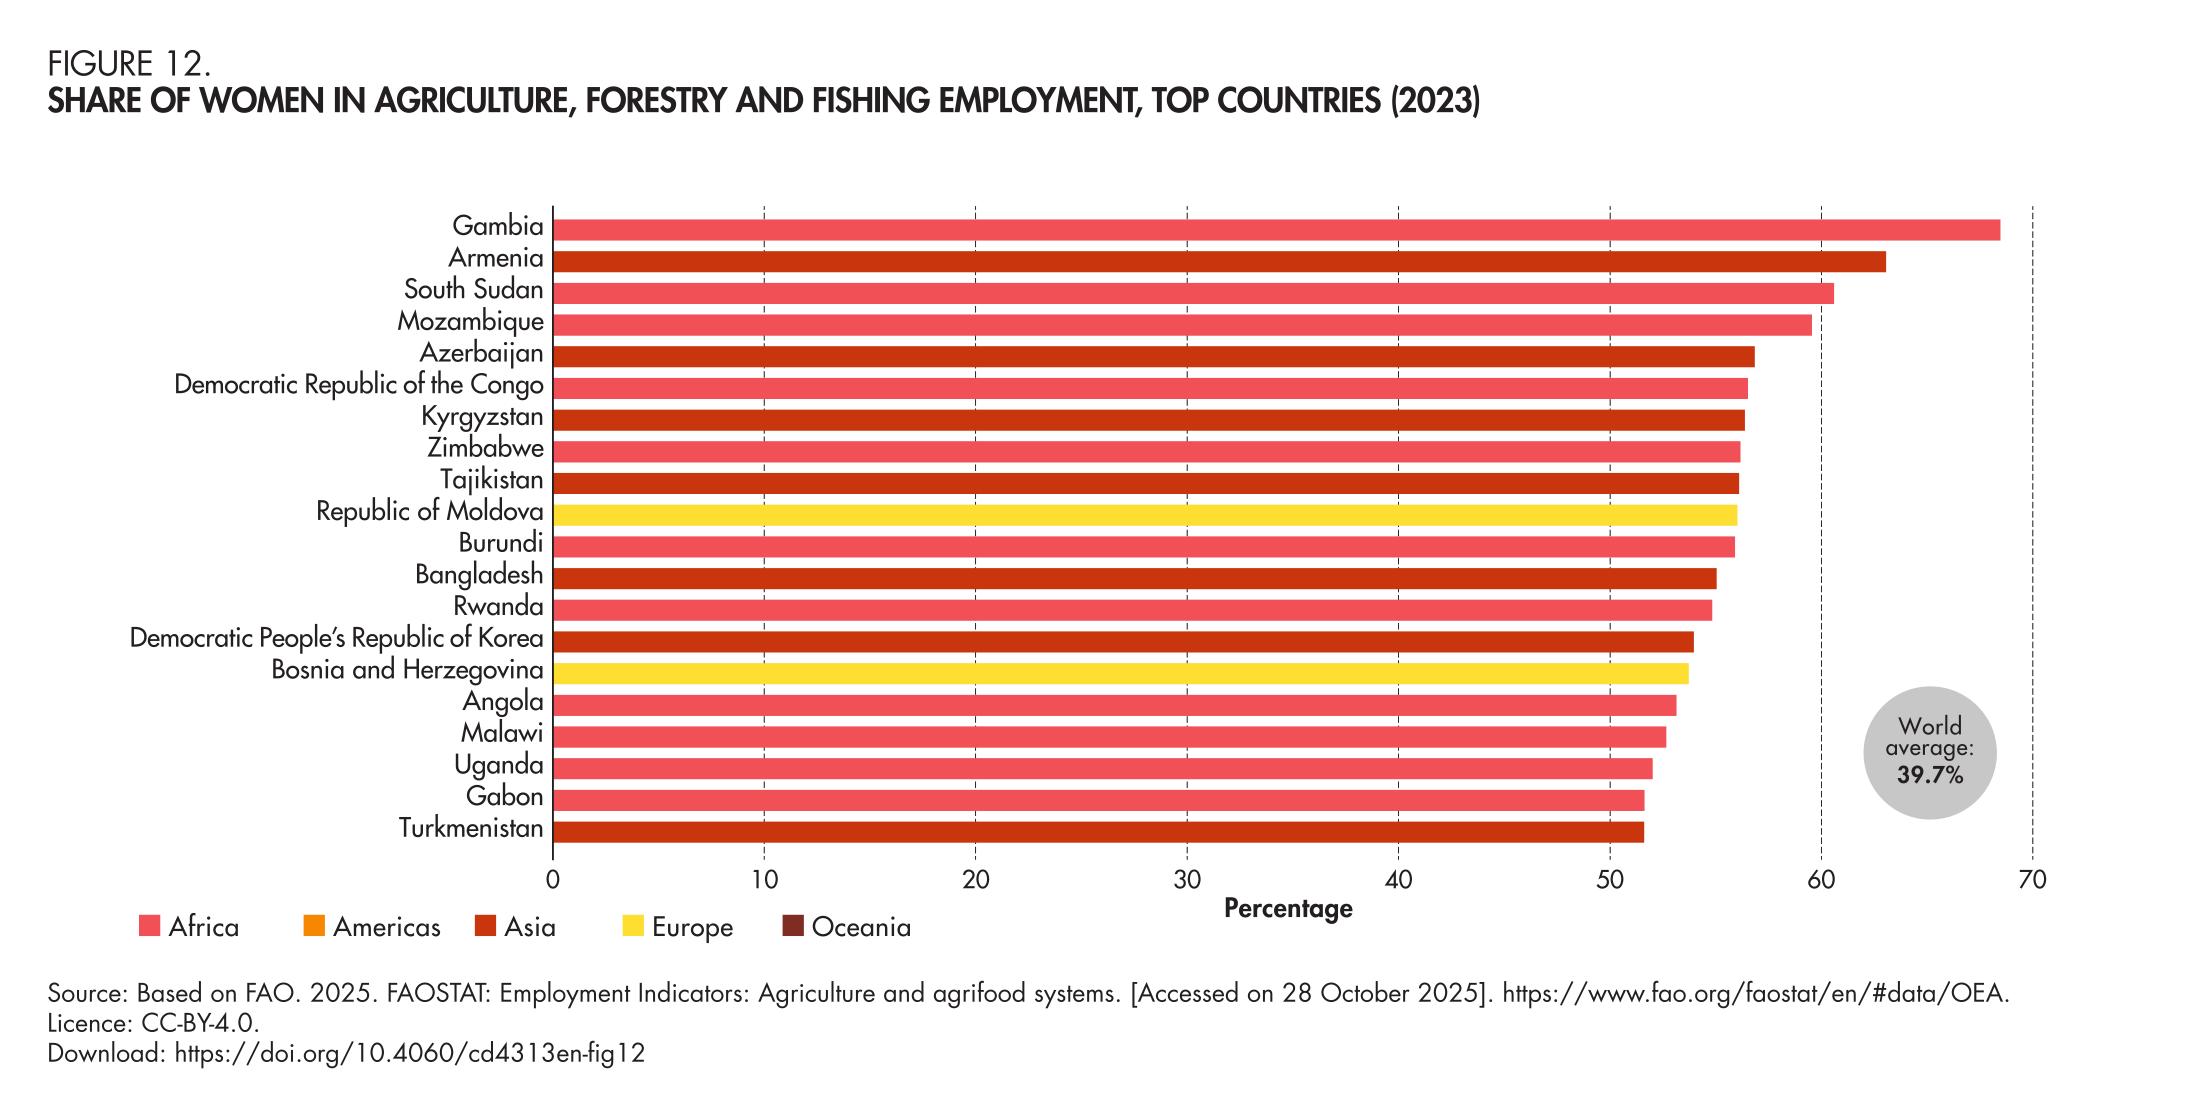
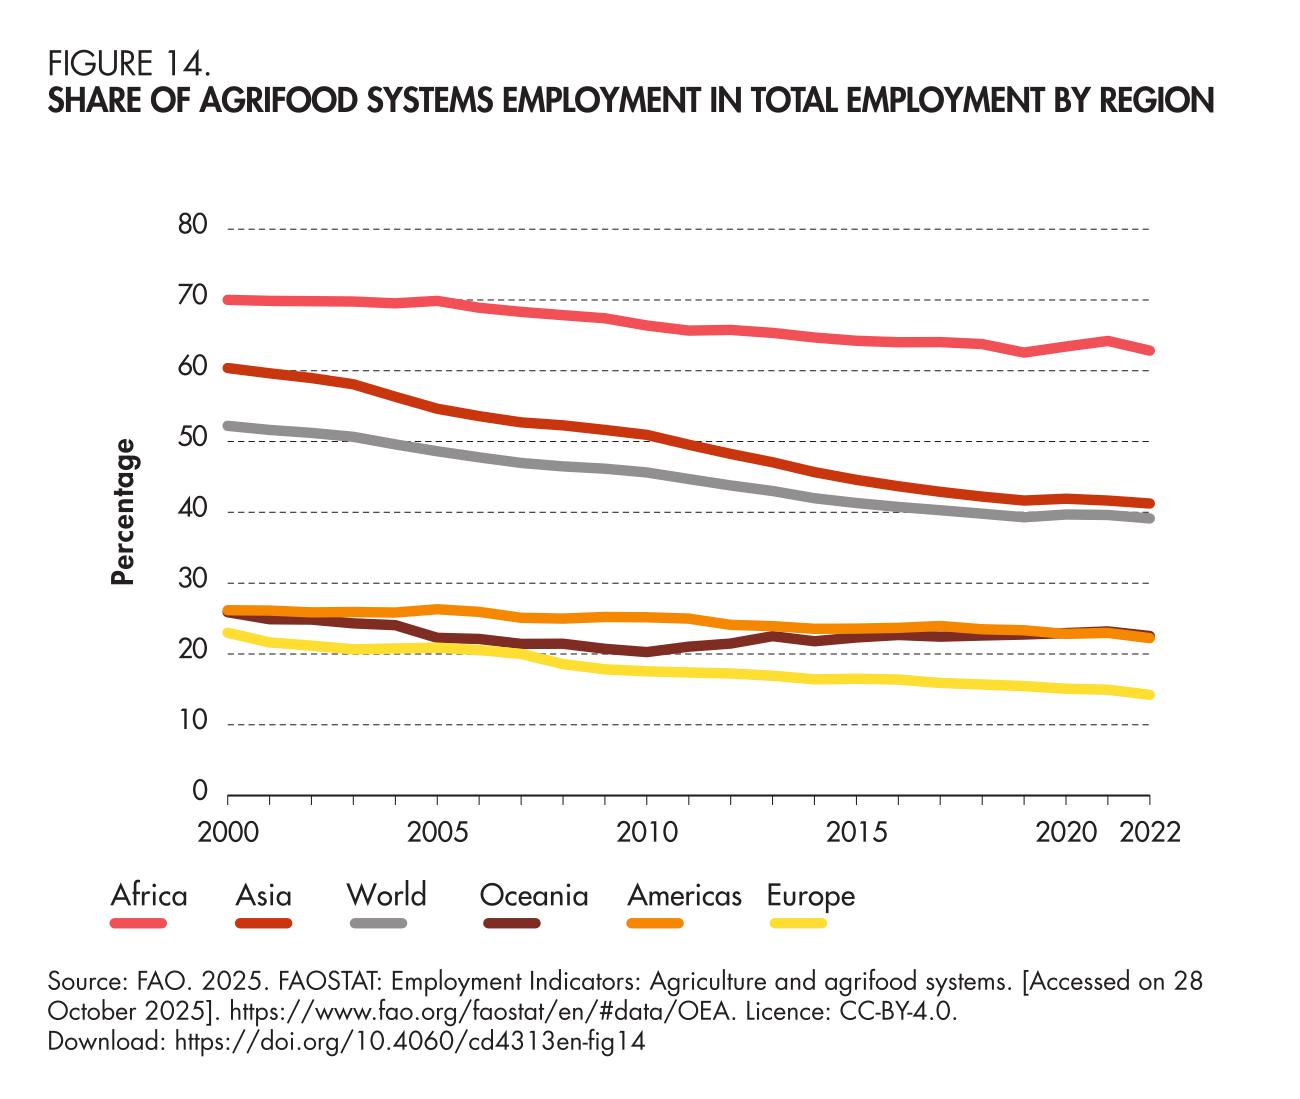
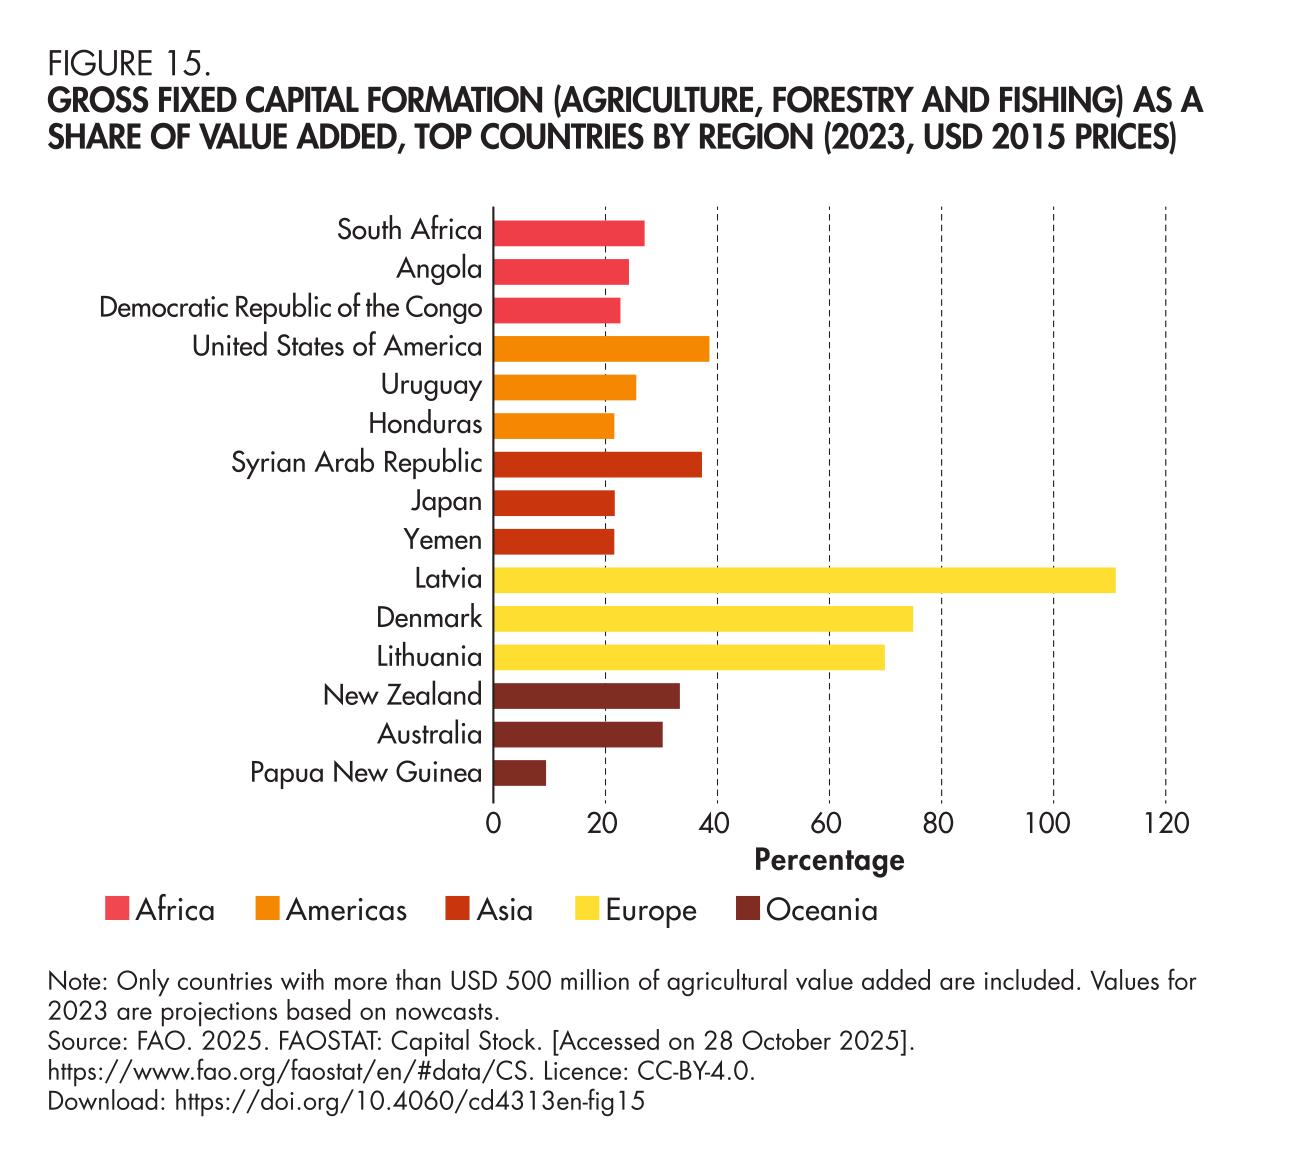
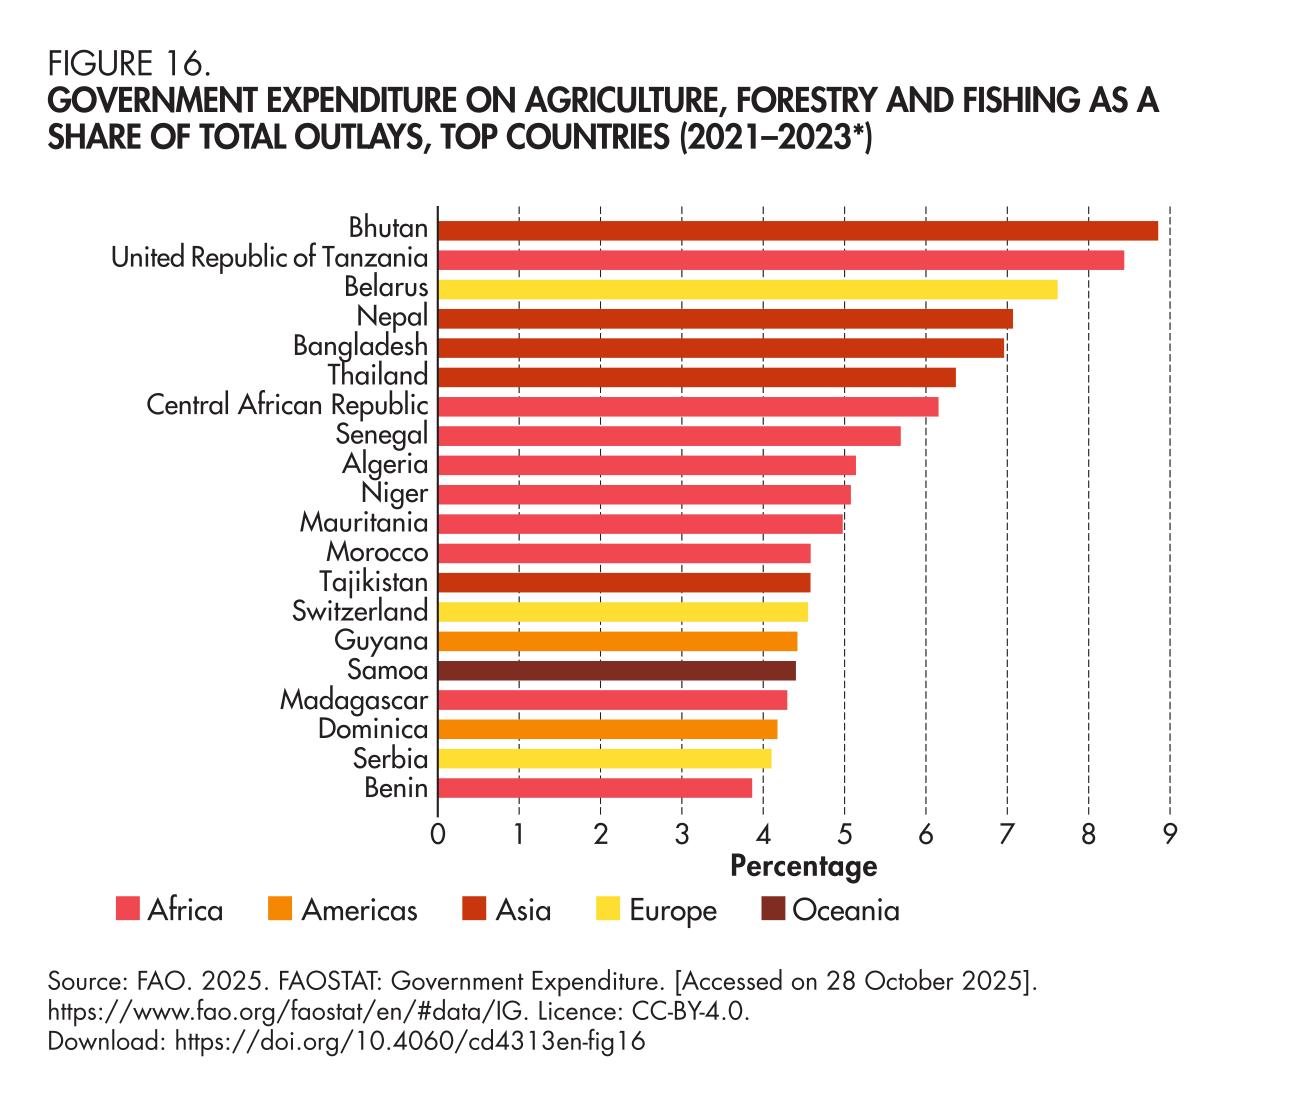
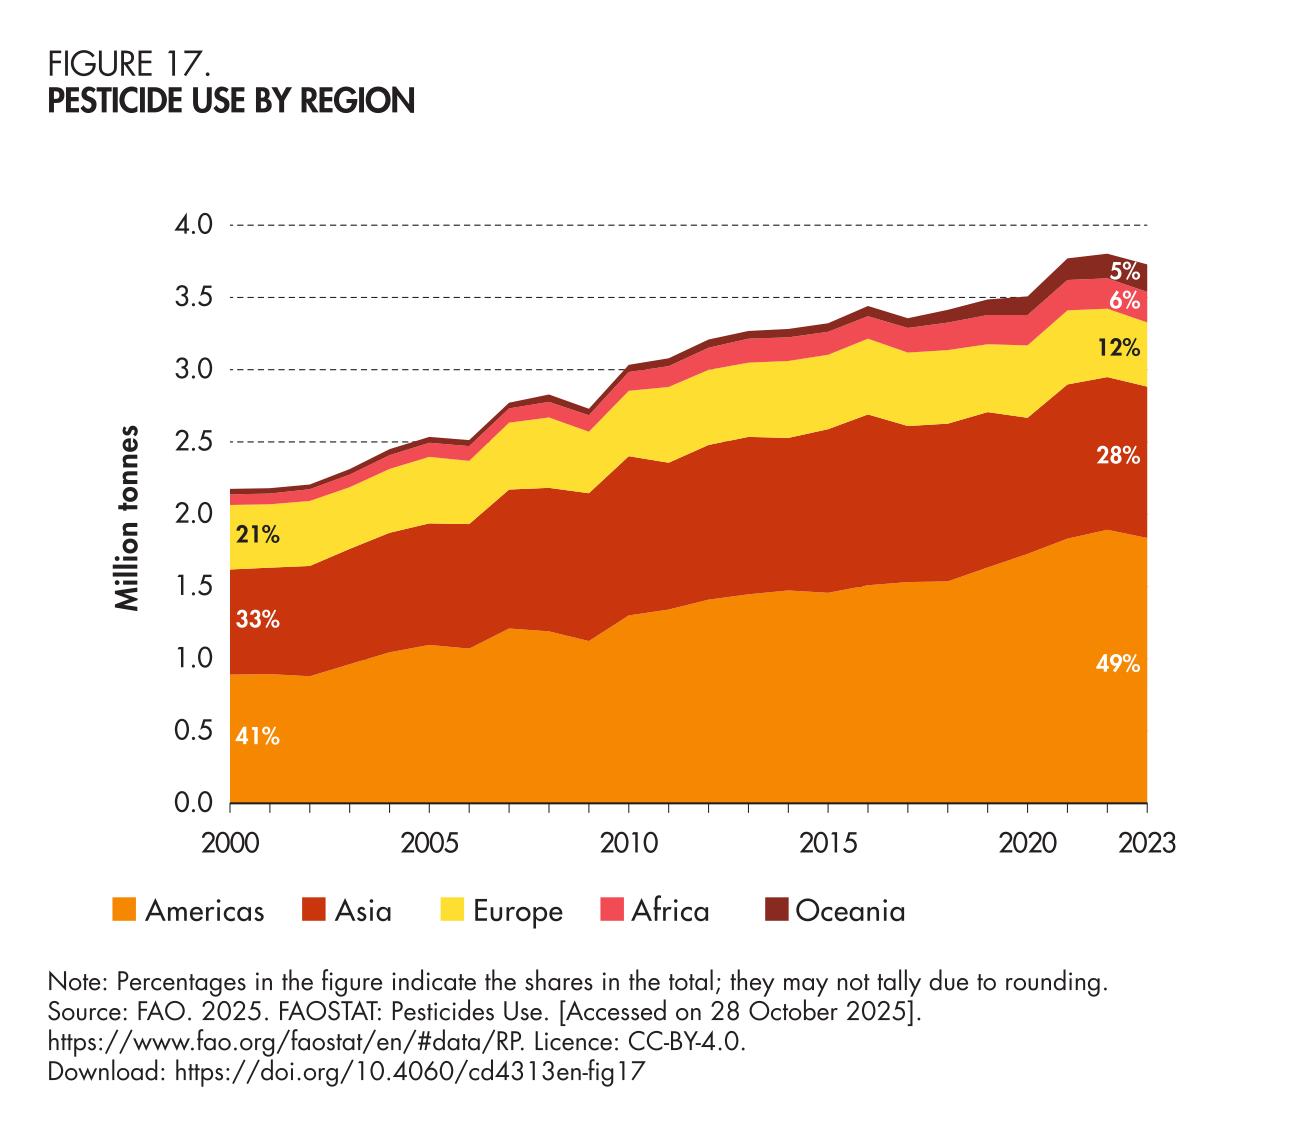
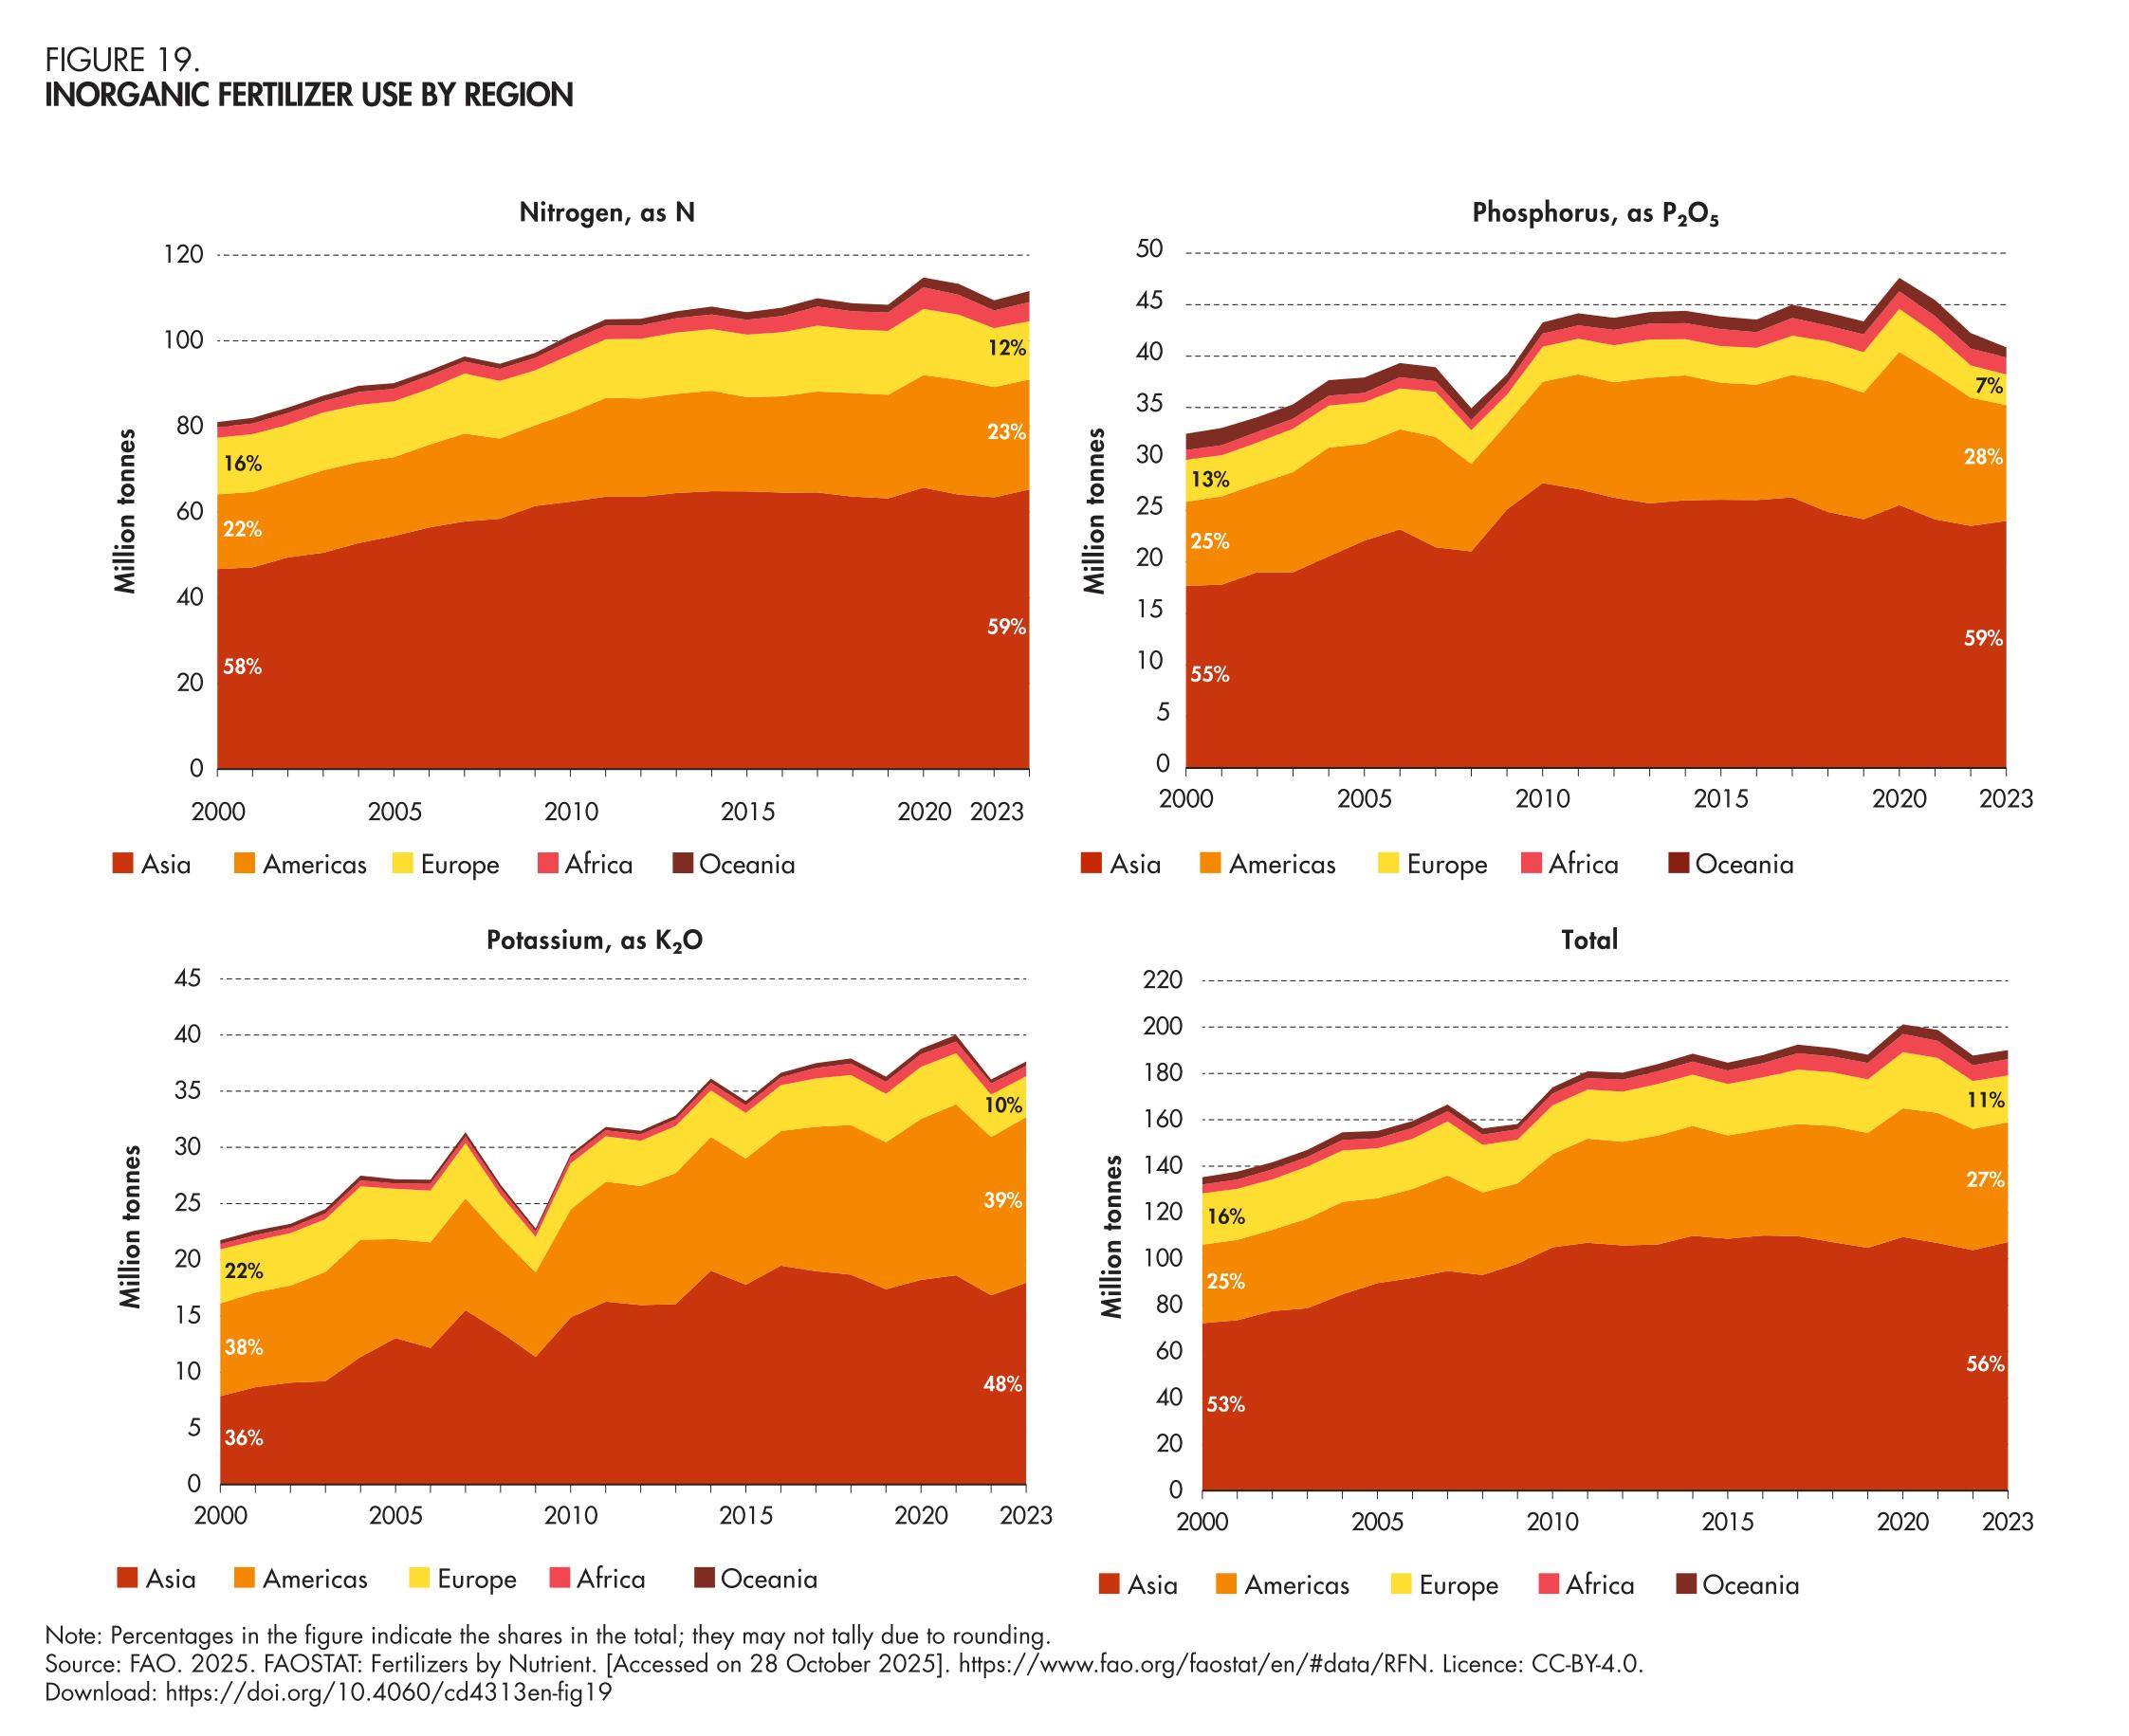
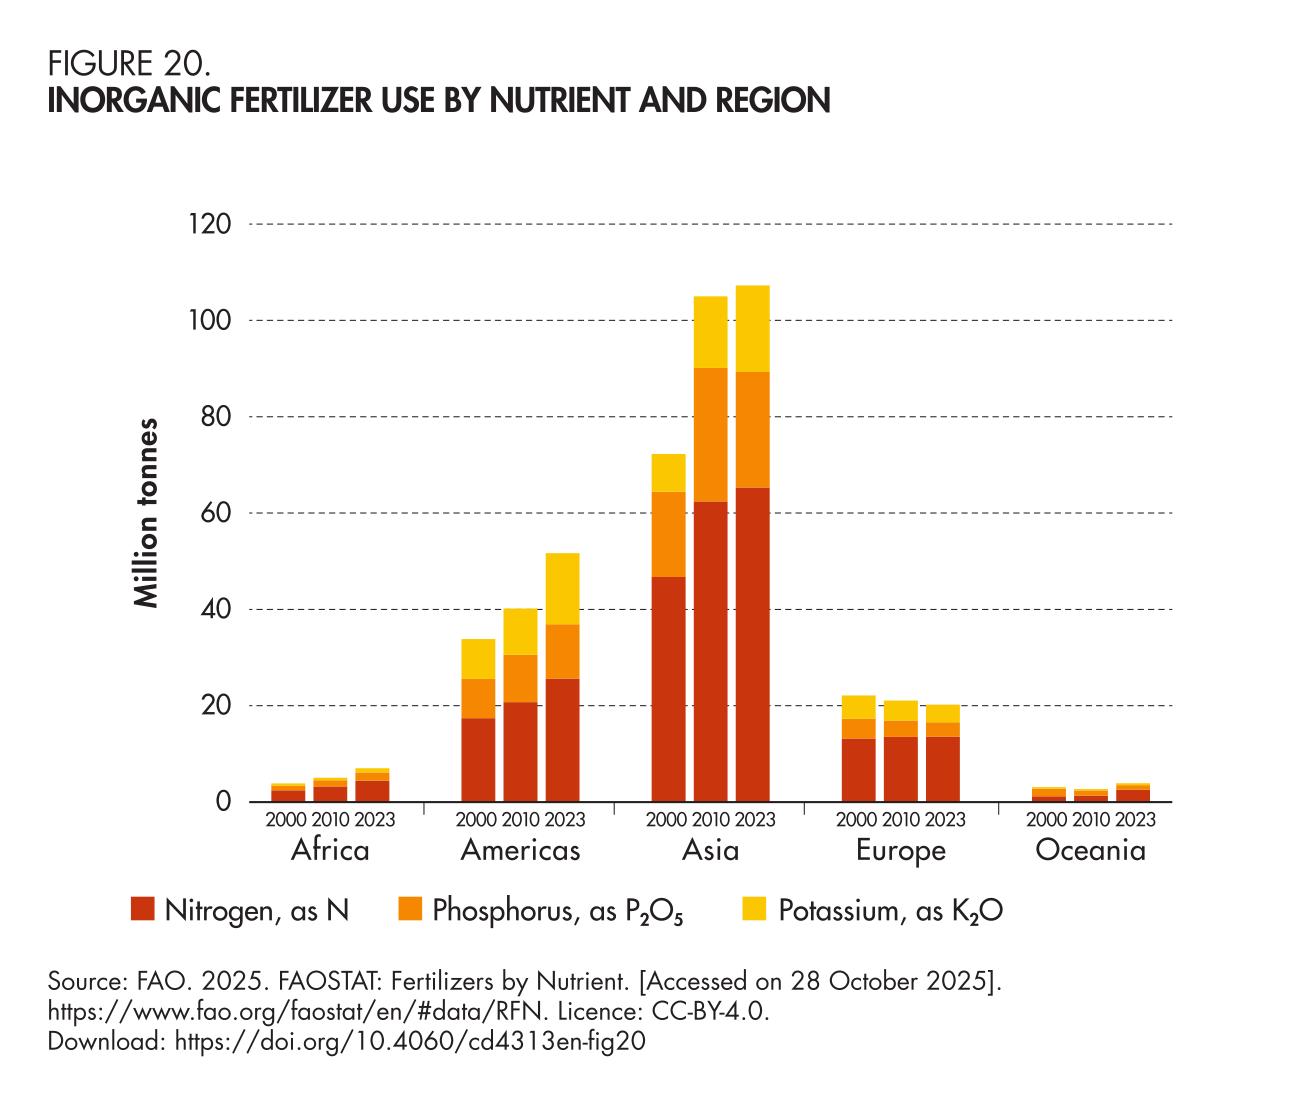
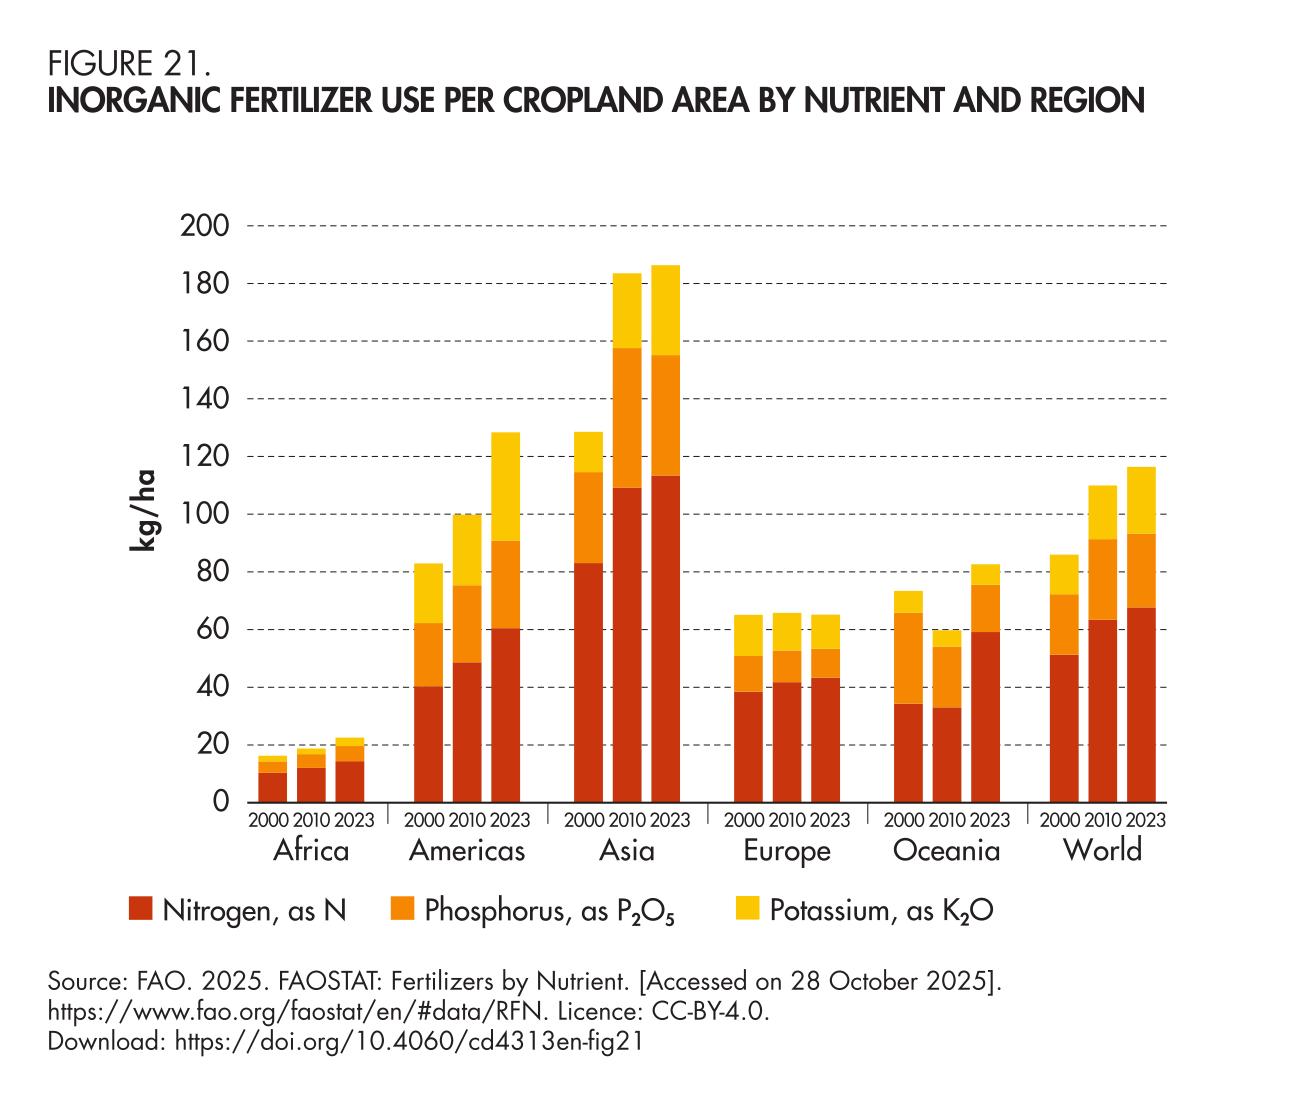
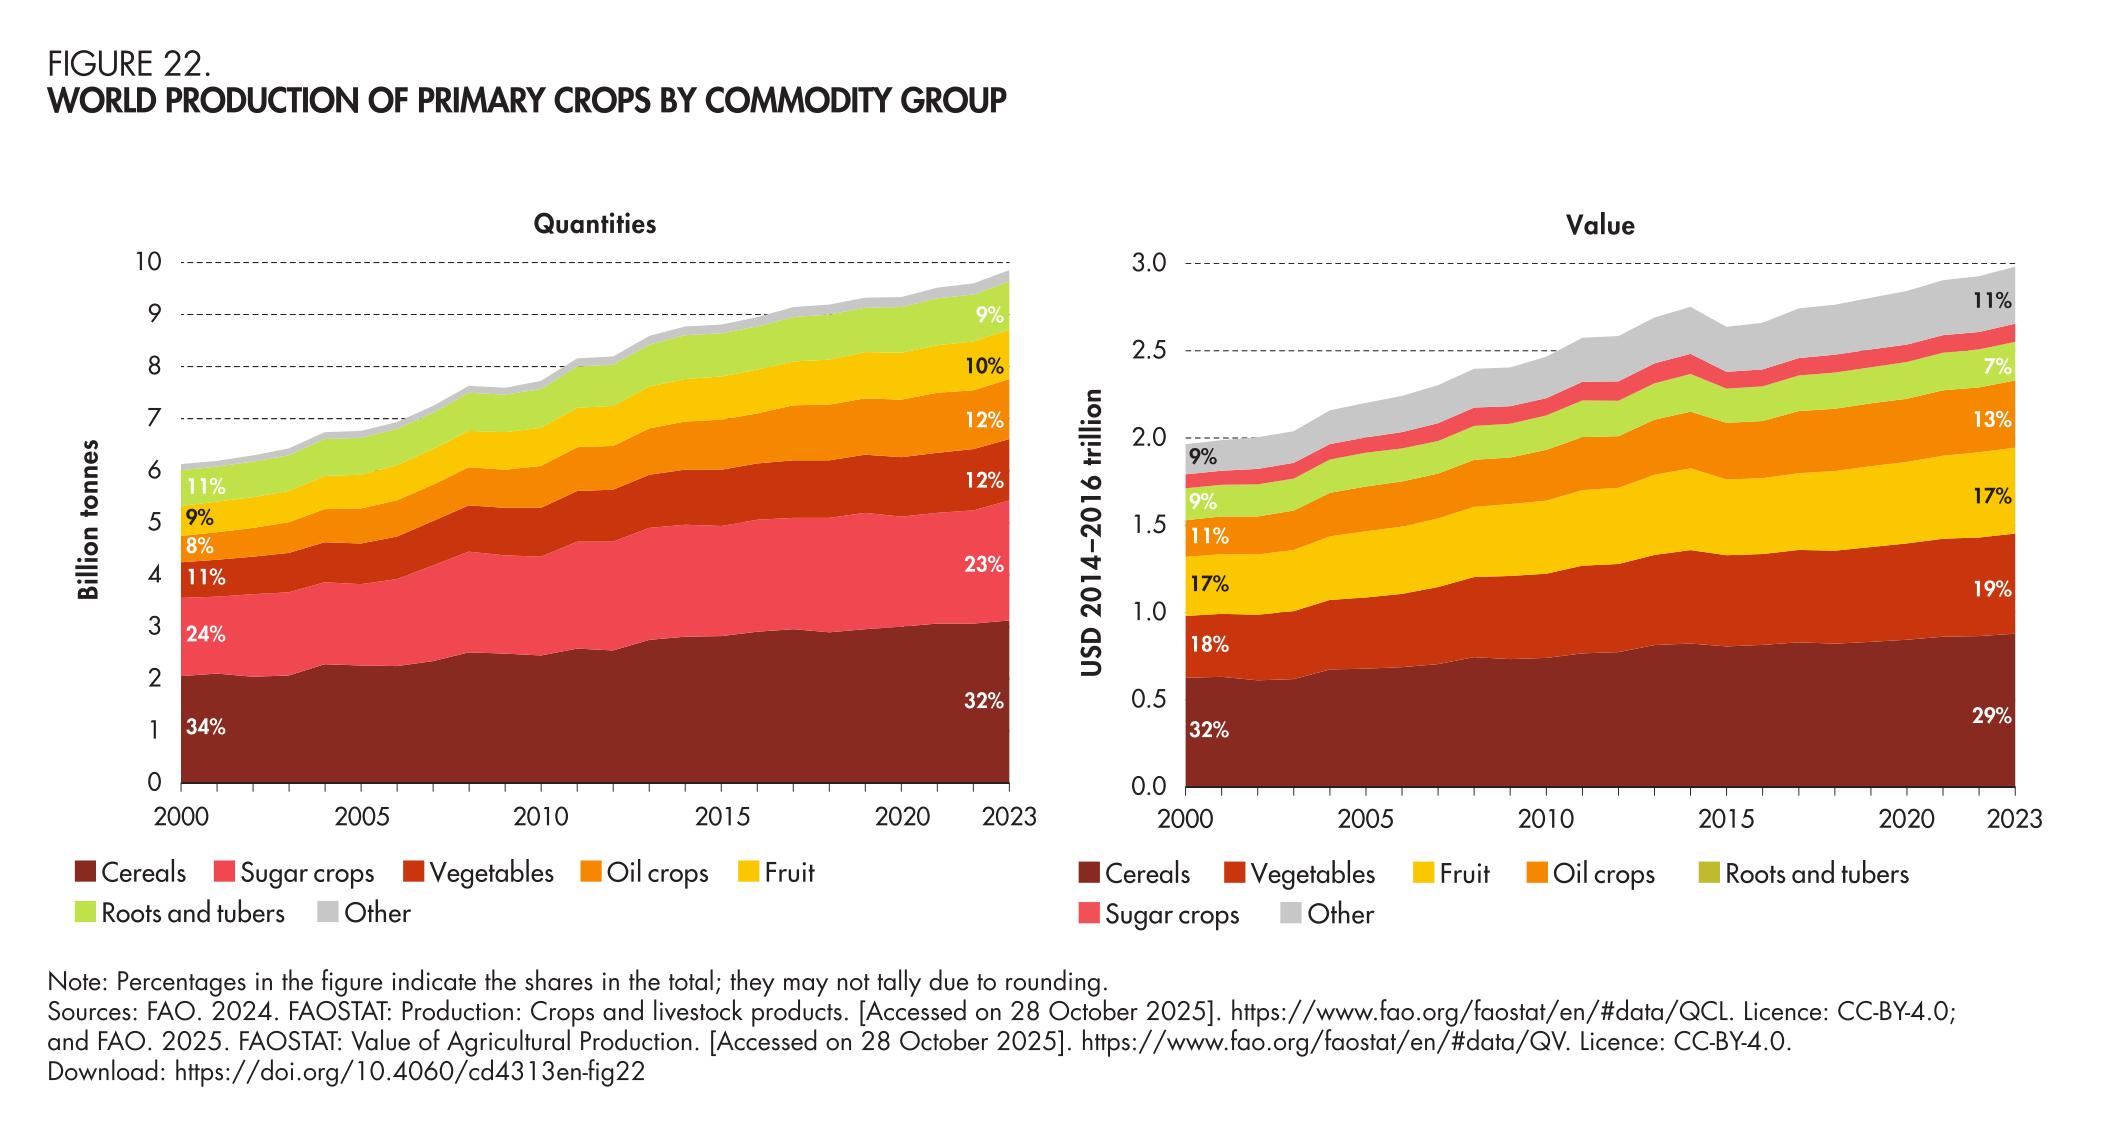
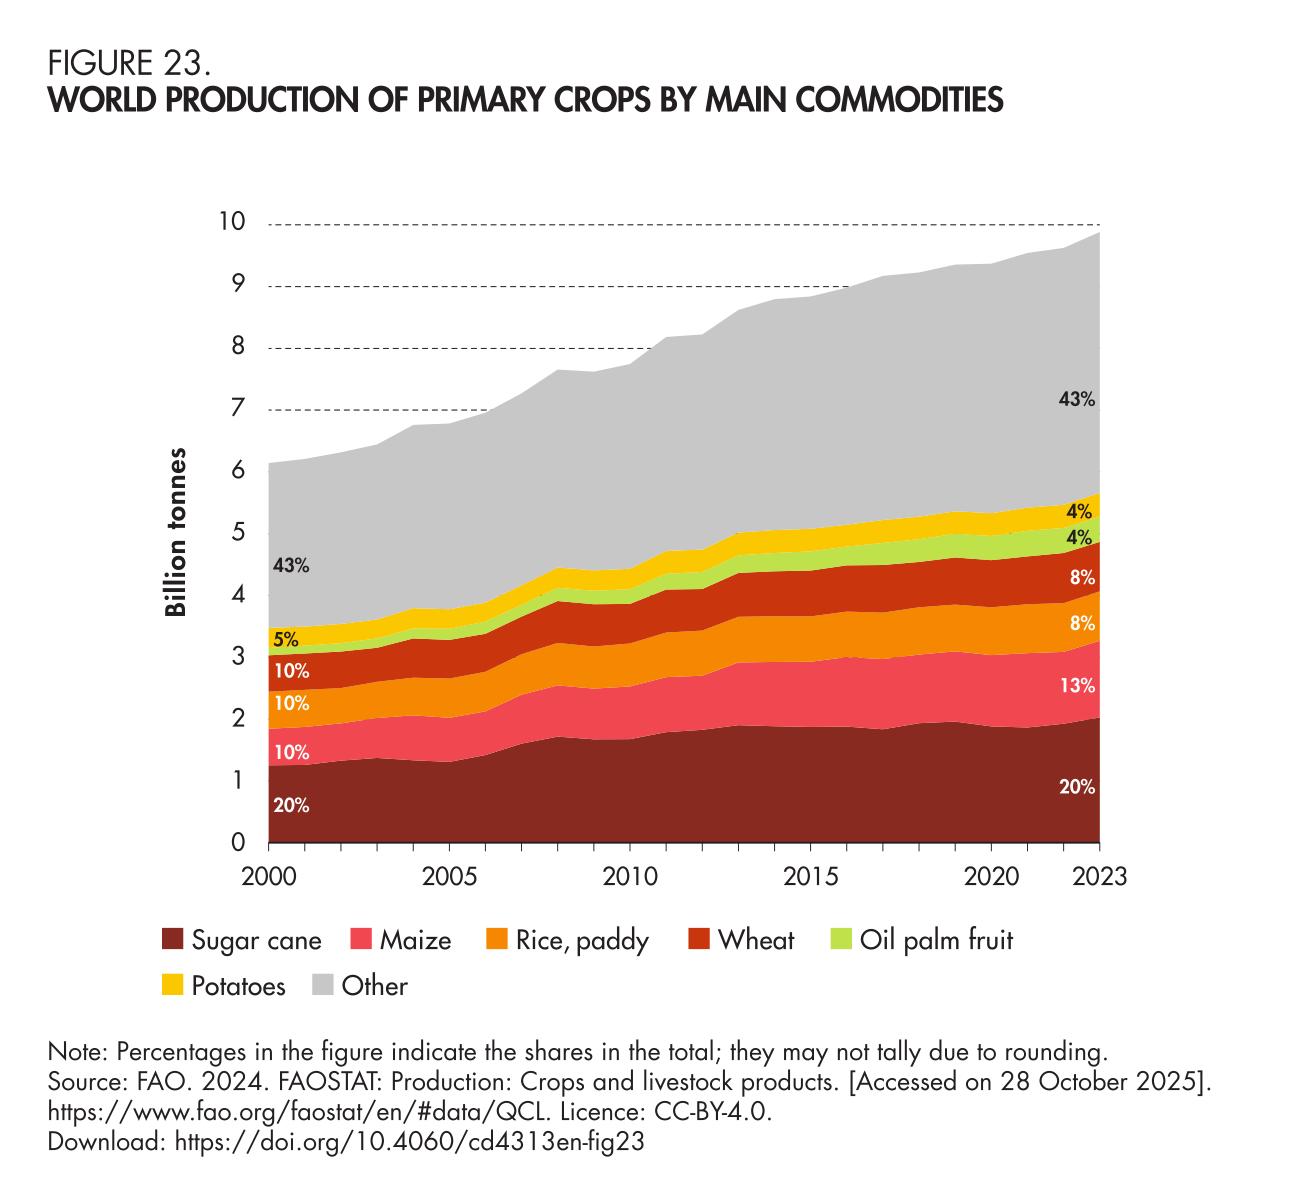
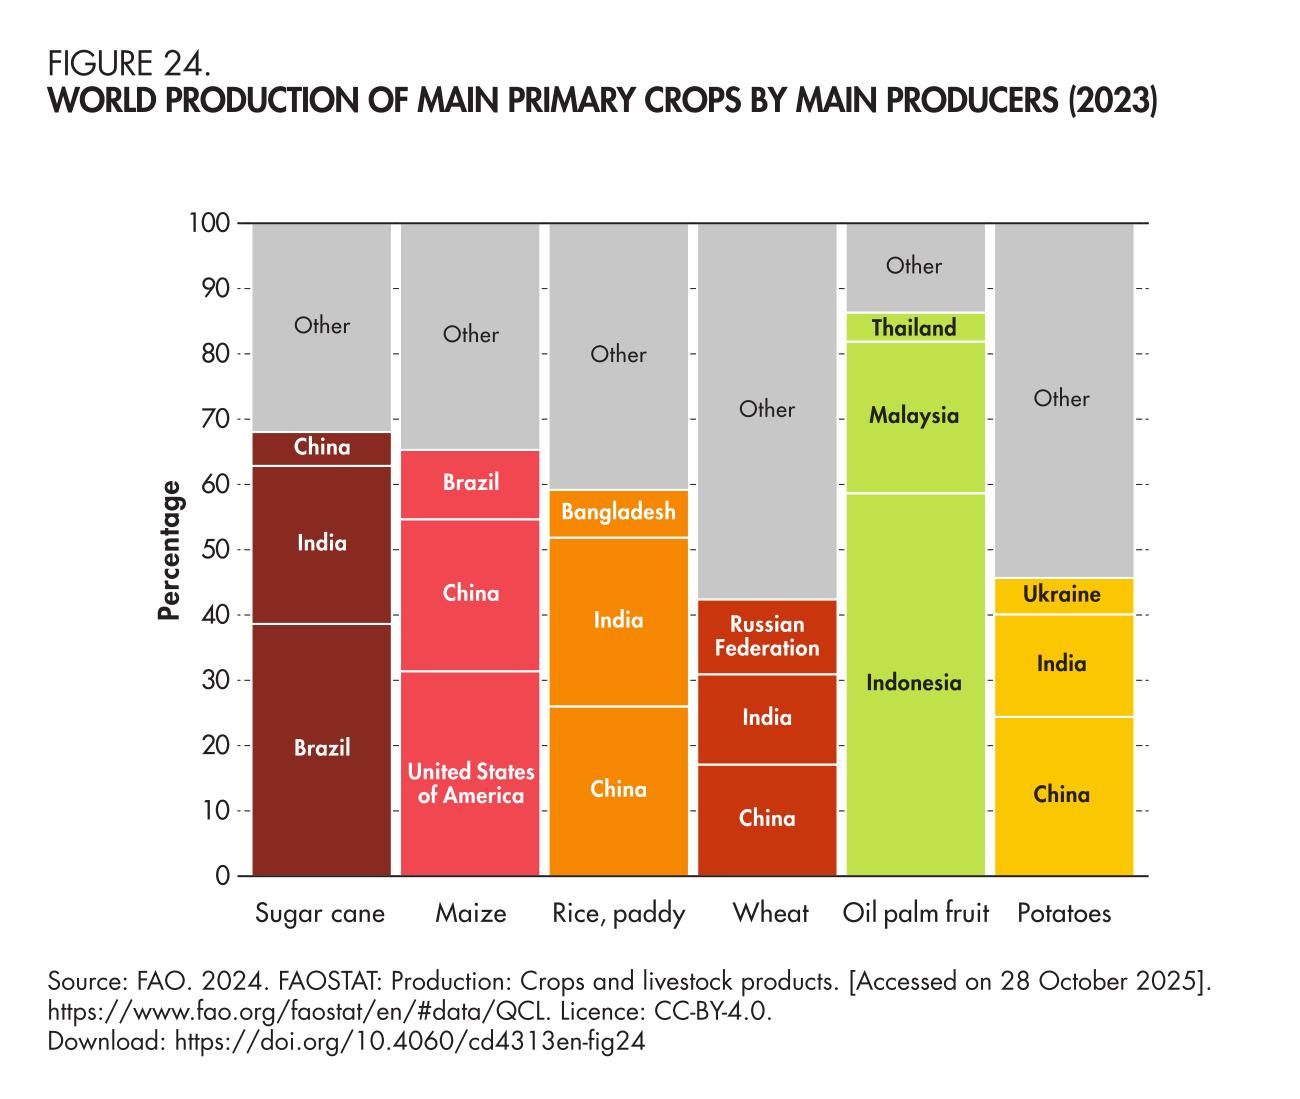
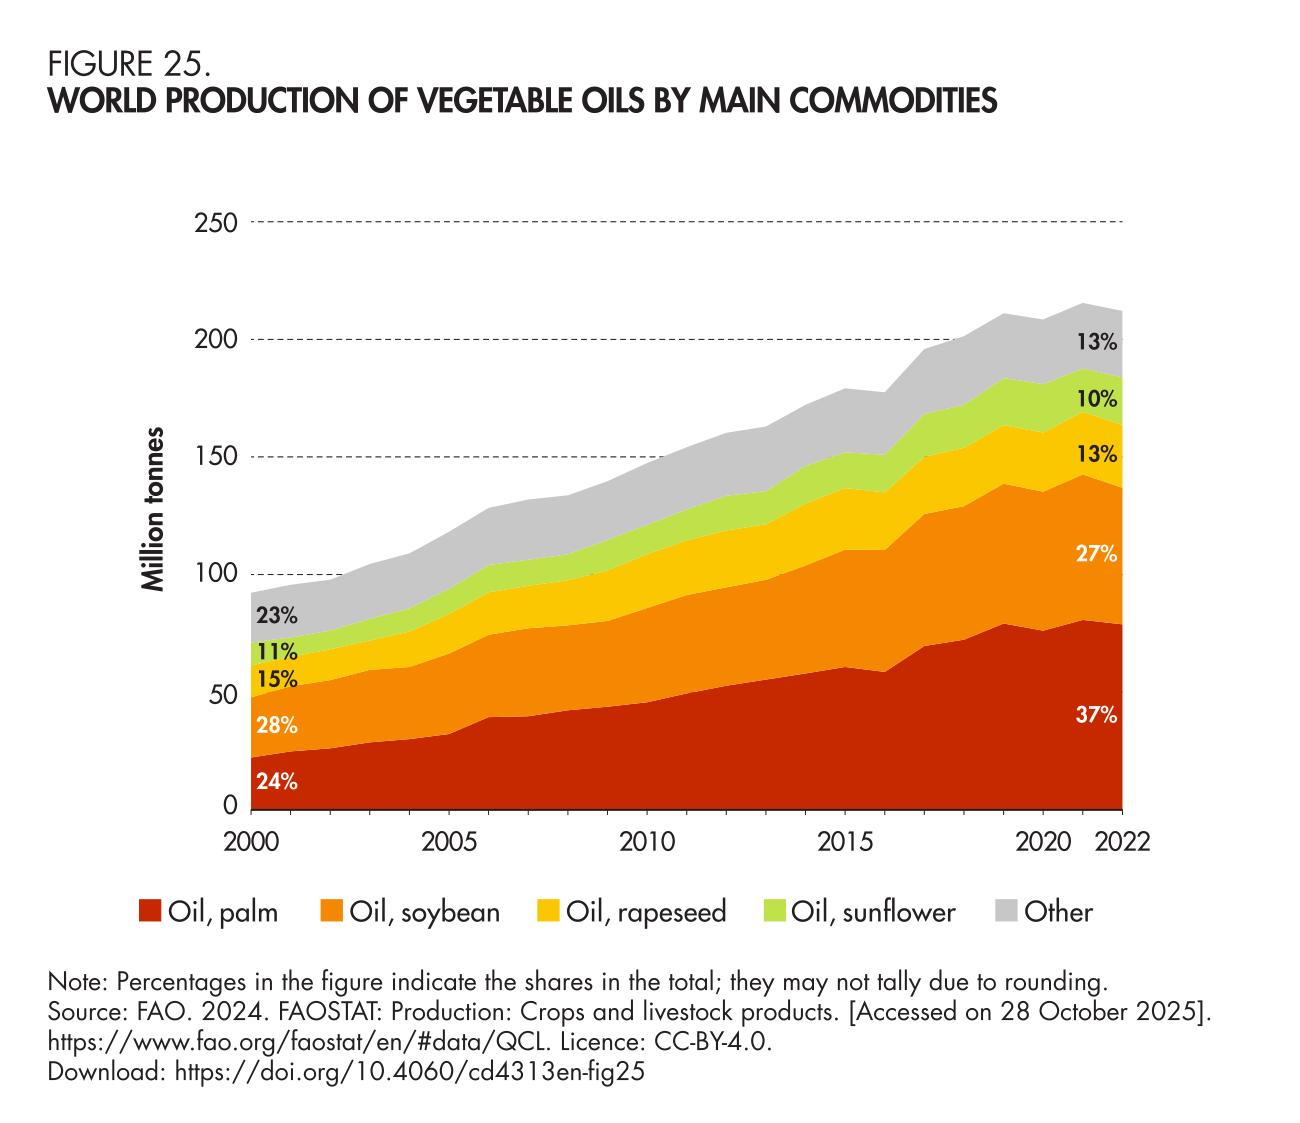
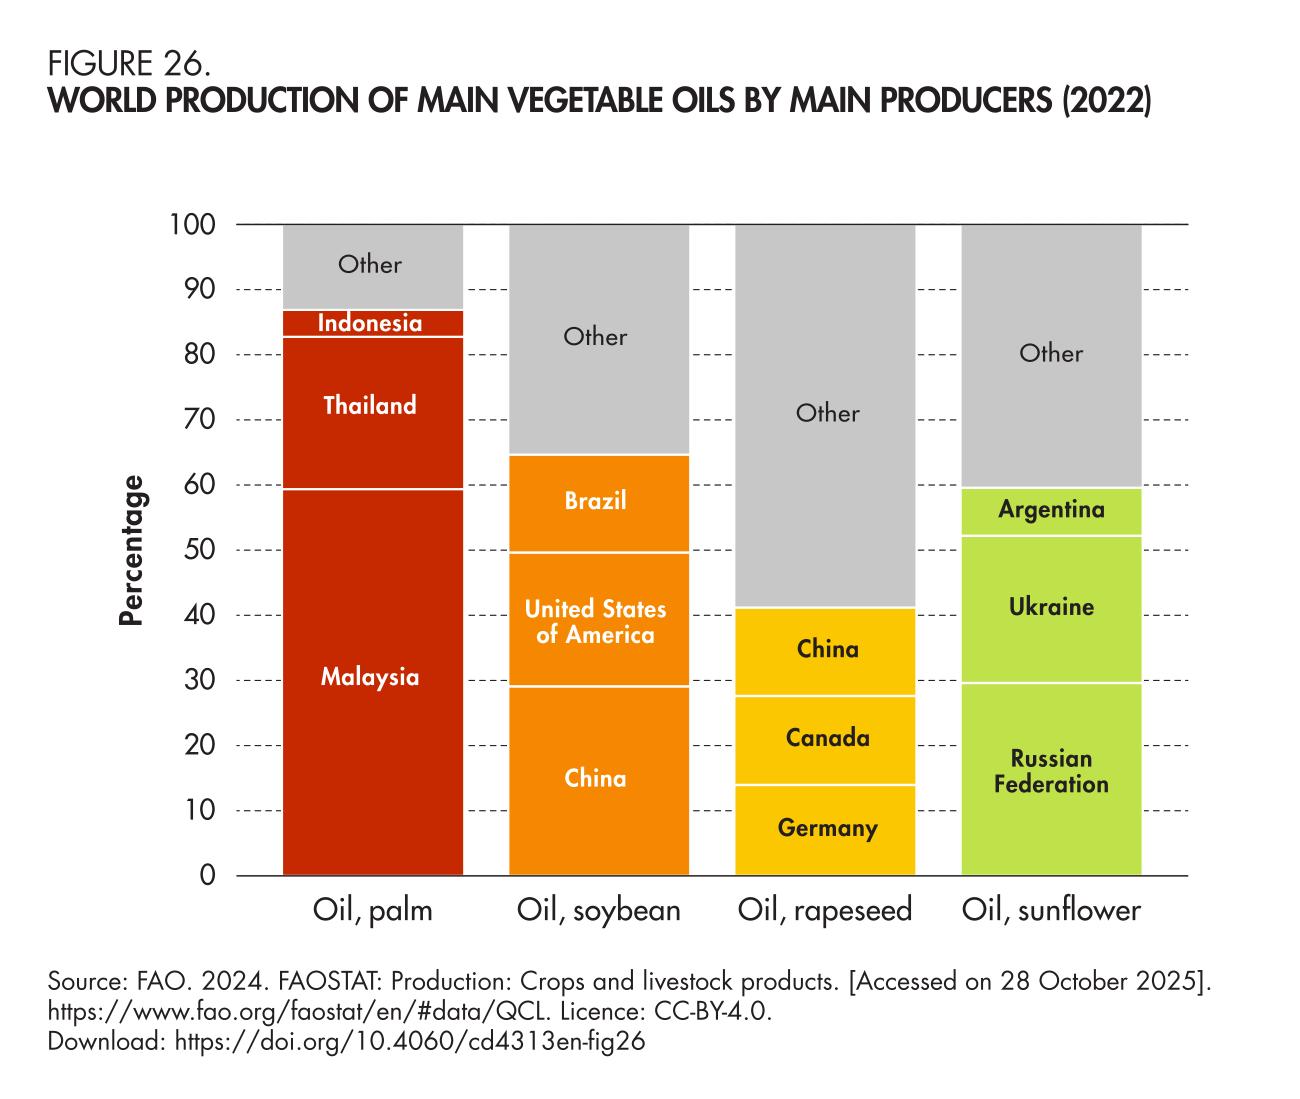
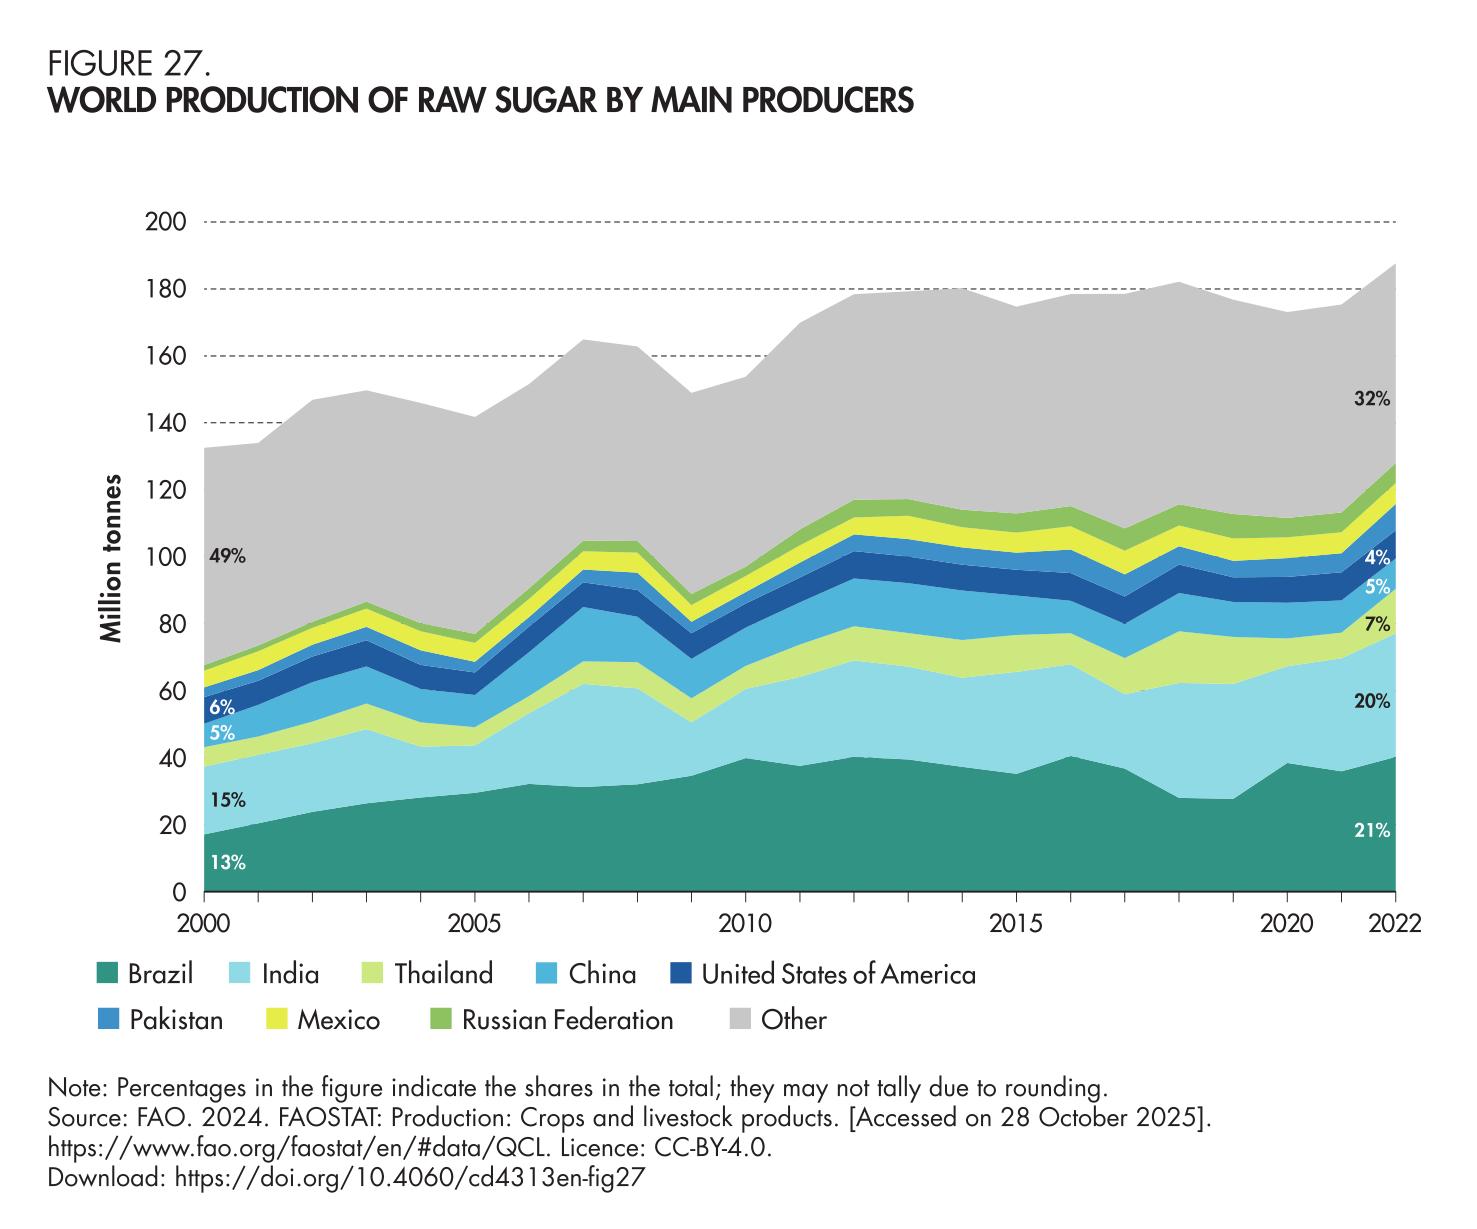
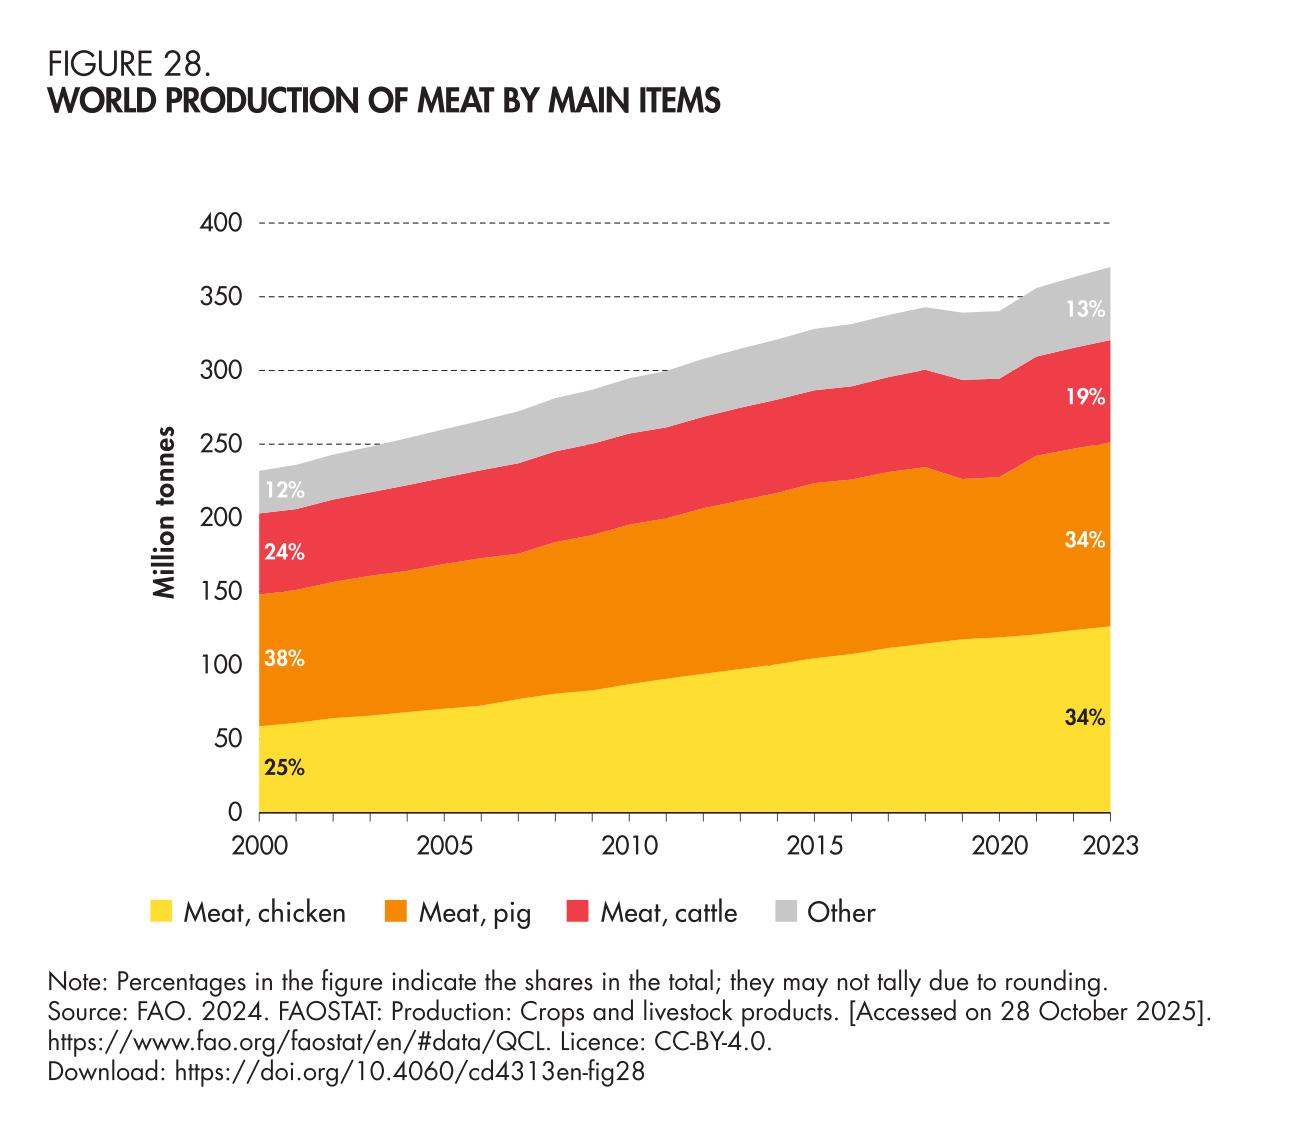
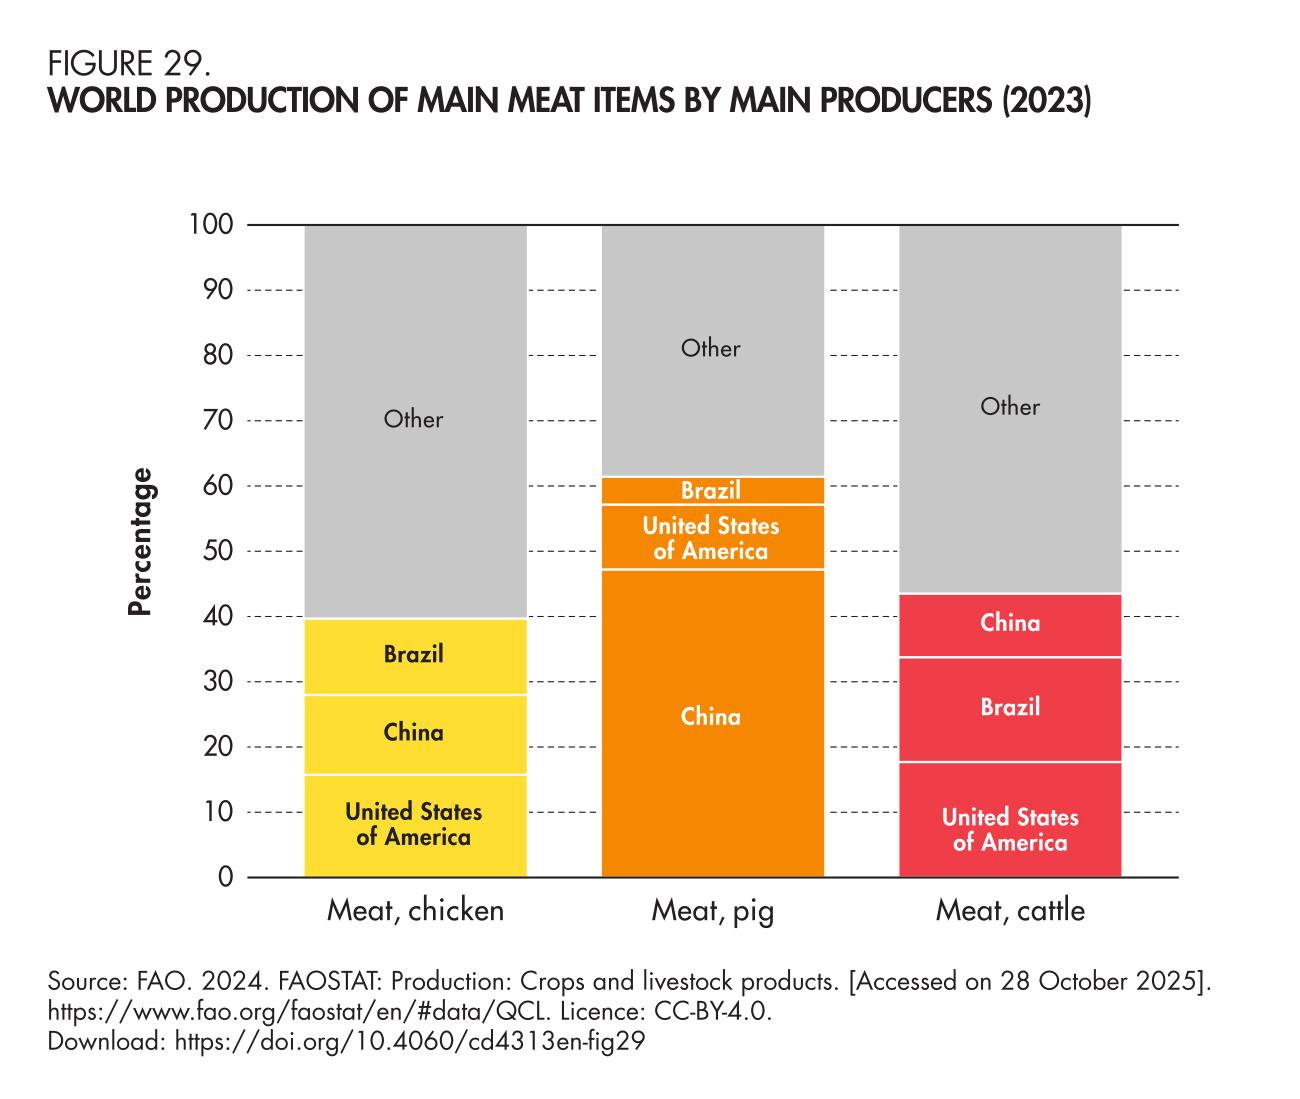
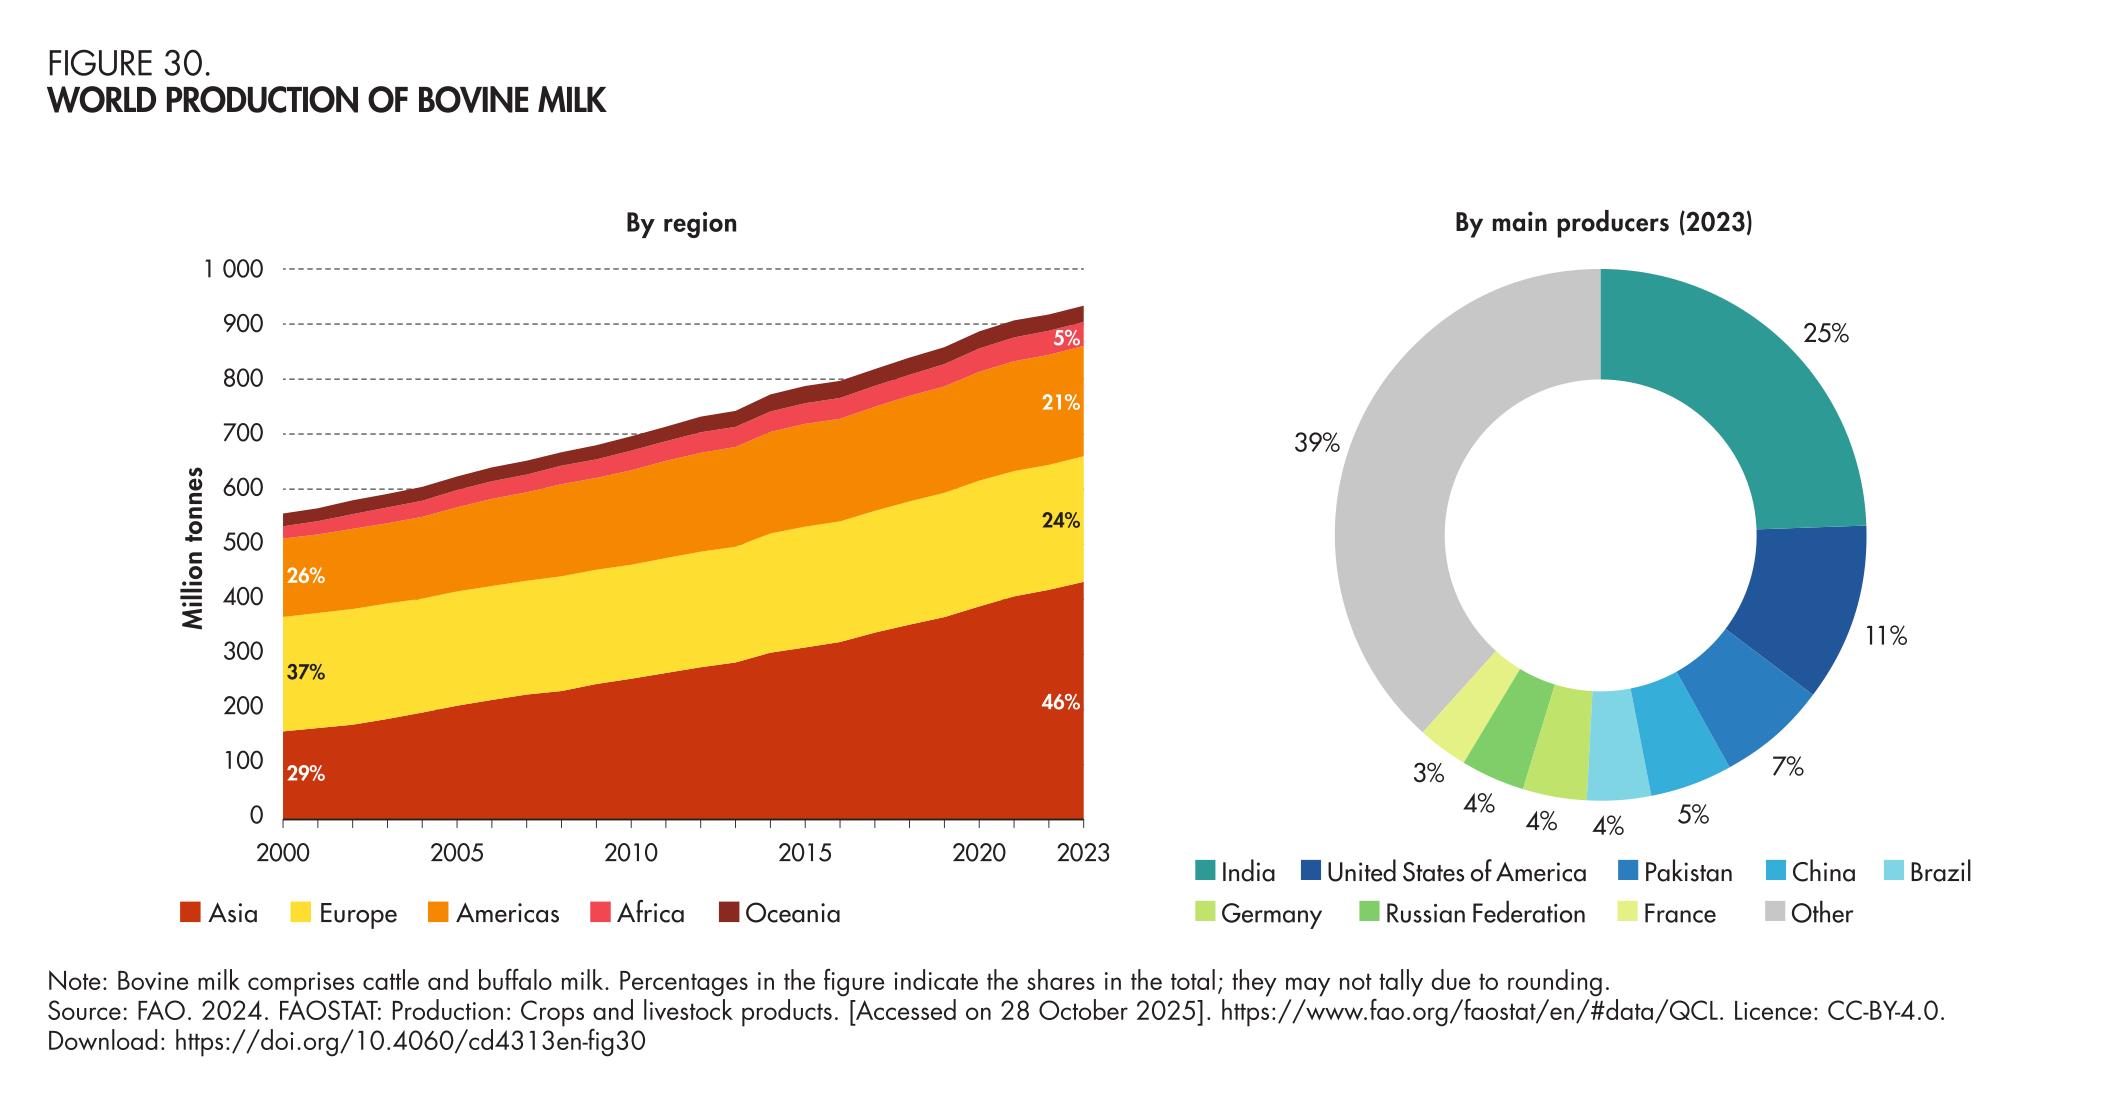
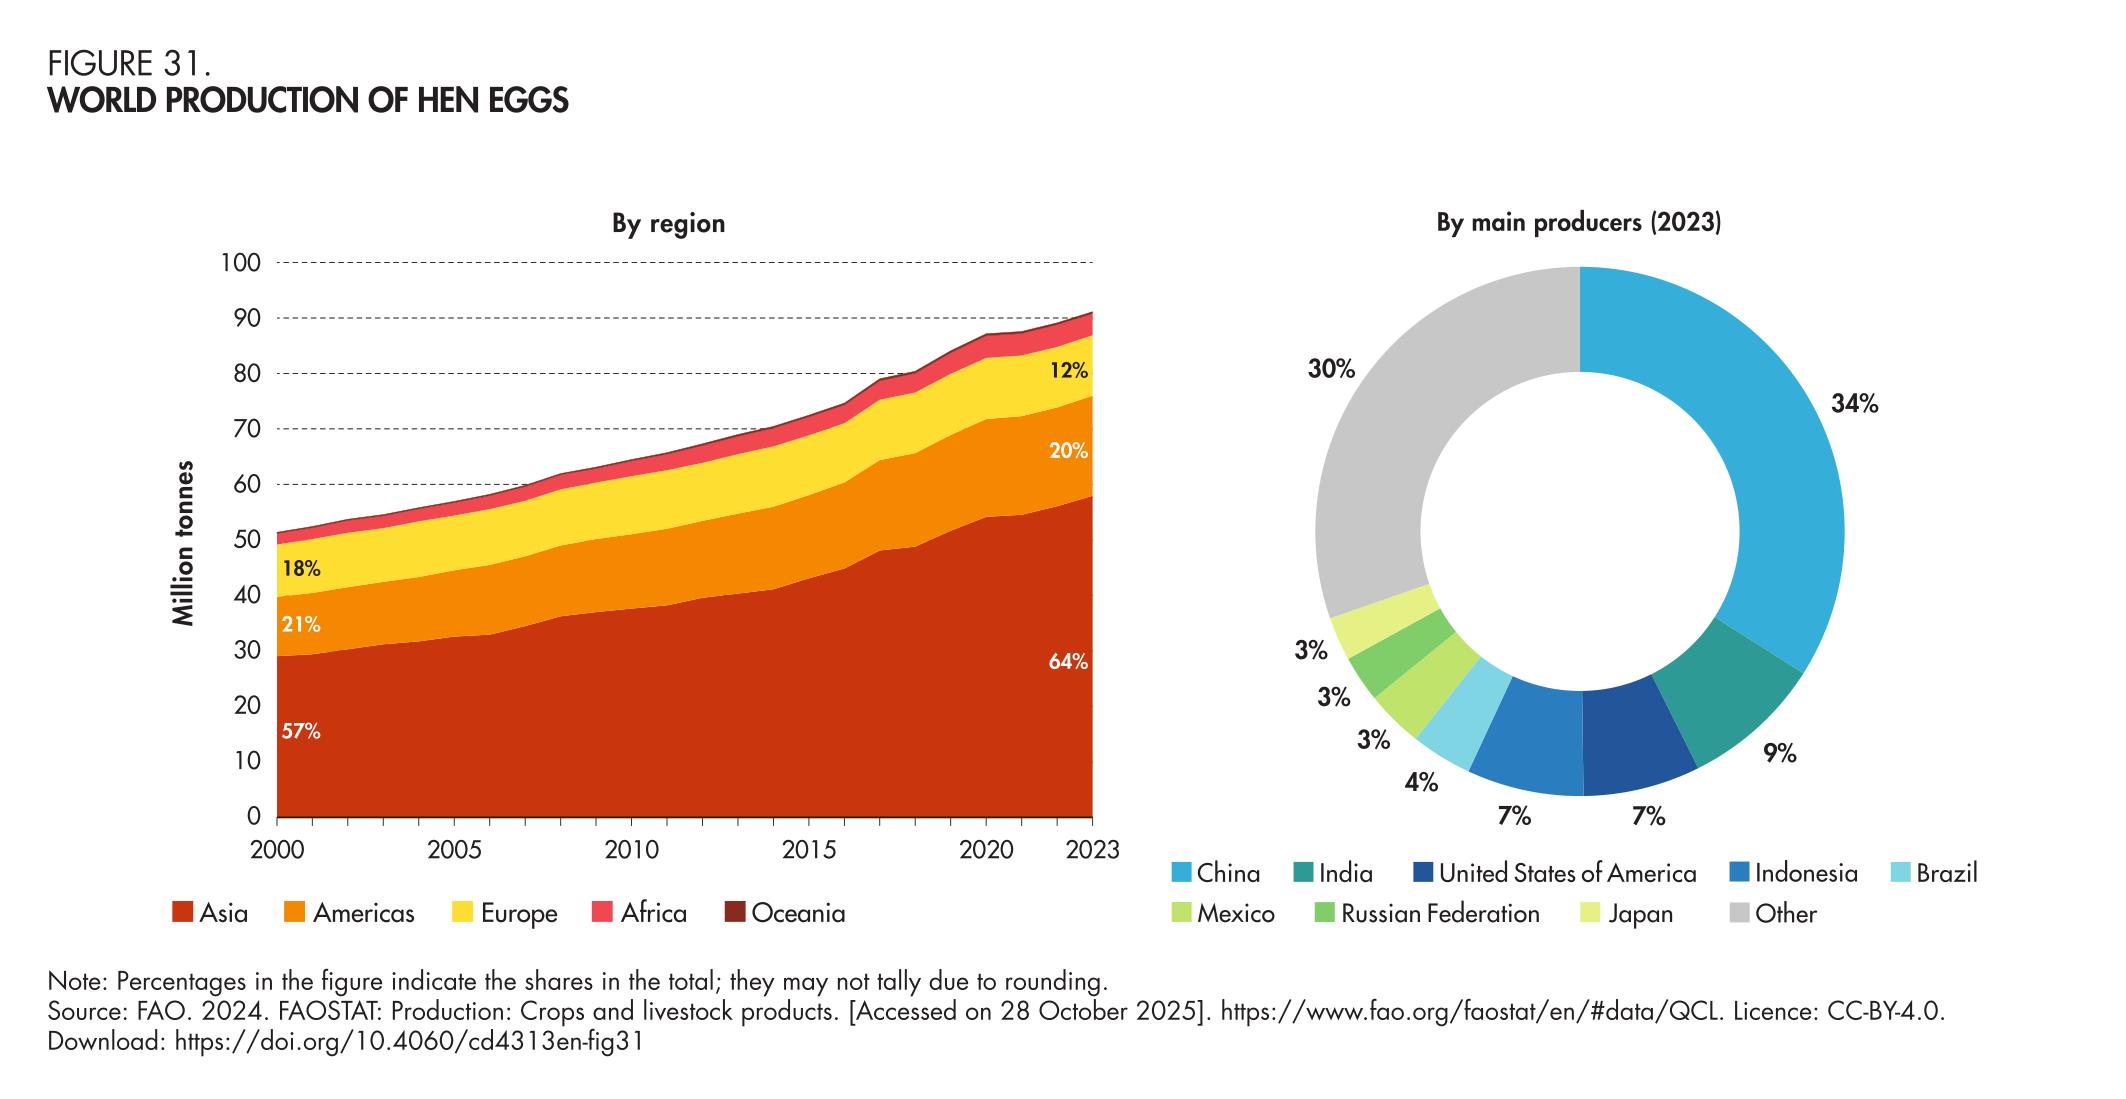
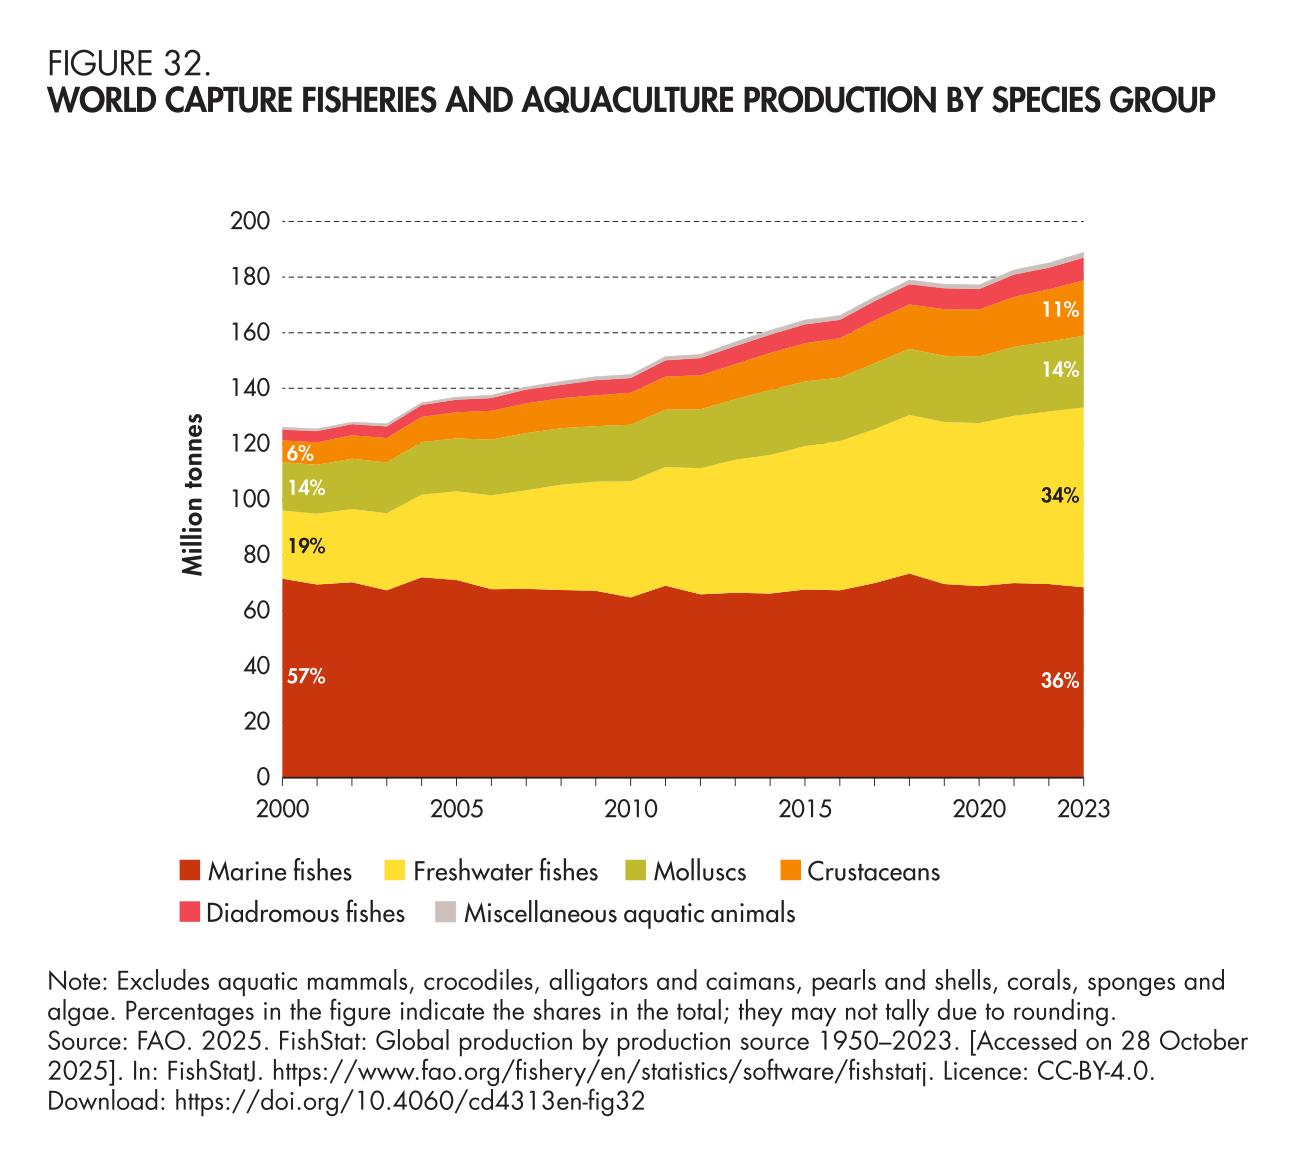
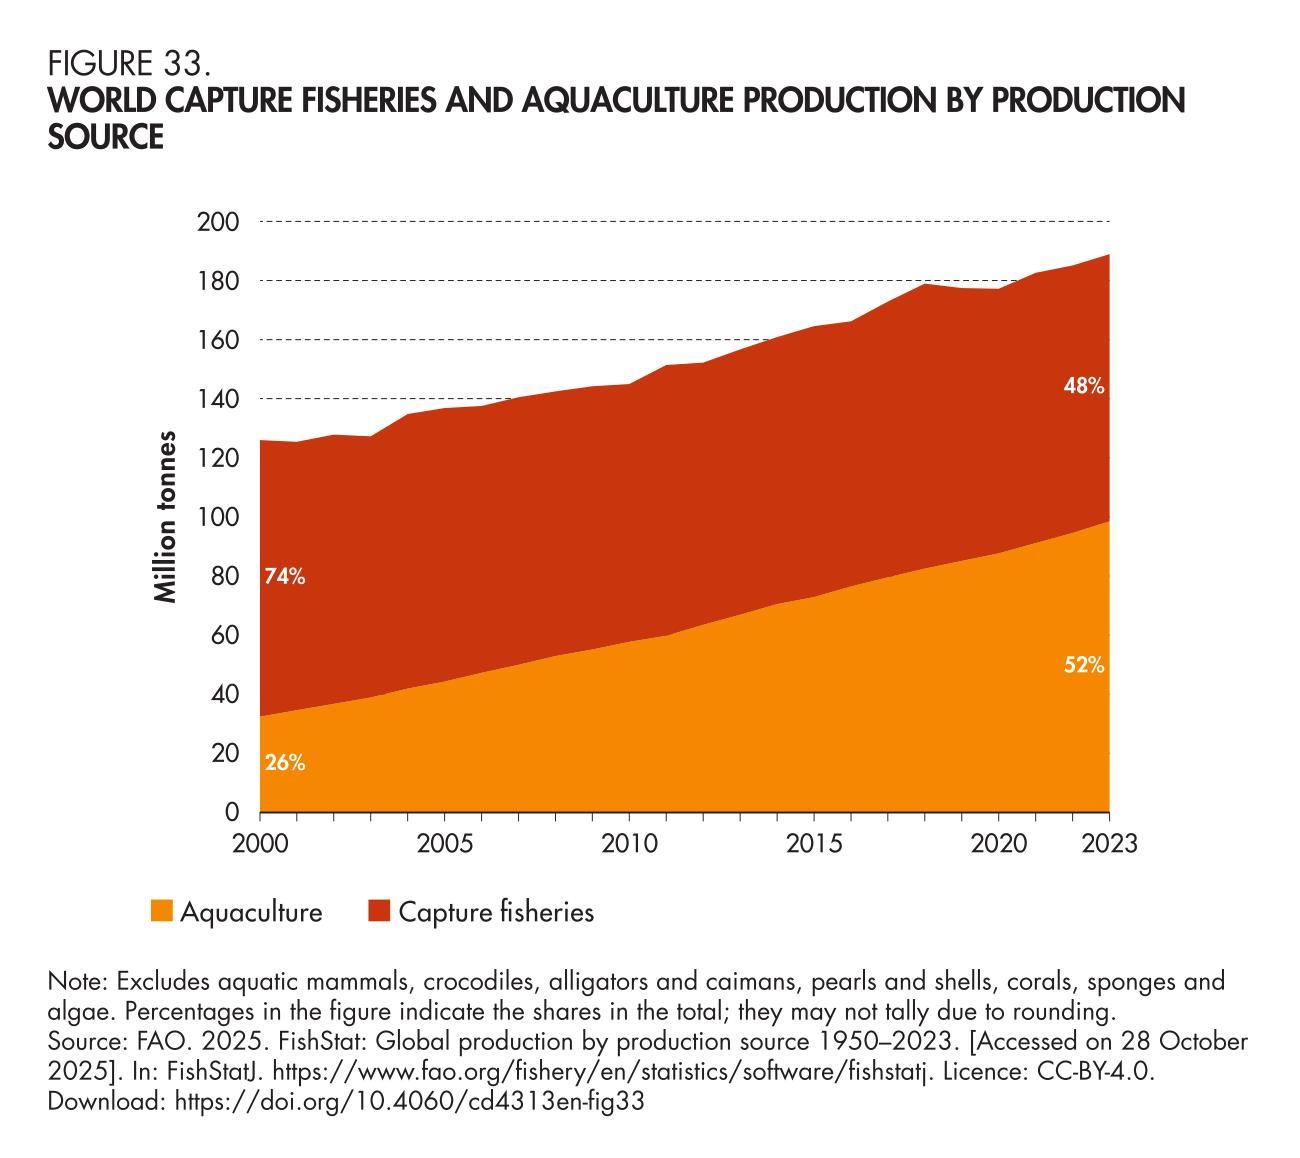
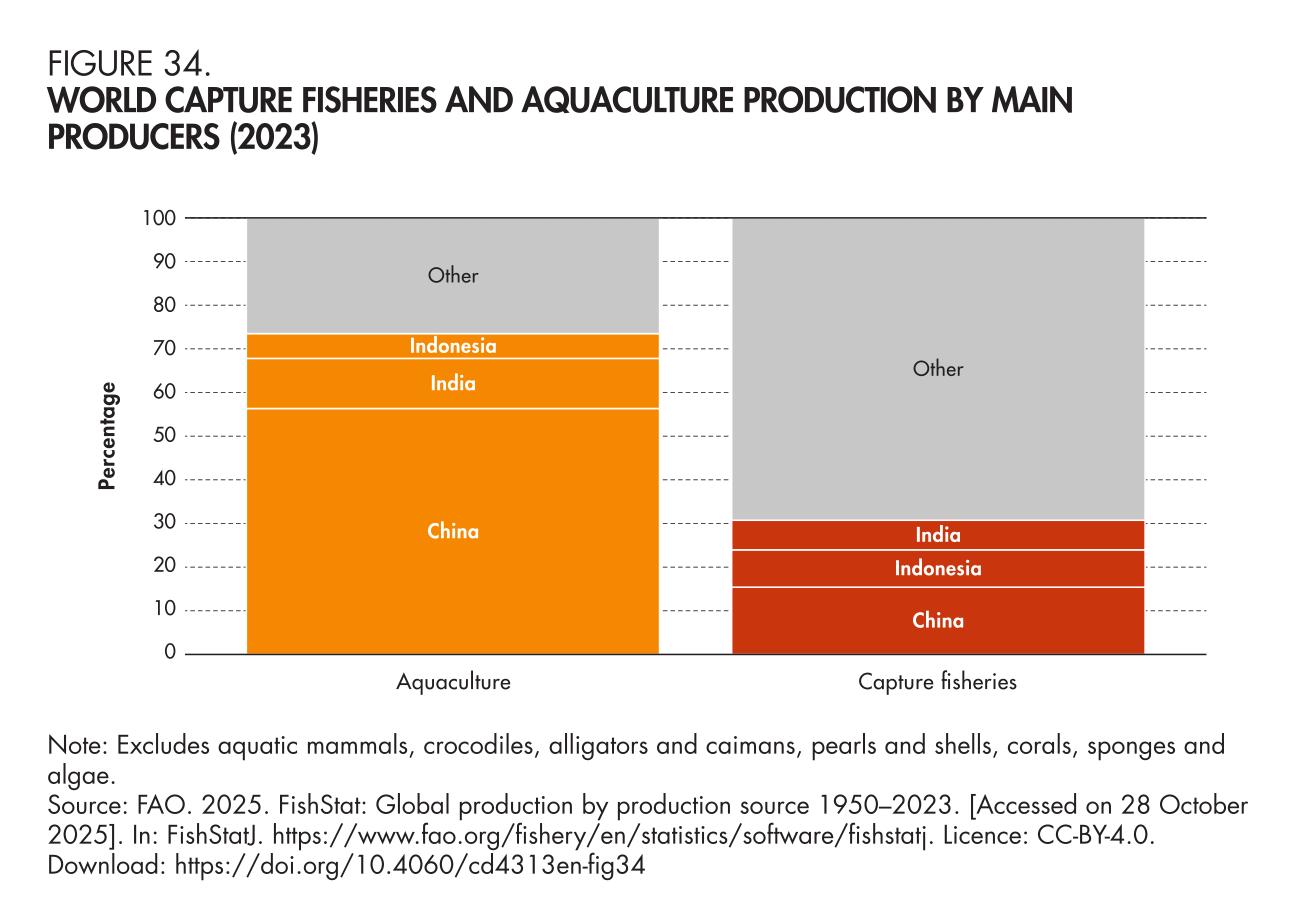
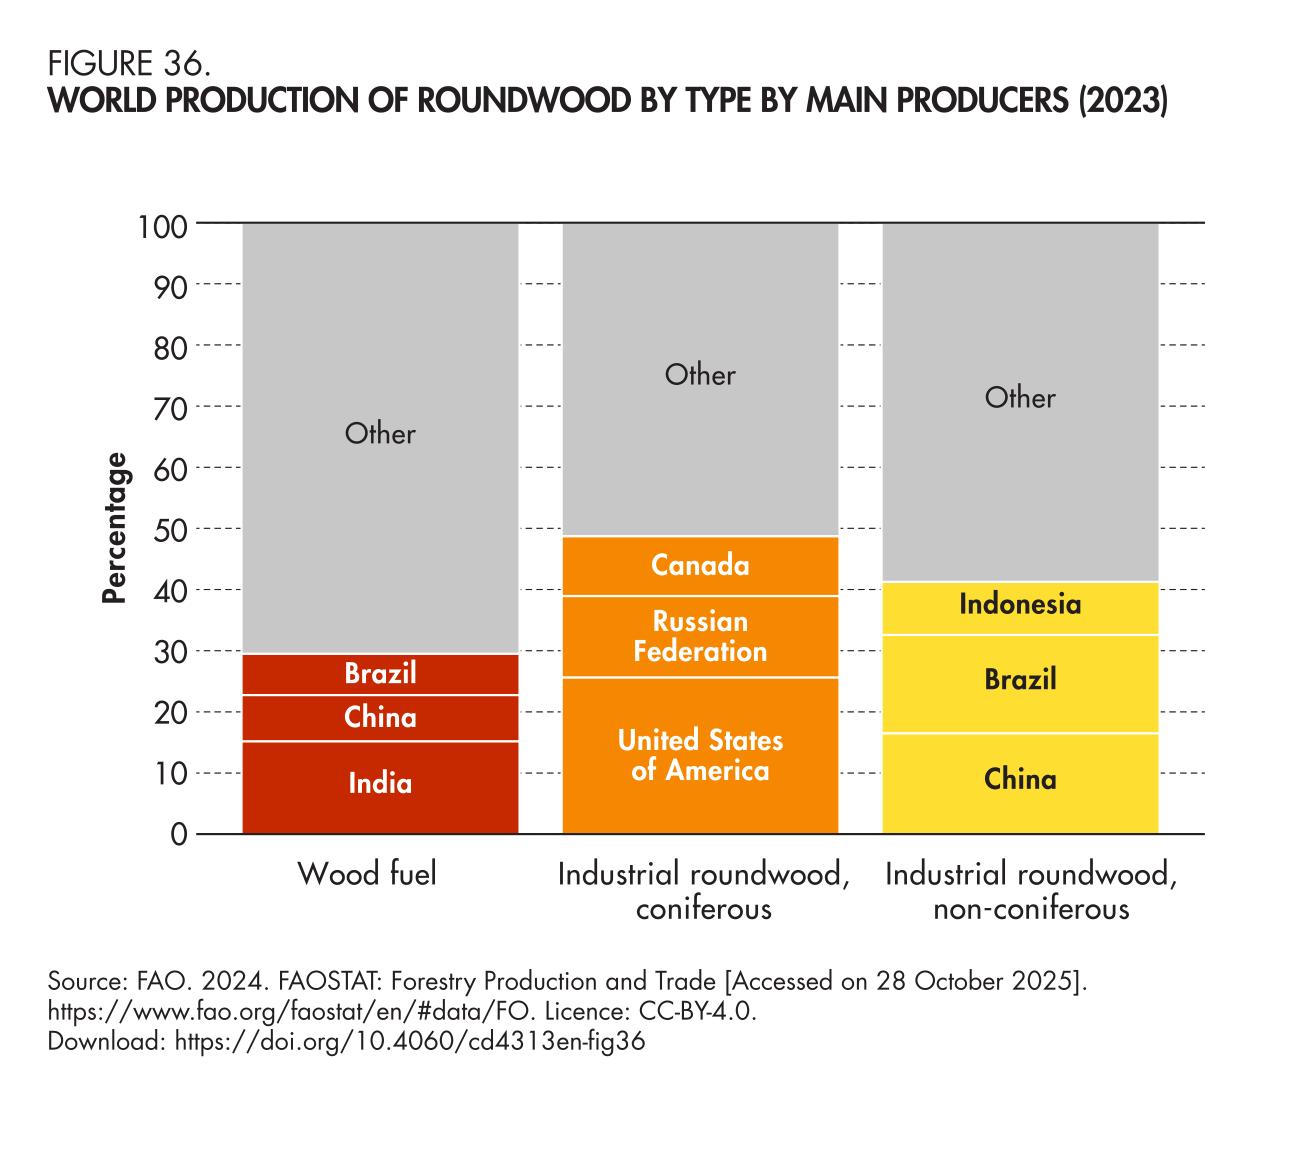
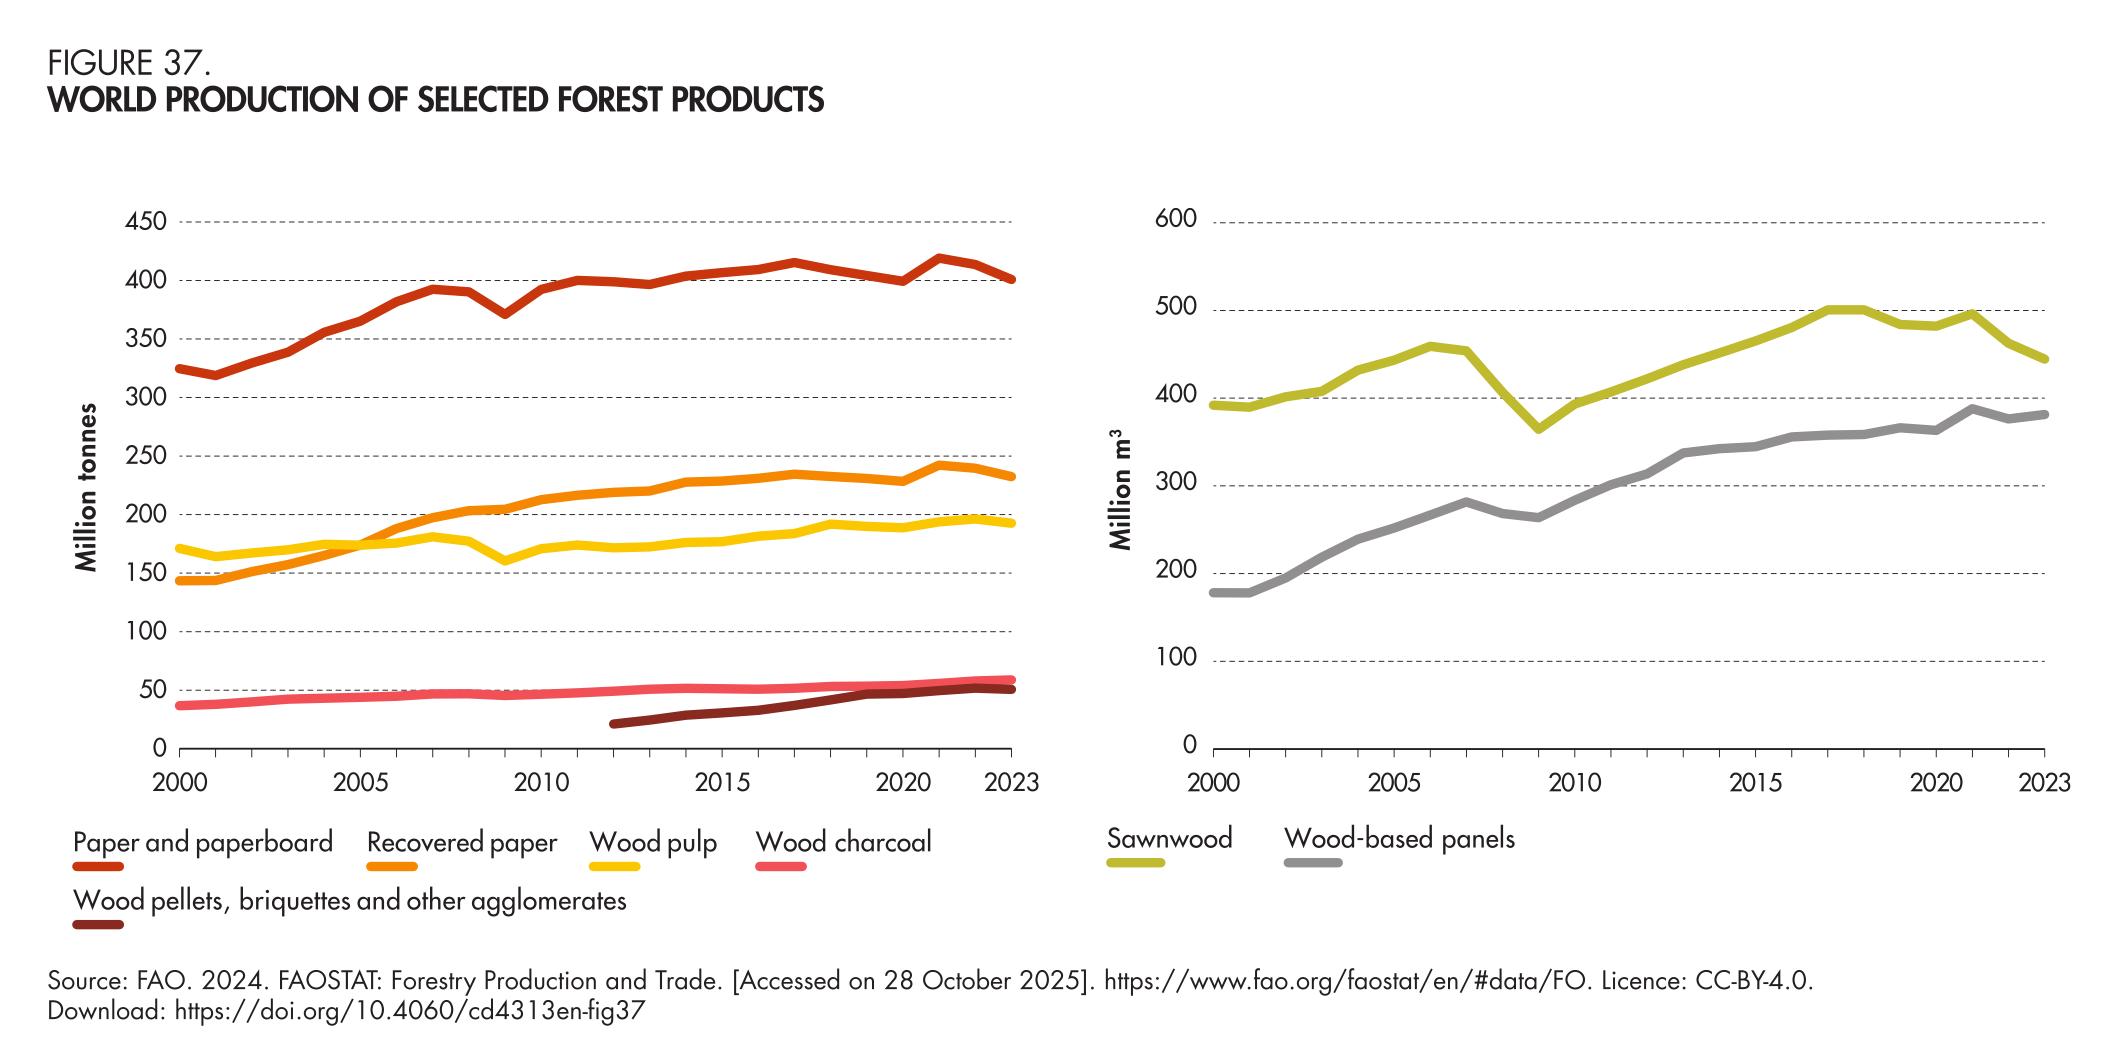
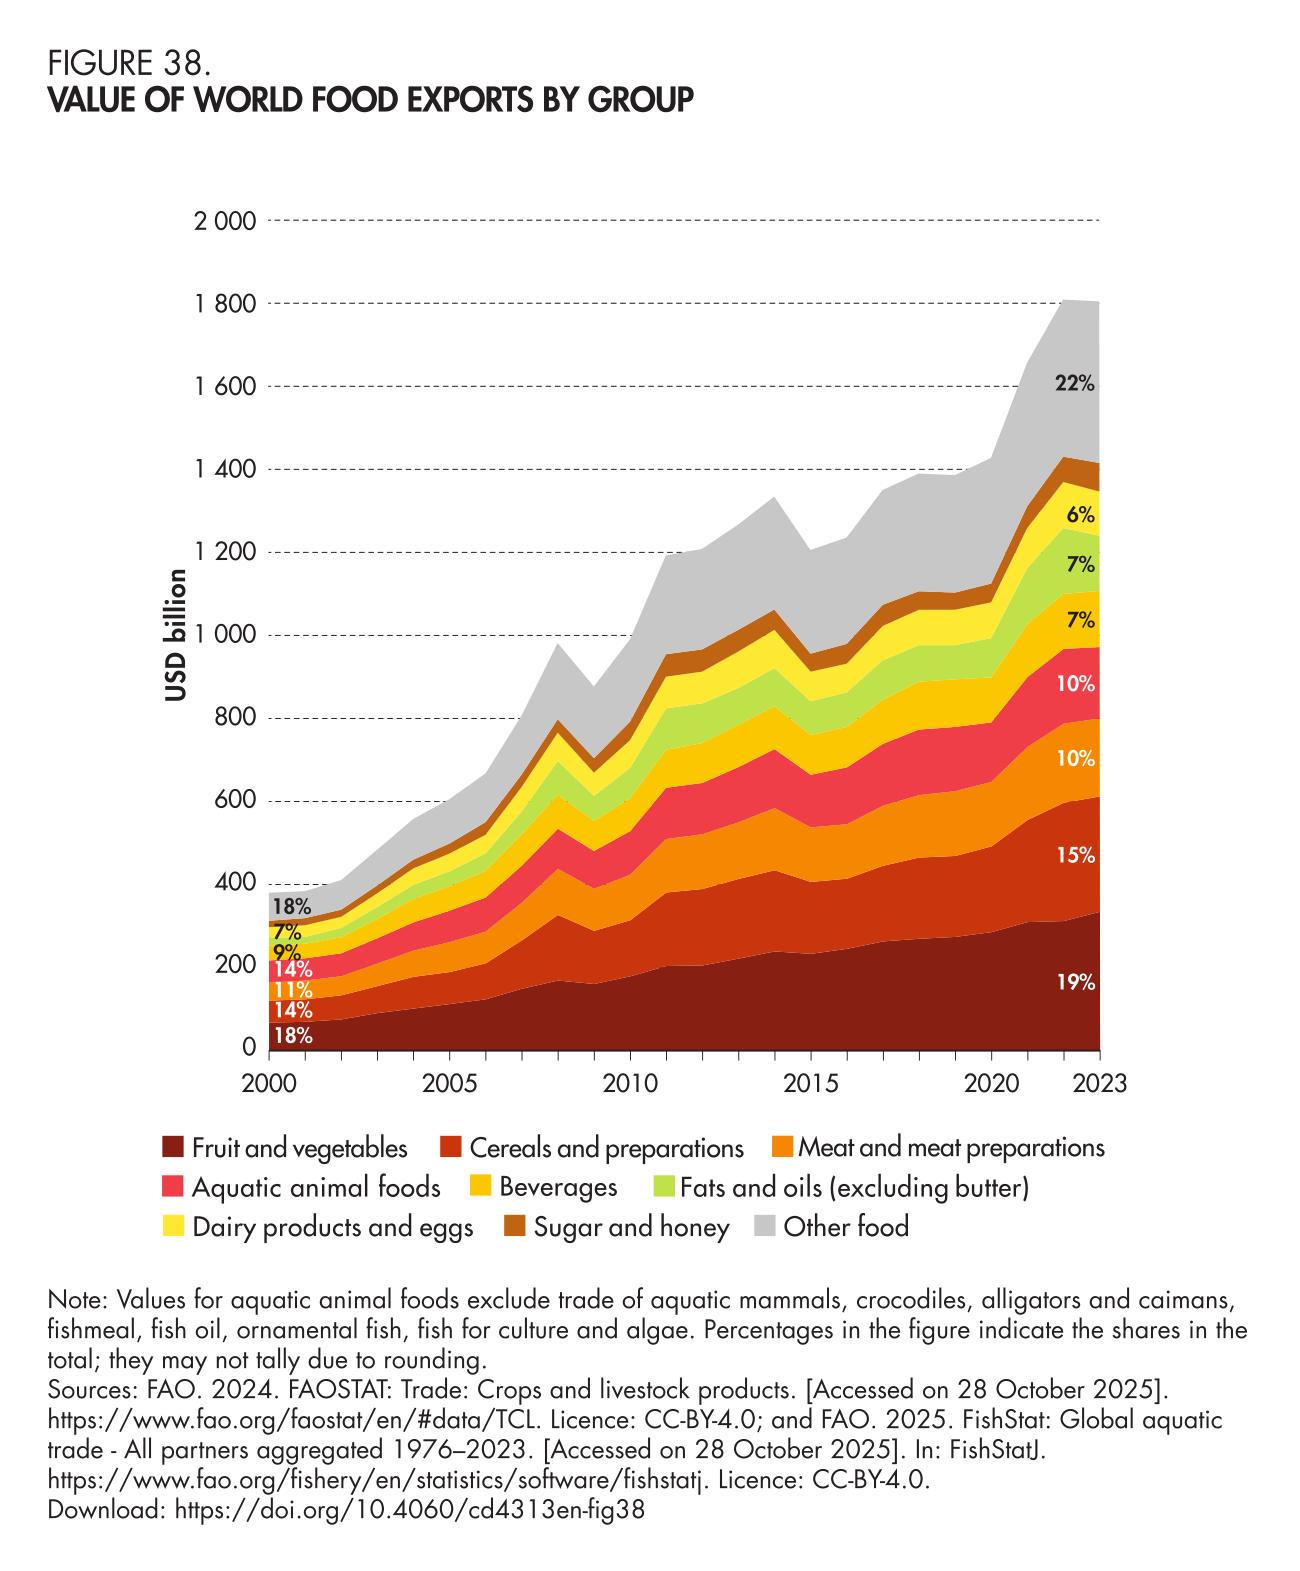
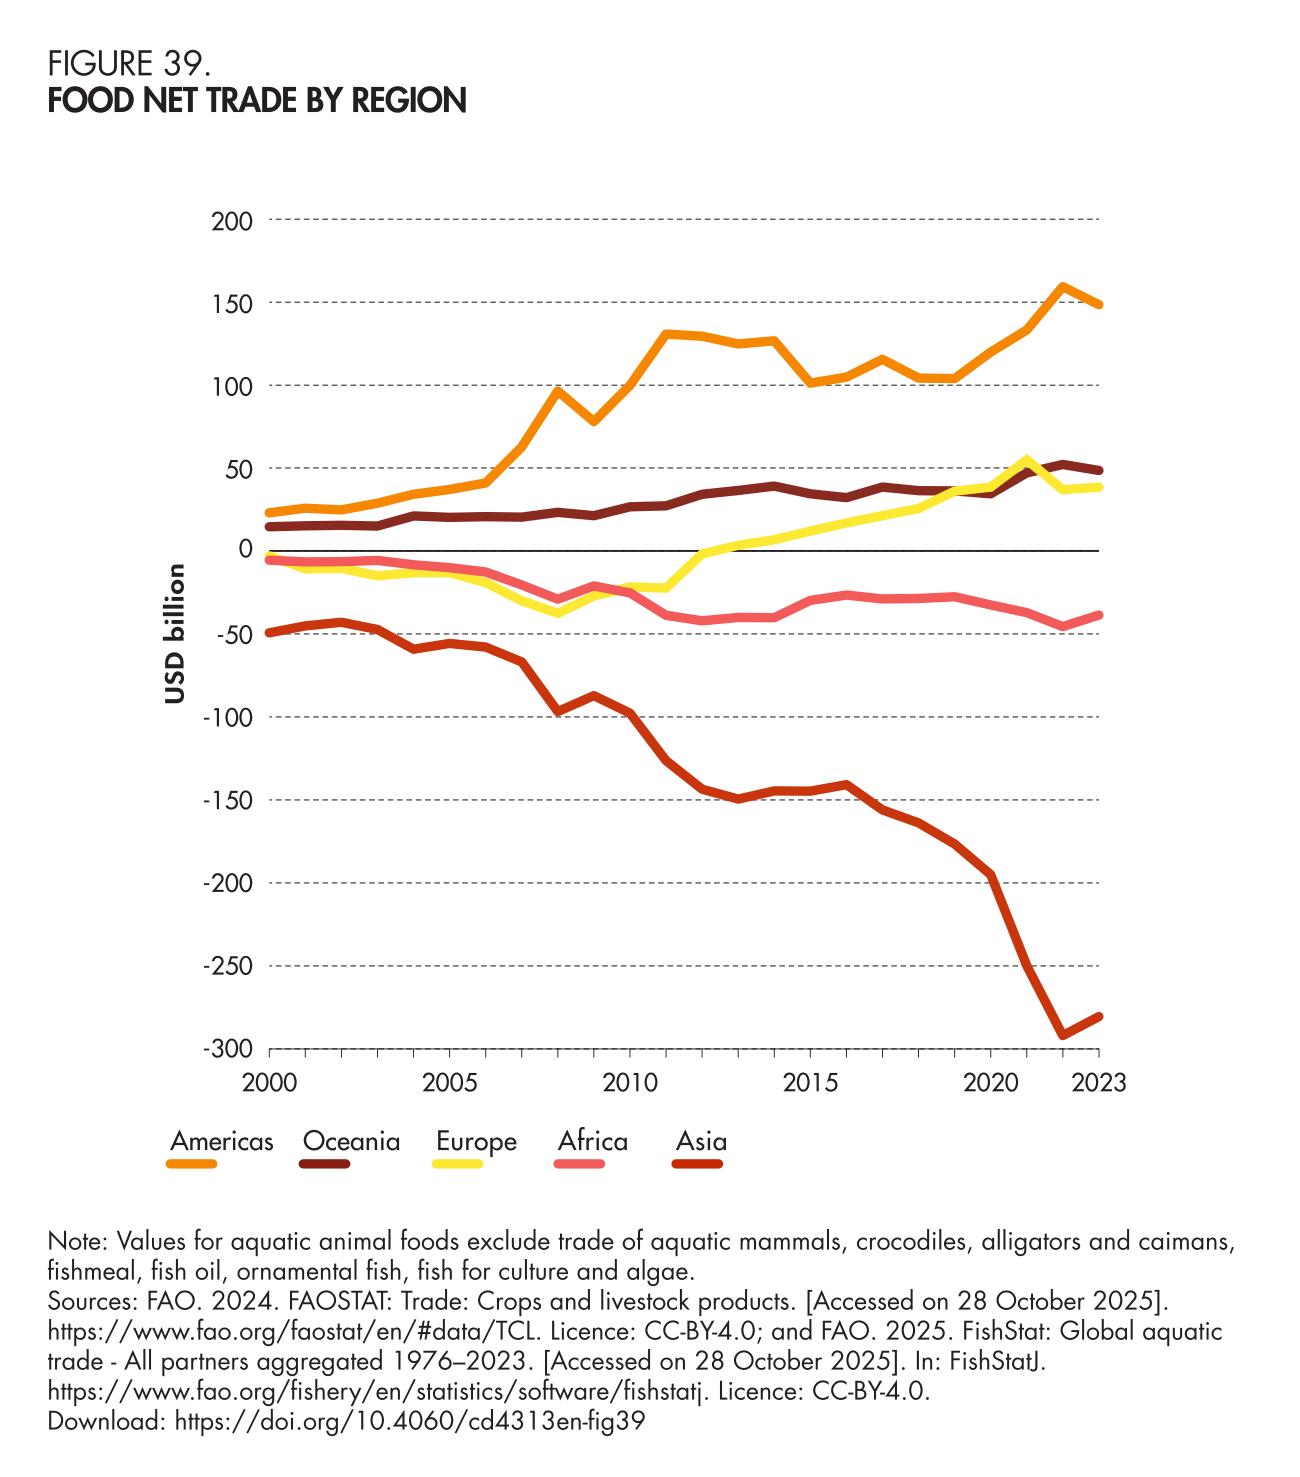
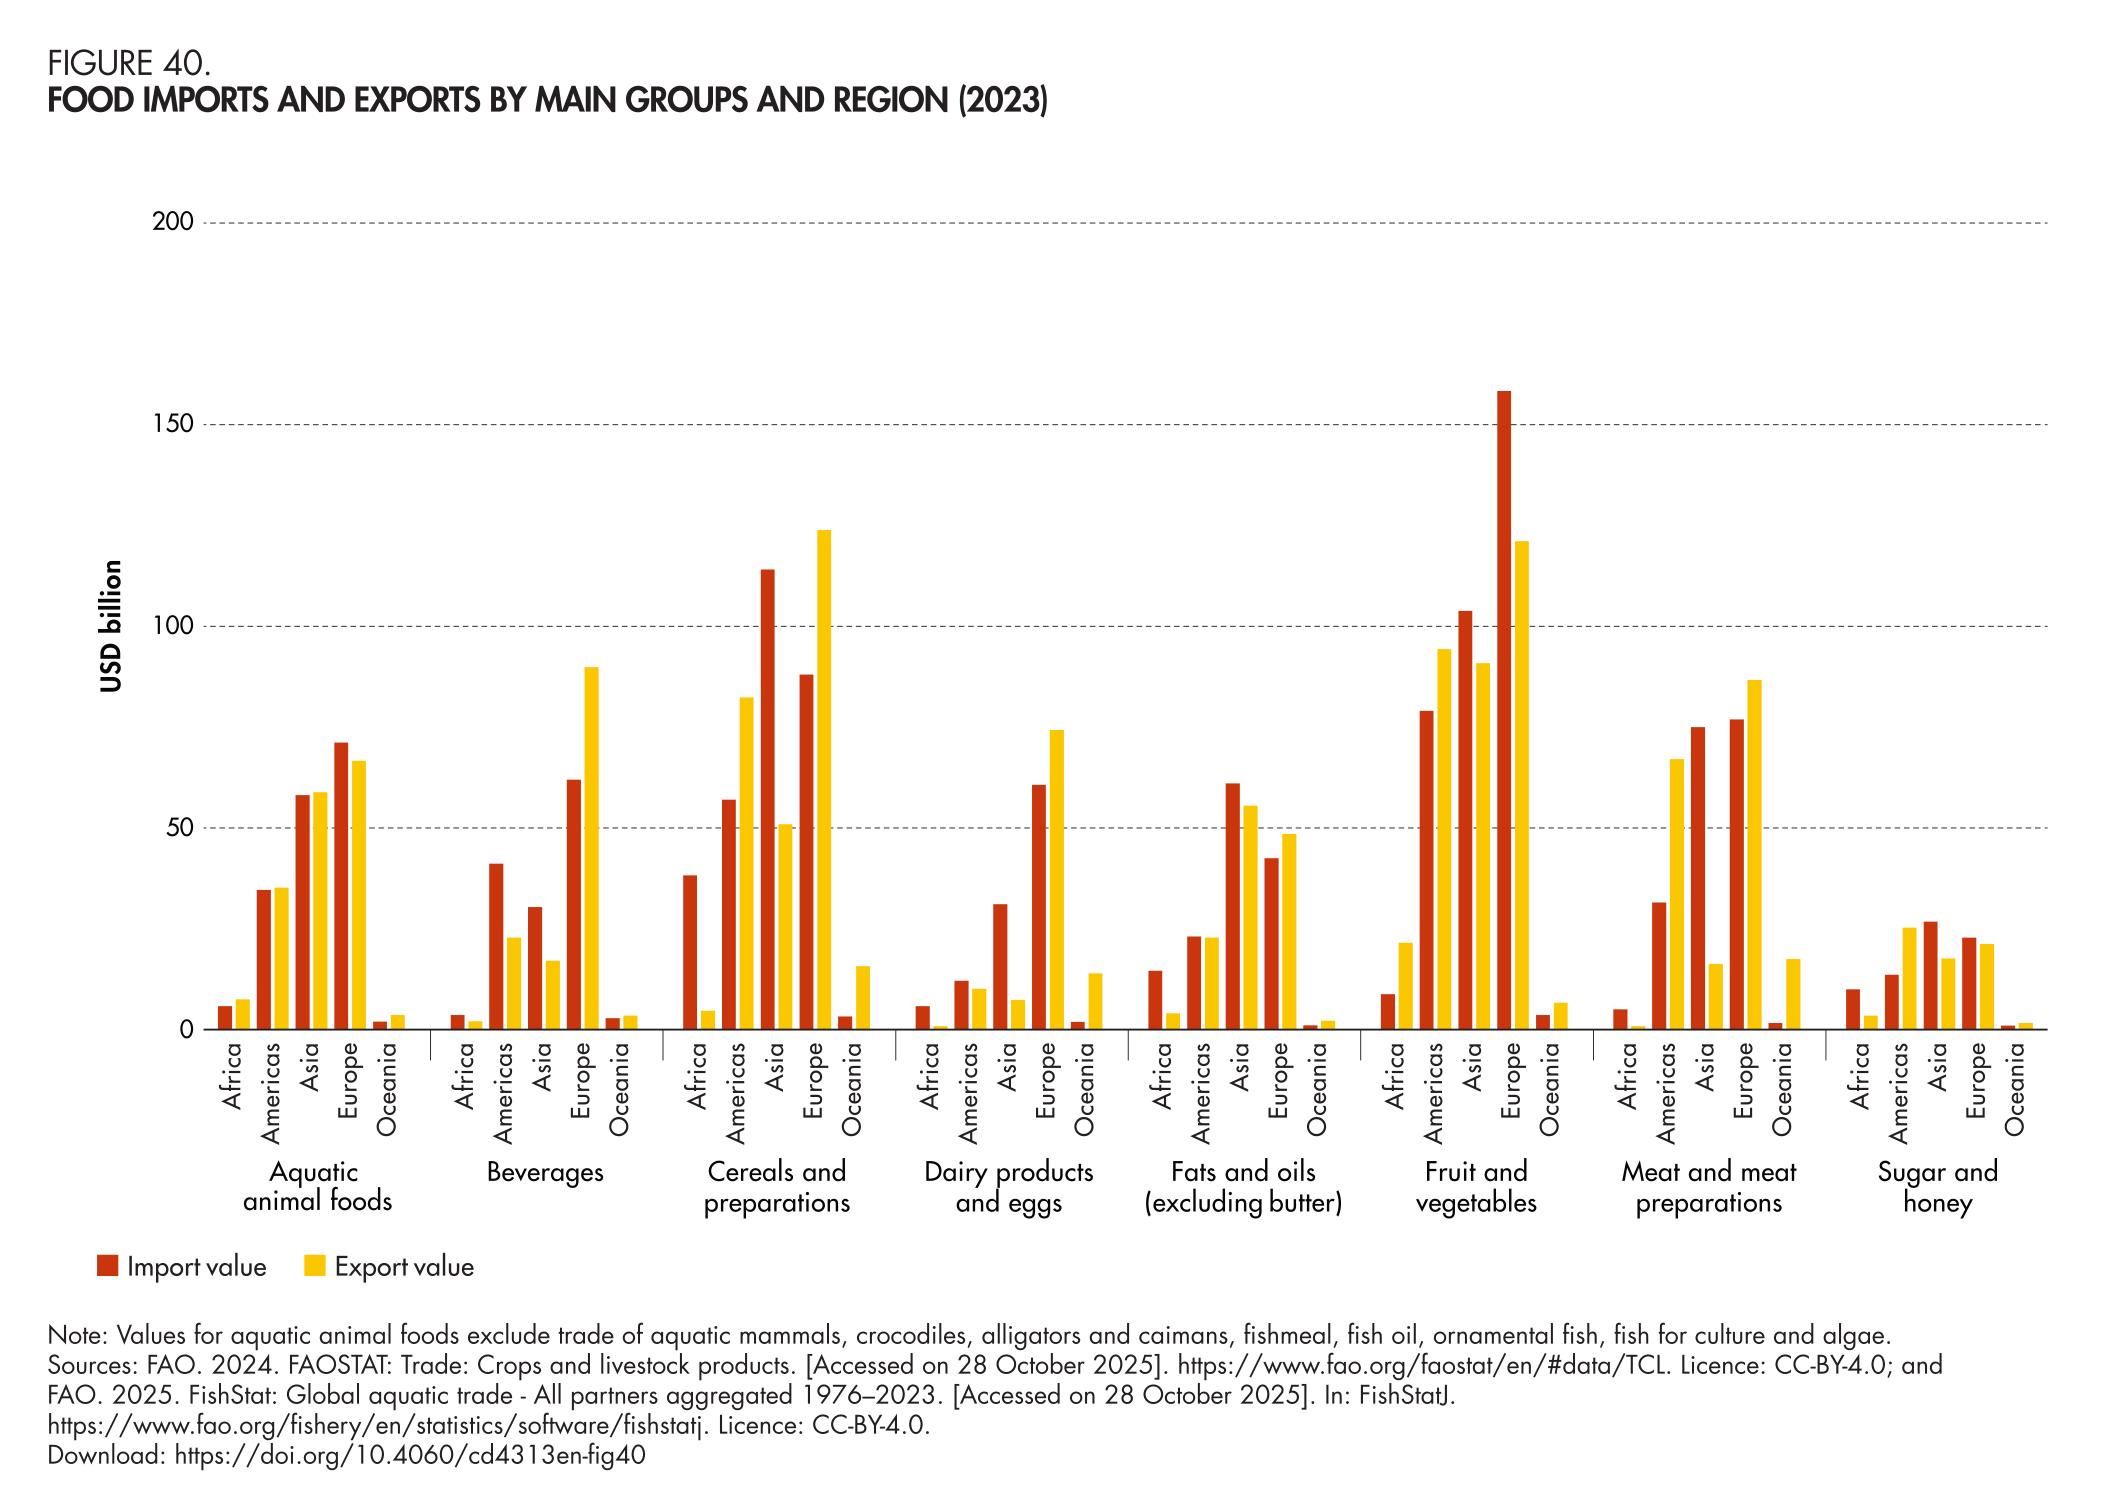
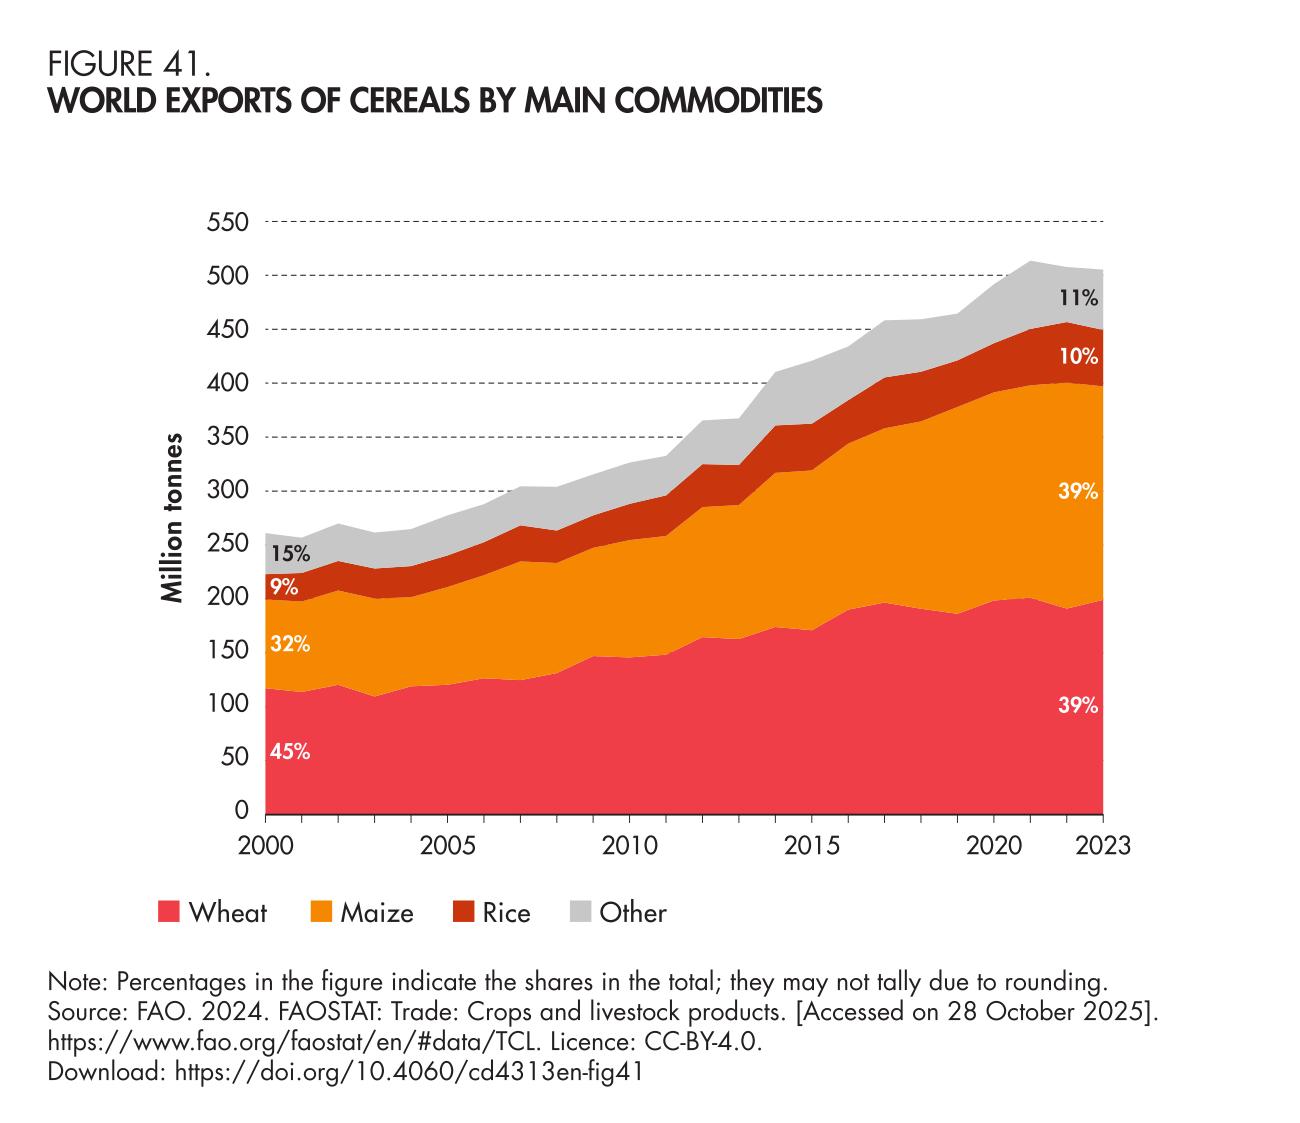
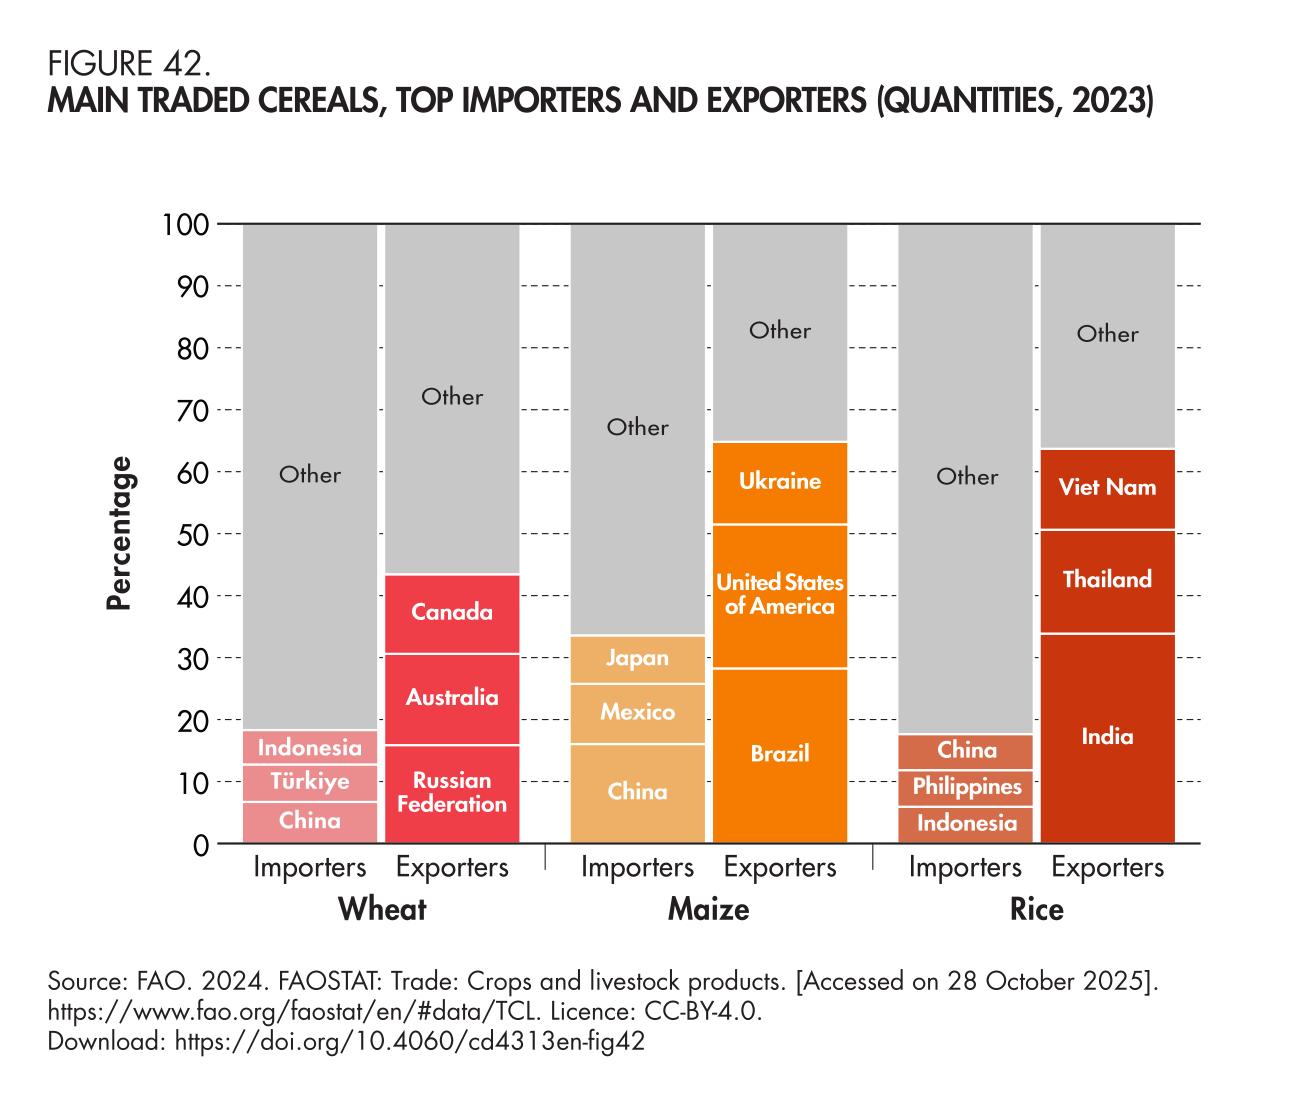
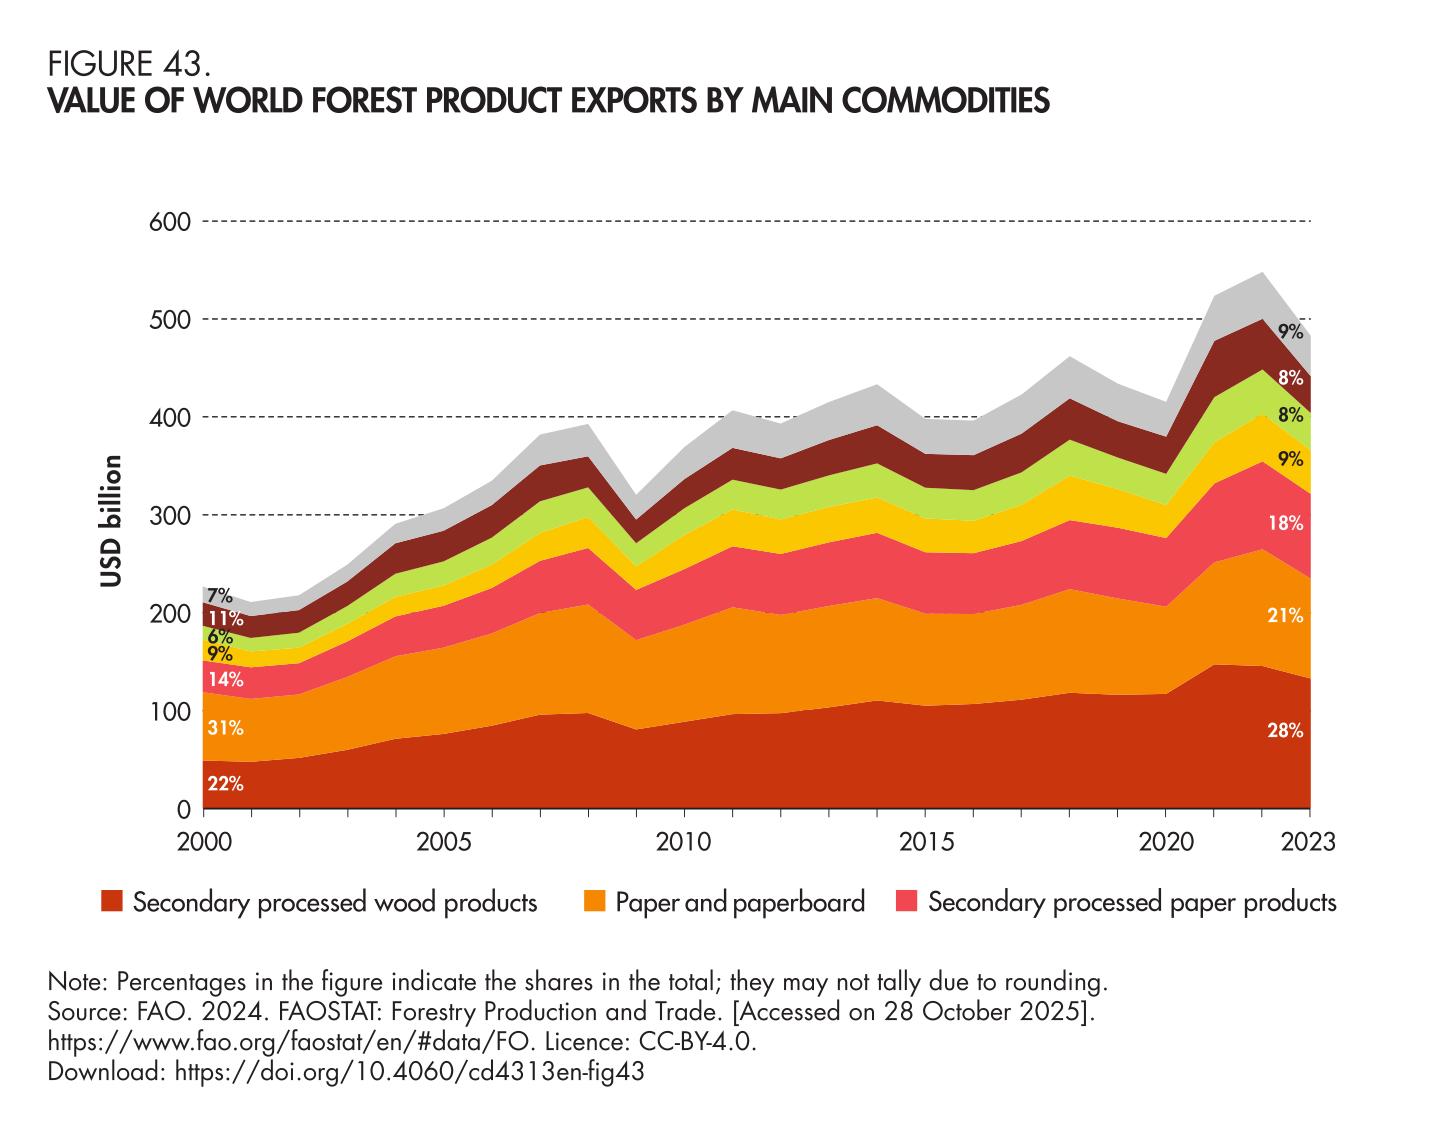
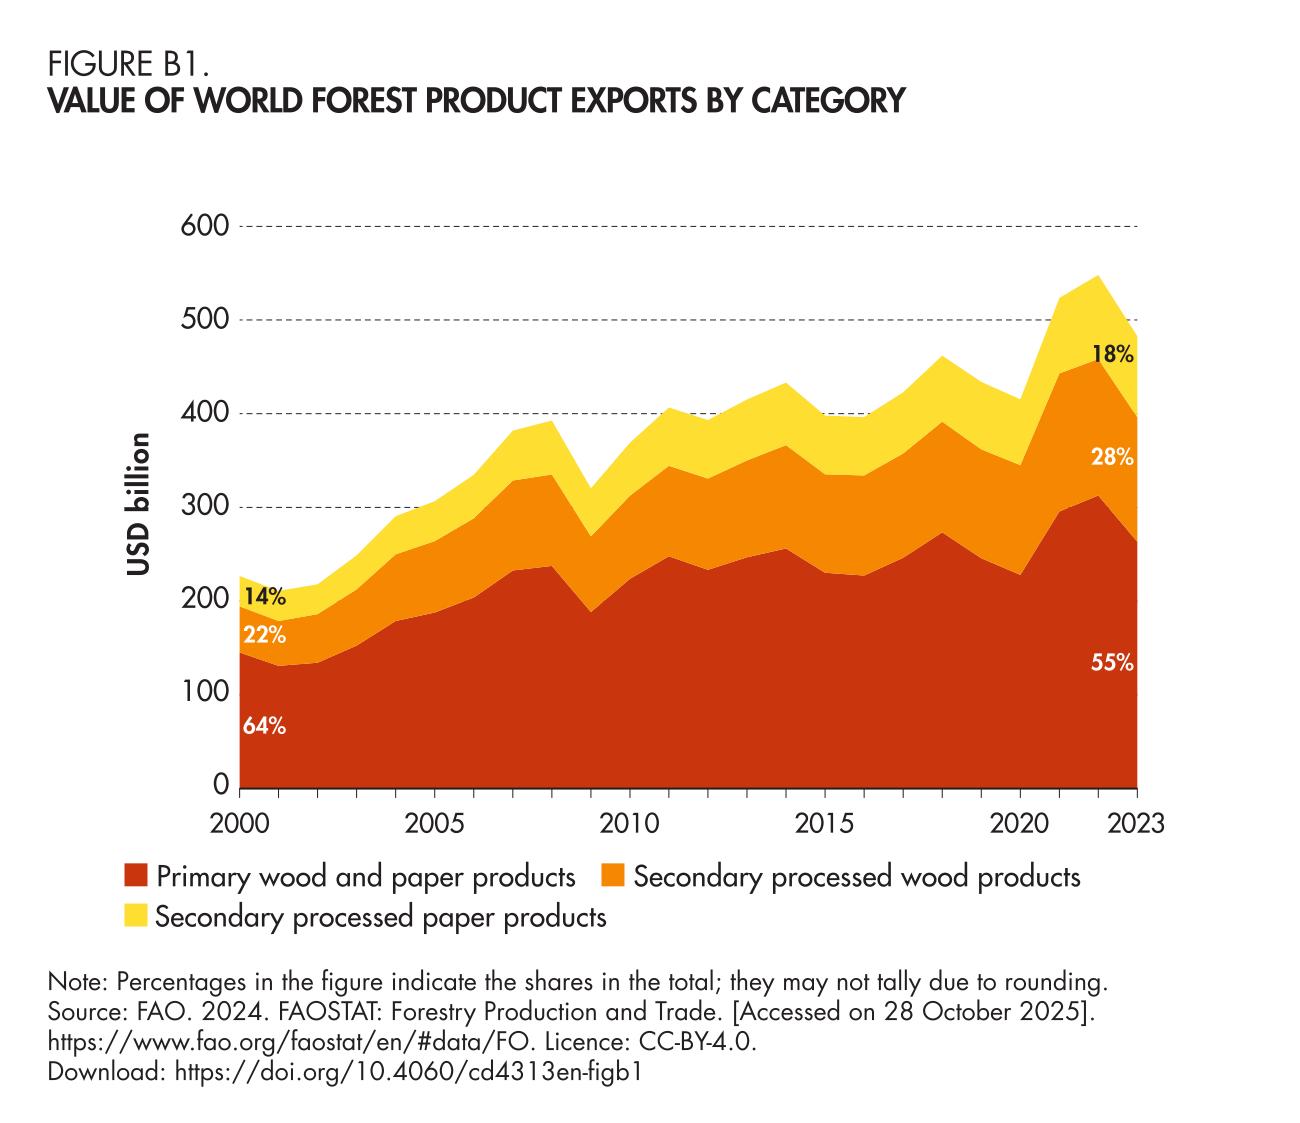
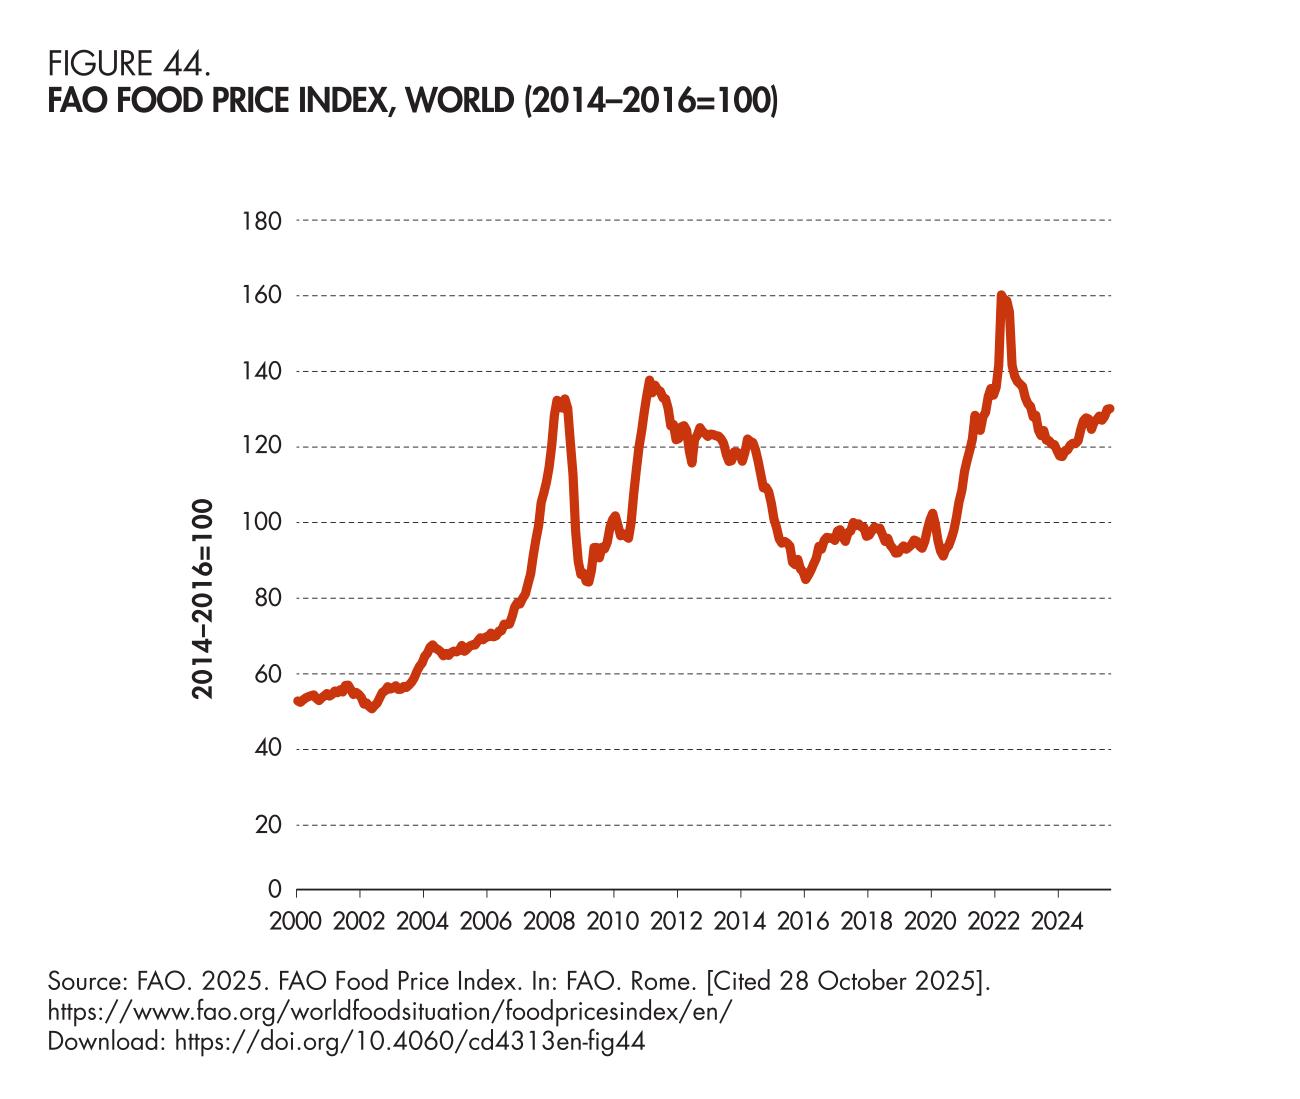
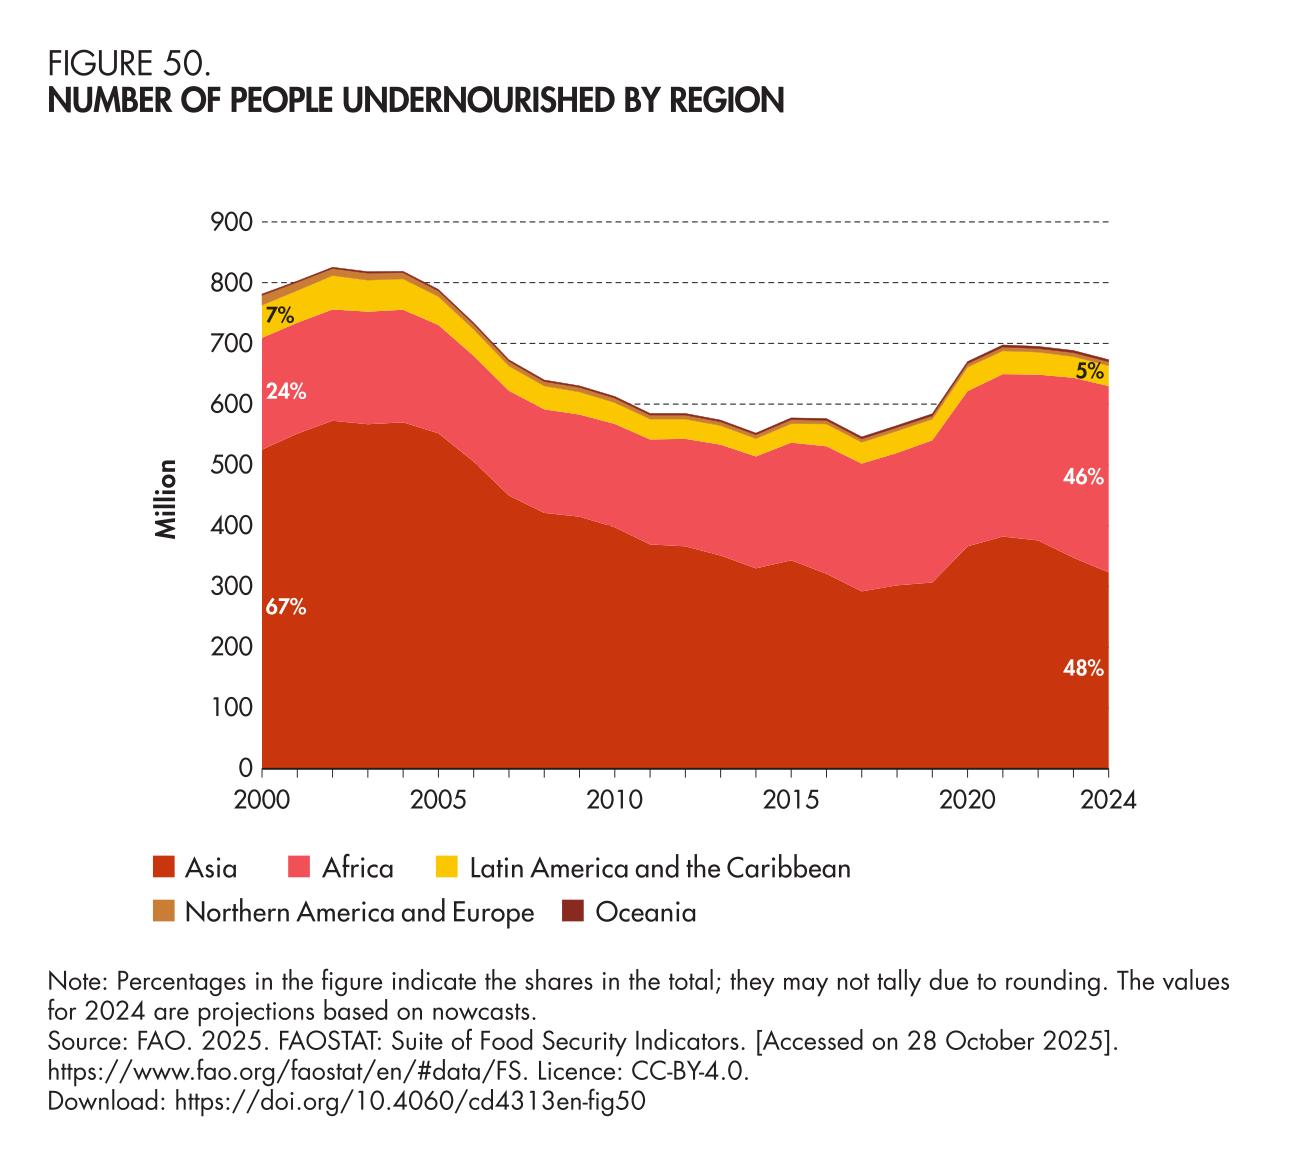
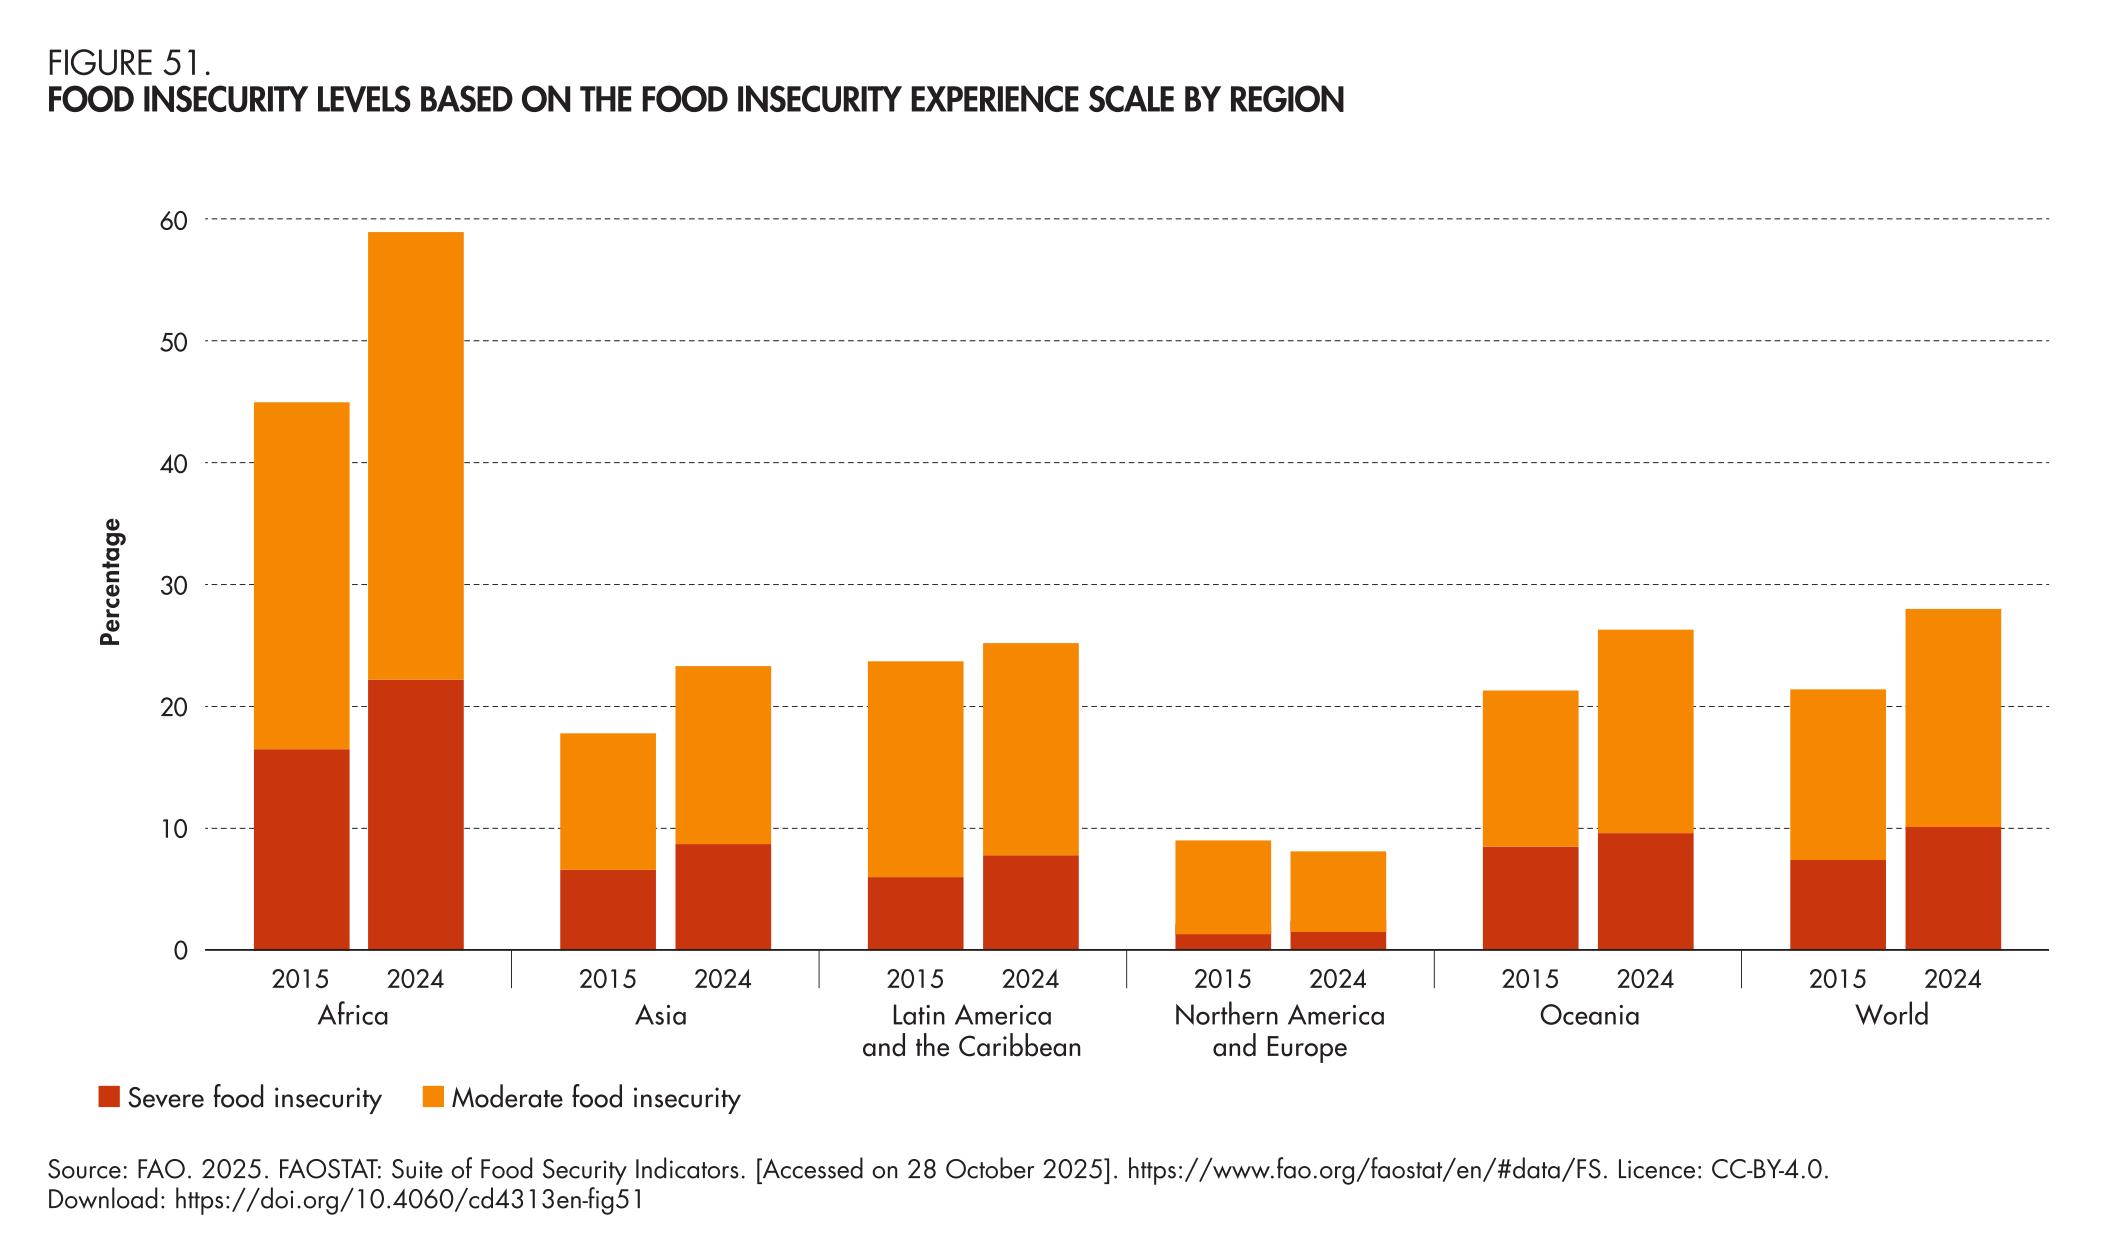
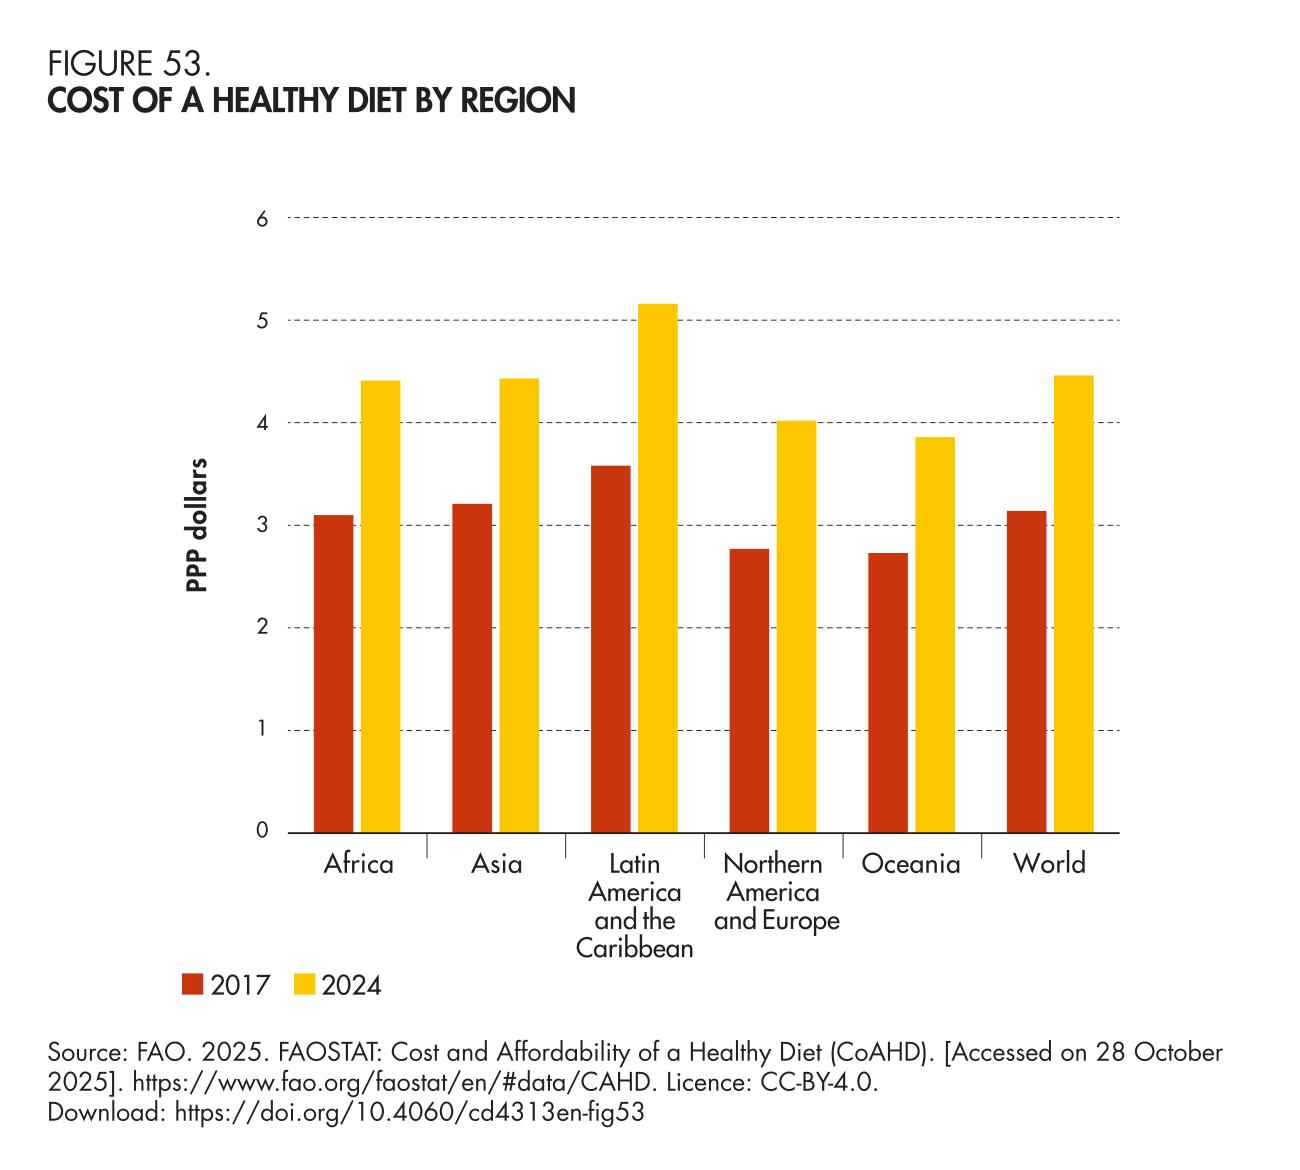
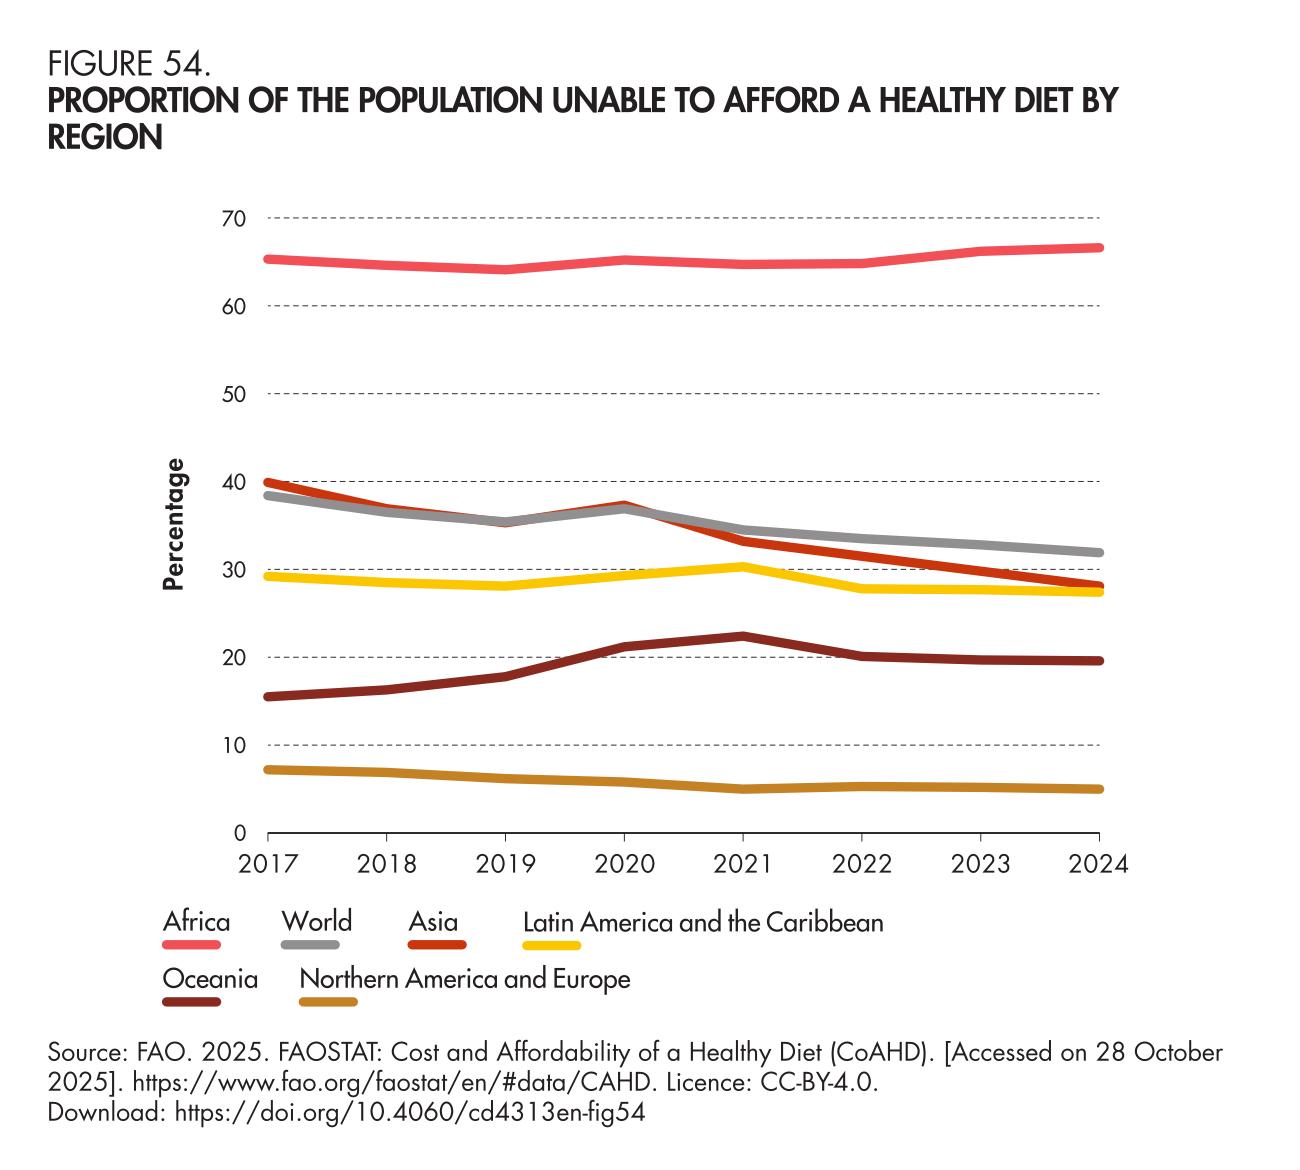
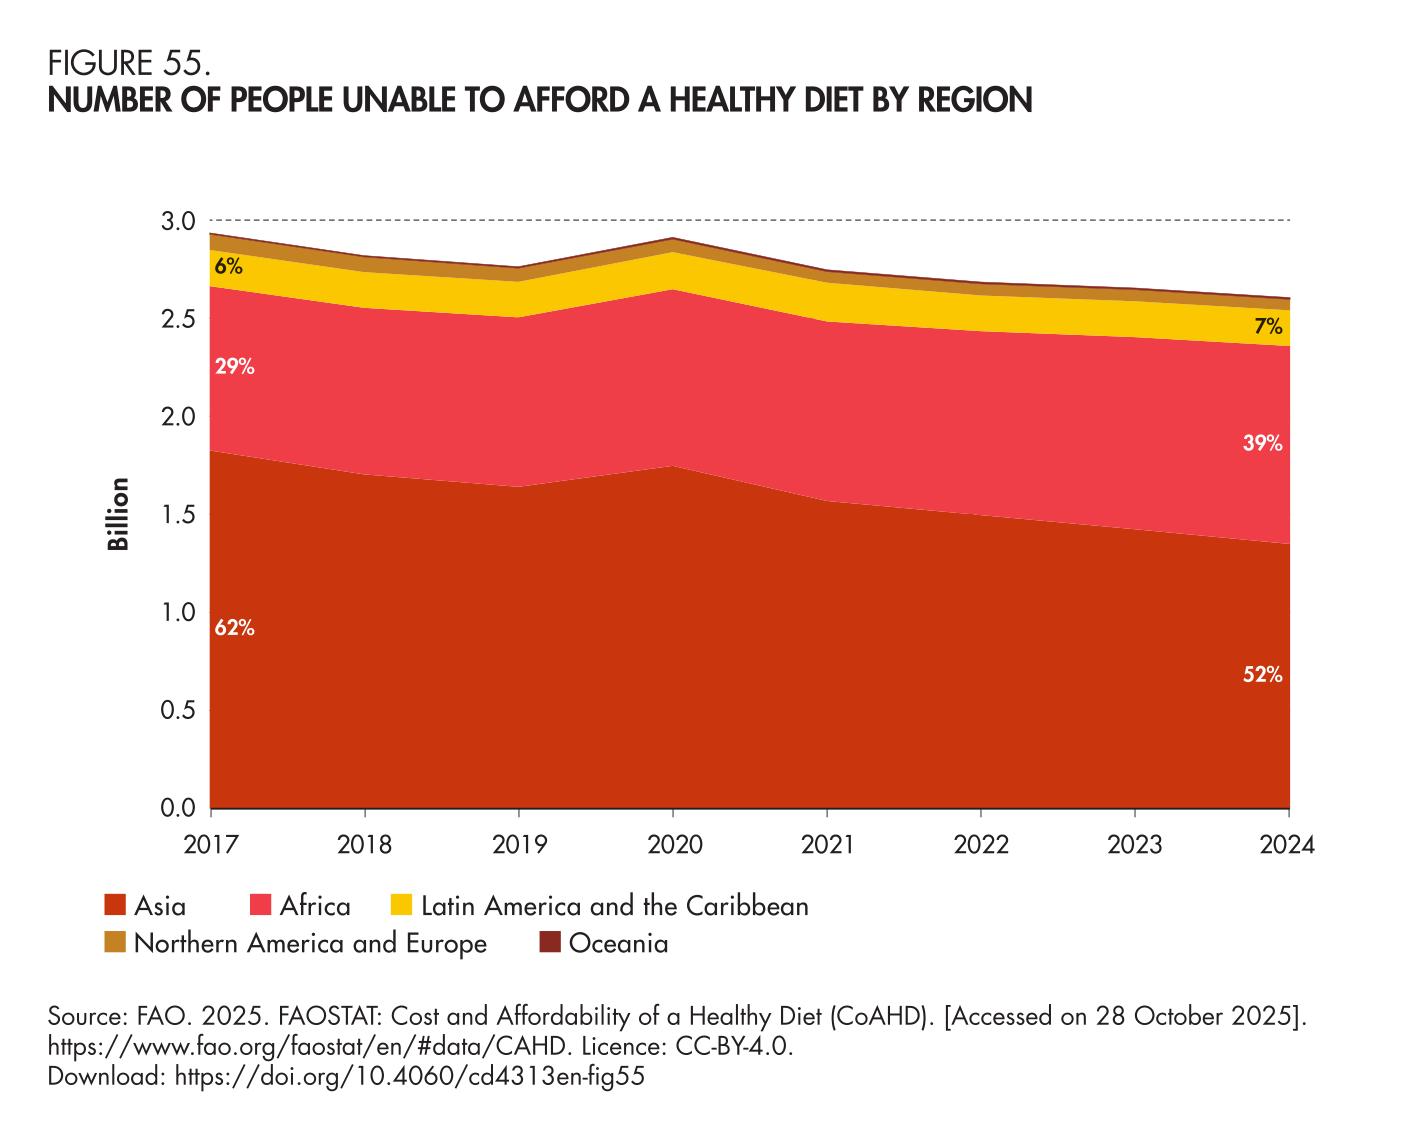
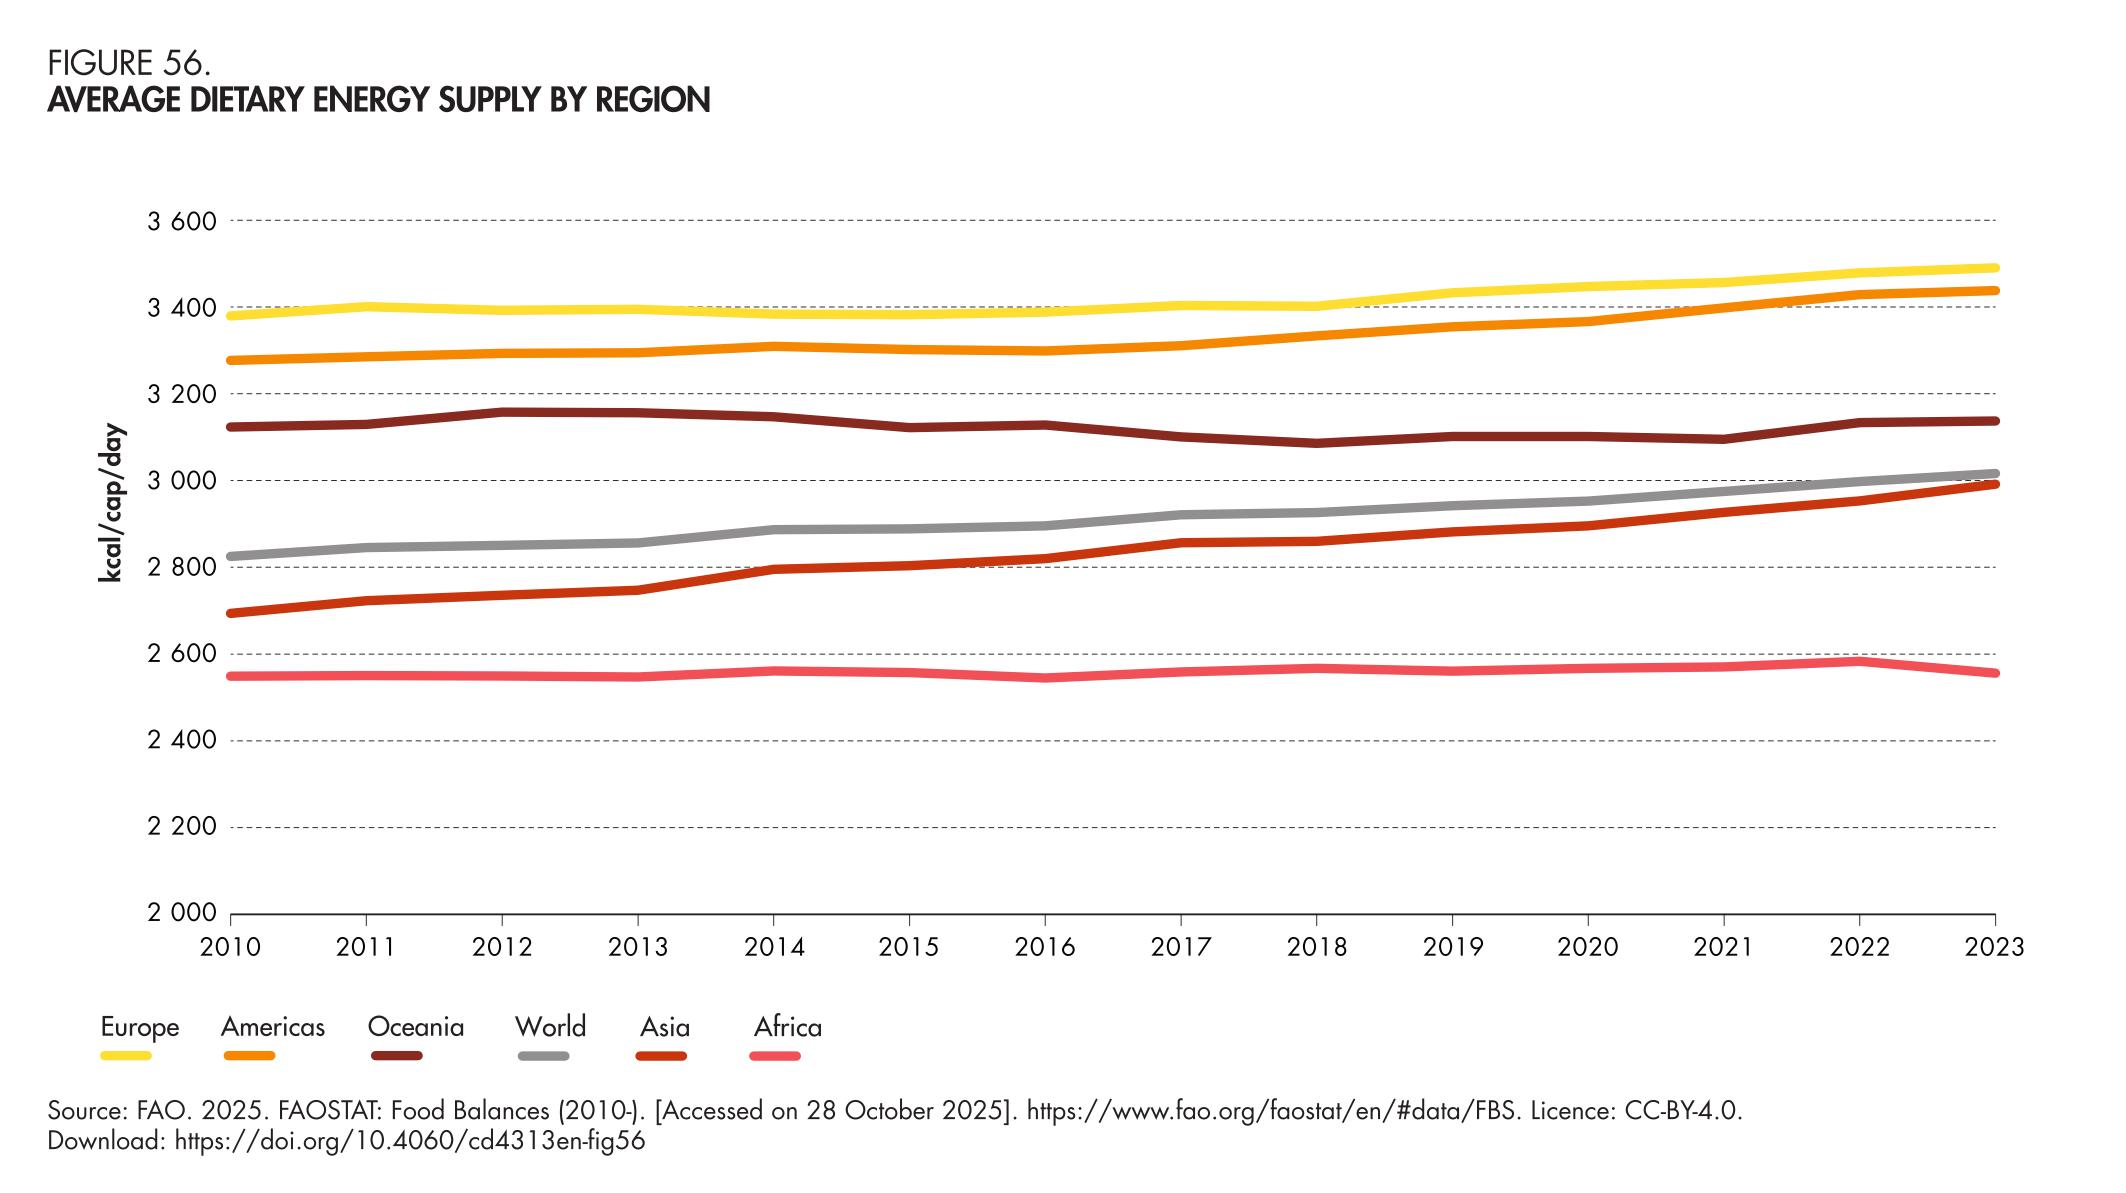
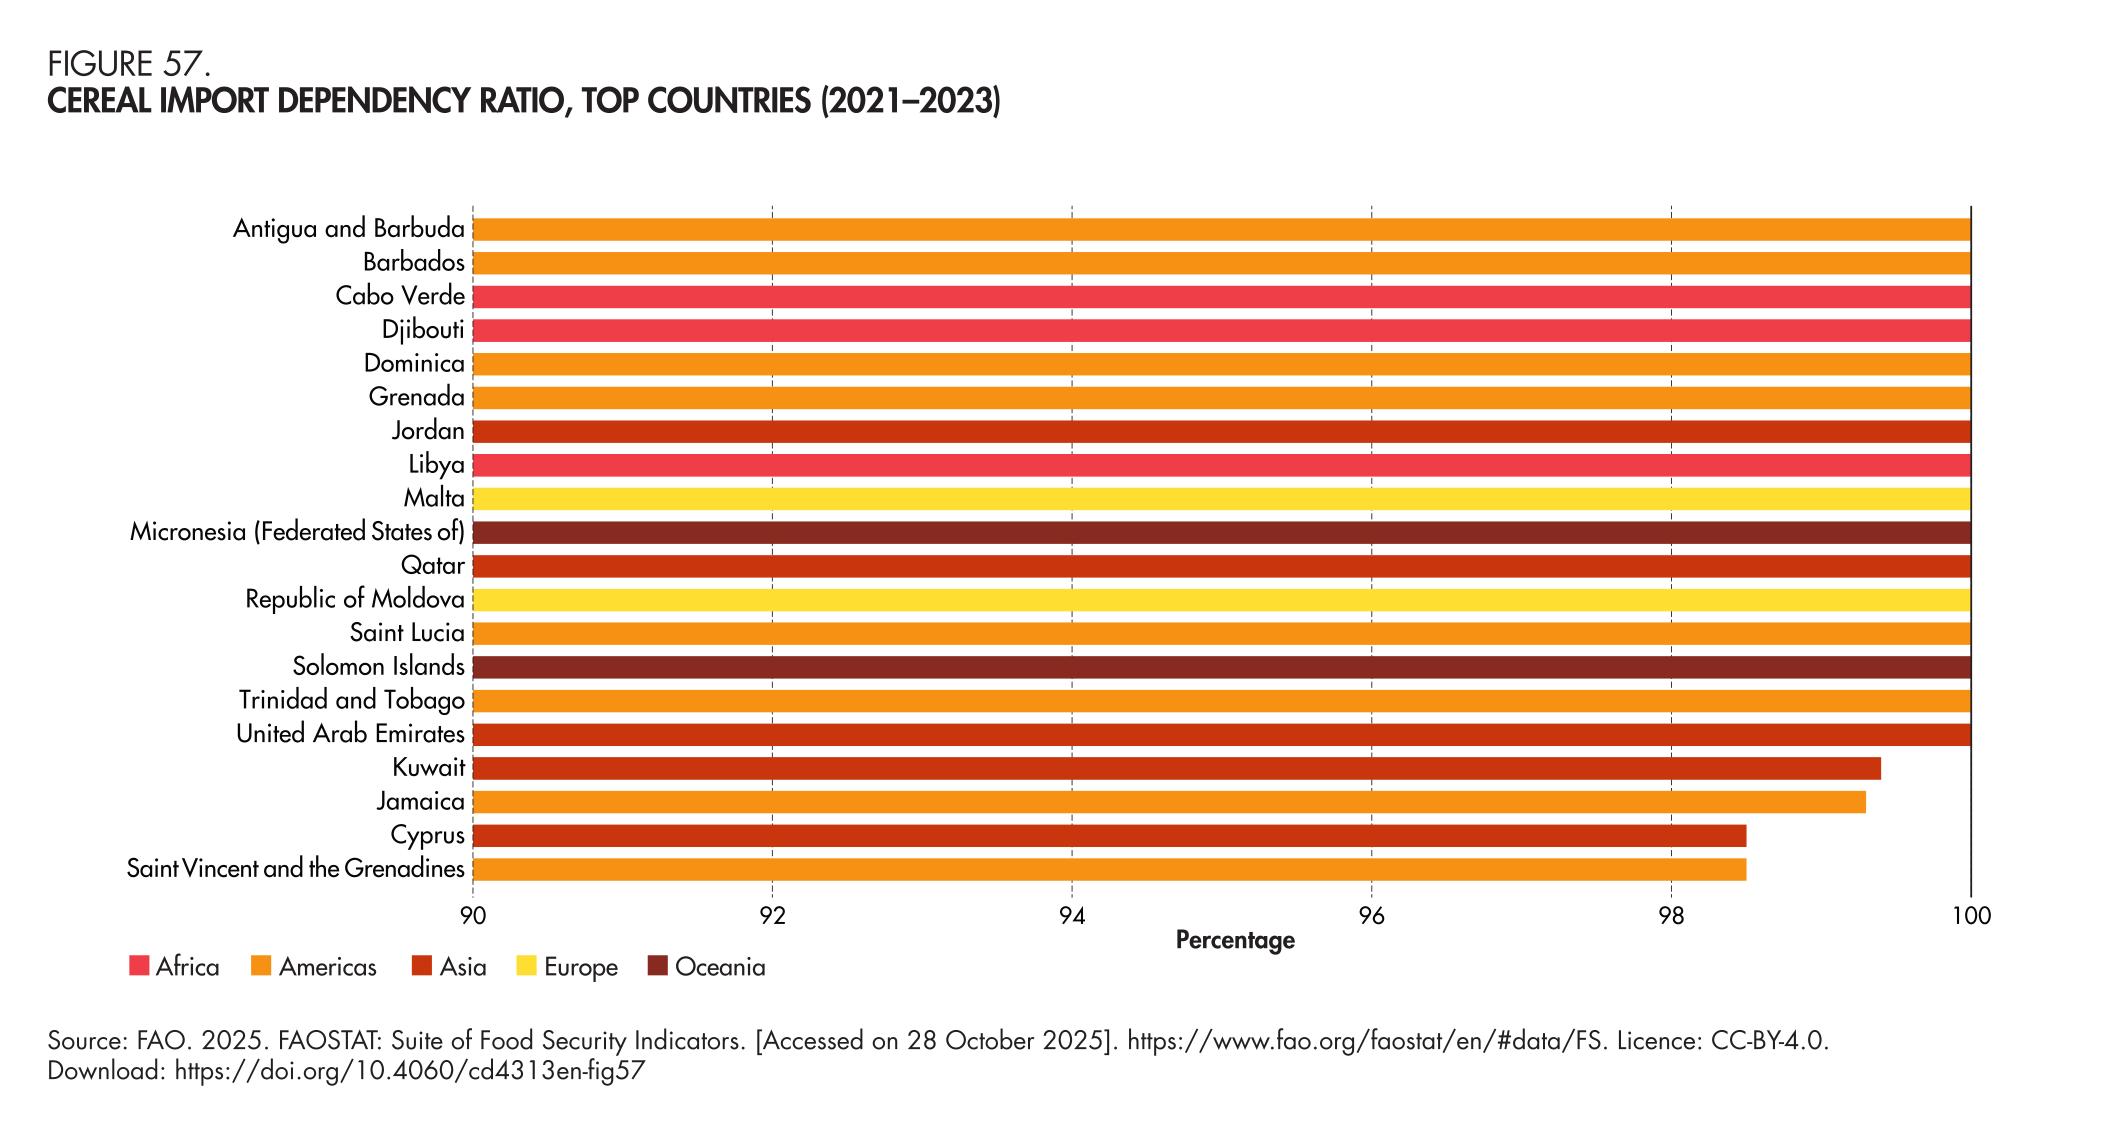
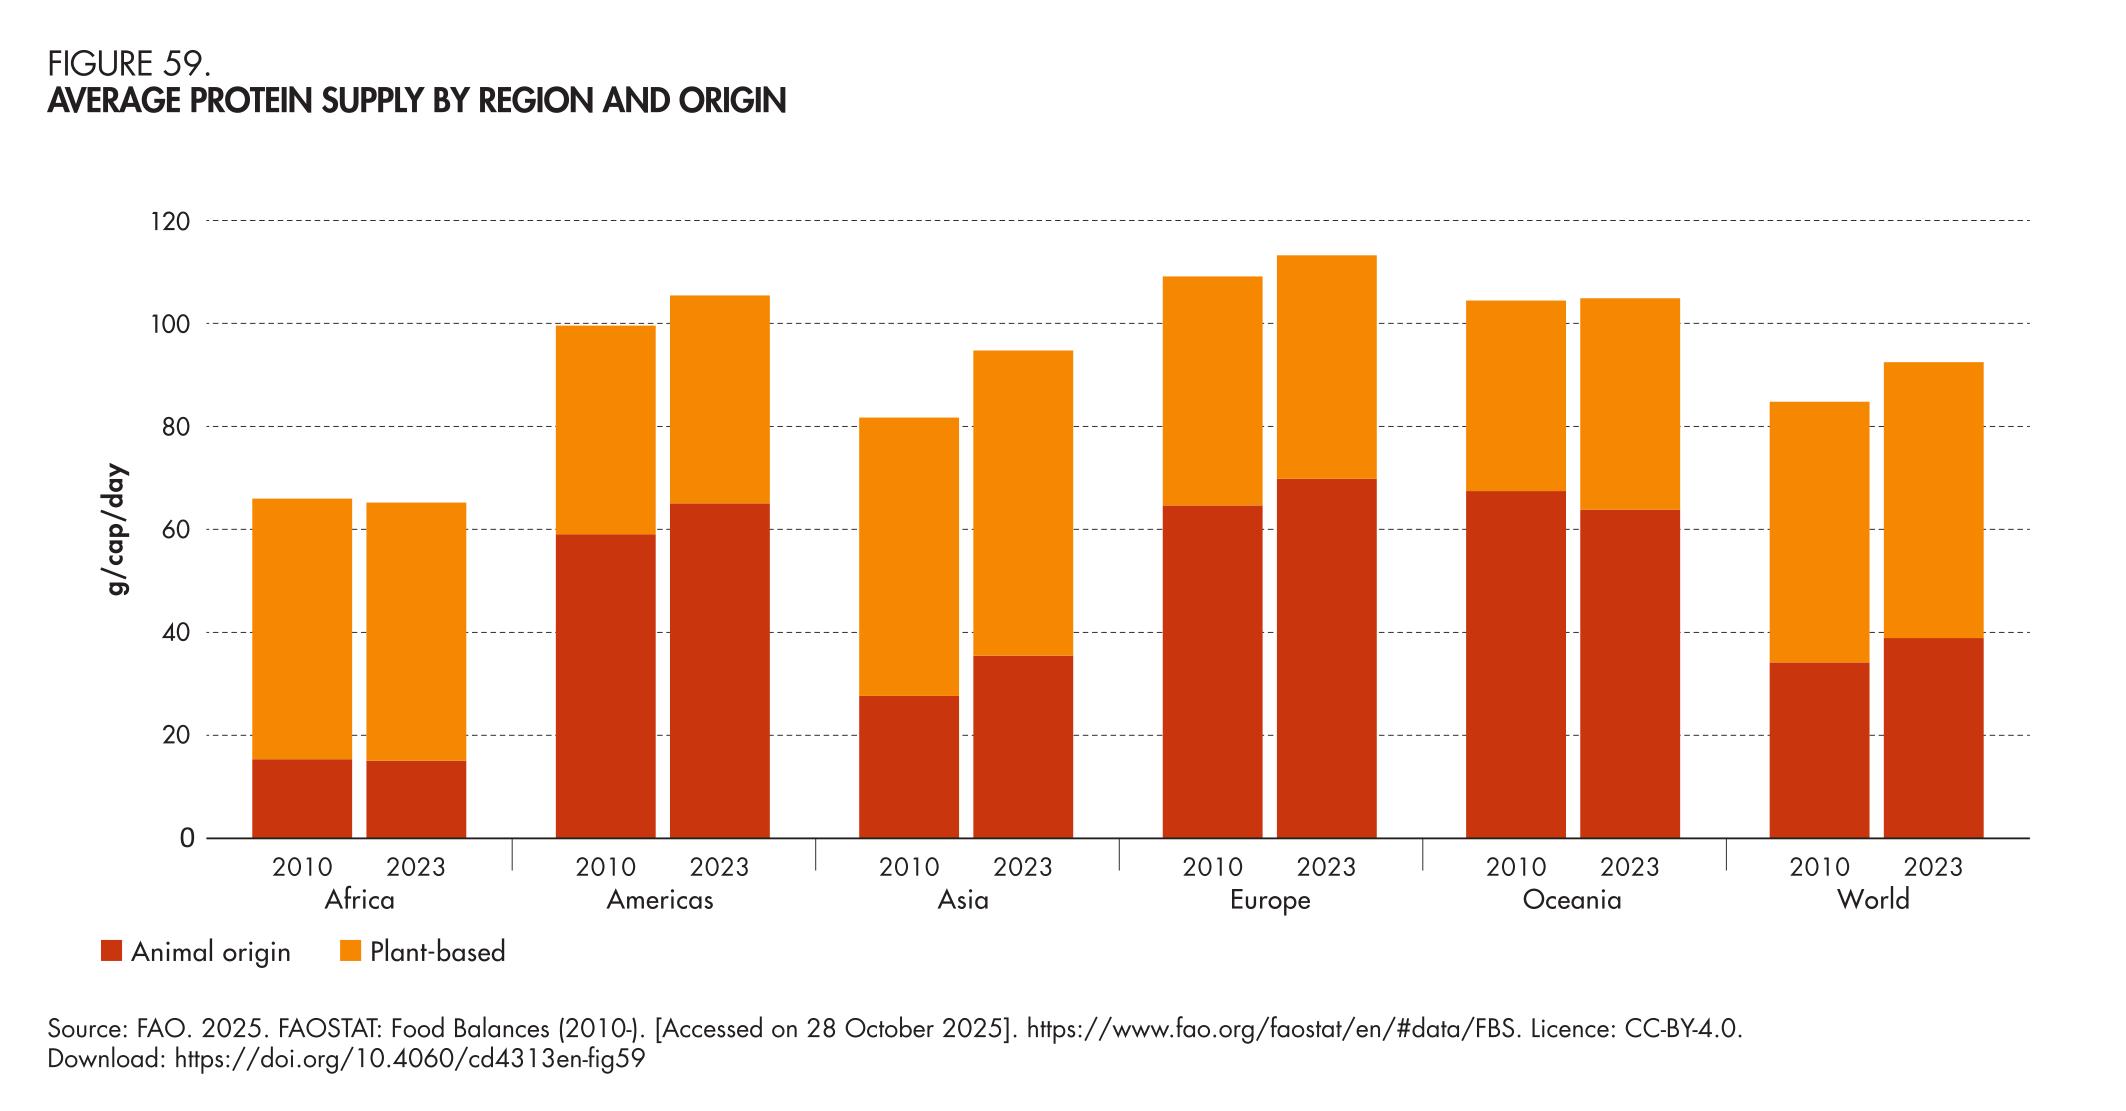
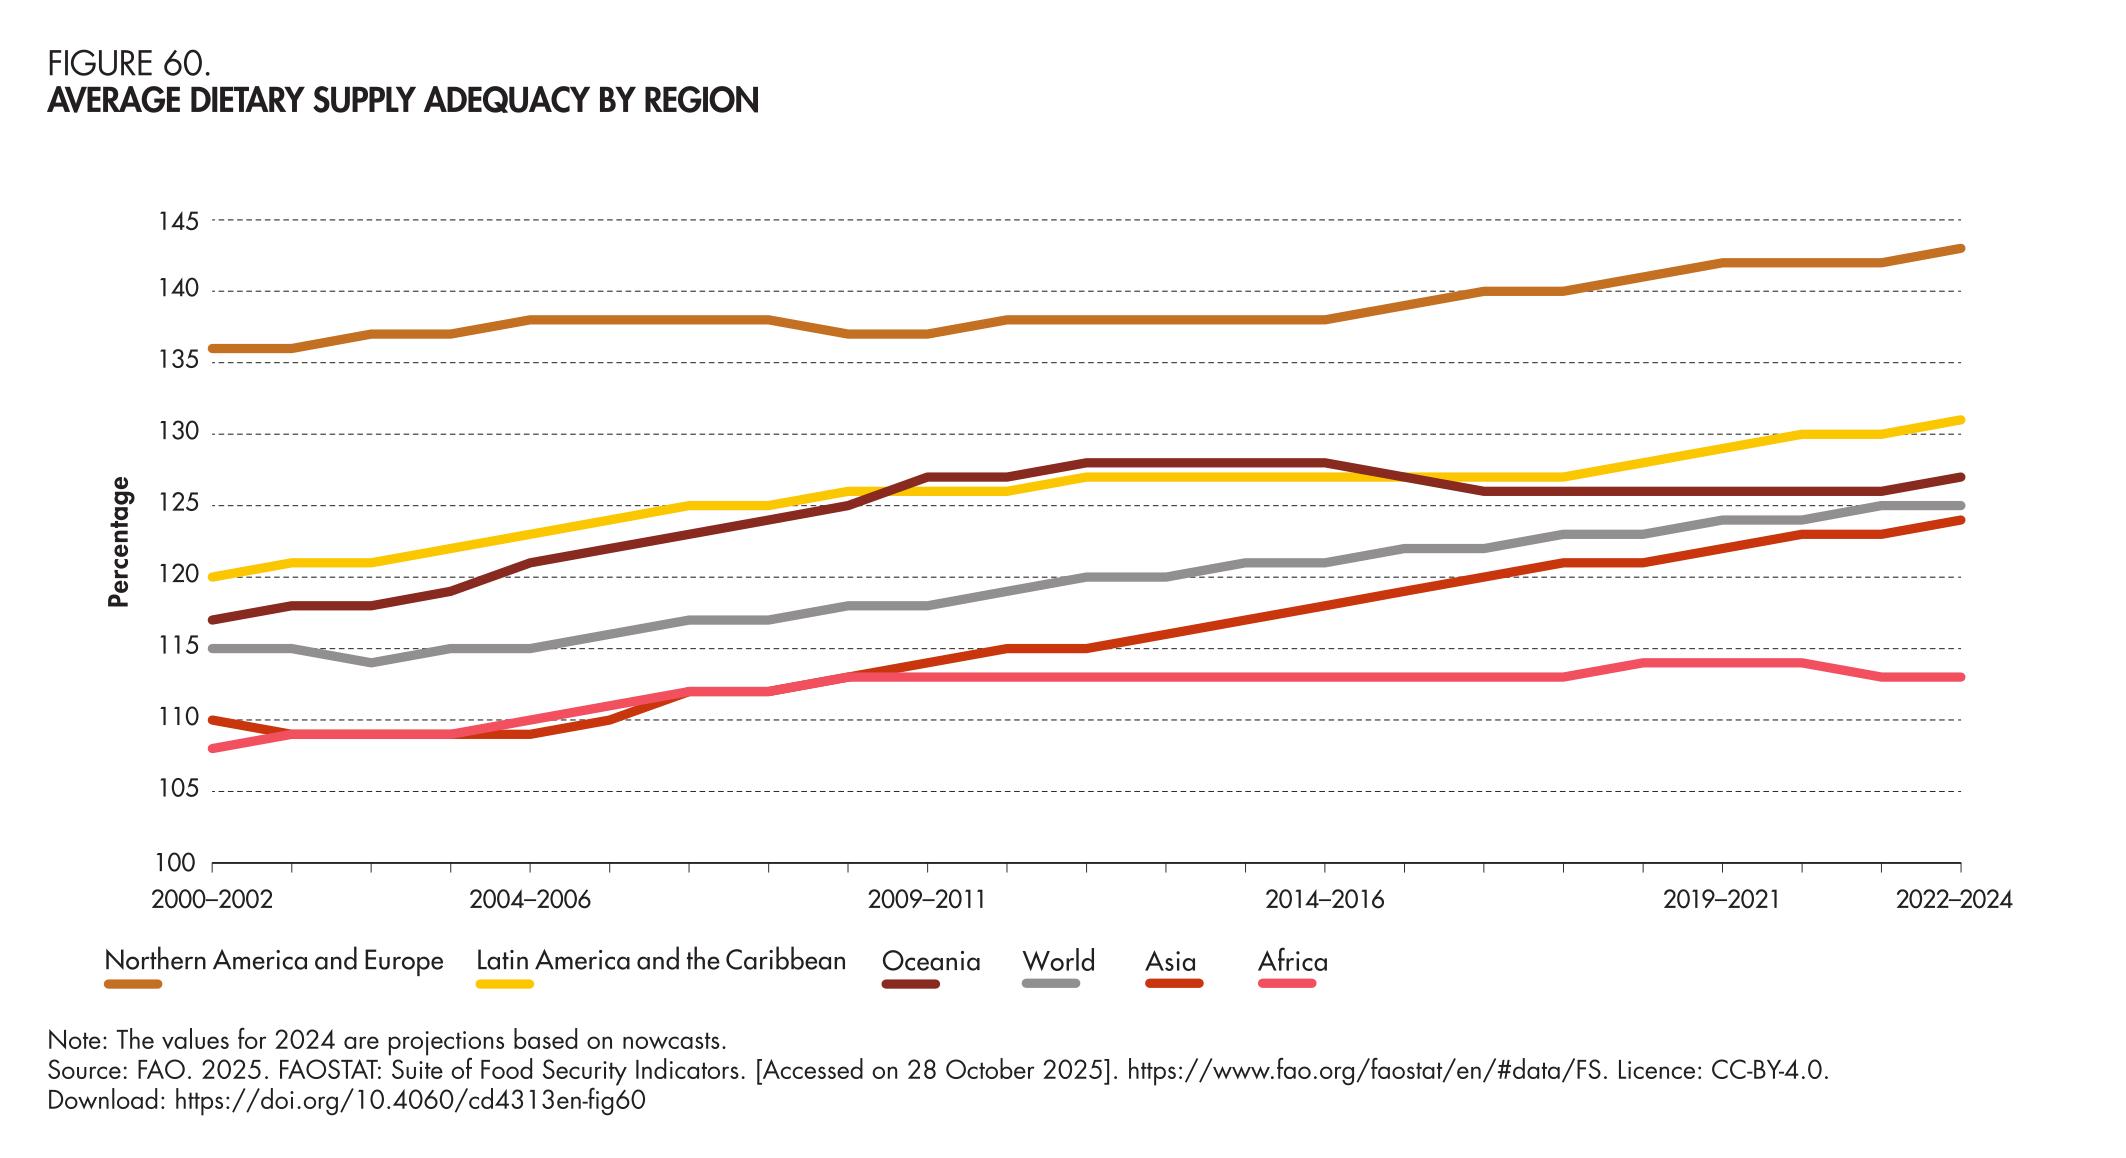
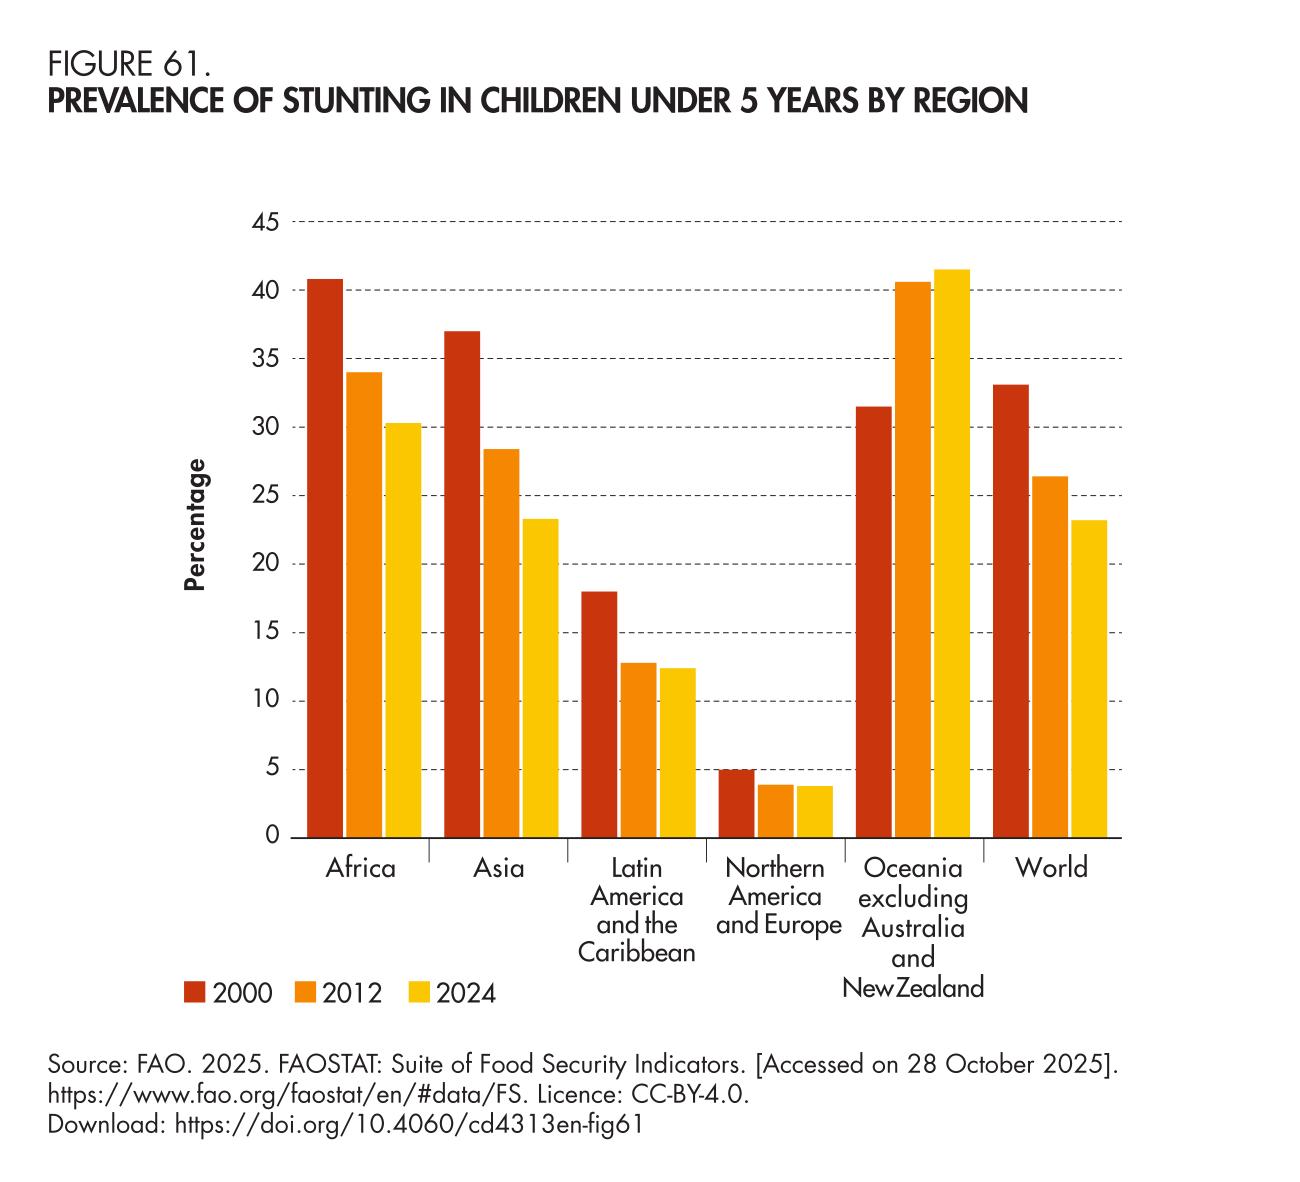
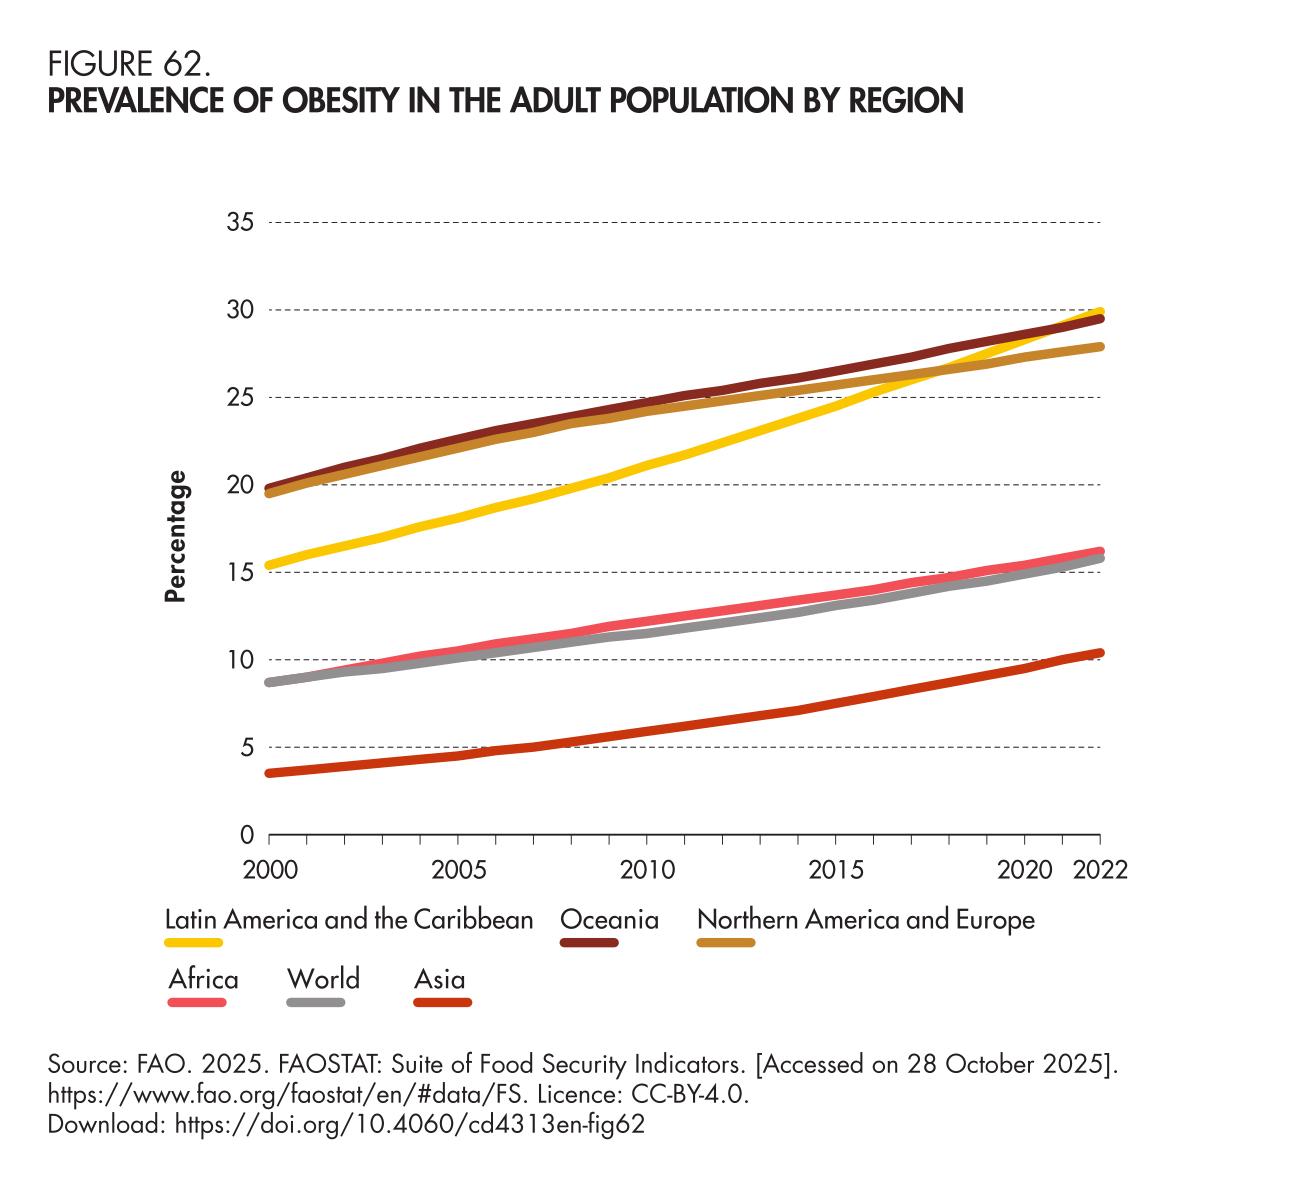
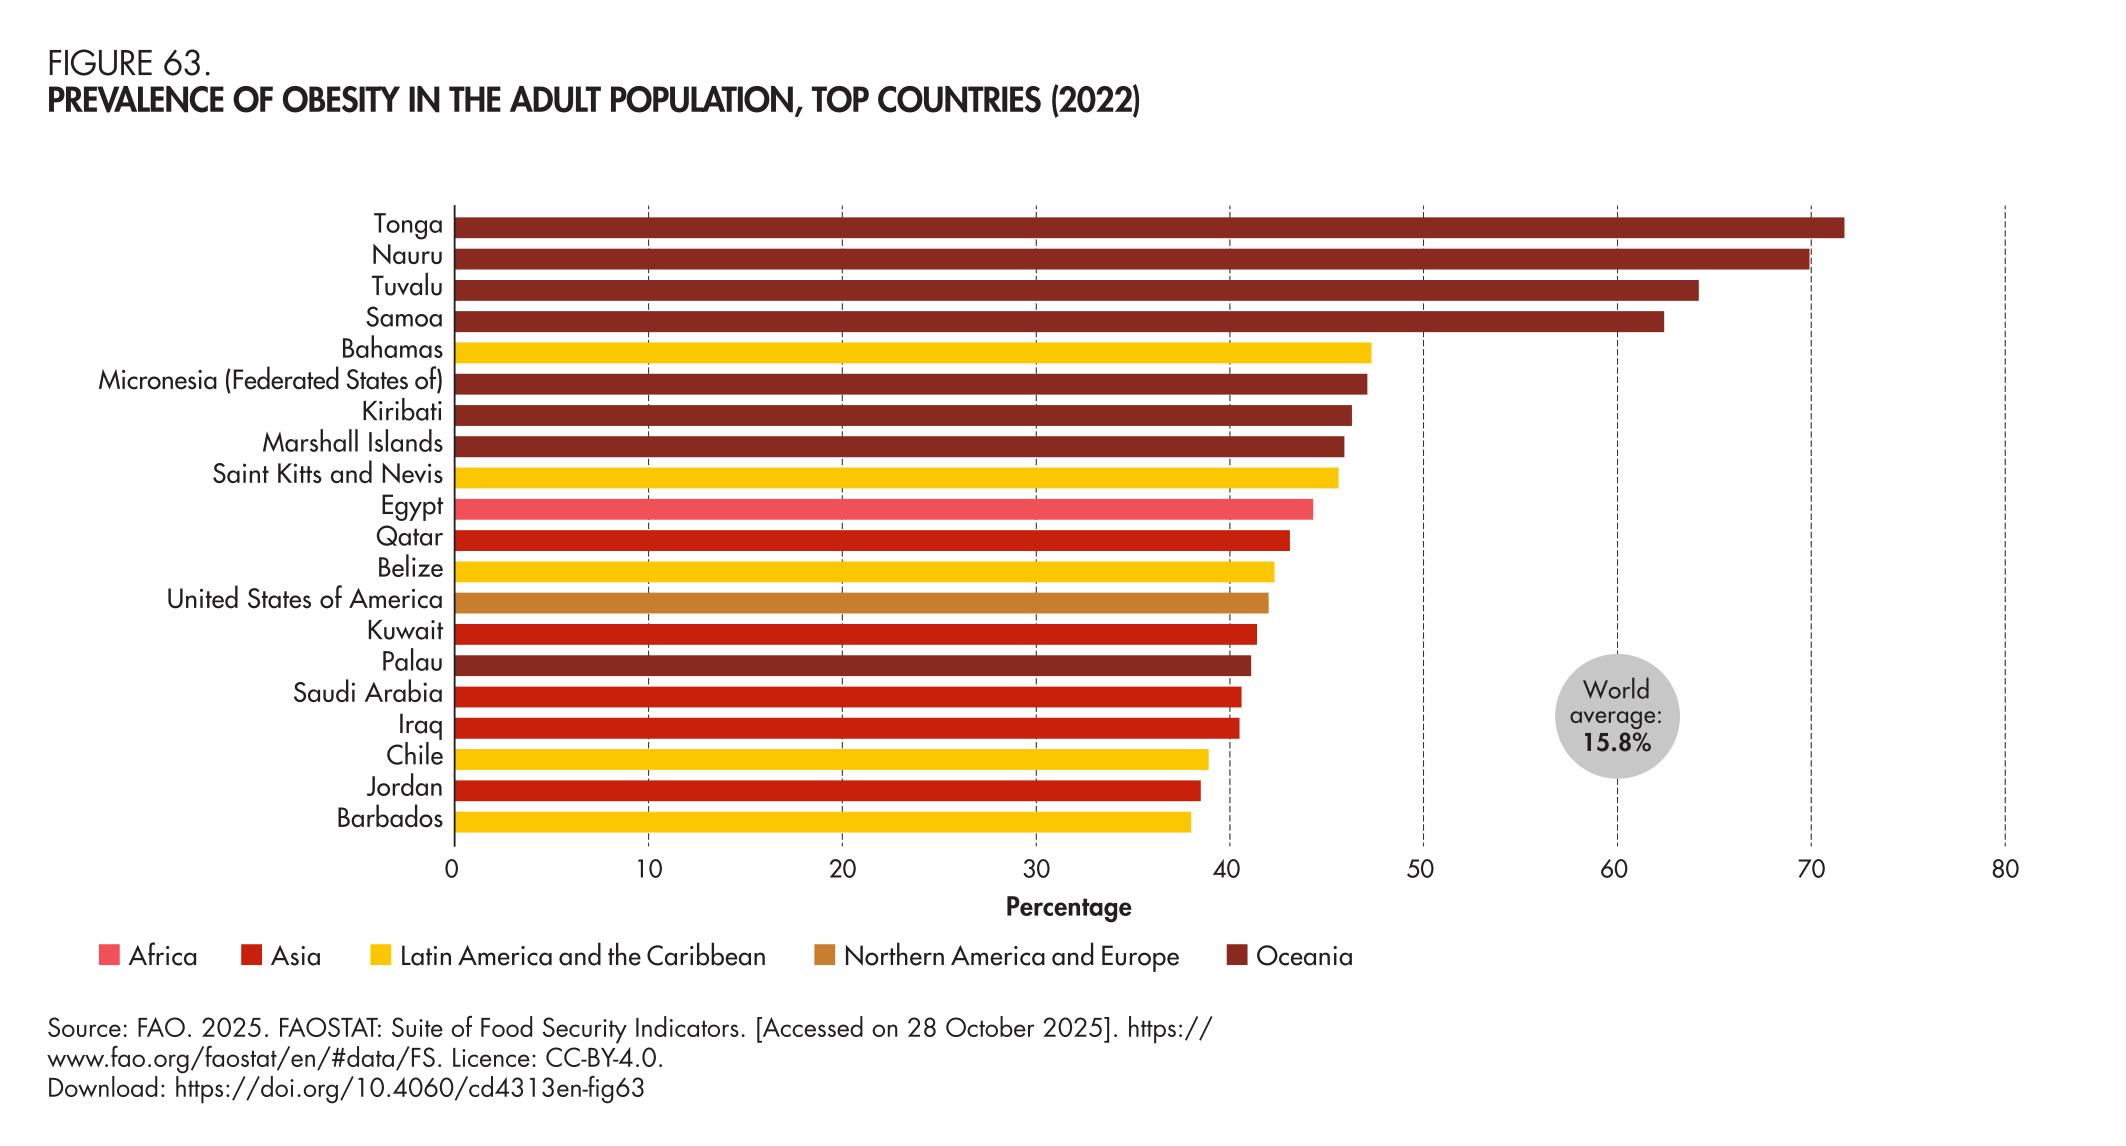
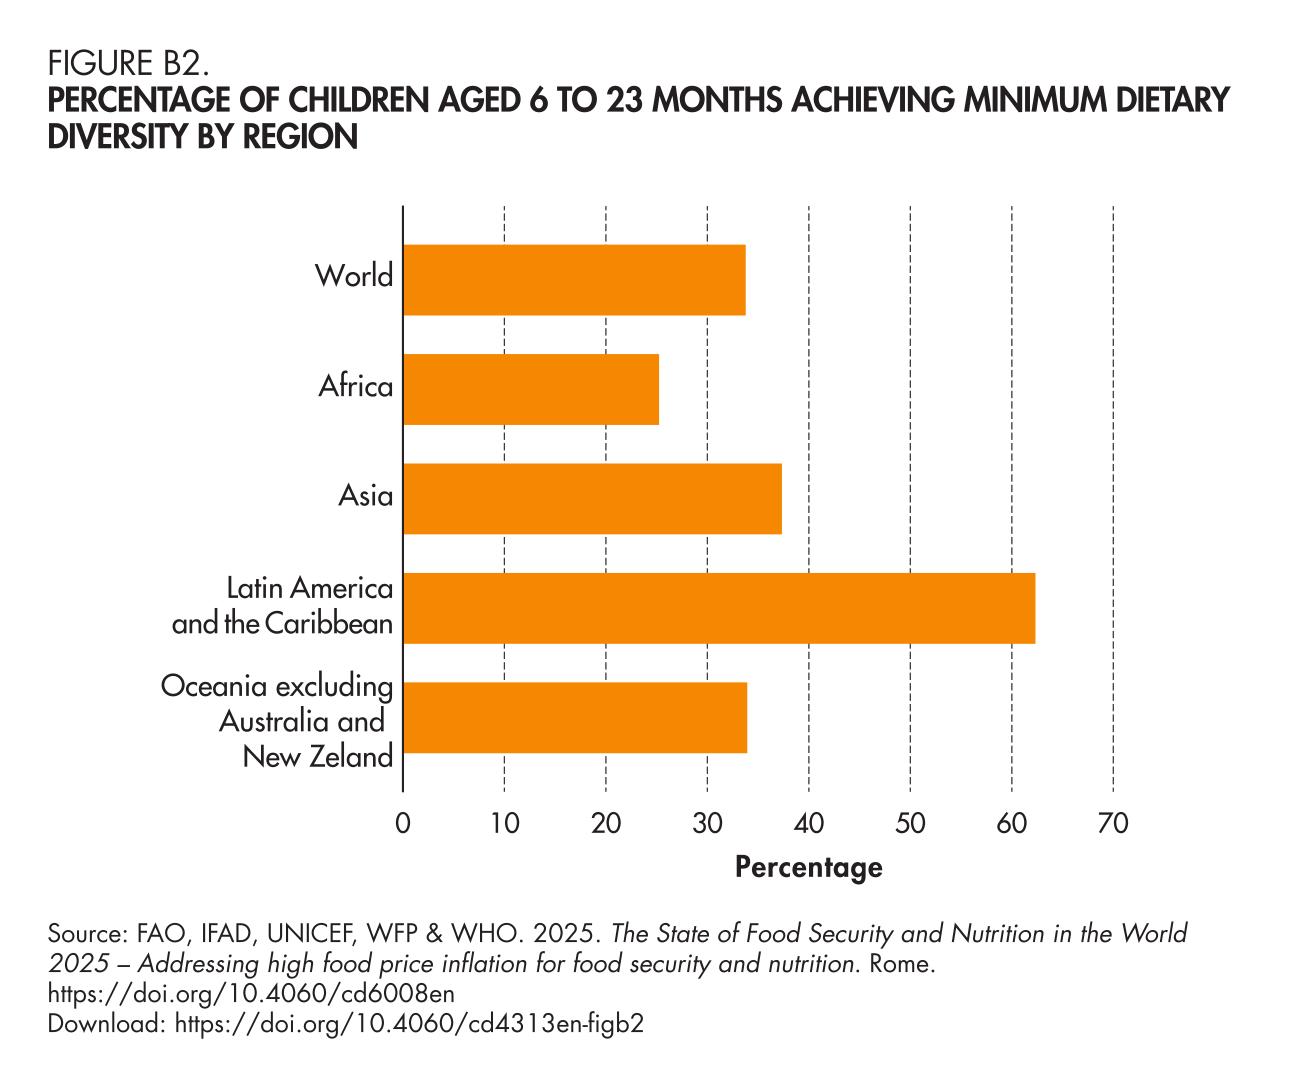
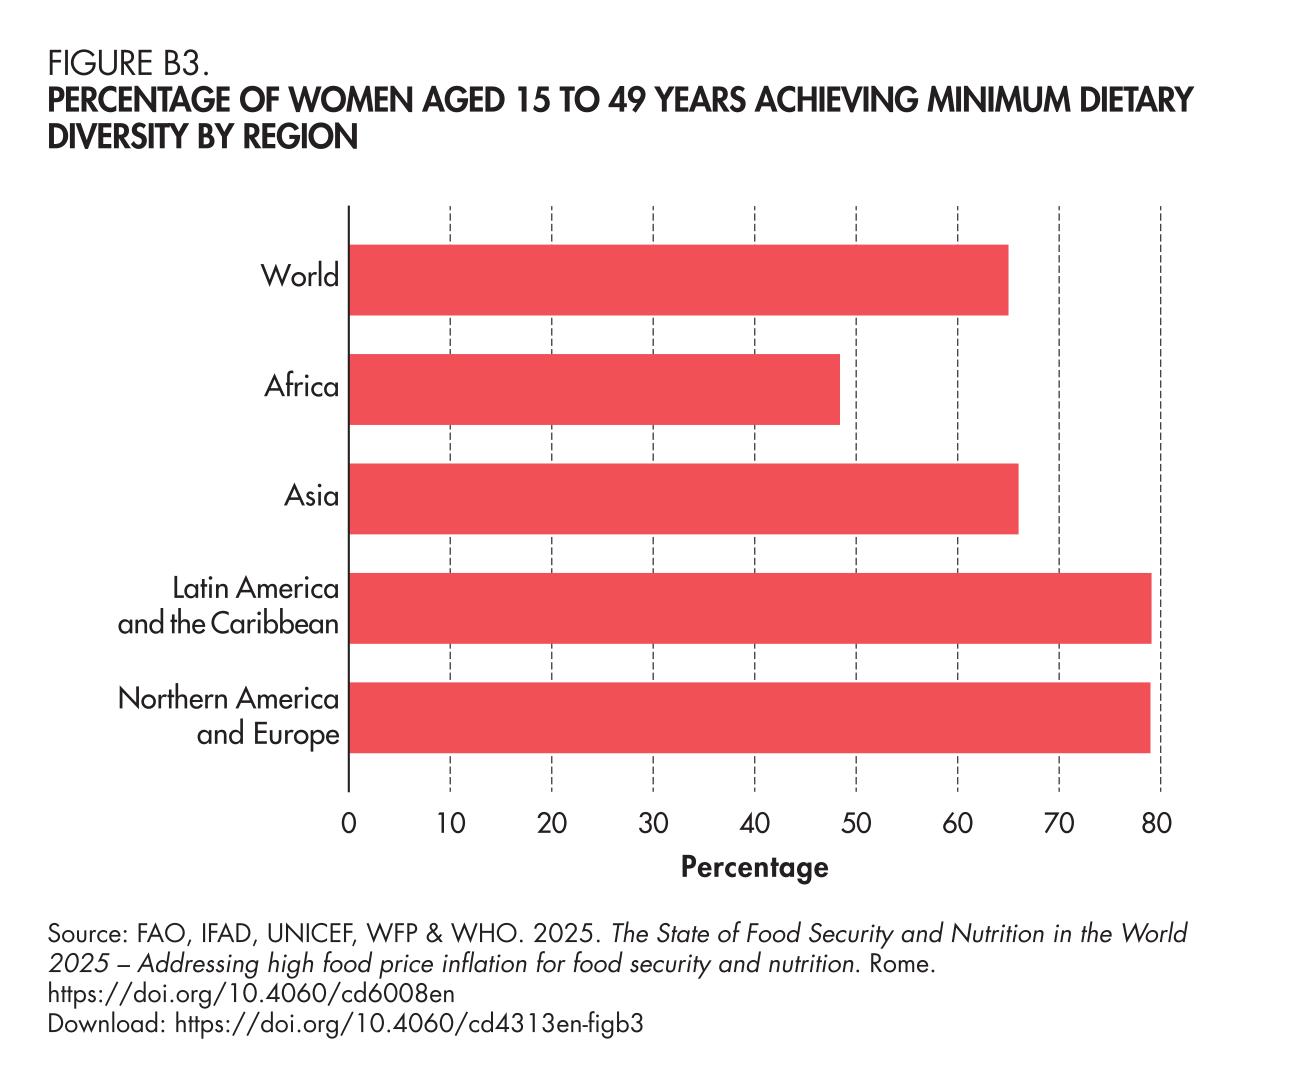
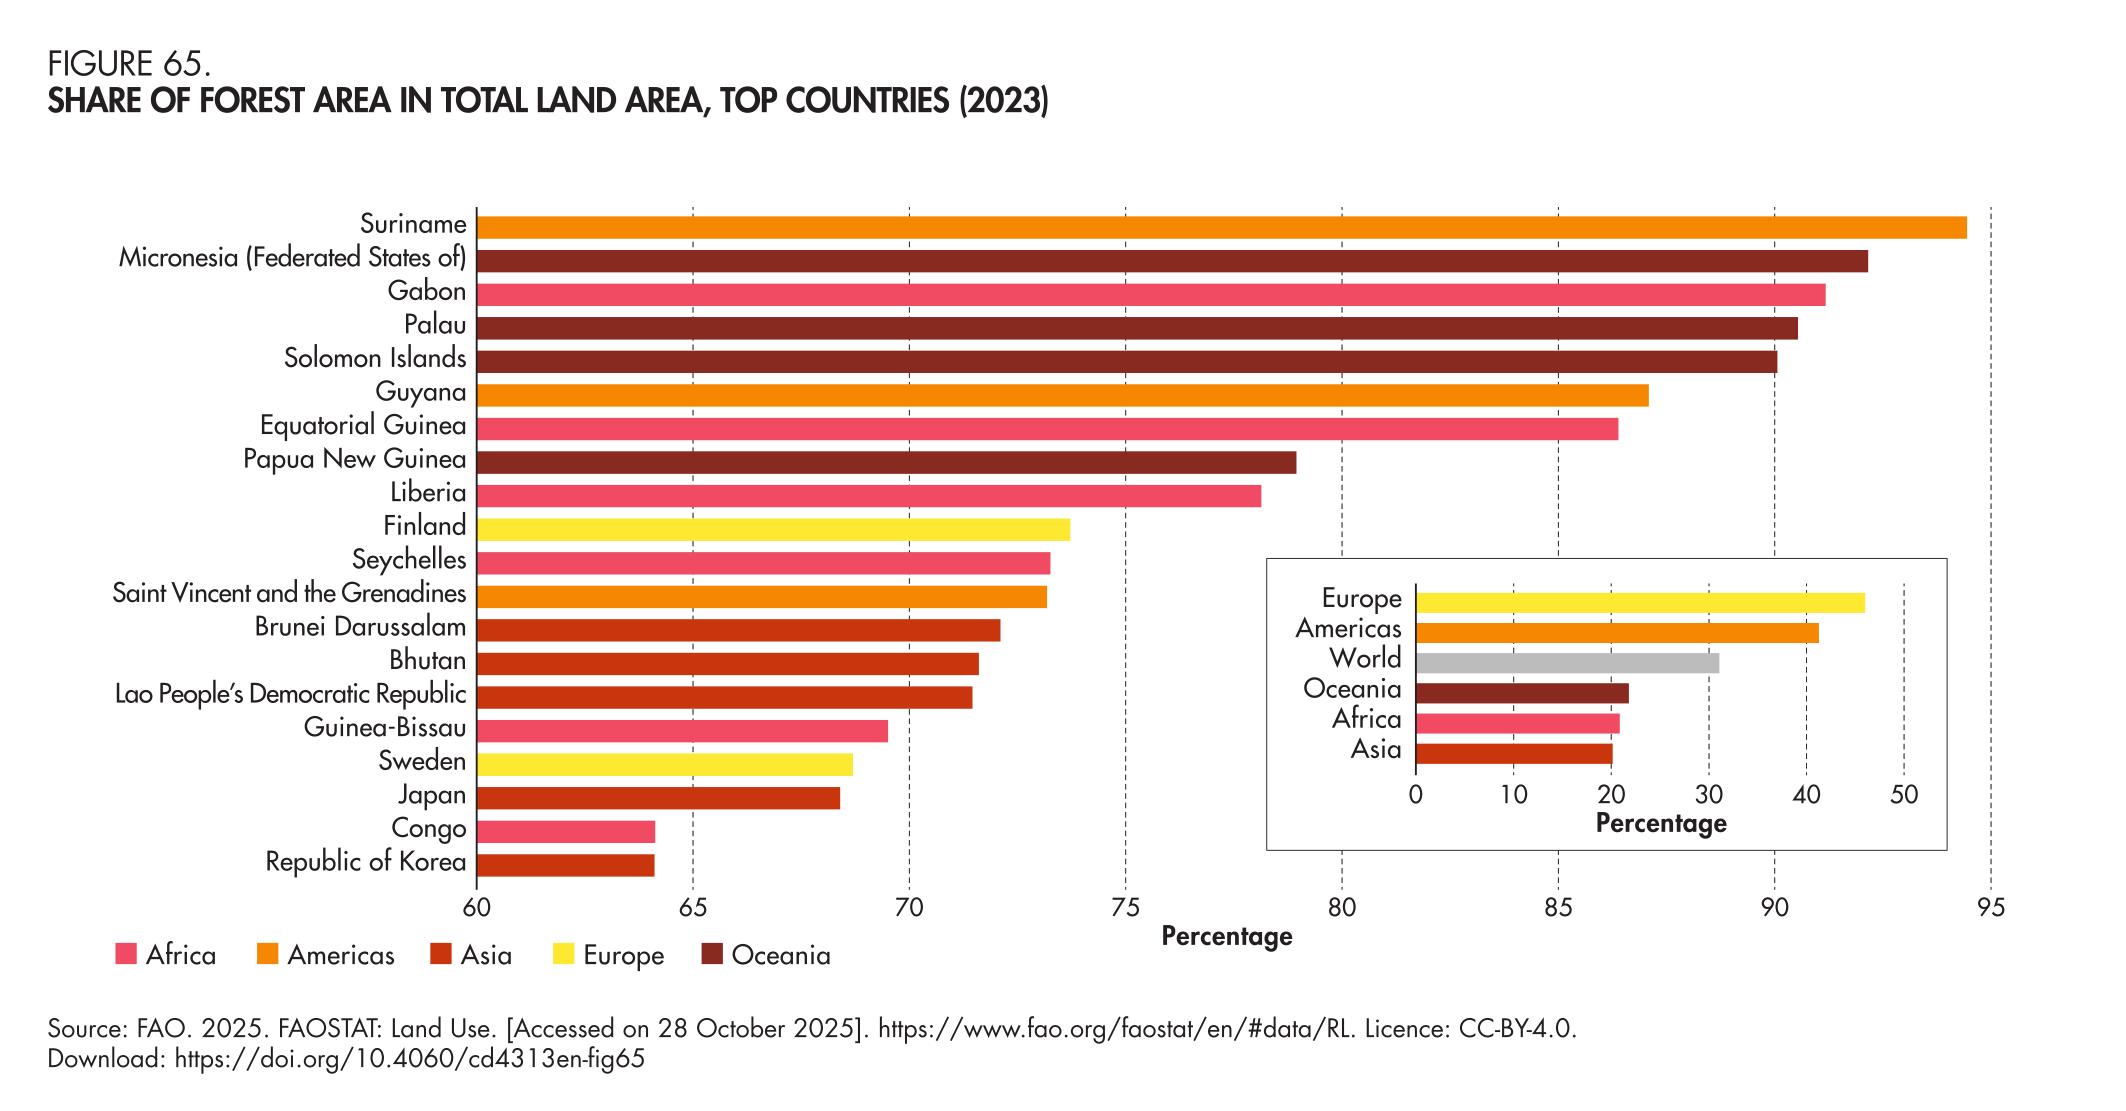
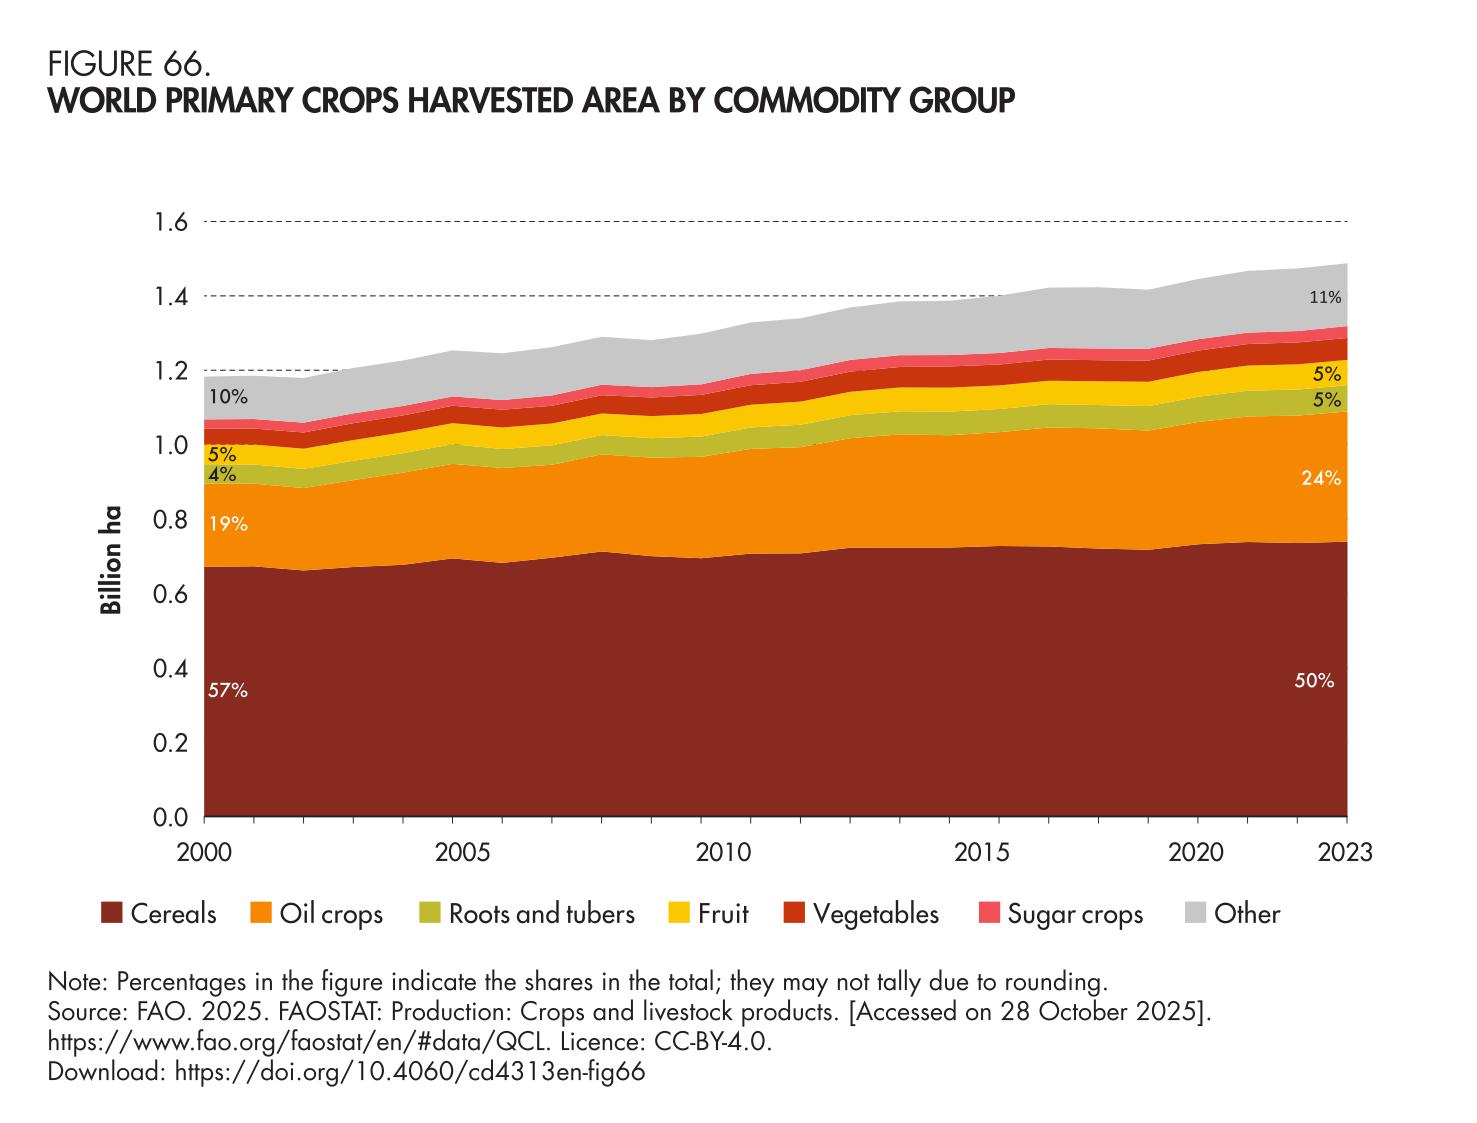
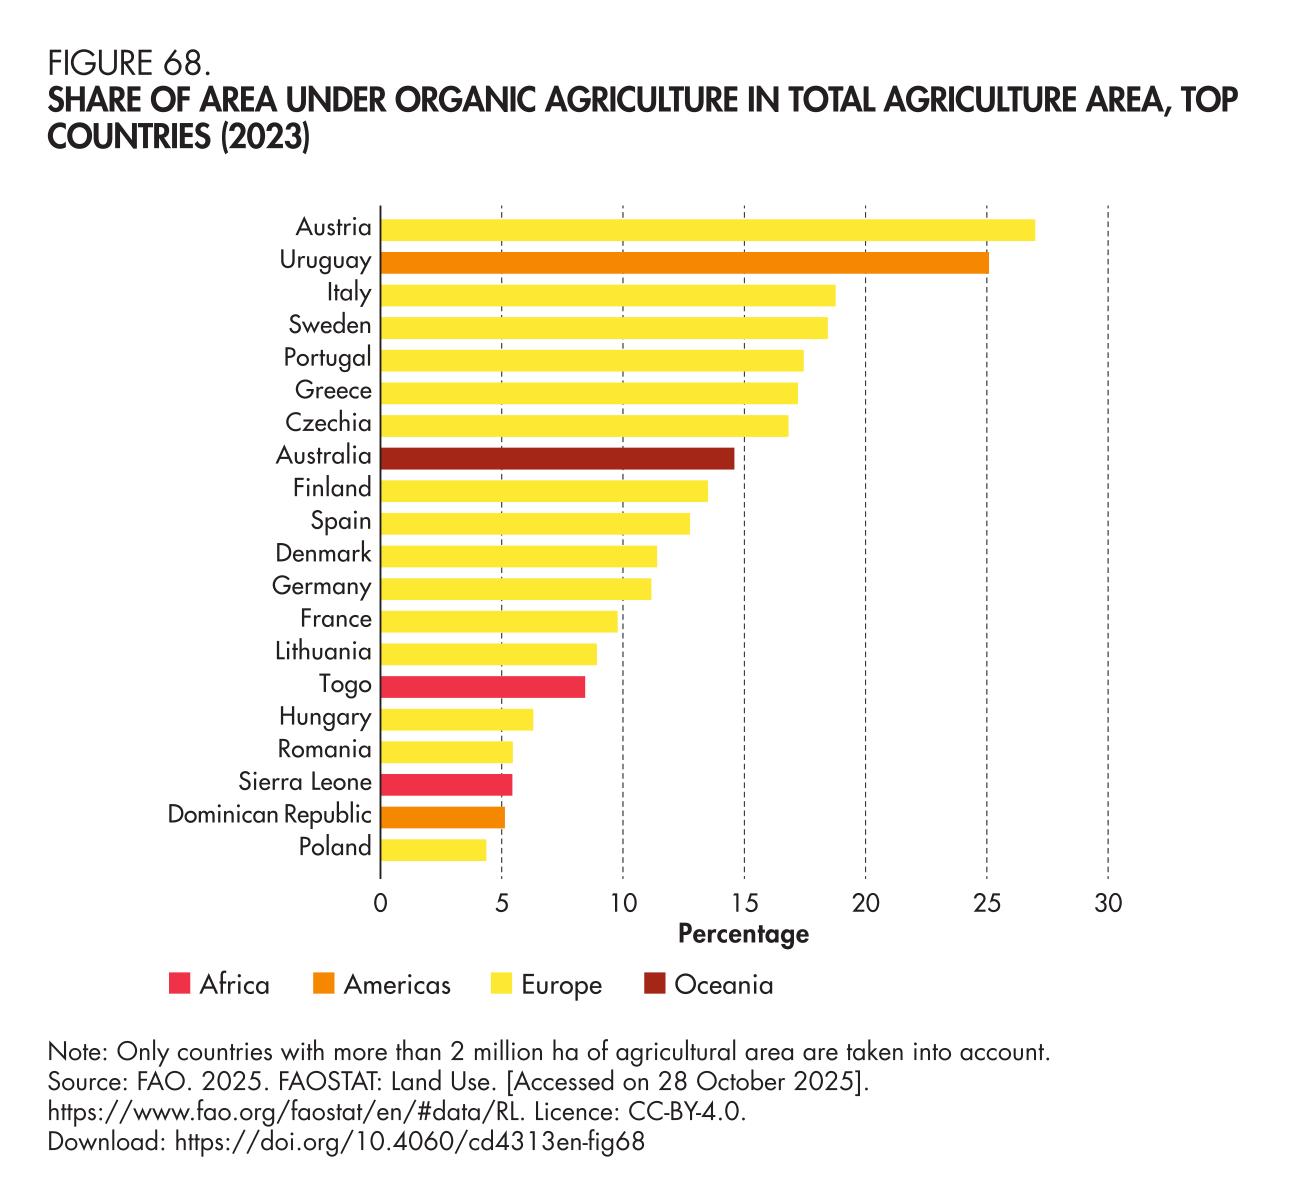
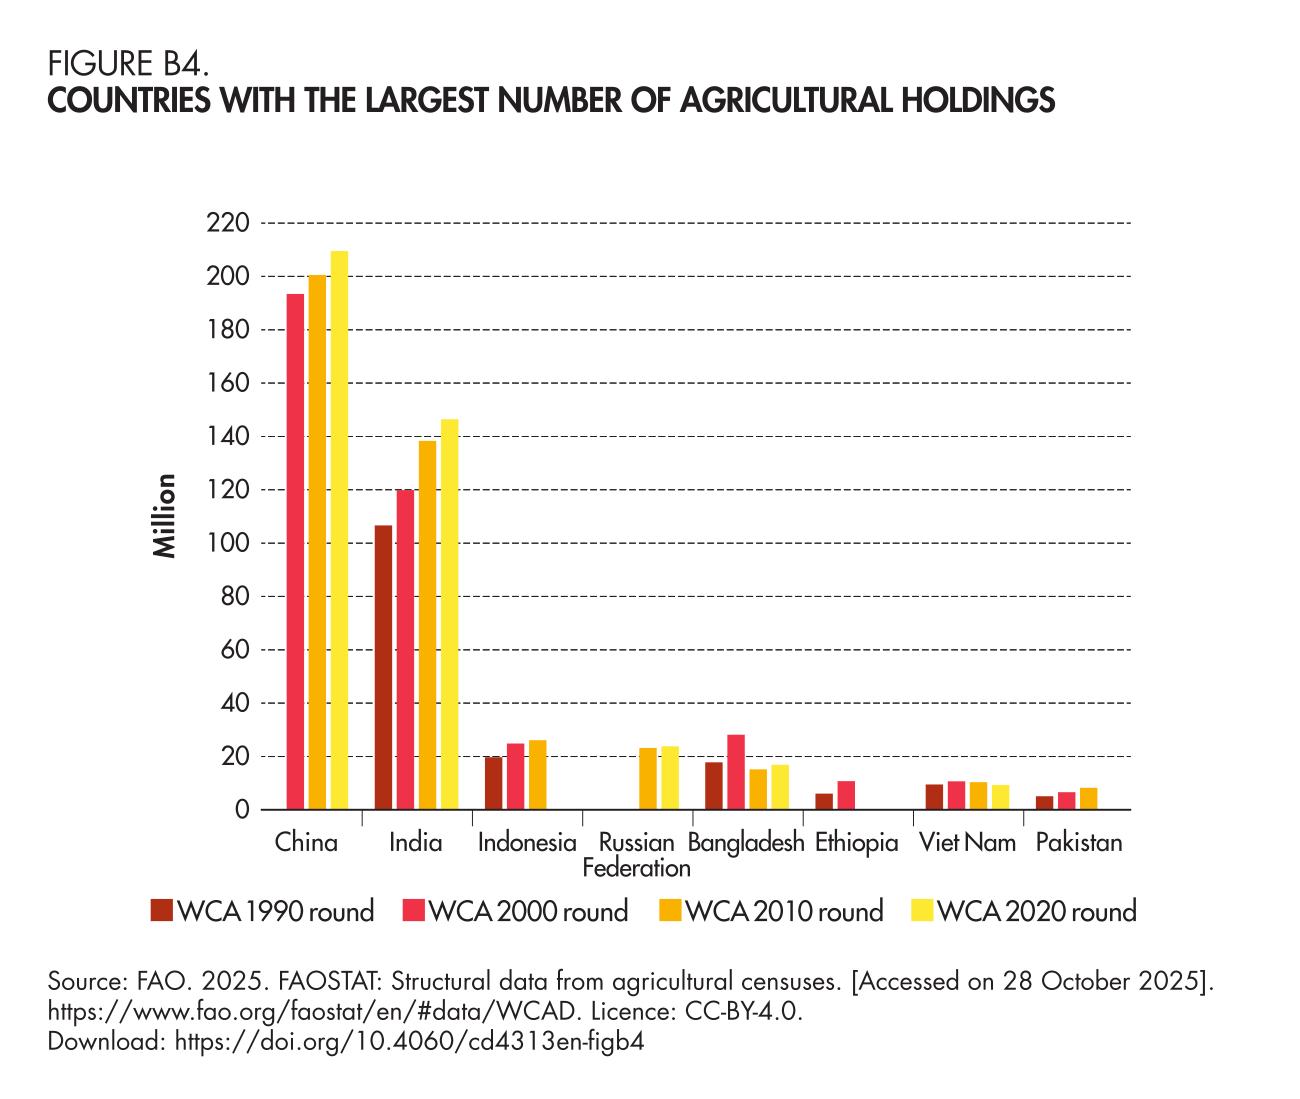
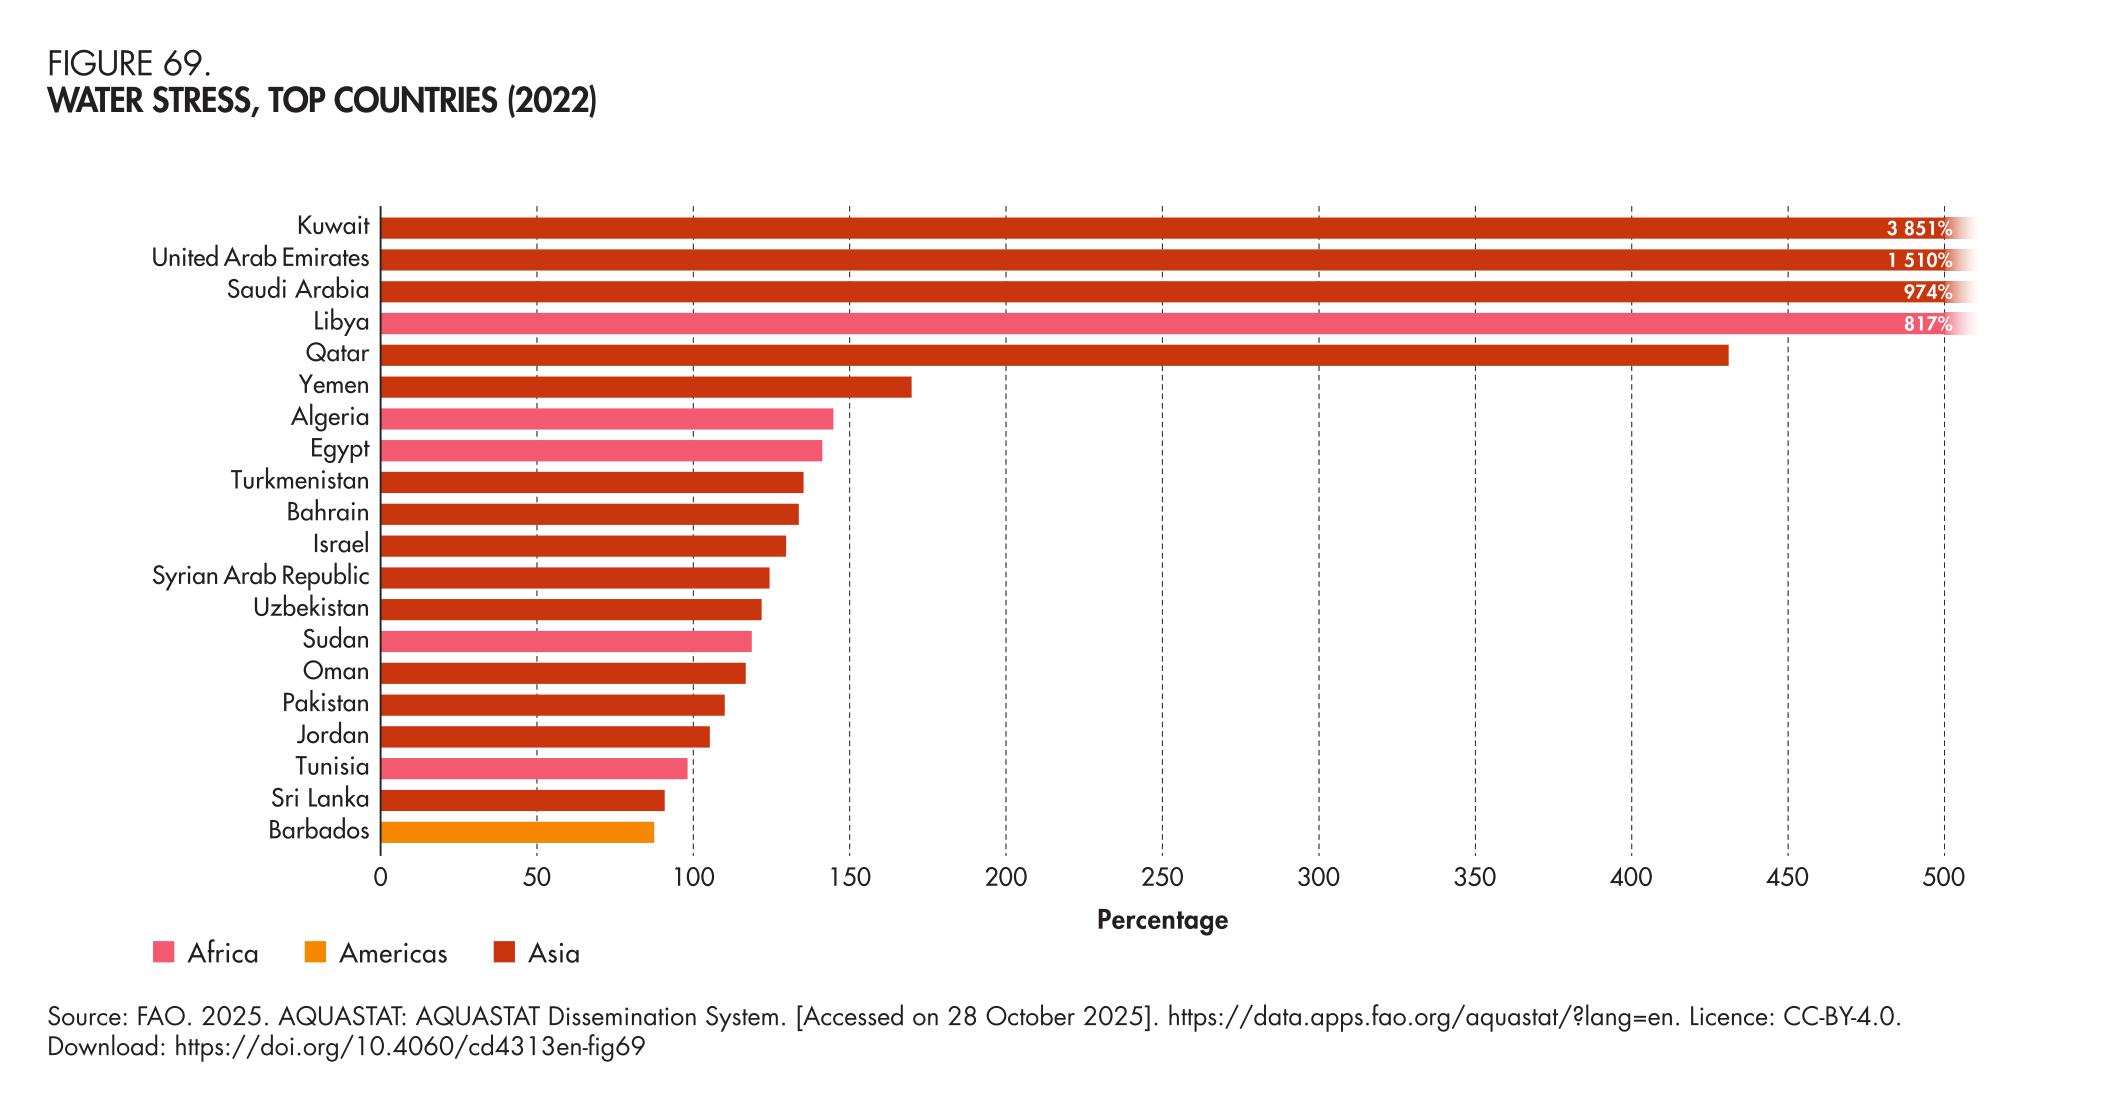
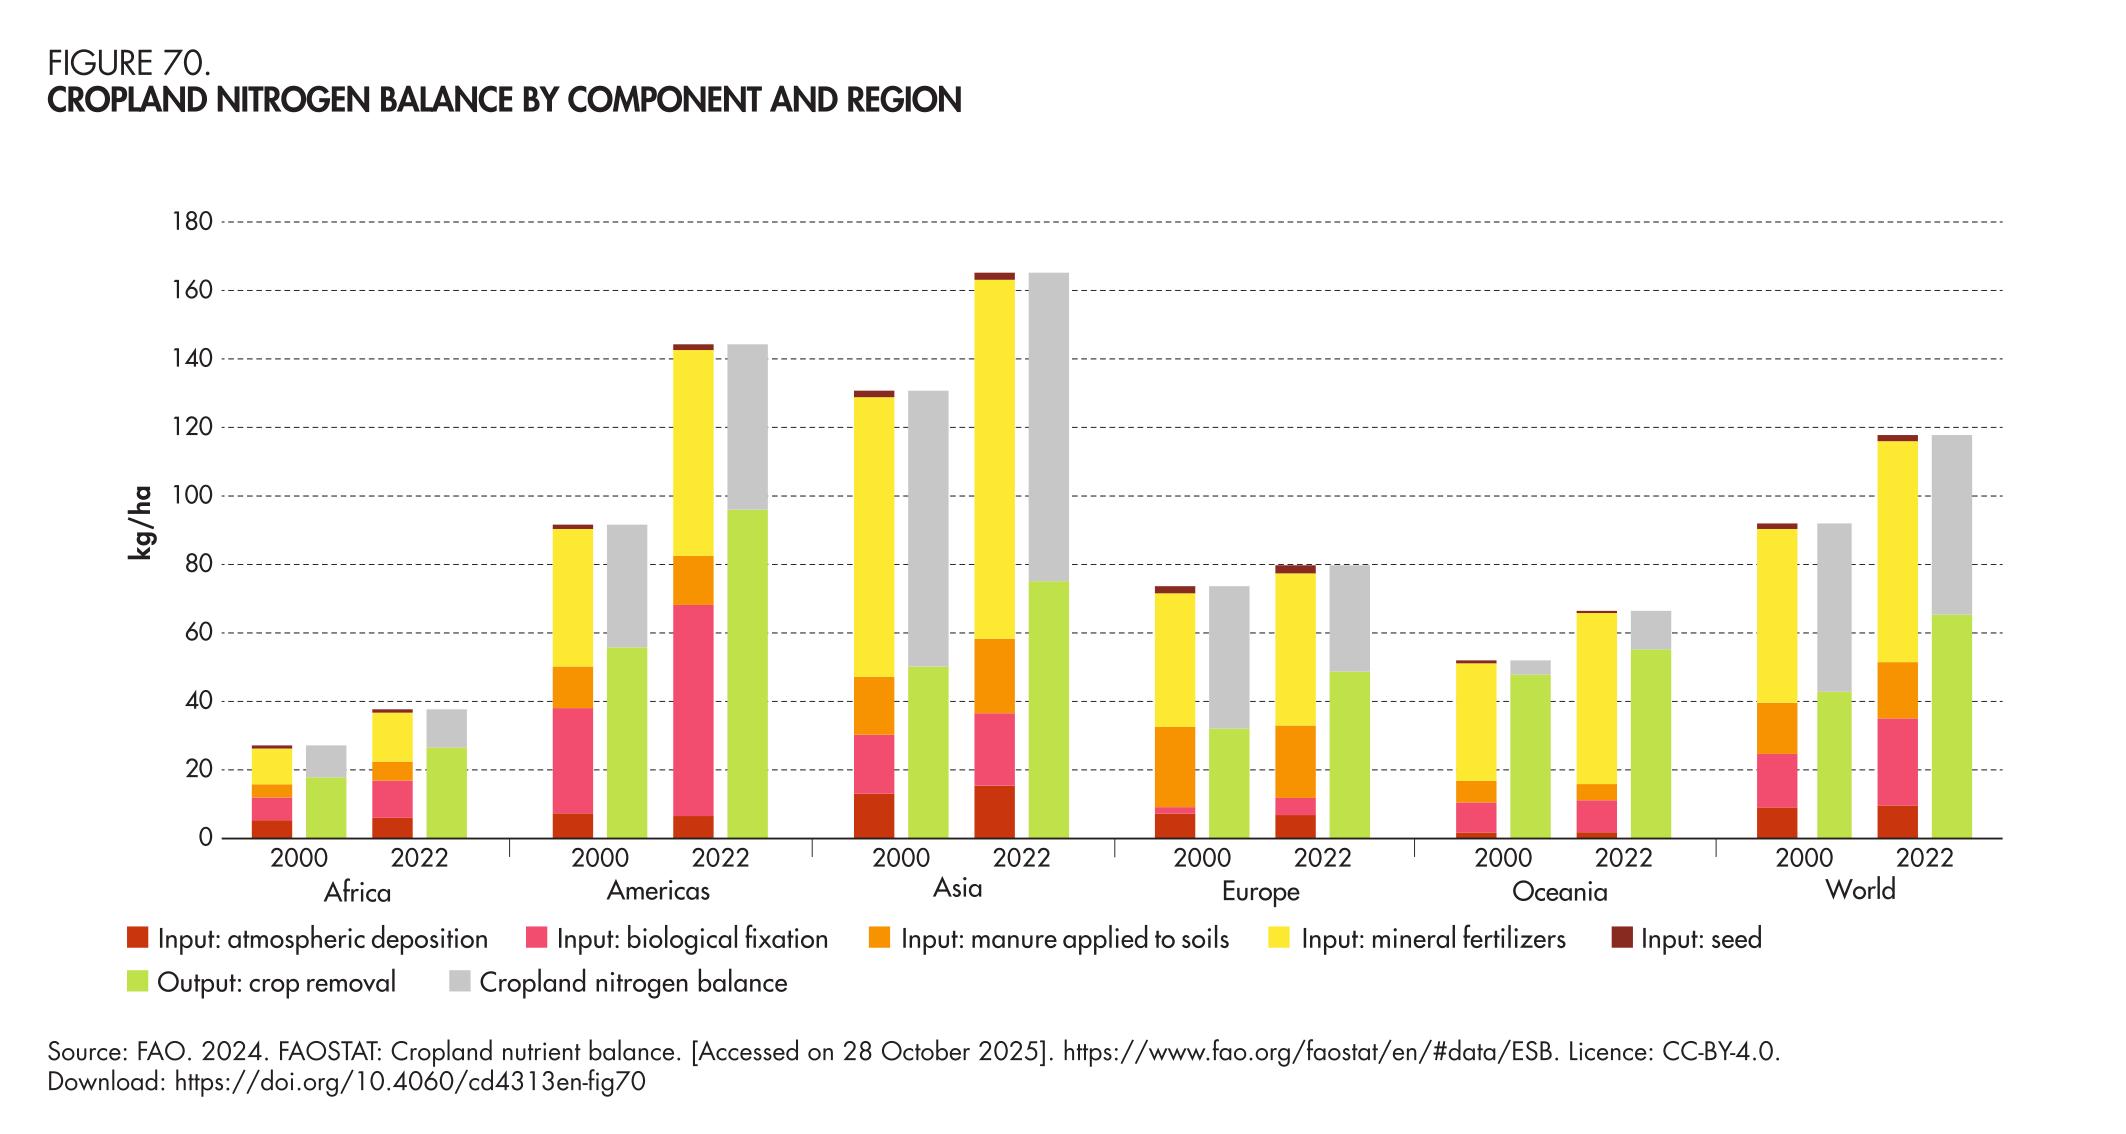
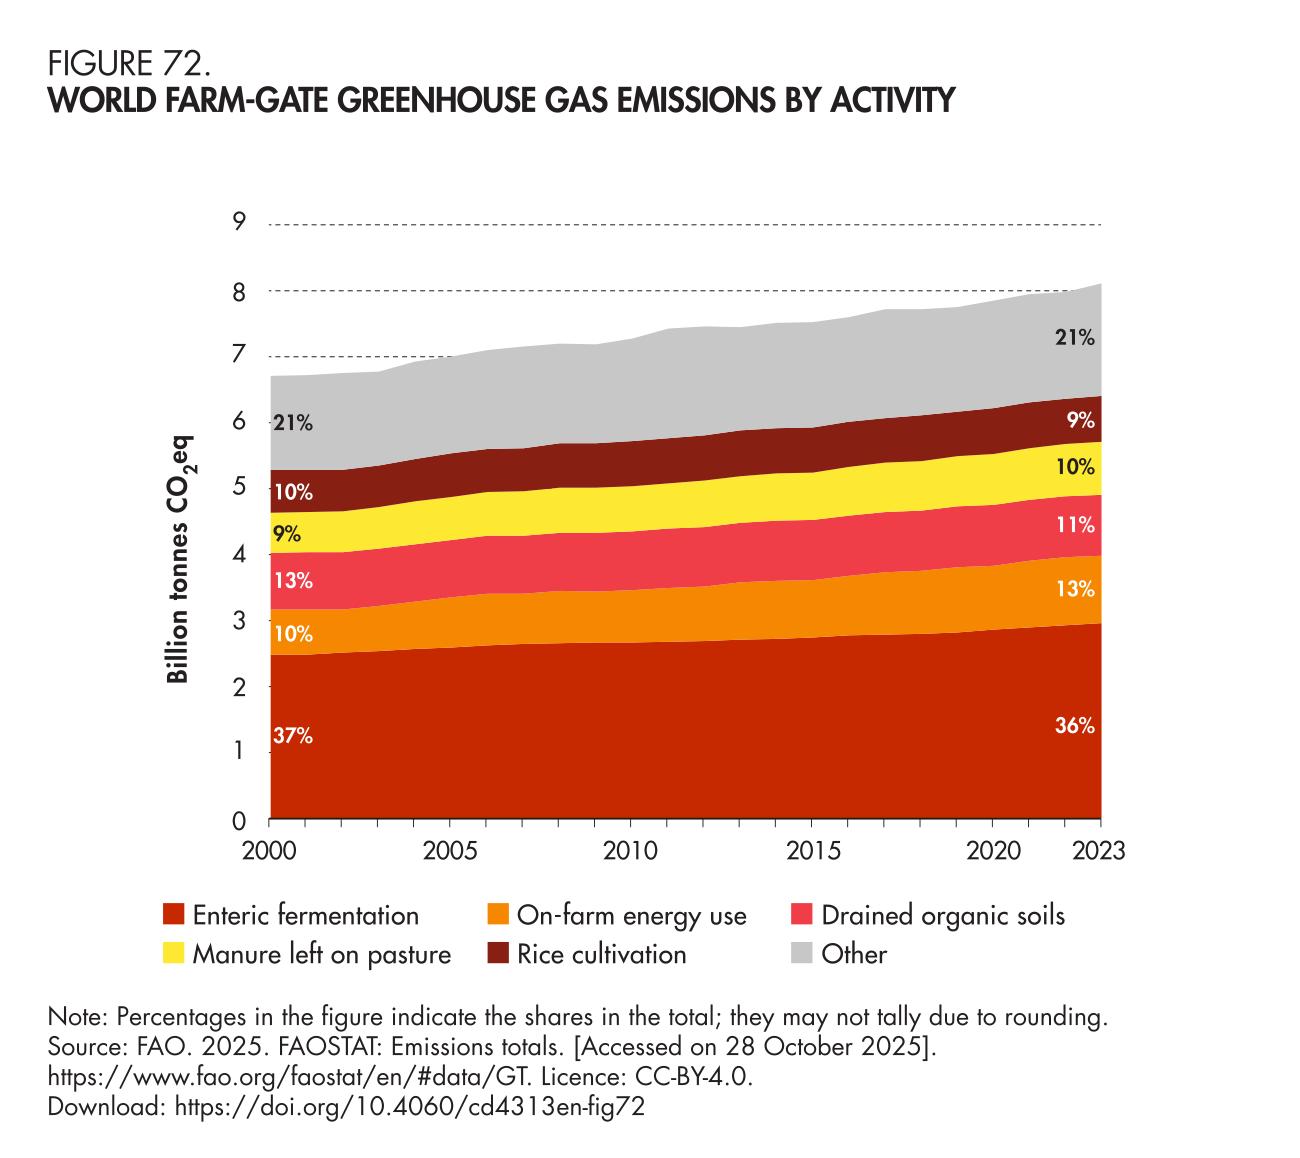
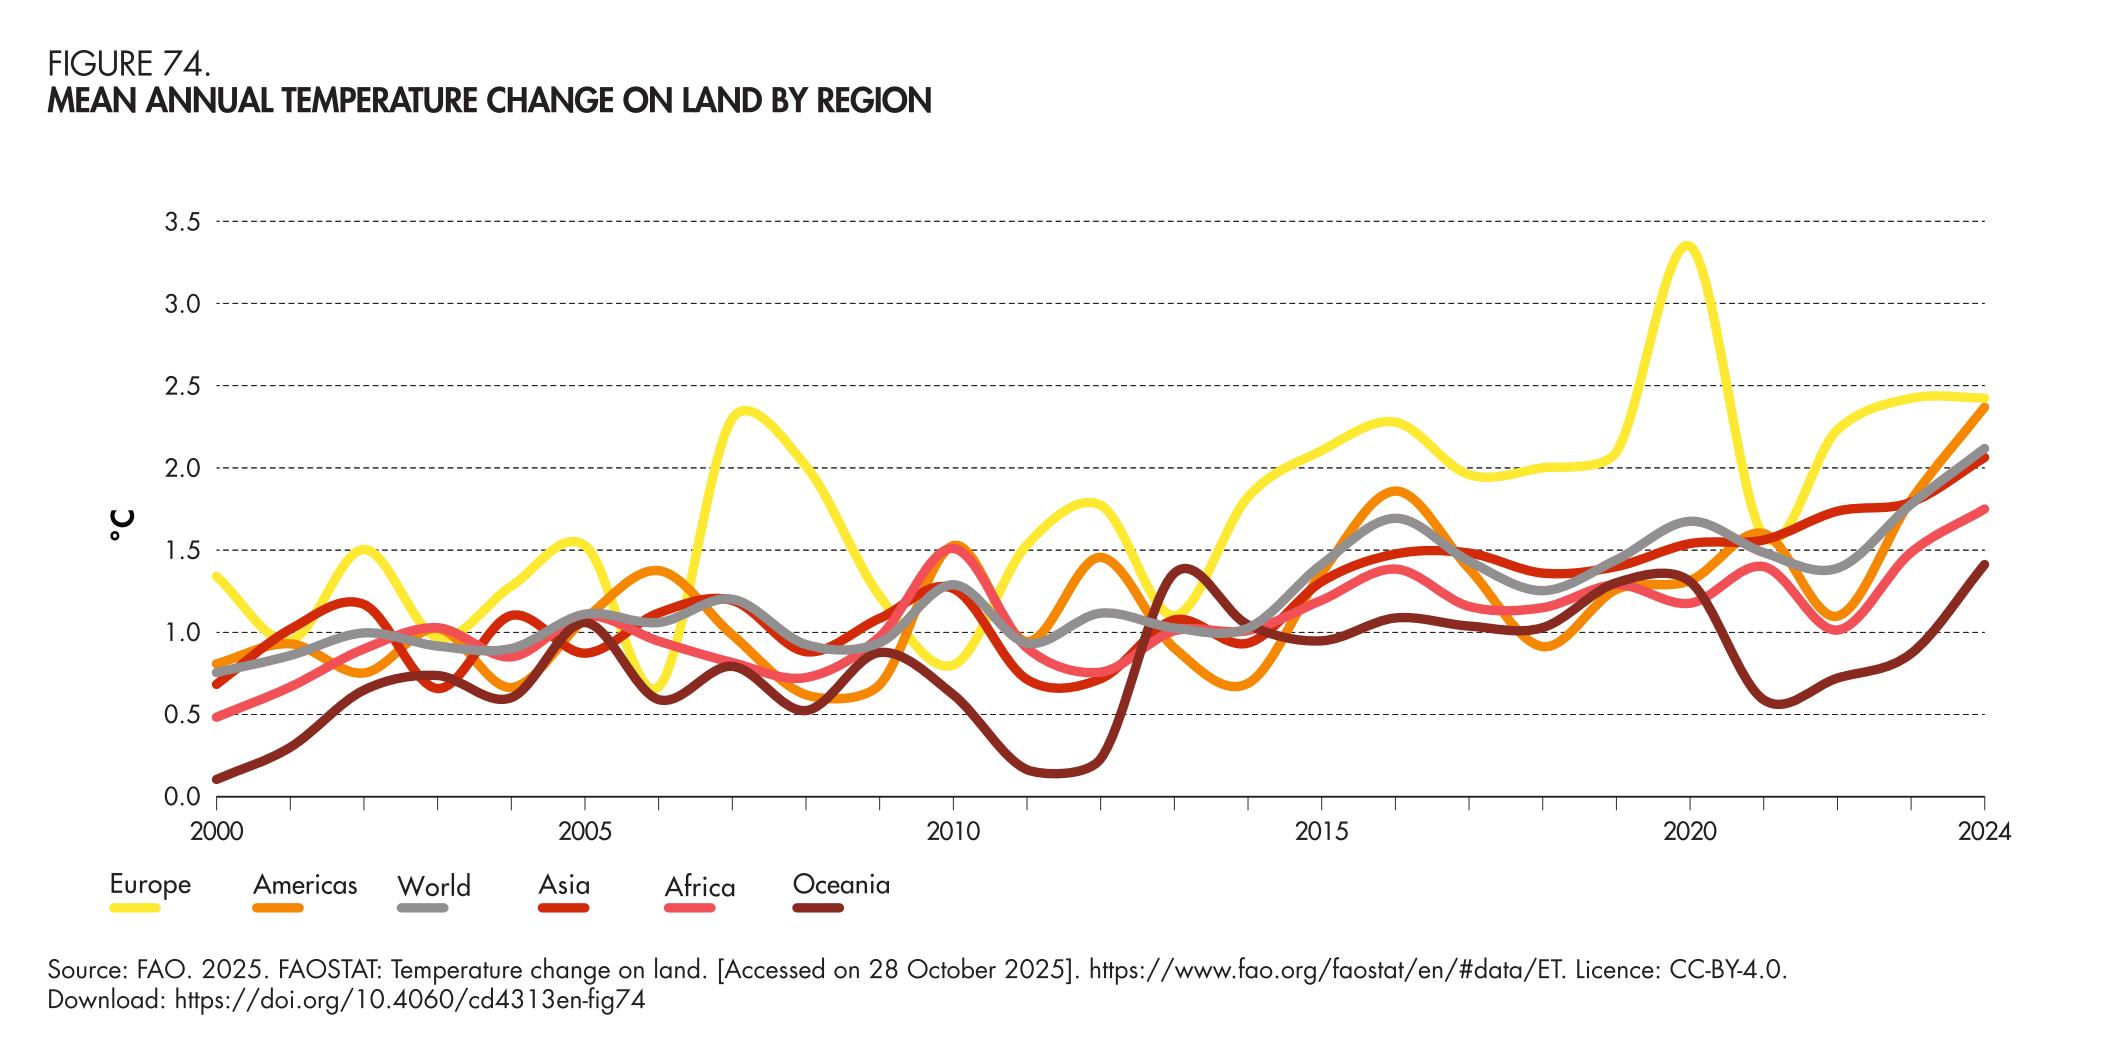