


3.4.1 Has inflation affected different foods in different ways globally?
In 2020, FAO, in collaboration with the World Bank, began global monitoring of the cost of a healthy diet, and its affordability relative to income available for food.170, 171 A healthy diet includes a diverse mix of foods, including starchy staples, vegetables, fruits, animal source foods, fats and oils, legumes, nuts and seeds;ag this helps achieve adequate nutrient intake. A healthy diet is balanced in energy and its primary sources (carbohydrates, fats, protein), and moderate in the consumption of products that increase the risk of diet-related non-communicable diseases (NCDs), such as unhealthy fats and added sugars.172 Food cost can be an impediment to access to and consumption of a healthy diet. Starchy staple foods, oils and sugars are cheaper per calorie, while nutrient-rich foods like fruits, vegetables, legumes and animal source foods are, in general, more expensive.ah, 175–177
About one-third (32 percent) of the global population were unable to afford a healthy diet in 2024 (see Section 2.2), and inflation might have contributed to persistently high levels of unaffordability. Inflation reduces purchasing power for those whose incomes do not match rising prices, and its effects on welfare and health vary depending on how price increases are distributed across food groups. When inflation disproportionately affects the affordability of nutrient-dense foods or indirectly reduces household capacity to purchase such foods, it can undermine the consumption of healthy diets. This, in turn, poses serious risks to food security and nutrition outcomes, especially for vulnerable populations.
Global price data reveal a persistent disparity between the price per kilocalorie of basic starchy staples and that of more nutrient-dense food groups, with significant implications for diet quality and affordability. This subsection analyses the trends in the average prices of different food groups based on data from the International Comparison Program (ICP). In particular, the ratios of prices from different food groups relative to basic starchy staple foods are calculated. Basic starchy staples (e.g. grains, flour, rice, roots and tubers) are unprocessed or minimally processed (i.e. belonging to NOVA category 1) staple foods and tend to be the most important source of calories for low-income consumers. The ratio of the average price of a food category of interest to the price of basic starchy staples indicates to what degree purchasing different foods imposes a price penalty relative to the primary source of low-cost dietary energy. The analysis focuses on the three available rounds of ICP data from 2011, 2017 and 2021. Though the available data are sparse, they allow for the characterization of longer trends. This analysis is complemented with a more granular analysis based on case studies from three countries in Section 3.4.2. As illustrated in Figure 3.11, basic starchy staples remain the least expensive source of dietary energy across all countries and throughout the ten-year period captured by the ICP.ai In contrast, more nutrient-dense food groups – such as vegetables, animal source foods, and fruits – consistently rank as the most expensive. In 2021, the average global price of vegetables was 11.9 times higher than that of basic starchy staples, while animal source foods and fruits were 9.1 and 7.2 times more expensive, respectively. Even legumes, nuts and seeds (3.1 times) and less nutrient-rich categories such as confectioneries (3.7 times) exhibited notable price premiums relative to basic starchy staples. These enduring price differentials underscore the economic barriers many households face in accessing a healthy diet. Furthermore, more expensive nutrient-dense foods – such as animal source foods, fruits and vegetables, and legumes – are critical to meeting the nutritional needs of infants and young children.154
FIGURE 3.11 The cost of basic starchy staples is consistently lower than that of more NUTRIENT-DENSE food groups
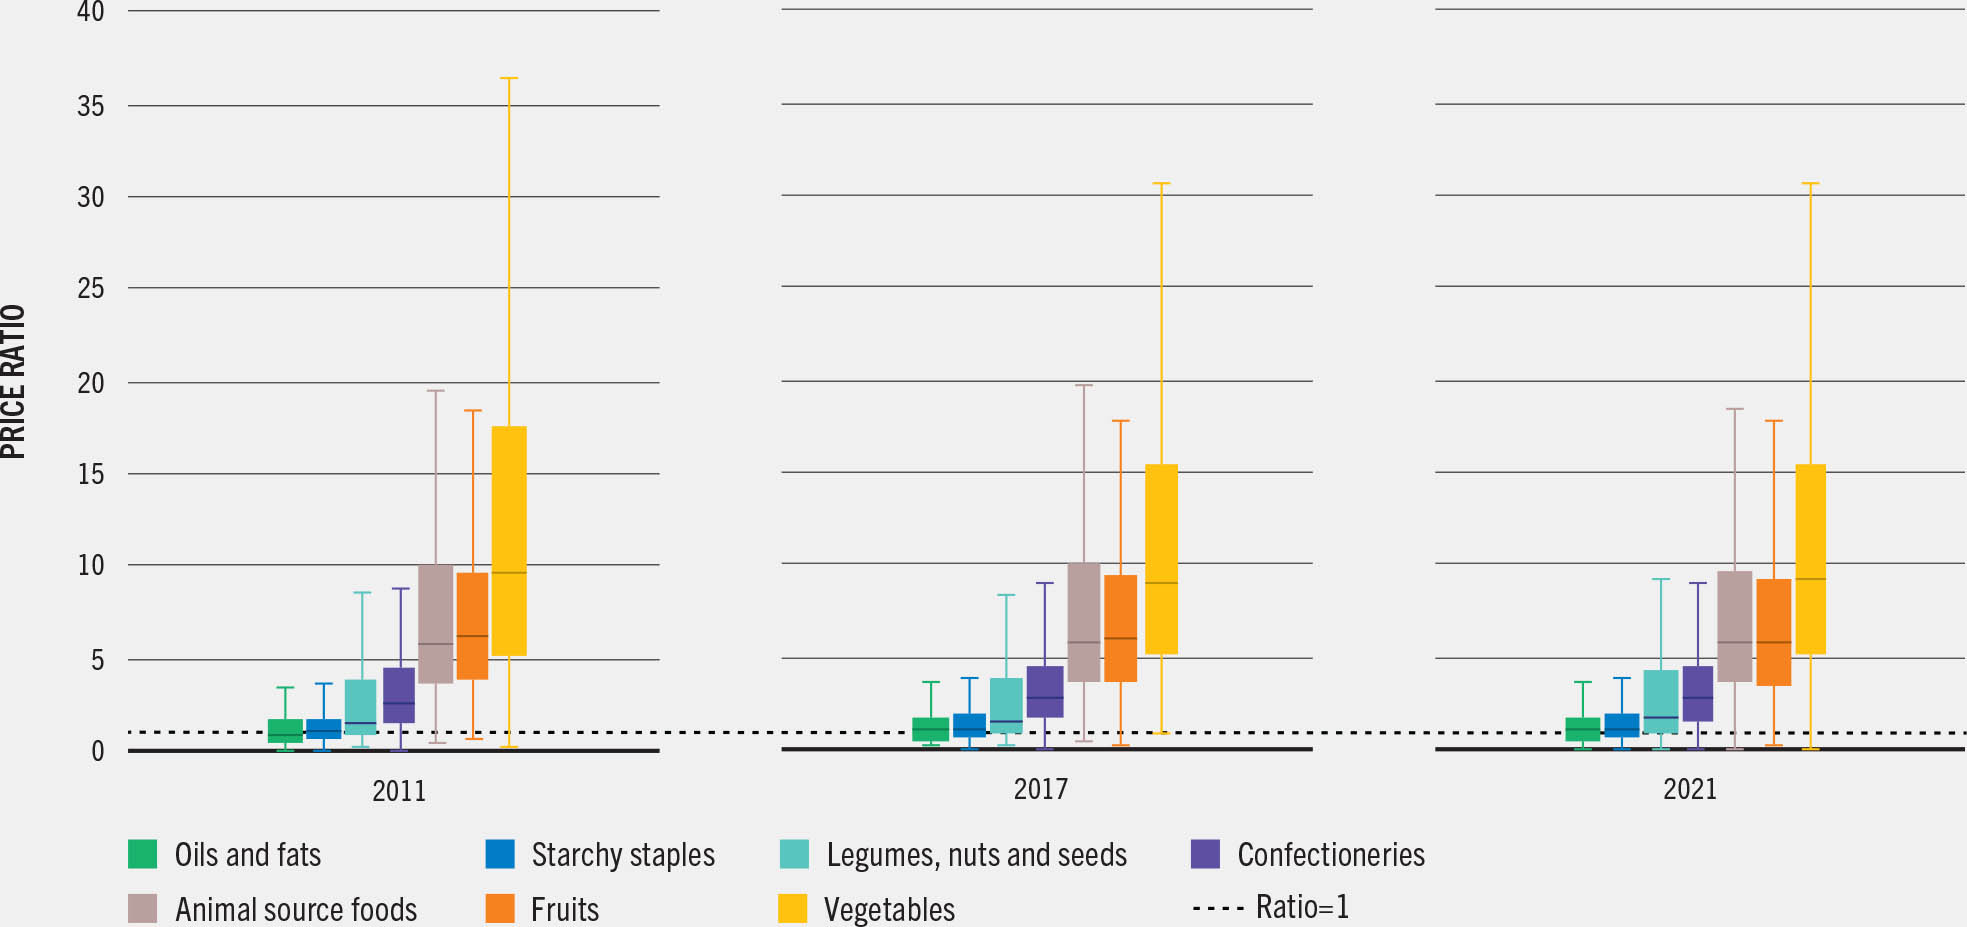
SOURCE: Costlow, L., Martínez, E., Gilbert, R., Nakasone, E. & Masters, W.A. (forthcoming). Price dynamics for foods of varied nutritional characteristics – Background paper for The State of Food Security and Nutrition in the World 2025. FAO Agricultural Development Economics Working Paper 25-07. Rome, FAO.
Consumption of ultra-processed foods is increasing despite growing evidence of their adverse health impacts. These products – characterized by ingredients rarely used in culinary preparation and additives with cosmetic functions (e.g. flavourings, colourings, sweeteners) – are produced using mechanical and other industrial processes such as extrusion, moulding and pre-frying; frequently contain significant amounts of sugars, fats and salt; and are generally devoid of many beneficial nutrients such as naturally occurring dietary fibre, phytochemicals and other bioactive compounds.176 Frequent consumption of ultra-processed foods has been linked to a wide range of NCDs and health risks, including obesity, diabetes, metabolic syndrome, cardiovascular diseases, certain cancers, and mental health disorders,178–187 posing a significant challenge for public health and food policy. Despite the negative health consequences, consumption of ultra-processed foods has expanded globally.188–190 Different factors, such as their palatability, convenience, widespread availability, extended shelf-life, and appeal (the result of extensive marketing campaigns), have contributed to this expansion.191–194 Lower prices of ultra-processed foods might also have contributed to this trend. Though there is variation within food groups,aj ultra-processed foods were, on average, 47 percent less expensive than unprocessed or minimally processed foods and 50 percent less expensive than processed foods in 2021ak (Figure 3.12).
FIGURE 3.12 Ultra-processed foods are more affordable than less processed alternatives
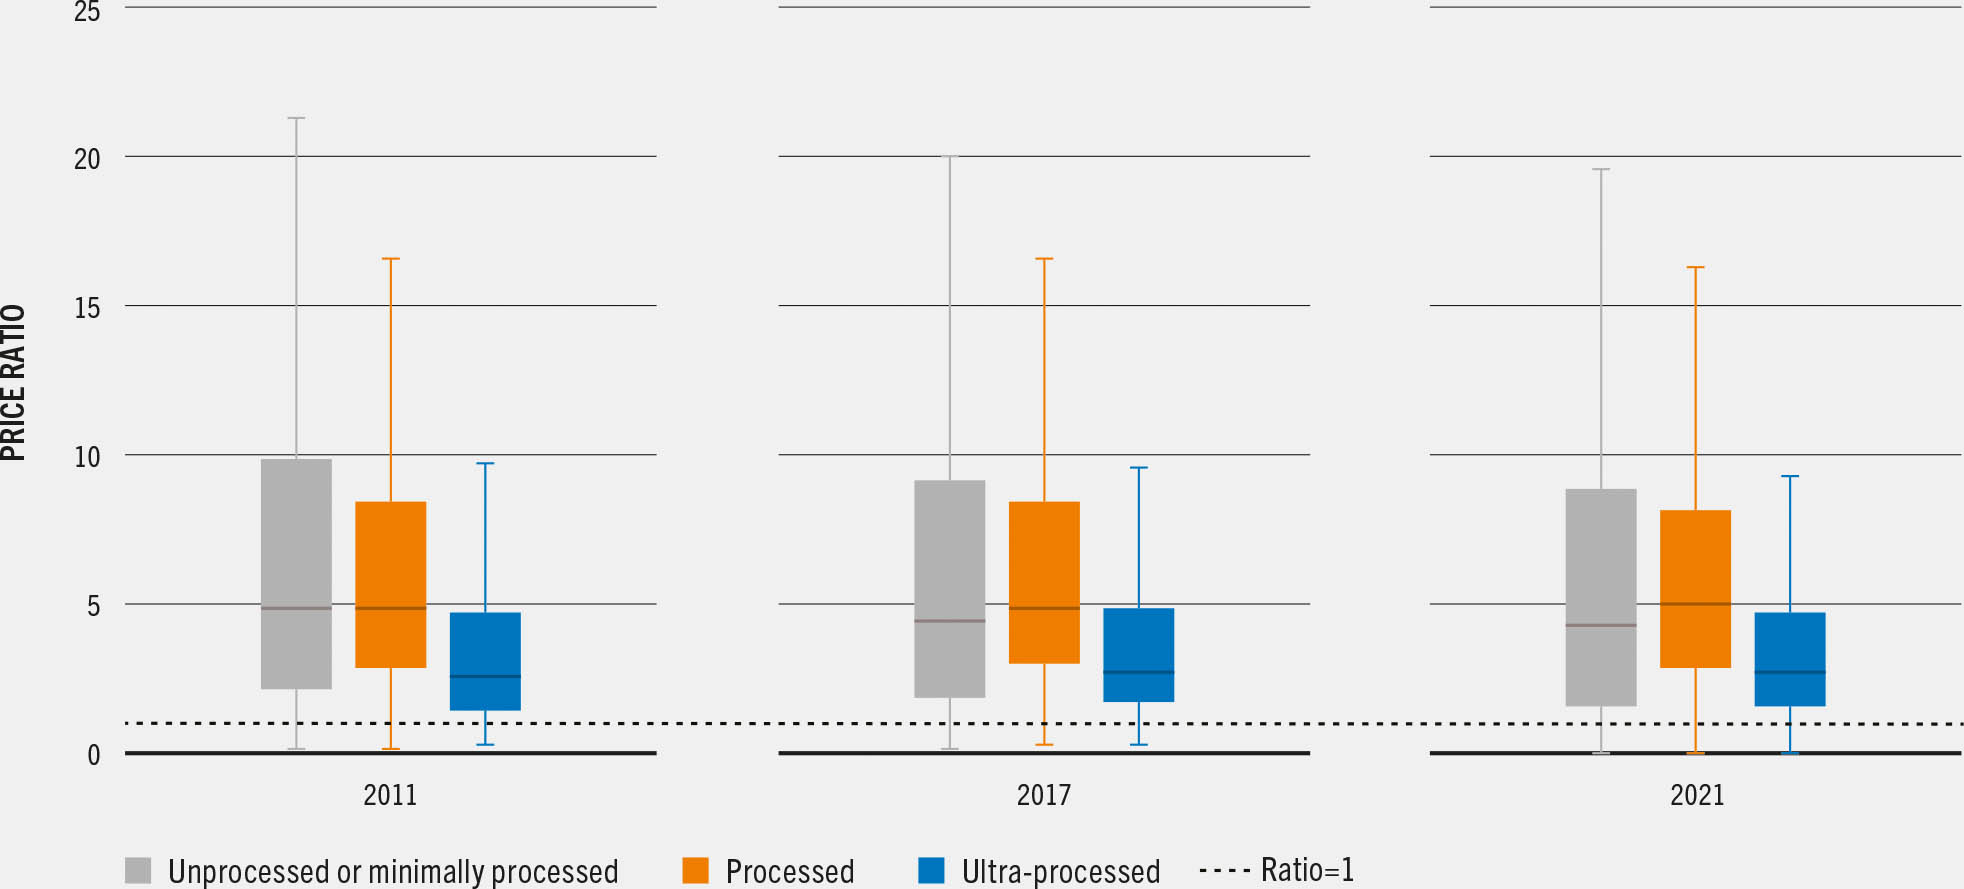
SOURCE: Costlow, L., Martínez, E., Gilbert, R., Nakasone, E. & Masters, W.A. (forthcoming). Price dynamics for foods of varied nutritional characteristics – Background paper for The State of Food Security and Nutrition in the World 2025. FAO Agricultural Development Economics Working Paper 25-07. Rome, FAO.
The affordability and widespread availability of ultra-processed foods are rooted in broader transformations in global agrifood systems and consumption patterns. Their lower production costs are enabled by the use of inexpensive industrial ingredients (e.g. hydrogenated oils, protein isolates, and added sugars and salt), as well as preservatives and stabilizers that reduce spoilage and storage costs, making these products more accessible than perishable, nutrient-dense foods. These supply-side dynamicsal have coincided with rapid urbanization, rising incomes, and shifts in labour force participation – particularly among women – which have increased demand for convenient, shelf-stable and appealing food options in both urban and rural areas around the world.197–201 However, while ultra-processed foods offer affordability and convenience, their proliferation has come at a cost to population health. The global surge in their consumption is closely linked to the escalating prevalence of diet-related NCDs187 and environmental health,202 placing a growing strain on health systems and exacerbating inequalities in nutrition and well-being.
Despite broad global stability in relative food prices over the past decade, important nuances may be hidden beneath aggregate trends. The global relative food prices – whether assessed by food group or level of processing – remained broadly stable between 2011 and 2021. This points to a lack of structural shifts in the medium-term price relationships among different types of foods. However, it is important to note that this global perspective, which relies on aggregated data across a decade, may obscure important short-term or country-specific dynamics – particularly those emerging during recent inflationary periods. To better understand these variations, the following section examines price and nutritional trends in greater detail across three country case studies.
3.4.2 Inflation and food prices: variations across food groups and processing levels – three country case studies
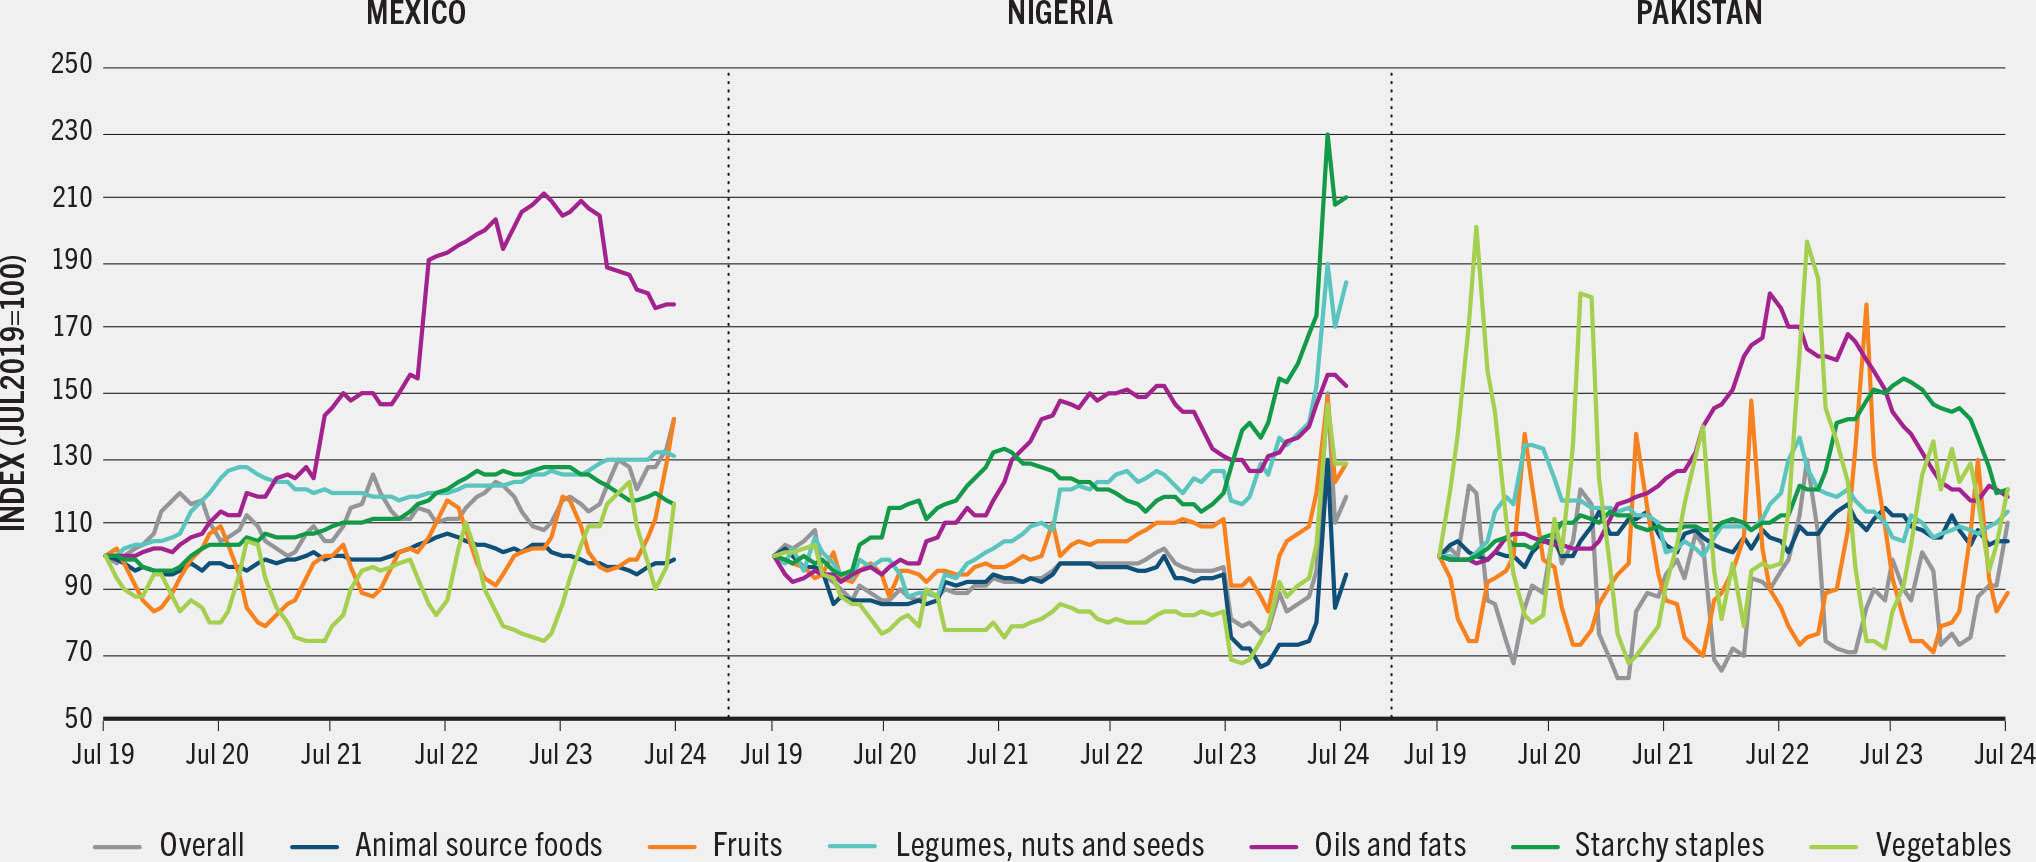
Food price inflation between 2021 and 2023 (and in some countries up to 2024) varied markedly across food groups, with starchy staples and oils experiencing disproportionate price increasesam that posed risks to food security and nutrition outcomes. Prices for basic starchy staple foods such as wheat and starchy tubers rose faster than overall food price inflation, while oils and fats also saw steep increases. This section examines recent food price inflation trends by food group, drawing on disaggregated consumer price data from Mexico (population 130 million), Nigeria (227 million) and Pakistan (240 million) – three large countries representing Latin America, Africa and Asia, respectively. While not exhaustive, the analysis provides insight into emerging regional patterns. As shown in Figure 3.13A, food price inflation in all three countries substantially outpaced general inflation, with notable spikes in prices for starchy staples (both basic starchy staples and overall starchy staplesan) and edible oils. These price surges became especially pronounced in early to mid-2022, aligning with the global cereal market disruptions driven by the war in Ukraine – a major exporter of wheat and oilseeds. The findings underscore the vulnerability of staple-dependent diets in some countries to international commodity shocks and the need for strengthened food price monitoring systems.
FIGURE 3.13 The price of starchy staples and oils faced the highest increase in Mexico, Nigeria and Pakistan

SOURCE: Costlow, L., Martínez, E., Gilbert, R., Nakasone, E. & Masters, W.A. (forthcoming). Price dynamics for foods of varied nutritional characteristics – Background paper for The State of Food Security and Nutrition in the World 2025. FAO Agricultural Development Economics Working Paper 25-07. Rome, FAO.
Price premiums for nutrient-dense foods, particularly vegetables, fruits and animal source foods, remain substantial and volatile, reinforcing economic barriers to the consumption of healthy diets. As illustrated in Figure 3.13B, these food groups consistently command higher prices relative to basic starchy staples, which continue to account for the largest share of food expenditures in many developing countries. Vegetables exhibit the highest premiums, followed by fruits and animal source foods. The volatility of these prices is amplified by factors such as perishability, seasonal supply fluctuations, and frequent disruptions along supply chains.203, 204 While the recent inflationary spike in basic starchy staples (Figure 3.13A) has somewhat narrowed these relative differences, the absolute premiums remain stark. On a per-calorie basis, vegetables are still 7 to 24 times more expensive than basic starchy staples, while animal source foods and fruits are 5 to 10 and 4 to 15 times more costly, respectively. These persistent price gaps highlight structural challenges to improving dietary quality in low-income settings and the importance of policy interventions to support access to diverse, nutrient-dense foods.
While basic starchy staples such as rice, wheat and tubers continue to represent the most affordable food sources, shifts in relative food prices have significant implications for the affordability of healthy diets, particularly among low-income households.ao Sharp price increases for basic starchy staples can have serious implications for low-income consumers, many of whom rely on these products to meet daily energy needs. The 2023 edition of this report showed that, in a sample of 11 African countries, households allocated 38 percent of their food expenditures to starchy staple foods, highlighting the importance of this food group. Due to the significant inflation in starchy staples, the relative cost of nutrient-rich foods, including fruits, vegetables and animal source products, declined in the countries in this analysis. However, this does not necessarily translate into improved diet quality. When the prices of basic staples rise, already constrained household budgets are further compressed and might reduce the capacity of families to allocate spending towards more diverse and nutrient-dense food groups.21, 175
Understanding the impact of relative food price changes on household dietary adequacy requires careful examination beyond average price trends. While evidence shows shifts in relative average prices across food groups, this alone does not confirm that households have been priced out of maintaining a healthy diet. Households may still access relatively low-cost items within more expensive food groups, increasing their chances of meeting a healthy diet despite overall inflation. However, if inflation disproportionately affected these lowest-cost items, households’ ability to meet a healthy diet could be compromised. Therefore, a more targeted analysis is required to assess whether rising food prices between 2019 and 2024 constrained access to healthy diets.
To assess this, the analysis adopts a modified cost-of-a-healthy-diet framework tailored to monthly price data from Mexico, Nigeria and Pakistan. In line with established methodology (Section 2.2), the approach identifies between one and three of the least-cost items per food group, including starchy staples, vegetables, fruits, animal source foods, legumes, nuts and seeds, and oils and fats, in each country and year. Given the seasonality inherent in monthly price data, particularly for perishable goods like vegetables, the analysis tracks the frequency with which each item appears as the lowest-cost option throughout the study period. These frequencies serve as weights to construct a representative “overall” healthy basket. The resulting monetary value of this basket serves as a proxy for the least-cost healthy diet, providing a more direct measure of household access to nutritious food under changing price conditions (Figure 3.14).
FIGURE 3.14 Price INDICES of items selected for least-cost healthy diets
SOURCE: Costlow, L., Martínez, E., Gilbert, R., Nakasone, E. & Masters, W.A. (forthcoming). Price dynamics for foods of varied nutritional characteristics – Background paper for The State of Food Security and Nutrition in the World 2025. FAO Agricultural Development Economics Working Paper 25-07. Rome, FAO.
Focusing on the least expensive options in each food group needed for a healthy diet, there are heterogeneous effects of inflation on the cost of these options. The least-cost healthy diet decreased in Nigeria through mid-2023, though it had increased by the end of the analysis period. In Pakistan, it exhibited an oscillating trend, likely reflecting seasonal fluctuations. In contrast, in Mexico, the least-cost healthy diet became more expensive. This reveals how the real cost of food and a least-cost healthy diet can vary widely across countries even during periods of high inflation.
Food price inflation may have affected processed and unprocessed foods differently in different countries between 2019 and 2024. Urbanization, extensive marketing campaigns by food manufacturers, rising incomes and increased workforce participation drive demand for convenient, appealing and ultra-processed foods, often high in unhealthy fats, sugars and/or salt.21 Food processing enhances appeal by improving taste, extending shelf-life and reducing preparation time.206 Food manufacturing involves additional labour and inputs in the production process, which can drive up costs. For instance, recent food price inflation in the United States of America has been largely influenced by price hikes in processed foods. In a tight labour market and high-inflation environment, rising wages have increased labour, production and distribution costs.207 These added costs have been passed on to consumers, resulting in higher prices for processed than for unprocessed foods. However, there are limited data to determine if this pattern holds true in other regions, particularly in low- and middle-income countries.
In Nigeria, recent inflation has similarly affected the prices of processed and unprocessedap foods, while in Pakistan and Mexico unprocessed or minimally processed foods were consistently more expensive. In Nigeria, inflation appears to have similarly affected ultra-processed, processed and unprocessed foods, suggesting that the inflationary crisis has not made ultra-processed foods more affordable than unprocessed options. Price premiums for ultra-processed foods are generally lower than for unprocessed foods when comparing items across all food groups, but unprocessed or minimally processed foods are not necessarily the most expensive (Figure 3.15). Meanwhile, in countries such as Mexico and Pakistan, unprocessed or minimally processed foods were consistently the most expensive options between 2019 and 2024.
FIGURE 3.15 Price trends by NOVA processing category relative to basic starchy staples in Mexico, Nigeria and Pakistan
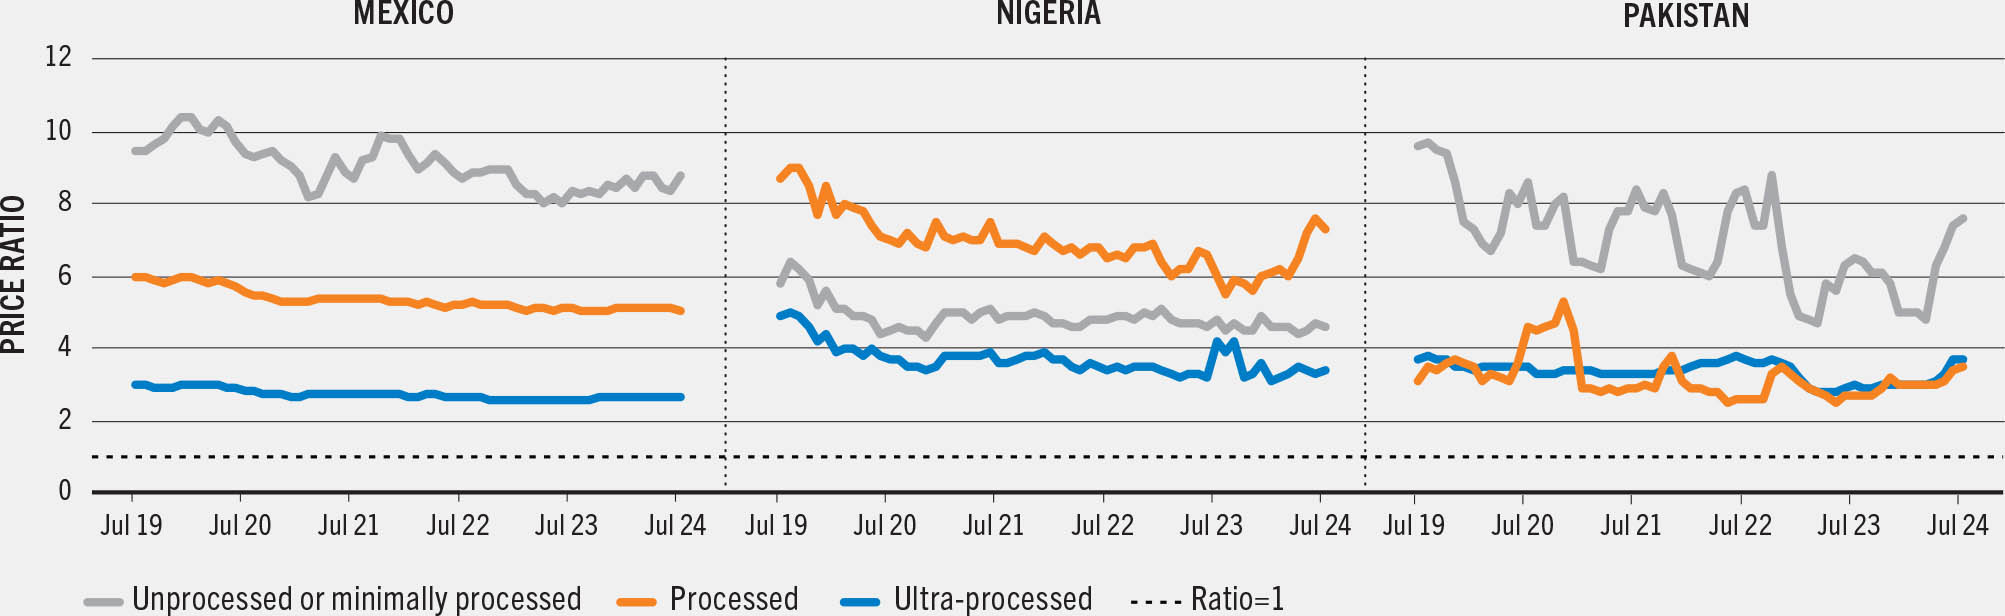
SOURCE: Costlow, L., Martínez, E., Gilbert, R. (forthcoming). Price dynamics for foods of varied nutritional characteristics – Background paper for The State of Food Security and Nutrition in the World 2025. FAO Agricultural Development Economics Working Paper 25-07. Rome, FAO.


