


- ➔ The world made progress to reduce child stunting since the baseline year of 2012. The prevalence fell from 26.4 percent in 2012 to 23.2 percent in 2024, with Asia contributing the most to the improvement. However, the world is still not on track to achieve the 2030 target of 14 percent, and faster progress is needed.
- ➔ More than half of countries with progress data were on track to achieve the 2030 target for child wasting, but at the global level there was no meaningful change in prevalence, and accelerated progress is needed to achieve the 2030 global target of 3 percent.
- ➔ Child overweight remained largely unchanged, with a prevalence of 5.5 percent in 2024 and 5.3 percent in 2012. Actions aimed at preventing overweight in children must be stepped up to achieve the 2030 target of 3 percent.
- ➔ The percentage of infants under six months of age receiving the important benefits of exclusive breastfeeding increased significantly from 37.0 percent in 2012 to 47.8 percent in 2023. Continued and faster progress will help to achieve the 2030 target. Actions to promote exclusive breastfeeding can contribute to improving nutritional status throughout life.
- ➔ The latest available global estimates for low birthweight point to a prevalence of 14.7 percent in 2020, revealing little change since 2012 and confirming the need to reinforce efforts to achieve the 2030 global target of 10.5 percent.
- ➔ The prevalence of adult obesity increased from 12.1 percent in 2012 to 15.8 percent in 2022. Nearly all countries are off track to achieve the 2030 target, and urgent efforts are needed to turn this trend around.
- ➔ New updates of the prevalence of anaemia in women aged 15 to 49 years reveal either no improvement or an increase in prevalence in nearly all regions between 2012 and 2023, and an increase in the global prevalence from 27.6 to 30.7 percent. Concerted actions on various fronts are needed to address this critical health issue affecting women as well as their newborn children.
- ➔ In 2025, a new global nutrition indicator was endorsed to monitor SDG Target 2.2: minimum dietary diversity. Globally, about one-third of children aged 6 to 23 months and two-thirds of women aged 15 to 49 years achieved minimum dietary diversity, according to the latest estimates. Actions are needed to enable consumption of diverse diets for women and children.
There is expert consensus that reducing child malnutrition is one of the smartest development targets a country can focus on, because the investment is highly cost effective, returning on average USD 23 for every USD 1 spent.12 In some countries, the return on investment could be as high as 160-fold.13 Child malnutrition has long-lasting impacts on an individual, including reduced earnings and increased risk of chronic disease as an adult. Height at two years of age has been described as one of the best predictors of human capital,14 and ending malnutrition is foundational to the achievement of nearly all the Sustainable Development Goals. The negative impact of malnutrition means that nutrition must be a cornerstone of national progress and an investment priority for the global health and development agenda.
In 2008 and 2013, the global research community documented the interventions that work for nutrition, and highlighted the importance of intervening on nutrition early (during pregnancy and the first two years of a child’s life) in The Lancet series on maternal and child undernutrition.15, 16 In 2022, in a special issue of the American Journal of Public Health, researchers reiterated the importance of early nutrition interventions to achieve optimal individual and national development.17 The United Nations demonstrated its commitment to prioritizing nutrition with the proclamation of the United Nations Decade of Action on Nutrition 2016–2025. This year, in order to sustain momentum and align with the 2030 Agenda for Sustainable Development, the United Nations extended the period for prioritized action for nutrition to 2030.18
This section presents prevalence estimates and trends at global and regional levels for seven nutrition indicators with 2030 global targets: low birthweight, exclusive breastfeeding, child stunting, child wasting, child overweight, anaemia in women aged 15 to 49 years, and adult obesity. The World Health Assembly (WHA) endorsed six nutrition targets in 2012; these were initially 2025 targets but were subsequently proposed to be extended to 2030.19 Very recently, revised targets were endorsed by the WHA (Box 2.3). The WHA adopted adult (18+ years) obesity as part of the Global Action Plan for the Prevention and Control of Non-Communicable Diseases in 2013.20 All the targets are for indicators of nutritional status, with the exception of one – exclusive breastfeeding of infants under six months of age – which is a behavioural outcome. Four out of the seven indicators were also selected to monitor progress towards SDG Target 2.2, namely stunting, wasting and overweight in children under five years of age, and anaemia in women aged 15 to 49 years.
BOX 2.3New targets for global nutrition indicators
The 2030 targets used in this edition of the report as well as previous editions since 2018 were originally proposed in a 2018 WHO–UNICEF discussion paper.19 New official 2030 targets were recently endorsed at the Seventy-eighth World Health Assembly (WHA)21 (Table A). Progress tracking based on the new targets will be reflected in the 2026 edition of this report.
TABLE A NEW GLOBAL NUTRITION TARGETS (FROM A 2012 BASELINE)
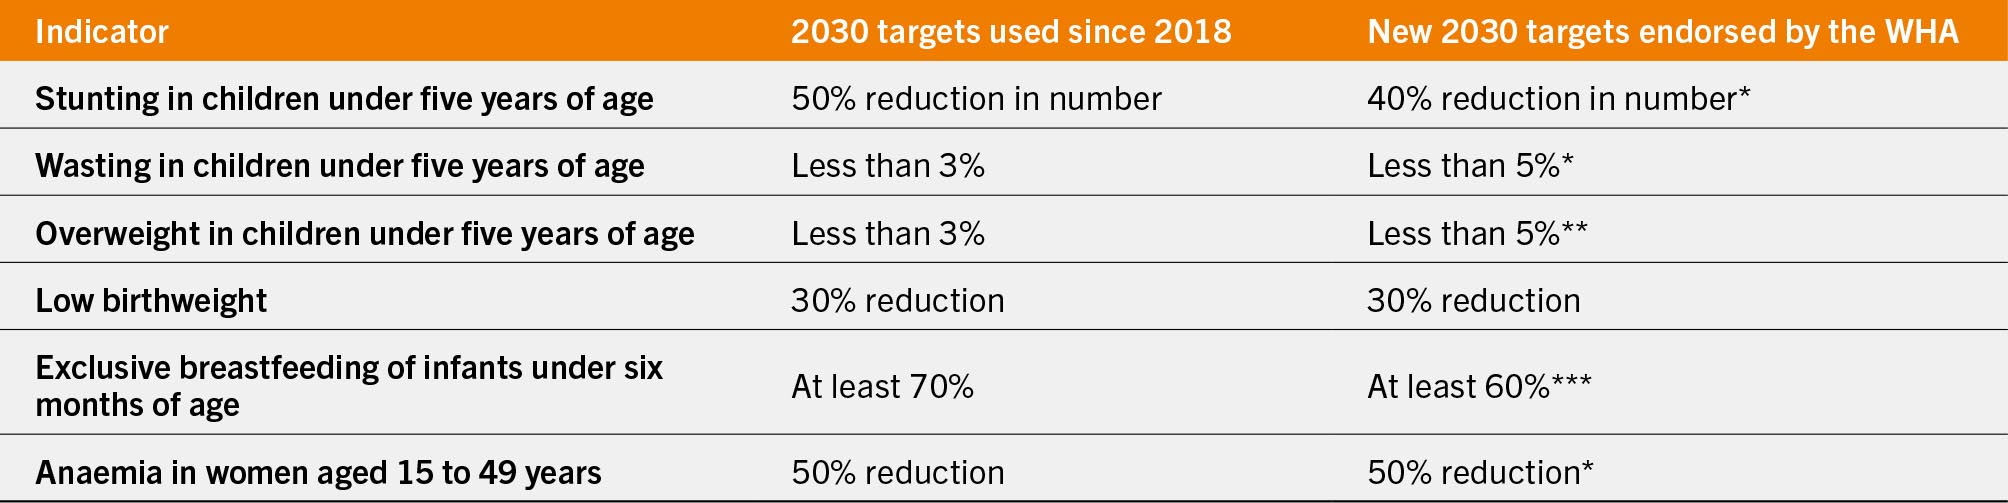
SOURCE: WHO. 2024. 2025-2030 World Health Assembly global maternal, infant and young child nutrition targets and proposal for process indicators – Results of the online consultation and way forward. Geneva, Switzerland. https://cdn.who.int/media/docs/default-source/breastfeeding/online-consultation-cip-discussion-paper-responses-2024.pdf?sfvrsn=f0fa14e7_3
The section also provides a summary of country progress for the global nutrition targets and includes a spotlight on minimum dietary diversity (MDD), recently endorsed as a new addition to the indicators for global monitoring of SDG Target 2.2. The spotlight provides an overview of the MDD indicator and the most recent global and regional estimates.
2.3.1 Global and regional trends
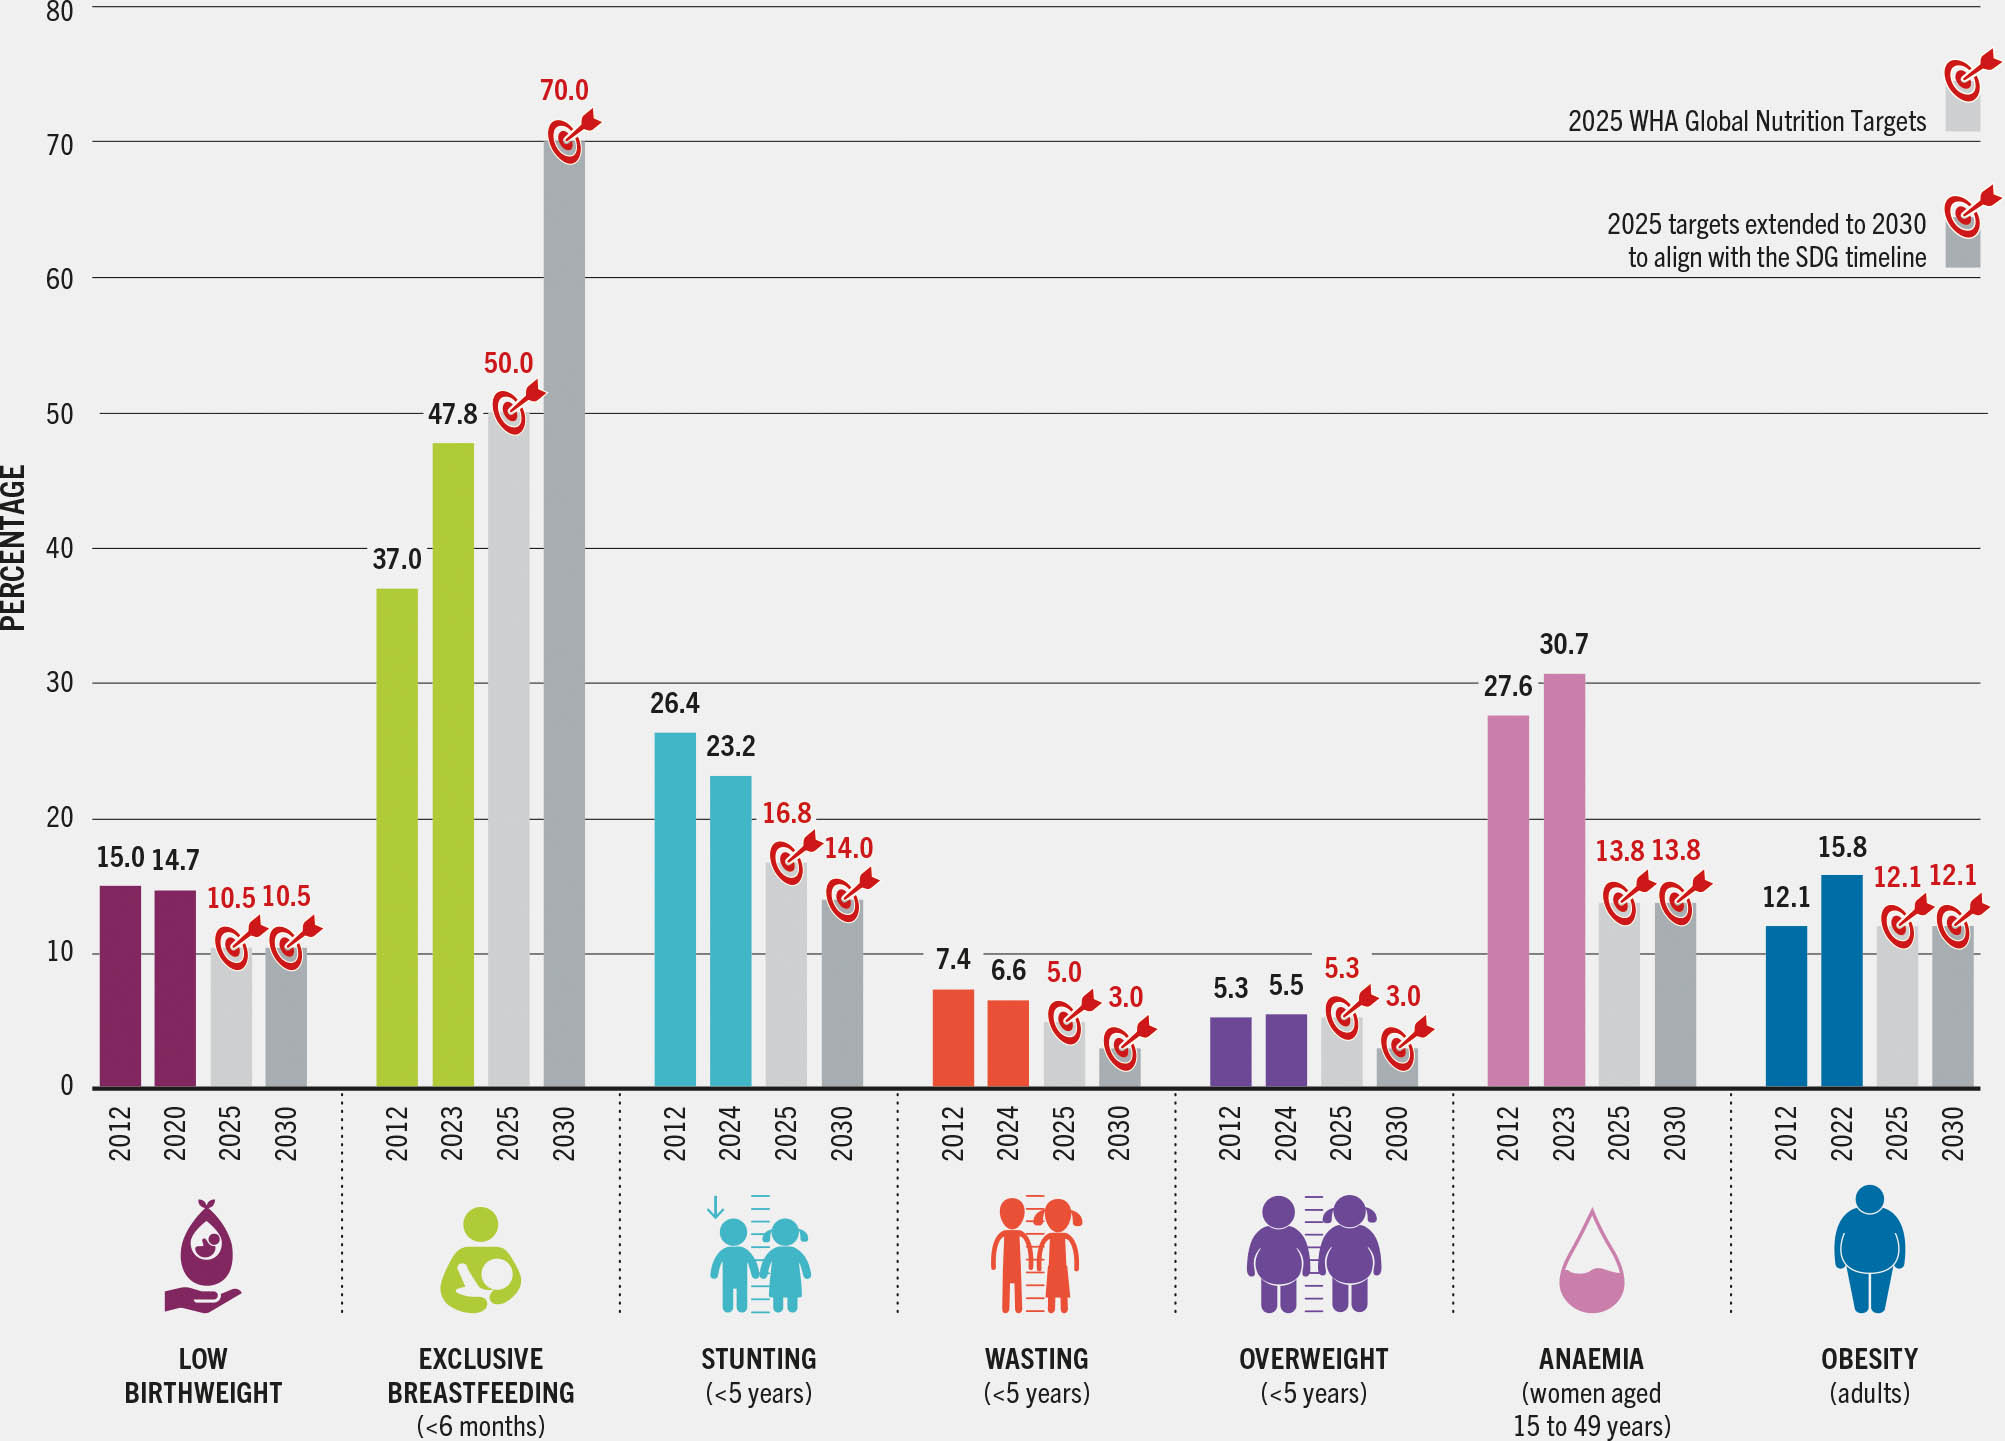
Global trends from the baseline to the most recent estimate for seven nutrition indicators with global targets are shown in Figure 2.9. Among the indicators of child nutritional status, only stunting has undergone a significant change from the baseline year, improving from 26.4 percent in 2012 to 23.2 percent in 2024. The other indicators of child nutritional status – low birthweight, wasting and overweight – showed no meaningful changes from the baseline at the global level. All indicators of child nutritional status, including stunting, need accelerated progress to achieve the 2030 targets.
FIGURE 2.9 Accelerated progress is needed to achieve the 2030 global nutrition targets
SOURCES: Data for stunting, wasting and overweight are based on UNICEF, WHO & World Bank. 2025. Levels and trends in child malnutrition: UNICEF/WHO/World Bank Group Joint Child Malnutrition Estimates. Key findings of the 2025 edition. New York, USA, Geneva, Switzerland and Washington, DC. [Cited 4 April 2025]. https://data.unicef.org/resources/JME, https://www.who.int/teams/nutrition-and-food-safety/monitoring-nutritional-status-and-food-safety-and-events/joint-child-malnutrition-estimates/latest-estimates, https://datatopics.worldbank.org/child-malnutrition; data for exclusive breastfeeding are based on UNICEF. 2024. Infant and young child feeding. In: UNICEF. [Cited 30 April 2025]. https://data.unicef.org/topic/nutrition/infant-and-young-child-feeding; data for low birthweight are from UNICEF & WHO. 2023. Low birthweight joint estimates 2023 edition. [Cited 28 April 2025]. https://data.unicef.org/topic/nutrition/low-birthweight; www.who.int/teams/nutrition-and-food-safety/monitoring-nutritional-status-and-food-safety-and-events/joint-low-birthweight-estimates; data for anaemia are based on WHO. 2025. WHO Global Anaemia estimates, 2025 edition. [Cited 8 May 2025]. https://www.who.int/data/gho/data/themes/topics/anaemia_in_women_and_children; data for adult obesity are based on WHO. 2024. Global Health Observatory: Prevalence of obesity among adults, BMI >= 30 (age-standardized estimate) (%). Estimates by country. [Accessed on 24 July 2024]. https://www.who.int/data/gho/data/indicators/indicator-details/GHO/prevalence-of-obesity-among-adults-bmi-=-30-(age-standardized-estimate)-(-). Licence: CC-BY-4.0. The targets are drawn from: UNICEF & WHO. 2017. Methodology for monitoring progress towards the global nutrition targets for 2025 – technical report. New York, USA and Geneva, Switzerland. https://data.unicef.org/resources/methodology-for-monitoring-progress-towards-the-global-nutrition-targets-for-2025; and UNICEF & WHO. 2018. The Extension of the 2025 Maternal, Infant and Young Child Nutrition Targets to 2030 – WHO/UNICEF discussion paper. New York, USA and Geneva, Switzerland. https://data.unicef.org/resources/extension-of-2025-maternal-infant-young-child-nutrition-targets-2030
For child overweight, the latest estimate shows no significant change compared to the baseline (5.3 percent in 2012 to 5.5 percent in 2024). While this is sufficient to achieve the 2025 target of no increase, the 2030 target for child overweight calls for a reduction to below 3 percent; thus, improvement is needed over the next five years to achieve the 2030 target.
The percentage of children benefiting from exclusive breastfeeding increased substantially: from 37.0 percent in 2012 to 47.8 percent in 2023. The 2025 target is to increase the percentage of exclusively breastfed children to over 50 percent. While the 2025 target of 50 percent could be reached by the end of this year, and progress should be celebrated, it is also important to note that the 2030 target of 70 percent calls for even more accelerated improvement.
There was deterioration in both nutrition indicators for older age groups – adult obesity and anaemia in women aged 15 to 49 years. For adult obesity, the prevalence rose from 12.1 percent in 2012 to 15.8 percent in 2022. For anaemia, new updated data reflect no improvement or an increase in prevalence in nearly all regions from 2012 to 2023, and the global prevalence increased from 27.6 to 30.7 percent. As both indicators have worsened, the global nutrition targets are unlikely to be achieved by 2030 without substantial policy and programmatic changes to kickstart progress. Some of the unique challenges to addressing anaemia in women aged 15 to 49 years are presented in Box 2.4.
BOX 2.4Progress on anaemia in women aged 15 to 49 years in context
Anaemia, or low blood haemoglobin concentration,* is a critical health issue, as it can impair physical and cognitive function. Severe anaemia puts pregnant women at increased risk of post-partum haemorrhage and can result in low birthweight. Infants born to anaemic mothers are also at a higher risk of anaemia, which can hinder their cognitive development.26, 27 Reducing anaemia in women of reproductive age is, therefore, a critical goal for their own health and for that of the next generation.
The new estimates presented in this report provide a very clear message: there has been no global progress towards reducing the prevalence of anaemia among women aged 15 to 49 years from 2012 to 2023. The data also suggests a recent rise in prevalence. This should serve as a strong call to action.
One potential explanation for the observed increase in anaemia comes from the biological point of view. Anaemia has multiple causes including inadequate nutrient intake, infection, inflammation and excessive blood loss.28 There is growing evidence that inflammation associated with obesity and related non-communicable diseases may increase the risk of iron deficiency anaemia.29–31 Therefore, given the sharp rise in obesity globally, it is essential to better understand how inflammation associated with obesity may be contributing to the observed increase in anaemia among women aged 15 to 49 years worldwide.
However, it is also important to interpret the reported increase in anaemia with caution, as there are some measurement issues to take into account. About half of surveys used for global reporting on anaemia used capillary blood samples obtained through the field-friendly method of finger punction. There is evidence that this approach may overestimate anaemia prevalence compared to estimates from venous blood – the gold standard.32, 33 Differences in the magnitude of such errors across surveys may distort actual trends in anaemia prevalence. Nonetheless, it is worth noting that mild anaemia – or haemoglobin concentrations close to the cut-off point for defining anaemia – is the most prone to such measurement error.32 A closer examination of the available data reveals that, while mild anaemia is steadily increasing, the biggest increase is observed in moderate anaemia which is less prone to this error (Figure A).
Figure A Global anaemia prevalence in women aged 15 TO 49 years by severity, 2012–2023
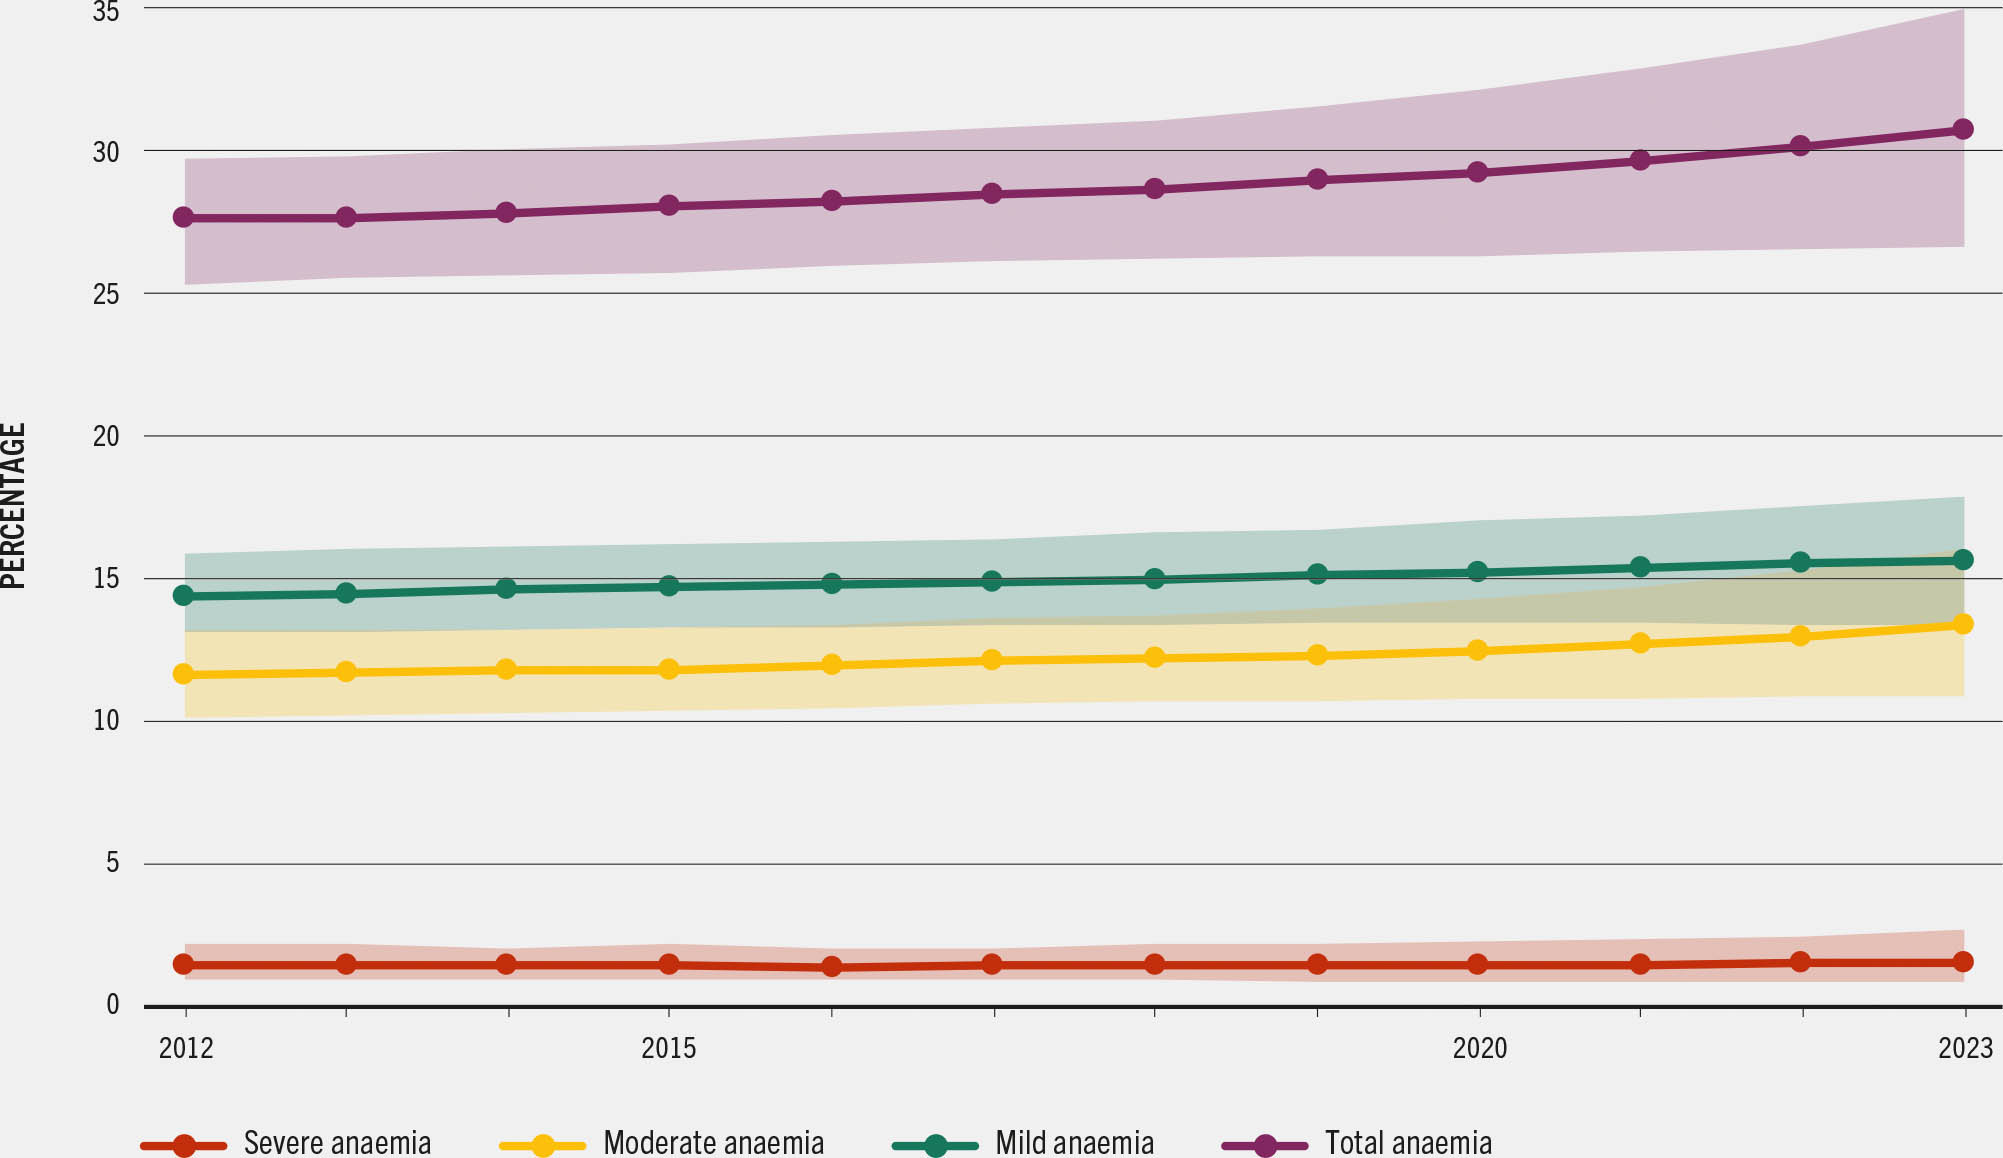
It is also important to highlight that more national surveys are needed to improve the accuracy of the global anaemia estimates and the trends among women aged 15 to 49 years. Global estimates drew on 85 surveys from 2015 to 2019 but on only 41 between 2020 to 2023, which may reduce precision and increase uncertainty around the 2023 anaemia estimates compared to the 2012 baseline estimates (Figure A).
Notwithstanding the methodological issues and the insufficient data, the lack of progress and the suggested increase in anaemia are not surprising. Few countries have successfully scaled actions known to effectively prevent nutritional anaemia (e.g. micronutrient supplementation during pregnancy and lactation, food fortification, and enhancing access and consumption of healthy diets). It is necessary to generate and use better context-specific evidence on anaemia in women aged 15 to 49 years in order to design effective programmes to address the multiple and interlinked causes of anaemia, including the anaemia of inflammation. To make progress on this important Sustainable Development Goal indicator, actions should be adequately resourced, coordinated and monitored for sustained impacts.
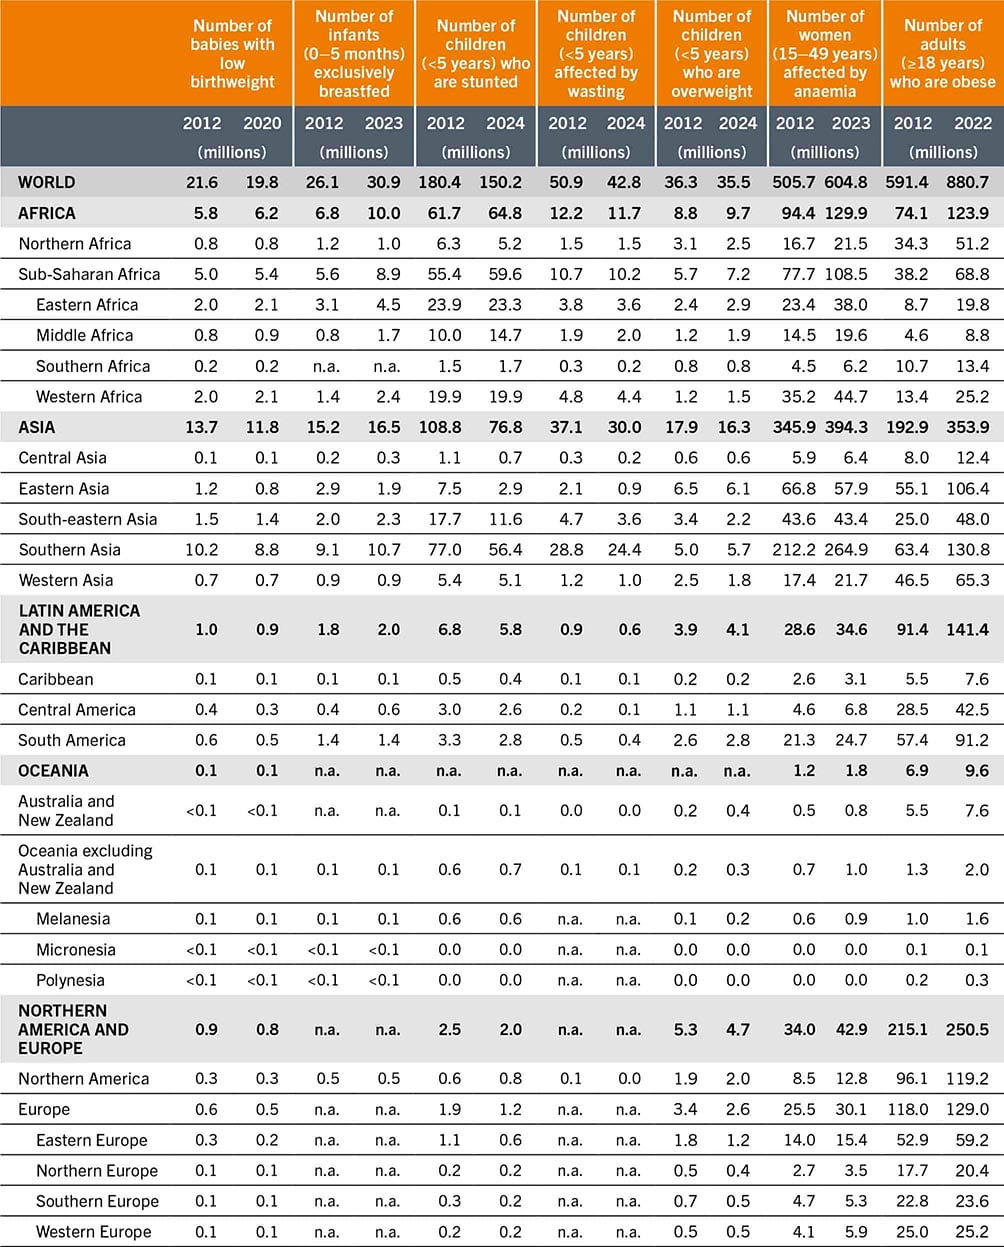
Table 2.7 shows the global and regional trends in prevalence for the selected indicators. While there was no significant change in child wasting prevalence at global level (7.4 percent in 2012 and 6.6 percent in 2024), there were improvements in some subregions. From 2012 to 2024, the largest decreases for child wasting prevalence occurred in Western Africa (from 8.2 to 6.5 percent) and Central Asia (from 3.8 to 2.1 percent). Encouragingly, no regions experienced worsening in child wasting prevalence.
TABLE 2.7Global and regional trends in prevalence for seven nutrition indicators with global targets
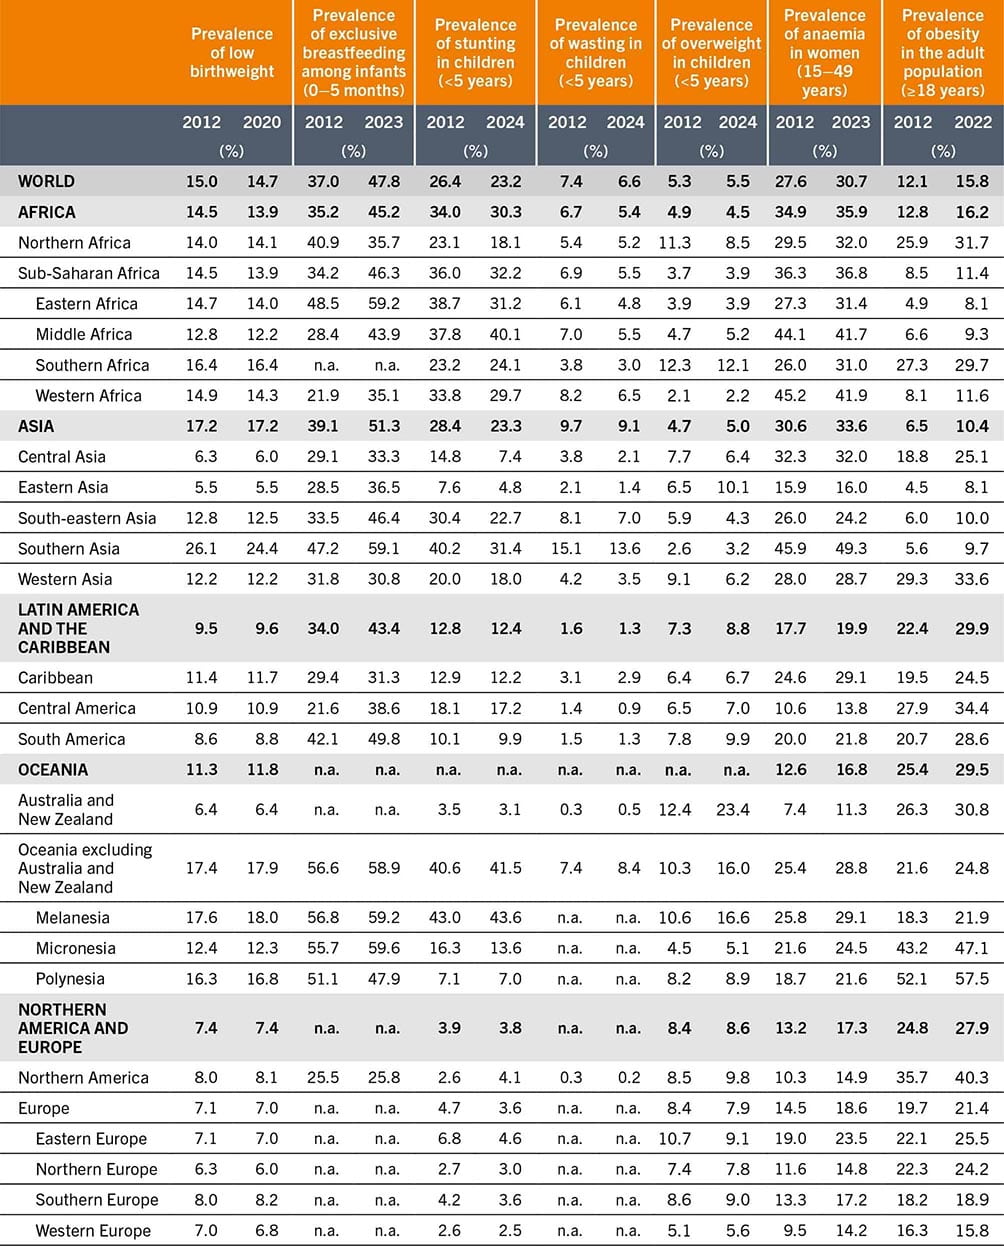
SOURCES: See sources listed under Figure 2.9.
Table 2.8 presents the global and regional trends in numbers for the seven global nutrition targets. The numbers are calculated from prevalence and should not be mistaken for annual burden, particularly for indicators that are likely to have repeated incident cases over the course of a year. For example, a child can have multiple episodes of wasting within a year, and the annual burden for this indicator should consider incidence. Another important consideration for interpretation of numbers over time is that they are affected by both prevalence and birth rate. From 2012 to 2024, the number of children under five years of age in the world decreased from 683.5 to 647.3 million, a 5.3 percent drop. While there was a global reduction in the number of children, the birth rate varied by region, and there was a notable increase in the under-five child population in Africa over the same period (from 181.4 to 214.1 million, up by 18.1 percent).
TABLE 2.8Global and regional trends in numbers for seven nutrition indicators with global targets
SOURCES: See sources listed under Figure 2.9.
The child stunting target is the only global nutrition target that refers to the number of children rather than the prevalence. The 2025 and 2030 targets are to reduce the number of stunted children by 40 percent and 50 percent from the baseline, respectively. Globally, the number of stunted children decreased from 180.4 to 150.2 million from 2012 to 2024, a 16.8 percent drop. The subregions with the largest decreases in the number of stunted children from 2012 to 2024 were: Southern Asia (−20.6 million), South-eastern Asia (−6.1 million) and Eastern Asia (−4.6 million).
The large decrease in the number of stunted children in Asia came from a combination of decreases in stunting prevalence and child population. This dynamic is shown in Eastern Asia, where there was a 36.8 percent reduction in prevalence from 2012 to 2024 (from 7.6 to 4.8 percent) and a larger (61.1 percent) reduction in the number of stunted children (from 7.5 to 2.9 million), surpassing both the 2025 and 2030 targets. While some regions are on track to achieve the child stunting targets, other regions – particularly those where the child population continues to increase – require large reductions in stunting prevalence to achieve the 2030 targets. In Africa, the need for accelerated prevalence reduction is illustrated by an increase in the number of stunted children from 2012 to 2024 (+3.1 million), despite a drop in stunting prevalence over the same period (from 34.0 to 30.3 percent).
2.3.2 Country progress
Figure 2.10 presents the number of countries that are on or off track for the 2030 global nutrition targets. The figure also includes the category “assessment not possible”, which indicates the number of countries without sufficient estimates to track progress. Sufficient estimates on child wasting and exclusive breastfeeding are not available for many countries. For child wasting, 32 percent of countries (63 out of 195) did not have sufficient data, and for exclusive breastfeeding it was 43 percent (83 out of 195). The high percentage of missing countries must be considered when interpreting progress, especially for these two indicators.
FIGURE 2.10 MOST COUNTRIES EITHER DO NOT HAVE SUFFICIENT data or are off track to achieve the 2030 global nutrition targets
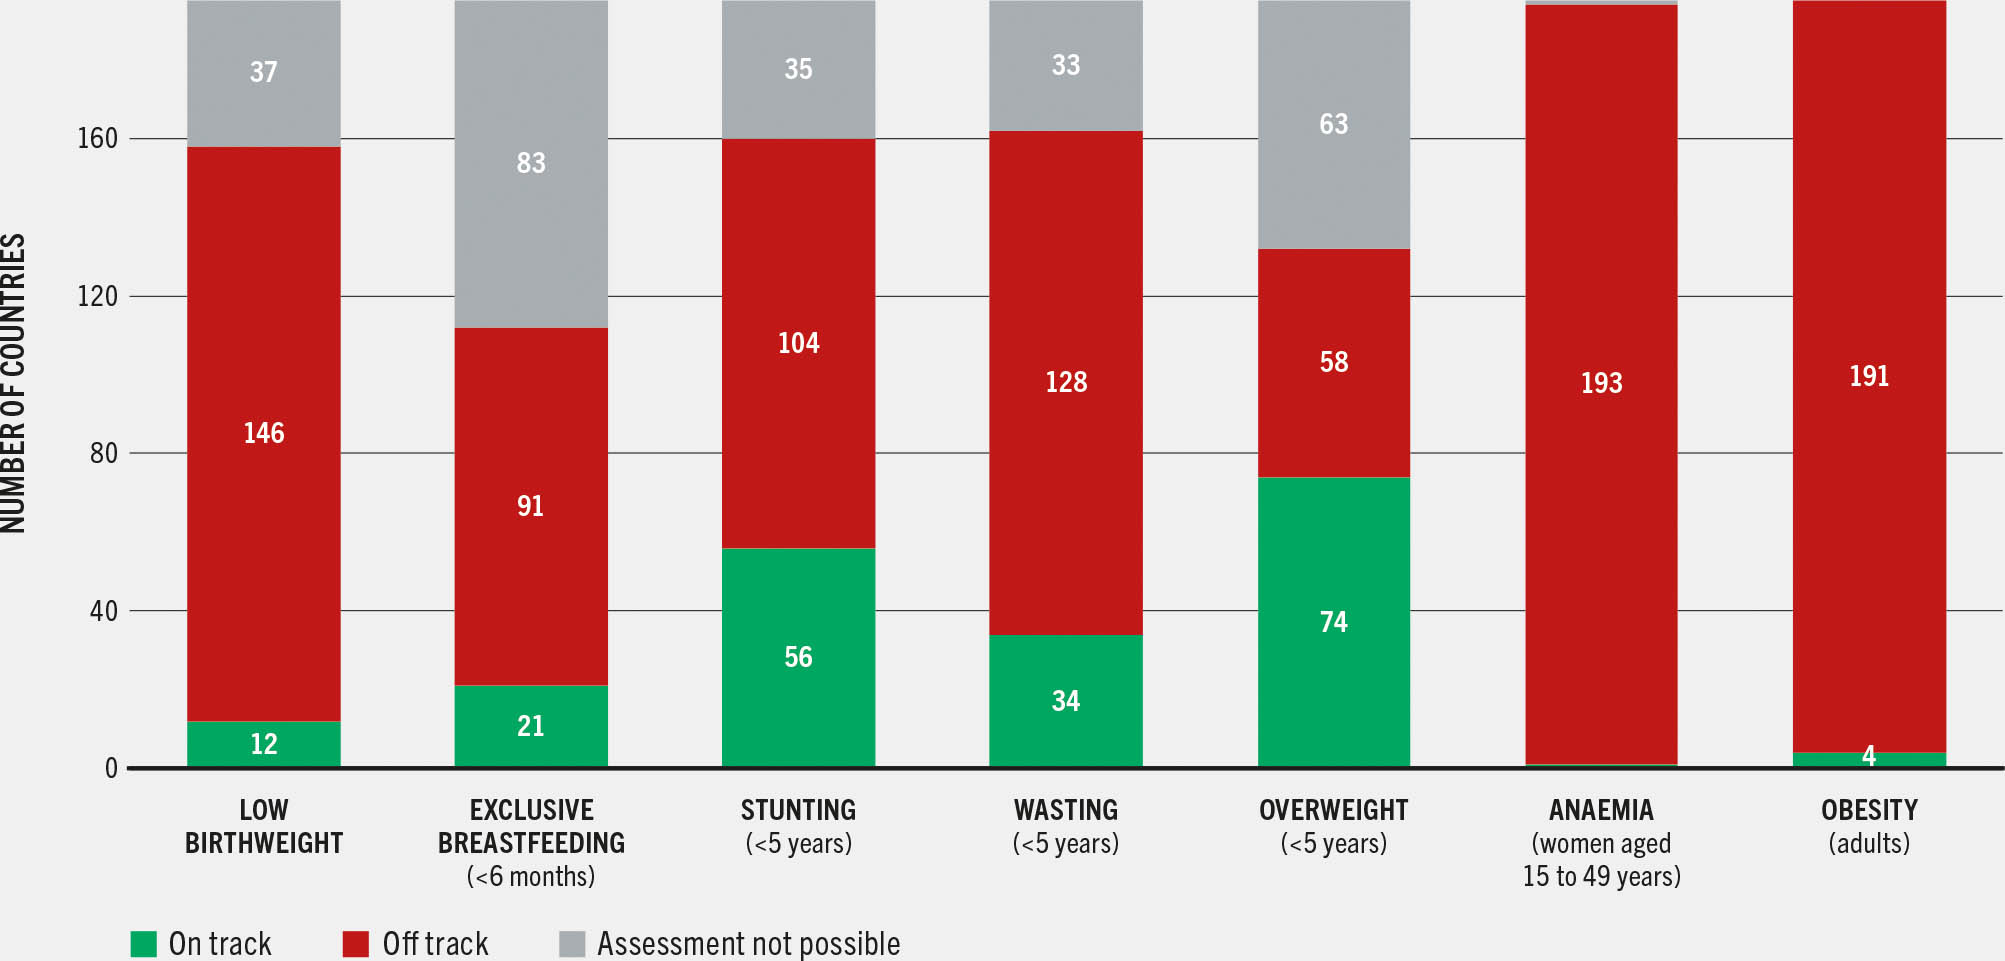
Among the 132 countries with data to assess progress on child wasting, more than half (74 out of 132) are on track to achieve the 2030 target. More countries are on track for child wasting than for other indicators of child nutritional status. Low birthweight has the lowest percentage of on-track countries of all the child nutritional status indicators, at 8 percent (12 out of 158). For child stunting, 35 percent of countries (56 out of 160) are on track; the percentage is lower for child overweight, with only 21 percent of countries with progress data (34 out of 162) achieving on-track status. Even though there are also a substantial number of countries on track, many need to accelerate progress to achieve the 2030 targets for child-focused indicators.
As mentioned above, the world is close to achieving the 2025 target for exclusive breastfeeding, but accelerated progress is needed to achieve the 2030 target. Only 19 percent of countries with progress data (21 out of 112) are on track to achieve the 2030 exclusive breastfeeding target, further illustrating the need for increased improvement in this child feeding indicator.
For indicators related to older age groups, there are very few on-track countries. Only 1 out of 194 countries (<1 percent) with progress data is on track for anaemia in women aged 15 to 49 years, and only 4 out of 195 (2 percent) are on track for adult obesity.
2.3.3 Spotlight on minimum dietary diversity in children and women: the newest SDG 2 indicator
In March 2025, the United Nations Statistical Commission officially endorsed the prevalence of minimum dietary diversity (MDD) as a new indicator for monitoring progress towards SDG Target 2.2 – to end all forms of malnutrition by 2030.e This decision addresses a major gap in the SDG indicator framework, which until now contained no indicator for tracking the quality of diets. It also marks the consensus attained by Member States on a valid indicator for global monitoring of diets in varied contexts.
With 2.6 billion people around the world unable to afford a healthy diet – and the significant contribution of poor diets to the global burden of malnutrition, diet-related non-communicable diseases and mortality – monitoring what people eat is not only timely but also critical to inform the design and implementation of policies and programmes that address gaps in food and nutrient intake. The heightened global focus on sustainable food systems that deliver healthy diets has also increased the demand for valid yet feasible indicators for tracking the diets of populations.
Healthy diets can look very different depending on where they are consumed in the world. However, as mentioned in Section 2.2, healthy diets share four universal characteristics: they are diverse, containing a variety of foods that provide nutrients and bioactive compounds important for health; they are adequate in essential nutrients; they are balanced in dietary energy and its sources (proteins, carbohydrates and fats); and they are moderate in dietary components that are detrimental to health if consumed in excess.10, 11
Minimum dietary diversity captures the diversity of diets of two nutritionally vulnerable populations – children aged 6 to 23 months (MDD-C) and women aged 15 to 49 years (MDD-W) – through a simple count of the number of food groups these individuals consumed the previous day. Eight food groups are used for computing MDD-C and ten groups are used for MDD-W.f Individuals who consumed foods or beverages from five or more food groups are classified as meeting minimum diet diversity, indicating a greater likelihood that the diet is sufficient in the essential vitamins and minerals that these populations need. Details regarding the methodologies can be found in the UNICEF and WHO infant and young child feeding guidelines23 and in FAO’s guide to using and interpreting MDD-W.24
Global and regional estimates for minimum dietary diversity
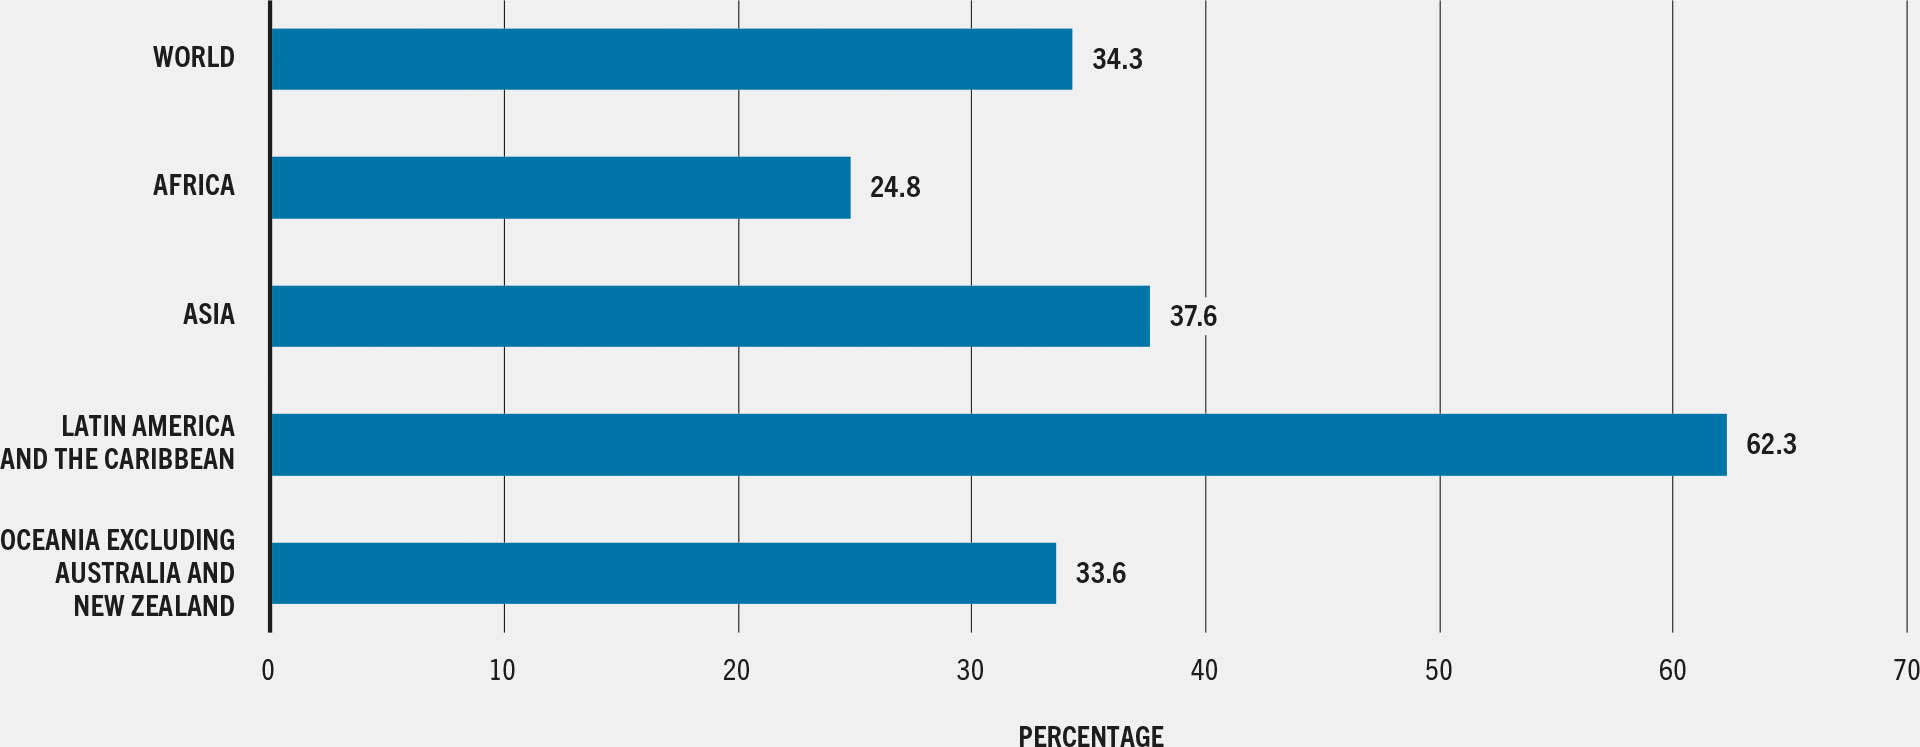
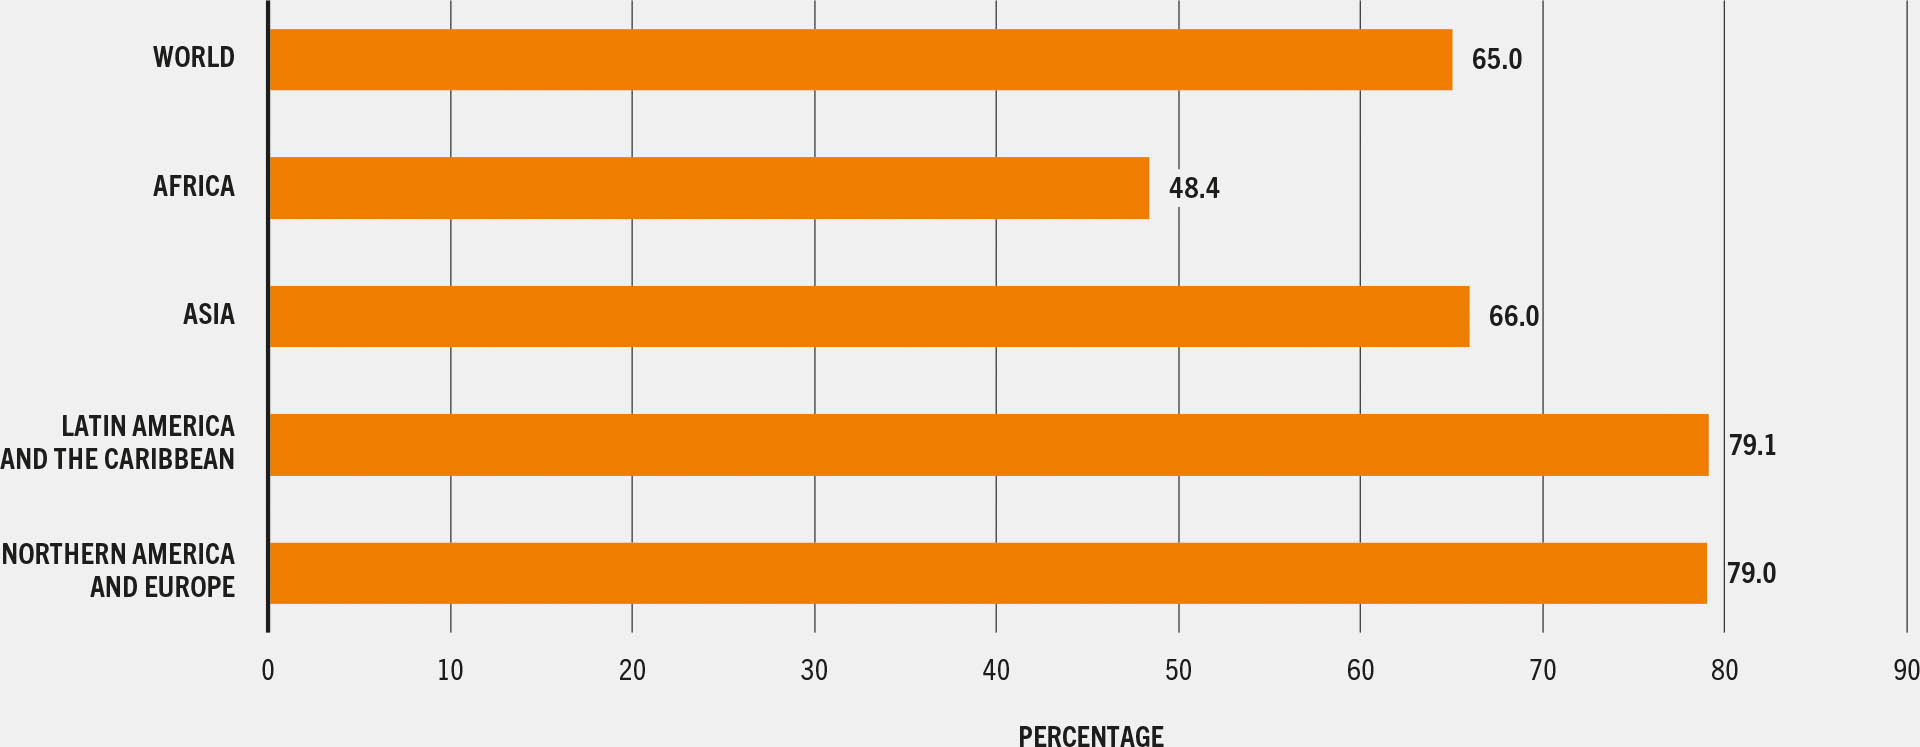
As of the first quarter of 2024, nationally representative survey data on MDD-C and MDD-W were available from 110 and 92 countries, respectively. Globally, only one-third (34 percent) of children aged 6 to 23 months achieved MDD-C, based on pooled data from 2016 to 2022 (Figure 2.11), and two-thirds (65 percent) of women aged 15 to 49 years achieved MDD-W, estimated using pooled data from 2020 to 2024 (Figure 2.12). In other words, one-third of women and – even more worryingly – about two-thirds of children aged 6 to 23 months in the world consumed diets that were not sufficiently diverse, thereby putting them at risk of inadequate intake of essential vitamins and minerals required for good nutrition and health.
FIGURE 2.11 Only one-third of children AGED 6 TO 23 MONTHS IN THE WORLD are achieving Minimum Dietary Diversity for Children (MDD-C)
SOURCE: UNICEF. December 2023. Infant and young child feeding. In: UNICEF. [Cited 6 April 2025]. https://data.unicef.org/topic/nutrition/infant-and-young-child-feeding
FIGURE 2.12 Two-thirds of women aged 15 to 49 years in the world are achieving Minimum Dietary Diversity for Women (MDD-W)
SOURCE: FAO. 2025. FAOSTAT: SDG Indicators. [Accessed on 28 July 2025]. https://www.fao.org/faostat/en/#data/SDGB. Licence: CC-BY-4.0.
Stark differences are apparent across regions, with the lowest percentage of women achieving MDD-W in Africa (48 percent) and the highest in Northern America and Europe (79 percent); Oceania is excluded from the analysis because data are available for only one country. Africa also has the lowest percentage of children aged 6 to 23 months achieving MDD-C (25 percent), followed by Oceania (34 percent), Asia (38 percent) and Latin America and the Caribbean (62 percent). Data on MDD-C are only available for five countries in Northern America and Europe, and the estimate for Oceania does not include information for Australia and New Zealand due to lack of data. The lack of data leaves large gaps and hinders a full understanding of diets in different parts of the world.
The low percentage of women and children receiving a minimally diverse diet across the world is concerning, as lack of dietary diversity not only affects risk of micronutrient deficiencies but can also lead to other health and developmental consequences. It is also concerning that dietary diversity is not improving quickly for children; MDD-C improved only marginally – from 28 percent of children meeting MDD in 2015 to 34 percent in 2022.25 Monitoring and ensuring healthy diets for women and children is a key global priority. However, to achieve minimum dietary diversity, governments and other national stakeholders need to ensure increased and sustained actions in policies and programmes for improving diets of women and children, and the integration of MDD indicators into data collection platforms such as population-based surveys. This calls for raising awareness and building capacity on MDD-C and MDD-W among different stakeholders, especially at national and subnational levels, and ensuring sufficient funding to facilitate countries’ ability to collect, analyse, use and report progress on this indicator.


