Breakdown of water resources by basic unit
The above review of water resources, based on countries, does not provide information about the distribution of the resources among the various river basins and basic units. For several countries, where detailed studies have been carried out, this information exists and was used in the assessment of water resources and irrigation potential. For several other countries, however, the information was not available.
A systematic approach, based on information available through FAO's Geographic Information System (GIS) has thus been used to provide information on water resources for the units for which it was not available in the literature.
A first estimate of water resources by basic unit can be obtained by multiplying annual precipitation P by a runoff coefficient c.
Q = c.P
where Q is the average annual flow produced inside the basic unit; Q and P are expressed in mm/year and c is dimensionless.
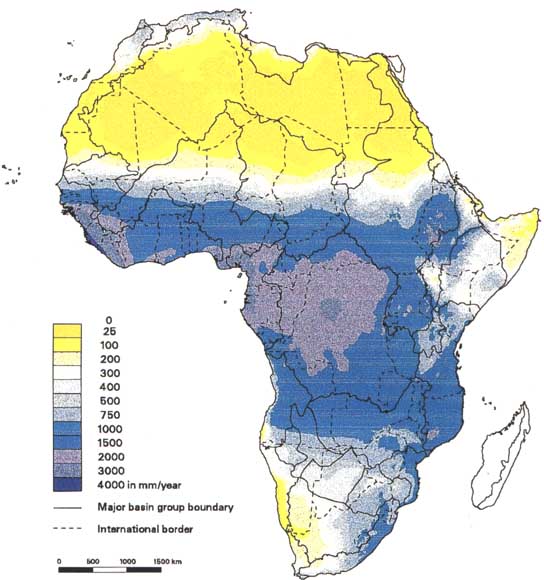
This was achieved by preparing a raster coverage of runoff coefficients from a map of African runoff coefficients [28] and combining the results with the annual average rainfall map (Figure 7) [23].
By multiplying the precipitation map by the runoff coefficient map, a map of runoff Q was obtained. In first approximation, this runoff can be assimilated to internal renewable water resources. This approximation is specially valid in humid areas. In arid areas, where groundwater resources are relatively important compared to surface water, this approximation may be less valid.
Integration of the runoff figures at the level of each country was performed to obtain country values of runoff, R. expressed in km3/year. The 53 country values of R were then compared with the figures of IRWR in Table 6. To avoid giving excessive importance to large and humid countries, the results were plotted in a logarithmic scale after having transformed IRWR and R from km/year to mm/year by dividing it by the area of the country. The comparison showed good agreement between the two sets of data and it was decided that this method was satisfactory to provide estimates of internal water resources for those basic units for which no information was available.
A similar test was performed to compare runoff measured at the outlet of large basins (obtained from the literature) and the value of runoff computed by integrating Q over the basins. The results show a systematically lower value of the measured runoff Rm compared to R. the relative difference being more important in arid than in humid areas. This can easily be explained by the losses occurring in the basins before the water reaches the outlet: losses by evaporation in the reaches, lakes, wetland and uses by agriculture and other sectors. Losses are relatively more important in arid areas, where the evaporation potential is higher and use by agriculture is usually more important than in humid areas. However, relative uncertainties with arid regions are less important because most of the missing information concerns humid countries.
The results of the second test (basin level) also bring the concept of scale in assessment of water resources. As both the runoff coefficient map [28] and the IRWR figures in Table 6 [21] used the country as a basis for assessment of water resources, they give similar results. A study at a smaller scale (local level) would probably show higher values of measured runoff due to reduced possibilities of losses, against the lower values measured at the larger scale (basin level).
TABLE 6: Water resources by country (all figures in km3/yr)
CONTRY |
Internal renewable water resources |
Incoming water |
Global renewable water res. |
Other resources |
||||||||
Surface water |
Ground water |
Overlap |
Total |
Surface water |
Ground water |
Surface water |
Ground water |
Total |
Desalination |
Groundw depletion |
||
C. |
(1+2-3) |
T |
B |
(1+5+6) |
(2+7) |
(8+9-3) |
||||||
(1) |
(2) |
(3) |
(4) |
(5) |
(6) |
(7) |
(8) |
(9) |
(10) |
(11) |
(12) |
|
1. ALGERIA |
13.2 |
1.7 a |
1 |
13.9 |
0.4 |
0 |
0.03 |
13.6 |
1.73 |
14.33 |
0.03 |
5 |
2. ANGOLA |
182 |
72 B |
70 |
184 |
0 |
0 |
0 |
182 |
72 |
184 |
X |
0 |
3. BENIN |
10 |
1.8 a |
1.5 |
10.3 |
0.5 |
15 |
0 |
25.5 |
1.8 |
25.8 |
0 |
0 |
4. BOTSWANA |
1.7 |
1.7 a |
0.5 |
2.9 |
11.5 |
0.3 |
0 |
13.5 |
1.7 |
14.7 |
0 |
0 |
5. BURKINA FASO |
13 |
9.5 a |
5 |
17.5 |
... |
X |
0 |
X+13 |
9.5 |
X+17.5 |
0 |
0 |
6. BURUNDI |
3.5 |
2.1 b |
2 |
3.6 |
X |
0 |
0 |
X+3.5 |
2.1 |
X+3.6 |
0 |
0 |
7. CAMEROON |
268 |
100 b |
100 |
268 |
... |
0 |
0 |
268 |
100 |
268 |
0 |
0 |
8. CAPE VERDE |
0.18 |
0.12 |
||||||||||
9 CENTRAL AFRICAN REP. |
141 |
56 b |
56 |
141 |
0 |
X |
0 |
X+141 |
56 |
X+141 |
0 |
0 |
10 CHAD |
13.5 |
11.5 b |
10 |
15 |
28 |
0 |
0 |
41.5 |
11.5 |
43 |
0 |
0 |
11 COMOROS |
X |
X |
X |
1.02 |
0 |
0 |
0 |
X |
X |
1.02 |
0 |
0 |
12 CONGO |
222 |
198 b |
198 |
222 |
... |
610 |
0 |
832 |
198 |
832 |
... |
0 |
13 COTE D'IVOIRE |
74 |
37.7 a |
35 |
76.7 |
1 |
X |
0 |
X+75 |
37.7 |
X+77.7 |
0 |
0 |
14 DJIBOUTI |
X |
X |
X |
0.3 |
0 |
2 |
X |
X+2 |
X |
X+2.3 |
0 |
0 |
15 EGYPT |
0.5 |
1.3 a |
0 |
1.8 |
65.5 |
0 |
1.2 |
66 |
2.5 |
68.5 |
0.01 |
... |
16 EQUATORIAL GUINEA |
25 |
10 b |
5 |
30 |
... |
0 |
0 |
25 |
10 |
30 |
0 |
0 |
17 ERITREA |
X |
X |
X |
2.8 |
0 |
6 |
0 |
X |
X |
8.8 |
0 |
0 |
18 ETHIOPIA |
X |
X |
X |
110 |
0 |
0 |
0 |
X |
X |
110 |
0 |
0 |
19 GABON |
162 |
62 b |
60 |
164 |
0 |
0 |
0 |
162 |
62 |
164 |
0 |
0 |
20 GAMBIA |
3 |
0.5 b |
0.5 |
3 |
5 |
0 |
0 |
8 |
0.5 |
8 |
0 |
0 |
21 GHANA |
29 |
26.3 a |
25 |
30.3 |
22.9 |
0 |
0 |
51.9 |
26.3 |
53.2 |
0 |
0 |
22 GUINEA |
226 |
38 b |
38 |
226 |
0 |
0 |
0 |
226 |
38 |
226 |
0 |
0 |
23 GUINEA BISSAU |
12 |
14 b |
10 |
16 |
11 |
0 |
0 |
23 |
14 |
27 |
0 |
0 |
24 KENYA |
17.2 |
3 a |
0 |
20.2 |
... |
10 |
0 |
27.2 |
3 |
30.2 |
0 |
0 |
25 LESOTHO |
4.73 |
0.5 b |
0 |
5.23 |
0 |
0 |
0 |
4.73 |
0.5 |
5.23 |
0 |
0 |
26 LIBERIA |
200 |
60 b |
60 |
200 |
32 |
0 |
0 |
232 |
60 |
232 |
0 |
0 |
27 LIBYA |
0.1 |
0.5 a |
0 |
0.6 |
0 |
0 |
0 |
0.1 |
0.5 |
0.6 |
0.003 |
2 to 4 |
28 MADAGASCAR |
332 |
55 b |
50 |
337 |
0 |
0 |
0 |
332 |
55 |
337 |
0 |
0 |
29 MALAWI |
16.14 |
1.4 b |
0 |
17.54 |
1.14 |
0 |
0 |
17.28 |
1.4 |
18.68 |
0 |
0 |
30 MALI |
50 |
20 a |
10 |
60 |
40 |
0 |
0 |
90 |
20 |
100 |
0 |
0 |
31 MAURITANIA |
0.1 |
0.3 a |
0 |
0.4 |
0 |
11 |
0 |
11.1 |
0.3 |
11.4 |
X |
0 |
32 MAURITIUS |
2.03 |
0.68 a |
0.5 |
2.21 |
0 |
0 |
0 |
2.03 |
0.68 |
2.21 |
0 |
0 |
33 MOROCCO |
22.5 |
7.5 a |
0 |
30 |
0 |
0 |
0 |
22.5 |
7.5 |
30 |
0.004 |
0 |
34 MOZAMBIQUE |
97 |
17 b |
17 |
97 |
106 |
5 |
0 |
208 |
17 |
208 |
0 |
0 |
35 NAMIBIA |
4.1 |
2.1 b |
0 |
6.2 |
11.3 |
28 |
0 |
43.4 |
2.1 |
45.5 |
0.003 |
0 |
36 NIGER |
1 |
2.5 a |
0 |
3.5 |
29 |
0 |
0 |
30 |
2.5 |
32.5 |
0 |
0 |
37 NIGERIA |
214 |
87 b |
80 |
221 |
59 |
X |
0 |
X+273 |
87 |
X+280 |
0 |
0 |
38 RWANDA |
5.2 |
3.6 b |
2.5 |
6.3 |
0 |
X |
0 |
X+5.2 |
3.6 |
X+6.3 |
0 |
0 |
39 SAO TOME AND PRINCIPE |
X |
X |
X |
2.18 |
0 |
0 |
0 |
X |
X |
2.18 |
0 |
0 |
40 SENEGAL |
23.8 |
7.6 b |
5 |
26.4 |
2 |
11 |
0 |
36.8 |
7.6 |
39.4 |
0 |
0 |
41 SEYCHELLES |
X |
X |
X |
X |
0 |
0 |
0 |
X |
X |
X |
0 |
0 |
42 SIERRA LEONE |
150 |
50 b |
40 |
160 |
0 |
0 |
0 |
150 |
50 |
160 |
0 |
0 |
43 SOMALIA |
5.7 |
3.3 b |
3 |
6 |
7.5 |
0 |
X |
13.2 |
X+3.3 |
X+13.5 |
0 |
0 |
44 SOUTH AFRICA |
40 |
4.8 |
0 |
44.8 |
5.2 |
0 |
0 |
45.2 |
4.8 |
50 |
X |
0 |
45 SUDAN |
28 |
7 |
0 |
35 |
119 |
0 |
0 |
147 |
7 |
154 |
0 |
0 |
46 SWAZILAND |
X |
X |
X |
2.64 |
1.87 |
0 |
0 |
X+1.87 |
X |
X+4.51 |
0 |
0 |
47 TANZANIA |
80 |
30 b |
30 |
80 |
0 |
9 |
0 |
89 |
30 |
89 |
0 |
0 |
48 TOGO |
10.8 |
5.7 a |
5 |
11.5 |
0.5 |
0 |
0 |
11.3 |
5.7 |
12 |
0 |
0 |
49 TUNISIA |
2.31 |
1.21 a |
0 |
3.52 |
0.32 |
0 |
0.1 |
2.63 |
1.31 |
3.94 |
0.009 |
1 |
50 UGANDA |
35 |
29 b |
25 |
39 |
27 |
0 |
0 |
62 |
29 |
66 |
0 |
0 |
51 ZAIRE |
934 |
421 b |
420 |
935 |
84 |
X |
0 |
X+1018 |
421 |
X+1019 |
0 |
0 |
52 ZAMBIA |
33.1 |
47.1 |
0 |
80.2 |
35.8 |
X |
0 |
X+68.9 |
47.1 |
X+116 |
0 |
0 |
53 ZIMBABWE |
13.1 |
5 b |
4 |
14.1 |
0 |
X+5.9 |
0 |
X+19 |
5 |
X+20 |
0 |
0 |
TOTAL |
3721 |
1517 |
1370 |
3988 |
||||||||
C: Method of computing groundwater;
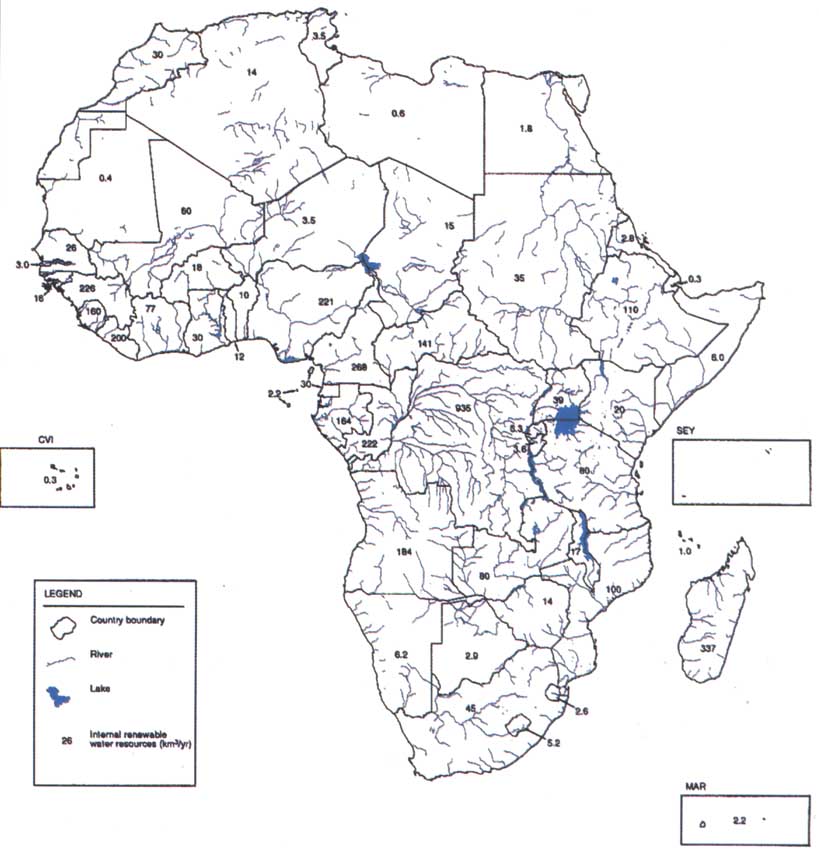
Figure 6: Water resources by country (all figures in km3/year)
Figure 7: Average annual rainfall