![]()
![]()
![]()
The results obtained, following a hierarchical classification, are presented in the form of a tree illustrating the successive grouping of the elements under analysis, in classes which ultimately amalgamate to form a single unique group which represents the total population. The tree can be interpreted in a descending (from the "trunk" to the "leaves" of the tree) or ascending (from the "leaves" to the "trunk ") fashion. The problem lies in the definition of an appropriate cut in the tree to establish the number of classes relevant to the profile.
The data analyst will suggest, using statistical criteria, one or more cuts based on "gaps" between successive "nodes" (a "node" being a subdivision of one branch into two branches): a greater gap, with more sub-branches emanating from it, indicates a significant difference with the other branches of the node. The quantitative criteria used to set the level at which cuts will be made are:
- the numbers in the classes (in general, the creation of very small classes should be avoided);
- the percentage of the variability explained by the typology, measured in terms of the ratio of within-cluster inertia to total inertia, (where inertia is a measure of the variability of a cluster). Between-clusters inertia represents the variability between the classes: the larger it is, the more different are the groups. Total inertia corresponds to the variability of the whole subject of the classification, and is equal to within-cluster variability plus between-clusters variability. The ratio "between-clusters variability/total variability" gives the percentage of variability taken into account by representing the sum of K classes. Within-cluster variability makes it possible to assess the degree of heterogeneity of each class and the possible relevance of choosing a cut with K+1 classes to split off the most dissimilar group.
The general structure of the tree provides us with information on the heterogeneity of the data set and on the efficiency of the classification to define classes within it. The result depends on the classification algorithm used; that is why it is always necessary to specify which method has been used. It is not sufficient to say, for example, that an Ascending Hierarchical Clustering - AHC - has been used. In the example of the Moroccan coastal fleet profile, the method used for hierarchical classification is Ward's algorithm (a clustering technique based on variance). The result also depends on the size of the data-table being classified and therefore on the number of individuals and variables used. This last point is critical. In fact, if the number of individuals or the number of variables changes, you are likely to obtain slightly different results, especially if the structure of the data is "fuzzy". The more the elements of the profile are different, with distinct, valid classes, the more stable will be the results of the typological analysis. The main difficulty lies in constructing the data table to be analysed, in the choice of individuals and variables, and in the coding of the data. It may be necessary to remove "aberrant" individuals (and to then treat them as additional individuals), to avoid redundant variables, to cluster the modalities of nominal variables (to avoid including modalities for very weak frequencies). The first data-table can, if necessary (as is often the case), be modified, following the analysis of the relationships amongst variables and amongst individuals. This is why it is advisable as a first stage, to carry out a factorial analysis. This makes it possible to take account, in successive factorial analyses, of the sources of variability in the data set, and to identify the variables responsible for this heterogeneity and to locate the atypical individuals. This examination of the data-structure helps to plan the steps in the analysis. This is a useful first step, since it allows the data set to speak for itself and respond to successive adjustments. It is generally necessary, in the construction of the data-table, to refer back several times. Figure 7 illustrates these successive stages and the feedback that is often necessary in analysing the data set.
|
The hierarchical classification tree (or dendrogram) resulting from the analysis of the technical specifications of 497 boats of the Moroccan coastal fleet, is illustrated below. This representation of the tree is limited to 45 branches, whereas the complete tree comprises 497 (the number of individuals in the classification). The structure underlined illustrates 3, even 4 quite distinct classes. Cutting the tree into 4 classes explains 40.87 % of the total variability in technical specifications for the 497 boats. |
Ward's Hierarchical classification
of 497 vessels described by their technical specifications
Once the number of classes has been decided, the analyst generates the statistics (mean, standard deviation, frequency) for all the significant variables (active and supplementary) of the partition, in order to describe each class resulting from the typological classification. At the same time, it is often useful to provide a list of the individuals in each class, as well as the list of the individuals closest to the centroid of the class. These individuals, which are typical of the class mean, are called "paragons": they are the stereotypical components of the class (e.g.: boat-types representative of the average characteristics of that class of boats).
The next step brings in the field specialist. It is usually difficult for the person is in charge of the analysis to also carry out the interpretation of results by themselves. The expert can judge the validity of the classes and potential problems involved in the assignment of individuals to classes. From the list of the characteristic variables for each class, the expert can normally give a name to each class, on the basis of association of these variables. The goal of classification is to confirm the existence of classes suspected by the experts and, eventually, to reveal categories unsuspected even by the experts! This interpretation work must be undertaken jointly by the analyst and the owner of the data in order to take into account qualitative elements which are non-quantifiable and difficult to represent in tabular form, but which are known through experience to local scientists or administrators. During the course of a typological study, individual experience undeniably guides the interpretation of the data. This is why it is necessary to combine expert knowledge and the objectivity and rigor of statistical analysis. This requires a concerted effort and, in practice, the organization of working groups.
|
Work on the profile of Moroccan coastal fishery started with a survey carried out in 1996-97 by the INRH, based in Casablanca. Data was analyse by an FAO consultant at ORSTOM (Institut Français de Recherche Scientifique pour le Développement en Coopération) based in France. In addition numerous exchanges by fax or email, several trips and meetings took place in connection with the data processing: - the first trip by the data analyst to Morocco: preparatory meeting, recommendations for the database, the results expected, activities to be carried out and collaboration necessary; - a second trip by the data analyst, seven months later, lasting one week: presentation of the results obtained from the typology of the fleet's technical characteristics (see the diagram of analysis presented in Figure 5): comments from various experts, validation of the first typology (concerning the technical characteristics of the vessels of the fleet), evaluation of the data processing activity. Notably, a work-programming meeting was organized between the FAO consultant and the representatives of the three institutions involved in the Fisheries Modernization Programme (the INRH, l'Office National des Pêche et le Ministère des Pêches Maritimes). Each variable of the investigation was reviewed with the specialists, in order to define particular requests for specific treatments (presentation of certain tables, calculation of new composite variables, for example: range of costs for purchase of electronic equipment; relationship tonnage/power, tonnage/number of people aboard; relation between length of cable on the winch and the horsepower of the trawler in order to determine the possibilities of prospecting by large trawlers in the deepest zones); - a trip by a technician of the Service de Technologie de l'INRH, a "field specialist", to France the following month, for one week: a detailed study of the results of the statistical analysis as a function of the characteristics of the investigation, an expert knowledge of the Moroccan fleet, and the objectives being pursued; - submission of the first report on the typology of vessel technical characteristics; - a third and last trip by the data analyst, also for a week, the following month: for the development of the profile of the fishing strategies (see the procedure of analysis presented in Figure 6); The conclusion of the data-analysis and the handing-over of the final report, with the appendices and the diskettes containing the programs and processed data, occurred before the end of 1997. The analysis of the information, from planning to analysis and the submission of results, thus required a full year, calling upon part-time external resources. |
A fleet profile based on catch and fishing effort may be commissioned, for example, within the framework of a study to analyse the structure of the fleet (type, number and characteristic of the various units composing the fleet) in respect of its potential impact on resources. The objective, from the point of view of management, is to better understand fishing pressure and the sustainability of exploitation by taking into account the particular interactions between the vessels. The analysis can be based on the annual or monthly catch-composition by vessel or of the catch per unit of effort (CPUE). The classification of fishing vessels on the basis of their catches and their fishing effort, and the identification of homogeneous categories within the fleet, are necessary in order to calculate fishing power or to be able to model the allocation of fishing effort. A discussion on using the results of a fleets profile was made by Biseau (in Rochet et al., 1994).
Fleet profiling based on catches is generally carried out on a fine temporal scale, either at the level of the fishing trip, the trawl, or the monthly landing. This type of analysis is implemented at the initial stages of a fleet profile because the criterion subject to classification is no longer the vessel but the fishing trip. This kind of profile is necessary in order to study multi-species fisheries or species associated within the catch. In general, analyses of production are carried out in parallel with those of fishing effort. Coupling two profiles using different criteria is fairly common: for example, cross-tabulations between two independent profiles based on the same set of fishing trips produced, on the one hand, from activities (fishing effort) and, on the other hand, from production (catch). Or coupling of analyses between the quantity of catch and the frequency of fishing zone use. The process of analysis in Figure 4 shows two examples of coupling (artisanal fisheries in Senegal and the trawl fisheries of the Celtic Sea) between the catch data set and the fishing effort data set.
|
The profile of artisanal fishing tactics in Senegal was implemented by the technicians of the Centre de Recherche Océanographique de Dakar-Thiaroye, using routine follow-up data samples. The plan of analysis (Figure 4) applied to the catch and effort data, for each trip sampled in 1992, made it possible to identify 6 types of fishing behaviour (behaviour-types or "tactics"). Each tactic or behaviour-type is described by a combination of the 4 qualitative variables (Figure 3) describing a type of fishing behaviour (target species * gear * place of fishing * month) and by supplementary variables (depth and crew). |
|
In the table below, each tactic is named after the most characteristic category of the variable "catch profile" (bold). The target species is assumed to be the most characteristic category of the variable catch per species (in italics). In the first column, the number of illustrative individuals assigned to the cluster (i.e. the tactic) is reported in parentheses. In the gear column, G1 corresponds to no engine, G2 corresponds to an engine power < 9 kW, and G3 corresponds to an engine power > 9 kW. Depth is coded in 7 categories, but only characteristic depth ranges are reported for clarity (taken from Pelletier & Ferraris, Can. Journal Fish. 2000). |
|
Active variables |
Illustrative variables |
||||||
| Cluster size |
Catch profile (tactic name in bold) |
Gear |
Location |
Month |
Catch per species (target species in italics) |
Depth |
Crew size |
| 1490 |
1. Sea bream |
G2G3 |
L14, L6, L13,L21, L7 |
Feb., Jan., Mar., Dec., Nov., May |
Pagellus bellottii |
25 to 50m |
4, 3, 5 |
| 1321 |
2. Groupe |
G3 |
L2, L24, L5, L8, L15, L17 |
June, Jul.,Apr. |
Epinephelus aeneus |
10 to 25m and75 to 120m |
3, 2 |
| 339 |
3. Goatfish |
G1 |
L15, L40, L10, L11 |
Jul., Aug.,Sep. |
Pseudupeneus prayensis |
10 to 50m |
1, 2 |
| 449 |
4. Sailfish |
G2 |
L20, L13, L7 |
Aug., Sep., Jul., Oct. |
Istiophorus platypterus |
25 to 75m |
2 |
| 1112 |
5. Octopus |
G1 |
L9, L11, L40, L10, L17 |
Mar., Oct., May, Nov.,Apr. |
Octopus vulgaris |
<25m |
1 |
| 716 |
6. Deepwater group |
G3 |
L16, L23, L21, L17 |
Mar., Dec.,Apr.,Oct., Sep., Feb., Jan |
Dentex spp. |
>75m |
4, 5 |
A fleet profile that is based on the technical specifications of the vessels requires that variables be pre-selected. In fact, these variables generally fall under several headings which convey information only if the boat possesses the element described by the heading (e.g.: "dimensions of fishing gear: seine" will be given only if the preceding variable "presence of a seine" is positive, i.e. if there is a net on board!) It is therefore judicious to make several classifications: the first on the variables common to all the boats (general characteristics), then by sub-groups each corresponding to a group of boats of the same type for which the same series of data exist. As far as possible, the number of variables under each heading must be balanced in order to avoid giving too much weight to a heading as a result of its number of variables. Indeed, the calculation of similarity between two boats will be a function of the variation observed for each variable and thus of the number of variables per heading. It is also advisable to include any redundant variable as an additional variable along with those kept active, in order to build the classification tree. The additional variables are reintroduced at the point of interpretation of the classes and provide a posteriori proof that the effect related to these variables did not contribute to the classification. For example, the majority of variables relating to technical specifications is to some extent connected to the size of the boat (or even depends on it): storage capacities, quantities of gear or equipment, etc. It is thus sensible to preserve, as supplementary, variables of size (length, power, hold) to at least demonstrate that the classes are constructed in such a way that there is a good separation of the boats according to size.
The results of the profile finally appear, after a series of successive analyses, as classification trees and statistical tables. Presentation of the results generally consists of the key points emerging from the analysis, along with the recommended actions. Presented below, in detail, is the result obtained from profiling the Moroccan coastal fleet according to technical specification.
|
The process of profiling the technical characteristics of the Moroccan coastal fleet took place in several stages: 1- a global profile on 29 active variables: propulsion = 4, equipment = 5, gear types = 4, hold capacities = 6, electronics = 6 and safety = 4. 2- sectoral profiles carried out on each principal group of the first profile, starting with the variables specific to each group (in this particular case, three principal groups were identified during the course of the global profile, therefore three sectoral profiles were carried out). Appendix IV provides a list of the active variables and supplementary (or "illustrative") variables used for each of these profiles. 1. Global profile The first profile defines 3 groups (or branches) whose first explanatory variable is the dominant activity: - the first branch corresponds to 98% of boats whose dominant activity is trawling. The class is made up of 72.4% trawlers, 13.8% trawler-sardine boats, 13.8% others; - the second branch corresponds to the dominant activity of the sardine boats: 92.6% of the activity is in this class, which is relatively specific to this activity, and the class is homogeneous for this activity at 98.3%. 89% of the SARD licence type are in this class, but 26% of the boats of the class are not of this type (heterogeneity of the class); - the third branch is associated with the dominant activity of the longliners (specificity of longliners = 95%; homogeneity = 80.6% longliners + 7.2% not specified): the class is made up of 76 % boat type PAL, 20.86 % type PALSA. These first results thus demonstrate that there are some contradictions between the type of licence and the dominant activity practiced by the ships, and that the type of licence does not consistently reflect the nature of the equipment on board the fishing vessels. 2. Three sectoral profiles 2.1 - In the profile of the first group (or branch) of 181 boats whose dominant activity is trawling, it is possible to recognize 4 classes according to the size of the unit and the type of boat: - boats corresponding to the mean characteristics of the variables used (class 1 = 110 boats); - boats below the average (class 2 = 30 boats); this class has principal characteristics as follows: length = 16 m; gross tonnage = 29.8 tons; power = 173 hp (with older engines - 11 years compared to 7 years for the boats in group I) and a geographical component (71.4% of the boats from the same port (M'diq) pertaining to group I are found in this class). - boats above the average (class 3 = 31 boats); this class groups together large vessels, with greater capacity; and the principal characteristics of the boats are: length = 21.4 m; power = 433 hp; gross tonnage = 75.2 tons and the units are well equipped electronically (94% have a radio; 58% a GPS) - class 4 (= 10 boats) covers boats whose dominant activity is sardine boat or longliner; these boats are on average smaller than those of class 2 (14.8 m) with a higher gross tonnage (36.6 tons); 50% of these units are equipped with a nozzle. Analysis shows the first 3 classes to be distinct, once the units lacking a trawl are not included. The classification reveals the same structure as previously, that is to say a structure based on size. 2.2 - The analysis of the group (or branch) II (177 boats with dominant activity of the type "sardine boat") produces 3 groups. The boats are either single-purpose sardine boats, or of mixed type which are mainly trawler-sardine boats and longliners-sardine boat. The dendrogram has three principal branches separating the units according to size: - class 1 (71 boats) consists of boats with similar principal characteristics as follows: length = 15.5 - 19.6 m; gross tonnage = 24.3 tons; power = 156.8 hp (all less than average); relatively less well equipped from the electronic point of view than other groups (87% have a depth-sounder); 62% are equipped with a lamp; 14% do not have a hold and 80% use fish boxes for storage; a geographical component is noted since 100% of the boats of this group (the sardine boat) are from three ports (Cala Iris, Djebha and M'Diq). - class 2 (25 boats) is exemplified by relatively large and powerful boats (58 tons and 372 hp), of which 72% are equipped with a lamp, and which have a better than the average storage capacity in fish boxes, with insulated holds (76%). It is observed that this class of sardine boat is common in different areas from the previous class (50% of the boats from Ras-Kebdana and 61% of the Al Hoceima boats are in class 2); the seine has a depth of 126m. - class 3 (81 boats) consists of boats with characteristics above the overall mean, with an average length of 20.9 m (338 hp; 61 tons) and most of the units equipped with a video-sounder (96%), bulk-storage in non-insulated holds (2.4 holds/boat); in general these boats are better equipped for safety; the height of the net (depth of the seine) is on average less than the boats of the preceding class (68.8 m); and the boats of this class tend to come from certain areas (Agadir and the Grand Sud: Safi, Laayoune, Tan-Tan). 2.3 - The typology of group (or branch) III (139 boats which are of the type "longliner") identifies 5 branches of which only 4 are relevant (one of the classes consists of only one boat): - class 1 (19 boats), includes 47% longliner-sardine boat and 16% sardine boat, and covers mainly old boats (22.2 years with an engine acquired 16 years previously), all possessing a seine, mostly small (on average 289 m length and 74 m depth), with 60 % possessing a drift gillnet, with some having a fishing- lamp but not a line, and which are generally minimally equipped (the auxiliary bridge equipment is limited to a mechanical capstan, and approximately a fifth of the units do not even have a navigation compass. Three quarters do not have any particular means of fish conservation); this type of unit of fishing represents up to 75% of the fleet at a particular port (Ras-Kebdana); - class 2 (90 boats) includes boats with dominant activity longliner of which 63% are liner-netters (practicing in particular bottom longline and hand line), of average technical specification: length = 10.6 m; cv=83; gross tonnage = 11 tons, rather lower than the normal, except for the units using surface longlines; - a third class (23 boats) covers netters (17% are also liners), of average technical specification except for the use of trammel nets and ordinary gillnets of larger than average dimensions; 48% of the boats of this class have insulated holds, and this class of vessel is characteristic of certain ports (Larache, for 83% of the boats; Mohamedia for 75%); - a final class includes 6 boats of rather higher technical specification whose principal activity is trawling or sardine fishing; but one of the characteristics of the boats of this last class was to give the response "not applicable" to questions concerning the compass: a response that was interpreted as meaning that the vessel did not have a compass. In this case, the correct interpretation of the data emerged after re-checking upon returning from the field, which suggested that the 6 boats of this group need to be the subject of case by case analysis and of a detailed study of the data, since their distinction from the other boats of apparently the same type is not obvious. This suggests data transcription errors, which would explain the grouping of these boats in the longliner group. In order to summarize the structure of the sample of the Moroccan coastal fleet revealed by the analysis of technical specifications, it is possible to construct a dendrogram showing the 4 successive profiles: this tree enables us to visualize the sequence of the 11 classes ultimately retained.
- the separation of the 497 boats into 3 groups, of 181, 177 and 139 boats respectively, is made on the basis of a hierarchical tree obtained by performing a global profile (on all the boats); it should be noted that the first dichotomy separates the group of 181 (main activity: trawling) from the other boats. The separation of the sardine boats and longliners takes place at a lower level. This level (vertical bars correspond to a node) is defined by an index resulting from the classification algorithm, representing the degree of resemblance between the elements belonging to the same branch. Thus all of the 177 + 139 boats of groups II and III correspond to a group more heterogeneous than the whole of the 181 boats of group I (since the division of this group into sub-groups is done at a decidedly lower level (vertical division bars are more to the left of the figure); - the successive stages of division of each of the three groups I, II and III, are then traced on the basis of the three dendrograms resulting from the sectoral profiles. The degree of heterogeneity in each resulting sub-group can thus be visualized (by the level of corresponding divisions, as well as by the level of the following division traced for each resulting sub-group). It can be seen, for example, that the sub-group of 31 boats in group I (181 vessels), which covers large, well-equipped fishing units, is more heterogeneous than the sub-group of 110 trawlers (the first branch at the top of the dendrogram) which, in spite of its greater manpower, is a relatively homogeneous group from the point of view of technical specifications. The overall results of the Moroccan coastal fleet profile based on technical specifications are summarized in tables 1 and 2, presented at the end of this report (3.4. Presentation of results). Ultimately, only 9 classes prove significant, leaving aside 2 poorly represented classes that do not belong to the principal group that they are associated with, and represent artifacts (class 4 of the trawler group and 11 of the longliner group). |
The result of profiling fleet exploitation strategies is illustrated by the example of the Moroccan coastal fleet (see Figure 6). It may be recalled that the goal is to obtain a classification of the 497 boats for a representative sample of the fleet, according to the exploitation strategies implicit in their fishing operations (see Annex I and Annex III for the "fleet operations" heading of the questionnaire and the list of coded variables). The term "fishing operation" (or campaign) is used to label the ensemble of place, gear, time and target of fishing. A difference in one of these criteria (example, a different fishing zone) requires the coding of a new fishing operation, and each boat could carry out several fishing operations during the year prior to the investigation.
The first stage was to describe and characterize the fishing operations, given that the boats employed a maximum of 4 different types of fishing operation during the year prior to the investigation.
|
Description of fishing operations: - The 497 boats of the sample correspond to 1 064 fishing operations, an average of 2.15 operations per boat. 6.7% of the boats practiced a single identical type of fishing all the year (only one type of operation or campaign), whilst the majority (3/4) carried out two operations in 1995; the boats that carried out more than 2 campaigns belong to the category of the longliners. - Fishing gear: 8 categories of gear were declared. In order of importance: seine (including tuna seine), trawl, drift net, longline, and simple net, trammel net and hand line, trap. - 26 different fishing zones were visited (see the geography of Morocco, defined for the Atlantic coast according to latitudinal sections, and for the Mediterranean, according to longitude). Certain zones are visited more, or much more, than other zones (such as between Tan-Tan and Laayoune, towards Agadir or from Rabat to Essaouira and West of Al Hoceima). A single fishing operation can obviously cover several zones, whether contiguous or not. Single operations were found to cover a maximum of 12 zones (trawler) but the majority of the fishing trips take place in 2 to 3 zones at most. One can however observe very clearly that the trawlers are in the Atlantic, the longliners in the northern Atlantic, the multipurpose units in the eastern Mediterranean - and the sardine boats in the western Mediterranean and central and south Atlantic. - Species: the majority of the fishing operations lead to the capture of several species (the diversity of the catch depends on the fishing method and the type of activity, from only 1 species in 15.1% of the cases (mainly longliners) to 2-4 species in 56% of the cases (notably sardine boats), and ultimately the trawlers which have the most species diversity in their catch (on average, 5 species). The species declared the most frequently change, of course, according to the type of activity: the horse mackerel and the hake for the trawlers, the swordfish and the sea bream for the longliners and obviously sardine for the sardine boats. - Period: the majority of the operations cover one period from 2 to 7 months with average of 5.5 months: no difference is noted between the type of boats; only 16 % of the operations cover more than 7 months; every month includes some fishing operations fishing, the most frequent months being from June to September. - Depth: the longliners, on average, operate in the greatest depths (139.5 m - 294.8 m) and the sardine boats in the least (35.9 m - 129.9 m); the trawlers operate in an intermediate depth range. - Bottom type: 9 basic bottom types are distinguished: soft, silt, mixed silt, sand, sandy-muddy; hard sand; hard; rock and mixed rock. These categories will be ultimately condensed into 4 classes during the course of analysis: soft, hard, semi-hard/sand and semi-hard/silt. The "soft" and "hard" categories are most frequently encountered; the latter is more characteristic of longliners but is also reported during other types of activity. - Destination of products: the majority of operations are associated with a primary destination (only 9% of the operations are associated with a secondary destination for the products). The main destination is the market (66.4%), then export (15.1%), the processing plant (10.6%) and fishmeal (3.5%). These percentages vary according to the dominant activity: fresh fish sales (market) being more characteristic of trawlers, export of longliners, and the processing plant and fishmeal being the destination of the catch of the sardine boats. - Landing points: Principal ports for unloading are identified (Tan-Tan, Laayoune, Agadir, Casablanca, Tangier then Al Hoceima). Landing points are of course closely associated with the home port of the boat: a boat generally unloads at its home port. - Average landing per trip: in the Moroccan example, the average landing is 7,192 kg; increasing from the longliners to the trawlers, then the sardine boats. - Duration of trip: averages 2.4 days, decreasing from trawlers to longliners, then mixed and sardine boats. - Number of gear sets per trip: 7.5; decreasing from trawlers to sardine boats to sardine boat-longliners, then longliners and longliner-sardine boats. - Duration of set: 4.5 hours. The longest is observed for longliners, decreasing for the mixed fishing types, then the trawlers and, finally, the sardine boats. |
Fishing operations are described by a very large number of variables and in certain categories, this number is much higher than in others (species = 73; month = 12, zones = 26). It is thus necessary from the start to make a synthesis under each category defining a single qualitative variable with an equivalent number of modalities: this is obtained by carrying out a classification by heading. For example, each fishing operation is characterized by the species captured. At maximum there are 8 species taken in an operation (certain trawlers) out of the total of 73 different species listed from the sample unit. The classification of fishing operations described by the presence or absence of the 73 species makes it possible to group the operations on the basis of the type of species caught. The number of the class corresponding to the type of species captured during the operation is then given to each operation, and the result of the classification is thus equivalent to a new qualitative variable in which the number of modalities is equal to the number of classes. This process is applied 4 times, to the species caught, the zone, the period and the depth of fishing.
|
Analysis of captured species (1 064 operations × 73 species) The classification tree exhibits a very clear structure with 5 branches: 2 important classes are distinguished (I: 329 operations and V: 482 operations) corresponding respectively to 79% of the operations of the sardine boats and 89.8% of the trawlers (this latter class does not however consist entirely of trawler operations but includes 14% others): - class I (329 operations) corresponds to catches of pelagic species: sardine, anchovy, mackerel, scad; constituting 79 % of the sardine boat operations; - class II (115 operations) is characterized by captures of tuna and tuna-like species: skipjack, bluefin tuna, frigate tuna, bonito; constituting 47% of longliner operations, 46% of sardine boats and 6% of mixed-purpose boats (sardine boat-longliner); the use of drift gillnets particularly ... this class is unexpected and requires verification; - class III (96 operations, characterized by the swordfish and gillnets, is composed of 75.7 % of longliner operations and 10.2% of sardine boat-longliner; with the same comment as for the preceding class; - class IV (42 operations) is characterized by: scorpion fish, spiny lobster, pandora, sea bass, sea bream, grouper, Couch's sea bream, conger eel, John Dory, lobster, moray eel, composed 66.8% from operations of longliners using longlines and trammel nets; - finally class V (482 operations) corresponds to the demersal species: hake, sole, shrimp, octopus, mullet, cuttlefish, sea bream, John Dory, composed 89.8 % of trawlers. The raw data suggests an identification problem in classes II and III: concerning drift gillnets used by longliners. Verification by field experts is necessary but it could also be a coding problem. Finally, each fishing operation is characterized by a new qualitative variable of 5 modalities (number of the class of membership from 1 to 5) summarizing the type of species caught. Analysis of fishing zones visited (1 064 operations × 26 zones) A classification of the presence/absence of the 26 basic zones frequented shows that there are 7 principal geographical ranges exploited during the course of fishing operations: these results are illustrated in a graphic form as Figure 8. Two classes (II, III) correspond to operations taking place in the northern Atlantic, which covers the zone of the Straits; classes IV and V relate to operations in the western and eastern Mediterranean respectively, and classes VI and VII, of less significance, consist of groups of operations carried out in the southern and extreme southern Atlantic. Class I, the largest, includes within its group several "other operations" which correspond to a more restricted heterogeneity of range: Tan-tan/Laayoune, Agadir and/or Tangier. An automatic classification often gives a heteroclitic (anomalous) class which groups individuals which are different, but which do not fit into the other classes defined. Analysis of the fishing period (1 064 operations × 12 months) The classification tree leads to the definition of 4 very clear classes: The first semester of the year (January-June), the warm season from May to September, the cool period from October to March, and the second semester of the year (Figure 8). Analysis of bathymetric classes (1 064 operations × 6 depths) The same treatment is carried out on the depth-classes in order to define the bathymetric ranges fished during the course of operations. The classification tree reveals 8 classes (Figure 8): the first zone between 55 and 270 meters is more characteristic of the trawlers (64 percent, comprising 37 percent of the trawling operations), whereas the shallow depths (classes III, VII and VIII) are associated with the seine; classes IV, V and VI, characterized by higher bathymetry, and correspond more to the north Atlantic zone and the Mediterranean, associated with the trammel net, gillnet and pelagic longline (Annex V). It is important to note that for the depth-classes with a strong relationship to a particular gear-type, this variable will not be used in profiling operations; it will be only needed in the analysis as a supplementary variable. |
The next stage is to carry out a typological analysis of fishing operations described by 4 qualitative variables, in which the number of modalities is relatively balanced: species * zone * period * gear. The analysis is made starting from an analysis of multiple correspondences, followed by a Ward classification (see the scheme of analysis in Figure 6). All the other quantitative and qualitative variables associated with fishing operations are preserved as additional (supplementary) variables.
|
The 1 064 fishing operations of the 497 sampled boats of the Moroccan coastal fleet are described by the 4 qualitative variables resulting from preceding classifications, which correspond to a total of 22 modalities (species = 5 classes; zone = 7 classes; period = 4 classes, and gear = 8 classes). Automatic classification is carried out on the factorial coordinates of the fishing operations following an analysis of the multiple correspondences underlining the relations between the classes of species, period, zones and gear-types. The analysis reveals 16 campaign-types grouped in 4 principal branches: 1. seines capturing small pelagic species, characteristic of shallower depths (<125 m), of the geographical ranges 1, 4 and 5 (the central Atlantic and the Mediterranean zones), on hard and sandy bottoms, especially during first semester, 2. drift gillnets, targeting tunas and swordfish, in depth-ranges < 90 m, in summer; 3. longlines, trammel nets and simple gillnets: associated with rocky bottoms, covering all the depth-ranges, more characteristic of zone 2 (Al-Détroit), targeting "prime" species (sea bass, grouper, lobster, swordfish); no characteristic season; 4. trawls (84 %) covering a broad range of depths (30-270 m), in soft substrate, more characteristic of the south Atlantic zone; no characteristic species or seasons. The division of the 4 principal branches into 16 classes, equivalent to 16 campaign-types, makes it possible to refine this very obvious classification. For example, in branch 1 (which covers 120 fishing operations) presented above, a model campaign-type (constituting class 1) can be subsequently described: seiners operating all year round, more characteristically in the second semester (and the first two months of the year), operating in the southern Atlantic zone, catching small pelagics: sardine > anchovy > mackerel > horse mackerel > bonito > bogue; the depth is between 33-101 m (2 characteristic classes: <30 and 30-90), over sandy soft bottoms; the most frequent product destination is the processing factory, then fertilizer, and the market. The average production is 23.8 tons for a trip of one day and there are 3.2 operations per trip lasting 2.3 hours. The campaign lasts 5.6 months. The ports of landing are: Tan-tan, Laayoune and/or Agadir. |
The following step allows us to return to the original objective of the fleet profile by using boat information, such as the calendar of fishing, as a starting point. The fishing calendar, drawn up on the basis of the time spent on the various fishing operations and previously classified by campaign-types, makes it possible to understand exploitation strategies. Exploitation strategies can be defined in various ways. For example it can be a question of the fishing behaviour adopted by the boat over the medium or long term, in terms of gear used, fishing zones visited, species targeted, and fishing period. Such strategies can be studied from a dynamic point of view: the process is then the study of the choices made by fishers over the course of time, or based on a synthesis over a given period (e.g.: an annual calendar of fishing summarizing the number of days spent on the various tactics adopted during each trip, on the different fishing campaign-types adopted over several trips, or in the various methods (for the general-purpose vessels) adopted during the course of the year).
|
The typology of the 497 boats of the Moroccan coastal fleets, from the point of view of exploitation strategies, is based on fishing calendars constructed on the basis of the 16 categories of campaign-type with the addition of a "not fishing" category. Each column of the data-table is described by the number of months during the year spent on the corresponding variable (campaign-type or "not fishing"). Classification of the 497 boats leads to 16 classes again: the majority of the exploitation strategies are characterized by only one campaign-type: changes in fishing operations (75% of the boats took part in two operations) being taken into account in the variability appropriate to the campaign-type (variation in depth, the captured species or the individual zones visited within the same geographical range). Only 6 classes of strategies (a class of sardine boat, two classes of longliners and mixed, and three classes of obligate longliners) are characterized by several campaign-types, indicating important changes in exploitation strategies during the year. We provide here the example of strategy N°16, characteristic of general-purpose boats: Strategy N°16 (n=33): longliner and mixed, characterized by the campaign type N°8 (5.4 months ± 2.1), campaign-type N°11 (2 months ± 1.9), campaign-type N°7 (0.9 months ± 1.5) and/or campaign-type N°9 (0.8 months ± 1.5); boats fully active from June to August (80% active in December); no specific zone, except for the extreme south Atlantic zone and zones frequented more than 40%: A1-A3 or M4-M5; the most reported species: swordfish > others > hake > sea bream = lobster > mottled bass. These boats typically have nets aboard (in fact, many boats coded as type "longliner" possess nets): the number of simple gillnet and trammel net and a greater hold capacity compared to the reported longline vessel average. |
Fleet profiling can be carried out from several perspectives, and with various immediate objectives (managing the activities of the fishing sector, controlling its development, modernization or reorganization of production) as well as, generally, for the purposes of sustainable management and/or a precautionary approach to the exploitation of natural resources.
The results obtained from the analysis of the restricted sample of the fleet are then extrapolated to the whole population of vessels. The proportion of the fleet observed in different classes of the typology can be applied to the whole population, according to the rules of the sample design that established the choice of sample. The identification and description of fleet types remains, though it is appropriate to analyse the structure of the fleet and to provide recommendations according to the objectives behind the typology of fleets. Profiling allows the fishing fleet to be partitioned according to various criteria, from the distribution of fishing vessels in the categories defined on the basis of the ensemble of variables describing an aspect of the fishery (boat equipment, the means by which it was established, fishing strategies). These segments can then be subject to specific measures through fishery and resource management programmes.
|
Conclusions drawn from the typology of Moroccan coastal fleets (Technical Report 14 of Programme UTF/MOR/017/MOR "Technical assistance to the programme of modernization and development of the maritime fisheries sector: technical options for modernization, and strategic implementation plan" (M. Taconet and O. Boumediene, October 1998). "The typological survey, based on a sample of more than 500 vessels, was carried out by the STP team at INRH, between January and October 1996, with technical support from the FAO head office. A statistical expert was brought in to assist with data processing. The results of two typological analyses carried out ("Technical characteristics of the fleet" in May-June 1997, followed by "Strategies of exploitation" in July-August 1997) are as follows: A typological database which offers rich potential for analysis. This information source can perhaps be used by many experts working on problems of development or management. 9 fleet segments: the statistical analyses carried out within the framework of the profile, in collaboration with Moroccan fishery specialists and, in particular, technical experts, made it possible to describe 9 fleet segments based on the technical specifications of the vessels. Within each of the three most dominant groups (trawlers, sardine boats and longliners); three classes were distinguished on the basis of the parameters: geographic location, age, technical capacities (power, gross tonnage) and/or gear used, standard of vessel equipment, and methods of handling the catch. This segmentation provides qualitative and quantitative technical bases for the definition of criteria of eligibility for the modernization programme, and for the evaluation of the financial input necessary to carry out this program. 16 campaign types and 16 exploitation strategies: profiling the strategies of exploitation provided a snapshot of the various "coastal fleet exploitation systems" in 1996. Based on the variables describing the activity of the vessels, it was possible to describe 16 "campaign types", in terms of exploited zones, fishing period, targeted species and gear used. Each vessel might carry out from 1 to 3 of these campaign types during a single year of fishing. The way in which a vessel combines different campaign types identifies its exploitation strategy: 16 exploitation strategies were accordingly described. The profile makes clear certain management and development parameters, such as the biogeographic limits of fishing (North-South and coastal-oceanic), seasonalities, species associations, and fleet interactions. The analysis of exploitation strategies provided, at that point in time, the decision-elements enabling the "exploitation systems" component of the management plan to be developed. |
The fleet profile makes it possible to describe the composition of the fleet, whether it be from the point of view of technical characteristics, fishing activity or fishing behaviour, or fishing results. This information is essential for better appreciating the problems of fishery over-capacity and for making management decisions in connection with fishing effort (the number and types of boat), permitted zones or seasons. The evolution of fishing effort estimated on the basis of broad characteristics of vessels (for example: motorization) does not make it possible to determine the true dynamics of fisheries, notably in the case of composite or multispecies fisheries. To better understand the relationship between fishing effort and impact on the resource requires a better description of the fishing behaviour based on the strategic choices made by fishers.
|
Profiling the fishing tactics of the liners of the artisanal fishery in Kayar in Senegal (Figure 4) made it possible to disaggregate the evolution of fishing effort into categories finer than those used in the fishery statistics system: the number of trips classified according to the 6 types of fishing tactic. At the time of the survey, the effort for the liners was coded according to the type of engine of the boat: without engine, engine < 9 CV and engine > 9 CV. For fishing trips lasting less than 12 hours, effort was measured by the number of trips per category of boat. Illustrated below are the two types of temporal profiles obtained, with the number of trips per type of engine and the number of trips per fishing tactic. The dynamics of the fishery appear in all their complexity in the second case, reflecting a change of tactics by the fishers over the course of time. |
|
|
Fig. |
Fig. |
|
For each tactic, it is possible to locate and track catches of the various targeted species, to better understand the interaction between tactics in terms of the zones visited or the type of boats, and to study the evolution of yields. Illustrated below are two different tactics for the effort-yield relationship: liners catching sea-bream and liners catching grouper. The temporal evolution of the sea-bream liners is very uneven, and yield tracks effort; this fleet is made up primarily of migrant fishermen from the north. Grouper line-fishing shows an increase in effort at the height of the grouper migration period, with a cycle defined by the cool and warm seasons as for sea-bream, but the yield remains stable overall. An increase in the effort devoted to the "grouper" tactic corresponds to a reduction in effort devoted to the "sea-bream" tactic, and reflects a change in fishing tactics. |
|
|
"GROUPER TACTIC" |
|
The presentation of the results of a profiling exercise can be of two types: with the goal of scientific analysis or for presentation to a general audience.
Example of results for the benefit of scientists:
The result of a fleet profile appears in general as a chart summarizing the characteristics of the fishing vessels which were grouped and classified. Only the variables which demonstrate a significant difference between each of the classes and the total population are retained and used in the profile. The characteristics of the table depend on the nature of the variables:
- qualitative variables: the frequency of the modalities of the variables which characterize the class is given. The degree of significance is evaluated as a function of two criteria: the homogeneity of the class (for example: where 80% of the boats of a class have the modality "sardine boat" for the variable " licence-type"); and the specificity of the class (for example: all the sardine boat-longliners in variable " licence-type" might be in the class).
- quantitative variable: the mean and the standard deviation make it possible to evaluate the relevance of the variable in characterizing the class (a variable will be retained as "characterizing" a class when it has a different mean from the total population (total number of boats) in the classification, taking into account the variability (standard deviation) observed between the elements.
|
Given below is the description of the first class obtained in the profile of the technical specifications of the Moroccan coastal fleet. The "V-Test", provided by the SPAD statistical software package, makes it possible to judge the degree of significance of the method or variable in order to characterize the class (an absolute value of the V-Test that is higher than 2 corresponds to a significant probability: the modality or the variable is retained to describe the class. The column headed "weight", on the right, indicates the number in the sample, here the number of boats, relating to the modality. |
|||||||
|
CHARACTERISATION BY MODALITIES |
|||||||
|
V.TEST |
PROBABILITY |
- - PERCENTAGES - - |
CHARACTERISTIC |
|
WEIGHT |
||
|
|
|
CLA/MOD |
MOD/CLA |
GLOBAL |
MODALITIES |
VARIABLES |
|
|
|
|
|
|
36.42 |
CLASS 1 |
|
181 |
|
|
|
|
|
|
|
|
|
|
22.74 |
0.000 |
97.71 |
94.48 |
35.21 |
trawling |
ACDO dominant activity |
175 |
|
17.88 |
0.000 |
97.04 |
72.38 |
27.16 |
trawler |
TYPE type of boat surveyed |
135 |
|
12.00 |
0.000 |
61.69 |
84.53 |
49.90 |
iceP |
CONS method of preservation |
248 |
|
9.81 |
0.000 |
48.47 |
96.13 |
72.23 |
WOOD |
STOCK Method of storage |
359 |
|
9.55 |
0.000 |
60.87 |
69.61 |
41.65 |
insulation |
Iso: insulated hold? |
207 |
|
6.95 |
0.000 |
84.78 |
21.55 |
9.26 |
POLY |
Revet: hold lining |
46 |
|
5.48 |
0.000 |
54.55 |
46.41 |
30.99 |
ORD |
Revet: hold lining |
154 |
|
3.83 |
0.000 |
67.57 |
13.81 |
7.44 |
trawler-sardine boat |
TYPE type of boat surveyed |
37 |
|
2.98 |
0.001 |
60.53 |
12.71 |
7.65 |
Region 10 Laayoune |
REGION |
38 |
|
2.98 |
0.001 |
60.53 |
12.71 |
7.65 |
Laayoune |
PORT Port of survey |
38 |
|
2.91 |
0.002 |
72.22 |
7.18 |
3.62 |
Essaouira |
PORT Port of survey |
18 |
|
2.48 |
0.006 |
56.41 |
12.15 |
7.85 |
Casablanca |
PORT Port of survey |
39 |
|
CLA/MOD is a measure of the specificity of the class and MOD/CLA, a measurement of homogeneity. For example, there are 18 boats in the total sample from the port of Essaouira. Compared to the number in the class (181 boats), the latter does not represent homogeneity for this port (since only 7% of the boats of the class are from Essaouira), but since the majority of the boats from Essaouira are in the class; the latter is thus specific to this port. |
|||||||
CHARACTERISATION BY CONTINUUM
| V.TEST |
PROBA |
MEANS |
STANDARD DEV |
CHARACTERISTIC VARIABLES |
|||
| CLASS |
GENERAL |
CLASS |
GENERAL |
NUMBER.LABEL |
|||
| CLASS 1 |
(WEIGHT = 181.00 NUMBER = 181) |
||||||
| 20.84 |
0.000 |
0.94 |
0.35 |
0.23 |
0.48 |
11.TREU |
Presence of winch |
| 20.82 |
0.000 |
0.94 |
0.35 |
0.24 |
0.48 |
35. |
Presence of trawl |
| 16.61 |
0.000 |
11.96 |
5.71 |
5.60 |
5.98 |
18.AUTO |
Autonomy of boat |
| 15.87 |
0.000 |
2.12 |
0.78 |
1.61 |
1.41 |
23.NBCA |
Number of trawls |
| 14.89 |
0.000 |
751.37 |
357.12 |
410.99 |
422.02 |
46.STPC |
Storage capacity in boxes |
| 14.88 |
0.000 |
2.61 |
0.98 |
2.19 |
1.84 |
22.NBCF |
Number of French trawls |
| 13.28 |
0.000 |
10969.51 |
5480.79 |
6205.50 |
6598.35 |
47.STGL |
Ice storage capacity |
| 10.96 |
0.000 |
43.60 |
26.68 |
22.85 |
24.74 |
117.PRDR |
Radar range |
| 10.29 |
0.000 |
11161.93 |
7198.55 |
6469.88 |
6414.75 |
20.COMB |
Fuel capacity |
| 9.89 |
0.000 |
0.72 |
0.43 |
0.45 |
0.49 |
49.ISO |
Presence/absence insulation |
| 9.69 |
0.000 |
317.51 |
238.43 |
106.68 |
137.50 |
5.CV |
Power of engine |
| 8.91 |
0.000 |
1.42 |
1.15 |
0.28 |
0.41 |
17.HEL |
Size of propeller |
| 8.40 |
0.000 |
51.94 |
38.96 |
20.20 |
26.03 |
3.TJB |
Gross tonnage |
| 8.22 |
0.000 |
2.36 |
1.85 |
0.88 |
0.97 |
112.NBEX |
Number of extinguishers |
| 8.15 |
0.000 |
0.88 |
0.65 |
0.32 |
0.48 |
91.RDR |
Presence radar |
| 7.33 |
0.000 |
0.33 |
0.12 |
0.73 |
0.47 |
24.NBCI |
Number of Italian trawls |
| 7.20 |
0.000 |
0.19 |
0.08 |
0.39 |
0.27 |
93.GPS |
Presence GPS |
| 7.15 |
0.000 |
1.54 |
1.32 |
0.51 |
0.52 |
107.NBRV |
Number radio and VHF |
| 7.06 |
0.000 |
0.56 |
0.36 |
0.50 |
0.48 |
89.RDO |
Presence radio |
| 6.97 |
0.000 |
9.22 |
5.43 |
12.05 |
8.84 |
16.CV+ |
Power of auxiliary engine |
| 6.89 |
0.000 |
2997.78 |
1981.74 |
3201.03 |
2457.35 |
21.EAU |
Freshwater capacity |
| 6.59 |
0.000 |
0.96 |
0.73 |
0.44 |
0.60 |
108.NBRD |
Number radar |
| 6.07 |
0.000 |
0.63 |
0.45 |
0.48 |
0.50 |
9.MOTA |
Presence of auxiliary engine |
| 5.91 |
0.000 |
399.51 |
310.77 |
238.54 |
239.69 |
113.PES1 |
Range of echo-sounder 1 |
| 5.78 |
0.000 |
0.36 |
0.13 |
1.07 |
0.67 |
25.NBC4 |
Number of 4-sided trawls |
| 5.75 |
0.000 |
0.50 |
0.21 |
1.22 |
0.85 |
103.AGPS |
Age of the GPS |
| 5.59 |
0.000 |
18.71 |
16.15 |
2.98 |
4.84 |
1.LONG |
Length |
| 5.24 |
0.000 |
4.33 |
3.12 |
3.97 |
3.88 |
101.ARDR |
Age radar |
| 5.19 |
0.000 |
0.08 |
0.03 |
0.28 |
0.17 |
10.TUYE |
Presence of pipe |
| 4.60 |
0.000 |
2.80 |
2.18 |
2.36 |
1.46 |
2.CREU |
Water drawn |
| 4.12 |
0.000 |
2.13 |
1.87 |
0.97 |
1.01 |
111.NBBO |
Number of buoys |
| 3.59 |
0.000 |
308.47 |
240.87 |
339.74 |
314.07 |
115.PVS1 |
Range video-sounder 1 |
| 3.54 |
0.000 |
0.98 |
0.86 |
0.53 |
0.54 |
105.NBES |
Number of echo-sounders |
| 3.22 |
0.001 |
3.59 |
2.64 |
4.79 |
4.98 |
99.ARDO |
Age of radio |
| 3.17 |
0.001 |
1.00 |
0.97 |
0.00 |
0.18 |
92.CMP |
Presence of compass |
| 2.86 |
0.002 |
0.85 |
0.78 |
0.36 |
0.41 |
85.ES1 |
Presence of Echo-sounder 1 |
| 2.84 |
0.002 |
58.88 |
36.51 |
173.29 |
131.94 |
114.PES2 |
Range of echo-sounder 2 |
| 2.49 |
0.006 |
1.11 |
1.04 |
0.38 |
0.46 |
109.NBCA |
Number of life-rafts |
| The equipment having been coded 0 or 1 (absence/presence), and therefore treated like the quantitative variables, the class mean indicates the percentage of the class possessing the equipment; for example, 94% of the boats in class 1 are equipped with a trawl and a winch, whereas only 35 % of the sample of boats have this equipment: these two variables are characteristic of the class. |
|||||||
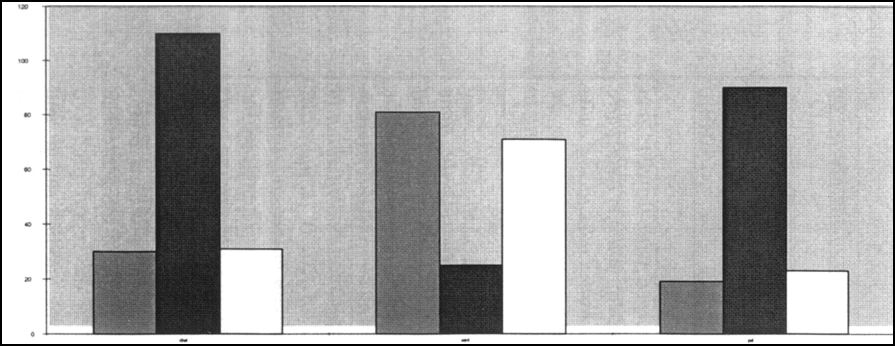
The fleet profile by exploitation strategies, in addition to the tabular summary of the characteristics of the boats belonging to the various strategies, often demonstrates the specificities of strategies in relation to the fishing calendar. For example, one can graphically illustrate the time spent on each strategy in the various specializations, campaign-types or classes of fishing tactic. Figure 9 presents the results obtained from the identification of the exploitation strategies in a sample of 30 fishermen in Kayar (Senegal) (Ferraris in Rochet et al., 1994). These strategies were identified by profiling the fishing calendars or schedules (the number of days spent on the various fishing trips pre-classified into 7 activity-types). The results are summarized in the table below.
Figure 9: Diagram representing the fishing strategies of 30 Kayar (Senegal) fishermen analysed by profiling fishing calendars in 1992.
|
An analysis of the effort - profiles of 30 fishing units that were followed in Kayar over an annual cycle, from 15/12/91 to 15/12/92, was carried out in several stages. Fishing units were characterized according the number of days spent on the various types of activities: line fishing, squid jigging, netting, using mixed lines, mixed line + net, mixed nets, taking a short stop or rest, prolonged stop and travel to another port. The profiling exercise made it possible to demonstrate an interesting structure relating to the objective, highlighting behavioural strategies in respect of the criteria of mobility and the use of a mixture of fishing gears. The first dichotomy of the dendrogram separates class 7 from the fishing units that spend a period greater than 90 days outside Kayar. Class 7, composed 100% of canoes registered at Kayar, is characterized by an average of 80 rest-days over the course of the year. Classes 3 and 4, consisting of Saint-Louisians (migrants from the north of Senegal), are characterized by their practice of alternating "line and set net" mixed fishing, and by a lower than average number of rest-days, translating into intense activity during their stay at Kayar. Classes 1 and 2 are separated from each other by the use of a jig, or not, when fishing for octopus. |
Example of results for the benefit of a non-scientific audience:
Results are presented in the form of graphs (Figure 10) and tables summarizing the principal points. These tables need to be constructed to present the classes obtained according to criteria required by the audience. For example: distribution of the sample number of the classes according to a geographical criterion, the fishing licence or the dominant activity (Table 1). They can also present simple statistics (average ± standard deviation) by class for variables of interest. For example, the variables relevant to a programme of fleet-modernization might be: age of the boats, length, tonnage, power and insulation of their holds (Table 2). A summary drawn from the analysis of these tables gives the principal results of the profile of fleet specifications, in the box below.
Figure 10: Distribution of boats in
the Moroccan coastal fleets, by group, from the first profile of the technical
specifications of the boats, and by type of boat (CHAL: trawler, CHPA:
trawler-longliner, CHSA: trawler-sardine boat boat, DIV: various, SARD: sardine
boat, SECH: seiner-trawler, SEPA: seiner-longliner, PASA: longliner-sardine
boat, PALA: Longliner)
|
|
DOMINANT ACTIVITY |
||||
| CLASSES |
TRAWLER |
SARDINE BOAT |
SEINER-LONGLINER |
LONGLINER-SARDINE BOAT |
LONGLINER |
|
Number of boats in the sample |
175 |
188 |
13 |
3 |
118 |
|
GROUP I |
|
|
|
|
|
|
1 = I.1 |
63% |
|
|
|
|
|
2 = I.2 |
17% |
|
|
|
|
|
3 = I.3 |
18% |
|
|
|
|
|
4 = I.4 |
|
5% |
|
|
5% |
|
GROUP II |
|
|
|
|
|
|
5 = II.1 |
|
36% |
23% |
|
|
|
6 = II.2 |
|
28% |
|
|
|
|
7 = II.3 |
|
43% |
|
|
|
|
GROUP III |
|
|
|
|
|
|
8 = III.1 |
|
3% |
73% |
100% |
|
|
9 = III.2 |
|
<1% |
|
|
75% |
|
10 = III.4 |
|
<1% |
|
|
19% |
|
11 = III.5 |
2% |
1% |
|
|
|
Table 1: Distribution of boats in the sample of Moroccan coastal fleets, classified by dominant activity according to the 11 sub-groups arising from the profile of technical specifications. This table shows the heterogeneity of boats associated with the same dominant activity but which are split amongst several flotillas (for example: the 118 longliners are separated into three groups: 75% in class 9, 19% in class 10 and 5% in class 4). Reading across the rows provides information on the dominant activity (or activities)) practiced by each flotilla.
| CLASSES of |
AGE |
LENGTH(m) |
POWER(HP) |
GROSSTONNAGE(tons) |
INSULATION(% of holds) |
|
GROUP I |
12,8±9,0 |
18,7±3,0 |
317,5±107,0 |
51,9±20,3 |
69% |
|
1 = I.1 |
11,9 ± 7,8 |
18,9 ± 2,4 |
329,5 ± 72,9 |
52,8 ± 13,8 |
66% |
|
2 = I.2 |
16,7 ± 13,0 |
16,1 ± 1,8 |
173,1 ± 36,9 |
29,8 ± 9,7 |
66% |
|
3 = I.3 |
12,2 ± 7,7 |
21,4 ± 2,1 |
432,9 ± 85,6 |
75,2 ± 21,0 |
84% |
|
4 = I.4 |
12,4 ± 9,3 |
14,8 ± 4,4 |
261,0 ± 122,4 |
36,6 ± 18,7 |
70% |
|
GROUP II |
17,3±12,2 |
18,6±3,8 |
270±118,8 |
45,8±25,1 |
25,4% |
|
5 = II.1 |
19,4 ± 14,9 |
15,5 ± 3,0 |
156,8 ± 68,3 |
24,3 ± 12,4 |
29% |
|
6 = II.2 |
17,7 ± 10,9 |
19,9 ± 1,5 |
371,7 ± 93,2 |
57,9 ± 12,3 |
76% |
|
7 = II.3 |
14,6 ± 8,0 |
20,9 ± 3,0 |
337,9 ± 71,3 |
61,0 ± 22,7 |
6% |
|
GROUPE III |
15,2±10,0 |
11,2±3,2 |
95,2±71,0 |
13,3±12,6 |
25,9 |
|
8 = III.1 |
22,2 ±11,9 |
11,6 ± 2,4 |
77,1 ± 33,8 |
10,2 ± 8,8 |
16% |
|
9 = III.2 |
14,9 ± 10,3 |
10,6 ± 2,5 |
82,7 ± 36,6 |
11,0 ± 6,7 |
20% |
|
10 = III.4 |
12,5 ± 5,9 |
11,4 ± 3,3 |
86,6±40,2 |
12,5 ± 8,6 |
48% |
|
11 = III.5 |
12,8 ± 9,5 |
19,5 ± 1,7 |
373,3 ± 81,2 |
60,2 ± 13,9 |
66% |
Table 2: Mean and standard deviation by class of the profile carried out on the technical specifications of the Moroccan coastal fleet (11 classes) and 5 variables of interest for the programme of fleet modernization. The values indicated in bold and italics correspond to variables which show significant differences between the class and the whole sample of boats.
|
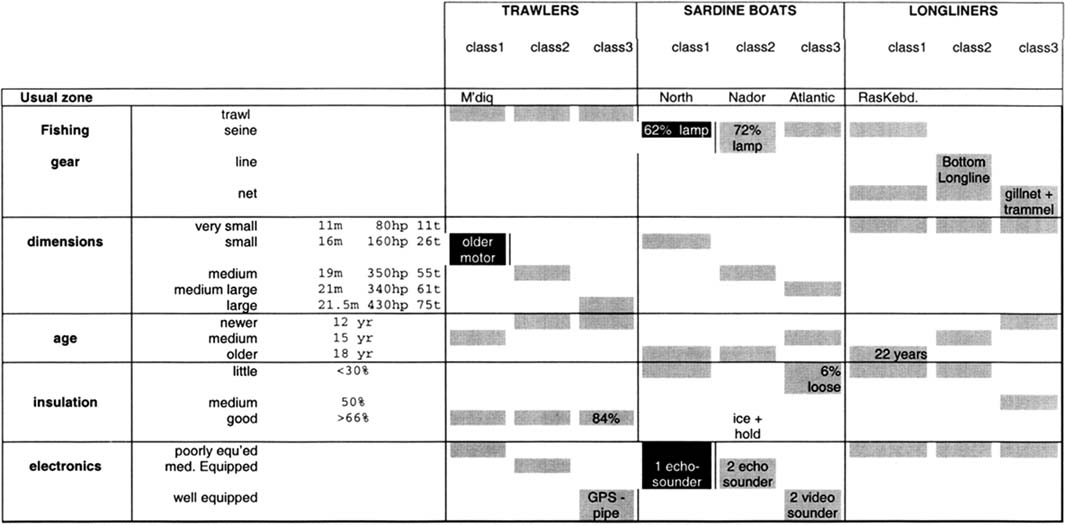
Summary of the results of profiling the technical characteristics of the boats of the Moroccan coastal fleet: The classification of fishing vessels on the basis of vessel technical characteristics, expressed in terms of presence or absence of the equipment, then of their dimensions, makes it possible to globally determine the dominant activity of the boats. Some anomalies however are noted: sardine boats and longliners grouped with trawlers and vice-versa, can appear to correspond with boats that are better equipped, younger and more powerful (greater autonomy, insulated holds with polystyrene coating) than boats of the same category, or conversely with less well-equipped boats. Every assumption remains to be confirmed and analysed individually, as the appearance of boats in a class not corresponding to their category can also result from errors in the data. Taking into account the dimensions of their equipment distinguishes boats sharing the same primary activity according to size, whilst the type of equipment provides a qualitatively based profile. The classes obtained in each group distinguish the types of boats which should be associated with particular fishing strategies: the larger, well equipped trawlers; Mediterranean sardine boats with fishing lights, insulated holds and a large seine (larger than boats fishing in the Atlantic); Atlantic sardine boats without insulated holds (storage of fish is haphazard); Mediterranean sardine boats or longline-sardine boats (older) equipped with gillnet and a small seine; and longline netter/liner or netters with trammel nets and larger gillnets. The age of the boat appears significant only for class III.1, that is, the sardine boats and longline-sardine boats equipped with a small seine, which is smaller, so that fewer are equipped with holds. |
The results can finally be presented in a very general way summarizing the principal points elucidated by the analysis. Figure 12 illustrates the presentation of the profile of the Moroccan coastal fleet according to technical characteristics that was included in the report produced within the framework of technical assistance to the programme of modernization and development of the marine fisheries sector (FAO Project UTF/MOR/017/MOR; Technical Report 14; Annex 4; Taconet and Boumediene, October 1998).
Figure 11: General presentation of the results of a typology of Moroccan coastal fleets according to technical characteristics (adapted from Taconet & Boumedien, 1998).
![]()
![]()
![]()