![]()
![]()
![]()
The demand for concentrate feeds is influenced by a range of socio-economic and technical factors including:
human population growth, economic growth and distribution of income
demand for livestock products and consumption preferences
livestock populations and composition
livestock feeding systems and available feed resources
economic and trade policy and conditions
agricultural development policy
Key factors are human populations and incomes; many other socio-economic factors such as relative prices of different foods, traditional preferences for foods, religious beliefs and factors such as urbanization and education also influence the demand for livestock products. The latter in turn influences the growth and composition of livestock populations, within the limits of other agricultural resource factors (eg existing livestock populations, grazing resources, or opportunities for intensification of livestock production systems).
The composition of livestock populations and the intensity of feeding systems determine the mix of concentrate feeds required. Thus increased monogastric livestock populations and more intensive feeding systems with improved genotypes of livestock result in relatively greater demand for higher quality concentrate feeds. Changes in feeding systems will, however, be constrained or influenced by the need to make the best use of resources available (eg the large quantities of rice bran available in Asian regions, or sweet potatoes in China). Changes in feeding technology, such as better targetted feeding to requirements or the use of specific nutrient supplements (eg amino acids), can also lead to significant changes in demand for some feeds.
Economic and trade policies control the levels of relative prices of livestock products and feed inputs, for example through subsidisation of certain commodities or by trade barriers or incentives. Broader agricultural policy influences factors such as the mix of crops grown, the intensity and costs of crop production, adoption of environmental protection measures, and other factors which may influence the mix of commodities available for feeds. Thus, self-sufficiency, crop diversification, input restriction and latterly liberalization policies in many countries and regions (eg EU) have changed the mix of cereals, oilseeds and pulses locally available for feeds.
This paper does not attempt to quantify the effects of all these factors on demand for concentrate feeds. Following sections outline current predictions of demand based on recent consumption patterns and trends, and review the qualitative effects of the major factors likely to affect demand in the next 10 to 20 years.
The demand for livestock feeds is determined mainly by human populations and their demands for livestock products. A key factor determining demand is the level of economic growth and disposable income. Recent reviews of population growth, economic growth and per capita incomes are summarised in Table 12 (FAO 1993).
Table 12 Population and GDP growth estimates to 2010
|
|
Population in 1989 and growth 1990-2000 |
GDP growth rates (%/year) 1989-2010 |
||
|
Region |
(million) |
(%/year) |
Total |
Per caput |
|
Developed regions |
|
|
|
|
|
W Europe |
399 |
0.2 |
2.7 |
2.5 |
|
N America |
274 |
0.6 |
2.2 |
1.6 |
|
E Europe + CIS (2) |
387 |
0.6 |
0.5 |
0.0 |
|
Others (3) |
182 |
0.9 |
4.2 |
3.4 |
|
Overall developed |
1244 |
0.5 |
2.6 |
2.1 |
|
Developing regions |
|
|
|
|
|
Sub-Saharan Africa |
473 |
3.3 |
3.9 |
0.7 |
|
W Asia/N Africa |
297 |
2.6 |
4.4 |
1.9 |
|
South Asia |
1144 |
2.2 |
5.1 |
3.0 |
|
East Asia |
1558 |
1.5 |
7.0 |
5.7 |
|
C and S America + Carib |
433 |
1.9 |
4.0 |
2.3 |
|
Overall developing |
3960 |
2.0 |
5.3 |
3.4 |
Source: FAO 1993
2. Commonwealth of Independant States of the CIS
3. Japan, Israel and S Africa
Per capita GDP growth is predicted to remain slow in SS Africa and W Asia/N Africa (though increasing from current negative rates). In S and E Asia, however, rates of increase are predicted to be high, of particular significance in view of the already large populations in these regions. Population growth in developed countries will be slow, though recovery in economic growth from the recessions of the late 1980s will allow further advances in per capita GDP, except in EE and the CIS (OECD 1994a and 1994b).
Demand for livestock products generally increases with disposable incomes, expressed as the 'income elasticity of demand' (indicating the percentage increase in demand per 1% increase in income). In developed countries with high incomes and established patterns of consumption at high levels, the income elasticity of demand for livestock products is low and increases in per capita incomes will not greatly affect demand. Table 13 presents examples of typical income elasticities of demand for livestock products determined for certain countries and regions. In developing countries, income elasticity is high and increases in income are closely associated with increases in demand (see also FAO 1989 for additional examples from the 1970s and early 1980s).
Predictions of income growth in developing countries are thus crucial to prediction of demand for livestock products, and livestock feeds. Growth in total demand may be expected to be particularly high in E and SE Asia.
Table 13 Income elasticities of demand for livestock products in developed and developing countries
|
|
Income elasticities for different livestock products |
||
|
Region/country |
Meat |
Milk |
Eggs |
|
Developing countries |
|
|
|
|
Sub-Saharan Africa (1) |
0.79 |
0.68 |
1.05 |
|
(2) |
0.98 |
0.82 |
1.10 |
|
South Africa (3) |
0.44 |
|
|
|
Mexico (3) |
0.47 |
|
|
|
Brazil (3) |
0.76 |
|
|
|
Philippines (3) |
3.98 |
|
|
|
S Korea (3) |
1.25 |
|
|
|
|
|
|
|
|
Developed countries |
|
|
|
|
USA (3) |
0.05 |
|
|
|
Australia (3) |
0.08 |
|
|
|
Japan (3) |
0.23 |
|
|
1. Sarma and Yeung 1985, cited by Winrock International (1992)
2. Jahnke (1982), cited by Winrock International (1992)
3. Blandford and Guntz, 1988.
Rapid urbanization will be a major demographic factor in developing countries over the next thirty years. Urban populations currently account for about three quarters of total populations in the developed world but only one third in developing countries (less in SSA but more in Latin America and Asia) (see Table 14). Urbanization rates will not increase markedly in the developed world as migration and birth rates have stabilised. In developing countries, urban populations are now growing at over twice the rate of total populations (4%/year cf 2.0%/year), mainly through immigration and lower urban death rates. By 2025 some 56% of developing country populations will be urbanized (raising the global average urbanization rate to over two thirds of the global total population) (see World Resources Institute 1994).
Urbanization affects the livestock sector on both supply and demand sides. On the demand side, urbanization stimulates changes in consumption patterns. This is partly due to associated increases in incomes and purchasing power (at least for a proportion of the population), but also to changes in life-style, and in the relative prices and convenience of different foods (see Scott 1993, Scott and Okali 1993, Von Braun, McComb, Fred-Mensah and Pandya-Lorch 1993).
Table 14 Growth of urban populations and urbanization percentages in developed and developing countries 1950-2010
|
|
Urban populations and urbanization percentages 1950-2010 |
||||
|
|
1950 |
1970 |
1990 |
2010 |
|
|
Region |
Urban populations (millions) |
||||
|
Developed countries |
450 |
700 |
870 |
1020 |
|
|
Developing countries |
280 |
650 |
1510 |
3050 |
|
|
World |
730 |
1350 |
2390 |
4070 |
|
|
|
Urbanization percentage (% total population) |
||||
|
Developed countries |
54 |
67 |
73 |
78 |
|
|
Developing countries |
17 |
25 |
37 |
52 |
|
|
World |
30 |
37 |
45 |
56 |
|
Source: WHO, Meslin (1995)
The key factor affecting demand is income, with effects as described in Section 3.1.1. above. Changes in lifestyle include factors such as occupational patterns, time constraints and the consumption of prepared and convenience foods, but also changes in health, life expectancy and education which may affect diets. Relative prices of foods are affected by factors such as transport and preservation costs and methods. Foods which can be produced in intensive systems in proximity to urban areas and which are more easily transported and traded may become relatively cheaper and more accessible than others. Thus poultry egg and meat and cattle milk consumption often increase in relation to beef (as in Brazil, see Lynam 1989)
On the supply side, the concentration of production in peri-urban and associated rural areas often leads to intensification of production systems, particularly of landless systems such as poultry, pig and dairy production. Various factors encourage such intensification, including pressures on land, the concentrated availability of certain feeds (eg brans, oilmeals and other crop processing by-products and waste feeds), and access to large markets allowing the development of large-scale enterprises with potential for economies of scale.
Urbanization may thus influence the types of livestock production systems carried out and the demand for feeds independantly of either human population or income growth. These effects are, however, largely accounted for in the FAO (1993) projections of increases in consumption and production of different livestock commodities and demand for feeds (as shown in Table 16, in Section 3.1.4 below) since the projections are based on current trends including the effects of urbanization to date.
Relative demand for different livestock products varies considerably between regions and countries of the world, based on traditional preferences, comparative advantages for production, relative prices, and considerations such as religious beliefs, diet and health, and ethical and environmental concerns.
Per capita demand for all meat in 1990 was estimated at 77.4 kg and 14.5 kg in developed and developing countries respectively (FAO 1989), illustrating the potential demand for increased consumption with economic growth. Recent trends indicate more rapid increases in meat consumption in developing than developed countries, even in per capita terms (2.8% and 1% per year respectively, FAO 1989, and FAO 1993, see Tables 15 and 16 below).
Pig meat comprises the largest proportion of global meat consumption (38% in 1990), followed by beef (32%), poultry (21%) and sheep and goat meat (6%). In recent years, while the global total consumptions of all types of meat have increased, there have been slower rates of growth in consumption of beef and small ruminant meat than of poultry and to a lesser extent pig meats in both developed and developing countries. The main reasons for this have been the great increases in productivity and reduction in relative prices of poultry and pig meats (see FAO 1989). Ruminant productivity has not increased and beef in particular has, until recently, been subject to production price support in many countries raising costs to consumers (eg EU, Japan). Consumption of beef has recently declined in N America and parts of W Europe prompted, in developed countries, by concerns over diets and health. Consumption of poultry meat has increased also as a result of improved preparation and marketing of convenience products. Urbanization and the consequent ease of market access by peri-urban poultry and pig enterprises is also likely to be a factor.
The following sections briefly review market prospects for livestock products in different regions of the world.
OECD developed countries Consumption of livestock products is already at a high level in these countries and demand elasticities are low. No substantial increases in total demand are therefore likely to occur (OECD 1994a). Some shifts in demand are expected between products based on relative prices (eg away from beef to poultry meat), and on issues such as health (reduced consumption of fats and cholesterol from milk products and red meats). Ethical considerations in relation to husbandry, transport and slaughter methods may further reduce consumption of some products (eg veal and beef).
Predicted changes in aggregate production to the late 1990s in OECD countries are for roughly stable milk production (no increase in EU, small increase in USA), and slightly increased overall meat production (at about 1.5% per year), with relatively greater increases in poultry meat production, small increases in pork production and roughly constant beef production, (OECD 1994a). Consumption of meat is expected to continue to increase in Japan, where income elasticity of demand is still relatively high (FAO 1989), though population growth is expected to remain low.
Some differential adjustments in livestock output are expected in different OECD countries. Production will continue to decline in Canada until the late 1990s in response to trade liberalization measures (GATT and NAFTA, see Section 3.3.) and to rise in the USA. Recession in the EU reduced production marginally in the period 1990-93 and effects of CAP reform and GATT will be to further reduce production throughout the 1990s until modest increases early in the next century (Oil World 1994). Market liberalization will also result in reduced domestic productionof livestock products in Japan, despite increased consumption.
Eastern Europe and the former USSR There are considerable uncertainties over trends in demand and production in Eastern Europe and the countries of the former Soviet Union. Recent reductions in livestock populations and production due to changes in government support, reduced credit and input supplies, and reductions in demand due to falling incomes, may take some time to reverse. Livestock production in the former USSR in 1993 was 25% lower than in 1989, with per capita consumption declining by 28% as populations continued to grow (Oil World 1994). FAO (1993) expectations are that per capita consumptions of livestock products may return to pre-reform levels by 2010. Demand for livestock feeds will thus remain depressed for the foreseeable future. Similar reductions in production have occurred in E European countries.
Developing countries
C and S America Following a decade of low or negative economic growth, most countries of C and S America are now predicted to have improving growth rates over the next 15 years. Allied to moderate population growth, the region will experience moderate increases in per capita incomes and consumption of livestock products. Some countries will experience rapid increases in demand and production, including Brazil and Argentina. Total livestock production is expected to more than double in Brazil over the period 1988-92 to 2008-12, and per capita production to increase by over 50% (Oil World 1994).
Despite its historical importance in the region, per capita consumption of beef has recently plateaued or declined in some countries. In contrast, poultry meat consumption has increased rapidly; poultry production in the region increased at an annual rate of 9% over 1968-84 (Lynam 1989). In Brazil, in the early 1990s, annual rates of increase in production of poultry meat were 9-11%, and of beef 3.8% (FAO 1992). In Mexico and Argentina, similar relative increases in poultry production are underway. Since most beef is produced from grazing and poultry from intensive concentrate feeding systems, considerable changes in demand for livestock feeds are also occurring. Some countries, such as Peru and Chile, which are partly reliant on imported feeds, have experienced periodic difficulties in foreign exchange availability and short-term reductions in production and consumption of poultry meat; long-term predictions are for increased production and consumption with economic growth.
Sub-Saharan Africa Despite large population growth, and rapid urbanization (to 36% by 2000 and 55% by 2025, Winrock International 1992), demand for livestock products will remain dependant on increases in incomes. Per capita incomes have declined or risen only slowly in recent years but are now expected to grow slowly as a result of changes in economic policy and in response to current adjustment programmes (Table 12). Increases in demand and livestock production are estimated at between 3.5-4.0%/year (FAO 1993, Winrock International 1992 respectively). Greater increases in production are expected from pigs and poultry (5.2%/year) than from beef and other red meats (3.6%/year), resulting in a shift in demand for livestock feeds towards higher quality feeds for monogastric livestock. Considerable scope exists also to improve the productivity and efficiency of milk production with suitable concentrate feeds.
West Asia and N Africa Through the 1970s and 1980s, meat consumption rose rapidly in this region as per capita incomes and populations increased, particularly in oil-rich states. Consumption preference in the region has traditionally been for sheep and goat meat, though consumption of beef has increased and of poultry meat trebled in the 10 years to the mid 1980s (FAO 1989). Population growth is predicted to remain rapid in this region through the 1990s. However, because of only moderate increases in incomes (and some recent declines in oil-rich states), relatively small increases in per capita consumption of meat (0.9%/year) and dairy products (0.5%/year) may be expected to the year 2000 (OECD 1993). Resultant increases in total demand for livestock products are predicted to be 3-5%/year in the region.
Asia Asia is considered by the international feed manufacturing and trading industry as the most promising market of the future, mainly as a result of rapid economic growth and increases in per capita incomes on the base of large populations (Table 12). Between 1980 and 1990, annual per capita GDP growth was 7.8% in China and 3.2 and 3.9% in India and Indonesia respectively (World Bank 1993).
However, consumption of livestock products in Asia depends not only on economic growth but also on religious followings and cultures. This is, for example, reflected in the low per capita consumption of meat, especially beef, in India. Consumption of pig meat is low in some mainly muslim countries (eg Pakistan, Bangladesh, Malaysia and Indonesia). Pig meat consumption is however very high in much of E Asia (China, Japan) and SE Asia (Vietnam). Poultry meat consumption has been increasing rapidly throughout the region, including India.
Some countries have already achieved quite high levels of consumption of livestock products (such as Taiwan, S Korea, Malaysia and Singapore), whereas there is still scope for increased consumption in the large populations of China, India, Indonesia, Pakistan, Vietnam and others. Overall, growth rates in demand for livestock products and feeds are expected to be in the range of 6-10%/year. Estimates for China are 4.6%/year in view of potential problems of supplying the necessary feeds (FAO 1993). Poultry and milk production are predicted to rise relatively faster than beef and other meat production. China is expected to show the highest rate of increase in livestock production in the world over the 20 years to 2012, with increases in annual total production to 2.4 times 1988-92 levels. Total production in India will double over the same period (Oil World 1994).
Recent and predicted changes in the production of different types of meat and milk in developing countries are summarised in Table15 (FAO 1993). These figures confirm the general trend across regions for relative increases in poultry and pig meat production.
Table 15 Rates of growth in meat and milk production in developing countries
|
|
Production 1988/90 |
Annual growth rates (%/year) |
|
|
Product |
(million mt) |
1970-90 |
1988/90-2010 |
|
Beef |
18.6 |
2.2 |
2.7 |
|
Mutton |
4.9 |
2.8 |
3.1 |
|
Pork |
28.3 |
6.1 |
4.0 |
|
Poultry meat |
12.9 |
7.0 |
5.1 |
|
Overall meat |
64.8 |
4.6 |
3.8 |
|
Milk |
147.3 |
3.5 |
2.5 |
|
Net trade in milk (2) |
-16.2 |
5.8 |
2.2 |
Source: FAO 1993
2. Predicted shortfall in developing country production made up by imports from developed countries
Predicted growth rates of livestock production and demand for cereals for concentrate feeds in developing and developed countries are summarised in Table 16 (FAO 1993). Rates of increase in cereal feed-use are predicted to roughly match those of total livestock production. This is because a relatively high proportion of the increase in overall livestock production is predicted to come from poultry and pigs, with high cereal feed requirements, as well as from some intensification of other (ruminant) production systems. Even higher rates of increased use of oilmeals are predicted (FAO 1993). Increased demand for feeds will be stronger in developing than in developed regions. Particularly high growth rates of feed demand are predicted for E Asia, maily due to China. Growth rates are predicted to rise in SSA (from the current very low usage and restricted growth).
Overall global demand for cereals for livestock feed is predicted to rise by 34% over the period 1988-90 to 2010 to 854 million mt. Demand in developed regions will increase by only 9%, while that in developing regions will more than double (+112%). Under the predictions of FAO (1993) 'Agriculture Towards 2010', these increases are presumed to be met from feasible increases in production (see Chapter 4). OECD (1994) predictions are for an 11% increase in utilization of coarse grains in OECD countries from 1990-92 to 1998/99, with similar proportional increases in both feed and other uses (eg industrial and beverage uses). Increases in wheat utilization are estimated at 4% over the same period, with much of the increase due to increased feed use, particularly in the EU where reduced cereal prices are expected to stimulate feed consumption.
Table 16 Growth in total livestock outputs and use of cereals for livestock feed
| |
Use of cereals (million mt) |
Growth rates (%/year) |
||||
|
Livestock output (1) |
Cereal feed use |
|||||
|
1988/90 |
2010 |
1970-90 |
1988/90 |
1970-90 |
1988/90 |
|
|
Region |
|
|
|
-2010 |
|
-2010 |
|
Developed countries |
|
|
|
|
|
|
|
E Europe + former USSR |
189 |
172 |
2.1 |
0.3 |
2.2 |
-0.4 |
|
Other developed (2) |
294 |
355 |
1.7 |
0.8 |
0.7 |
0.9 |
|
Developing countries |
|
|
|
|
|
|
|
Sub-Saharan Africa |
1.8 |
4.3 |
3.2 |
3.5 |
1.3 |
4.2 |
|
W Asia/N Africa |
31.6 |
64.5 |
4.6 |
3.7 |
7.2 |
3.5 |
|
S Asia |
2.9 |
5.3 |
4.5 |
3.2 |
4.4 |
2.9 |
|
E Asia |
73.0 |
174 |
7.0 |
4.3 |
6.5 |
4.1 |
|
C and S America + Caribb. |
44.6 |
78.9 |
3.8 |
2.8 |
3.8 |
2.8 |
Source FAO 1993
1. 'Feed index weighted' livestock output calculated to sum production of meat, milk and eggs
2. OECD countries
Global demand for oilcakes and meals is also expected to rise, though at a declining rate (Oil World 1994). Annual consumption of the 12 main oil meal commodities (including fishmeal and maize germ meal and gluten feed) is predicted to rise 58% from 137 to 216 mill mt per year over the 20 years from 1988-92 to 2008-12. Annual growth rates of consumption were 5% over the 20 years to 1982 but slowed to 3% in the 10 years to 1992 and are expected to decline further to 2% over the next 20 years. Reduced growth rates are due to reduced livestock production and demand in the countries of the former USSR, the near saturation of demand for livestock products in industrialized countries, and anticipated reductions in rates of utilization of oilmeals per tonne of livestock output in some areas, especially in the EU and Japan (Oil World 1994).
Nevertheless annual demand over the 20 years to 2012 (expressed in soyabean meal equivalent) is expected to rise in the USA by over 8 mill mt (+36%), as livestock output increases, and to grow strongly in developing countries. Annual consumption in China is expected to increase by over 12 mill mt (+126%) and similarly in India (6 mill mt, +83%) and Brazil (5.4 mill mt, +153%). Large percentage, though smaller absolute, increases in consumption are predicted also for Argentina and Indonesia (Oil World 1994).
The demand for concentrate feeds depends in part on the types of feeding systems operated and the nature of feed resources available. Thus, for example, the amounts and types of protein or energy supplements required for ruminant diets depend on the nature of forage feeds available. In monogastrics, the increased availability or lower costs of particular feeds may have implications for demand for balancing feeds.
A recent example is illustrated in Appendix 4 Table 1. EU policies to increase cereal prices and to promote the production of home-grown proteins such as rapeseed in the 1980s, resulted in the increased use of cereal milling by-products and rapeseed meal in pig diets. In order to meet essential amino acid requirements, higher total protein levels were required with these ingredients, supplied by greater combined amounts of rapeseed meal and soyabean meal than in the former cereal/soyabean meal diets. Higher dietary total protein levels also resulted in greater nitrogen excretion per unit of product even at similar performance levels.
As indicated in Section 3.2.1. below, such changes in the mix of available feed resources are likely to continue to occur, especially for commodities such as oilmeals for which production is partly determined by demand for other (non-feed) products (eg cotton fibre, edible oils and industrial oils). Similar considerations apply to the available mix of cereal milling residues which will be dependant on preferences and demand for direct food consumption of cereals.
Apart from such responses to changing resource availability, feeding systems may also be manipulated in various ways in order to reduce the demand for concentrate feeds. These include:
Multi-phase feeding to adjust nutrient supply frequently to match the needs of the animal as these change through growth and reproductive cycles
Supplying of essential nutrients in specific forms (eg essential amino acids instead of crude protein, and specific minerals and vitamins)
Increasing the digestibility of diets through selection of more digestible ingredients or treatment
Improving feed conversion efficiency by ensuring appropriate levels of productivity for the quality and quantity of feeds available.
Multi-phase feeding Nutrient requirements of livestock change progressively over production cycles and can be better matched by supplying a number of different diets rather than just one for the whole period. Limited multi-phase feeding is commonly applied in more intensive production systems, for example by feeding different diets for pregnant and lactating sows, or for broiler starters, growers and finishers, or for laying hens in early or late stages of lay. Illustrations of the benefit, in terms of nitrogen economy, of multiphase feeding systems for both growing and breeding pigs are shown in Appendix 4 Table 2 (after Lenis 1985). Thus, total protein requirements can be reduced by over 4% by 3-phase compared to 2-phase feeding of growing pigs for the same levels of output, and by over 16% by 2-phase feeding of breeding sows. Similar considerations apply to feeding of milking cattle. In more advanced systems, technology now exists to provide many more dietary phases to animals to further reduce concentrate feed requirements.
Feeding essential nutrients Probably the most important example of feeding specific nutrients is that of essential amino acids in non-ruminant diets. It is technically possible to satisfy amino acid requirements within reduced total protein intakes by supplementing diets with high quality protein sources, including bloodmeal, fishmeal or with synthetic amino acids. Flikweert (1989) showed in the Netherlands that the protein level of pig diets could be reduced by 3 percentage units by the use of synthetic amino acids, without affecting performance. Similar results have been achieved in France (Gatel and Grosjean 1991). Diet formulations with bloodmeal and crystalline amino acids could reduce vegetable protein use (including soyabean meal) by over 40%, though at increased cost.
Similar arguments may be applied to feeding of certain minerals such as phosphorus (P). Dietary phosphorus is supplied from two very different sources: organic P from plant material, much of which is bound in phytate complexes, and inorganic P from animal protein and mineral sources. Phytate P is only partially available to animals, depending on the presence and activity of phytase enzymes. Uncertainty over plant P availability has led to over-supplementation with additional inorganic P to prevent deficiency, thereby increasing demands for P and environmental loads through wastage. The proportion of phytate P is now known to vary between crops (eg. beans 30% and sunflower 80%, Jongbloed and Kemme 1990), and within crops depending on soil conditions and climatic factors (Reddy et al 1982). Variations also occur in phytate P availability in the animal (ranging from 10-45% in the pig, for example). The functioning of phytase enzymes is becoming better understood, with prospects for better diet formulation and reductions in requirements for P supplements per unit of product output (see Pointillart et al 1987, Pointillart 1988, Jongbloed and Kemme 1990). Similar considerations apply to other minerals for pig feeding (Whittemore and Manson 1995).
Improving diet digestibility Improving the digestibility of the diet has a direct effect on feed requirements, and on manure output. Thus, an improvement of feed digestibility from 85 to 90% leads to approximately 5% reduction in feed requirements and a 33% reduction in faecal output. Such effects can be achieved in a number of ways: by the selection of more digestible ingredients and the avoidance of those containing anti-nutritional factors; by treatment of feeds to improve digestibility (eg by the use of enzymes); or by modification of the intestinal microflora to reduce protein degradation.
For protein, industrial and animal sources are potentially more digestible by non-ruminants than vegetable protein feeds. The ileal digestibility of lysine hydrochloride by pigs is accepted to be 100% (Eurolysine 1992), and that of good quality bloodmeal 93%. These are substantially higher values than for commonly used vegetable protein sources, such as soyabean (85%), rapeseed meal (73%) and sunflower meal (74%).
The use of enzymes can greatly increase the digestibility of dietary components, and could make lower quality protein sources more competitive. Research suggests that protein digestibility may be improved by up to five percentage points and faecal nitrogen and organic matter output reduced by as much as 20% by enzyme treatment of feeds. Other methods include the regulation of intestinal flora by the use of growth promoters which has been shown to improve digestibility in non-ruminants by around two percentage points.
Improving feed conversion efficiency Better animal performance due to higher genetic potential, or better health and environmental conditions, is generally accompanied by a reduction in feed required per unit of product output. This applies to both non-ruminant and ruminant livestock. Thus, faster growth rates and shorter feeding periods may result in reduced feed requirements for a certain liveweight gain in beef cattle (an example is shown in Appendix 4 Table 3). Similar effects may be noted in growing pigs and broiler chickens. For breeding populations, improvements in feeding may have marked additional effects on reproductive performance leading to reductions in the breeding populations required and greater efficiency of overall feed-use. The efficiency of milk production in less intensive systems can also be improved by this means, through increases in annual average milk yields. In more intensive milk production systems, however, increased yields require increasing amounts of concentrate feeds both in absolute terms and per unit of output (though feed-efficiency measured over all feeds including forages may continue to increase with increasing productivity, as shown in Appendix 4 Table 4).
The supply of most concentrate feeds is ultimately dependant on the production of crop commodities. Availability is locally dependant on trade and on factors affecting the relative demand and distribution of commodities between human food, industrial and feed uses. Trends in total production, and the effects of trade and other factors are reviewed in following sections.
Total outputs of coarse grains, wheat and oilseeds The major crops providing concentrate feed commodities are. Roots and tubers and pulses are less important sources. Recent trends in regional annual production of coarse grains, wheat and oilseeds are reviewed in Table 17 (including production for all uses as human food, livestock feed, industrial raw materials and seed). Data presented in following sections are summarised from analyses of areas cropped, yields and total production of different commodities presented in Appendix 5 (Tables 1 to 4).
Global average annual production of coarse grains, wheat and oilseeds amounted to 829, 543 and 222 million mt respectively over 1990-92. Annual production of these commodity groups increased by 23%, 30% and 70% respectively between 1975/77 to 1990/92.
Table 17 Total production of coarse grains wheat and oilseeds in world regions 1975/77 to 1990/92
| |
Average annual production in 1990/92 (million mt), and growth 1975/77 to 1990/92 (%) (1) |
|||||
|
Coarse grains |
Wheat |
Oilseeds |
||||
|
Region (2) |
Prod'n (mill mt) |
Growth (%) |
Prod'n (mill mt) |
Growth (%) |
Prod'n (mill mt) |
Growth (%) |
|
Developed regions |
|
|
|
|
|
|
|
North America |
264.3 |
22.2 |
85.9 |
4.6 |
69.6 |
38.9 |
|
Western Europe |
97.2 |
12.2 |
94.6 |
77.2 |
13.4 |
436 |
|
E Europe and CIS |
146.0 |
6.6 |
110.5 |
-9.7 |
15.6 |
12.2 |
|
Oceania |
8.3 |
51.0 |
10.7 |
-12.3 |
1.2 |
140 |
|
Developing regions |
|
|
|
|
|
|
|
C and S America |
71.3 |
32.0 |
18.9 |
-2.1 |
40.6 |
115 |
|
W Asia and N Africa |
27.1 |
44.1 |
46.5 |
59.2 |
3.6 |
20 |
|
Sub-Saharan Africa |
40.5 |
25.8 |
4.6 |
27.8 |
6.2 |
-10.1 |
|
S Asia |
36.2 |
7.4 |
73.3 |
78.3 |
26.0 |
111 |
|
SE Asia |
15.2 |
70.8 |
0.1 |
- |
10.4 |
62.5 |
|
E Asia |
114.9 |
59.1 |
97.5 |
91.2 |
34.6 |
126 |
|
World |
829.2 |
22.9 |
542.6 |
30.9 |
222.2 |
70.3 |
1. Source: Analysis of USDA PS&D data, calculated as three year averages 1975-77 and 1990-92
2. World regions as defined in Appendix 1
Coarse grain production is concentrated in developed regions plus E Asia (mainly China) and C and S America. Increases in coarse grain production have been particularly marked in developing regions (SE Asia, E Asia, W Asia and N Africa and C and S America), with important increases also in N America. Wheat production is also centred in developed regions plus S and E Asia (Pakistan, India and China), with particularly marked increases in W Europe (mainly in the EU), and notable increases in S and E Asia.
Oilseeds production increased by almost 50% in developed regions over the period, but more than doubled in developing regions, particularly in C and S America, S Asia and E Asia. A very large increase in production occurred over the period in W Europe, though from an initially relatively low level, mainly due to domestic support policies in the EU.
Annual production of all roots and tubers commodities in 1991/92 (not shown in Table 17) totalled 597 million mt (fresh weights) (see Table 4, Appendix 5). Major producing regions included E Asia (China) with 150 million mt, SS Africa (129 mill. mt) and E Europe and CIS (130 mill. mt).
Trends in production Trends in production of coarse grains, wheat and oilseeds are illustrated in Table 18. In general, annual percentage growth rates in production of commodities were lower in the more recent period 1985/87 to 1990/92, than in the period 1975/77 to 1985/87. The reasons for this have been mainly attributed to economic recession, changes in agricultural support practices in the developed regions, and economic transition in Eastern Europe and the CIS.
Table 18 Trends in production of coarse grains, wheat and oilseeds from 1975/77 to 1990/92 by world regions
| |
Annual percentage growth in production (% per year) (1) |
||||||
|
Coarse grains |
Wheat |
Oilseeds |
|||||
|
Region (2) |
1975/77- 1985/87 |
1985/87- 1990/92 |
1975/77- 1985/87 |
1985/87- 1990/92 |
1975/77- 1985/87 |
1985/87- 1990/92 |
|
|
Developed regions |
|
|
|
|
|
|
|
|
North America |
2.34 |
-0.62 |
0.73 |
-0.55 |
2.87 |
0.92 |
|
|
Western Europe |
1.83 |
-1.30 |
4.20 |
3.26 |
15.2 |
5.70 |
|
|
E Europe and CIS |
1.38 |
-1.44 |
-0.12 |
-1.80 |
1.49 |
-0.60 |
|
|
Oceania |
4.04 |
0.28 |
3.10 |
-8.23 |
8.74 |
3.05 |
|
|
Developing regions |
|
|
|
|
|
|
|
|
C and S America |
1.77 |
2.06 |
1.18 |
-2.69 |
5.96 |
3.77 |
|
|
W Asia and N Africa |
2.48 |
2.40 |
1.71 |
6.08 |
1.75 |
0.59 |
|
|
Sub-Saharan Africa |
2.31 |
0.28 |
0.92 |
3.09 |
-0.83 |
-0.43 |
|
|
S Asia |
-1.41 |
4.36 |
4.80 |
2.21 |
3.34 |
8.73 |
|
|
SE Asia |
4.81 |
1.37 |
9.71 |
-6.12 |
3.52 |
3.00 |
|
|
E Asia |
2.31 |
4.85 |
6.04 |
1.23 |
8.04 |
0.91 |
|
|
World |
1.88 |
0.39 |
2.38 |
0.69 |
4.23 |
2.38 |
|
Source: Analysis of USDA PS&D data
1. Calculated as compound annual percentage growth rates between three year averages for production over 1975-77, 1985-87 and 1990-92, as shown in Appendix 5
2. World regions as defined in Appendix 1
In developing regions, trends have been more variable. Notable features have been the continued growth in production of coarse grains (mainly maize) in S Asia and E Asia (especially India and China), growth in wheat production in W Asia/N Africa and in SSA, and growth in oilseeds production in C and S America, S Asia (India) and SE Asia (Indonesia and Malaysia). In the period 1985/87 to 1990/92, however, many regions experienced declining per capita production of these commodities which have yet to be fully restored (see 'The State of Food and Agriculture', FAO 1994).
Trends in cropped areas and crop yields Trends in the areas cropped and yields of coarse grains, wheat and oilseeds are presented in Appendix 5, Tables 5 to 7. For coarse grains and wheat, trends have been for declining areas under production but increasing average yields, particularly in developed regions. Yield increases slowed in developed regions over the more recent period 1985/87 to 1990/92 but continued strongly in developing regions (especially C and S America and all Asian regions).
For oilseeds, production increases have mainly derived from increased areas of cropping. Yield increases have been low, particularly over the recent period (except in S Asia where yield levels were formerly very low).
Yield levels of all commodities generally remain lower in developing than in developed regions, offering possibilities of further increases in production in developing regions.
Trends in the production and consumption of the major feed commodities are reviewed briefly in following sections, to indicate likely changes in cropping and feeding systems. The analyses presented are derived mainly from 'Agriculture Towards 2010' (FAO 1993) which takes account of trends in population and economic growth, economic and trade policy development, technology adoption, input supplies and other factors affecting production, on the basis of historical and recent trends in production. Additional predictions are based on data provided by US Feed Grains Council annual reports (1994), Oilworld (1994) and OECD analyses (OECD 1994a and b). Other information on current production is derived from the USDA PS&D database.
Cereals The production of both food grains (rice and wheat) and coarse grains are predicted to increase over the period 1988/90 to 2010, at rates which allow increased per capita consumption (though it is estimated that this will still not be adequate to meet all food needs in 2010, FAO 1993). Growth rates of coarse grain production (mainly maize) are expected to exceed those of food grains because of the growth in demand for livestock products (FAO 1993, US Feed Grains Council 1994). Coarse grains will thus increase in importance in both cropped areas and concentrate feed-use.
Maize production is widespread in both the tropics and sub-tropics. The USA is by far the most important producer (34% of world total production), followed by China (22%), Brazil (7%) and the EU (6%) (USDA PS&D 1994). Mexico, South Africa, Argentina, India, E Europe, the CIS and some countries of SE Asia and SS Africa are also important producers. Barley production is concentrated in the temperate zones, with the CIS, E and W Europe and Canada dominant, and in W Asia and N Africa. Sorghum is produced in drier zones; the USA, India, SS Africa and China are the main producers, with minor though increasing production in Argentina and Mexico.
Increases in OECD grain production are predicted to amount to 11% for coarse grains and 4% for wheat over the period 1990/92 to 1998/99 (OECD 1994a). The USA is expected to contribute the bulk of this increase, with additional increases also in Australia and Canada. In developing countries, the scope for increased production of maize is moderately high, particularly in C and S America and SSA. In these regions, both area expansion and increased yields are expected over the next 20 years. For sorghum, increases in production may be more modest. While there is scope for area expansion, yield increases are less likely since much of the production occurs in the less reliable semi-arid rainfall areas of SS Africa and C and S America (FAO 1993).
Some importing countries may face the greatest pressures to raise domestic production by unsustainable intensification, increased use of marginal lands, or increased competition with food crops. In countries with more liberal trading policies and rapid economic growth, such as in Mexico, reduced subsidisation may allow increased imports and a contraction of production to more suitable croplands.
Oilseeds and meals Soya bean meal is by far the most important protein concentrate feed. The major soya bean producers (and exporters) include the USA (42% of world production in 1993), Brazil (21%), China (13%), Argentina (11%) and India (4%) (USDA PS&D 1994). Demand and world trade are expected to continue to increase (FAO 1993); production is forecast to increase at 3.6%/year, faster than any other crop. Production increases which have been particularly rapid in Latin America (> 10%/year in the 1980s, especially in Brazil and Argentina) and in India and Indonesia are expected to continue, though at reduced rates.
Other oilseeds have shown similar expansion in production, particularly rapeseed and sunflower important for oil production. Production of rapeseed is concentrated in Canada, EU, China and India. Increases in production could occur in E Europe and the former USSR. Sunflower production is more widespread; recent increases in production have occurred particularly in Argentina, EU, India, China and W Asia. E Europe and the former USSR are large producers with scope to increase production. Southern and South Africa have also shown increasing production from currently low levels.
Groundnut production has not increased so rapidly as other oilseeds in recent years, and prospects are for continued modest expansion. China, India, W Africa, USA and Indonesia are important producers. The crop is grown in other parts of Africa where there is scope to increase production, though outputs and cropped areas declined through the 1980s. Cotton production has also increased only modestly through the 1980s; yield increases have led to a decline in planted areas. China, USA, India, southern republics of the former USSR, W Asia and W Africa are major producers; increases in production have recently occurred in W Africa and Australia. Modest continued increase in demand for cotton is expected (FAO 1993).
Changes in production of oilseeds have been prompted by demand for both oils and meals. Current estimates are that the demand for oils has grown more strongly than demand for meals since the mid-1980s, and will continue to do so in the next 10 years (Oil World 1994). The production and mix of oilmeals available will thus increasingly reflect demand for seeds for oil, thus favouring seeds such as palm kernel, rapeseed and sunflower with desirable oils at the expense of linseed, copra, groundnut and sesame.
Roots and tubers The major market for cassava as animal feed is currently the EU, with principal suppliers Thailand (80%), Indonesia and China. Prospects for cassava in the EU market are for declining demand due to reduced domestic cereal prices. Demand for feed-use of roots and tubers may increase in SE and E Asia, though expectations of lower price returns in these markets have already led to reduced plantings and programmes of crop diversification in Thailand (FAO 1994).
Current patterns of world trade in feed commodities reflect centres of production and consumption, as well as relative prices and trade policies. Prospects for production and trade define the important production centres and therefore locations of potential environmental impacts of feed demand.
Coarse grains Recent patterns of trade in coarse grains between world regions are illustrated in Figure 10. The figure shows net exports between regions, calculated as the sum of gross exports less imports for all countries of the regions (based on USDA PS&D data as shown in Appendix 6 Tables 1 and 5). NAM clearly dominates the world trade in coarse grains. In 1990/92, NAM provided 54% of the world annual total gross exports (see Appendix 6), amounting to 85% of the net flows to importing world regions. Major net importing regions are now E Asia (40% of total net imports), WANA (22%), and EE+CIS (22%). Notable recent trends in trade include increased imports since 1975/77 in WANA and E Asia (despite slight reductions over the period 1985/87 to 1990/92), and a large turn around from net importing to exporting in WE. WE is the only region with both large gross exports and imports, due to exports of barley, oats and rye and imports of maize (as well as considerable intra-regional trade).
The major countries supplying coarse grains for export are listed in Table 19. USA is by far the major source. China was the next most important source by 1990/92, with a large increase in average annual net exports since 1975/77, mainly of sorghum. Argentina, the EC-12, Canada and Australia constituted most of the remainder, with increased net export also particularly notable from the EC-12. Average annual net export in 1990/92 constituted relatively high proportions of total production in Argentina (49%) and Australia (33%), but also significant proportions of production in USA, Canada, Thailand and China.
Figure 10 Annual net exports of coarse grains by regions of the world, 1975/77 to 1990/92
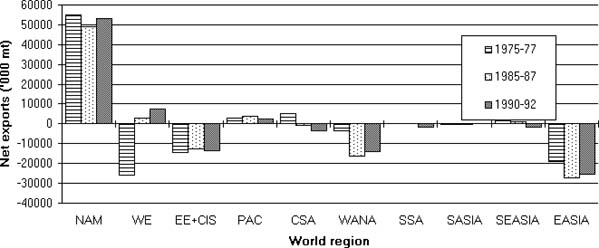
Table 19 Annual net exports of coarse grains by major exporting countries 1975/77 to 1990/92
|
|
Gross Exports (1) |
Net Export (2) |
|||||
|
Country (3) |
1975/77 ('000 mt) |
1990/92 ('000 mt) |
1975/77 ('000 mt) |
1990/92 ('000 mt) |
% production in country 1990/92 |
% world total 1990/92 |
|
|
Developed regions |
|
|
|
|
|
|
|
|
United States |
51,277 |
50,776 |
50,994 |
49,012 |
20 |
64 |
|
|
Canada |
4,480 |
4,671 |
3,899 |
5,202 |
18 |
5 |
|
|
EC-12 |
12,068 |
21,014 |
-24,748 |
5,593 |
7 |
8 |
|
|
Ukraine |
0 |
100 |
0 |
-1500 |
- |
- |
|
|
Australia |
2,667 |
2,537 |
2,655 |
2,533 |
33 |
3 |
|
|
S Africa |
2,494 |
700 |
2,493 |
-862 |
- |
|
|
|
Developing regions |
|
|
|
|
|
|
|
|
Argentina |
9,291 |
6,400 |
9,291 |
6,400 |
49 |
8 |
|
|
China |
233 |
9,570 |
214 |
8,689 |
8 |
11 |
|
|
Thailand |
2,053 |
289 |
2,053 |
507 |
13 |
1 |
|
|
World (4) |
90,077 |
102,956 |
71599 |
77099 |
9 |
100 |
|
Source: Analysis of USDA PS&D data; on commodity fresh weight basis
1. Gross exports including some re-export and intra-regional trade; NB US Feed Grains Council (1994) estimates of 'total implied exports' for the 1991/92 year were 93.5 mill mt
2. Net export = Gross export less imports; world totals = sum of tabulated positive net exports
3. Major exporting countries as identified in PS&D database, ranked on average annual gross exports in 1990-92
4. World total gross exports as quoted in PS&D database including all countries
World trade in coarse grains is forecast to increase slowly in the next decade, with much of the increase due to increasing imports into developing countries (US Feed Grains Council 1994). The USA dominates this trade with a 40-60% market share of gross exports depending on prices. Exports in the coming decade are forecast to increase from the main producers Argentina (+51%), Canada (+66%) and the USA (+19%). Production increases may also be particularly marked in E Europe and the former USSR, these countries becoming net exporters or, in the case of Russia, a reduced importer in the next 10 years.
Many countries in Asia may soon become net importers, including current exporters China and Thailand, and currently self-sufficient countries such as Indonesia, Philippines, Malaysia and Pakistan, as domestic production fails to meet demand arising from rapidly expanding poultry and/or pig production. Japan, S Korea, Taiwan and India will increase their imports, despite the trend in Japan for greater import of livestock products rather than feeds. Brazil and Mexico are also forecast to remain importers, though there will be large increases in production in Brazil. WANA countries such as Algeria, Egypt, Israel and Saudia Arabia will remain major importers.
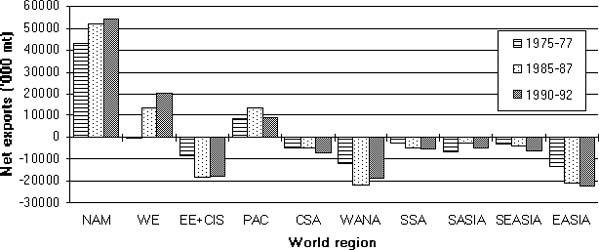
Wheat Figure 11 and Table 20 show the net export of wheat between regions and the major exporting countries respectively. The amount and pattern of wheat production and trade is similar to that of coarse grains, though most of the trade is for human food uses. NAM is by far the most important source region, providing 65% of the total net export, with WE and Oceania (PAC) providing the rest (see Appendix 6 Tables 2 and 6). E Asia, EE+CIS and WANA are the major importing regions, each consuming about a quarter of total net exports. Since 1975/77 and 1985/87 there have been increases in annual net exports from NAM and WE, and in imports into most importing regions, especially E Asia.
Figure 11 Annual net exports of wheat by regions of the world, 1975/77 to 1990/92
The major sources of wheat are USA, Canada and EC-12, supplying 35%, 24 and 21% respectively of annual world total net exports in 1990/92. Australia, Argentina and Kazakhstan are the next most important suppliers. Canada and Australia produce mainly for export (70 and 69% of production respectively), while Argentina and USA export over half their production.
Table 20 Annual net exports of wheat by major exporting countries 1975/77 to 1990/92
|
|
Gross Exports (1) |
Net Export (2) |
|||||
|
Country (3) |
1975/77 ('000 mt) |
1990/92 ('000 mt) |
1975/77 ('000 mt) |
1990/92 ('000 mt) |
% production in country 1990/92 |
% world total 1990/92 |
|
|
Developed regions |
|
|
|
|
|
|
|
|
United States |
29,456 |
33,584 |
29,393 |
32,244 |
50 |
35 |
|
|
Canada |
13,899 |
21,974 |
13,899 |
21,903 |
70 |
24 |
|
|
EC-12 |
12,767 |
35,616 |
-472 |
19,845 |
22 |
21 |
|
|
Kazakhstan |
0 |
3,683 |
0 |
3,547 |
26 |
4 |
|
|
Ukraine |
0 |
1,200 |
0 |
167 |
1 |
0.1 |
|
|
Australia |
8,749 |
9,572 |
8,749 |
9,560 |
69 |
10 |
|
|
Developing regions |
|
|
|
|
|
|
|
|
Argentina |
3,612 |
5,741 |
3,612 |
5,731 |
56 |
6 |
|
|
World (4) |
73,436 |
120,949 |
55,653 |
92,997 |
16 |
100 |
|
Source: Analysis of USDA PS&D data; on commodity fresh weight basis
1. Gross exports including some re-export and intra-regional trade
2. Net export = Gross export less imports; world totals = sum of tabulated positive net exports
3. Major exporting countries as identified in PS&D database, ranked on annual average gross exports in 1990-92
4. World total gross exports as quoted in PS&D database including all countries
Oilseeds and meals Figures 12 and 13 illustrate the inter-regional trade in oilseeds and oilmeals (derived from Appendix 6 Tables 3, 4,7 and 8). Most oilseed is traded for oil extraction and the residue used for livestock feed, while most oilmeal is traded directly for livestock feed. The major trade in oilseeds is from NAM to WE, the latter accounting for 60% of total inter-regional trade. Most of the remaining trade is into E Asia, especially Japan. CSA constitutes the only other major exporting region, though in recent years an increasing capacity for oil extraction has been developed resulting in rapidly increasing exports of oilmeals rather than oilseeds.
WE has also been the major importer of oilmeals (Figure 13). Rates of growth in world trade in oilmeals have declined sharply from a high of 8% annually in the 13 years to 1988 to 1.8% since that time, in response to changes in demand outlined in Section 3.1.4 above. Reduction in EU demand has been a prime factor, and is unlikely to change over the next few years; trade into EU is predicted to fall by 7% in the five years to 1997 and by a further 3% in the following five years (Oil World 1994).
Tables 21 and 22 show the main individual countries exporting oilseeds and meals respectively. The USA dominates the trade in oilseeds, supplying 64% of total net exports. Argentina and Brazil are the next most important suppliers, with 12 and 10% of net exports respectively. Net export comprises a relatively small proportion of total production for most countries (15-35% for major exporters). In Asia, China has emerged as an important producer and exporter of oilseeds (mainly soya bean) in recent years.
For oilmeals, Brazil, Argentina and the USA are the major suppliers. Both Argentina and Brazil now process a large proportion of their own production of oilseeds, having increased processing capacity in recent years. Both countries export a high proportion of the oilmeals produced. Most oilmeals produced in USA and in WE (mainly from imported oilseeds) are consumed locally in domestic livestock production systems. In Asia, both India and China process large quantities of oilseeds for domestic oil markets. Both countries consume a relatively high proportion of oilmeals produced (82% in China and 74% in India) but both have increased their net exports in the last 15 years. Malaysia is now emerging as an importer and processor of oilseeds, and net exporter of oilmeals, together with some of the other rapidly industrialising countries of SE Asia.
Figure 12 Annual net exports of oilseeds by regions of the world, 1975/77 to 1990/92
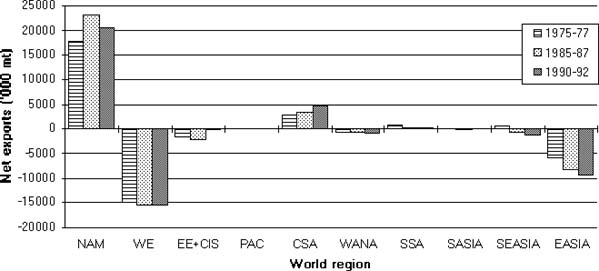
Table 21 Annual net exports of oilseeds by major exporting countries 1975/77 to 1990/92
|
|
Gross Exports (1) |
Net Export (2) |
|||||
|
Country (3) |
1975/77 ('000 mt) |
1990/92 ('000 mt) |
1975/77 ('000 mt) |
1990/92 ('000 mt) |
% prod'n in country 1990/92 |
% w'ld total 1990/92 |
|
|
Developed regions |
|
|
|
|
|
|
|
|
United States |
17,412 |
18,925 |
17,409 |
18,762 |
29 |
64 |
|
|
Canada |
964 |
2,151 |
538 |
1,844 |
35 |
6 |
|
|
Australia |
12 |
175 |
-9 |
112 |
11 |
0.4 |
|
|
South Africa |
87 |
25 |
85 |
-140 |
- |
- |
|
|
Developing regions |
|
|
|
|
|
|
|
|
Argentina |
999 |
3,575 |
999 |
3,575 |
23 |
12 |
|
|
Brazil |
2,218 |
3,241 |
2,184 |
2,971 |
15 |
10 |
|
|
Other S America |
220 |
1,193 |
119 |
851 |
27 |
3 |
|
|
West Africa |
495 |
208 |
491 |
177 |
5 |
0.6 |
|
|
India |
110 |
25 |
-7 |
25 |
0.1 |
0 |
|
|
Malaysia |
40 |
40 |
-13 |
-516 |
- |
- |
|
|
China |
162 |
1,298 |
7 |
1,195 |
4 |
4 |
|
|
World (4) |
24,881 |
35,872 |
21,832 |
29,512 |
18 |
100 |
|
Source: Analysis of USDA PS&D data; on commodity fresh weight basis
1. Gross exports including some re-export and intra-regional trade
2. Net export = Gross export less imports; world totals = sum of tabulated positive net exports
3. Major exporting countries as identified in PS&D database for both oilseeds and oilmeals exports, ranked on average annual gross exports in 1990-92
4. World total gross exports as quoted in PS&D database including all countries
Figure 13 Annual net exports of oilmeals by regions of the world, 1975/77 to 1990/92
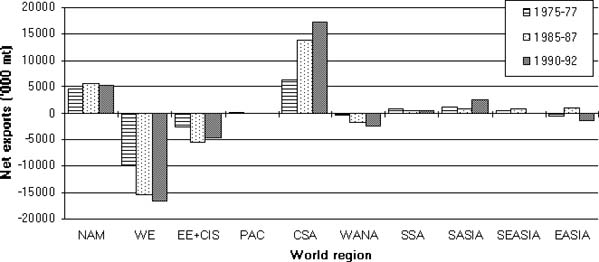
Table 22 Annual net exports of oilmeals by major exporting countries 1975/77 to 1990/92
|
|
Gross Exports (1) |
Net Export (2) |
|||||
|
Country (3) |
1975/77 ('000 mt) |
1990/92 ('000 mt) |
1975/77 ('000 mt) |
1990/92 ('000 mt) |
% prod'n in country 1990/92 |
% w'ld total 1990/92 |
|
|
Developed regions |
|
|
|
|
|
|
|
|
United States |
4,867 |
5,873 |
4,766 |
5,151 |
18 |
18 |
|
|
Canada |
184 |
713 |
-170 |
58 |
3 |
0.2 |
|
|
Australia |
0 |
10 |
-19 |
-33 |
- |
- |
|
|
South Africa |
21 |
0 |
14 |
-284 |
- |
- |
|
|
Developing regions |
|
|
|
|
|
|
|
|
Argentina |
977 |
7,878 |
977 |
7,878 |
98 |
27 |
|
|
Brazil |
5,005 |
8,283 |
5,005 |
8,283 |
68 |
28 |
|
|
Other S America |
891 |
2,918 |
651 |
2,020 |
51 |
7 |
|
|
West Africa |
453 |
394 |
453 |
362 |
35 |
1 |
|
|
India |
1,045 |
2,580 |
1,044 |
2,580 |
26 |
9 |
|
|
Malaysia |
128 |
984 |
-15 |
686 |
49 |
2 |
|
|
China |
21 |
2,934 |
20 |
2,241 |
18 |
8 |
|
|
World (4) |
19,131 |
42,224 |
12,930 |
29,259 |
24 |
100 |
|
Source: Analysis of USDA PS&D data; on commodity fresh weight basis
1. Gross exports including some re-export and intra-regional trade
2. Net export = Gross export less imports; world totals = sum of tabulated positive net exports
3. Major exporting countries as identified in PS&D database for both oilseeds and oilmeals exports, ranked on average annual gross exports in 1990-92
4. World total gross exports as quoted in PS&D database including all countries
Roots and tubers Inter-regional trade in roots and tubers in 1991/92 is summarised in Appendix 6 Table 9 (based on FAO Agrostat data for the single crop year 1991/92). Trade was (and still is) dominated by export from SE Asia to WE which comprises over 75% of the world total net export. E Asia (mainly China), EE+CIS and WANA are the only other regions with significant imports (comprising 16%, 7% and 3% respectively of world total net imports). The main sources of export supply of roots and tubers are Thailand (84% of net export) and Indonesia (15%) as reviewed in Table 23. Thailand exports virtually the whole of its production of roots and tubers (almost entirely cassava and its products) whereas Indonesia exports about a quarter.
Table 23 Net exports of roots and tubers by major exporting countries in SE Asia 1991/92
|
|
Gross Exports (1) |
Net Export (2) |
|||
|
Country (3) |
1991/92 ('000 mt) |
1991/92 ('000 mt) |
% production 1991/92 |
% world total 1991/92 |
|
|
Thailand |
|
|
|
|
|
|
|
Roots and tubers |
22,207 |
22,146 |
108 (4) |
84 |
|
|
Cassava |
22,198 |
22,198 |
109 (4) |
85 |
|
|
Sweet potato |
0 |
0 |
- |
- |
|
Indonesia |
|
|
|
|
|
|
|
Roots and tubers |
4,148 |
3,988 |
21 |
15 |
|
|
Cassava |
4,088 |
3,908 |
24 |
15 |
|
|
Sweet potato |
2 |
2 |
0.1 |
11 |
|
Philippines |
|
|
|
|
|
|
|
Roots and tubers |
162 |
67 |
2 |
0.2 |
|
|
Cassava |
162 |
89 |
5 |
0.3 |
|
|
Sweet potato |
0 |
0 |
- |
- |
|
Vietnam |
|
|
|
|
|
|
|
Roots and tubers |
56 |
54 |
1 |
0.2 |
|
|
Cassava |
56 |
56 |
2 |
0.2 |
|
|
Sweet potato |
0 |
0 |
- |
- |
|
Malaysia |
|
|
|
|
|
|
|
Roots and tubers |
34 |
-208 |
- |
- |
|
|
Cassava |
13 |
-139 |
- |
- |
|
|
Sweet potato |
18 |
16 |
32 |
89 |
|
World Totals (5) |
|
|
|
|
|
|
|
Roots and tubers |
28,235 |
26,255 |
55 |
100 |
|
|
Cassava |
26,517 |
26,251 |
64 |
100 |
|
|
Sweet potato |
20 |
18 |
0.5 |
100 |
Source: Analysis of FAO Agrostat data; on commodity fresh weight basis
1. Gross exports including some re-export and intra-regional trade
2. Net export = Gross export less imports; regional totals = sum of tabulated positive net exports
3. Major exporting countries as identified in FAO Agrostat database
4. Net exports greater than production due to stocks from previous trading years
5. World total gross exports derived from the FAO Agrostat database (not summed from Table)
The importance of trade in commodities which may be used for feeds, and therefore the potential for environmental impacts of trade (and production for trade), is illustrated in Table 24 derived from data in Appendices 5 and 6. Annual global gross exports of coarse grains, wheat, oilseeds, oilmeals and roots and tubers (for all food, feed and industrial uses) comprise a relatively small proportion of production, generally less than one fifth except for oilmeals. Gross exports for feed use are even less significant, ranging from 2 to 8% of production (again except for oilmeals), though consituting a higher proportion of total feed-use. Overall the above feed types, global gross exports are estimated at 148 mill. mt for 1990/92, comprising 15% of total feed consumption. Thus, the majority of feeds produced are consumed within regions or countries of production and any environmental impacts of trade itself (and transport) are likely to be small in comparison to the sum of any environmental effects of production of commodities.
Table 24 Global total trade in feed commodities in 1990/92
|
|
Average annual gross exports of different commodities (as percent of production or consumption) (1) |
|||
|
Commodity |
For all uses (% total production) |
For feed use (% total production) |
For feed use (% total feed-use)(3) |
For feed use (mill mt) |
|
Coarse grains |
12 |
8 |
13 |
68.0 |
|
Wheat |
21 |
4 |
21 |
25.0 |
|
Oilseeds |
16 |
2 |
30 |
4.0 |
|
Oilmeals (2) |
34 |
32 |
34 |
40.0 |
|
Roots and tubers |
7 |
2 |
9 |
11.0 |
Feed-use estimated on basis of USDA PS&D data (see Table 27)
1. See Appendices 5 and 6 for regional data and definitions
2. Production of oilmeals refers to production of residues after crushing
3. Amounts traded as percentage of total amount of commodity used as feed (see Table 4, Section 2.4.1.)
Trade is clearly more important for certain regions and countries than the global averages indicate. Countries with significant quantities of exports, and which export relatively high proportions of their production, are summarised in Table 25 below. These countries may be expected to be most at risk of environmental impacts of the demand for feed concentrates, and would be priority targets for any monitoring or case study of impacts. (Note, however, that the figures in Table 25 refer to exports for all uses; data are not available to distinguish the end-use of exports from individual countries)
Table 25 Summary list of major exporting countries ranked by annual quantities of commodities exported in 1990/92
|
Major exporting countries for different commodities (1) (figures in brackets indicate gross exports as percent of production) |
||||
|
Coarse grains |
Wheat |
Oilseeds |
Oilmeals (2) |
Roots and tubers |
|
USA (20) |
EC-12 (22) |
USA (29) |
Brazil (68) |
Thailand (84) |
|
EC-12 (7) |
USA (50) |
Argentina (23) |
Argentina (98) |
Indonesia (21) |
|
China (8) |
Canada (70) |
Brazil (15) |
USA (18) |
|
|
Argentina (49) |
Australia (69) |
Canada (35) |
China (18) |
|
|
Canada (18) |
Argentina (56) |
China (4) |
India (26) |
|
|
Australia (33) |
Kazakhstan (26) |
Other S America (5) |
Other S America (51) |
|
|
Thailand (13) |
|
|
Malaysia (49) |
|
|
|
|
|
W Africa (35) |
|
Sources: USDA PS&D data, see Tables 19 to 23
1. Ranked by quantities of annual gross export in 1990/92; including countries with net exports at least 1% of world total trade; note quantities exported may be for food, feed and other uses
2. Production of oilmeals refers to product of crushing for oil (may be partly derived from imported oilseeds).
3.2.5. Competition with demand for food
The availability of commodities for concentrate feeding of livestock is partially determined by the demand for direct human food use. The potential competition for resources mainly concerns cereals, but could in some circumstances involve land used for other high value commodities providing livestock feeds (such as oilseeds or forages) instead of crops for direct human consumption.
Table 26 shows the utilization of cereals for food and feed in developed and developing countries up to the mid 1980s (FAO 1987) (including milled rice, coarse grains and wheat). Of the total world consumption of cereals in 1983-85 about 38% was used for livestock feed (not including milling by-products). The proportion of cereals used for feed varied greatly between regions, from 65% in the developed market economies to less than 2% in the lowest income developing countries (in SS Africa and S Asia). Up to the mid-1980s, utilization for feed increased more rapidly than for food in all regions but particularly in the middle income developing countries. In the latter, both food and feed utilization increased at rates well above population growth. In the lowest income developing countries, food and feed use showed lower but similar growth rates, at about the level of population growth.
Table 26 Utilization of cereals for human food or livestock feed
|
|
Food use 1983/85 |
Feed use (2) 1983/85 |
Growth rates %/year 1969/71 to 1983/85 |
|||
|
Region |
(mill. tons) |
(%total) |
(mill. tons) |
(%total) |
Food |
Feed |
|
Developing countries |
|
|
|
|
|
|
|
Low income |
203 |
87 |
3 |
1 |
2.5 |
2.9 |
|
Middle income |
402 |
68 |
123 |
21 |
4.0 |
6.3 |
|
Over all |
605 |
74 |
126 |
15 |
3.5 |
6.2 |
|
Developed countries |
|
|
|
|
|
|
|
Market economies |
103 |
23 |
297 |
65 |
0.7 |
0.8 |
|
E Europe + USSR |
72 |
24 |
176 |
58 |
0.3 |
2.7 |
|
World |
780 |
49 |
599 |
38 |
2.2 |
2.7 |
Source: FAO 1987 Agriculture Towards 2000
2. Feed use of cereals including milled rice, wheat and coarse grains but not including milling by-products
Table 27 shows the proportions of different commodities consumed as feeds in 1990/92 derived from analysis of USDA PS&D data and FAO Agrostat data for world regions. Feed-use of all commodities (except oilmeals) remains low in low-income developing regions of SSA and S Asia. Utilization of coarse grains for feed is generally higher than of wheat, particularly in the developed regions but also in CSA and WANA. Consumption of wheat (and rice - not shown) for feed is very low in all developing regions and will probably remain so outside temperate and cooler sub-tropical areas. Relatively small proportions of oilseeds are consumed directly as feeds (11% globally), though slightly more in developed than in developing regions. For roots and tubers, feed consumption accounts for over 30% of total utilization in Europe, the former USSR, CSA and E Asia but is otherwise a relatively small proportion of total utilization.
Recent estimates for developing countries suggest that the growth of feed-use of all cereals (milled rice, wheat and coarse grains), is likely to continue at twice the rate of food use to 2010, rising to 22% of total cereal use by that time (FAO 1993) (cf 15% in 1983-85, Table 26). Regional differences will remain, with very low levels of feed use in SS Africa and S Asia (2-3%), but rising levels in N Africa/W Asia, E Asia and C and S America. These increases in feed-use will be achieved despite predicted increases in per capita food availability, even in the countries of SSA and S Asia with the lowest current consumption rates.
Table 27 Percentages of commodities consumed as feeds in world regions 1990/92
| |
Commodity utilization for feed in region (% total consumption of commodity in the region) (1) |
|||||
|
Region (2) |
Coarse grains |
Wheat |
Oilseeds |
Oilcakes and meals |
Roots and tubers |
|
|
Developed regions |
|
|
|
|
|
|
|
North America |
78 |
28 |
13 |
100 |
7 |
|
|
Western Europe |
73 |
38 |
11 |
100 |
47 |
|
|
E Europe and CIS |
76 |
49 |
16 |
100 |
35 |
|
|
Oceania |
77 |
37 |
10 |
100 |
5 |
|
|
Developing regions |
|
|
|
|
|
|
|
C and S America |
64 |
2 |
7 |
99 |
31 |
|
|
W Asia and N Africa |
82 |
5 |
9 |
100 |
14 |
|
|
Sub-Saharan Africa |
3 |
1 |
8 |
100 |
3 |
|
|
S Asia |
12 |
1 |
12 |
99 |
0 |
|
|
SE Asia |
59 |
7 |
4 |
99 |
6 |
|
|
E Asia |
66 |
6 |
10 |
68 |
41 |
|
|
World |
66 |
21 |
11 |
94 |
26 |
|
Source: Analysis of USDA PS&D data for coarse grains, wheat and oilseeds (mean annual consumption for 1990-92, on commodity fresh weight basis), and FAO Agrostat data for roots and tubers
NB PS&D data on feed use of oilseeds includes utilization for seed and waste (seed use accounts for 5-7% of consumption)
1. Feed use %= feed use in region as percent total consumption (for food, industrial, seed and feed) in region
2. World regions as defined in Appendix 1
The issue of concern in the increasing feed-use of cereals is the extent to which this restricts the availability of food cereals at affordable prices for poorer countries or sectors of populations. Populations or countries unable to increase production or imports to make up deficits in supply because of production and/or marketing constraints, or lack of foreign exchange, are particularly vulnerable. Barkin, Batt and De Walt (1990) suggest that poorer sectors of rural populations who rely on carbohydrate rich diets may face increased food prices and may, in some cases, be displaced from land by larger scale cash crop farmers as the demand for feeds increases.
As argued by FAO (1993), however, experience has indicated that while these circumstances do still pertain in poor parts of some countries, increased cereal demand has generally been fulfilled at declining or stable real prices due in part to the adoption of improved production technologies. Competition for cereals does not, therefore, seem to have raised prices out of reach of poorer populations (though prices might have fallen even lower without increased feed-use). In most countries, increases in production and consumption of cereals for both food and feed have occurred together. The experience of middle-income countries has been that income growth has been associated with increased cereal production and/or import capacity to meet demand for both food and feed. In low-income countries, growth in feed-use has generally remained low until income growth has stimulated demand for livestock products; most of the future predicted extra demand for cereals in these countries will be for direct food use until that demand is more nearly satisfied (FAO 1993). Nor do low-income countries appear to increase exports of cereals at the expense of home consumption; trade in food or feed cereals out of low- towards middle- or high-income countries does not occur to a significant degree; the reverse is more often the case.
In countries with currently low per capita consumption of livestock products, medium-term increases in ruminant livestock production may be supportable on the increased availability of cereal milling by-products derived from projected increases in food grain production. In these cases also, competition for cereal foods may not be an important factor. This is the projected situation for Kenya for example (Reynolds 1993), though some increases in feed grain availability will be required to meet non-ruminant feed demands.
National and international agricultural and trade policies have direct and indirect impacts on feed concentrate use and supply. In the international context, GATT will have the most far-reaching impact on international feed trade. Policy changes within the major regional trade blocks such as in the EU and N America (NAFTA) will have additional impacts. Economic reform policies in former socialist countries and structural adjustment programmes in developing countries will also affect demand and supply of feed concentrates. Some of these effects are outlined in following sections.
The agreements reached in the Uruguay round of the GATT will be implemented over a six year period (1995-2000) for developed countries and over 10 years (1995-2004) for developing countries. Least developed countries are not required to make any adjustments. The principal elements of the Agreement on Agriculture include improved market access (by limitation and 'tariffication' into financial terms of non-trade barriers such as quotas, levies and licences), reduced domestic support (by reductions in domestic price and production support measures), and increased export competition (reduced export subsidization). Development policies, such as investment subsidy, in developing countries will be exempted from provisions of reduced domestic support; developing countries are also allowed a smaller reduction of domestic support and a higher minimum rate of domestic support for individual commodities before support reduction policies come into force (10% cf 5% in developed countries).
Predictions of the impacts of GATT have been made by a number of agencies (FAO 1993, FAO 1994, FAPRI 1994, USDA 1994a, US Feed Grains Council 1994 and Oil World 1994). The major impacts of the agreement will concern temperate zone developed country products which have been the subject of most support, especially wheat, sugar and livestock products (FAO 1994). Impacts are likely to be greater for trade than for production, as a number of domestic production support measures are not affected. International meat and dairy prices are predicted to rise, reducing demand to some extent and implying further shifts of production towards systems using less concentrate feeds.
The major impact on coarse grain production and trade will occur through reductions in export subsidy and export quantities by the EU. Relative to 'without-GATT' predictions, international coarse grain trade is likely to increase marginally due to GATT and prices to rise 1.8% to 4%, slightly less than for wheat. Production of coarse grains in the EU is likely to decline in favour of wheat. In the USA, production and export of coarse grains is predicted to rise due to the country's comparative advantage. Imports into Japan and S Korea will increase (though increased Japanese imports of livestock products will moderate this increase to some extent) and import restrictions will be reduced in some other countries (such as The Phillipines, South Africa, Sweden and Finland) (see US Feed Grains Council 1994).
Wheat production and trade will also be mainly affected by reductions in EU export subsidization. The initial impacts will include a 5% to 7% increase in world market prices resulting in reduced trade and consumption but greater incentives to export. Production will subsequently increase in areas with comparative advantage. World trade is forecast to increase relative to without-GATT projections after the year 2000. Increases in the returns from wheat compared to coarse grains may result in some shift of production in favour of wheat in favourable areas in WE and in the countries of the former USSR.
Impacts of GATT on oilmeals are difficult to predict since they are determined by a complex of impacts on both edible and non-food oil production and trade, including the effects of reduced restrictions on oilseed plantings for non-food uses (industrial uses of oils is forcast to increase strongly, Oil World 1994). In general, some restrictions on EU plantings of edible oil crops, and reductions in export subsidies for oilmeal exports from the USA will be the most significant factors, resulting in some extra increases in production and trade from rapidly growing producers in Latin America (Brazil and Argentina) and Canada. Total production and export from the USA is still predicted to increase as a result of GATT. The availability and costs of oilmeals may not be greatly affected.
Impacts on developing countries are thought to be positive. Countries able to produce traded commodities such as wheat, coarse grains and oilseeds or meals at low cost may be able to expand production and exports. Changed agreements on fibre commodities may also allow expanded cotton and cotton seed production.
A number of regional trade agreements now exists (see FAO 1994), with the general aim of facilitating intra-regional trade. Increasingly, these will be influenced by the same issues and policies underlying the GATT. They may have considerable local impacts on production and trade in some commodities. NAFTA in N America is estimated to double coarse grain imports to Mexico in the next 10 years, mainly from increased production in USA, and to reduce maize area in Mexico by 17% (US Feed Grains Council 1994). Trade in oilseeds and meals may also increase with Canada and Latin American countries joining NAFTA (such as Venezuela) benefitting most (Oil World 1994).
In general the effects of these agreements over the long-term are to increase trade, to increase economic growth and thereby consumption (including of livestock products), to increase demand for concentrate feeds, and to encourage increased production of commodities in areas of comparative advantage.
Policies on agricultural development and management of markets are under review in many countries and regions. General objectives of these policies are to reduce the levels of price support and market distortion, and to increase competitive trade in commodities, while supporting the development of necessary infrastructure, services and investment to secure food supplies. At the same time, a number of environmental objectives are increasingly included to improve the sustainability of farming systems and reduce environmental impacts. These policies will increasingly affect the production and use of feed commodities and intensive livestock production systems.
EU Common Agricultural Policy (CAP) Impacts of recent reforms of the CAP in 1992 are likely to reduce high domestic prices of cereals, and therefore to increase cereal feed-use at the expense of grain substitutes and oilmeals (Rutherford 1994). Imports of cassava, milling by-products and vegetable proteins are expected to decline; commodities such as rice bran, palm kernel meal and copra meal with high freight costs will be particularly affected. These products may well be absorbed by the expanding feed industries in Asian countries. Use of oilmeals in EU animal feed rations is expected to decline due to falling domestic cereal-oilmeal price ratios in the EU.
Reduced feed prices could lead to reduced pork and poultry prices with prospects for increased production and some un-subsidised export. Impacts on beef and dairy feeding systems are less certain. On the one hand, cereals may form a greater proportion of concentrates fed, while on the other, demand and price pressures may cause a reduction in overall concentrate feed use, especially for beef production.
Reform policies in E Europe and the New Independant States (former USSR) Changes in economic and agricultural policies in countries of E Europe and the CIS may have major impacts on the supply and demand for feed concentrates over the coming 10 years (see FAO 1993, OECD 1994b). Per capita incomes are predicted to remain low and to recover only slowly in these countries. Total domestic demand for cereals is likely to decline from pre-reform levels due to slightly reduced direct food consumption, reduced demand for livestock products, more efficient utilization of feeds, and reduced post-harvest losses. At the same time some recovery and growth in cereal production is predicted. E Europe is expected to become a growing net exporter while the former USSR could become self-sufficient. Impacts on cereal trade will thus be significant; in 1988-90 imports to these countries amounted to over 20% of world trade.
Reductions in per capita consumption of meat could continue in the short-term. Recovery and growth in total consumption is predicted to be slow, not restoring pre-reform levels before 2010, and is likely to include a trend for decreased beef but increased poultry consumption (FAO 1993).
Agricultural policies in developing countries Since the 1980s, agricultural policies in developing countries have been mostly characterised by liberalisation and structural adjustment programmes. These have aimed to reduce control of markets and prices, and to reduce subsidies to agriculture. Devaluation of overvalued currencies has tended to increase exports and reduce imports of agricultural commodities (except that reliance on food imports and food aid has increased in the poorest countries).
Decreased controls have lead to changes in cropping patterns and resource allocation depending more on market forces. For example in N China, the removal of price controls for grains and oilseeds, and the de facto disappearance of crop planning in 1992/3 was followed by a readjustment of cropped areas away from maize towards more profitable crops such as soya, other oilseeds and other grains. Similar examples may be noted in Tanzania where considerable adjustments (and increases) in areas of food maize production occurred following the reduction of marketing restrictions in the late 1980s.
The reduction of government controls of markets may in some instances lead to increased production of feed commodities for high value markets at the expense of food production for poorer sectors of the population (though see section 3.2.5). The principal problems in the poorer developing countries will remain, however, the very low per capita incomes and income growth. These will continue to constrain demand for both food and feed commodities below desirable levels for the medium term future. Improvements in economic growth could have marked impacts on demand, as illustrated in the more rapidly developing countries.
![]()
![]()
![]()