![]()
![]()
![]()
The function of indicators of environmental impacts is to provide relatively few easily measurable descriptors of the state or trends of conditions in the environment. Such indicators may be used for a variety of purposes for reporting the state of the environment and for contributing to the integration of environmental concerns in sectoral and general socio-economic policy development and planning (identifying needs and monitoring change).
Environmental indicators are currently under development by many agencies for these different purposes. There has thus been interest in the harmonization of the identification and use of indicators, particularly to facilitate international comparisons and discussion. Approaches to such harmonization have been developed by the OECD Group on the State of the Environment and the UNCED. The presentation and discussion of appropriate indicators in this study is made in the framework outlined by these groups (as described in OECD, 1993 Environment Monographs No 83)
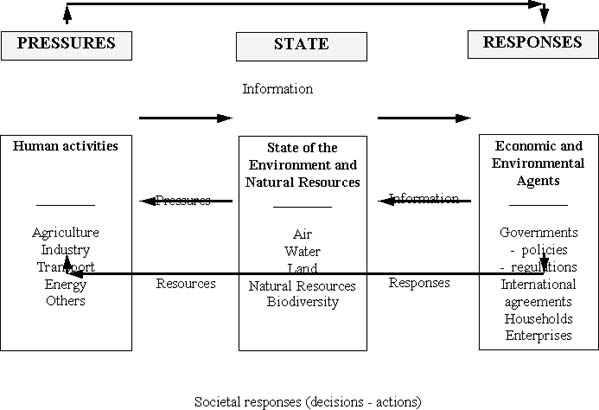
A framework for the identification of different types of indicators is provided by the pressure-state-response model described by OECD (1993), as illustrated in Figure 14. This model recognises the links between the pressures created by human activities on different components of the environment (state) and the policy and activity responses of society in mitigation and regulation of these pressures. The model has the advantage of also representing the stages in the environmental policy cycle (from problem recognition, policy formulation, monitoring and evaluation), facilitating the identification of indicators for specific purposes.
Indicators may be identified for each of the pressure-state-response components of the framework. Indicators of environmental pressures describe the pressures exerted by human activities, such as through emissions, consumption of natural resources, land-use and changes. These may be direct (or proximate) indicators of pressures exerted directly on the environment ( such as emissions) or indirect indicators of background factors leading to such pressures (human population growth, economic development etc).
Indicators of environmental conditions describe the state of the environment and the quantity and quality of natural resources. These include direct measures of components of the environment such as air and water quality, soil conditions, land resources, biodiversity and others. Indicators of societal responses measure the policy and activity responses to environmental concerns, including actions to prevent, mitigate or reverse negative impacts and to encourage positive impacts and the sustainable utilization and conservation of resources. To be useful and objective, such indicators should be quantitative measurements rather than (or as well as) qualitative observations (eg the proportion of land under conservation measures rather than the existence of such policies, or the proportion of farmers adopting safe pesticide handling procedures rather than whether or not pesticide regulations are in place).
Figure 14 Pressure-state-response framework for identification of indicators of environmental impact
Under the OECD (1993) guidelines, three basic criteria have been defined for the selection of indicators; these are policy relevance, analytical soundness and measurability. For policy relevance, indicators should:
provide a representative picture of environmental conditions, pressures and responses
be simple, easy to interpret and able to show trends over time
be responsive to changes in environment and human activities
provide a basis for international comparisons
be either national in scope or applicable to regional environmental concerns, and
have a threshold or reference value for comparison purposes.
For analytical soundness, indicators should:
be theoretically well founded in technical and scientific terms
be based on international standards and international consensus about their validity, and
lend themselves to being linked to economic models, forecasting and information systems.
In order to be easily measurable, the data required to derive indicators should be:
readily available at a reasonable cost/benefit ratio
adequately documented and of known quality, and
able to be updated at regular intervals in accordance with reliable procedures.
In practice, these criteria may not be met in full for all indicators. They nevertheless provide a useful reference guide for selection of indicators in following sections. Of particular note is the requirement that indicators are analytically sound and accurately reflect environmental pressures, conditions or responses. Close understanding of the cause and effect linkages and mechanisms of environmental impacts in the sector under study is thus required. The identification of pressure indicators is especially difficult in this respect, particularly of indirect indicators with more remote linkages to actual environmental impacts.
Certain qualifications of the use of indicators should also be noted (as outlined in OECD 1993). Of relevance in the context of the present study are the qualifications that:
indicators often need to be supplemented by other quantitative and qualitative information to aid accurate interpretation
indicators must be reported and interpreted in the appropriate context, taking account of relevant ecological, geographical, socio-economic and other conditions
policy and activity responses may not be quantifiable in simple indicators but may nonetheless provide useful qualitative supplementary information
there is no unique necessary normalisation of indicators across environments or countries (eg in relation to GDP or human population). Other forms of normalisation in relation to livestock numbers, livestock products, land areas etc may be relevant but will also require careful interpretation for comparison purposes, particularly where data may be of variable or doubtful accuracy.
The environmental impacts of concentrate feed demand are principally derived from the crop production of feed commodities, as described in Chapter 4. A wide range of impacts are potentially exerted. As an approach to identifying particular indicators of the environmental impacts, Table 37 outlines the main indirect and direct origins of impacts and the components of the environment affected.
Indirect pressures The left-hand column of the table lists the background factors contributing to pressures on the environment as a result of the demand for feed concentrates. Thus demand is primarily due to human population and incomes determining consumption of livestock products (as outlined in Chapter 2). Demand for feeds is then more directly determined by the nature of the livestock production systems producing livestock products (including factors such as the levels and efficiency of utilization of feeds). The supply of feeds to meet this demand raises an additional range of factors leading to pressures on the environment, including the extent of home production or trade in feeds and the characteristics of the crop production systems producing feeds (particularly cropping systems, cropping intensity and input utilization). Indirect indicators of environmental pressures could be developed out of key components of this chain of factors.
Table 37 Types of environmental pressures and components of the environment affected by the demand for feed concentrates
|
Sources of environmental pressures |
Components of environmental conditions |
|
|
Indirect |
Direct |
|
|
Demand for concentrate feeds: |
Land resource utilization: |
Habitats and biodiversity: |
|
Supply of concentrate feeds: |
Water resource utilization: Use of irrigated croplands for feed crops Irrigation water utilization (rates, husbandry and drainage systems) |
Landscape and amenity: |
|
Cropping systems and intensity |
Pollution of water resources: Contamination of water run- off effluents and drainages- with N and P - with pesticides |
Soil conditions Soil erosion status (soil depth, soil loss) |
|
Crop input utilization Fertilizer and pesticide use] |
Pollution of air: GHG emissions (CO2) |
Water resources: Availability of irrigation water |
|
|
|
Water quality: Eutrophication status and aquatic life of water bodies |
Direct pressures Direct pressures on the environment are caused by the utilization of land and water resources, and by the pollution of water and air by emissions due to agricultural practices involved in feed crop production. The principal general components of these pressures are shown in the central column of Table 37, out of which key indicators may be developed.
Environmental conditions The conditions or state of the environment affected by feed crop production are listed in the right-hand column of the table, including the status of habitats and biodiversity, landscape and amenity, soil conditions, water resources and water quality.
Societal responses Table 37 does not list the components of societal responses from which indicators might be drawn. Societal responses are less clearly defined at present but might include the various incentives and regulations developing to control land-use and incorporate environmental objectives, preserve habitats and biodiversity, and encourage sustainable agricultural practices (eg soil conservation, input limits, pesticide handling and disposal regulations, measures to encourage more efficient feed utilization, etc). Development of indicators of the nature and scale of these responses has not yet been approached.
The framework provided by Table 37 is used for the identification of potential indicators of environmental pressures and conditions, as presented in following sections.
Potential indicators of environmental pressures are listed in Tables 38 and 39 for indirect and direct indicators respectively. Potential indicators of environmental conditions are listed in Table 40. The tables also present the potential sources of information which may be used for such indicators.
Few of the potential indicators are available in a useable form directly from published data sources, especially for indicators of current environmental conditions. Some indicators of environmental pressures could be derived from existing published sources, particularly for indirect indicators. The precise definitions of these indicators remain to be determined, however, depending on data availability in specific cases. Tables 38 and 39 offer general definitions but further detailed case studies will be required to explore the precise form and methods of calculation of these indicators and their links to environmental impacts. In the absence of published data, many of the potential indicators would require primary field survey work to establish monitoring programmes, which may be a key factor determining their utility.
A common short-coming of published data for the derivation of indicators is the level of aggregation at which they are collected and published (at the national level). Data on cropland-use, soil conditions or use of agricultural inputs, for example, do not distinguish land used for feed crops. Thus, interpretations and comparisons, from aggregate data, of environmental impacts due to demand for feeds might be misleading depending on the mix of all crops grown or the mix of cropping systems employed.
Table 38 Potential indirect indicators and sources of data for monitoring environmental pressures
|
Source of pressure |
Indicators |
Sources of data |
|
1. Demand for concentrate feeds: Human population Incomes and elasticity of demand Consumption of livestock products Livestock production systems - use of concentrate feeds |
1.1. Per capita consumption of meat, milk and eggs; proportional consumption of different products; time trends 1.2. Feed utilization by different livestock production systems and species (dietary inclusion rates; consumption per head of livestock and per unit of product (feed efficiency), for total concentrates and for key feeds 1.3. Relative prices of feed commodities and livestock products (price ratios for unit of key feed inputs, eg maize and soyabean per unit of different livestock products, eg beef, milk, pig meat, poultry meat and eggs) |
National and international databases on livestock product consumption available, eg FAO. Aggregate national data on feeds consumption available from most countries (eg via FAO and USDA PS&D) but reliability uncertain. Data on feed use not available by production system or livestock species (except by field survey). Prices of major commodities available in international databases eg FAO. |
|
2. Supply of concentrate feeds: Home production of concentrate feed crops Export and import of concentrate feeds Competition for food and feed uses of commodities |
2.1. Proportions of domestic production of crops used for food and feed (by coarse grains, wheat, oilseeds, roots and tubers and pulses) 2.2. Proportions of feed consumption home grown or imported (and origins) 2.3. Proportions of feed production (or commodities potentially used for feeds) exported 2.4. Per capita consumption of food grains, roots, tubers and pulses potentially used for livestock feeds and diet sufficiency ((a) for whole population (b) for poorest sector of society) 2.5. Relative prices of food and feed commodities (especially grains) |
Aggregate national data on crop production published for most countries; data on feed use available via FAO and USDA PS&D databases, but basis for national reports not always reliable. Data on import and export published for most countries (and available via FAO and USDA PS&D databases) - but trade for feed purposes not distinguished. Food consumption and price data available through international databases. |
|
3. Cropping systems and intensity Cropping systems (crops and rotations) Crop:fallow ratio Cropping index (crops per year) Husbandry practices (soil conservation, manuring etc) |
3.1. Proportion of total crop and/or feed crop areas under different cropping systems (eg low- or high-intensity systems with different types of potential environmental impacts) 3.2. Adoption of sustainable cropping practices (proportions of feed crop areas under different practices, eg with soil conservation, manuring, minimum tillage) 3.3. Crop:fallow ratios, cropping indices and trends in cropping systems with feed crops 3.4. Average yields and trends for feed crops by cropping systems |
Areas under different cropping systems not routinely reported, available for some countries through sample surveys. Data on adoption of sustainable cropping practices not widely reported. Crop yield data available but not distinguished for different end uses of crop (eg wheat for food or feed). |
|
4. Crop input utilization Fertilizer and pesticide use Mechanisation Transport |
4.1. Input utilization rates per unit area and per unit output of feed crops (fertilizers, pesticides, mechanisation) |
Aggregate data on fertilizer and mechanisation inputs available in international databases (eg FAO), but not pesticide use. No breakdown of input utilization by different crops or end uses reported (may be collected by sample survey). |
Table 39 Potential direct indicators and sources of data for monitoring environmental pressures
|
Source of pressure |
Indicators |
Sources of data |
|
1. Land resource utilization: Cropland use - overall cropping - for feed crops Forest and grazing land loss Use of marginal croplands |
1.1. Cropped areas and changes as proportion of total land-use 1.2. Feed crop areas and proportions of total cropped areas (overall feed crops and by crop types including coarse grains, wheat, oilseeds, roots and tubers and pulses) 1.3. Forest and grazing land loss (areas and proportions) to cropping (and feed crops) 1.4. Marginal cropland areas and proportions cropped (overall and for feed crops) |
National and international statistics sources; FAO, USDA PS&D. Feed crop areas not distinguished (proportions may be interpreted from proportional end use of crop). Use of marginal land not fully reported. |
|
2. Water resource utilization: Use of irrigated croplands for feed crops] Irrigation water utilization (rates, husbandry and drainage systems) |
2.1. Irrigated land areas and proportions used for feed crop production 2.2. Irrigation water utilization per unit area and per unit production of cropland and feed crops 2.3. Areas and proportional areas of irrigated land with inadequate drainage (overall crops and used for feed crops) |
Statistics available for overall irrigated croplands and some crops (eg rice) but not feed crops. Areas with inadequate drainage not fully reported. |
|
3. Pollution of water resources: Contamination of water run- off effluents and drainages - with N and P - with pesticides |
3.1. Cropland drainage effluent contamination from major feed crops (nitrate, phosphate and pesticides) cf acceptable levels 3.2. Areas and proportional areas of croplands (or feed croplands) with unacceptable drainage effluent contamination |
Some sample survey data available but few comprehensive data reported routinely. |
|
4. Pollution of air: GHG emissions (CO2) - from forest clearance - from soil OM loss - from energy consumption |
4.1. Areas and volumes of forest loss, proportions burned and amounts of CO2 emitted 4.2. Soil organic matter loss and CO2 emission (overall cropland and for feed crops) 4.3. Fertilizer, mechanisation, pesticide and fuel energy inputs to agriculture, burned fossil fuel use and implied CO2 emission (overall and proportional contribution by feed crops) |
National and international data on forest loss but interpretation of permanent loss of CO2 complex (see World Res. Inst. 1994). No comprehensive data on soil OM loss reported. Some sample statistics on fossil fuel use but no comprehensive data routinely reported; estimation complex. |
Table 40 Potential indicators and sources of data for monitoring of environmental conditions
|
Type of impact |
Indicators |
Sources of data |
|
1. Habitats and biodiversity: Reserves and mosaic habitats Habitat diversity Natural species diversity Crop and livestock species diversity |
1.1 Areas and proportional areas of reserves and different habitat types (a) overall land and (b) within agricultural areas 1.2 Natural species numbers by habitats; presence and numbers of endangered or critical indicator species; 1.3 Numbers and areas grown of crop varieties |
National or district statistics; some data in international databases, FAO, World Resources Institute, WWF etc. Few sources provide breakdown within agricultural land areas. Data may be collected through remote sensing and local survey. |
|
2. Landscape and amenity: Landscape diversity Countryside amenity value |
2.1 Areas and proportional areas of different landscapes and land amenity values in agricultural areas |
No routinely published data sources. Data may be collected through remote sensing and local survey. |
|
3. Soil conditions Soil erosion status (soil depth, soil loss) Salinization of irrigated areas Soil fertility status (CEC, pH, N,P,K, micro-nutrients, OM) Soil physical status (water holding capacity, bulk density, compaction) |
3.1. Areas and proportional areas at risk of soil erosion, or exhibiting different degrees/types of degradation 3.2. Areas and proportional areas affected by salinization 3.3. Areas and proportional areas affected by lowered soil fertility or degraded soil conditions of different types 3.4. Rates of soil loss, soil depth, degree of salinization, soil fertility status or depletion rates, soil condition (compaction, bulk density) cf acceptable levels |
Some international data sources, eg FAO, but not comprehensive. No sources distinguish by cropping systems (eg extensive or intensive, with/without feed crops), or by crop types (eg feed crops). Data may be collected through remote sensing and local land resource and soil survey, though costly. |
|
4. Water resources: Availability and use of irrigation water Aquifer resources (depletion and recharge) |
4.1. Areas and proportional areas of cropland irrigated for feed crops 4.2. Irrigation water availability/use per unit area cropland and cropland for feeds; total and proportion of water resources |
Data available for total irrigated areas for some countries through national and international sources, eg FAO. Incomplete data on allocation of water resources by cropping systems or feed crop areas. |
|
5. Water quality: Eutrophication status and aquatic life of water bodies Drinking water quality |
5.1. Numbers and proportions of water bodies (a) exceeding safe nutrient and pesticide contamination levels, or (b) affected by eutrophication and reduced aquatic life biodiversity 5.2. Water quality (esp. drinking water); nitrate, phosphate and pesticide levels; proportion of supplies exceeding safe levels (eg EU thresholds of 50 mg/l nitrate, 5000 ug/l P, 0.1 ug/l any single pesticide, 0.5 ug/l all pesticides) |
Published data on water body conditions incomplete. Few sources distinguish contamination due to agricultural practices. Drinking water quality statistics available for most countries. Local surveys of water quality relatively easy and cheap |
Similarly, published data on feed use are not usually available by livestock production systems or species so estimations of feed efficiency for different products may not be easily made. In such cases, interpretations of aggregate feed efficiencies (and thereby environmental pressures) will depend on the mix of production systems and species present.
Many of the potential indicators identified in Tables 38 to 40 are defined, and data availability assessed, at national, district or zonal levels. Similar indicators may be defined at more local levels, depending on the purposes of monitoring. Thus for individual projects or enterprises, the same major issues may apply, though the selection of indicators and the methods of data collection may be different.
The number and range of indicators that could be derived from Tables 38 to 40 is too great and broad to provide a useful package of monitoring tools. A shortlist of key indicators is thus presented in Table 41 below, focusing on the major potential impacts of feed crop production.
Indicators of environmental conditions The selected indicators include six indicators of environmental conditions relating to habitat diversity, soil conditions and water quality. Indicators of soil conditions (1.4) and water quality (1.6) would each require several component measurements. However, few of the identified indicators are currently routinely monitored or reported at national levels. Most countries report areas of reserves and special habitats, and some of these are subject to international monitoring. Few countries or zones routinely monitor and report cropland soil conditions (eg soil erosion and soil fertility status) or aspects of water body conditions and drinking water quality. These may be better monitored through targeted periodic field surveys of sample areas under different cropping systems and crops.
Certain potential indicators of environmental conditions listed in Table 40 are not selected as key indicators of impacts of feed crop production. Indicators of species biodiversity are not selected as the presence of habitat is the more critical indicator. Impacts on biodiversity due to pesticide residues are captured through indicators of residues in water bodies (easier to measure) and of impacts on aquatic biodiversity (the habitat most at risk). Indicators of irrigation water resources and irrigated land degradation have not been included as key indicators as irrigation is relatively less used for concentrate feed crops than for food and industrial crops (especially rice and wheat) and forages.
Direct indicators of environmental pressures Priority direct indicators of environmental pressures are identified as those monitoring changes in land-use (particularly increases in overall and feed crop areas and the loss of forest and grazing land), and the degree of contamination of cropland drainage effluents with lost nutrients (especially nitrate and phosphates) and pesticide residues.
Table 41 Selected key indicators of environmental conditions or pressures due to demand for concentrate feeds
|
1. Indicators of environmental conditions: |
|
|
|
1.1. Areas and proportional areas of reserves and different habitat types (a) overall land and (b) within agricultural areas |
|
|
1.2. Areas and proportional areas of cropland (or feed cropland) at risk of soil erosion, or exhibiting different degrees and types of erosion |
|
|
1.3. Areas and proportional areas of cropland (or feed cropland) affected by lowered soil fertility or degraded soil conditions of different types |
|
|
1.4. Comparative soil conditions (compaction, bulk density), soil depth and soil fertility status or rates of loss of soil and soil fertility in croplands (or feed croplands) |
|
|
1.5. Numbers and proportions of water bodies (a) exceeding acceptable nutrient and pesticide contamination levels, or (b) affected by eutrophication and reduced aquatic life biodiversity |
|
|
1.6. Water quality (esp. drinking water); nitrate, phosphate and pesticide levels and proportion of supplies exceeding safe levels (eg EU thresholds of 50 mg/l nitrate, 5000 ug/l P, 0.1 ug/l any single pesticide, 0.5 ug/l all pesticides) |
|
2. Direct indicators of environmental pressures: |
|
|
|
2.1. Proportion of total land-use under cropping, and trends |
|
|
2.2. Proportion of cropped areas under feed crops, and trends ((a) for all feed crops and (b) by crop types: coarse grains, wheat, oilseeds, roots and tubers and pulses) |
|
|
2.3. Forest and grazing land loss (areas and proportions) to cropping (and to feed crops) |
|
|
2.4. Marginal cropland areas and proportions cropped (overall and for feed crops) |
|
|
2.5. Cropland drainage effluent contamination from major feed crops (nitrate, phosphate and pesticides) cf acceptable levels |
|
3. Indirect indicators of environmental pressures: |
|
|
|
3.1. Per capita consumption of meat, milk and eggs, and trends |
|
|
3.2. Per capita consumption of food grains, roots, tubers and pulses potentially used for livestock feeds, and diet sufficiency ((a) for whole population (b) for poorest sector of society) |
|
|
3.3. Relative prices of food and feed commodities (especially grains) |
|
|
3.4. Utilisation of total concentrates and key individual feed commodities by different livestock production systems and species (dietary inclusion rates, consumption per head of livestock and per unit of product (feed efficiency)) |
|
|
3.5. Relative prices of feed commodities and livestock products (price ratios for units of key feed inputs, eg maize and soyabean, per unit of different livestock products, eg beef, milk, pig meat, poultry meat and eggs) |
|
|
3.6. Proportions of domestic crop production used for food and feed (by coarse grains, wheat, oilseeds, roots and tubers, and pulses, not including milling by-products) |
|
|
3.7. Proportions of concentrate feed consumption home grown or imported (and origins) |
|
|
3.8. Proportions of concentrate feed crop production exported |
|
|
3.9. Crop:fallow ratios, cropping indices and trends in cropping systems with feed crops |
|
|
3.10. Average yields and trends for feed crops by cropping systems |
|
|
3.11. Crop input utilization rates per unit area and per unit output of feed crops (fertilizers, pesticides, mechanisation) |
Land use changes are reported at national levels and in international databases, though they are not consistently accurate for all countries. They may also be monitored relatively easily by remote sensing. The use of marginal croplands, while a potentially important indicator, is not well monitored at present and is not easy to interpret from available soils and land-use data (see FAO 1993). There are procedural difficulties in defining marginal lands in ways that allow reliable comparisons across soils, regions and countries, and in collecting cropping statistics within categories of land capability or soil types. Such monitoring may be better conducted through periodic sample surveys or studies at district or national scales. Drainage effluent contamination is monitored in only a few situations; comparative data could be relatively easily obtained through periodic field surveys in selected relevant areas.
The priority list of direct indicators of environmental pressures does not include the indicators of greenhouse gas production (mainly CO2) from forest biomass burning, soil organic matter depletion or fossil fuel burning for agricultural energy. The contribution to these from feed crops will be relatively small, and the issues of land-use change, soil organic matter content and agricultural input utilization are captured in other indicators which are easier to measure.
Indirect indicators of environmental pressures A variety of indirect indicators of environmental pressures are identified in Table 41. These are primarily concerned with the levels or rates of consumption or production of concentrate feed commodities, or the factors that may affect such production and consumption (such as relative price ratios). Many of these indirect indicators have the advantage of being possible to estimate from available data published in national and some international statistics, at least at aggregated levels (such as the consumption of livestock products, and the prices of products and feeds). (It may be noted, however, that data are incomplete for a key indicator, 3.4, concerning the utilization of concentrate feeds by different livestock production systems and species. Although aggregate data on feed consumption are available it is not possible, from available statistics, to apportion consumption to different types of livestock or production systems and difficult, therefore, to assess the efficiency of feed use or to attribute environmental impacts to particular livestock systems).
Indicator 3.2. describes the potential for competition between human food and livestock feed uses of commodities (ie the extent to which feed demand reduces access to foods) by monitoring the adequacy of human diets. The more critical indicator may be the relative rates of consumption of grain foods by the poorest sectors of society, though data for this indicator are not commonly available. This issue cannot be monitored by a single indicator, however. A combination of indicators will be required including the adequacy of food consumption, the proportions of domestic commodity production used as feed or exported, and the relative prices of commodities used for food and feeds.
Many of the indirect indicators suffer the disadvantage that the linkages between them and the environmental impacts of concentrate feed production are not clear and may vary between locations (eg relative prices of concentrate feeds and livestock products). There is a dearth of studies of the empirical associations of these factors and environmental impacts, and of the mechanisms by which they may operate. Detailed case studies are required to establish the utility and validity of these indicators.
Some indirect indicators are relevant as ancillary information to assist the interpretation of other indicators. Thus the per capita consumption of livestock products may explain the mix of feed resources required, while the levels of per capita consumption of food grains (and relative prices of food and feed grains) may explain trends in demand for and production of foods and feeds (eg the extent to which demand for food grains is saturated and demand for feed grains able to increase without affecting food grain consumption).
Indicators 3.9. to 3.11. are of a different nature, concerning the intensity of cropping and trends in the likely origins of further increases in crop production. Thus indicators 2.1. and 2.2. together with indicators 3.9. and 3.10 describe trends in the increase in cropped areas, cropping intensity and yield levels. These changes imply different types and degrees of environmental impact as described in Section 4.3.2. Input utilization rates (indicator 3.11.) describe the potential for nutrient run-off and pesticide residue pressures on the environment, as well as the utilization of energy for agriculture (and consequent greenhouse gas production). Of these indicators, data are commonly available to describe cropping intensity, average crop yields and input utilization rates (except pesticides) at aggregate levels across different cropping systems. Few data are available at the level of different cropping systems, however, so that comparisons of geographical area or national statistics will be confounded by differences in the prevalence of different cropping systems.
The demand for livestock feeds is derived from the many different livestock production systems utilizing feeds, as outlined in Chapter 2. These systems are aggregated for this study into the groups identified by Sere (1994) (as outlined in Section 2.3.4 and Appendix 1). Feed utilization by these system groups (and therefore relative potential environmental impacts) is indicated in Tables 10 and 11 in Section 2.4.4. Following sections discuss the potential application of the environmental indicators to these systems to develop approaches to monitoring their environmental impacts.
There are a number of procedural difficulties, however, in identifying and linking appropriate indicators to particular livestock production systems. Three major difficulties are that:
purchased feeds utilized by many livestock production systems (particularly the more intensive landless systems) contain a variety of feeds from a mixture of alternative sources (cropping systems, countries), depending on market conditions. The linkages between particular livestock systems and particular sources of feeds are thus variable and may not be precisely definable. Thus the impacts of LLM systems in W Europe may include cropping impacts in USA, Brazil and Thailand for different crops and cropping systems.
many indicators of the environmental impacts of feed production are defined at the level of (or are dependant on ) general land-use or cropping system practices rather than for individual feed crops. These indicators are not easily related to particular livestock production systems. In such cases, it may be necessary to identify the type of land-use and cropping systems from which feeds are derived in order to identify appropriate indicators.
similarly many of the indirect indicators of environmental pressures of feed crop production are socio-economic indicators of feed demand, consumption or production calculated at a general level in the economy and not attributable to particular livestock production systems (eg per capita consumption of livestock products or relative prices of feed commodities and livestock products).
In practice, therefore, it will be appropriate to monitor most of the indicators outlined in Table 41 whatever the livestock production system under study, and particularly if monitoring is of a general nature at district or national levels. Closer definition of appropriate indicators may be possible for specific systems in particular locations, once it is established which are the main feed resources utilized and their origins (land-use circumstances, cropping systems and cropping intensity). Criteria for the selection (or omission) of indicators will include:
potential for impacts through land-use change
potential for pressures on marginal croplands
potential for expansion of exploitative cropping systems
potential for high-input agriculture and run-off impacts on water resources
the extent to which competition with human food supplies may be an issue
Table 42 presents a listing of the particular indicators to be monitored under these different circumstances (and which could be omitted from monitoring programmes if the criteria were not relevant). Indicators not listed would still need to be monitored in most circumstances.
Monitoring of environmental pressures and impacts may increasingly be required as part of programmes and projects to support development of livestock production. Such developments will in future include relevant environmental objectives to encourage sustainable utilization of resources and to manage pressures on the environment. Developments to be monitored may include district or national level policy initiatives and incentives to encourage certain types of livestock development, such as increased intensive poultry or milk production, or specific projects to develop particular enterprises, such as poultry production units and associated feed mills.
Table 42 Selection of indicators for monitoring environmental pressures and impacts under different land-use and crop production circumstances
|
Criteria for selection of indicators |
Indicators appropriate if relevance of criterion high(1) |
|
Potential for impacts through land-use change |
1.1, |
|
Potential for pressures on marginal croplands |
1.2, 1.3, 1.4 |
|
Potential for expansion of exploitative cropping systems |
1.2, 1.3, 1.4 |
|
Potential for high-input agriculture and run-off impacts on water resources |
1.5, 1.6 |
|
Extent of likely competition with human food supplies |
3.2, 3.3 |
1. Indicators as numbered in Table 41.
NB listed indicators may also be omitted from monitoring if criterion not relevant
Selection of indicators for these purposes will be subject to similar conditions as for specific livestock production systems outlined above. At the programme level a broad selection of several key indicators listed in Table 41 may be appropriate. At the specific project level the choice of indicators may be more selective according to the criteria outlined in Table 42 and in relation to the specific livestock products produced or feeds utilized. At the project level, particularly, it will be important to restrict the selection of indicators as much as possible to make monitoring manageable and cost-effective. The final selection of indicators in these circumstances will only be possible after careful consideration of the linkages from proposed projects to specific components of the environment affected (as outlined in Section 4.3) and is thus likely to be highly site specific. These processes will increasingly be adopted as part of Environment Impact Statement and Assessment procedures accompanying policy initiatives and projects.
![]()
![]()
![]()