This flagship publication is part of THE STATE OF THE WORLD series of the Food and Agriculture Organization of the United Nations.
Required citation:
FAO and UNEP. 2020.
The State of the World’s Forests 2020. Forests, biodiversity and people.
Rome.
DOI: https://doi.org/10.4060/ca8642en.
The designations employed and the presentation of material in this information product do not imply the expression of any opinion whatsoever on the part of the Food and Agriculture Organization of the United Nations (FAO) or United Nations Environmental Programme (UNEP) concerning the legal or development status of any country, territory, city or area or of its authorities, or concerning the delimitation of its frontiers or boundaries. The designations employed and the presentation of material in the maps do not imply the expression of any opinion whatsoever on the part of FAO or UNEP concerning the legal or constitutional status of any country, territory or sea area, or concerning the delimitation of frontiers. The mention of specific companies or products of manufacturers, whether or not these have been patented, does not imply that these have been endorsed or recommended by FAO or UNEP in preference to others of a similar nature that are not mentioned.
The views expressed in this information product are those of the author(s) and do not necessarily reflect the views or policies of FAO or UNEP.
ISBN
978-92-5-132419-6
ISSN 1020-5705
[PRINT]
ISSN 2521-7542 [ONLINE]
© FAO
2020
Some rights reserved. This work is made available under the Creative Commons Attribution-NonCommercial-ShareAlike 3.0 IGO licence (CC BY-NC-SA 3.0 IGO; https://creativecommons.org/licenses/by-nc-sa/3.0/igo).
Under the terms of this licence, this work may be copied, redistributed and adapted for non-commercial purposes, provided that the work is appropriately cited. In any use of this work, there should be no suggestion that FAO endorses any specific organization, products or services. The use of the FAO logo is not permitted. If the work is adapted, then it must be licensed under the same or equivalent Creative Commons license. If a translation of this work is created, it must include the following disclaimer along with the required citation: “This translation was not created by the Food and Agriculture Organization of the United Nations (FAO). FAO is not responsible for the content or accuracy of this translation. The original English edition shall be the authoritative edition.”
Any mediation relating to disputes arising under the licence shall be conducted in accordance with the Arbitration Rules of the United Nations Commission on International Trade Law (UNCITRAL) as at present in force.
Third-party materials. Users wishing to reuse material from this work that is attributed to a third party, such as tables, figures or images, are responsible for determining whether permission is needed for that reuse and for obtaining permission from the copyright holder. The risk of claims resulting from infringement of any third-party-owned component in the work rests solely with the user.
Sales, rights and licensing. FAO information products are available on the FAO website (www.fao.org/publications) and can be purchased through publications-sales@fao.org. Requests for commercial use should be submitted via: www.fao.org/contact-us/licence-request. Queries regarding rights and licensing should be submitted to: copyright@fao.org.
COVER PHOTOGRAPH © Ricky Martin/CIFOR
INDONESIA: A local man fishing in a forest lake at Gede Pangrango to meet the needs of everyday life.
1. Annual rate of forest area change
2. Other land with tree cover, 2020
3. Vulnerability status of forest plants, animals and fungi in the IUCN Red List as of December 2019
4. Examples of forest-associated infectious diseases
5. Global forest types and their protection status in 2015
6. Tree cover within protected areas in 2015, by global ecological zone
7. Financial instruments for conservation
8. Finance mobilized by ten large PES programmes
1. Global distribution of forests showing the ten countries with the largest forest area, 2020
2. Net forest area change by region, 1990–2020
3. Trends in global tree cover, 1992–2015
4. Global forest expansion and deforestation, 1990–2020
5. Percentage of naturally regenerating and planted forest by region, 2020
6. Percentage of plantation forests comprising native and introduced species, by region, 2020
7. Global forest area by climatic domain, 2020
8. Forest by global ecological zone
9. Proportion of forest area by patch size class and global ecological zone, 2015
10. Average forest patch size by global ecological zone, 2015
11. Forest area density index, 2015
12. Proportion of forest area by forest area density class and global ecological zone, 2015
13. Average forest area density by global ecological zone, 2015
14. Most-intact forests by global ecological zone, 2015
15. Most-fragmented forests by global ecological zone, 2015
16. Annual change in area of naturally regenerating forest, 1990–2020
17. Ten countries with the most tree species
18. Top ten countries and territories in terms of number of endemic tree species
19. Forest biodiversity significance, 2018
20. Forest biodiversity significance for areas of forest loss during 2000–2018
21. Forest biodiversity intactness, 2018
22. Bivariate map of forest biodiversity significance and intactness within forest biomes, 2018
25. Overlay of forest cover and poverty rate
26. Forest cover, forest area density and poverty in Malawi
27. Number of tree species providing food of importance to smallholder livelihoods
28. Production of forest nuts, 2017
29. Drivers of deforestation and forest degradation by region, 2000–2010
33. Proportion of land in a degraded state between 2000 and 2015 by region
34. Progress towards Goal 5 of the New York Declaration on Forests
36. Commitments to the Bonn Challenge as of February 2020
37. Percentage of forest in legally protected areas, 2020
38. Trends in area of forest within protected areas by region, 1990–2020
39. Increase in forest area within protected areas by forest type, 1992–2015
40. Increase in forests within protected areas by global ecological zone, 1992–2015
41. Percentage of forest within protected areas by global ecological zone, 2015
42. Trends in forest area primarily designated for conservation of biodiversity, 1990–2020
44. Sources of financing for reversing deforestation
1. What is forest biological diversity?
2. The first global assessment of biodiversity for food and agriculture
3. The rise, fall and rise again of the Selva Maya
5. Key goals, targets and indicators relevant to forest area
6. Forest versus tree cover: What is the difference?
7. Two examples of animal species that depend on primary forest for their survival
8. Challenges of monitoring and reporting on primary forests
9. Dryland forests – a first global assessment
10. Wetland forests: the example of the Cuvette Centrale
11. Tidal areas: mangrove forests
12. Key goals, targets and indicators relevant to decreasing forest degradation
13. Growing risks from invasive pests and pathogens associated with global changes
14. Causes and impacts of forest fragmentation
16. More than half of Europe’s endemic tree species face extinction
18. Forest-dwelling pollinators
19. Saproxylic beetle diversity in Mediterranean forests
20. Primate populations in forest regenerating from farmland, Costa Rica
21. Conservation, management and use of forest genetic resources
22. Assessing threats to conservation of the genetic resources of food-tree species in Burkina Faso
23. Implementation of the Global Plan of Action on forest genetic resources
24. Development of a regional strategy for conserving forest genetic resources in Europe
25. The challenge of defining forest-dependent people
26. Forests supporting inland fisheries in tropical countries
27. Issues associated with use of woodfuel for cooking
28. Links of forests and tree-based systems to dietary diversity
29. Examples of forest foods consumed in West Africa during the lean season
30. Brazil nut: a cornerstone of Amazonian forest conservation
33. Forest Europe’s recommendations for integrating human health into sustainable forest management
34. Complex drivers leading to different forest outcomes on Mount Elgon, Uganda
35. REDD+ under the UNFCCC and the Paris Agreement
37. Deforestation-free commodity chains: Integrating cocoa and forests in West Africa
38. Halting deforestation: recommendations of a global conference
39. Monitoring wildlife management in production forests in Cameroon
40. Key goals, targets and indicators relevant to forest restoration
41. Restoring forest landscapes through assisted natural regeneration
42. Rewilding and the reintroduction of keystone species
43. The Economics of Ecosystem Restoration initiative
44. Examples of new forest restoration and tree-planting pledges made in 2019
47. Labelling initiative supports stingless bee honey produced by Bolivian women
48. Territories and areas conserved by indigenous peoples and local communities
52. Key goals, targets and indicators relevant to sustainable forest management
53. Mainstreaming biodiversity into agriculture
55. Harnessing volunteer power to tackle invasive species
58. FAO remote-sensing platforms and tools for forestry
59. Collecting information on biodiversity in Papua New Guinea’s forests
60. Advances in remote sensing for biodiversity monitoring
61. The Singapore Index on Cities’ Biodiversity to monitor urban biodiversity conservation efforts
As we were putting the finishing touches to The State of the World’s Forests 2020 (SOFO), the world came face to face with the unprecedented challenges of the COVID-19 pandemic. While the immediate global priority is to tackle this public health emergency, our long-term response must also address the underlying causes of such a pandemic. The degradation and loss of forests is one such contributing factor, disrupting nature’s balance and increasing the risk and exposure of people to zoonotic diseases. Understanding and keeping track of the state of our world’s forests has never been so important.
This year marks the end of the United Nations Decade on Biodiversity and the implementation of the Strategic Plan for Biodiversity 2011–2020. All countries are coming together to review progress towards the Plan’s five Strategic Goals and the 20 Aichi Biodiversity Targets to shape the post-2020 global biodiversity framework.
This framework must be underpinned by evidence: evidence of the current state of the world’s biodiversity and recent trends; evidence of the linkages between biodiversity and sustainable development; and evidence of successful actions taken to conserve and sustainably use the many products and services that the world’s biodiversity provides to support food security and human well-being.
The vast majority of terrestrial biodiversity is found in the world’s forests – from boreal forests in the far North to tropical rainforests. Together, they contain more than 60 000 different tree species and provide habitats for 80 percent of amphibian species, 75 percent of bird species and 68 percent of mammal species. About 60 percent of all vascular plants are found in tropical forests. Mangroves provide breeding grounds and nurseries for numerous species of fish and shellfish and help trap sediments that might otherwise adversely affect seagrass beds and coral reefs, habitats for marine life.
The conservation of the majority of the world’s biodiversity is thus utterly dependent on the way in which we interact with and use the world’s forests.
This edition of SOFO examines the contributions of forests, and of the people who use and manage them, to the conservation and sustainable use of biodiversity. It assesses progress to date in meeting global targets and goals relating to forest biodiversity and describes the effectiveness of policies, actions and approaches for conservation and sustainable development alike, illustrated by case studies of innovative practices and win-win solutions.
This volume does not aim to be a comprehensive treatise on forest biodiversity, but rather to provide an update on its current state and a summary of its importance for humanity. It is intended to complement The State of the World’s Biodiversity for Food and Agriculture, released by the Commission on Genetic Resources for Food and Agriculture of the Food and Agriculture Organization of the United Nations (FAO) in 2019, last year’s Global Assessment Report on Biodiversity and Ecosystem Services of the Intergovernmental Science-Policy Platform on Biodiversity and Ecosystem Services (IPBES) and the Global Biodiversity Outlook 5 of the Convention on Biological Diversity (CBD).
For the first time, this edition of SOFO is a joint effort between two United Nations entities: FAO and the United Nations Environment Programme (UNEP). Building on our ongoing collaboration and comparative advantages, we bring together new information generated by FAO’s Global Forest Resources Assessment 2020 with analyses of the status and representativeness of protected forests over time undertaken by the UN Environment Programme World Conservation Monitoring Centre (UNEP-WCMC).
SOFO 2020 confirms that deforestation and forest degradation continue to take place at alarming rates, which contribute significantly to the ongoing loss of biodiversity. Agricultural expansion continues to be one of the main drivers, while the resilience of human food systems and their capacity to adapt to future change depends on that very biodiversity.
SOFO 2020 also identifies signs of hope. The rate of forest loss is decreasing globally and solutions that balance conservation and sustainable use of forest biodiversity do exist. To turn the tide on deforestation and biodiversity loss, we urgently need to see these solutions being scaled up as well as instill transformational change in the way we produce and consume food. We also need to conserve and manage forests and trees within an integrated landscape approach and reverse the damage done through forest restoration efforts.
Critical to these transformations are effective governance, policy alignment between sectors and administrative levels, land-tenure security, respect for the rights and knowledge of local communities and indigenous peoples, enhanced capacity for monitoring of biodiversity outcomes, and by no means least, innovative financing modalities.
Ultimately, we need to foster a new relationship with nature, and we can achieve that together. SOFO 2020 contributes to that vision. We hope you will find it interesting, valuable and inspiring.
Qu Dongyu |
Inger Andersen |
The State of the World’s Forests 2020 (SOFO 2020) was prepared by the FAO Forestry Policy and Resources Division in collaboration with the United Nations Environment Programme World Conservation Monitoring Centre (UNEP-WCMC).
The development of the report was guided by a core team of five senior staff members of FAO and UNEP-WCMC and led by the FAO Divisional Director, who assumed overall coordination for the publication.
Progress towards goals and targets related to forests and their biodiversity was assessed based on existing literature and commissioned studies. A series of case studies were compiled to provide practical examples of the conservation and sustainable use of forest biodiversity from around the world.
This issue of SOFO draws on the results of FAO’s Global Forest Resources Assessment 2020 (FRA 2020), which will also be published in 2020.
FRA 2020 examined the status and trends of more than 60 variables related to the extent, characteristics, condition, management and uses of forest across 236 countries and areas over the period 1990–2020.
The backbone of FRA 2020 is official data provided by a well-established network of officially nominated National Correspondents through a consolidated transparent and traceable reporting process. The application of a standardized reporting methodology enables monitoring changes over time and aggregation of data at regional and global levels.
Only data relevant to forest biological diversity were used for SOFO 2020. Most of these were at the global level and drawn on the Key Findings of FRA 2020, which were released shortly before SOFO 2020. Readers can explore more detailed information at regional and country level in the upcoming FRA 2020 report (FAO, 2020). Terms and definitions used in FRA 2020 can be found at http://www.fao.org/3/I8661EN/i8661en.pdf.
Three new studies were specifically commissioned for SOFO 2020:
A UNEP-WCMC analysis of annual land-cover data from 1992 to 2015 provided new information on how the area under tree cover varies significantly from year to year. This was further investigated in relation to FAO’s global ecological zone map, the World Database of Key Biodiversity Areas (WDKBA) and the World Database on Protected Areas (WDPA) providing new insights on the representativeness of protected areas and on changes in the protection status of forests over time.
The Joint Research Centre of the European Commission in collaboration with the United States Forest Service applied an existing methodology for analysing spatial patterns of forests to the global Copernicus Land Cover map for 2015, overlaid with FAO’s global ecological zone map. This provided new data on forest intactness and fragmentation by broad forest types.
The World Bank contributed a study on the links between forests and poverty. This was based on a literature review and overlaying forest maps with poverty data held by the Bank.
All chapters benefited from the support of staff and consultants for data-collection and/or writing. The final document was assembled and edited by a senior consultant.
Internal peer reviewers from different units and departments in FAO and UNEP and external peer reviewers provided extensive comments and suggestions on the draft versions of the document.
The State of the World’s Forests 2020 was prepared under the overall direction of Mette L. Wilkie, who led a core team comprising Anssi Pekkarinen, Ewald Rametsteiner, Andrew Taber and Sheila Wertz-Kanounnikoff from FAO and Will Simonson from the United Nations Environment Programme World Conservation Monitoring Centre (UNEP-WCMC). Andrea Perlis assisted the core team in compiling and editing the publication. Additional contributors and reviewers are listed below.
FAO:
Contributors: Hitofumi Abe, Safia Aggarwal, Astrid
Agostini, Damien Bertrand, Simone Borelli, Marco Boscolo, Pierre Bouillon, Amanda
Bradley, Anne Branthomme, Vito Brito, Lyndall Bull, Malgorzata Buszko-Briggs,
Benjamin Caldwell, Laura Cerioni, Michela
Conigliaro, Jose Diaz Diaz, Yoshihide Endo, Aurelie Fernandez, Serena Fortuna,
Julian Fox, Sarah Fumey, Monica Garzuglia, Emma Gibbs, Marta Gruca, Abdel Hamied
Hamid, Daphne Hewitt, Sooyeon Jin, Örjan Jonsson, Adolfo Kindgard, Jarkko Koskela,
Arvvdas Lebedys, Thais Linhares
Juvenal, Erik Lindquist, Yuka Makino, Peter Moore, Giulia Muir, Azdad Mustapha,
Scott Newman, Maria Isabel Ochoa, Chiara Patriarca, Peter Pechaek, Clelia Maria
Puzzo, Sara Casallas Ramirez, Kristina Rodina, Moctar Sacande, Shiroma Sathyapala, Kenichi Shono, Bianca
Sipala, Simona Sorrenti, Elaine
Springgay, Ashley Steel, Tiina Vähänen, Martina Venturi, Pedro Vivar, Anni
Vuohelainen, Sven Walter, Zuzhang Xia and Daowei Zhang.
Reviewers: Julie Belanger, Lorenzo Bellu, Nora Berrahmouni, Jeffrey Campbell, Frederic Castell, Ana Paula De la Ocampos, Michael Euler, Adriana Ignaciuk, Lourdes Orlando, Dafydd Pilling, EranRaizman, Selvaraju Ramasamy, Kostas Stamoulis and Carlos Vaquero.
UNEP and UNEP-WCMC:
Contributors: Andy Arnell, Abigail Burns,
Lauren Coad, Alexander Gangur, Joe Gosling, Samantha Hill, Lisa Ingwall-King,
Valerie Kapos, Steven King, Edward Lewis, Calum Maney, Emma Martin, Ana Paula de la
O Campos, Barbara Pollini,
Marieke Sassen, Emma Scott, Arnout van Soesbergen and James Vause.
Reviewers: Abdelkader Bensader, Neil Burgess, Katherine Despot-Belmonte, Satu Glaser, Kelly Malsch and Susan Mutebi-Richards.
Joint Research Centre of the European Commission
(Study on forest fragmentation):
Peter Vogt.
United States Forest
Service (Study on forest fragmentation):
Kurt Ritters.
World Bank (Study
on forests and poverty):
Contributors: Shun Chonabayashi, with support from Yulin Chen, Shanjun Li, Luming
Tan and Ziye Zhang.
Reviewers: Benoît Blarel, Timothy H. Brown, Susmita Dasgupta, Martin Heger, Minh Cong Nguyen.
Case studies and
boxes:
Case studies and boxes were provided by
FAO and UNEP-WCMC staff and the following external contributors:
Case study on Dana Biosphere Reserve, Jordan: Qamar Almini, Nashat Hamidan and Amer Rfou’, The Royal Society for the Conservation of Nature, Jordan, and Mohammad Alnsour, Watershed and Development Initiative, Jordan.
Case study on the North American model of wildlife conservation: Shane Patrick Mahoney, President, Conservation Visions, Inc.
Case study on the Singapore Index on City Biodiversity: Lena Chan, National Parks Board of Singapore.
Box on the regional strategy for conserving forest genetic resources in Europe: Michele Bozzano, Forest Genetic Resources Programme, European Forestry Institute.
Box on assessing threats to the genetic resources of food tree species in Burkina Faso: Hannes Gaisberger and Barbara Vinceti, Bioversity International.
The State of the World’s Forests 2020 also benefited from external peer reviews by David Cooper and Lisa Janishevski (CBD Secretariat), Christel Palmberg-Lerche (ex-FAO) and Fred Stolle (World Resources Institute), as well as comments on specific sections from many colleagues in other technical divisions within FAO.
The FAO Meeting Programming and Documentation Service provided printing services and carried out the translation. The Publishing Group in FAO’s Office for Corporate Communication provided editorial support, design and layout, as well as production coordination, for all six languages.
AAD
Action Against Desertification
ABS
access and benefit-sharing
ADB
African Development Bank
AU
African Union
BESNet
Biodiversity and Ecosystem Services Network
BGCI
Botanic Gardens Conservation International
CAFI
Central African Forest Initiative
CATIE
Tropical Agricultural Research and Higher Education Center
CBD
Convention on Biological Diversity
CBI
City Biodiversity Index
CBNRM
Community-based Natural Resources Management
CEPF
Critical Ecosystem Partnership Fund
CFS
Committee on World Food Security
CGRFA
Commission on Genetic Resources for Food and Agriculture
CIFOR
Center for International Forestry Research
CIRAD
Agricultural Research Centre for International Development
CITES
Convention on International Trade in Endangered Species of Wild Flora and Fauna
COMIFAC
Central African Forest Commission
CONAFOR
National Forestry Commission of Mexico
CONAP
Consejo Nacional de Áreas Protegidas of Guatemala
CPF
Collaborative Partnership on Forests
CPW
Collaborative Partnership on Sustainable Wildlife Management
CRITFC
Colombia River Inter-Tribal Fish Commission
DBR
Dana Biosphere Reserve
DFSC
Danida Forest Seed Centre
EC
European Commission
ESA
European Space Agency
ESA CCI
European Space Agency Climate Change Initiative
EU
European Union
EUFGIS
European Information System on Forest Genetic Resources
EUFORGEN
European Forest Genetic Resources Programme
FAO
Food and Agriculture Organization of the United Nations
FAOSTAT
FAO statistics database
FCPF
Forest Carbon Partnership Facility
FERI
Forest Ecosystem Restoration Initiative
FLD
Forest and Landscape Denmark
FLEGT
Forest Law Enforcement, Governance and Trade
FONAFIFO
National Forestry Financing Fund of Costa Rica
FPIC
Free, Prior and Informed Consent
FRA
Global Forest Resources Assessment
FSC
Forest Stewardship Council
GBP
pound sterling
GCF
Green Climate Fund
GDP
gross domestic product
GEF
Global Environment Facility
GEZ
global ecological zone
GPFLR
Global Partnership on Forest and Landscape Restoration
HLPE
High Level Panel of Experts on Food Security and Nutrition of the Committee on World
Food Security
HWC
human–wildlife conflict
ICCA
territory or area conserved by indigenous people and local communities
IDS
Institute of Development Studies
IFAD
International Fund for Agricultural Development
IFPRI
International Food Policy Research Institute
IIED
International Institute for Environment and Development
ILO
International Labour Organization
IMF
International Monetary Fund
INAB
Instituto Nacional de Bosques of Guatemala
INBAR
International Bamboo and Rattan Organisation
INTERPOL
International Criminal Police Organization
IPBES
Intergovernmental Science-Policy Platform on Biodiversity and Ecosystem Services
IPCC
Intergovernmental Panel on Climate Change
IPGRI
International Plant Genetic Resources Institute
ITC
International Trade Centre
ITTO
International Tropical Timber Organization
IUCN
International Union for Conservation of Nature
IUCN WCPA
International Union for Conservation of Nature World Commission on Protected Areas
JRC
Joint Research Centre of the European Commission
KBA
Key Biodiversity Area
MAP
medicinal and aromatic plant
MEA
Millennium Ecosystem Assessment
MEF
Ministry of Environment and Forestry, Republic of Indonesia
MERECP
Mount Elgon Regional Ecosystem Conservation Programme
MINEF
Ministry of Environment and Forests, Cameroon
MINEPDED
Ministry of Environment, Nature Protection and Sustainable Development, Cameroon
MINFOF
Ministry of Forests and Wildlife, Cameroon
MIPAAF
Ministry of Agriculture, Food and Forestry Policies, Italy
MNRT
Ministry of Natural Resources and Tourism, United Republic of Tanzania
MoE
Ministry of Environment, Jordan
MoP
Ministry of Planning and International Cooperation, Jordan
MPP
Mountain Partnership Products
NACSO
Namibian Association of CBNRM Support Organizations
NCED
National Conservation Easement Database
NDC
Nationally Determined Contribution
NGO
non-governmental organization
NGS
National Geographic Society
NWFP
non-wood forest product
NYDF
New York Declaration on Forests
OECD
Organisation for Economic Co-operation and Development
OECM
other effective area-based conservation measure
OIE
World Organisation for Animal Health
PES
payment for ecosystem services
PFM
participatory forest management
PNAS
Proceedings of the National Academy of Sciences of the United States of America
PREDICTS
Projecting Responses of Ecological Diversity in Changing Terrestrial Systems
REDD+
reducing emissions from deforestation and forest degradation and the role of
conservation, sustainable management of forests and enhancement of forest carbon
stocks in developing countries
RNZ
Radio New Zealand
RRI
Rights and Resources Initiative
RSCN
Royal Society for the Conservation of Nature, Jordan
SADC
Southern African Development Community
SDG
Sustainable Development Goal
SEEA
System of Environmental Economic Accounting
SEGeF
Suivi de la gestion de la faune dans les forêts de production
SEPAL
System for Earth Observation Data Access, Processing and Analysis for Land
Monitoring
SI
Singapore Index on Cities’ Biodiversity
SMFE
small and medium-sized forest enterprise
SOFO
The State of the World’s Forests
SPDA
Sociedad Peruana de Derecho Ambiental, Peru
SVLK
Sistem Verificasi Legalitas Kayu of Indonesia
TFCA
United States Tropical Forest Conservation Act
UAESPNN
Unidad Administrativa Especial del Sistema de Parques Nacionales Naturales
UN
United Nations
UN-REDD
United Nations Programme on Reducing Emissions from Deforestation and Forest
Degradation
UNCCD
United Nations Convention to Combat Desertification
UNCTAD
United Nations Conference on Trade and Development
UNDESA
United Nations Department of Economic and Social Affairs
UNDP
United Nations Development Programme
UNEP
United Nations Environment Programme
UNEP-WCMC
United Nations Environment Programme World Conservation Monitoring Centre
UNESCO
United Nations Educational, Scientific and Cultural Organization
UNFCCC
United Nations Framework Convention on Climate Change
UNICEF
United Nations Children’s Fund
UNODC
United Nations Office on Drugs and Crime
USAID
United States Agency for International Development
USD
United States dollar
USDA
United States Department of Agriculture
US/ICOMOS
United States Committee of the International Council on Monuments and Sites
VFR
Village Forest Reserves
WCMC
World Conservation Monitoring Centre
WCPA
World Commission on Protected Areas
WCS
Wildlife Conservation Society
WDPA
World Database of Protected Areas
WHO
World Health Organization
WRI
World Resources Institute
WWF
World Wide Fund for Nature
ZSL
Zoological Society of London
As the United Nations Decade on Biodiversity 2011–2020 comes to a close and countries prepare to adopt a post-2020 global biodiversity framework, this edition of The State of the World’s Forests (SOFO) takes the opportunity to examine the contributions of forests, and of the people who use and manage them, to the conservation and sustainable use of biodiversity. It is intended to complement The State of the World’s Biodiversity for Food and Agriculture, released by the Food and Agriculture Organization of the United Nations (FAO) in February 2019; the Global Assessment Report on Biodiversity and Ecosystem Services of the Intergovernmental Science-Policy Platform on Biodiversity and Ecosystem Services (IPBES), the draft of which was released in 2019 and the Global Biodiversity Outlook 5 of the Convention on Biological Diversity (CBD), released in 2020.
Forests harbour most of Earth’s terrestrial biodiversity. The conservation of the world’s biodiversity is thus utterly dependent on the way in which we interact with and use the world’s forests. Forests provide habitats for 80 percent of amphibian species, 75 percent of bird species and 68 percent of mammal species. About 60 percent of all vascular plants are found in tropical forests. Mangroves provide breeding grounds and nurseries for numerous species of fish and shellfish and help trap sediments that might otherwise adversely affect seagrass beds and coral reefs, which are habitats for many more marine species.
Forests cover 31 percent of the global land area but are not equally distributed around the globe. Almost half the forest area is relatively intact, and more than one-third is primary forest. More than half of the world’s forests are found in only five countries (Brazil, Canada, China, Russian Federation and United States of America). Almost half the forest area (49 percent) is relatively intact, while 9 percent is found in fragments with little or no connectivity. Tropical rainforests and boreal coniferous forests are the least fragmented, whereas subtropical dry forest and temperate oceanic forests are among the most fragmented. Roughly 80 percent of the world’s forest area is found in patches larger than 1 million hectares. The remaining 20 percent is located in more than 34 million patches across the world – the vast majority less than 1 000 hectares in size.
More than one-third (34 percent) of the world’s forests are primary forests, defined as naturally regenerated forests of native tree species where there are no clearly visible indications of human activity and the ecological processes are not significantly disturbed.
Deforestation and forest degradation continue to take place at alarming rates, which contributes significantly to the ongoing loss of biodiversity. Since 1990, it is estimated that some 420 million hectares of forest have been lost through conversion to other land uses, although the rate of deforestation has decreased over the past three decades. Between 2015 and 2020, the rate of deforestation was estimated at 10 million hectares per year, down from 16 million hectares per year in the 1990s. The area of primary forest worldwide has decreased by over 80 million hectares since 1990. More than 100 million hectares of forests are adversely affected by forest fires, pests, diseases, invasive species drought and adverse weather events.
Agricultural expansion continues to be the main driver of deforestation and forest fragmentation and the associated loss of forest biodiversity. Large-scale commercial agriculture (primarily cattle ranching and cultivation of soya bean and oil palm) accounted for 40 percent of tropical deforestation between 2000 and 2010, and local subsistence agriculture for another 33 percent. Ironically, the resilience of human food systems and their capacity to adapt to future change depends on that very biodiversity – including dryland-adapted shrub and tree species that help combat desertification, forest-dwelling insects, bats and bird species that pollinate crops, trees with extensive root systems in mountain ecosystems that prevent soil erosion, and mangrove species that provide resilience against flooding in coastal areas. With climate change exacerbating the risks to food systems, the role of forests in capturing and storing carbon and mitigating climate change is of ever-increasing importance for the agricultural sector.
The net loss of forest area decreased from 7.8 million hectares per year in the 1990s to 4.7 million hectares per year during 2010–2020. While deforestation is taking place in some areas, new forests are being established through natural expansion or deliberate efforts in others. As a result, the net loss of forest area is less than the rate of deforestation. In absolute terms, the global forest area decreased by 178 million hectares between 1990 and 2020, which is an area about the size of Libya.
The biodiversity of forests varies considerably according to factors such as forest type, geography, climate and soils – in addition to human use. Most forest habitats in temperate regions support relatively few animal and tree species and species that tend to have large geographical distributions, while the montane forests of Africa, South America and Southeast Asia and lowland forests of Australia, coastal Brazil, the Caribbean islands, Central America and insular Southeast Asia have many species with small geographical distributions. Areas with dense human populations and intense agricultural land use, such as Europe, parts of Bangladesh, China, India and North America, are less intact in terms of their biodiversity. Northern Africa, southern Australia, coastal Brazil, Madagascar and South Africa, are also identified as areas with striking losses in biodiversity intactness.
Progress on preventing the extinction of known threatened species and improving their conservation status has been slow. More than 60 000 different tree species are known, more than 20 000 of which have been included in the International Union for Conservation of Nature (IUCN) Red List of Threatened Species, and more than 8 000 of these are assessed as globally threatened (Critically Endangered, Endangered or Vulnerable). More than 1 400 tree species are assessed as critically endangered and in urgent need of conservation action. Some 8 percent of assessed forest plants, 5 percent of forest animals and 5 percent of fungi found in forests are currently listed as critically endangered.
The forest-specialist index, based on 455 monitored populations of 268 forest mammals, amphibians, reptiles and birds, fell by 53 percent between 1970 and 2014, an annual rate of decline of 1.7 percent. This highlights the increased risk of these species becoming vulnerable to extinction.
On a positive note, the Nagoya Protocol on Access to Genetic Resources and the Fair and Equitable Sharing of Benefits Arising from their Utilization has been ratified by 122 contracting Parties (an increase of 74 percent from 2016) and 146 Parties have ratified the International Treaty on Plant Genetic Resources for Food and Agriculture.
All people depend upon forests and their biodiversity, some more than others. Forests provide more than 86 million green jobs and support the livelihoods of many more people. An estimated 880 million people worldwide spend part of their time collecting fuelwood or producing charcoal, many of them women. Human populations tend to be low in areas of low-income countries with high forest cover and high forest biodiversity, but poverty rates in these areas tend to be high. Some 252 million people living in forests and savannahs have incomes of less than USD 1.25 per day.
MEXICO
Millions of the
Monarch butterfly (Danaus plexippus) migrate annually from
Canada to Mexico where they spend the winter in the forest.
Feeding humanity and conserving and sustainably using ecosystems are complementary and closely interdependent goals. Forests supply water, mitigate climate change and provide habitats for many pollinators, which are essential for sustainable food production. It is estimated that 75 percent of the world’s leading food crops, representing 35 percent of global food production, benefit from animal pollination for fruit, vegetable or seed production.
Worldwide, around 1 billion people depend to some extent on wild foods such as wild meat, edible insects, edible plant products, mushrooms and fish, which often contain high levels of key micronutrients. The value of forest foods as a nutritional resource is not limited to low- and middle-income countries; more than 100 million people in the European Union (EU) regularly consume wild food. Some 2.4 billion people – in both urban and rural settings – use wood-based energy for cooking.
Human health and well-being are closely associated with forests. More than 28 000 plant species are currently recorded as being of medicinal use and many of them are found in forest ecosystems. Visits to forest environments can have positive impacts on human physical and mental health and many people have a deep spiritual relationship to forests. Yet, forests also pose health risks. Forest-associated diseases include malaria, Chagas disease (also known as American trypanosomiasis), African trypanosomiasis (sleeping sickness), leishmaniasis, Lyme disease, HIV and Ebola. The majority of new infectious diseases affecting humans, including the SARS-CoV2 virus that caused the current COVID-19 pandemic, are zoonotic and their emergence may be linked to habitat loss due to forest area change and the expansion of human populations into forest areas, which both increase human exposure to wildlife.
Solutions that balance conservation and sustainable use of forest biodiversity are critical – and possible. Not all human impacts on biodiversity are negative, as shown by the many concrete examples in this publication of recent successful initiatives to manage, conserve, restore and sustainably use forest biodiversity.
Actions to combat deforestation and illegal logging have gathered pace over the past decade – as have international agreements and results-based payments. So far, seven countries have reported reduced deforestation to the United Nations Framework Convention on Climate Change (UNFCCC) and countries are now accessing payments based on reducing emissions from deforestation and forest degradation from the Green Climate Fund and similar financing mechanisms. Efforts to address illegal logging are spearheaded by trade regulations in consumer countries that require importers to demonstrate that timber has been harvested legally. Many tropical timber-producing countries are making corresponding efforts to strengthen legal compliance and verification. Fifteen of them are developing national systems to assure legality of timber operations under the EU Forest Law Enforcement, Governance and Trade mechanism. As part of this mechanism, countries are required to also implement measures to prevent illegal hunting.
Aichi Biodiversity Target 11 (to protect at least 17 percent of terrestrial area by 2020) has been exceeded for forest ecosystems as a whole. However, protected areas alone are not sufficient to conserve biodiversity. Globally, 18 percent of the world’s forest area, or more than 700 million hectares, fall within legally established protected areas such as national parks, conservation areas and game reserves (IUCN categories I–IV). However, these areas are not yet fully representative of the diversity of forest ecosystems. A special study conducted for SOFO 2020 on trends in protected forest area by global ecological zones (GEZs) between 1992 and 2015 found that more than 30 percent of tropical rainforests, subtropical dry forests and temperate oceanic forests were within legally protected areas (IUCN categories I–VI) in 2015. The study also found that subtropical humid forest, temperate steppe and boreal coniferous forest should be given priority in future decisions to establish new protected areas since less than 10 percent of these forests are currently protected. Areas with high values for both biodiversity significance and intactness, for example the northern Andes and Central America, southeastern Brazil, parts of the Congo Basin, southern Japan, the Himalayas and various parts of Southeast Asia and New Guinea, should likewise be given high priority.
Limited progress has been made to date on classifying specific forest areas as other effective area-based conservation measures, but guidance on this category is being developed and has significant potential for forests.
Aichi Biodiversity Target 7 (by 2020, areas under agriculture, aquaculture and forestry are managed sustainably, ensuring conservation) has not been met for forests, but the management of the world’s forests is improving.The area of forest under long-term management plans has increased significantly in the past 30 years to an estimated 2.05 billion hectares in 2020, equivalent to 54 percent of the global forest area.
Current negative trends in biodiversity and ecosystems will undermine progress towards the Sustainable Development Goals (SDGs). The world’s biodiversity underpins life on Earth, but despite some positive trends, the loss of biodiversity continues at a rapid rate. Transformational change is needed in the way we manage our forests and their biodiversity, produce and consume our food and interact with nature. It is imperative that we decouple environmental degradation and unsustainable resource use from economic growth and associated production and consumption patterns and that land-use decisions take the true value of forests into account.
Ensuring positive outcomes for both biodiversity and people requires a careful balance between conservation goals and demands for resources that support livelihoods. There is an urgent need to ensure that biodiversity conservation be mainstreamed into forest management practices in all forest types. To do so, a realistic balance must be struck between conservation goals and local needs and demands for resources that support livelihoods, food security and human well-being. This requires effective governance; policy alignment between sectors and administrative levels; land-tenure security; respect for the rights and knowledge of local communities and indigenous peoples; and enhanced capacity for monitoring of biodiversity outcomes. It also requires innovative financing modalities.
We need to transform our food systems to halt deforestation and the loss of biodiversity. The biggest transformational change is needed in the way in which we produce and consume food. We must move away from the current situation where the demand for food is resulting in inappropriate agricultural practices that drive large-scale conversion of forests to agricultural production and the loss of forest-related biodiversity. Adopting agroforestry and sustainable production practices, restoring the productivity of degraded agricultural lands, embracing healthier diets from sustainable food systems and reducing food loss and waste are all actions that urgently need to be scaled up. Agribusinesses must meet their commitments to deforestation-free commodity chains, and companies that have not made zero-deforestation commitments should do so. Commodity investors should adopt business models that are environmentally and socially responsible. These actions will, in many cases, require a revision of current policies – in particular fiscal policies – and regulatory frameworks.
Large-scale forest restoration is needed to meet the SDGs and to prevent, halt and reverse the loss of biodiversity. While 61 countries have, together, pledged to restore 170 million hectares of degraded forest lands under the Bonn Challenge, progress to date is slow. Forest restoration, when implemented appropriately, helps restore habitats and ecosystems, create jobs and income and is an effective nature-based solution to climate change. The United Nations Decade on Ecosystem Restoration 2021–2030, announced in March 2019, aims to accelerate ecosystem restoration action worldwide.
Forests are increasingly recognized for their role as a nature-based solution to many sustainable development challenges, as manifest in strengthened political will and a series of commitments to reduce rates of deforestation and to restore degraded forest ecosystems. We must build on this momentum to catalyse bold actions to prevent, halt and reverse the loss of forests and their biodiversity, for the benefit of current and future generations.
As the United Nations Decade on Biodiversity 2011–2020 comes to a close and countries prepare to adopt a post-2020 global biodiversity framework, this edition of The State of the World’s Forests (SOFO) takes the opportunity to examine the contributions of forests, and of the people who use and manage them, to the conservation and sustainable use of biodiversity (Box 1). By focusing specifically on forests and their biodiversity, it is intended to complement The State of the World’s Biodiversity for Food and Agriculture, released by FAO in February 2019 (FAO, 2019a) (Box 2), the Global Assessment Report on Biodiversity and Ecosystem Services of the IPBES, the draft of which was released in 2019, and the forthcoming Global Biodiversity Outlook 5 of the CBD.
Forest biological diversity is a broad term that refers to all life forms found within forested areas and the ecological roles they perform. As such, forest biological diversity encompasses not just trees, but the multitude of plants, animals and microorganisms that inhabit forest areas and their associated genetic diversity.
Forest biological diversity can be considered at different levels, including ecosystem, landscape, species, population and genetic. Complex interactions can occur within and between these levels. In biologically diverse forests, this complexity allows organisms to adapt to continually changing environmental conditions and to maintain ecosystem functions.
In the annex to Decision II/9 (CBD, n.d.a), the Conference of the Parties to the CBD recognized that:
“Forest biological diversity results from evolutionary processes over thousands and even millions of years which, in themselves, are driven by ecological forces such as climate, fire, competition and disturbance. Furthermore, the diversity of forest ecosystems (in both physical and biological features) results in high levels of adaptation, a feature of forest ecosystems which is an integral component of their biological diversity. Within specific forest ecosystems, the maintenance of ecological processes is dependent upon the maintenance of their biological diversity.”
SOURCE: CBD n.d.b.
The State of the World’s Biodiversity for Food and Agriculture (FAO, 2019a), provides a global assessment of the state of all components of biodiversity of relevance to food and agriculture (crop and livestock production, forestry, fisheries and aquaculture). It complements the global assessments of the genetic resources of forest, plants (crops), animals (livestock) and aquatic species (farmed species and their wild relatives within national jurisdiction) (FAO, 1997; 2007; 2010a; 2014a; 2015a; 2019b) prepared under the guidance of the Commission on Genetic Resources for Food and Agriculture. It does so by focusing particularly on categories of biodiversity not addressed in detail in these reports, including invertebrates, microorganisms and other species that provide supporting and regulating ecosystem services in and around production systems and wild species that are sources of wild foods. It also focuses on interactions between different components of biodiversity.
The publication draws on 91 country reports, reports from 27 international organizations and several specially commissioned thematic studies, as well as on the wider global literature. It provides an overview of the various contributions that biodiversity makes to food and agriculture and of the status and trends of relevant components of biodiversity and the drivers of change affecting them. It also discusses the status of implementation of practices and strategies for sustainable use and conservation of biodiversity for food and agriculture and of related policy, legal and institutional frameworks.
Forests harbour most of Earth’s terrestrial biodiversity (MEA, 2005) and provide habitats for 80 percent of amphibian species, 75 percent of bird species and 68 percent of mammal species (Vié, Hilton-Taylor and Stuart, 2009). The GlobalTreeSearch database (BGCI, 2019) records more than 60 000 species of trees, more than 20 000 of which have been included in the IUCN Red List and over 8 000 of which are assessed as globally threatened (IUCN, 2019a). About 60 percent of vascular plants are found in tropical forests (see Chapter 3). Along tropical coasts, mangroves provide breeding grounds and nurseries for numerous species of fish and shellfish and help trap sediments that might otherwise adversely affect seagrass beds and coral reefs, habitats for many more marine species.
In both low- and high-income countries in all climatic zones, communities that live within forests rely the most directly on forest biodiversity for their lives and livelihoods. However, nearly all people today have at least some contact with forests and/or the products of their biodiversity and we all benefit from the functions provided by components of this biodiversity in the carbon, water and nutrient cycles and through the links with food production.
The deep relationship between people and forests and their associated biological diversity has a long history, reflecting the roots of the human species in forests and savannahs (Roberts, 2019). Fossil records date human use of plants to at least the Middle Palaeolithic, some 60 000 years ago (Solecki, 1975). For millennia, the myriad species of flora and fauna of forests have provided vital sources of raw materials for food and feed, construction, clothing, handicrafts, medicines and other daily livelihood needs (Camara-Leret and Denney, 2019). Scholars going back at least to Charles Darwin have recognized the influences of the ecological characteristics of forested regions and their biodiversity on the nature of human societies, human distribution across landscapes and the history of civilizations. Harvesting of and trade in many forest plants have supported and in some cases driven the spread of human societies around the globe: for instance, trade in the wood and highly valued red dye of Paubrasilia echinata on the eastern coast of South America, and nutmeg from Myristica fragrans in Indonesia had major influences on European colonial activity from the fifteenth century on.
Archaeological and ethnobotanical evidence suggests that human activities have influenced forest ecosystems and their biodiversity since ancient times (Roosevelt et al., 1996; Peters, 2000) (Box 3). This is true even in some of the most remote forests, such as in the heart of the Amazon, where the diversity and distribution of some species reflect a long history of plant domestication (Kareiva et al., 2007; Dourojeanni, 2017; Levis et al., 2017). The distribution of valuable timber species across the tropics, such as mahogany (Swietenia spp.), is in part due to ecological impacts associated with ancient communities that disappeared centuries ago (Vlam et al., 2017). The same is true for fruit trees and other sources of forest foods.
The Selva Maya is a vast area of lowland tropical forest at the juncture of Belize, Guatemala and Mexico. It extends over some 4.2 million hectares and is a highly biologically diverse region. In addition to its biological characteristics, the region is also archaeologically and culturally rich. It is the cradle for one of the world’s great ancient civilizations – the Mayans – which built major centres such as Tikal, El Mirador, Chichén Itzá and Ek Balam between 2000 BCE and 900 CE. At its height during the Late Classic Period (650 to 800 CE), the region’s population was likely between 7 million and 11 million people (Canuto et al., 2018).
Despite its biological and cultural richness, today these forests face serious threats. Estimates indicate that in the past 25 years, approximately 38 percent of the forests have been lost in the Guatemalan portion of the Selva Maya alone, with a decline in forest cover from 2.62 million hectares to 1.63 million hectares between 1991 and 2016 (INAB, 2019). This was mainly due to rapid population growth, expansion of agriculture (crop and livestock), illegal logging and forest fires (Blackman, 2015). This forest loss has serious environmental and economic consequences, including the loss of livelihoods of forest-dependent communities and peoples, water scarcity, destruction of habitats for endangered species and increased greenhouse gas emissions, which contribute to climate change.
However, the Selva Maya has experienced periods of forest loss in the past from which it has recovered. Scientific evidence suggests that the decline of the Mayan civilization during the Terminal Classic Period (830–950 CE) was related to the climate becoming drier. This change was likely accelerated by expansion of agriculture, which contributed to a decline in forest cover, which in turn reduced the availability of water (Cook, et al., 2012; Evans, et al., 2018). Although the resulting environmental change was not solely responsible for the decline of the Mayan civilization, it seems to have been a significant factor (Turner and Sabloff, 2012). In this regard, what happened over a millennium ago has striking parallels with what is happening today.
This lesson from ancient history should inform approaches and policies for natural resource management today. It is important to get the balance right between the conservation of forests and their biodiversity and the use of resources to improve the livelihoods of local communities and indigenous populations that depend on forests today. That this balance is possible is showcased in the same region by the community forest concessions in the Maya Biosphere Reserve in Guatemala (see Case Study 3). The performance of community concessions granted in the reserve provides solid evidence that, given the necessary enabling conditions – such as an appropriate regulatory framework, strong community organizations, technical assistance, market access, institutional support and other incentives – it is possible to improve well-being and generate development while protecting natural resources and maintaining forest cover and biodiversity.
Forest biodiversity continues to face challenges today, through overexploitation but above all through agricultural expansion – the main driver of deforestation and forest fragmentation and the associated loss of forest biodiversity. Ironically, the resilience of human food systems and their capacity to adapt to future change depends on that very biodiversity, including dryland-adapted shrub and tree species that help combat desertification, forest-dwelling bee species that pollinate crops, trees with extensive root systems in mountain ecosystems that prevent soil erosion and sedimentation, and mangrove species that provide resilience against flooding in coastal areas, to name just a few examples. Forests have an essential role in the maintenance of biodiversity as a gene pool for food and medicinal crops. With climate change exacerbating the risks to food systems, the role of forests in capturing and storing carbon and mitigating climate change is paramount.
However, not all human impacts on biodiversity are negative, as shown by the many concrete examples in this publication of recent successful initiatives to manage, conserve, restore and sustainably use forest biodiversity.
This volume of SOFO does not aim to be a comprehensive treatise on the subject of forest biodiversity, but rather to provide an update on its current state and a summary of its importance for humanity. It assesses progress to date in meeting global targets and goals (Box 4) and illustrates the effectiveness of policies, actions and approaches, in terms of both conservation and sustainable development outcomes, through a series of case studies aimed at identifying innovative practices, success factors and win–win solutions.
The objectives of the CBD, which was adopted in 1992 (UN, 1992a), are the conservation of biodiversity (including forest biodiversity), the sustainable use of its components, and the fair and equitable sharing of the benefits arising out of the utilization of genetic resources. The Strategic Plan for Biodiversity 2011–2020 (CBD, 2010a) includes 20 time-bound, measurable targets to be met by 2020: the Aichi Biodiversity Targets. Several of these targets relate to forest ecosystems. New targets are expected to be agreed at the fifteenth Conference of the Parties to the Convention in October 2020. The Nagoya Protocol on the Access to Genetic Resources and the Fair and Equitable Sharing of Benefits Arising from their Utilization (CBD, 2011), a supplementary agreement to the CBD adopted in 2010, is also of considerable relevance for forests and forest-dependent people.
Forests have a key role in reducing greenhouse gas emissions and mitigating climate change under the UNFCCC (UN, 1992b). Article 5 of the Paris Agreement (UN, 2015), signed in 2016, lays out a framework for the conservation of carbon sinks, including forests, through schemes such as results-based payments and Reducing Emissions from Deforestation and forest Degradation and the role of conservation, sustainable management of forests and enhancement of forest carbon stocks in developing countries (REDD+). UNFCCC (2011) specifies that actions to enhance forest carbon stocks should be “consistent with the conservation of natural forests and biological diversity” and “used to incentivize the protection and conservation of natural forests and their ecosystem services, and to enhance other social and environmental benefits.” Actions to reduce emissions derived from deforestation and forest degradation and increase forest area to sequester carbon feature in many countries’ pledges to the UNFCCC as part of their Nationally Determined Contributions (NDCs).
The United Nations Convention to Combat Desertification (UNCCD) was adopted in 1992 (UN, 1992c). Its Strategic Framework 2018–2030 (UNCCD, 2018) provides a framework for all relevant stakeholders to achieve land degradation neutrality. Although forest biodiversity is not explicitly mentioned within this framework, enhanced synergies with the CBD and UNFCCC are a priority, as reflected in Expected Impact 4.1, “Sustainable land management and the combating of desertification/land degradation contribute to the conservation and sustainable use of biodiversity and addressing climate change.” Landscape restoration, including reforestation, is clearly one of the means of achieving this.
The United Nations 2030 Agenda for Sustainable Development and the SDGs adopted in 2015 (United Nations General Assembly, 2015a) provide a framework for mobilizing efforts towards ending poverty, fighting inequality and tackling climate change for the period 2015–2030. SDG 15, “Life on land”, is of direct relevance to the conservation and sustainable management of forests and their biodiversity.
The Convention on International Trade in Endangered Species of Wild Fauna and Flora (CITES), which was signed in 1973 (CITES, 1983), lists many tree and forest-dependent species in its appendices, exerting different levels of control on their international trade. The 183 Parties to the Convention are required to ensure that international trade in listed species is not detrimental to the species in the wild and that trade is legal, sustainable and traceable.
The International Tropical Timber Agreement, 2006 (UNCTAD, 2006), which entered into force in December 2011, is an agreement to ensure that exported tropical timber and timber products from non-CITES-listed species are from sustainable sources.
The Convention on Wetlands of International Importance especially as Waterfowl Habitat (Ramsar Convention) (UNESCO, 1971) includes designations for forest ecosystems such as mangroves and peatland forests. The Convention also supports restoration initiatives, and in 2002 it adopted principles and guidelines for wetland restoration.
The first United Nations Strategic Plan for Forests 2017–2030 (UN, 2017a) was developed under the auspices of the United Nations Forum on Forests and adopted by the United Nations General Assembly in 2017. The Strategic Plan includes six global forest goals and 26 associated targets to be voluntarily and universally achieved by 2030.
The New York Declaration on Forests (UN, 2017b) calls for action to halt global forest loss and comprises ten goals related to the protection and restoration of forest. First endorsed during the United Nations Climate Summit in 2014, it now has over 200 endorsers including national governments, companies, indigenous and local groups and non-governmental organizations (NGOs) (UN, 2017b).
The Global Plan of Action for the Conservation, Sustainable Use and Development of Forest Genetic Resources, agreed by the Commission on Genetic Resources for Food and Agriculture in 2013 (FAO, 2014b), identifies 27 strategic priorities for action.
The International Plant Protection Convention (FAO, 2011) is an international treaty that aims to secure coordinated, effective action to prevent and to control the introduction and spread of pests of plants and plant products – key to forest health. Adoption of its 2020–2030 Strategic Framework coincides with the International Year of Plant Health 2020.
The Convention on the Conservation of Migratory Species of Wild Animals (UNEP, 1979) provides a global platform for the conservation and sustainable use of migratory animals and their habitats, bringing together the States through which migratory animals pass and laying the legal foundation for internationally coordinated conservation measures throughout a migratory range.
The two chapters that follow address the biophysical status of forest biodiversity – the ecosystems (Chapter 2) and the species and genetic diversity (Chapter 3). Chapter 4 looks at the importance of forests and their biodiversity for people, for their livelihoods and well-being. The relationship between poverty and forest biodiversity is explored, as is the socio-economic role of forest resources in supporting livelihoods, food security and nutrition and human health. Chapters 5 and 6 address actions to ensure the continued contribution of forests to the health and well-being of the planet and all its occupants. Chapter 5 looks at means of reversing forest losses. It first reviews the underlying causes and drivers of deforestation and forest degradation, and then describes some successful forest restoration efforts. Chapter 6 focuses on conservation and sustainable use of forest resources and biodiversity. It looks at the role of protected areas and other effective area-based conservation measures; it also examines other management systems that permit and encourage sustainable forest use in support of the livelihoods and well-being of the people of forest areas. Chapter 7 emphasizes the importance of bringing together these actions in an integrated and innovative way. It acknowledges that trade-offs are sometimes inevitable in managing forests for both conservation and socio-economic development and the difficulties of monitoring the results and taking necessary follow-up action. Despite these challenges, it demonstrates that synergies are possible, summarizing a number of interventions that have achieved them.
This chapter presents new data on the state of forest ecosystems. These are drawn from FAO’s Global Forest Resources Assessment 2020 (FRA 2020) and two new analyses prepared for SOFO 2020 by the Joint Research Centre (JRC) and by the United Nations Environment Programme World Conservation Monitoring Centre (UNEP-WCMC) using satellite imagery. It focuses on the global level and broad biomes (global ecological zones). More detailed information at the regional and national levels is available in FAO (2020).
Forest ecosystems are a critical component of the world’s biodiversity as many forest are more biodiverse than other ecosystems. The area covered by forests is thus one of the indicators of Sustainable Development Goal 15 “Life on land”.
According to FRA 2020, forests currently cover 30.8 percent of the global land area (FAO, 2020). The total forest area is 4.06 billion hectares, or approximately 0.5 ha per person, but forests are not equally distributed around the globe. More than half of the world’s forests are found in only five countries (the Russian Federation, Brazil, Canada, the United States of America and China) and two-thirds (66 percent) of forests are found in ten countries (Figure 1).
Forest area as a proportion of total land area, which serves as SDG Indicator 15.1.1 (Box 5), decreased from 32.5 percent to 30.8 percent in the three decades between 1990 and 2020. This represents a net loss of 178 million hectares of forest, an area about the size of Libya. However, the average rate of net forest loss declined by roughly 40 percent between 1990–2000 and 2010–2020 (from 7.84 million hectares per year to 4.74 million hectares per year), the result of reduced forest area loss in some countries and forest gains in others (Table 1) (FAO, 2020). Forest loss is primarily caused by agricultural expansion, while an increase in forest area may occur through natural expansion of forests, e.g. on abandoned agricultural land, or through reforestation (including through assisted natural regeneration) or afforestation. These natural and human-induced changes have different impacts on forest biodiversity.
▸ Sustainable Development Goal 15.1: By 2020, ensure the conservation, restoration and sustainable use of terrestrial and inland freshwater ecosystems and their services, in particular forests, wetlands, mountains and drylands, in line with obligations under international agreements.
— SDG 15.1.1 Forest area as a proportion of total land area.
▸ Aichi Biodiversity Target 5: By 2020, the rate of loss of all natural habitats, including forests, is at least halved and where feasible brought close to zero, and degradation and fragmentation is significantly reduced.
▸ United Nations Strategic Plan for Forests Goal 1: Reverse the loss of forest cover worldwide through sustainable forest management, including protection, restoration, afforestation and reforestation, and increase efforts to prevent forest degradation and contribute to the global effort of addressing climate change.
— Target 1.1 Forest area is increased by 3 percent worldwide (by 2030).
▸ New York Declaration on Forests Goal 1: At least halve the rate of loss of natural forests globally by 2020 and strive to end natural forest loss by 2030.
Africa had the highest net loss of forest area in 2010–2020, with a loss of 3.94 million hectares per year, followed by South America with 2.60 million hectares per year (Figure 2). Since 1990, Africa has reported an increase in the rate of net loss, while South America’s losses have decreased substantially, more than halving since 2010 relative to the previous decade.
Asia showed the highest net gain in forest area in the period 2010–2020, followed by Oceania and Europe. Both Europe and Asia reported a net forest gain for each ten-year period since 1990, although both regions show a substantial reduction in the rate of gain since 2010.
As part of the reporting to FRA 2020, countries were asked to report on “Other land with tree cover”, defined as “Other land [i.e. land not classified as forest, other wooded land or inland water] spanning more than 0.5 ha with a canopy cover of more than 10 percent comprising trees able to reach a height of 5 m at maturity” (see Box 6). “Other land with tree cover” was split into five categories (Table 2). Fewer than half the countries were able to report on this parameter, and even fewer to provide trends over time. However, the reported figures indicate that the world has at least 162 million hectares of land with tree cover that is not classified as forest, and possibly as much as 300 million hectares, judging from the gap in data. The only category that did not show an increase over time was trees in urban settings.
Global data on forest area reported by in this edition of SOFO differ from those reported by other initiatives mainly because of differences in the methods employed to derive the information and in the definitions of forest. FAO defines forest as a combination of tree cover and land use, while some others define forest only in terms of tree cover (i.e. include both forests and “Other land with tree cover” according to FRA 2020 definitions). Data sets based solely on medium- to low-resolution remote-sensing sources cannot differentiate between tree cover in agricultural production systems (e.g. orchards, oil palm plantations, coffee plantations) and tree cover on land that is not predominantly under agricultural or urban land use. This means that these data sets generally report a total area of tree cover that is larger than the total forest area. In addition, areas of forest where the tree cover that has been temporarily removed as part of a forest management scheme or temporarily lost through natural disturbances are still considered forest according to the FAO definition, while a remote-sensing analysis of tree cover will interpret these areas as forest loss. Conversely, an increase in agricultural tree crops will be interpreted as an increase in forest area if based only on remote sensing. Moreover, young trees cannot easily be detected by satellites. Reporting years also differ, but even when this is accounted for, the annual net change in the area covered by trees based solely on remote-sensing data can differ substantially from the net change in forest area, given that the latter is based on auxiliary data, including data on land use.
Thus, while the FRA 2020 results reported above show a steady decrease in the rates of net loss of forest area globally, the New York Declaration on Forests (NYDF, 2019) reports an increase in the global rate of tree cover loss since 2000 measured as gross loss (i.e. excluding any gains in tree cover over the same period) of all types of trees, and Song et al. (2018), looking at the difference in area between two points in time and hence reporting on net changes, assert that global tree cover increased between 1982 and 2016. Conversely, a study conducted by UNEP-WCMC for this edition of SOFO (see Figure 3) indicates that total tree cover declined between 1992 and 2015.
An attempt has been made in this volume to clearly distinguish between results referring to forests and those referring to tree cover.
A UNEP-WCMC analysis of annual land-cover data at around 300 m resolution from 1992 to 2015 from the European Space Agency (Bontemps et al., 2013) indicates that global tree cover (including palms and agricultural tree crops) amounted to around 4.42 billion hectares in 1992 but had fallen to 4.37 billion hectares by 2015, a decrease of approximately 50 million hectares; however, the area under tree cover varied significantly from year to year (Figure 3). The rate and scale of net change in tree cover are also highly variable between countries and between forest types. While the global area with tree cover in this study corresponds well to the combined forest area and area of other land with tree cover reported to FRA 2020, the average net loss is considerably lower, in part owing to an expansion of other land with tree cover during this period and in part owing to different assessment methods.
For FRA 2020, countries were asked for the first time not only to report on the total forest area at different points in time, data which are used to report net change in forest area, but also to provide information on the rate of deforestation, i.e. the forest losses due to conversion to other land uses or the permanent reduction of canopy cover below the minimum 10 percent threshold that defines forest. Since 1990, an estimated 420 million hectares of forest has been lost through deforestation, but the rate of deforestation has decreased substantially since 1990–2000. During 2015–2020, the rate of deforestation was estimated at 10 million hectares per year, down from 16 million hectares per year in the 1990s. Figure 4 illustrates the trends in the average annual rates of deforestation and forest expansion which, combined, equal the net change in forest area.
For the purposes of FRA 2020, forests are categorized into naturally regenerating forests (further disaggregated into primary forests and other naturally regenerating forests) and planted forests (further disaggregated into forest plantations and other planted forests). At the global level, naturally regenerating forests account for 93 percent of the world’s forest area. The remaining 7 percent is composed of planted forests (Figure 5).
Primary forests. FAO defines primary forests as naturally regenerated forests of native tree species, where there are no clearly visible indications of human activities and the ecological processes are not significantly disturbed. They are sometimes referred to as old-growth forests. These forests are of irreplaceable value for their biodiversity, carbon storage and other ecosystem services, including cultural and heritage values. Large extents of such forests now occur only in tropical and boreal regions. A coordinated response to their protection should be a fundamental priority under the CBD’s post-2020 global biodiversity framework, and this needs to be underpinned by a sound knowledge base on their current status and condition.
Forested ecosystems harbour most of global terrestrial biodiversity, and primary forests in particular are home to species that are unique to these ecosystems. In the Amazon, a study of the species richness and community similarity of primary forests, secondary forests (here used to describe forests established through natural expansion and around 14 to 16 years of age) and plantations found that 25 percent of the species studied were unique to primary forests and almost 60 percent of tree and liana genera were only present in primary forests (Barlow et al., 2007). In more fragmented landscapes, primary forest patches have a key role in ensuring the survival of species in the long term, even if species can persist in the short term in younger forests and plantations (Watson et al., 2018) (Box 7).
Golden-headed lion tamarins (Leontopithecus chrysomelas) live only in the Atlantic rainforest of Bahia state, Brazil. Because the primary forest in this region is very fragmented after decades of deforestation, this tamarin is in an endangered state according to the IUCN Red List (IUCN, 2019a), with a total wild population size estimated between 6 000 and 15 000 individuals. This species can use forest regrowth and rubber plantations that retain some old trees; however, it requires old-growth primary forest fragments for roosting and thus for its survival (World Land Trust, n.d.).
The northern spotted owl (Strix occidentalis caurina) is an iconic primary forest species of western North America. Its forest habitat is characterized by dense canopies and abundant logs, standing snags and live trees with broken tops. Although these owls are found to nest, roost and feed in other habitat types, particularly in the southern part of its range, they mostly rely on older (150- to 200-year-old), multilayered forest stands, with open spaces to allow flight below the canopy (Oregon Fish and Wildlife Office, n.d.).
According to FRA 2020, approximately one-third (34 percent) of the world’s forests are primary forests (FAO, 2020). More than half of these (61 percent) are found in only three countries: Brazil, Canada and the Russian Federation.
Primary forests continue to decline globally. Since 1990, primary forest worldwide has decreased by 81 million hectares, but the rate of loss more than halved over the last decade. However, the status and trends are based on incomplete data, as the measurement, monitoring and reporting of primary forests present significant challenges (see Box 8). Only 137 countries reported full time series data for 1990–2020, and these together accounted for just over half (57 percent) of the global forest area. Further work is clearly needed to improve global and national estimates.
FAO (2018a) defines primary forests as “Naturally regenerated forest of native tree species, where there are no clearly visible indications of human activities and the ecological processes are not significantly disturbed.” The CBD (2006) uses a similar definition: “A forest that has never been logged and has developed following natural disturbances and under natural processes, regardless of its age… Also included as primary are forests that are used inconsequentially by indigenous and local communities living traditional lifestyles relevant for the conservation and sustainable use of biological diversity.” Both these definitions capture the qualitative characteristics of primary forest but they do not provide a measurable indicator that countries can use to identify them and monitor their change.
Because of the lack of an operational definition and consistent, easy-to-map indicators, some inconsistencies and bias are inherent in current country-level reporting for FRA 2020 (Bernier et al., 2017). Most countries use proxies based on land use and/or land cover to extrapolate data on primary forest and these proxies vary. Ten countries account for 91 percent of the primary forest area reported to FRA 2020 but they used a variety of proxies and measurements, such as forests in protected areas; forest without ocular evidence of disturbance; geographic information system analysis based on forest maps, absence of transportation network, urban areas and detectable disturbances; and visual interpretation of photo plots. The increase in primary forest area that some countries have reported over the years, particularly in temperate and boreal countries, is often due to the use of new definitions or application of new methodologies (FAO, 2020).
“Intact forest landscape” is currently the metric most commonly used to identify primary forests. Potapov et al. (2017) define an intact forest landscape as “a seamless mosaic of forests and associated natural treeless ecosystems that exhibit no remotely detected signs of human activity or habitat fragmentation and are large enough to maintain all native biological diversity, including viable populations of wide-ranging species.” Operationally, they identify such landscapes based on the size and configuration of the forest patches (minimum 500 km2, with a minimal width of 10 km and corridors at least 2 km wide), absence of any alteration or management due to agriculture, logging or mining and a 1-km buffer from any infrastructure such as roads and power lines, although these criteria may not be appropriate across all forest biomes (see also discussion on Forest intactness and fragmentation).
If remote sensing alone is used to detect intact forest landscapes, there is a risk of missing types of disturbance (e.g. selective logging) that are characteristic of forests that are not classified as primary (Bernier et al., 2017). Emerging approaches and technologies to monitor primary forests that combine remote sensing, participatory mapping and other approaches can help to measure both human modification and spatial integrity, two essential and quantifiable characteristics for identifying primary forests. The size of forest patches, spatially weighted forest density and connectivity are some of the indices that can be easily measured to quantify forests’ spatial integrity (Kapos, Lysenko and Lesslie, 2002) (see Forest intactness and fragmentation). In addition to these indices, specific human activities that are drivers of change, such as development of settlements and infrastructure, could be included in a multidimensional index. As these drivers are often context specific, it may be better to develop regional metrics that consider context-specific issues but that are consistent and comparable globally, rather than a single metric or globally defined indices (Bernier et al., 2017).
FAO, together with partners including CBD, UNEP-WCMC and some countries with large areas of primary forest, has initiated work to improve reporting on primary forest area and its changes.
Drivers of deforestation in primary forests are context specific but include unsustainable industrial timber extraction, agricultural expansion and fires which are often associated with infrastructure and logging-site development (Potapov et al., 2017). See more on drivers of deforestation in Chapter 5.
Planted forests. The area of planted forests has increased by 123 million hectares since 1990 and now covers 294 million hectares, but the rate of increase has slowed since 2010. Approximately 45 percent of the planted forests (or 3 percent of all forests) are plantation forests, i.e. intensively managed forests, mainly composed of one or two tree species, native or exotic, of equal age, planted with regular spacing and mainly established for productive purposes. The other 55 percent of planted forests, “Other planted forests”, are forests that can resemble natural forest at stand maturity and include forests established for ecosystem restoration and protection of soil and water. South America has the largest proportion of planted forests that are plantation forests (99 percent of the planted forest area, or 2 percent of the total forest area); Europe has the smallest share (6 percent of planted forests, or 0.4 percent of the total forest area).
Globally, 44 percent of plantation forests comprise introduced species, with large regional variations (Figure 6). In South America, 97 percent of the plantation forests are made up of introduced species, compared with only 4 percent in North and Central America.
Worldwide, there are five major climatic domains: boreal, polar, temperate, subtropical and tropical; the largest part of the forest (45 percent) is found in the tropics, followed by the boreal, temperate and subtropical domains (Figure 7). These domains are further divided into terrestrial global ecological zones, 20 of which contain some forest cover (Figure 8). The UNEP-WCMC analysis on changes in tree cover conducted for SOFO 2020 (see here) found that ten global ecological zones experienced a net reduction in tree cover between 1992 and 2015 and ten experienced net growth. The largest negative change in tree cover was seen in the tropical rainforest, which covers much of Central Africa, the Amazon Basin, Indonesia and Papua New Guinea, while the largest positive change was found in the boreal tundra woodland, which is found in Canada and the Russian Federation.
Forests can be found from arid zones (Box 9) to wetlands (Box 10) and tidal areas (Box 11).
While humid tropical forests contain the most biological diversity, drylands are biodiverse and productive landscapes with considerable economic, social and environmental value. Drylands account for more than two-thirds of the land area of 7 of the now 36 biodiversity hotspots (Myers et al., 2000; CEPF, 2020) and are found in 24 of the 134 terrestrial ecoregions (Olson et al., 2015) identified as priority conservation targets. Drylands are also inhabited by more than 2 billion people, 90 percent of whom live in developing countries (MEA, 2005). Many of these people rely on forests and woodland systems for their basic needs. Despite the ecological and social importance of drylands, very limited information has been available about forest and tree cover in these areas until now.
The first Global Drylands Assessment (FAO, 2019c) was based on visual interpretation of freely available satellite images for more than 200 000 sample plots in the world’s drylands, as classified by UNEP-WCMC (2007). More than 200 regional experts were involved in the analysis.
The results revealed that the world’s drylands contain 1.1 billion hectares of forest, corresponding to 27 percent of the world’s forest area and 18 percent of the dryland area. Approximately 51 percent of these forests are dense, having canopy cover of 70 to 100 percent. The area of dryland forest varies significantly between regions (Figures A and B).
Many trees in drylands grow outside forests. Almost 30 percent of cropland and 60 percent of built-up land in arid and semi-arid zones has at least some tree cover, as have large areas of rangelands. Western and Central Africa and Southern Asia have the highest proportion of trees outside forests in cropland, followed by Eastern Africa and Southern Africa (Figure C); in these regions, trees are often integral parts of traditional agroforestry or agrosilvopastoral landscapes and food systems, supporting agricultural production and resilience of both ecosystems and local communities.
The assessment results serve as a basis for identifying key emerging threats to dryland forests and their populations and for prioritizing action and targeting investment for restoration and sustainable management of these often-vulnerable ecosystems – key for the resilience of landscapes and community livelihoods in a changing climate. Data used for the assessment were collected in 2015 and could therefore serve as a baseline for monitoring changes of forests, trees and land use and contribute to the reporting on progress towards SDG 15 targets and indicators.
The Cuvette Centrale peatland in the Congo Basin is believed to be the largest continuous tropical peatland complex in the world, covering an area of around 14.5 million hectares, typically in hardwood swamp forest and palm-dominated swamp forest (Dargie et al., 2017). The area holds large areas of intact biodiverse rainforest and contains the highest densities of western lowland gorillas (Gorilla gorilla gorilla) in the world, as well as bonobos (Pan paniscus), chimpanzees (Pan troglodytes) and forest elephants (Loxodonta cyclotis). The dwarf crocodile (Osteolaemus tetraspis) lays its eggs in the peat. This large freshwater ecosystem plays a crucial role in regulating water flows as well as providing food for a large human population downstream in the Democratic Republic of Congo and the Republic of Congo. In addition to its high level of biodiversity, the Cuvette Centrale peatland contains at least 30 gigatonnes of carbon – equivalent to two years of global carbon emissions (Dargie et al., 2017), and these large carbon stores enhance its combined biodiversity and ecosystem-service value.
Dwarf crocodile.
©Francesco VeronesiMangroves are salt-tolerant shrubs and trees that grow along coastlines in the tropics and subtropics, where they fulfil important environmental and socio-economic functions. These include the provision of a large variety of wood and non-wood products, coastal and coral-reef protection and provision of habitat for terrestrial and aquatic species.
As reported to FRA 2020, 113 countries have areas of mangrove forest, totalling an estimated 14.79 million hectares. The largest area was reported in Asia (5.55 million hectares), followed by Africa (3.24 million hectares), North and Central America (2.57 million hectares) and South America (2.13 million hectares). Oceania reported the smallest area of mangroves (1.30 million hectares).
More than 40 percent of the total area of mangroves was reported to be in just four countries: Indonesia (19 percent of the total), Brazil (9 percent), Nigeria (7 percent) and Mexico (6 percent). Since 1990, the area of mangroves has decreased by 1.04 million hectares, but the rate of change more than halved over the reporting period, 1990–2020 from 47 000 hectares per year in the period 1990–2000 to 21 000 hectares per year over the last ten years.
SOURCE: FAO, 2020.
While there is no agreed definition of forest degradation, in a more general sense forest degradation entails a reduction or loss of the biological or economic productivity and complexity of forest ecosystems resulting in the long-term reduction of the overall supply of benefits from forest, which includes wood, biodiversity and other products or services.
To facilitate future reporting on relevant goals and targets related to forest degradation (Box 12), FAO asked countries reporting for FRA 2020 whether they were monitoring forest degradation and, if so, what methods they used. A total of 58 countries responded (together accounting for 38 percent of the global forest area) indicating that they were attempting to monitor the extent of forest degradation. However, many of those countries assessed only one or a few specific elements.
▸ Sustainable Development Goal 15.3: By 2030, combat desertification, restore degraded land and soil, including land affected by desertification, drought and floods, and strive to achieve a land degradation-neutral world.
— SDG 15.3.1 Proportion of land that is degraded over total land area.
▸ Aichi Biodiversity Target 5: By 2020, the rate of loss of all natural habitats, including forests, is at least halved and where feasible brought close to zero, and degradation and fragmentation is significantly reduced.
▸ United Nations Strategic Plan for Forests Goal 1: Reverse the loss of forest cover worldwide through sustainable forest management, including protection, restoration, afforestation and reforestation, and increase efforts to prevent forest degradation and contribute to the global effort of addressing climate change.
For the purposes of this report, the status and trends related to forest ecosystem health and forest fragmentation are examined as proxies of forest degradation.
Forests are subject to a number of natural disturbances (e.g. wildfires, pests, diseases, adverse weather events) that can adversely affect their health and vitality by causing tree mortality or reducing their ability to provide the full range of goods and services. The effects at national and local levels and/or for specific forest species can be devastating.
Forest fires. In some ecosystems, natural fires are essential to maintain ecosystem dynamics, biodiversity and productivity. Fire is also an important and widely used tool to meet land-management goals. Most fires are caused by people, and sometimes they get out of control. Every year, deliberately set fires and wildfires burn millions of hectares of forests and other types of vegetation. A global analysis of forest area affected by fire between 2003 and 2012 identified approximately 67 million hectares burned annually (van Lierop et al., 2015). In 2015, around 98 million hectares of forest were affected by fires (FAO, 2020). These fires occurred mainly in the tropics, where they affected about 4 percent of the forest area. More than two-thirds of the total forest area burned was located in South America and Africa.
About 90 percent of fires are readily contained and account for 10 percent or less of the total area burned. The remaining 10 percent of fires account for the other 90 percent of the burned area. These dramatic and high-profile wildfire events, such as those in Australia, Brazil, Greece, the Russian Federation and the United States of America (California) in 2018 and 2019, cause great losses of human and animal lives, property and infrastructure as well as immense environmental and economic damage, both in terms of resources destroyed and the costs of suppression. Firefighters can do little to stop such fires until weather or fuel conditions change.
In the future, climate change is expected to bring longer fire seasons and more-severe fires over much of the globe, including some areas where fire has not previously been a common problem. Forest fires cannot be avoided but their occurrence and impacts can be significantly reduced by applying integrated fire management and fire-smart forest management and by taking sociocultural realities and ecological imperatives into account in the landscapes where fire occurs (FAO, 2006).
Other disturbances. Disturbances other than fire affected 142 million hectares between 2003 and 2012. These included disturbances by insect pests, mainly in temperate North America; severe weather, mainly in Asia; and diseases, mainly in Asia and Europe (van Lierop et al., 2015). In 2015, around 40 million hectares of forests were affected by such disturbances, mainly in the temperate and boreal zones (FAO, 2020).
DEMOCRATIC REPUBLIC OF THE
CONGO
Lomako forest, a community
reserve in Equateur, is part of the Cuvette Centrale
peatland.
Invasive species (non-native insect pests, pathogens, vertebrates and plants) and outbreaks of native insect pests and diseases pose an increasing threat to the health, sustainability and productivity of natural and planted forests globally (Box 13). Outbreaks of forest insect pests alone damage about 35 million hectares of forests annually (FAO, 2010b). Invasive plant and animal species are now considered one of the most important causes of biodiversity loss, especially in many island countries (CBD, 2009). However, except in some developed countries, very few quantifiable data are available on the total impact of invasive species.
Increasing international trade and human mobility, exacerbated by impacts of climate change, have increased the introduction of plant and animal species into new areas where they have become invasive. Examples include the box tree moth (Cydalima perspectalis), which has caused dieback of endemic boxwood (Buxus colchica) forests in the Islamic Republic of Iran and the Caucasus region, and ash dieback in the United Kingdom of Great Britain and Northern Ireland, caused by the fungus Hymenoscyphus fraxineus, which is of eastern Asian origin. Climate change and annual climate fluctuations, often combined with poor forest management practices (such as the alteration of forest structure and diversity), have a strong influence on both native and introduced pests and pathogens, especially on their biology (e.g. faster development) and behaviour (e.g. host preference). Higher temperatures, severe and extreme weather events and drought stress result in reduced vigour of trees, making them more vulnerable to outbreaks of native and introduced pests and diseases. For example, the dieback of millions of hectares of pine forests caused by outbreaks of native bark beetles in Central America, Europe and North America is associated with climate changes, impacts of extreme weather events and, in some cases, inadequate forest management practices (Billings et al., 2004; Bentz et al., 2010; Hlásny et al., 2019).
Making forests and forest ecosystems more resilient to pests, diseases and invasive species requires coordination of national, regional and global activities for prevention, early detection, early action, implementation of phytosanitary measures and effective public awareness. It also requires sustainable forest management practices that both reduce the vulnerability of forests to the impacts of climate change and take biodiversity conservation and sustainable use into consideration.
In the past century, forest fragmentation – the division of continuous habitat into smaller and more isolated fragments – has profoundly altered the characteristics and connectivity of forests and caused severe biodiversity losses (Haddad et al., 2015). Understanding the extent, causes and consequences of forest fragmentation is critical to conserving forest biodiversity and ecosystem functioning (see Box 14).
The fragmentation of forest entails the alteration of habitat configuration, loss of forest area and connectivity, increased isolation of forest patches and greater exposure to human land uses along forest fragment edges (see Figure A). Perforations, or the introduction of holes into intact forest patches, is one of the chief components of fragmentation. Perforations are often accompanied by the introduction of roads, resulting in a strong decrease of undisturbed core forest habitat area. Forest fragmentation initiates long-term changes to the structure and functions of the remaining forest fragments, with impacts on habitats and forest ecosystem services (Lindenmayer and Fischer, 2006; Hermosilla et al., 2019).
Forest fragmentation may be induced by natural environmental changes and disturbances (climate, geological processes, natural disasters, wildfire, pests and diseases) which can cause the segmentation of a forest into smaller patches, or by anthropogenic factors such as forest exploitation (unmanaged logging or fuelwood harvesting) or land-use conversion resulting from agricultural expansion, conversion into tree plantations, conversion into pastures for livestock, new settlements caused by human migration, urbanization and infrastructure development. Forest fragmentation often occurs in the first phase of land conversion from forest to other land uses.
The fragmentation process transforms the composition, configuration and functions of the landscape. It typically implies habitat destruction or isolation, and many studies demonstrate that long-term fragmentation of habitats, and in particular forested habitats, strongly affects biodiversity and ecosystem processes (Skole and Tucker, 1993; Pereira et al., 2010), although the responses may vary substantially between species and forest types. Fragmentation has impacts on almost all ecological processes, from gene to ecosystem level, and affects plant and animal population composition and dynamics. It may also increase the interaction between livestock and wildlife and hence increase the risk for disease transmission. While the number of generic, multihabitat, edge or invasive species may increase (Laurance et al., 2006) (see also Box 18 on Forest-dwelling pollinators in Chapter 3), forest fragmentation mostly reduces species richness (Turner, 1996; Zhu et al., 2004). It decreases nutrient retention, affects trophic dynamics and, in more isolated fragments, alters movement of animals. Reduction of forest patch size and increase in patch isolation have been shown to decrease the abundance of birds, mammals, insects and plants by 20 to 75 percent, impacting ecological functions such as seed dispersal and hence forest structure while also contributing to a reduction in ecosystem services such as carbon sequestration, erosion control, pollination and nutrient cycling (Haddad et al., 2015).
A recent spatial analysis carried out by the JRC for this report used satellite remote sensing to identify forests that are the most intact and connected and those where fragmentation is most severe. The analysis was carried out at the global level as well as for each of the 15 GEZs representing more than 1 percent of the world’s forest area.
Two fragmentation indices were applied to the global Copernicus Land Cover map for 2015 (Buchhorn et al., 2019), overlaid with FAO’s GEZ map (see Figure 7). An attempt was made to exclude oil palm plantations and agricultural tree crops from the analysis. The first index, called accounting, evaluates the size and distribution of forest patches i.e. distinct areas of forests separated from other forest areas by at least 100 m (Vogt, 2019a) (Figures 9 and 10). The second index, forest area density, measures the proportion of forest pixels within a fixed local neighbourhood (Vogt, 2019b) (Figures 11, 12, and 13). A high value for forest area density indicates high forest connectivity, compact forest areas and low forest fragmentation, while a low value indicates forest patches that are isolated, perforated and generally highly fragmented.
The study found 34.8 million patches of forest in the world, ranging in size from 1 ha hectare (one pixel on the map) to 680 million hectares. Roughly 80 percent of the world’s forest area is found in patches larger than 1 million hectares; this size class accounted for more than 25 percent of the forest area for all forest types (Figure 9). However, there are only 149 such forest patches, which means that the majority of the world’s forest area is concentrated in very few locations. The rest of the world’s forests are scattered and comparatively small.
Some 34.7 million patches (99.8 percent of the total number of patches) are smaller than 1 000 hectares. Together, they account for 7 percent of the global forest area. The average size of all forest patches is a mere 132 hectares, but the average patch size varies significantly between ecological zones (Figure 10). The largest average patch sizes are found in the boreal coniferous forest and tropical rainforest zones.
Almost half of the global forest area (49 percent) falls in the two highest forest area density classes (intact and interior) and thus has a high level of integrity (Figures 12 and 14). At the other end of the density spectrum, 9 percent of the world’s forests are in the rare and patchy classes, with little or no connectivity, and can be considered severely fragmented (Figures 12 and 15).
Where are forests the most intact? Tropical rainforest and boreal coniferous forest – the ecological zones with the most forest – are the least fragmented and most-intact forest ecosystems. More than 90 percent of the forest area in these zones is in patches larger than 1 million hectares and the forest patches in these zones are much larger than the global average (Figures 9 and 10). Less than 2 percent of the forest area in these zones is in the rare and patchy classes, and more than 50 percent is in the interior and intact classes (Figure 12). These ecosystems are characterized by difficulties of access and low population density.
Half of the remaining tropical rainforest falls within the intact forest area density class and 94 percent of the forest area is well connected. Forests in the Amazon and Congo basins are the least fragmented and most contiguous (Figure 14). However, land-use conversion in these areas is causing rapid change. As these are forests of unique biodiversity, particular attention is required to conserve them and manage them sustainably.
In the boreal coniferous forest biome, 11 percent of the forest area is in the intact class, mainly in Canada and the Russian Federation. Boreal forest fragmentation is mainly linked to natural disturbances (fire and insect outbreaks). Increased severity of boreal-zone wildfires related to global warming (Walker et al., 2019) might increase fragmentation in the long term.
Mountain systems in boreal, temperate and tropical climates are also biomes with limited accessibility and low population density, and these biomes also have notably less-fragmented forest than other ecological zones. Their average patch size is larger than the global average (Figure 10), only 6 percent of their forest area is in the rare and patchy classes and more than 40 percent is in the intact and interior classes (Figure 12). The forest integrity in these biomes may also be linked to the considerable amount of protected areas in these zones that were established to safeguard water sources and avoid land erosion. Mountain forests with low fragmentation include temperate North America montane forests (Appalachians, Cascade Range), boreal Russian forests (Ural Mountains, Stanovoy range and Sikhote-Alin mountains, which host endangered species such as the Siberian tiger) and tropical mountains in the lake regions of Central Africa, which have an exceptionally high species richness and shelter most of the mountain gorilla population. Unfortunately, some of these forests are now facing high risk of encroachment and fragmentation at their edges because of growing population pressure.
Where are forests the most fragmented? Ecological zones with a limited area of forest (less than one-third of total land area), such as tropical shrubland, subtropical steppe, subtropical dry forest and temperate oceanic forest, have the highest fragmentation level and the lowest average forest area density (Figures 10 and 13). These zones have average patch size of less than 60 hectares and a high proportion of forest area (around 20 percent) in patches smaller than 1 000 hectares (Figures 9 and 10); they also have 20 percent of forest in the rare and patchy classes and less than 20 percent in the interior and intact classes (Figure 12). While some of these ecological zones have naturally fragmented landscape patterns (e.g. subtropical steppe), in others fragmentation is the result of past land-use conversion and forest utilization practices.
Boreal tundra woodland, tropical dry forest and tropical moist forest ecological zones have more significant forest cover (more than 40 percent of total land area) but the average patch size is much smaller than the global average (Figures 9 and 10) and more than 30 percent of forest is in the rare, patchy and transitional classes (Figure 12). These biomes have less than 30 percent of forest area in the intact and interior classes, and only 16 percent in the case of boreal tundra woodland.
Forest fragmentation in the boreal tundra woodlands is primarily a consequence of natural conditions and disturbances (climate, wildfire and pests). In contrast, tropical dry and moist forests, such as the Cerrado forests in Brazil, the South American Gran Chaco, the Miombo woodlands in southern Africa and the tropical dry forests in India and the Mekong region, have been affected by rapidly changing land-use dynamics. These forests are very important in terms of both biodiversity and livelihoods, yet only a few large continuous forest areas remain in these ecological zones.
Once a forest has been fragmented, it is very difficult to reverse the situation, especially in terms of biodiversity losses. Efforts are required to reconnect forest fragments through restoration, including the creation of corridors, buffers or stepping stones (see Chapter 5. Reversing deforestation and forest degradation).
As is evident from section 2.1 Status and trends in forest area, there is some progress towards reversing the loss of forest cover worldwide, with the net loss of forest area having decreased from an average of 7.84 million hectares per year in the 1990s to 4.74 million hectares per year in the period 2010–2020 (Table 1). However, the world is not on track to meet the target of the United Nations Strategic Plan for Forests (UN, 2017) to increase forest area by 3 percent worldwide by 2030 (relative to 2015).
Over the past 30 years, the area of naturally regenerating forest has decreased by 7 percent (301 million hectares) (FAO, 2020). The rate of loss of naturally regenerating forest has been decreasing (Figure 16) but not enough to meet Aichi Target 5 and Goal 1 of the New York Declaration on Forests, to at least halve the rate of loss of natural forests globally by 2020 (relative to 2010) (Box 5).
While the JRC study on fragmentation did not look at trends over time, indications, based on patterns of deforestation, are that fragmentation of forests is increasing in many countries. On a more positive note, 122 countries have committed to setting land degradation neutrality targets and more than 80 countries have already set their targets (UNCCD, 2019a).
It is not only the trees that make a forest, but the many different species of plants and animals that reside in the soil, understorey and canopy. Estimates of the total number of species on Earth range from 3 million to 100 million (May, 2010). An estimate from 2011 puts the number at about 8.7 million (plus or minus 1.3 million), with 6.5 million species on land and 2.2 million in oceans (Mora et al., 2011), while IPBES (2019a) puts the number at about 8 million, of which 5.9 million species are terrestrial. Although it is widely reported that forests harbour 80 percent of terrestrial plants and animals, such a precise estimate is unlikely to be accurate given the changing state of knowledge of planetary biodiversity.
Tropical moist forests stand out as highly significant reservoirs of global biodiversity; examples include 1 200 species of beetle from a single tree species (Erwin, 1982), 365 tree species in a 1-ha plot (Valencia, Balslev and Paz y Miño, 1994), 365 plant species in a 0.1-ha plot (Gentry and Dodson, 1987) and an estimated half of the world’s species richness in just 6 to 7 percent of its land area (Dirzo and Raven, 2003). Tropical and subtropical forests (dry and humid) contain the ten hotspots with the greatest total number of endemic higher terrestrial vertebrates and the greatest number of threatened species (Mittermeier, 2004; Mittermeier et al., 2011, cited in IPBES, 2019b).
Thus, while trees are the defining component of forests and their diversity can give an indication of overall diversity, there are many other ways to determine the biodiversity significance of forests. This chapter looks at some of these aspects as it explores progress towards key targets related to the conservation of forest biodiversity at the species and genetic level (Box 15).
The GlobalTreeSearch database (BGCI, 2019) reports the existence of 60 082 tree species. This number includes palms and many agricultural tree crops (e.g. fruit trees, coffee and oil palm) not commonly found in forests.
Nearly half of all tree species (45 percent) are members of just ten families. The three most tree-rich families are Fabaceae, Rubiaceae and Myrtaceae. Brazil, Colombia and Indonesia are the countries with the most tree species (Figure 17). The countries with the most country-endemic tree species reflect broader plant diversity trends (Australia, Brazil and China) or are islands where isolation has resulted in added speciation (Indonesia, Madagascar and Papua New Guinea) (Figure 18). Nearly 58 percent of all tree species are single-country endemics (Beech et al., 2017).
▸ Aichi Biodiversity Target 12: By 2020, the extinction of known threatened species has been prevented and their conservation status, particularly of those most in decline, has been improved and sustained.
▸ Aichi Biodiversity Target 13: By 2020, the genetic diversity of cultivated plants and farmed and domesticated animals and of wild relatives, including other socio-economically as well as culturally valuable species, is maintained, and strategies have been developed and implemented for minimizing genetic erosion and safeguarding their genetic diversity.
▸ Aichi Biodiversity Target 16: By 2015, the Nagoya Protocol on Access to Genetic Resources and the Fair and Equitable Sharing of Benefits Arising from their Utilization is in force and operational, consistent with national legislation.
As of December 2019, a total of 20 334 tree species had been included in the IUCN Red List of Threatened Species (IUCN, 2019a), of which 8 056 were assessed as globally threatened (Critically Endangered, Endangered or Vulnerable). A total of 32 996 tree species have a conservation assessment on some level (national, global, regional) and 12 145 of those have a threatened assessment. Of these, more than 1 400 tree species have been assessed as critically endangered and are in urgent need of conservation action (Global Trees Campaign, 2020) (see also Box 16). CITES listings of tree species have surged in recent years as a result of the concern that many commercially valuable tree species may be threatened by overexploitation; more than 900 tree species are now included in CITES appendices and have their trade regulated through CITES, including rosewoods, ebonies and mahoganies (CITES, 2019).
The European Red List of Trees (Rivers et al., 2019), an evaluation of the conservation status of the 454 tree species native to Europe, indicates that 58 percent of the region’s endemic trees – those that are not found anywhere else on Earth – are threatened, while 42 percent of all native species are threatened with regional extinction. Of the endemic species, 15 percent (66 species) have been assessed as critically endangered, or one step away from going extinct. Invasive pests, diseases and plants are the largest threats to European tree species.
Tree species in the genus Sorbus are particularly affected; three-quarters of Europe’s 170 Sorbus species are assessed as threatened.
The horse chestnut (Aesculus hippocastanum) has been assessed as vulnerable following declines caused by the horse chestnut leafminer moth (Cameraria ohridella), an invasive species that originated in isolated mountainous regions of the Balkans and has invaded the rest of Europe.
SOURCE: IUCN, 2019b.
In some countries, efforts are made to recognize and protect individual trees outside forest that are notable for their size, age, historical significance or other qualities (Box 17).
In recent decades, some countries, states, districts or cities have made efforts to recognize and protect heritage trees (sometimes termed champion, historic, landmark or significant trees) – individual trees considered to have unique value because of their age, rarity, large size or beauty or their cultural, historical, botanical or ecological value. The oldest individuals of a tree species represent an important gene pool and also contain a living library of climate changes that have taken place over hundreds or thousands of years (US/ICOMOS, 2019).
Around the world, various registries focus on these trees as valuable and sometimes endangered icons in the landscape. Some tree registries are crowdsourced and managed by national NGOs, such as the Champion Trees National Register in the United States of America, the Tree Register in the United Kingdom of Great Britain and Northern Ireland and Ireland and the Register of Significant Trees in Australia. These registries are not typically associated with any regulatory controls. However, some heritage trees are protected by national, state, district or municipal law (US/ICOMOS, 2019). In Singapore, for example, heritage trees are selected for protection by law under the Heritage Trees Scheme adopted in 2001 – part of a nationwide effort to conserve trees not just within protected areas but anywhere in urban and rural Singapore. In many cities in the United States of America, heritage tree ordinances prevent removal of specific trees.
In Italy, a list of monumental trees was decreed by national law in 2014, including single trees and groups of trees in agrosilvopastoral or urban contexts, considered “green monuments” by virtue of their age, size, morphology, rarity, provision of habitats for animal species, and historical, cultural and religious value. Information collection is coordinated by the Ministry of Agricultural, Food and Forestry Policies (MIPAAF) and carried out by regions, autonomous provinces and municipalities as directed in the law. The first list, published in 2017, contained 2 407 trees; regular updates added 332 and 509 new trees in 2018 and 2019, respectively. Research centres, scholastic institutions, forestry professionals, environmental associations and citizens assist in identifying the trees (MIPAAF, 2017; MIPAAF, 2019).
One of the monumental trees of Italy, the 24-m-tall Albero del Piccioni (Mr Piccioni’s tree) near Ascoli Piceno in the Marche region. An Old World sycamore (Platanus orientalis) 8.7 m in circumference, it was mentioned by name on a map from 1718.
© Infinitispazi/Wikimedia CommonsAbout 391 000 species of vascular plants are known to science (including the 60 082 trees mentioned above and more than 1 600 species of bamboo (Vorontsova et al., 2016)), of which about 94 percent are flowering plants. Of these, 21 percent are likely threatened by extinction (Willis, 2017). Some 60 percent of the total are found in tropical forests (Burley, 2002). Some 144 000 species of fungi have been named and classified so far. However, it is estimated that the vast majority (over 93 percent) of fungal species are currently unknown to science, indicating that the total number of fungal species on Earth is somewhere between 2.2 and 3.8 million (Willis, 2018).
Close to 70 000 vertebrate species are known and described (IUCN, 2019a). Of these, forests provide habitats for almost 5 000 amphibian species (80 percent of all known species), close to 7 500 bird species (75 percent of all birds) and more than 3 700 different mammals (68 percent of all species) (Vié, Hilton-Taylor and Stuart, 2009). Iconic forest-dependent species include the jaguar of Latin America, the bears of North America, the gorillas of Central Africa, the lemurs of Madagascar, the panda bears of China, the Philippine Eagle and the koalas of Australia.
Some 1.3 million species of invertebrates have been described. However, many more exist, with some estimates ranging from 5 million to 10 million species (see e.g. Ødegaard, 2000). Most are insects, and the vast majority live in forests (see example in Box 18).
Both managed and wild pollinators have an important role in forest landscapes, providing pollination services to crop plants, wild plants and forest trees. They are thus vital for maintaining biodiversity and associated ecosystem functions, as well as for the regeneration of trees and plants used for timber and non-wood forest products (NWFPs) and in turn for resilient forests and for ensuring food security and sustainable livelihoods. About 87.5 percent of global wild flowering plants are pollinated by animals (94 percent of tropical species and 78 percent of temperate species) (Ollerton, Winfree and Tarrant, 2011), while 75 percent of the 115 leading food crops benefit from animal pollination in some measure for fruit, vegetable or seed production (Klein et al., 2007). However, many pollinators, especially wild bees and butterflies, are under threat (IPBES, 2016). Evidence from a new study in preparation by FAO and Bioversity International (Krishnan et al., forthcoming) suggests that the decline in populations of both wild and managed pollinators can have severe consequences for natural regeneration of forests and for maintenance of the genetic diversity of forest trees, and thus for their adaptive potential to climate change and their resilience to pests and disease.
Although social bees have been the most studied, a wide range of animals with varied habitats and forage requirements provide pollination services; the baobab (Adansonia spp.) and the rainforest tree Syzygium cormiflorum, for example, are pollinated by bats. Bees are the most frequent flower visitors, followed by flies, butterflies and moths (Winfree et al., 2007).
Pollinators benefit from diverse natural habitats for forage and nesting sites. Drivers affecting pollinator abundance and diversity include land-use change, landscape composition, forest management practices and climate change (IPBES, 2016; Krishnan et al., forthcoming). Change in climatic conditions can alter the timing, quality and duration of leaf unfolding, flowering and fruit maturation in plants. Disruption in the synchrony of plant–animal interactions can have a negative effect on both communities.
Habitat fragmentation and degradation and disruption of connectivity between various pollinator habitats can reduce the breeding success and thus population sizes of pollinators. Smaller populations of insect pollinators have been found to lead to decreased pollen diversity, increased levels of selfing and lower genetic variation in subsequent generations of some eucalypt species, leading to decreased general fitness which in turn could adversely affect their adaptability to changing environmental conditions (Breed et al., 2015). Enhanced long-distance pollination across a fragmented landscape (e.g. by bird pollinators) could partly compensate for this, depending on the degree of fragmentation and the species involved (Aguilar et al., 2008).
On the other hand, a moderate amount of disturbance can improve the quality and availability of pollinator habitats and thus have a positive effect on pollinator diversity (IPBES, 2016). Most bees, for example, seem to prefer a slightly open forest over closed forest, and fragmentation was seen to have a negative effect on bees only in cases where it was extreme (Winfree et al., 2009). Flies are more resilient than bees and other pollinators to habitat change or loss; certain species increase in number with land-use change, while others decrease (Stavert et al., 2007). Forest management can thus have an important role in maintaining and providing a continuous supply of pollinators (Krishnan et al., forthcoming), but selecting the best measures to take is not simple and needs to take the larger context into account. Practices such as selective logging and coppicing, retention of dead wood, prescribed fires and infrequent mowing, which generate more heterogeneous habitats, are likely to be beneficial to pollinators, but also other forest biodiversity. Maintaining adequate floral diversity and abundance in the understorey also helps to support pollinator diversity.
While insects are predominant in understorey pollinator populations, birds and mammals prefer the canopies. Management of landscape attributes thus needs to consider the whole pollinator community. The diversity of bird- and mammal-pollinated tree species within forest landscapes should be maintained through active management practices, such as tree retention and planting. For example, in Brazil, trees were seen to provide stepping stones for nectariferous birds within otherwise homogeneous farmland; in highly fragmented landscapes, such stepping stones can facilitate forest regeneration (Barros et al., 2019).
Globally, described species of soil bacteria and fungi exceed 15 000 and 97 000, respectively, compared with 20 000–25 000 species of nematodes, 21 000 species of protists (protozoa, protophyta, and moulds), and 40 000 species of mites (Orgiazzi et al., 2016). However, the identity of much of the soil biota remains unknown. Soil microbes, forest-dependent pollinators (insects, bats, birds and some mammals) (Box 18), and saproxylic beetles (Box 19) play very important parts in maintaining the biodiversity and ecosystem functions of forests.
Saproxylic beetles are a group of insect species dependent upon dead wood or wood-decaying fungi for some portion of their life cycle. They play an important role in decomposition processes and are therefore significant for forest nutrient cycling. They are also a source of food for species in the higher trophic levels, such as birds. Many species play a part in pollination.
In the Mediterranean region, endemism centres are found in southwestern and southeastern Europe, Turkey, the Near East and topographically varied areas in North Africa (e.g. the Atlas Mountains). Oak-dominated forests are the most important forest type for saproxylic beetles. Conifer plantations support only a limited number of species – usually widespread species assembled in communities distinct from those found in semi-natural oak forests. The major threat to saproxylic beetles in Mediterranean forests is habitat loss due to tree felling, overgrazing and burning.
SOURCE: FAO and Plan Bleu, 2018.
Similarly, mammals, birds and other organisms can play major roles in forest ecosystem structure including on the distribution patterns of trees through their direct roles in seed dispersal, seed predation and herbivory, and indirectly through predation on such ecological architects (Beck, 2008).
Along tropical coasts, mangroves provide breeding grounds and nurseries for numerous species of fish and shellfish and help trap sediments that might otherwise adversely affect seagrass beds and coral reefs – the habitats of a myriad of marine species.
Forest biodiversity significance. The natural biodiversity of forests varies considerably according to factors such as forest type, geography, climate and soils. A study led by UNEP-WCMC (Hill et al., 2019) shows how the contribution of these factors to the distributions of mammal, bird, amphibian and conifer species varies around the world. This analysis uses the rarity-weighted richness of these species (chosen because they were the only groups with ranges that were comprehensively assessed at the time), based on data from the IUCN Red List; these include spatial distribution maps for each species. The biodiversity significance map (Figure 19) shows similarities with the distribution of endemic bird areas and biodiversity hotspots (Myers, 1990; Stattersfield et al., 1998; Mittermeier et al., 1998; Mittermeier et al., 2004) but is based on many more species.
Most forest habitats in temperate regions have low biodiversity significance values because they support fewer species than those in the tropics and the species that they do support tend to have larger geographical distributions than those in other regions of the world (Figure 19). The lowland tropical forests in the Amazon and Congo basins have intermediate biodiversity significance values; even though these forests are species rich, the species present often have large distributions, so the contribution of any individual location to the overall distribution of these species is low. Regions showing the highest biodiversity significance are those having many species with small geographical distributions, such as the montane forests of South America, Africa and Southeast Asia and lowland forests of insular Southeast Asia, coastal Brazil, Australia, Central America and the Caribbean islands.
Figure 20 indicates where the removal of forested habitats could have a disproportionate impact on the world’s forest-dependent species, based on an analysis of the forest biodiversity significance of tree cover loss from 2000 to 2018. Places where the impact would be highest include Madagascar, parts of eastern Brazil, Central America, Southeast Asia, West Africa, Australia and northern New Zealand.
Forest biodiversity intactness. Figure 21 shows forest biodiversity intactness, illustrating the impacts of forest change and human population density on species assemblages; it was developed based on the modelled relationship between anthropogenic pressures and changes in the composition of species communities. As expected, areas with dense human populations and intense agricultural land use, such as Europe and parts of Bangladesh, China, India and North America, are less intact. Southern Australia, coastal Brazil, Madagascar, South Africa and northern Africa are also identified as areas with striking losses in biodiversity intactness.
Overlaying the metrics for conservation planning. The biodiversity significance and intactness metrics have complementary relevance for conservation policy and practice. Safeguarding areas of high significance is important because their loss elevates species’ risk of extinction. Safeguarding areas of high intactness is important to maintain ecosystem functioning, to retain community resilience against pressures such as climate change and to help mitigate climate change (Steffen et al., 2015).
Overlaying the significance and intactness layers (Figure 22) highlights areas with high values for both metrics, for example the northern Andes and Central America, southeastern Brazil, parts of the Congo Basin, southern Japan, the Himalayas and various parts of Southeast Asia and New Guinea (Figure 23). Other areas are notable for having high values for one metric but not the other. Europe, for example, is dominated by large areas of biodiversity intactness in the northeast and areas of high-biodiversity significance in the south (Figure 23D).
Such overlays provide information relevant for conservation planning. For example, landscapes of high significance but low intactness may be appropriate targets for restoration efforts. Landscapes of both high intactness and high significance have a relatively high density of geographically restricted native species and may therefore be important to safeguard through broad-scale policy responses or site-scale conservation measures, such as designation of protected areas. The protected-area coverage of forests within the corresponding ecological zones is already relatively high (see Chapter 6. Conservation and sustainable use of forests and forest biodiversity), but where they are not already protected such areas should be considered priorities for protected-area expansion; an example is the montane forests of the northern Andes.
The outputs highlighted here are also relevant to international and national policy, including National Biodiversity Strategies and Action Plans under the CBD. In addition, mapping of forest biodiversity significance or intactness lost over time can be used to track progress towards goals and targets such as Aichi Target 5 (loss and degradation of habitats), Aichi Target 11 (areas of biodiversity significance) and Aichi Target 12 (preventing extinctions and declines of threatened species). Data on forest loss linked to biodiversity can also inform national planning to reduce deforestation and forest degradation, as well as investment policy.
It will soon be possible to develop tools that combine remotely sensed data with algorithms to show areas of forest loss and the consequences of forest loss for biodiversity in near real time, which would allow rapid responses and interventions on the ground. To this end, both the biodiversity significance intactness and biodiversity layers have been incorporated into the Global Forest Watch platform (www.globalforestwatch.org).
Global processes for setting targets and monitoring progress generally use measures based on forest area as proxy indicators of forest biodiversity; for example, Aichi Target 5 focuses on halving the rate of loss of forests and other natural habitats by 2020. However, a recent study (Green et al., 2019a,b) questions whether changes in forest area are a reliable proxy indicator of forest vertebrate population trends.
The study used time-series abundance data from the Living Planet Database (ZSL and WWF, 2014) for 1 668 populations of forest-dwelling vertebrates to assess the possible influence of changes in tree cover on forest vertebrate populations. Satellite imagery was used to assess tree cover change over the period 1982–2016. The analysis was repeated for 175 populations of “forest specialists”, species that occur only in forests and in no other ecosystem.
Taking the global data set as a whole, the analyses did not reveal a statistically significant relationship between tree-cover change and changes in the population of either forest-dwelling or forest-specialist vertebrate species. It therefore seems that, at a global scale, vertebrate forest populations do not respond in a consistent manner to tree cover change in their vicinity. Areas that have gained tree cover do not necessarily see a recovery of other forest biodiversity, probably because of pressures not related to loss of habitat. However, at the local scale, a statistically significant relationship was evident in specific instances. Annual abundance values of 40 of the 175 forest-specialist populations were found to be positively correlated with tree cover changes, while others were negatively correlated or uncorrelated with changes in tree cover. Time lags between tree cover change and population change were allowed for, because forest vertebrates can take several years to respond to changes in their habitat. Source literature for the data on these forest-specialist populations also indicated other factors driving species population sizes at the local level (see the example in Box 20), demonstrating that relying on forest cover changes as the sole proxy for changes in vertebrate populations is inappropriate.
The Santa Rosa National Park in Costa Rica was established in 1971 on reclaimed ranch lands. Since its designation in 1971, the park has been protected from hunting, human disturbance and logging, with the result that the former pasturelands are returning to forest.
Long-term monitoring of mantled howler monkeys (Alouatta palliata) and white-faced capuchins (Cebus capucinus) has shown the recovery of their populations associated with re-establishment of the forests (Figure A), but also reveals other factors that influence population size besides forest area and condition (Fedigan and Jack, 2012; Green et al., 2019a). Capuchins can inhabit fairly young forest patches and the most recent survey at Santa Rosa showed that the population had grown continuously since the 1980s. However, howler monkeys prefer more mature forests (at least 60 years old) and a population plateau since the 1990s suggests that the population has reached its current carrying capacity in the national park.
Geoffroy’s spider monkeys (Ateles geoffroyi) are also found in Santa Rosa but only in large old-growth patches of forest (at least 100 to 200 years old). Many decades may be required for populations of this species to respond to the increase in forest cover and maturity of trees.
Development of a forest-specialist index. As part of the study of forest vertebrate biodiversity discussed above, Green et al., (2019a) developed a forest-specialist index as a possible global indicator of biodiversity trends below the canopy. The index was created by extracting information on forest specialists from the Living Planet Index (ZSL and WWF, 2014), which tracks the average change in abundance of thousands of vertebrate populations from around the world. Some 75 percent of the specialists were from tropical forests, the most biodiverse forests in the world.
The forest-specialist index declined by 53 percent between 1970 and 2014 from an initial value of 1.0 to an index value of 0.47 (Figure 24), indicating that 455 populations of forest specialists monitored, taken together, more than halved in number on average over the period, an annual rate of decline of 1.7 percent. The finding was consistent across mammals, amphibians and reptiles but less so among birds, especially those from temperate forests. The decline in the index was steepest between 1970 and 1976, after which the decline continued at a slower rate. In the final two years of the period, the number of species increasing exceeded the number of species declining. It is uncertain, however, whether that upturn is a sign of significant long-term improvement in the abundance of forest specialists given that previous improvements were all followed by declines. Individual species showed a mixture of positive, stable and negative trends in both tropical and temperate forests; negative trends were prevalent in the former and positive trends in the latter.
The forest-specialist index could be useful to complement existing indicators in monitoring progress towards SDG 15, the CBD’s post-2020 global biodiversity framework and the goals of the Paris Agreement. The Biodiversity Indicators Partnership (2018) has put it forward as a means to measure progress towards Aichi Targets 5, 7 and 12.
Effect of wildlife hunting on forest biodiversity. Unsustainable wildlife hunting is one of the main drivers of biodiversity loss, second only to agriculture (Maxwell et al., 2016) (see also Chapter 5. Reversing deforestation and forest degradation). A global meta-analysis of threat information for 8 688 animal species on the IUCN Red List of Threatened Species (IUCN, 2019a) estimated that the relative abundance of tropical mammals and birds in hunted areas was 83 and 58 percent lower, respectively, than in areas with no hunting (Benítez-López et al., 2017). Nearly 20 percent of the Red List’s threatened (critically endangered, endangered and vulnerable) and near-threatened species are directly threatened by hunting (Maxwell et al., 2016), including more than 300 mammal species (Ripple et al., 2016). Large-bodied species with low reproductive rates and long generation times are especially vulnerable to hunting (Ripple et al., 2015); as a consequence, vertebrate species assemblages in hunted forests have a higher proportion of smaller species, such as rats, birds and squirrels. Under heavy hunting pressure, forests can ultimately reach the point where the trees are standing but large mammals are absent – a phenomenon termed the “empty forest syndrome” (Redford, 1992). Most commonly hunted mammals in tropical forests are frugivores, and reductions in or extinctions of these species and of large birds and some fish in floodplain forests can have major consequences for seed dispersal and survival and for forest regeneration (Galetti et al., 2008; Peres et al., 2016; Gardner et al., 2017). Thus, in regions with a high proportion of large-seeded animal-dispersed tree species, such as Africa, Asia and the Neotropics, a loss or reduction in forest vertebrates can lead to a reduction in tree-species diversity (Poulsen, Clark and Palmer, 2013; Bello et al., 2015; Osuri et al., 2016). On the other hand, in many countries with high forest cover, sustainable hunting can be an income generator and an important recreation activity, and hence a motivator for maintaining forest (e.g. Reimoser, 2000; Bengston, Butler and Asah, 2008) (see section on Sustainable hunting and wildlife management in Chapter 6).
Forest genetic resources are the heritable materials of forest trees and other woody plant species (shrubs, palms and bamboo) that are of actual or potential economic, environmental, scientific or societal value (FAO, 2014b). The first-ever State of the World’s Forest Genetic Resources (FAO, 2014a) assembled information from 86 reporting countries, accounting for 85 percent of the global forest area. These countries reported nearly 8 000 species of trees, shrubs, palms and bamboo, of which about 2 400 species were actively managed for products or services in forestry.
A total of nearly 1 000 species were reportedly conserved in situ and 1 800 species ex situ (see Box 21 for a discussion of the relative benefits of each type of conservation). Most in situ conservation of forest genetic resources takes place outside protected areas on a range of public, private and traditionally owned land areas, especially in forests managed for multiple uses. It is probable that more species were reported as conserved ex situ than in situ because ex situ conservation efforts are typically better documented than in situ ones. Countries also interpret in situ conservation differently. The mere presence of a given species in a protected area may sometimes be reported as in situ conservation, even though protected areas are generally established for conserving habitats or wildlife rather than for the conservation of forest genetic resources.
In the face of evolving societal needs and climate change, a dynamic, in situ approach is crucial for the long-term conservation of forest genetic resources. Ex situ conservation is mostly static, based on the conservation and management of collected samples of genetic diversity as tissue, seeds or in living collections.
In situ conservation of forest genetic resources is typically carried out in managed natural forests or protected areas by designating specific conservation stands or units for this purpose (FAO, DFSC and IPGRI, 2001). These units may harbour conservation populations of one or more tree species. Silvicultural treatments are applied, if necessary, to maintain or enhance genetic processes within tree populations and to ensure their regeneration. Ideally, the network of these conservation units should cover the whole distribution range of a given tree species. In addition to the species’ distribution range, information on its reproductive biology and genetic characteristics and existing conservation efforts is necessary to assess the effectiveness of established strategies for genetic conservation and to identify gaps in these efforts (e.g. Lompo et al., 2017).
Ex situ conservation of forest genetic resources (e.g. in seed banks, seed orchards, provenance trials and botanical gardens) is often implemented to complement in situ conservation, especially when the population size is critically small in the wild or where in situ conservation cannot be guaranteed. Ex situ conservation is relatively easy in seed banks for seeds that maintain their viability when dried and stored at low temperature. However, this method cannot be used for tree species that lack dormancy and are sensitive to desiccation and low temperatures, which is the case for more than 70 percent of tree species in the humid tropics. Ex situ conservation of those species must rely on field collections, ex situ conservation stands and breeding populations (Sacande et al., 2004). More technically sophisticated approaches, such as cryopreservation of seeds, in vitro conservation of tissue, pollen storage and DNA storage, can also be used for such species (FAO, FLD and IPGRI, 2004).
Natural regeneration relies on genetic material that is readily available on or adjacent to a given site, while planting of trees typically implies the use of germplasm from outside sources. As the rotation cycle of a forest stand can be several decades or even more than 100 years, it is important to make sure that the origin of the introduced germplasm is suited to the environmental conditions on the site, and that the material has enough genetic diversity to allow the new forest to cope with changing environmental conditions and likely pests and diseases.
Once a natural or planted forest has been established, subsequent forest management interventions can have profound effects on its genetic composition. The extent of these effects depends on the specific forest management practices and the stand structure as well as the biological characteristics and ecology of the species (Ratnam et al., 2014).
More than 700 species are included in tree improvement programmes around the world, focusing largely on traits of commercial interest, such as growth, wood properties and resistance to or tolerance of pests and diseases. More recently, however, climate-change-related traits such as plasticity and drought tolerance have been increasingly considered by tree breeding programmes (FAO, 2014b).
At the global level, the supply of tree germplasm for raising planting stock is still largely based on unimproved seeds collected from forest stands, but regions and countries differ considerably in their sourcing and production of tree germplasm. At one extreme, most seedlings planted in the forest sector are raised from improved seeds; at the other, almost all seed is sourced from existing forests or plantations of unknown origin or even from individual trees found in agricultural landscapes (FAO, 2014b). The seed supply for boreal, temperate and fast-growing tropical and subtropical trees has mostly met the demand for establishing new forests, but the seed supply for many high-value tropical hardwoods and for trees used in agroforestry systems has often been insufficient to meet the demand (Koskela et al., 2014). More recently, increasing forest restoration efforts have created a high demand for seeds of native tree species, and many restoration projects are already facing problems in obtaining a sufficient quantity of seed of good physiological and genetic quality to meet the needs of these efforts (Jalonen et al., 2017).
In 2019, FAO initiated the preparation of the second State of the World’s Forest Genetic Resources report, to be launched in 2023. It is expected that the second global assessment will increase awareness of existing gaps in knowledge and highlight the importance of obtaining better information and data on forest genetic resources to enhance the management of these resources at the national, regional and global levels (see example in Box 22).
Agroforestry parklands are traditional land-use systems in many parts of sub-Saharan Africa. Trees retained by farmers in these parklands supply wild fruits, nuts and vegetables to rural communities, especially between crop harvests and during extended droughts. Unfortunately, many food-tree species face threats from overexploitation, fire and climate change.
To enhance the conservation of genetic resources of these tree species in Burkina Faso, scientists at Bioversity International and their collaborators developed a spatially explicit multi-threat model to predict locations where current and future threats are likely to have negative impacts on tree populations (Gaisberger et al., 2017).1 The study targeted 16 food-tree species, based on their importance to the diet of local communities and the availability of data on their occurrence (essential for developing spatial distribution models): baobab (Adansonia digitata), African custard-apple (Annona senegalensis), desert date (Balanites aegyptiaca), the red kapok tree (Bombax costatum), hanza (Boscia senegalensis), sweet detar (Detarium microcarpum), African grape (Lannea microcarpa), African locust bean (Parkia biglobosa), Senegalia macrostachya, gum arabic tree (Senegalia senegal), marula (Sclerocarya birrea), elephant orange (Strychnos spinosa), tamarind (Tamarindus indica), shea butter tree (Vitellaria paradoxa), false sandal-wood (Ximenia americana) and Indian jujube (Ziziphus mauritiana). Some of these have a vast distribution range (e.g. Parkia biglobosa) and others supply multiple edible products (e.g. leaves, seeds and pulp from Adansonia digitata).
The model defines suitable habitats for the species under present and future conditions by combining information from freely accessible data sets, species distribution models, climate models and expert survey results. Of the six main threats identified, overexploitation and conversion of land to cotton production were seen to be the most important in the short term, while climate change was seen as the prevalent long-term threat for 14 of the 16 tree species examined. The study also revealed that all 16 species face serious threats in most of their locations across Burkina Faso, indicating that urgent action is needed to conserve the species and their genetic resources in the country.
Observing where high genetic diversity of a species coincides with high threat levels enables more-effective design of conservation actions and use of limited resources to maintain the genetic diversity of tree populations across the species’ distribution range. For example, Parkia biglobosa is highly threatened by overexploitation in the central part of Burkina Faso (Figure Aa) and protection and assisted regeneration should be promoted there as the species grows in areas where predicted climatic conditions will continue to be favourable in the future. Parkia biglobosa populations located along the northern margin of the species’ range are highly threatened by climate change (Figure Ab), and seed sources in this valuable area may be lost unless seed is collected for planting in more suitable climates and for ex situ conservation. A range-wide genotyping study provided important insight into the spatial genetic structure of P. biglobosa populations across West Africa (Lompo et al., 2018). By comparing the spatially explicit threat maps from Gaisberger et al. (2017) and the genetic diversity map in Burkina Faso from Lompo et al. (2018) (Figure B), it is possible to identify those genetically distinct tree populations that are at risk and deserving of priority in conservation efforts. This information can also be used to guide tree-planting efforts.
Progress towards Aichi Target 12, on preventing the extinction of known threatened species and improving their conservation status, has been slow.
Table 3 summarizes the vulnerability status of the forest-dwelling plants, animal and fungi that have been assessed in the IUCN Red List (2019a) as of December 2019.
The Global Living Planet Index, calculated using data for 16 704 populations representing 4 005 species monitored across the globe, shows an overall decline of 60 percent in the population sizes of vertebrates between 1970 and 2014 (WWF, 2018). The forest-specialist index, modelled on this, declined by 53 percent between 1970 and 2014 (Figure 24), highlighting the increasing risk of 268 forest vertebrate species becoming vulnerable to extinction.
Progress towards Aichi Targets 13 (maintenance of the genetic diversity of cultivated plants and farmed and domesticated animals and of wild relatives) and 16 (implementation of the Nagoya Protocol on Access to Genetic Resources and the Fair and Equitable Sharing of Benefits Arising from their Utilization) has been more positive. As of January 2020:
▸ the Nagoya Protocol had been ratified by 122 contracting Parties, including the EU (an increase of 74 percent from 2016) (CBD, 2020a);
▸ 95 countries and the EU have submitted an interim national report on the implementation of the Nagoya Protocol to the access and benefit-sharing (ABS) Clearing-House (CBD, 2020b);
▸ 44 countries submitting progress reports in 2018 reported having achieved, on average, two-thirds of the action points in the Global Plan of Action for the Conservation, Sustainable Use and Development of Forest Genetic Resources (Box 23);
▸ a pan-European strategy has enhanced regional collaboration for the conservation of forest genetic resources in Europe (Box 24); and
▸ 146 Parties had ratified the International Treaty on Plant Genetic Resources for Food and Agriculture (FAO, 2019d).
The voluntary, non-binding Global Plan of Action for the Conservation, Sustainable Use and Development of Forest Genetic Resources (FAO, 2014b), adopted by the FAO Conference in 2013, identifies four priority areas for action at the national, regional (see Box 24 below) and global levels to enhance the management of forest genetic resources:
▸ improving the availability of, and access to, information on forest genetic resources;
▸ conservation of forest genetic resources (in situ and ex situ);
▸ sustainable use, development and management of forest genetic resources; and
▸ policies, institutions and capacity-building.
In 2017, the Commission on Genetic Resources for Food and Agriculture adopted targets, indicators and verifiers for forest genetic resources to be used in monitoring the implementation of the Global Plan of Action. The targets and indicators can also be used for monitoring the progress made towards Aichi Biodiversity Target 13 (and a possible new target replacing it for the post-2020 period) as well as relevant targets of the SDGs.
In 2018, 44 countries submitted progress reports, which FAO used to prepare the first report on the implementation of the Global Plan of Action (CGRFA, 2019). Although the response level was not high enough to make comprehensive conclusions on the progress made by countries in implementing the Global Plan of Action, some observations can be made:
▸ Reporting countries had achieved, on average, 67 percent of the action points in the plan and had initiated efforts on a further 10 percent.
▸ Only four of the 44 reporting countries had achieved all 15 action points.
▸ Many countries lack the human and financial resources to carry out and report on conservation programmes for all important and useful forest species, and especially for endangered, threatened and rare species.
Many tree species have distribution ranges that extend across large geographical areas with profound environmental differences. These ranges often include many countries with different forest management practices, ownership patterns and administrative structures. For these reasons, the management and conservation of forest genetic resources often vary considerably within the species’ distribution ranges.
Efforts to conserve the genetic diversity of Europe’s tree species in situ and to develop regional genetic conservation strategies for forest trees were long hampered by countries’ different ideas about how to manage tree populations or stands designated for conservation, as well as inadequate documentation.
To address this problem, the European Forest Genetic Resources Programme (EUFORGEN, www.euforgen.org), a collaborative mechanism under the Forest Europe process (Forest Europe, n.d.), developed common minimum requirements for genetic conservation units of forest trees that set criteria for how the units should be documented and managed (Koskela et al., 2013). Georeferenced data on these units are collected in the European Information System on Forest Genetic Resources (EUFGIS, http://portal.eufgis.org), which has made it possible to identify gaps in conservation efforts at both national and regional levels (Lefèvre et al., 2013) and to analyse the expected impacts of climate change on the genetic conservation units of forest trees in Europe (Schueler et al., 2014).
Based on this information, EUFORGEN prepared a pan-European strategy for conserving forest genetic resources (de Vries et al., 2015). During this process, the regional-level minimum conservation target was determined for each tree species by dividing its distribution range into smaller geographical areas by country and by Europe’s eight major environmental zones. The strategy aims to have at least one conservation unit for each environmental zone in which a given species occurs in a country; this provides for systematic coverage of all countries and environmental zones across the whole distribution range of the species (barring any gaps in conservation efforts). EUFORGEN has also developed recommendations for considering the implications of climate change in conserving forest genetic resources (Kelleher et al., 2015).
As of December 2019, EUFGIS contained data on 3 593 genetic conservation units and 108 tree species in 35 countries (see example in Figure A). The database is continuously updated, and EUFORGEN regularly monitors implementation of the regional conservation strategy.
This regional collaboration has prompted many countries to take action to improve the management of their forest genetic resources. It has also improved partnership between experts, forest owners, managers and the broader biodiversity community in exploring new ways to improve the contribution of production forests and protected areas to the genetic conservation of forest trees.
Much of human society today has at least some interaction with forests and the biodiversity they contain and all people benefit from the functions provided by components of this biodiversity in the carbon, water and nutrient cycles and through the links with food production.
People’s relationships with forest biodiversity vary from region to region and country to country, and also differ widely depending on the context – from protected areas with limited human activities, to communities deep inside forests, to farmed and ranched landscapes, to towns and larger urban centres, to the world’s largest cities. This chapter examines the benefits that people derive from forests in terms of livelihoods, food security and human health.
In both developing and developed countries and in all climatic zones, communities that live within forests rely the most directly on forest biodiversity for their lives and livelihoods, using products derived from forest resources for food, fodder, shelter, energy, medicine and income generation. Other rural people, most of whom live in landscapes containing a mix of grasslands, farmlands and tree cover, often participate in the value chains of forest biodiversity, for example by collecting wood and non-wood products from nearby forests for personal use or sale, or engaging in forest-product industries or value addition (Zhang and Pearse, 2011). While the examples provided below provide some indication of the number of people dependent on forests for (parts of) their livelihood, a precise estimate of the number of forest-dependent people does not currently exist (Box 25).
A challenge for those concerned with policy, practice, planning and investment at the nexus of forests, biodiversity and people is in determining the numbers as well as the demographic, social and economic characteristics of those populations that depend the most on forest resources, often referred to as “forest-dependent people”. The heterogeneity of people’s interactions with forests makes it difficult to define forest dependence in a standard and meaningful way (Newton et al., 2016). For example, much of the world’s food production relies on forest ecosystem services such as fresh water, availability of pollinators and local climate regulation. Furthermore, reliable data and means of measuring and tracking forest dependence are widely lacking; in general, national and subnational statistics related to population, social, economic, health and poverty indicators do not disaggregate populations living in and around forests. The harvest and trade in NWFPs, often predominantly engaging women, are particularly poorly tracked (Gurung, 2002; Watson, 2005).
Nevertheless, a number of population statistics have been used to estimate the scale of human dependence on forests, and by inference forest biodiversity. The often-cited figure of 1.6 billion people dependent on forest resources to some extent globally (World Bank, 2002) is likely to be out of date in light of changes in rural populations around the world. FAO (2018b), based on data from the International Fund for Agricultural Development (IFAD) and other sources, indicated that around 820 million people live in tropical forests and savannahs in developing countries. Chao (2012), based on data from the World Bank, the Rainforest Foundation and the World Rainforest Movement, estimated that about 1.2 billion people rely on agroforestry farming systems; this is in addition to 300 to 350 million people living within or adjacent to dense forests and depending on them for their subsistence and income. IFAD and UNEP (2013) gives a more expansive estimate, suggesting that 2.5 billion people practising smallholder agriculture benefit from the regulatory and provisioning services of forests and trees in landscapes. Furthermore, 2.4 billion people – in both developing and developed countries and urban and rural settings – use wood-based energy for cooking, (FAO, 2014c).
Overall, with a world population of around 7.8 billion in December 2019, the estimates presented here suggest that roughly one-third of humanity has a close dependence on forests and forest products. However, it is difficult to estimate how this number is evolving with global trends, such as rural to urban migration, and how it will change with the projected increase in the global population to around 10 billion people by 2050.
Since information on forest-dependent people is scarce, it is difficult to design targeted interventions and policies, which is the reason why this group is at risk of being left behind with regard to the SDGs. Several actions are needed to ensure that appropriate policies, practices and programmes are implemented to prevent this eventuality:
▸ Forest dependence needs to be more clearly defined to identify both people living within and in close proximity to forests and those that depend to some extent on forest resources for their lives and livelihoods.
▸ Censuses and other household surveys, at both national and international levels, need to adequately sample populations living in and around forest areas, even if sampling costs are high given the remoteness of many such regions.
▸ Demographic and socio-economic data on forest-dependent people should be disaggregated in surveys that are already being undertaken.
▸ Standard criteria are needed to establish the poverty status of forest-dependent people based on both their income relative to the international poverty line (as per SDG Target 1.11) and nationally developed and tuned poverty indices (as per SDG Target 1.22). The latter would ideally be based on multidimensional criteria that integrate factors particular to forests, such as the direct contributions of forest resources to subsistence and the sometimes-high social capital and informal social protection mechanisms of traditional forest societies.
The Collaborative Partnership on Forests (CPF) has developed a global core set of 21 forest-related indicators to support the implementation of the 2030 Agenda (particularly SDG 15, Life on land) and the United Nations Strategic Plan for Forests 2017–2030 (UN, 2017a) and is developing methodologies for their implementation. Current work focuses on those indicators that pose particular data-collection challenges, especially socio-economic indicators – including “Number of forest-dependent people in extreme poverty”.
In developing countries, woodfuel (fuelwood and charcoal) is particularly important, both for household use and for sale, with an estimated 880 million people worldwide spending part of their time collecting fuelwood or producing charcoal (FAO, 2017a). More than 40 million people – 1.2 percent of the global workforce – are engaged in commercial fuelwood and charcoal activities to supply urban centres. Production of woodfuel generated USD 33 billion of revenue globally in 2011. The sustainability of its production is hence extremely important.
Wood and non-wood forest products (NWFPs) provide around 20 percent of income for rural households in developing countries with moderate to good access to forest resources (Angelsen et al., 2014). Taking into account direct, indirect and induced employment, the formal forest sector provides an estimated 45 million jobs globally and labour income in excess of USD 580 billion per year (FAO, 2018b). Small and medium-sized forest enterprises (SMFEs) account for about 20 million of these jobs, generating value of USD 130 billion per year. Globally, the reported value of NWFP removals in 2015 amounted to almost USD 8 billion (FAO, 2020). These estimates are all likely to be significantly lower than actual figures, since much of the forest sector globally is in the informal economy and not well tracked in national statistics.
The informal sector – defined as non-commercial, subsistence or unregulated and unreported small-scale enterprises – was estimated to have generated USD 124 billion in revenue in 2011, providing employment for an additional estimated 41 million people (FAO, 2014c). NWFPs are particularly important in this sector, providing food, income and nutritional diversity for hundreds of millions of people around the world, notably women, children, landless farmers, indigenous peoples and others in vulnerable situations (see Box 25 and FAO, 2018b). The gathering of food, medicinal plants, craft materials, other NWFPs and woodfuel forms a significant component of women’s contributions to household livelihoods. In some remote areas, the sale of NWFPs is the only source of cash available to women (Shackleton et al., 2011).
Non-consumptive uses of forest biodiversity, such as recreation and tourism, are also a growing part of rural cash economies (Hegetschweiler et al., 2017). Each year an estimated 8 billion visits are made to protected areas, many of which are forest covered, and associated in-country expenditures are estimated to be in the order of USD 600 billion annually (Balmford et al., 2015).
In addition, forest biodiversity may provide a safety net for hundreds of millions of people as sources of food, energy and income during hard times (Sunderlin et al., 2005), although some authors (e.g. Paumgarten, Locatelli and Witkowski, 2018) note that this function may be limited by seasonal fluctuations and decreased availability during extreme events.
Urban populations have long benefited from a range of wood and NWFPs, from paper and furniture to mushrooms, forest fruits and wild game. A significant proportion of poor urban people depend on fuelwood and charcoal to cook their food, particularly in Africa (see e.g. Mulenga, Tembo and Richardson, 2019). In more prosperous economies, urban people are showing a growing interest in foods, cosmetics and other products from the forest, as illustrated by the appearance of products from forest species such as the Açai palm (Euterpe oleracea) and the baobab tree (Adansonia digitata) on supermarket shelves or in the recipes of cutting-edge chefs around the world (e.g. McDonell, 2019). In addition, an increasing number of economically well-off people in developed and developing countries are opting to live at least part-time in forested areas, with biodiversity being one of the main attractants, in what has been termed amenity migration (Gosnell and Abrams, 2011).
Indigenous peoples depend to a particularly high degree on forest biodiversity for their livelihoods, although this relation is in flux as their linkages with national and global monetary economies grow. Areas managed by indigenous peoples, currently approximately 28 percent of the world’s land surface, include some of the most ecologically intact forests and many hotspots of biodiversity (Garnett et al., 2018). Indigenous communities often have a deep cultural and spiritual relationship with their ancestral forest lands and age-old knowledge about biodiversity (Verschuuren and Brown, 2018), much of which is at risk of being lost (Camara-Leret, Fortuna and Bascompte, 2019). The intangible contribution of forests and their biodiversity to people’s identity and sense of well-being is undervalued in many economic assessments.
The world’s poorest people depend on forests to varying extents (Sunderlin et al., 2005; Camara-Leret, Fortuna and Bascompte, 2019), but are generally more dependent on biodiversity and ecosystem services than are people who are better off (Reid and Huq, 2005; CBD, 2010b). Human populations tend to be low in areas of low- and middle-income countries with high forest cover and high forest biodiversity, but poverty rates in these areas tend to be high (Fisher and Christopher, 2007). FAO (2018b) estimated that 252 million people living in forests and savannahs had incomes of less than USD 1.25 per day. Overall, about 63 percent of these rural poor lived in Africa, 34 percent lived in Asia and 3 percent lived in Latin America. The 8 million forest-dependent poor in Latin America represent about 82 percent of the region’s rural extreme poor.
Understanding the relationship between poverty and forest landscapes has critical implications for global efforts to fight poverty and to conserve biodiversity. The relationship between humans and forests is subject to complex, dynamic and sometimes opposing forces (e.g. Busch and Ferretti-Gallon, 2017). Identifying the causal pathways between social and economic variables and environmental outcomes is a formidable challenge (Ferraro, Sanchirico and Smith, 2019).
Poverty reduction and income growth can, on the one hand, increase the demand for land-intensive goods and production and intensify the human desire to convert forest to pasture, cropland and living space. On the other hand, rising income could change occupational patterns away from land-intensive production, increase the demand for recreation and environmental quality, and strengthen people’s ability and willingness to conserve nature. The impacts of these forces are filtered through and shaped by institutions and policy conditions (Deacon, 1995).
Studies by Alix-Garcia et al. (2013) in Mexico and by Heß et al. (2019) in the Gambia to determine the causal impact of income growth on deforestation showed that income growth induced by a conditional cash transfer programme and a community-driven development programme, respectively, increased forest loss. By contrast, other studies in Mexico and Uganda suggest that programmes offering payments in compensation for conservation activities have successfully reduced rates of deforestation (Alix-Garcia et al., 2015; Jayachandran et al., 2017).
A variety of social and economic factors interact with both forest cover and poverty, affecting their relationship. These factors include agricultural expansion, population growth, transportation infrastructure, technology change, credit access and international trade. Transportation infrastructure provides a good example of such interactions. Forest landscapes are generally remote and often have poor connections to markets for their products and poor provision of services from both governments and the private sector; the latter is exacerbated by the fact that many forest populations are socially marginalized groups such as ethnic minorities or indigenous people. New and better roads could reduce the cost of exploiting forest resources and expand the market for local forest products but could at the same time provide residents of forest areas with more economic opportunities and social services and reduce reliance on the forest.
A study by the World Bank commissioned for this volume found great heterogeneity in the relationship between poverty and forest cover (Figure 25). Central Africa has both high poverty rate and high forest cover, while many parts of Europe and North America exhibit low poverty rate and high forest cover. Malawi is shown as a specific case where district-level poverty data were available (Figure 26). Here the mapping exercise suggests a negative correlation between poverty and forest intactness, with the southern part of the country having lower forest density (used as a proxy for intactness) and higher poverty rates.
Such results do not make it possible to infer causality but can still be useful to help identify priority intervention areas for national plans and strategies that aim to combine positive development and conservation outcomes. The availability of more spatially disaggregated poverty data in the future, ideally using multidimensional criteria that better reflect the forest context, may help to establish causal pathways.
FAO (2009) defines food security as a situation that exists when all people, at all times, have physical, social and economic access to sufficient, safe and nutritious food that meets their dietary needs and food preferences for an active and healthy life. Based on this definition, food security is understood to have four dimensions: availability, access, utilization and stability.
Forests and trees outside forests (including trees in agroforestry systems, other trees on farms and trees in non-forested rural and urban landscapes) contribute to all four dimensions of food security through the provision of nutritious food, income, employment, energy and ecosystem services (FAO, 2013a; FAO, 2017b; HLPE, 2017). Forest depletion or degradation can thus have a negative impact on food security and nutrition. Widespread conversion of forests to other land uses, particularly for agriculture, may increase food security of farmers and communities that depend on their products in the short or medium term but may also have negative long-term environmental, livelihood and food-security impacts on people; these impacts will primarily affect forest communities but also affect national and global populations. Furthermore, the aggregate long-term impact of the loss of biodiversity and ecosystem services resulting from loss of forest is likely to result in reduced agricultural productivity. The contribution of forests to food security and nutrition therefore calls for more direct attention in the forest policies of most countries.
Availability (the actual or potential presence of food). Worldwide, around 1 billion people depend to some extent on wild foods such as wild meat, edible insects, edible plant products, mushrooms and fish (Burlingame, 2000). Some studies indicate that in developing countries these households tend to have the lowest incomes (Angelsen et al., 2014). Even though foods from forests have been estimated to represent less than 0.6 percent of global food consumption (FAO, 2014c), they are key to ensuring the availability of nutrient-dense foods and important vitamins and trace elements in many communities.
Forests and trees outside forests also support food availability by providing fodder for livestock, either as browse or as animal feed. The contributions of fodder to food availability are twofold: livestock are a source of meat and milk and also support agricultural production by providing draught power and manure, which can increase farm productivity.
Ecosystem services provided by forests and trees in agroforestry and silvopastoral systems support agricultural, livestock, forestry and fishery production through water and microclimate regulation, shade and windbreak provision, soil protection, nutrient cycling, biological pest control and pollination (Reed et al., 2017) (see the example in Box 26 and the section on Forest biodiversity and sustainable agriculture). Their role in countering and mitigating climate change risks is vital in ensuring availability of food in many areas (see Case Study 1 on large-scale dryland restoration for the resilience of small-scale farmers and pastoralists in Africa, in Chapter 5).
Floodplain forests across the lower Amazon River support high fish catches in lakes and rivers in these highly biodiverse ecosystems, where fish richness and abundance has been found to be directly associated with forest area (Lobón-Cerviá et al., 2015; Castello et al., 2018). In Nigeria, the density of forest cover is positively and significantly correlated with village consumption of fresh fish (Lo, Narulita and Ickowitz, 2019). Inland fisheries contribute far more to global food security than has been previously recognized, providing primary sources of animal protein and essential nutrients, particularly in developing countries. Small fish, for example, can be important sources of vitamin A, iron and zinc and are reported to be more affordable and accessible than larger fish, other animal sources of foods or vegetables (Kawarazuka and Béné, 2011; Fluet-Chouinard, Funge-Smith and McIntyre, 2018).
Access to food. As described in 4.1 People’s benefits from forests and biodiversity, the formal and informal forest sectors (including collection, processing and sale of timber, woodfuel and NWFPs) are an important source of employment and income, thus ensuring economic access to food. Although the cash contribution of forest products to household income may not be large at the global level, it is still critical for the livelihoods and food security and nutrition of the more than 80 million people employed in the formal and informal forest sectors. Secure forest tenure and resource rights are essential for the full realization of economic benefits from collection and sale of forest products, and thus for the food security of forest-dependent people.
Although gender-disaggregated data are limited, studies suggest that rural women have a central role in sustainable harvesting of NWFPs and collection of fuelwood and rely year-round on returns from their sales (FAO, 2014d; HLPE, 2017). Some efforts have been made to improve the data on NWFPs, but more information is needed to allow more precise estimates of where and for whom these products play a key role in food security and nutrition (FAO, 2017c).
Thanks to their strong linkages with forest communities and their focus on forest-related livelihoods, SMFEs have particular potential to enhance the food and nutrition security of many rural communities. Realization of this potential will often depend on overcoming challenges such as limited local capacity, bureaucratic regulations, inequitable local power structures, tenure insecurity and the capture of benefits by local elites.
Utilization of food (consumption of adequate nutrition and energy). Cooking is the primary way to ensure nutrients are absorbed from food, and around one-third of the world’s population (2.4 billion people) uses woodfuel for cooking, while, approximately one in ten people globally uses woodfuel to boil and sterilize water to make it safe for drinking and food processing (FAO, 2014c). As another example of the use of tree products in food utilization, powdered seeds of the drumstick tree (Moringa oleifera) are also used for household water purification, because of its antibacterial properties (Delelegn, Sahile and Husen, 2018). Woodfuel is also used in food preservation processes such as smoking and drying, which extend the supply of food resources during non-productive periods and enable their distribution over wider areas.
However, the use of woodfuel can be associated with negative impacts including forest degradation and human health risks from smoke (Box 27). As woodfuel is likely to remain the most affordable source of energy for a considerable share of the world population in the medium-term future, it is important to ensure that it is harvested sustainably and used efficiently.
Woodfuel is still the predominant cooking fuel used by poor rural households in much of the developing world, especially in Africa and South Asia. Since the alternative might be raw food, this contribution is an absolutely core element of food security for this population. Woodfuel consumption has declined or remained steady over time in most regions, but in sub-Saharan Africa it continues to increase. Because of habits, taste, customs and experience, it is often preferred even where alternative energy sources are available (FAO, 2017a).
While woodfuel represents almost 50 percent of global wood consumption and over 90 percent of all wood harvested in Africa (FAO, 2019e), one-third of woodfuel is still harvested unsustainably as a result of unregulated forest access (FAO, 2017a) and harvesting woodfuel is a common cause of forest degradation.
If not used properly, woodfuel can also cause smoke pollution, commonly the result of inefficient combustion during cooking, which can have negative health impacts. It is estimated that almost 4 million people die prematurely each year as a result of illnesses attributed to household air pollution from cooking with solid fuels and inefficient cooking practices (Clean Cooking Alliance, 2015; WHO, 2018a). Improved stove systems can alleviate this risk and can also reduce the amount of fuel needed.
Forests and the biodiversity they contain also help to support local people’s nutrition status by providing foods that contribute a wide range of macro- and micronutrients. Wild foods often contain high levels of key micronutrients. Forest fruits, for example, are rich sources of minerals and vitamins, while seeds and nuts harvested in the forest add calories, oil and protein to diets. Wild edible roots and tubers serve as carbohydrate sources, while mushrooms are a source of important nutrients including selenium, potassium and vitamins. Leaves from trees and shrubs (either fresh or dried) are among the most widely consumed forest products. They serve as a rich source of protein and micronutrients including vitamin A, calcium and iron, which are often lacking in the diets of nutritionally vulnerable communities. Furthermore, most of the global supply of vitamins C and A and calcium and much of the folic acid comes from crops pollinated by animals (Eilers et al., 2011). Research has shown strong links between forest cover and dietary quality (Box 28).
Access to forests and tree-based systems is linked to consumption of fruits and vegetables and to dietary diversity, while forest loss is linked to a reduction in the nutritional quality of local diets (Ickowitz et al., 2014). Dietary diversity – the number of different foods or food groups consumed over a given period – of individuals or households can be used as an indicator of nutritional status, including adequacy of micronutrient availability, energy and child growth (Jamnadass et al., 2015). In a study in the United Republic of Tanzania, greater consumption of forest foods was correlated with higher dietary diversity, greater consumption of foods sourced from animals and more nutrient-dense diets (Powell, Hall and Johns, 2011). Ickowitz et al. (2014) paired satellite images of tree cover with dietary information across 21 African countries and found that the diversity of children’s diets was higher where tree cover was higher; consumption of fruits and vegetables increased with tree cover up to a peak of 45 percent tree cover. Similarly, across 27 countries in Africa, association with forests was correlated with an increase in children’s dietary diversity of at least 25 percent (Rasolofoson et al., 2018).
Loss of forest cover can also have negative nutritional consequences. In a geospatial analysis of 15 countries in sub-Saharan Africa, Galway, Acharya and Jones (2018) observed a link between deforestation and reduced dietary diversity in young children, in particular lower consumption of legumes, nuts, fruits and vegetables. They found the relationship to be strongest in West Africa.
Stability of food security (access to and availability and utilization of food at all times without risk). Income and wild foods from forests provide a safety net during seasonal food shortages and during times of famine, crop failure and economic, social and political shocks (FAO, 2017b). Harvesting food from forests is an important strategy for coping with periods of food insecurity, especially for the vulnerable households living in and close to forests. Forest products are often available for extended periods, including during the “hungry” or “lean” seasons (see example of West Africa in Box 29), when traditional agricultural products are unavailable, when stocks have run out and when money is in short supply.
In West Africa, African locust beans (Parkia biglobosa) are fermented to obtain a nutritious food rich in protein (40 percent of dry matter) and fat (35 percent), which keeps for over one year without refrigeration (FAO, 2016a). The beans mature in the dry season and thus provide valuable food in the middle of the traditional “hungry season” before the new crop harvest. Annual production figures are difficult to obtain because the beans do not enter regular commercial trade, but it has been estimated that 200 000 tonnes of beans are gathered each year in northern Nigeria alone (Nwaokoro and Kwon-Ndung, 2010).
In the western region of Ghana, NWFPs are particularly important for household food security, nutrition and health during the lean season (June to August). Low-income households reportedly consume products gathered from forests, such as bushmeat (including the greater cane rat, Thryonomys swinderianus), snails, mushrooms, honey and fruits, five to six times a week (Ahenkan and Boon, 2011).
In Senegal, the fruits of certain trees such as Boscia spp., which fruit all year round, and marula (Sclerocarya birrea), which fruit at the end of the dry season, are commonly used to diversify diets, thus helping to address seasonal shortages of vitamins (FAO, 1989).
In addition to providing measures for coping with short-term instability in food supplies (which can lead to acute food insecurity), forests and forest diversity provide ecosystem services that are critical to ensuring medium- to long-term stability of food supplies (which can prevent chronic food insecurity), including through their support to sustainable agricultural, livestock and fishery production (described above under Availability; see also section on Forest biodiversity and sustainable agriculture). The role of forests in the maintenance of biodiversity as a gene pool for food and medicinal crops is essential to secure the diversity needed to promote long-term quality of diets.
Forest foods form a small (in terms of calories) but critical part of diets commonly consumed by rural, food-insecure populations, also adding variety to predominantly staple diets. In some communities that consume high levels of forest food, wild forest foods alone are sufficient to meet minimum dietary requirements for fruits, vegetables and animal source foods (Rowland et al., 2015).
The value of forest foods as a nutritional resource is not limited to the developing world. More than 65 million citizens in the EU collect wild foods occasionally and at least 100 million consume edible forest products (Schulp, Thuiller and Verburg, 2014). Wild foods, particularly wild game and other forest products, are also commonly consumed in North America (Mahoney and Geist, 2019). Some forest foods are widely traded. The global market for edible mushrooms, for example, many of which are collected from forests, is estimated to be worth USD 42 billion per year (Willis, 2018).
Forest foods are of particular nutritional (and cultural) importance to indigenous communities. A study of 22 countries in Asia and Africa, including both industrialized and developing countries, found that indigenous communities use an average of 120 wild foods per community (Bharucha and Pretty, 2010).
Across the globe, a substantial number of tree species provide important sources of food and nutrients (Figure 27). Many species provide foods from multiple parts of the tree. The baobab (Adansonia digitata), for example, is a multipurpose tropical tree used for both its fruits and its leaves, which are a staple food for many people in African drylands. The dehydrated pulp of baobab fruits contains up to 300 mg of vitamin C per 100 g of fruit pulp, close to six times the level of vitamin C present in oranges (Odetokun, 1996, cited in Manfredini, Vertuani and Buzzoni, 2002), as well as vitamins A, B1, B2 and B6. Daily consumption of 10 to 20 g of the fruit pulp can meet the vitamin C intake requirement of a child. Baobab leaves are also high in calcium, protein and iron (Mbora, Jamnadass and Lillesø, 2008).
Similarly, the leaves of the drumstick tree (Moringa oleifera) provide large amounts of vitamin B, vitamin C, beta-carotene, magnesium, iron and protein. They also contain phenolic and flavonoid compounds that have antioxidant, anticarcinogenic, immunomodulatory, antidiabetic and hepatoprotective properties. Just 5 g of powdered leaf can meet around 60 percent of the daily vitamin A intake requirement of children under the age of three (Institute of Medicine, 2001; Witt, 2013).
Nuts. Nuts are among the most nutritionally concentrated of human foods, being high in protein, oil, energy, minerals and vitamins. Despite being an energy-dense food, nuts strongly induce satiety and their consumption is associated with no weight gain (or with weight loss) and reduced risk of obesity in observational studies and clinical trials (see e.g. Liu et al., 2019). The EAT-Lancet Commission (Willett et al., 2019) noted that transformation to healthy diets by 2050 will require substantial dietary shifts, including more than doubling consumption of healthy foods such as nuts, fruits, vegetables and legumes. While consumption of nuts is traditionally high in some West African populations, in general nuts are the food group with the largest gap between actual dietary intake and a reference “healthy” diet as proposed by the EAT-Lancet Commission.
The annual production of nuts that originate primarily or exclusively from forests is substantial in many countries (Figure 28). Some nuts support subsistence for rural communities and forest dwellers, while others, such as the Brazil nut, are of considerable commercial importance (Box 30). Trees and shrubs bearing edible nuts are often left standing on farmlands and homesteads after land clearance.
The Brazil nut (the seed of the rainforest tree Bertholletia excelsa) is the only globally traded edible seed currently collected from the wild by forest-based harvesters. Over the past few decades, the harvesting of Brazil nuts has supported the “conservation through use” of millions of hectares of Amazonian forest by tens of thousands of rural households. The nuts contribute significantly to local livelihoods, national economies and forest-based development in a large geographic area, generating tens of millions of United States dollars in annual export value in Bolivia (Plurinational State of), Brazil and Peru. The tree reacts robustly to the type and level of nut harvesting currently practised. The resource users have developed endogenous management systems that sustain productivity.
SOURCE: Guariguata et al., 2017.
Wild meat. Redmond et al. (2006) listed close to 1 800 species of insects, mammals, birds, amphibians and reptiles used as wild meat around the world, many of these in tropical and subtropical forests. Given that only 45 percent of these (around 800) were insects (other sources indicate that 1 900 species of insects have been used as food, see below) and that fish and shellfish were not included, the total number of forest animals hunted for food is likely to be significantly higher. In rural forest communities and small provincial towns, where there is little access to cheap, domestic meats but still access to wildlife, wild meat is often the main source of macronutrients, such as protein and fat (Sirén and Machoa, 2008), and important micronutrients, such as iron and zinc (Golden et al., 2011). A recent survey of almost 8 000 rural households in 24 countries across Africa, Asia and Latin America found that 39 percent of households harvested wild meat and almost all consumed it (Nielsen et al., 2018). Wild meat accounts for at least 20 percent of animal protein in rural diets in at least 62 countries worldwide (Nasi et al., 2008). In the Amazon and Congo basins, wild-meat consumption delivers between 60 and 80 percent of communities’ daily protein needs (Coad et al., 2019). Studies suggest that, where consumption of forest food is high, diets may include a higher proportion of meat, fish, fruits and vegetables from forests than from domestic livestock, aquaculture and agriculture (Rowland et al., 2017). In contrast, wild meat does not usually play a significant role in food security in established urban centres where relatively cheap domestic meats are available (Wilkie et al., 2016). However, in some poorer forested countries, urban centres may have significant demand for bushmeat, especially where domestic livestock sources of protein may be limited (Van Vliet et al., 2019).
Wild meat can be a particularly important source of protein, fat and micronutrients when other foods become unavailable, for instance during economic hardship, civil unrest or drought (Coad et al., 2019).
The sale of wild meat in urban centres could also be a source of income diversification for hunting communities, notably in areas where protein from domestic livestock is scarce or expensive (Nasi, Taber and Van Vliet, 2011). Similarly, trade in other wildlife products, such as hides taken as a by-product of harvesting animals for meat, can also provide a source of cash income for forest communities. Peru, for example, exports an average of 41 000 peccary skins annually under CITES permits for use by the fashion industry (Sinovas et al., 2017).
However, as the rate of urbanization accelerates, demand from cities for wild meat and wildlife products is driving increased hunting. Suppliers include both rural village hunters and professional commercial hunters from elsewhere. Even low per capita urban consumption can result in unsustainable levels of wildlife offtake in the supply catchment, especially when coupled with improvements in hunting technology, low wildlife productivity and habitat loss and fragmentation (Fa, Currie and Meeuwig, 2003; Coad et al., 2019).
In rural communities where wild-meat use is critical for local livelihoods but hunting offtakes have become unsustainable, decline in populations of wildlife species is likely to have significant impacts on human well-being unless sustainable management practices along the wild-meat commodity chain can be developed (Golden et al., 2011) (see Chapter 6. Conservation and sustainable use of forests and forest biodiversity). It is essential that management strategies be flexible, integrated and in harmony with different interests, needs and priorities (Coad et al., 2019).
Insects. It is estimated that insects form part of the traditional diets of at least 2 billion people. More than 1 900 species have reportedly been used as food, with beetles (Coleoptera) representing 31 percent of the species consumed, caterpillars (Lepidoptera) representing 18 percent of the species consumed, and bees, wasps, and ants (Hymenoptera) representing 14 percent of the species consumed (FAO, 2013b).
Though management of edible insects as a commercial food resource has great potential, overharvesting can pose conservation and food-security issues, as seen for example with commercialization of the mopane caterpillar (Imbrasia belina) (FAO, 2013b). Other challenges include lack of legislation and food-safety standards, although the situation is improving; the legitimacy of whole-insect foods has, for instance, been recognized by the EU under the Novel Food Regulation, which facilitates the marketing of insect-based foods (Belluco, Halloran and Ricci, 2017).
Rearing insects for food and feed is being explored as a way to alleviate pressure on wild populations and to bolster food security at a larger scale. In Thailand, for example, small-scale insect rearing is already a well-established practice (FAO, 2013c). More recently, countries such as Kenya and Uganda have successfully established cricket and grasshopper farming models.
The value of farming edible insects goes beyond their nutritional and economic value, as farming edible insects for food and feed puts much less pressure on already limited resources such as land, soils, water and energy than does other forms of livestock production. For instance, it is much more environmentally friendly to produce protein from yellow mealworm (Tenebrio molitor) than from beef (FAO, 2013b). In recent years, farming of insects for food has also become environmentally, socially and economically accepted in some European countries such as Belgium, Finland and the Netherlands, where insects have not been part of traditional diets (e.g. Luke, 2018).
Forest and agricultural production systems often overlap to varying degrees; sometimes they overlap completely, as in agroforestry. Around 40 percent of global agricultural land has more than 10 percent tree cover (Zomer et al., 2009).
Forests have much higher levels of plant and animal biodiversity than agricultural fields. This contributes to their provision of ecosystem services that have positive effects on the productivity and resilience of agricultural production systems located near forests (Duffy, Godwin and Cardinale, 2017; HLPE, 2017). An estimated 75 percent of the world’s accessible fresh water comes from forested watersheds. This water is used for agricultural, domestic, industrial and ecological purposes (MEA, 2005).
Forests also have an essential role in mitigating and adapting to climate change, thus contributing to prevention of climate-related food insecurity. Sustainably managed forest ecosystems can also help minimize the likelihood of agricultural losses from soil erosion, landslides and floods.
Forests also provide farmers with a local supply of agricultural inputs (e.g. fodder, fibre and organic matter), thereby reducing the costs and negative externalities of producing and transporting such inputs from more distant locations.
The means of production of some forest plants have moved on-farm (e.g. coffee, cacao and groundnuts), but forest ecosystems still often provide vital genetic resources for adapting and improving existing crops. Forests are reservoirs of wild relatives (ancestral or related species) of many domesticated livestock and crop species that have since been bred for high yields and other characteristics. Domesticated varieties and breeds can be highly genetically homogeneous and hence vulnerable to biotic and climatic changes. Wild species, in contrast, continuously evolve and diversify under natural, diverse and sometimes extreme conditions; crossbreeding with wild relatives may offer a source of adaptation for domesticated species.
Forests provide habitats for many pollinators, which are essential for sustainable food production (see example in Box 31) (see also Box 18 on Forest-dwelling pollinators in Chapter 3).
The United Republic of Tanzania, like most countries in sub-Saharan Africa, relies heavily on agriculture for livelihoods, income and food security. Most farmers in the country are smallholders who are dependent on naturally available ecosystem services for their subsistence and agricultural productivity. A national assessment revealed that forests have an important role in agriculture as the natural habitats of wild pollinators (Tibesigwa et al., 2019). The results showed a substantial productivity (and revenue) benefit from proximity to the forest for pollinator-dependent crops, which constitute the majority of crops in the country. This benefit was seen to decline exponentially with the distance between the farm plot and the forest and was non-existent more than 2 to 3 km from the forest. Furthermore, a reduction of forest cover was seen to lead to a reduction in crop revenue. The study demonstrated the importance of forest conservation in agricultural landscapes.
Eighty-seven of the world’s 115 leading food crops (some 75 percent), representing 35 percent of global food production by volume, benefit from animal pollination in some measure for fruit, vegetable or seed production (Klein et al., 2007). Many of these pollinators are found in forests.
However, it is also necessary to address the threats that unsustainable agriculture poses to forest biodiversity. Agricultural transformations in the late twentieth century, which relied on large-scale intensification using high levels of inputs, helped to increase crop and livestock yields and improve food security but sometimes had severe environmental impacts such as pollution of water sources with agricultural chemicals. Currently, the agricultural sector is responsible for 73 percent of deforestation worldwide (Hosonuma et al., 2012), leading to serious decline in biodiversity (see Chapter 6). Failure to fully recognize the benefits of forests and forest services to agriculture, including biodiversity, has sometimes led to management choices that have a negative effect on biodiversity and result in even further losses. Biodiversity-friendly land-use practices help to maintain the benefits of forest ecosystem services and improve agricultural productivity. In this respect, indigenous and local knowledge can be an invaluable asset (IPBES, 2019a) (see example in Box 32).
The Hani rice terraces, located in a region of southwestern China affected by increasing and recurring episodes of harsh drought, are an inspiring example of adaptation to harsh topographical conditions and resilience to water scarcity. These terraces have been a concrete testimony to farmers’ wisdom for more than 1 300 years. In 2009, a severe drought decimated agricultural production elsewhere in the region, while the Hani rice terraces maintained regular yields and water abundance for farmers. Forests in the upper hills and mountains, along with the terrace structure and ingenious water-management approaches, have played a central role in enhancing the landscape’s resilience to drought (Min, 2017). Hani rice cultivation, involving no fewer than 123 local varieties, would not be possible without a sufficient water supply from the forest. Indeed, forests play a crucial role in the stability and sustainability of the whole area’s ecosystem.
The resilience of the Hani rice terraces rests on four main pillars:
“Four-in-one” (forest–village–terrace–river) landscape management. Flourishing forests on the hilltops above the villages and the terraces facilitate the formation of dew from rising water vapour and the accumulation of water in reservoirs and creeks. Forests intercept rain and enhance the water storage capacity of the soil. They also help to conserve the soil, reducing erosion and protecting the villages from landslides.
Adapted forest species for water conservation. The forest patches are mainly composed of cardamom (Alnus nepalensis), a tree species that grows well on soils with high water content, and its extensive lateral root system gives some stability to soils that tend to slip and erode.
An efficient irrigation system based on forest environmental services. The water accumulated by the forests at the top of the mountains and the topography of the landscape provide a uniquely efficient form of irrigation for the paddy fields (see Figure A). The deep roots of the forest trees assist the percolation of rainfall into the groundwater. In addition, surface run-off flows down the slope, through the forests, villages and terraces. Forest patches provide not only water, but also fertilizers for the paddy fields, as the flowing water carries nutrients from the forest litter into numerous layers of the horizontal terraced fields.
Hani rice terraces, Yuanyang County, Yunnan, China.
© FAO/Min Qingwen.Forests as part of farmers’ daily life and culture. The Hani people worship nature and respect trees as gods that safeguard and bless them. Their beliefs are strongly linked to the important role that forests play in their lives, providing many goods including timber, fuelwood and medicines and habitats for a rich biodiversity. Each village maintains at least one sacred forest or “magic” wood plot. This cultural connection with nature serves as an incentive to protect and conserve the forest.
Agroforestry, whether organized as trees in agricultural landscapes or farming in forest landscapes, optimizes the links between agriculture and forest and tree biodiversity. The increasing focus on landscape-scale approaches to agroforestry strengthens its role in biodiversity conservation. Agroforestry has five major roles in biodiversity conservation (Udawatta, Rankoth and Jose, 2019):
▸ It provides habitats for species that can tolerate a certain level of disturbance.
▸ It helps to preserve germplasm of sensitive species.
▸ It reduces rates of conversion of natural habitats by providing a more productive, sustainable alternative to traditional agricultural systems that may involve clearing natural habitats.
▸ It provides connectivity between habitat remnants.
▸ It provides ecosystem services such as erosion control and water recharge, thereby preventing the degradation and loss of surrounding habitats.
Forests, trees and their associated biodiversity provide a wide range of products and services that contribute to human health, including medicines, food, clean water and air, shade or simply a green space in which to exercise and relax (Nilsson et al., 2010). The more biodiverse a forest or tree system is, the wider the range of products and services it can provide.
In addition to the contributions of forests and trees to nutrition and food security discussed above – which are in themselves vital for human health – forest biodiversity also encompasses an enormous range of plant, animal and microbial material with known or potential medicinal values. These substances are not only of local importance but are also commercialized on national and international markets or used as models to synthesize new medicines (the majority of active compounds that were originally derived from forest plants are now produced in laboratories). More than 28 000 plant species, many of which are found in forest ecosystems, are currently recorded as being of medicinal use (Willis, 2017).
Forest-derived medicines are prominent in Ayurvedic, traditional Chinese and other indigenous health care systems. Many of the drugs upon which western medicine depends are derived from forest plants and were discovered as part of the traditional health systems of forest peoples (Fabricant and Fransworth, 2001). For example, Jesuit’s bark (quinine), obtained from several Andean forest tree species of the genus Cinchona, was for centuries the most widely used antimalarial in the world. It was originally wild harvested but was later obtained from trees grown in plantations. Eventually quinine was displaced by an extract from sweet wormwood (Artemisia annua), which had been known in the Chinese pharmacopoeia for millennia. Other plant-derived drugs have been discovered through pharmacological screening; an example is paclitaxel, a bioactive compound originally derived from the bark of Pacific yew (Taxus brevifolia) and considered one of the best anticancer agents developed from natural products.
Traditional medicine systems of forest peoples around the world are thus a key source of knowledge. The World Health Organization (WHO, 2019) defines traditional medicine as the “sum total of the knowledge, skill, and practices based on the theories, beliefs, and experiences indigenous to different cultures, whether explicable or not, used in the maintenance of health as well as in the prevention, diagnosis, improvement or treatment of physical and mental illness.” Such systems contribute to the resilience of forest-dependent peoples around the world, often as the most available, accessible, affordable and sometimes culturally acceptable source of health care. WHO (2002) states that up to 80 percent of people in Africa still rely on traditional medicine for their primary health care requirements. It is estimated that at least 1 billion people, not including those in Europe and North America, use herbal remedies to treat children’s diarrhoea (FAO, 2014c). In 2010, the world market for herbal medicines based on traditional knowledge was estimated at USD 60 billion (Nirmal et al., 2013).
Traditional knowledge of forest medicinal plants and their associated benefits is vanishing as a result of rapid industrialization and the major socio-economic and cultural trends affecting contemporary indigenous societies, coupled with the decline of the world’s biological, linguistic and cultural diversity (Reyes-Garcia et al., 2013). Rural populations are losing access to food and medicine as a consequence of deforestation, ecosystem degradation and the loss of this knowledge, increasing food insecurity, malnutrition and diseases.
Clearly, preserving and maintaining traditional knowledge associated with forest biodiversity and protecting the rights of rural people to share the benefits from the use of their knowledge and resources, as recognized in the Nagoya Protocol (CBD, 2011), is extremely important for the health and well-being of local communities as well as for the global community.
There is growing evidence that exposure to natural environments has positive impacts on human physical and mental health across all socio-economic strata and genders, particularly in urban areas (Triguero-Mas et al., 2015) and particularly for socio-economically disadvantaged urban populations (Maas et al., 2006; Mitchell and Popham, 2008). In industrialized countries and urban contexts, green environments can enhance the motivation for physical exercise (Health Council of the Netherlands, 2004) and reduce health problems attributable to a sedentary lifestyle such as excess weight, chronic stress and attention fatigue. Green spaces have also been seen to reduce mental distress and improve well-being (Hartig, Mang and Evans, 1991; Groenewegen et al., 2006; White et al., 2013). It has been hypothesized that exposure to nature may reduce mental fatigue by inspiring unconscious cognitive processes that require little or no effort (Kaplan and Kaplan, 1989). However, some urban residents associate wilder green spaces with vulnerability, which emphasizes the need for careful planning of urban green spaces (Jorgensen, Hitchmough and Dunnet, 2006).
Visits to forest environments also appear to have positive physiological effects, such as reduced blood pressure and pulse rate (Tamosiunas et al., 2014), increased cognitive control (Berman, Jonides and Kaplan, 2008) and even strengthened human immune responses (Li et al., 2008). Several studies have shown that people living closer to natural and biodiverse environments have a more diverse and rich microbiota and less atopic sensitization (predisposition towards developing allergic hypersensitivity) (Ege et al., 2011; Hanski et al., 2012; Rook, 2013; Ruokolainen et al., 2015). The Japanese recognize the healing value of “forest bathing” or shinrin-yoku, the practice of simply being in nature and taking in the forest atmosphere (Park et al., 2010; Hansen, Jones and Tocchini, 2017).
“Forest schooling”, long popular in Scandinavian countries and now being adopted elsewhere, uses woods and forests as a means of developing physical, social, cognitive and life skills and building independence and self-esteem in children and young adults (O’Brien, 2009). Children enrolled in forest schools are less likely to be overweight or obese, to experience symptoms of attention deficit hyperactivity disorder or to contract common infections (Isted, 2013; Blackwell, 2015).
More than 90 percent of the world’s population lives in places where air pollution exceeds WHO guideline limits (WHO, 2016), and WHO (2018b) estimates that 7 million people die every year from exposure to fine particles in polluted air. Forests benefit the entire population simply by improving air quality (Nowak, Crane and Stevens, 2006). Forests and trees help mitigate many of the problems of living in urban areas, for example by reducing the urban heat island effect (Bowler et al., 2010; Shisegar, 2014) – which can be lethal during heat waves – and buffering noise (Irvine et al., 2009; González-Oreja et al., 2010). Given these and other benefits of forests and trees, pioneering health policies have begun to recognize the use of nature to enhance urban population health in such countries as Australia, the United Kingdom of Great Britain and Northern Ireland and the United States of America (Shanahan et al., 2015). Australia, for example, is pioneering “Healthy Parks Healthy People”, an approach that is part of a global movement that aims to unleash the preventative and restorative health and well-being benefits of nature and parks while conserving biodiversity.
Forests also indirectly decrease the occurrence of food- and waterborne diseases by filtering water and providing woodfuel for cooking food and boiling water. This is vital since waterborne diarrhoeal diseases, for example, are responsible for 2 million deaths each year, with the majority occurring in children under five (WHO/UNICEF, 2000). In addition, traditional diets based on diverse plant and animal-based foods gathered from woods and forests show promise for reducing diseases such as type 2 diabetes and obesity as these foods are mainly low in fat and high in protein and complex carbohydrates (Sarkar, Walker-Swaney and Shetty, 2019).
Well-being is a condition not only of individuals but also of the broader community. Many people and communities, and particularly indigenous peoples, have long, multigenerational links with specific forest areas; they derive not only direct benefits from the forest but also intangible benefits resulting from a deep spiritual relationship with forested landscapes and native species, expressed in beliefs, customs, traditions and cultures (Fritz-Vietta, 2016).
Biodiversity conservation initiatives that fail to take cultural values into consideration may have adverse effects on the individual and societal health of forest dwellers. For example, restricting harvest or collection of some traditionally important food products might cause psychological unrest and affect well-being even if nutritional needs are met through other sources; this has been seen, for example, among several ethnic groups in the Congo Basin who suffer from psychological stress when bushmeat is unavailable (Dounias and Ichikawa, 2017).
The abundant biodiversity in forests, particularly in the tropics, encompasses an astonishing range of pathogens, parasites and their vectors. The majority of new infectious diseases of humans are zoonotic, meaning that they originate in animals (Olival et al., 2017). Their emergence may be linked to change in forest area and the expansion of human populations into forest areas, both of which increase human exposure to wildlife (Wilcox and Ellis, 2006) and, in some cases, to the consumption of wild meat. Forest-associated diseases include malaria, Chagas disease (also known as American trypanosomiasis), African trypanosomiasis (sleeping sickness), leishmaniasis and Lyme disease (Table 4). HIV and Ebola, both zoonotic and both focuses of global attention, have clear forest origins. Other lesser-known pathogens associated with trees and forests include Henipah viruses, and new pathogens are being identified all the time, such as the SARS-CoV2 virus that caused the current COVID-19 pandemic. While it is not yet possible to determine exactly how humans were initially infected, COVID-19 is also assumed to be of zoonotic origin (WHO 2020).
Most pathogens found in forests do not represent immediate threats to people. Many potential pathogens have co-evolved with wildlife and do not cause health issues to their hosts, but may become problematic if they spill over to other host species such as humans. Forest alteration may result in modified abundance or dispersal of pathogen hosts and vectors, and altered hydrological functions may favour waterborne pathogens (Wilcox and Ellis, 2006). Thus, extractive industries, deforestation, habitat degradation and increasing encroachment of people into forest lands is increasing risks of novel pathogens affecting people. However, there is some evidence that high-biodiversity areas may buffer people from some infectious diseases through what is known as the dilution effect (Rohr et al., 2019).
Seventeen species of large mammalian carnivore are documented to have killed people. However, only five or six of these seem to do so on a regular basis, and predator attacks on humans are uncommon (Linnell and Alleau, 2016; Hart, 2018). In contrast, venomous animals attack as many as 2.5 million people each year, causing between 20 000 and 100 000 deaths (WHO, 2017). Snakebite is an occupational hazard in any forest activity. Other forest animals can also injure and kill people; in both Asia and Africa, conflicts with elephants result in hundreds of deaths each year (with India alone reporting annual deaths of 400 people and 100 elephants due to conflict incidents) (Shaffer et al., 2019). Considerable efforts have been made worldwide to reduce these events through innovative community-based natural resource management schemes, compensation systems and incentive and insurance progammes (IUCN, 2013) (see also Box 52 in Chapter 6).
Other potentially fatal health risks include accidents related to logging or other kinds of work in forests; falling trees or tree limbs, especially during storms; and wildfires, which are particularly destructive to people and their homes and businesses when they occur in forests in peri-urban areas such as those occurring in Australia in December 2019. Forests also harbour allergens (Cariñanos et al., 2019), fungi and other organisms that are toxic to people if consumed.
These issues suggest a role for responsible forest management in ensuring human well-being (McFarlane et al., 2019).
In view of the inextricable connection of human, animal and environmental health, the “One Health” approach aims to improve health and well-being through risk prevention and mitigation at the interface between humans, animals and their various environments. In Africa, for example, FAO, WHO and World Organisation for Animal Health (OIE) are jointly implementing One Health programming that brings together professionals and policymakers in forestry, natural resources, agriculture, livestock and public health to ensure balance among all the relevant sectors and disciplines.
The aim of achieving optimal health outcomes for human communities should be taken into account in forest management and planning, not only for rural areas but also for peri-urban and urban areas and for both developed (e.g. Box 33) and developing countries. Land-use planning for urban or agricultural expansion should also take into account the importance of buffers that would mitigate potential impacts associated with higher contact rates between wildlife, livestock and people.
▸ Enhance cooperation between forest owners, forest managers and landscape planners and professionals from other sectors, specifically public healthcare, education, sport, recreation and tourism.
▸ Encourage public participation and inclusivity through engagement with local communities.
▸ Consider human well-being as a central component of the ecosystem services concept when assessing mechanisms and funding for provision of forest ecosystem services.
▸ Monitor forest visitors, their demands for outdoor recreation and associated health benefits.
▸ Invest in research, e.g. on the dose–response relationship, long-term health effects related to rehabilitation and recovery from illnesses and economic valuation of the health benefits of forests.
▸ Invest in education and training that embraces the multiple functions of forests and prepares workers for new green jobs that integrate social and health aspects into sustainable forest management.
▸ Enhance the accessibility of forests to facilitate regular visits by urban residents.
▸ Enhance communication to improve public understanding of decisions related to forests and to minimize conflicts in the use and management of forested areas.
SOURCE: Summarized from Forest Europe, 2019. See Box 54 for a description of Forest Europe.
By far the greatest threat to forest biodiversity is loss of habitats and species due to deforestation and forest degradation.
This chapter looks at means of preventing, halting and reversing the forest losses described in Chapters 2 and 3. Understanding factors that lead to deforestation or forest degradation can assist understanding of how to prevent further forest and biodiversity loss. In the cases where the damage has already been done, forest landscape restoration can begin to reverse the losses.
Human population growth, demographic trends and economic development have long been acknowledged as the primary drivers of environmental change. In the past 50 years, the human population has doubled and the global economy has grown nearly fourfold. Economic development has lifted billions of people out of poverty in many countries. However, nature across most of the globe has been significantly altered in the process, with mostly negative consequences for biodiversity and often also for the most vulnerable of society, including indigenous peoples. The critical pressures are well known: habitat change, loss and degradation; unsustainable agricultural practices; invasive species; low resource-use efficiency and overexploitation, including illegal logging and trade in wildlife. Climate change and fluctuation increasingly exacerbates the impact of these pressures.
Global market pressures, dietary preferences, and loss and waste along agricultural value chains drive demand for agricultural and forest products, which, in turn, drive deforestation and forest degradation (IPCC, 2019). The need to provide food and energy for a growing global population is, generally speaking, the leading cause of loss of forests and forest biodiversity. In Africa, population pressure and poverty are the main threats to forest conservation, driving poor farmers to convert forests to cropland (Uusivuori, Lehto and Palo, 2002; Lung and Schaab, 2010) and to harvest woodfuel at unsustainable levels. Elsewhere, deforestation is driven by changes in consumption patterns of more affluent populations. However, deforestation and forest degradation are really driven by many political and socio-economic forces interacting at the global to local levels (Lambin et al., 2001; Carr, Suter and Barbier, 2005).
An analysis of national data for 46 tropical and subtropical countries representing about 78 percent of the forest area in those climatic domains (Hosonuma et al., 2012) revealed that large-scale commercial agriculture (primarily cattle ranching and cultivation of soya bean and oil palm) is the most prevalent driver of deforestation, accounting for 40 percent of it. Local subsistence agriculture accounts for an estimated 33 percent of deforestation, urban expansion for 10 percent, infrastructure for 10 percent and mining for 7 percent. In some cases, land-use change was preceded by forest degradation, for example caused by unsustainable or illegal wood removal. This analysis also revealed that the drivers differed significantly between regions (Figure 29) and even within countries.
People’s use of a resource is largely determined by perceived benefits, weighed against costs incurred through access or institutional barriers (Schweik, 2000), but is also influenced by local and historical factors at different scales such as recognition of traditional forest tenure and customary management and use practices, local implementation of agreements for protected-area use, local road access, commodity prices and cultural preferences. Understanding the local contexts in which the drivers at different scales interact – including global and national political and economic processes, institutional frameworks governing access to resources, the values of stakeholders and the ecological characteristics of the resources (Figure 30) – can help to inform management decisions (Ostrom and Nagendra, 2006).
As the example in Box 34 illustrates, simple models of forest change drivers do not reflect complex local social and ecological realities. They lead to simplified institutional prescriptions, and interventions based on these prescriptions therefore often do not meet their objectives (see also Nel and Hill, 2013 and Molinario et al., 2020). It is vital to take into account the dynamics of the underlying contexts and drivers of forest change and to recognize their importance in influencing local people’s decisions. Incentives that influence people’s motivation to support sustainable management of forests vary locally and can therefore not be designed globally.
Mount Elgon, Uganda, embodies the challenges of biodiversity conservation in densely populated areas. Its forests provide local communities with timber, fuelwood, non-wood resources and forest services, notably hydrological as the mountain is a major source of water for the region. The forests have also been a source of agricultural land. Mount Elgon has a history of protection under various more or less exclusionary management regimes. High population densities (up to 1 000 people per square kilometre) exercise growing pressure on forest resources. Conflicts over resource access and use are common (Norgrove and Hulme, 2006; MERECP, 2007).
Over the period 1973 to 2009, more than 25 percent of the area’s forest cover was lost but in some places forest also recovered (Sassen et al., 2013). Sassen (2014) used a combination of remote sensing and field-based research to investigate how factors that varied across the park and during the time period – including land-use goals, wealth levels, market access and the relationship with park management – led to these different outcomes for the forest.
The study found no simple direct relationship among population density, poverty and agricultural expansion and deforestation on Mount Elgon over the 36-year period. Population only drove deforestation under a few circumstances, i.e. when protected-area management institutions broke down in the 1970s and 1980s and in those places where people became wealthy from growing coffee. When protected-area boundaries were re-established, forest recovery took place near some of the most-densely populated areas; these included those areas where inhabitants were able to invest in agricultural intensification, had difficulties of market access but an easily transportable cash crop (coffee), and had little conflict with park management (see the trend in forest cover in the vicinity of “other coffee-based villages” after 1988 in Figure A). In general (although this too depended on the context), wealth, measured as assets, was more likely to drive deforestation than poverty. Resettlement of pastoral people outside the forest in the 1990s and encouragement of them to take up agricultural livelihoods (maize) led to conflicts and massive forest encroachment despite low population densities (see the trend in forest cover in the vicinity of “maize-based villages” in Figure A). High prices for cash crops were associated with deforestation mainly in places with good access to markets for bulky seasonal crops (e.g. maize, cabbages, potatoes) and high levels of conflict over park boundaries (i.e. for the ”southern coffee-based villages” after 2001 in Figure A).
Forest degradation also varied according to the needs associated with local land-use practices (e.g. the need for staking material for bananas and beans or for grazing land for cattle) and market access (e.g. the opportunity to sell charcoal). The study also found that allowing the collection of forest resources, such as fuelwood, under community management agreements can be double-edged. On the one hand, it creates opportunities for destructive activities; on the other hand, it can help to improve relations between local people and park staff and thus facilitate improved management arrangements and better forest outcomes.
These findings demonstrate that simple models based on single drivers of deforestation (e.g. population or poverty) cannot explain local variation in conservation outcomes. Rather, it is the local context (e.g. law enforcement, collaborative management, political interference) under which drivers such as population, wealth, market access and commodity prices operate that influence forest cover and degradation or regeneration outcomes over time, rather than the drivers per se. This concept has important implications for the design of more locally adapted and ecologically and socially sustainable management arrangements.
A good understanding of human activities leading to forest disturbances is instrumental for the development of policies and actions in the context of REDD+ and the identification of drivers of deforestation and forest degradation is usually an initial step in developing REDD+ strategies and action plans. The example from Zambia in Figure 31 illustrates the multiplicity of interactions among drivers.
Actions to combat deforestation have gathered pace over the past decade, primarily because of awareness that the loss of forests and the use of fire to clear land is having negative impacts on the global carbon cycle. REDD+ (reduction of emissions from deforestation and forest degradation and the role of conservation, sustainable management of forests and enhancement of forest carbon stocks in developing countries) is now included as a recommended action in the Paris Agreement. A recent analysis of 31 national REDD+ strategies and action plans (FAO, forthcoming) highlights priority actions to reduce deforestation and forest degradation (Figure 32). So far, nine countries have reported reduced deforestation to UNFCCC representing close to 9 billion tonnes of carbon dioxide in emission reductions (Box 35). Countries are now accessing REDD+ results-based payments – rewards for emission reductions – from the Green Climate Fund and other similar mechanisms. A number of international initiatives have provided support to these efforts, including the United Nations Programme on Reducing Emissions from Deforestation and Forest Degradation (UN-REDD) Programme jointly operated by FAO, the United Nations Development Programme (UNDP) and UNEP (Box 36), the Forest Carbon Partnership Facility and the Forest Investment Program of the World Bank.
REDD+ enables developing countries to access funding for verified results in terms of reduced emissions from deforestation and forest degradation, and for the sustainable management of forests, as well as for the conservation and enhancement of carbon stocks. The UNFCCC framework for REDD+ includes identification of drivers of deforestation, development of REDD+ strategies and action plans. It also includes a set of environmental and social safeguards to e.g. ensure that actions taken are consistent with the conservation of natural forests and biodiversity and that they respect the knowledge and rights of indigenous peoples and local communities.
To date, 50 countries have submitted a baseline of emissions against which to monitor their progress in reducing emissions from deforestation and forest degradation. These countries represent more than 30 percent of the global forest area and more than 70 percent of the global loss of forests. More than 30 countries have developed national REDD+ strategies, and 54 countries have included REDD+ in their NDCs. As of January 2020, nine countries have reported 8.82 billion tonnes of emissions reductions due to reduced rates of deforestation and forest degradation.
The UN-REDD Programme is a collaborative programme of FAO, UNDP and UNEP supporting nationally led REDD+ processes. It promotes the informed and meaningful involvement of all stakeholders, including indigenous peoples and other forest-dependent communities, in national and international REDD+ implementation. Since its creation in 2008, the Programme has supported national REDD+ readiness efforts in 65 partner countries in Africa, Asia and the Pacific and Latin America. The Programme has evolved to become the United Nations knowledge and advisory platform on forests and climate, with a focus on advancing Articles 5 and 6 of the Paris Agreement (relating to conservation of forests as carbon sinks, REDD+ and other approaches for the sustainable management of forests [Article 5] and carbon markets [Article 6]), supporting implementation of policies and strategies, enabling access to climate finance and forging partnerships to halt deforestation and protect and restore forests and thus address climate, biodiversity and livelihood goals simultaneously.
The New York Declaration on Forests, a voluntary and non-binding international declaration to take action to halt global deforestation launched in 2014, now has over 200 endorsers, including national and subnational governments, multinational companies, groups representing indigenous communities and NGOs. Importantly, it specifically includes commitments from and support to the private sector to eliminate deforestation from the supply chains of major agricultural commodities by 2020 (see example in Box 37 and Figure 43).
About 70 percent of global cocoa supply originates from West African smallholder farmers, and cocoa is a major cash earner in the areas that produce it (Gayi and Tsowou, 2016). However, cocoa has historically been an important driver and direct cause of deforestation (Ruf and Zadi, 1998). Expansion into forests is often driven by low cocoa yields from established plantations, since soils freshly cleared of natural vegetation are often more fertile.
Governments and the private sector have made a suite of commitments to end deforestation in cocoa supply chains so as to safeguard biodiversity and ecosystem services while avoiding revenue loss and impacts on local livelihoods (Carodenuto, 2019). Recent public–private initiatives such as the Cocoa Forest Initiatives in Ghana and Côte d’Ivoire (World Cocoa Foundation, 2017) and the Green Cocoa Landscape Programme in Cameroon (IDH, 2019) aim to support the sustainable intensification and climate resilience of cocoa production, the prevention of further deforestation and the restoration of degraded forests. They often align with national REDD+ policies and plans.
To support policy and planning for cocoa development and sustainable intensification, a study by the CocoaSoils research and outreach programme (Sassen, Arnel and van Soesbergen, forthcoming) identified forest areas that are both important for biodiversity (based on a metric using IUCN Red List species range data, refined to include only areas of suitable habitat) and currently suitable for cocoa (based on a model developed by Schroth et al. [2016]), and therefore potentially at risk of deforestation (dark brown areas in Figure A).
The study also analysed how biodiversity responds to changes in land use associated with different cocoa systems, using data from studies in Africa, Asia, the Americas and Oceania taken from the Projecting Responses of Ecological Diversity in Changing Terrestrial Systems (PREDICTS) database (Hudson et al., 2017). The results showed that in terms of species richness and community composition, the impacts of establishing cocoa were less severe than those associated with cropland and that naturally shaded agroforestry systems have significantly higher species richness than cocoa monocultures (Figure B). Over time, cocoa agroforestry systems become more similar to forest, although they never fully recover the original forest community within the life cycle of a productive cocoa plantation (approximately 25 years). Thus, although cocoa agroforests cannot replace natural forests, they are a valuable tool for conserving and protecting biodiversity while maintaining high levels of productivity in agricultural landscapes (see also Schroth et al., 2004).
The combined results highlight different risks and opportunities for different areas within the West African cocoa zone. Where land that is highly suitable for cocoa overlaps with remaining forests and high-biodiversity values (e.g. Liberia and Cameroon), there is a need to protect existing conservation areas and to limit further cocoa development in unprotected forests through careful planning. Here, supporting smallholder farmers to develop sustainable, deforestation-free cocoa production in diversified production systems is of crucial importance.
Where much of the original forest has already been converted to agriculture, as in Côte d’Ivoire and Ghana, cocoa agroforestry systems might play a role in efforts to increase tree cover in agricultural landscapes and restore degraded lands (e.g. under REDD+). These systems can help to maintain at least some biodiversity and support local and global ecosystem services as well as livelihood diversification.
Financial mechanisms to incentivize sustainable cocoa production (e.g. credits, payments for environmental services or carbon finance) are also needed, as smallholder farmers are unlikely to be able to bear the costs associated with changing their practices.
SOURCE: Data from PREDICTS database (Hudson et al., 2017).
Where the main driver of deforestation is subsistence agriculture or fuelwood harvesting, the development of forest-based livelihoods through a diversified portfolio of sustainably produced forest products and services; development of small and medium-sized enterprises; and the use of payments for carbon sequestration or other environmental services can help increase the value of forests to local communities and hence keep them intact.
In February 2018 the CPF convened a global conference to engage key stakeholder groups in a discussion on how to halt deforestation (Box 38), and in July 2019 the European Commission launched a communication on stepping up EU action to protect and restore the world’s forests (EC, 2019a). This sets out five priorities:
▸ Reduce the EU consumption footprint on land and encourage the consumption of products from deforestation-free supply chains in the EU.
▸ Work in partnership with producing countries to reduce pressures on forests and to “deforest–proof” EU development cooperation.
▸ Strengthen international cooperation to halt deforestation and forest degradation and encourage forest restoration.
▸ Redirect finance to support more-sustainable land-use practices.
▸ Support the availability of, quality of, and access to information on forests and commodity supply chains, and support research and innovation.
In February 2018, the Collaborative Partnership on Forests (a voluntary arrangement between 15 international organizations and secretariats with significant forest-related programmes, established almost 20 years ago and chaired by FAO) convened the global conference, “Working Across Sectors to Halt Deforestation and Increase Forest Area: From Aspiration to Action”. Approximately 300 participants from governments, international organizations, the scientific community, the private sector, civil society and farmer organizations attended. The conference listed the following actions that need to be taken to halt and reverse deforestation:
▸ As forest regulators and often large-scale forest owners, governments at all levels must take the lead in putting in place the enabling conditions needed to ensure all forests are sustainably managed and to attract long-term financing and investment to this end. This includes establishing participatory, inclusive and transparent processes for involving community and corporate stakeholders in land-use planning and decision-making.
▸ Agribusiness should meet its commitments to zero-deforestation from the production and processing of agricultural commodities by 2020. Companies that have not made zero-deforestation commitments should do so. Commodity investors should adopt business models that are environmentally and socially responsible and involve and benefit local/community producers, distributors and other value chain actors through, for example, extension programmes and the joint design of sustainable land-use plans on corporate land.
▸ The forest products industry should ensure legal and sustainable value chains for forest-based commodities, including through forest management and chain-of-custody certification, and work with local communities in the process.
▸ Civil society organizations serve as watchdogs and agents of change by holding governments and business to account. Non-governmental groups should increase their voice and influence through multistakeholder initiatives and platforms that promote understanding and recognition of the roles, contributions and interests of actors, both men and women, along value chains and across enterprises.
▸ Public and private actors should fully tap into the potential of civil society, particularly women and youth. Youth can facilitate collective action, engagement, innovation, capacity-building, networking and partnerships, as well as providing a long-term perspective.
SOURCE: FAO and CPF, 2018.
While some progress has been made (see also Chapter 2), much more remains to be done.
Poaching, illegal exploitation and illicit trade in timber and other forest resources are global phenomena that have serious implications for biodiversity conservation (see Chapter 3 for its effects on species biodiversity), ecosystem services and national economies. They also have direct and indirect negative impacts on urban and rural communities that result from depleting the resource base on which these communities depend for their livelihoods and well-being.
Illegal forest activities include harvesting, transport, processing, purchase or sale of forest products in violation of national or subnational laws. The drivers behind the illicit exploitation and trade in forest resources are complex, varying greatly over time and by the location and type of commodity and illegal activity involved. Direct causes of illegal activities include weak forest governance in producer countries and a resulting lack of adequate law enforcement; unclear legal frameworks; and limited capacity for developing and implementing land-use plans. However, consumer countries contribute to these problems by importing forest products – including timber, wild plants and animals and derived products – without ensuring that they are legally sourced. In sub-Saharan Africa, for example, the main drivers of illegal wildlife trade include increasing demand in consumer countries (e.g. Southeast Asia), poverty and lack of alternative livelihoods in source countries, and cultural and colonial legacies (Price, 2017).
In addition to the environmental impacts of loss of and damage to species and ecosystems, illegal forest exploitation also has economic and social impacts. The African Development Bank (ADB) values the detrimental economic impact to Africa of illicit trade in natural resources at approximately USD 120 billion a year – an amount equivalent to 5 percent of the continent’s gross domestic product (GDP). Of this total amount, approximately 10 percent falls within the forest sector (ADB, 2016). Illegal trade entails significant loss of revenue from taxes, which has effects at both the national and local levels. Revenue loss undermines efforts to make the forest sector contribute sustainably to national production and society as lost revenue cannot be reinvested in the sector. Illegal activities also distort global markets and undermine incentives for sustainable forest management as illegal products are often cheaper than legal ones. In terms of the social impacts, illegal harvesting and trade are often associated with corruption and with lack of recognition of land and use rights of forest communities or indigenous peoples, which can have negative impacts on local livelihoods and result in conflict.
Illegal logging. Harvesting, transport, purchase or sale of timber in violation of national laws (commonly referred to collectively as “illegal logging”) is a persistent global issue, affecting many forested countries in both temperate and tropical zones despite the numerous efforts to address it. Quantifying illegal logging is challenging and potentially controversial, but the International Criminal Police Organization (INTERPOL) puts the value of forestry crimes including corporate crimes and illegal logging somewhere between USD 51 billion and USD 152 billion per year (Nellemann et al., 2016). Hoare (2015) estimates that in 2013 around 50 percent of illegal timber in global trade came from Indonesia and 25 percent from Brazil – two of the ten countries with the largest forest area. Both countries have made significant efforts to address the problem since then; see e.g. FAO, 2020 and Addressing illegality). Illegal logging in other tropical timber-producing countries may result in smaller total volumes but may account for a greater proportion of the country’s total timber production. The demand for timber is so great that illegal logging will remain a major concern for the future of forest resources unless consistent efforts are made globally to control it (Hoare, 2015).
Illegal logging may occur as a direct result of demand for the timber resource, including specific targeting of the most valuable timber species, or it may be the by-product of land clearance for plantations of commodities such as oil palm and soya bean. As noted above, the most significant driver of deforestation (both legal and illegal) is demand for land for agricultural production; this pressure is also the most likely to contribute to large-scale illegal logging.
In most developing countries, the forest sector is dominated by informal operators, primarily small or medium-sized enterprises producing mainly for domestic markets. In addition to this informality, the sector is characterized by low capacity, limited resources and continuous change in the availability of resources, which all make it vulnerable to illegal activities.
As it obviously occurs in the absence of forest management planning, illegal logging leads to the loss or degradation of forests, and the resulting habitat and biodiversity losses threaten the survival of some species, particularly primates and some large mammals. Illegal logging activities often target and jeopardize valuable timber species, which are consistently in demand and promise immediate revenues. Rosewood (Dalbergia spp.) is case in point. It is estimated that exports of rosewood to China increased 14-fold between 2009 and 2014, despite rosewood being listed in CITES Appendix II (Bolognesi et al., 2015; Ong and Carver, 2019). In Madagascar, illegal harvesting and trafficking of rosewood have resulted in serious forest degradation and biodiversity loss (Ong and Carver, 2019).
Illegal charcoal production is even more challenging to document than harvest and trade of high-value timber species, as the sector is very fragmented and informal; however, it too contributes to forest loss and degradation. For example, Bolognesi et al. (2015) estimate that illegal trade in charcoal in Somalia between 2011 and 2013 accounted for 24 000 tonnes of production and resulted in a 2.7 percent loss of tree cover.
Illegal wildlife exploitation. INTERPOL estimates that the annual value of illegal wildlife trade is between USD 7 billion and USD 23 billion (Nellemann et al., 2016). All regions of the world play some role as a source, point of transit or destination for contraband wildlife, although certain types of illegal wildlife trade are strongly associated with specific regions; for example, birds are associated with Central and South America, mammals with Africa and Asia, and reptiles with Europe and North America (UNODC, 2016).
The African elephant is arguably the best-known case of overexploitation of keystone species (those that have a disproportionately large impact on a particular ecosystem relative to their abundance), with the loss of approximately 90 percent of the total population within the last century (TRAFFIC, 2019). Forest elephants are of particular importance for forests and other natural ecosystems as they disperse large seeds, keep the forest canopy open and spread rare nutrients across the forest, benefiting numerous species throughout the African tropics (Maisels et al., 2013).
Addressing illegality. Over the past ten years, efforts to address illegal logging have been spearheaded by trade regulations in consumer countries that require that importers demonstrate that the timber has been harvested legally. Significant demand-side legislation includes the Lacey Act Amendment in the United States of America (2008), the EU Timber Regulation (2013), the Clean Wood Act, Japan (2016) and the amendment of the Act on the Sustainable Use of Timbers, Republic of Korea (2017). Many tropical timber-producing countries are making corresponding efforts to strengthen legality compliance and timber legality verification. Indonesia, notably, has implemented a national timber legality assurance system (Sistem Verificasi Legalitas Kayu, SVLK) and in 2016 issued its first Forest Law Enforcement, Governance and Trade (FLEGT) timber export licences in compliance with the import requirement of the European Union Timber Regulation (EU FLEGT Facility, n.d.). With strengthened law enforcement, official figures from Indonesia show an increased number of operations sanctioned, from 25 in 2015 to 88 in 2017 (MEF, 2018). Fourteen other tropical timber-producing countries are developing national systems to assure legality under the FLEGT mechanism (EU FLEGT Facility, n.d.). As part of this mechanism, countries are required to implement measures to prevent illegal hunting (see Box 39).
Rainforests cover over 40 percent of the area of Cameroon and constitute a significant part of the Congo Basin forest ecosystem (FAO, 2020). This highly biodiverse ecosystem is threatened by deforestation and forest degradation, driven by agriculture and timber extraction (MINEPDED, 2013). It has been estimated that 815 species of flowering plants in the country are threatened (Onana, Cheek and Pollard, 2011), while 26 species of mammals are currently classified as endangered or critically endangered (IUCN, 2019a).
As part of its efforts to address high rates of illegal timber extraction and illegal poaching and trade of wildlife, in 2010 Cameroon signed a Voluntary Partnership Agreement with the EU on forest law enforcement, governance and trade in timber and derived products to the EU (EU, 2011). An essential element of this agreement is a legality verification system, based on a set of criteria and indicators that are used to verify the legal origin of timber. Criterion 5 of this system mandates that all areas where timber extraction is permitted (e.g. forest concessions, community forests, council forests) must comply with national regulations related to biodiversity protection (MINEF, 1998; MINEF, 2001) and implement measures to prevent illegal hunting of wildlife.
To facilitate the implementation of Criterion 5, the Wildlife Conservation Society (WCS) Cameroon, with the financial support of the FAO–EU FLEGT Programme, developed a comprehensive set of tools to help the forest administration and forest operators to comply with the regulatory requirements on monitoring and evaluation of wildlife management. These include the SEGeF (Suivi de la gestion de la faune dans les forêts de production) monitoring and evaluation matrix, which was integrated into a web and mobile application (SEGeF, 2018). In 2019, the government signed legislation that makes the use of this matrix compulsory in production forests in Cameroon (MINFOF, 2019). WCS worked closely with forest operators and forest communities to develop and implement the tool and has provided training in its use.
In July 2015, the United Nations General Assembly adopted its first-ever Resolution on Tackling Illicit Trafficking in Wildlife (69/314) (United Nations General Assembly, 2015b), which also addresses timber trafficking. Its fourth edition was adopted in September 2019 (UN, 2019b) and calls for enhanced national legislation, support to sustainable livelihoods, improved policy enforcement and anti-corruption measures, assistance in the deployment of information technologies and promotion of well-targeted demand reduction efforts.
The Collaborative Partnership on Sustainable Wildlife Management (CPW) (FAO, 2019f) provides a platform for addressing wildlife management issues that require national and supranational responses, including issues related to illegal wildlife trade. Established in 2013, CPW is a voluntary partnership of 14 international organizations with substantive programmes to promote the sustainable use and conservation of wildlife resources.
The Sustainable Development Goals Report 2019 (UN, 2019a) indicates that 20 percent of the Earth’s surface was in a degraded state between 2000 and 2015 (Figure 33). On 1 March 2019, the United Nations General Assembly declared the decade from 2021 to 2030 the United Nations Decade on Ecosystem Restoration, with the goals of preventing, halting and reversing ecosystem degradation, raising awareness of importance of ecosystem restoration and accelerating progress towards reaching existing global (Box 40) and regional ecosystem restoration goals.
▸ Sustainable Development Goal 15.3: By 2030, combat desertification, restore degraded land and soil, including land affected by desertification, drought and floods, and strive to achieve a land degradation-neutral world.
— SDG 15.3.1 Proportion of land that is degraded over total land area.
▸ Aichi Biodiversity Target 15: By 2020, ecosystem resilience and the contribution of biodiversity to carbon stocks has been enhanced, through conservation and restoration, including restoration of at least 15 percent of degraded ecosystems, thereby contributing to climate change mitigation and adaptation and to combating desertification.
▸ The Bonn Challenge/New York Declaration on Forests Goal 5: Restore 150 million hectares of degraded landscapes and forest lands by 2020 and significantly increase the rate of global restoration thereafter, which would restore at least an additional 200 million hectares by 2030.
▸ United Nations Strategic Plan for Forests Goal 1: Reverse the loss of forest cover worldwide through sustainable forest management, including protection, restoration, afforestation and reforestation, and increase efforts to prevent forest degradation and contribute to the global effort of addressing climate change.
— Target 1.3 By 2020, promote the implementation of sustainable management of all types of forests, halt deforestation, restore degraded forests and substantially increase afforestation and reforestation globally.
Restoration is a key part of the CBD’s Strategic Plan for Biodiversity and the Aichi Targets (CBD, 2010a) and forest landscape restoration has been recognized as a means by which to achieve Aichi Targets 5, 7, 11, 13 and 15 (Dave et al., 2019).
The United Nations Convention to Combat Desertification’s Land Degradation Neutrality Target Setting Programme has so far received land degradation neutrality commitments from 122 countries (UNCCD, 2019a). Regional land restoration goals include the Latin American Initiative 20x20 (Initiative20x20, n.d.), which aims to restore 20 million hectares of degraded land by 2020; the AFR100 (the African Forest Landscape Restoration Initiative), which aims to bring 100 million hectares of degraded land under restoration by 2030 (AFR100, n.d.); the Agadir Commitment for the Mediterranean, which aims to restore at least 8 million hectares of degraded forest ecosystems by 2030 (FAO, 2017d); ECCA30, an initiative of countries in Europe, Caucasus and Central Asia that aims to restore 30 million hectares of degraded land by 2030; and the Great Green Wall for the Sahara and the Sahel initiative, which aims to restore 100 million hectares by 2030 (Great Green Wall, 2019a).
Forest restoration can have a variety of objectives relating to reversing land degradation or loss of productivity of ecosystem goods and services such as food, biodiversity and water. These include:
▸ rehabilitation: restoration of desired species, structure or process to an existing ecosystem;
▸ reconstruction: restoration of native plants on land used for other purposes;
▸ reclamation: restoration of severely degraded land devoid of vegetation; and
▸ replacement: the most radical form of restoration, in which species or provenances maladapted for a given location and unable to migrate are replaced with new vegetation as climates change rapidly (Stanturf, Palik and Dumroese, 2014).
Forest restoration, when implemented appropriately, helps restore habitats and ecosystems, create jobs and income and is an effective nature-based solution to climate change (CBD, 2016a; FAO and Global Mechanism of UNCCD, 2015; IPBES, 2019a). See Case Study 1.
Action Against Desertification (AAD), implemented by FAO and partners and funded by the European Commission and the Secretariat of the African, Caribbean and Pacific Group of States, provides on-the-ground support to the Great Green Wall for the Sahara and Sahel initiative. Its objective is to strengthen the resilience of dryland communities and agrosilvipastoral ecosystems critically affected by climate variability and change through large-scale restoration of degraded lands, thus reducing poverty and achieving food, feed and nutrition security and enhanced resilience. The programme contributes to the achievement of the 2030 Agenda on Sustainable Development by delivering multiple environmental and socio-economic benefits.
AAD’s blueprint for large-scale restoration of drylands emphasizes plant-based solutions and includes:
▸ investment in large-scale land preparation through mechanized ploughing and enrichment planting;
▸ obstruction of sand encroachment through biophysical and biological interventions for land stabilization;
▸ promotion of natural regeneration wherever the soil seed bank and remnant plants allow it;
▸ mobilization of high-quality seeds and planting materials from the rich dryland plant biodiversity;
▸ development of NWFP value chains for income generation in rural areas, benefiting women, men and youth;
▸ inexpensive, participatory systems for information dissemination; and
▸ innovative biophysical and socio-economic monitoring systems for assessment of progress.
In five years, AAD has brought 53 000 hectares of degraded agrosilvipastoral lands under restoration, planting 25 million trees using native tree species commonly used by rural communities. A total of 100 tonnes of seeds of 110 woody and herbaceous fodder species have been collected and planted in nine countries, bringing huge positive economic and environmental returns. For instance, plots of planted herbaceous fodder in Burkina Faso and the Niger yielded an average of 1 200 kg of biomass per hectare just one year after planting, generating revenues of USD 40 per hectare, equivalent to half the country’s monthly minimum wage; thus, the 10 000 or more hectares under restoration in Burkina Faso could potentially yield USD 400 000 per year for local farmers. In Senegal, villagers that harvested fodder in the dry season (November to May) from about 4 000 hectares of degraded lands planted for restoration earned USD 2 per donkey cart or USD 4 per carload (about 100 kg of fodder). At an estimated biomass production of 1 tonne per hectare, this operation generated on average USD 80 000 per annual harvest for the communities from 2017 to 2019. Furthermore, it is estimated that restoring the land with native trees will sequester 7.15 tonnes of CO2-equivalent per hectare per year in the Sahel, based on an extrapolation of the results three years after planting to 20 years.
AAD’s approach to land restoration for resiliency places communities and plant knowledge at the heart of the interventions. Factors contributing to the success of ADD’s operations include:
▸ social mobilization and the support of local communities for the interventions in their communal lands;
▸ use of plant knowledge and expertise to prioritize well-adapted plant species useful to the communities, ensuring their buy-in; and
▸ a combination of well-tested methodologies and traditional knowledge to overcome technical and research challenges, such as identifying and planting the right species in the right place and at the right time to obtain maximum benefit from rainwater and maximize the chance of plant survival and growth under harsh conditions.
This approach is highly adaptable to varying ecological and socio-economic conditions and therefore very suitable for replication and scaling up in Africa and beyond, sustained investments permitting. AAD has recently begun expanding its interventions to southern Africa, where the countries of the Southern African Development Community (SADC) have launched a Great Green Wall under SADC coordination and with support from the African Union Commission.
SOURCE: FAO, 2019h.
The Global Partnership on Forest and Landscape Restoration (GPFLR, n.d.) has developed six globally agreed principles of forest and landscape restoration:
▸ Focus on the landscape scale.
▸ Engage stakeholders and support participatory governance.
▸ Restore multiple forest functions for multiple benefits.
▸ Maintain and enhance natural ecosystems within landscapes.
▸ Tailor restoration approaches to the local context.
▸ Manage adaptively for long-term resilience.
Numerous guidelines for forest restoration exist including a practioner’s guide to the restoration of forest landscapes (Stanturf, Mansourian and Kleine, 2017), specific guidelines for degraded dryland forests (FAO, 2015b), mangroves (Field, 1996), on the role of natural regeneration in forest and landscape restoration (Chazdon et al., 2017) and on integrating biodiversity considerations into ecosystem restoration (CBD, 2016a). The ITTO Guidelines for the restoration, management and rehabilitation of degraded and secondary tropical forests (ITTO, 2002) are in the process of being updated. See also Box 41.
Natural regeneration of forests is a biological process that can be assisted and managed to increase forest cover and achieve the recovery of the native ecosystem or some of its functions. Assisted natural regeneration (ANR) refers to any set of interventions that aim to enhance and accelerate the natural regeneration of native forests e.g. by protecting against disturbances (from fire, stray domestic animals and humans) and by reducing competition from grasses, bushes and vines that hinders the growth of naturally regenerated trees.
ANR is a simple, inexpensive and effective technique for restoring forests by removing or reducing barriers to natural succession. In addition to enhancing resilience and supplying multiple forest products and ecosystem services, ANR can be highly effective for recovering biodiversity, species interactions and movement within landscapes. During ANR, local biodiversity is enriched by:
▸ Natural establishment of trees and shrubs from seeds, root sprouts, stumps or coppices;
▸ Regeneration of local genetic resources adapted to local soil and climate conditions; and
▸ Associated pollinators, herbivores and seed-dispersal agents of colonizing trees.
Many of these benefits can also be achieved using direct seeding and tree-planting approaches, but at significantly higher costs. In tropical regions, spontaneous and assisted natural regeneration is more effective than tree planting at achieving the recovery of biodiversity and forest structure and generally results in more diverse, multi-layered vegetative cover than from typical reforestation involving the planting of a limited number of species.
SOURCE: FAO, 2019g.
Restoring forest ecosystems goes beyond the planting or assisted natural regeneration of trees. See e.g. Case Study 1 and the example of rewilding in Box 42.
Rewilding aims at restoring natural ecological succession, leading to self-sustaining ecosystems and ecosystem processes, and emphasizes process-based conservation approaches (CBD, 2014).
In some cases this is implemented in a passive manner – leaving nature to evolve. In others, it includes the reintroduction of apex predators and keystone species. One well-known example is the reintroduction of wolves to Yellowstone Park in the United States of America.
Wolves (Canis lupus) once roamed North America from the Arctic to Mexico, but by 1926, the last wolf pack had been killed in Yellowstone, America’s oldest national park, as part of the policy of the time to eliminate all predators.
Within a few years, the population of elks (Cervus elaphus) – one of the largest species within the deer family – had increased substantially, overgrazing willows (Salix spp.) and aspens (Populus tremuloides). Without those trees, songbirds began to decline, beavers (Castor canadensis) could no longer build their dams and riverbanks started to erode. The loss of beaver and streamside woody vegetation caused severe degradation of stream hydrology and riparian ecosystem function. Stream channels became wider, shallower and warmer. Collectively, these stream alterations severely degraded fish habitat.
In 1995, in collaboration with Canadian agencies, 14 wolves were captured in Jasper national park and brought to Yellowstone, supplemented by another 17 wolves in 1996. The elk and deer populations started responding immediately. Within about ten years, willows rebounded in many areas, although aspen is still affected by browsing of elk and bison, it recently appears to be recovering in a few stands. Songbirds have returned as have beavers, eagles, foxes and badgers.
While the reintroduction of wolves in Yellowstone has cost about USD 30 million, wolf ecotourism brings in USD 35 million annually, benefiting the surrounding communities.
SOURCE: Monbiot, 2013; Boyce, 2018; Kay, 2018; The Guardian, 2020.
The main challenge for restoration is to orient practitioners and policymakers to work together to ensure that it is planned well, implemented cost effectively and prioritized sufficiently among the range of development goals (Sabogal, Besacier and McGuire, 2015; FAO and Global Mechanism of UNCCD, 2015; Strassburg et al., 2019). This challenge is being addressed by a number of multilateral and bilateral programmes involving public- and private-sector actors. A second challenge is to engage producer organizations, farmers and small and medium-sized enterprises use in restoration, and to identify and enable business models that allow people to make a decent living through sustainable land management. To underpin the development of business models, a new initiative aims to facilitate access to information on the costs and benefits of ecosystem restoration, see Box 43.
The Economics of Ecosystem Restoration initiative, which started in 2019, aims to offer a reference point for the estimation of costs and benefits of current and future ecosystem restoration projects in all major biomes and across a wide range of contexts worldwide, based on information from comparable projects on which data have been collected through a standardized framework.
The initiative, led by FAO and carried out in collaboration with a consortium of organizations, including the secretariats of CBD and UNCCD, Bioversity International, CIFOR, IUCN, Tropenbos International, WeForest and the World Resources Institute (WRI), is building an information platform and developing decision-making tools that donors, investors, project implementers, governments and other stakeholders can consult for reliable cost and benefit data for their decision-making in ecosystem restoration.
The first output from this initiative, planned for release in 2020, is a framework for collecting consistent and reliable data on the costs and benefits of ecosystem restoration to facilitate further analysis and decision-making. A pilot study in the Sahel region is under way, and data-collection will soon be expanded to different contexts in all major biomes.
A recent study estimated that there are some 1.7 billion to 1.8 billion hectares of potential forest land (defined as land that could sustain more than 10 percent tree cover) in areas that were previously degraded, dominated by sparse vegetation, grasslands and degraded bare soils (Bastin et al., 2019); this excludes existing forests and agricultural and urban land and would be equivalent to 0.9 billion hectares of continuous forest cover. This is more than 25 percent of the current forested area globally. It should, however, be kept in mind that this study looked only at the biophysical potential for establishment of forests, irrespective of the importance of the current ecosystems and existing land-tenure rights. More detailed assessments incorporating local knowledge are thus needed to identify the most suitable areas at national or local level.
FAO has developed a module in the System for Earth Observation Data Access, Processing and Analysis for Land Monitoring (SEPAL) that incorporates the algorithm for tree restoration potential, to assist countries in identifying areas that are potentially suitable for restoration. Use of the module will be piloted in Cambodia, Kenya, Myanmar and Uganda by FAO and the respective government institutions in 2020–2021.
As a complement to the Restoration Opportunities Assessment Methodology developed by IUCN, specific guidelines are available to incorporate biodiversity aspects into landscape restoration opportunities assessments (Beatty, Cox and Kuzee, 2018).
A review of 62 countries in Asia, Africa and Latin America found that more than half of countries in each region had an established or preliminary restoration target in their National Biodiversity Strategy and Action Plan or Fifth National Report to the CBD (CBD, 2016b). While establishing targets is a good first step, implementing commitments remains challenging (Figure 34). In addition, restoration efforts are difficult to measure, and at present there are no global data sets to measure progress in forest landscape restoration (NYDF, 2019). FAO is working with several partners to establish a global monitoring system for the United Nations Decade on Ecosystem Restoration, and FAO and WRI (2019) have developed a guide to help countries and restoration practitioners identify priorities and indicators for monitoring forest and landscape restoration.
Many targets lack quantitative elements and developing restoration activities is a complex process. However, there have been some good examples of restoration success (Figure 35). For example, forest cover has significantly increased in China, Costa Rica, the Republic of Korea and Viet Nam as a result of government-led forest policies or initiatives. In southern Niger, farmer-managed natural regeneration using local agroforestry practices over three decades led to an increase in productivity on 5 million hectares of land (Reij, Tappan and Smale, 2009). Another example, the Great Green Wall for the Sahara and Sahel initiative, launched by the African Union in 2007, aims to restore 100 million hectares of currently degraded land, to sequester 250 million tonnes of carbon and to create 10 million green jobs by 2030, while creating an 8 000 km green wall across Africa’s drylands (see Case Study 1). Progress since 2007 (Great Green Wall, 2019b; UNCCD, 2019b) includes:
▸ 3 million hectares of land rehabilitated in Burkina Faso through local practices;
▸ 15 million hectares of degraded land in Ethiopia restored and land-tenure security improved;
▸ 5 million hectares of degraded land in Nigeria restored, 639 km of shelterbelt established in 11 states, 309 hectares of community orchard plantations and 293 hectares of community woodlots established;
▸ 5 million hectares of land in the Niger restored; and
▸ 12 million drought-resistant trees planted in Senegal in less than a decade.
As of October 2019, 61 countries had made pledges under the Bonn Challenge totalling 170.6 million hectares of restoration commitments for 2020 and 2030 combined (Figure 36) (Dave et al., 2019). However, since 2000 only 18 percent of the 2020 goal (restore 150 million hectares of degraded landscapes and forest lands by 2020) has been realized in terms of increases in forest or tree cover (NYDF, 2019). The Bonn Challenge Barometer (IUCN, 2018; Dave et al., 2019) is working to capture information on progress in substantive implementation more accurately, in terms of hectares brought into restoration and delivery of associated ecosystem benefits (including carbon sequestered and biodiversity conservation), as well as jobs created (Dave et al., 2019).
Many countries announced new pledges to restore forest and plant trees at the Climate Action Summit held in New York, United States of America, in September 2019 (Box 44). In early 2020, the World Economic Forum launched a global initiative to grow, restore and conserve 1 trillion trees (WEF, 2020).
▸ Barbados: 1 million trees to be planted by 2020
▸ Colombia: 300 000 hectares to be restored by 2022 (180 million trees) and 900 000 hectares under agroforestry and sustainable forest management
▸ Democratic Republic of the Congo: forest cover stabilized at 60 percent
▸ Europe, the Caucasus and Central Asia: 30 million hectares of degraded and deforested land to be brought into restoration by 2030
▸ Ethiopia: 4 billion new trees to be planted in a year
▸ Fiji: 1 million new trees to be planted and exploration of the possibility of planting 31 million more
▸ Guatemala: 1.5 million hectares to be restored by 2022
▸ Hungary: forest cover to be increased by 30 percent by 2030
▸ Kenya: 2 billion trees to be planted by 2022
▸ Mali: 10 million hectares to be restored by 2030*
▸ New Zealand: 1 billion trees to be planted by 2028
▸ Nigeria: 25 million trees to be planted by youth
▸ Pakistan: 10 billion trees to be planted in the next five years
▸ Senegal: 2 million hectares to be restored by 2030*
▸ Sierra Leone: 2 million trees to be planted by 2023
SOURCE: Nature4Climate, 2019, except those with an asterisk (*), which were submitted to AFR100.
This chapter looks at how to manage the world’s forest ecosystems in ways that will ensure the conservation and sustainable use of their biodiversity.
Creation of protected areas has historically been the forest governance instrument most often adopted to pursue biodiversity objectives (Watson et al., 2014). Many forested protected areas are managed to reconcile local livelihoods with biodiversity conservation. The protected-area approach has achieved positive results in terms of establishing barriers to the progress of deforestation and conserving species, although the evidence is not conclusive regarding most rare species.
However, from a biophysical perspective, evidence has shown that natural reserves alone are not sufficient to conserve biodiversity. They are usually too small, creating barriers to species migration and are vulnerable to exogenous factors such as climate change (Bennett, 2004; Fung et al., 2017). In addition, protected areas contain only a fraction of existing forest biodiversity. Thus, there is a need to look beyond protected areas and to mainstream biodiversity conservation into forest management practices.
Approaches that integrate conservation and socio-economic development goals, support sustainable resource use and devolve forest management to local people have emerged as alternatives or complements to strict conservation (Agrawal, Chhatre and Hardin, 2008; Lele et al., 2010; Mace, 2014). A variety of stakeholder-based governance approaches have emerged to negotiate multiple and sometimes conflicting uses of natural resources in such a way as to maintain the resources that local people use and value, as well as those that support broader societal needs (Kaimowitz and Sheil, 2007; McShane et al., 2011). Examples include areas managed and protected by indigenous communities, civil society organizations and private actors (Stolton et al., 2014; Drescher and Brenner, 2018), with increasing emphasis on rights-based approaches and landscape approaches. In many cases, reconciling forest use and forest conservation means reconciling local and global needs.
The importance of accounting for conservation beyond protected areas, including in productive forests, is recognized by the inclusion of other effective area-based conservation measures (i.e. conserved areas outside protected areas) and reference to sustainable use in global conservation goals (Box 45).
Over the past few decades, the global network of protected areas has expanded rapidly, reaching almost 240 000 designated protected areas, of which most are on land. Collectively, these areas protect just over 2 billion hectares, equivalent to 15 percent of the Earth’s land surface (UNEP-WCMC, IUCN and NGS, 2020). Thousands of protected areas are specifically designed to protect forests; some of them are among the oldest protected areas in the world. For example, Marakele Forest Reserve in Sri Lanka has been protecting forest since 1875.
Protected areas are categorized according to their management objective (Box 46).
▸ Sustainable Development Goal 15.1: By 2020, ensure the conservation, restoration and sustainable use of terrestrial and inland freshwater ecosystems and their services, in particular forests, wetlands, mountains and drylands, in line with obligations under international agreements.
— SDG 15.1.2 Proportion of important sites for terrestrial and freshwater biodiversity that are covered by protected areas, by ecosystem type.
▸ Aichi Biodiversity Target 11: By 2020, at least 17 percent of terrestrial and inland water, and 10 percent of coastal and marine areas, especially areas of particular importance for biodiversity and ecosystem services, are conserved through effectively and equitably managed, ecologically representative and well connected systems of protected areas and other effective area-based conservation measures, and integrated into the wider landscapes and seascapes.
▸ United Nations Strategic Plan for Forests Goal 3: Increase significantly the area of protected forests worldwide and other areas of sustainably managed forests, as well as the proportion of forest products from sustainably managed forests.
— Target 3.1 The area of forests worldwide designated as protected areas or conserved through other effective area-based conservation measures is significantly increased.
Category Ia covers strictly protected areas set aside to protect biodiversity and also possibly geological/geomorphological features, where human visitation, use and impacts are strictly controlled and limited to ensure protection of the conservation values. Such protected areas can serve as indispensable reference areas for scientific research and monitoring.
Category Ib protected areas are usually large unmodified or slightly modified areas, retaining their natural character and influence, without permanent or significant human habitation, which are protected and managed so as to preserve their natural condition.
Category II protected areas are large natural or near natural areas set aside to protect large-scale ecological processes, along with the complement of species and ecosystems characteristic of the area, which also provide a foundation for environmentally and culturally compatible spiritual, scientific, educational, recreational and visitor opportunities.
Category III protected areas are set aside to protect a specific natural monument, which can be a landform, sea mount, submarine cavern, geological feature such as a cave or even a living feature such as an ancient grove. They are generally quite small and often have high visitor value.
Category IV protected areas aim to protect particular species or habitats and management reflects this priority. Many category IV protected areas will need regular, active interventions to address the requirements of particular species or to maintain habitats, but this is not a requirement of the category.
Category V protected areas are those where the interaction of people and nature over time has produced an area of distinct character with significant ecological, biological, cultural and scenic value, and where safeguarding the integrity of this interaction is vital to protecting and sustaining the area and its associated nature conservation and other values.
Category VI protected areas conserve ecosystems and habitats, together with associated cultural values and traditional natural resource management systems. They are generally large, with most of the area in a natural condition, where a proportion is under sustainable natural resource management and where low-level non-industrial use of natural resources compatible with nature conservation is seen as one of the main aims of the area.
SOURCE: UNEP-WCMC, IUCN and NGS (2020).
Globally, 18 percent of the world’s forest area, or more than 700 million hectares, is reported to fall within legally established protected areas such as national parks, conservation areas and game reserves (protected-area categories I–IV). The largest share of forest in protected areas is found in South America (31 percent) and the lowest in Europe (5 percent) (Figure 37) (FAO, 2020).
According to FRA 2020, since 1990 the area of forest within protected-area categories I–IV has increased by at least 191 million hectares, but the rate of annual increase has slowed during the past decade (Figure 38). For FRA 2020, full time series were reported by only 129 countries, together accounting for 84 percent of the total forest area (FAO, 2020), so the actual increase in the area of forests in protected areas is likely to be slightly higher.
For this report, UNEP-WCMC conducted new studies on trends in protected areas by forest type and by global ecological zone and on trends in forest area within Key Biodiversity Areas (KBAs), i.e. sites contributing significantly to global biodiversity. These studies were based on four spatial data sets:
▸ Protected areas: the June 2019 release of the World Database of Protected Areas (WDPA) (UNEP-WCMC and IUCN, 2019).
▸ KBAs: the March 2019 release of the World Database of Key Biodiversity Areas (BirdLife International, 2019).
▸ Land cover: annual land cover at ~300 m resolution from 1992 to 2015, from the European Space Agency Climate Change Initiative (ESA CCI) Land Cover product (Bontemps et al., 2013), version 2.0.7.
▸ Ecological zones: the GEZ data set, second edition (FAO, 2012a).
It was not possible to exclude agricultural tree crops from the land-cover data, but since few of these fall within protected areas their inclusion is unlikely to significantly skew the key results presented below.
Note that while FAO asked countries to report on the area of forest in protected-area categories I–IV for FRA 2020, this study included also categories V and VI. The total area of forest in protected areas reported below is, therefore, considerably larger than that reported to FRA 2020.
Status and trends of protected areas by forest type. The area of tree cover within protected areas increased by an impressive 396 million hectares globally between 1992 and 2015, an average increase of 17 million hectares per year (Figure 39), reaching a total of 833 million hectares as of 2015 (Table 5). It is uncertain whether this increase is due to the widespread expansion of protected-area networks randomly overlapping with forests, or whether it represents the targeted protection of forest ecosystems.
The largest increase in area protected was of broadleaved evergreen (tropical) forest (Figure 39), which from 1992 increased by 226 million hectares to reach 397 million in 2015, the largest area of any forest type and the second highest percentage of forests in protected areas (Table 5). The growth in protected broadleaved evergreen forest represents over half the average global increase in protected forest each year since 1992. All other forest types experienced a markedly smaller increase during the 23-year period (Figure 39).
Status and trends of protected forest by global ecological zone. Worldwide, 20 terrestrial GEZs contain some tree cover. All zones had a greater proportion of their tree cover protected in 2015 than in 1992 (Figure 40). In three GEZs (tropical rainforest, subtropical dry forest and temperate oceanic forest), more than 30 percent of the tree cover is now in legally protected areas. In another three GEZs (subtropical humid forest, temperate steppe and boreal coniferous forest), less than 10 percent of the tree cover is in protected areas (Table 6). Areas having such a low proportion of forest in protected areas are mostly at higher latitudes (Figure 41). These areas should be considered priorities for further protection, given that representative protection of terrestrial ecosystems is a key component of Aichi Target 11.
Interestingly, despite having the highest rates of forest cover loss, the tropical rainforest GEZ experienced the highest levels of growth in tree cover in protected areas. This may largely be due to the protected-area network of Brazil, which now has the largest such network in the world (UNEP-WCMC and IUCN, 2019).
As of 2015, temperate oceanic forest – found in Europe, Chile and parts of Oceania – had the greatest percentage in protected areas. This is partly due to the extensive protected-area network in Europe, which accounts for almost half the protected areas in the world (UNEP-WCMC, IUCN and NGS, 2020).
Trends in forest within Key Biodiversity Areas. KBAs are areas that explicitly meet at least one of 11 biodiversity criteria, for example representing more than 5 percent of the global extent of a globally endangered or critically endangered ecosystem type (IUCN, 2016). There are currently more than 15 000 KBAs in the world, covering a total area of over 1.9 billion hectares (Birdlife International, 2019). Approximately 95 percent of them are terrestrial, and more than 75 percent contain some forest cover.
The UNEP-WCMC study suggests that forest cover has marginally decreased in these KBAs between 1992 and 2015 – a result that aligns with what other sources have found for a subset of KBAs (Tracewski et al., 2016). KBA status in itself does not provide any formal forest protection, although KBAs that are fully or partly within protected areas or are in more remote locations have a lower likelihood of land-cover change than other KBAs. Despite the marginal reduction in forest cover in KBAs, protected-area coverage in these areas has been growing steadily over time, albeit with widely differing levels of protection in different countries (Ritchie et al., 2018).
Increasingly, protected areas for biodiversity conservation are implemented following the so-called biological corridors or ecological networks approach (see e.g. Bennett and Mulongoy, 2006), which reconciles biophysical and human perspectives and contributes to the integrity of the broader agroecological landscape. Case Study 2 gives an example from Colombia, one of the world’s most biodiverse countries. Lessons learned from more than 30 years of implementing ecological corridors provide evidence on their benefits for conservation of forest cover, although not necessarily for conservation of the full range of species (Bennett and Mulongoy, 2006).
Since 2016, the five-year BioCaribe Connectivity Initiative (Conexión BioCaribe) has been working to reduce the degradation and fragmentation of the valuable ecosystems in the Caribbean Region of northern Colombia. While exploitation of the region’s resources since precolonial times had driven economic growth, unsustainable practices were increasingly posing a threat to the region’s rich biodiversity, resilience of rural communities and food security (FAO, 2019i).
The core of the initiative is the design of 1.5 million hectares of connectivity corridors to link isolated protected areas (Figures A and B). These corridors are formed by environmentally friendly production systems that include silvopastoral systems, agroforestry, mixed orchards, water-source and shore restoration, mangrove restoration and wetland recovery with aquatic agriculture, combining species that support both biodiversity conservation and food production. The process includes territorial planning, social participation with an intercultural vision, effective management of existing protected areas, creation of new protected areas and creation of buffer zones connecting protected areas, and feasibility analysis of potential conservation incentive and certification schemes.
The results (FAO, 2019i) have already included the following contributions to ecosystem connectivity and to the associated recovery of birds and mammals:
▸ about 13 500 hectares of new protected areas, and another 116 000 hectares in the process of creation;
▸ about 5 000 hectares farmed under alternative models of sustainable production, with more than 1 500 families having participated in farmer field schools;
▸ 1 300 hectares of protected-area buffer zones established with sustainable production plans; and
▸ 68 000 hectares of mosaics of conservation and sustainable use of natural resources established.
The corridors have been designed through a participatory process with local communities and institutions. This made it possible to design activities appropriate to the values and sociocultural traditions of ethnic communities. As a result, two indigenous and three Afrodescendant communities have incorporated the connectivity approach into their collective land-use plans.
The initiative also promoted the creation of a collective communication network for information dissemination and raising awareness of the activities of the communities, which has engaged children and young people in addressing the challenges facing each community. In 2020 the Colombian National System of Natural Parks is expected to take up responsibility for managing the network and maintaining cultural sovereignty in communication among these groups.
Nearly 40 percent of protected and ecologically intact ecosystems, such as boreal and tropical primary forests, savannahs and marshes, are under the custodianship of indigenous peoples (Garnett et al., 2018) and it is increasingly acknowledged that the needs, knowledge and values of local communities that are associated with biodiversity conservation sites contribute to biodiversity maintenance (Pretty and Smith, 2004; Sayer et al., 2017). This recognition has paved the way for win–win strategies for enhancing livelihoods while protecting natural heritage. Whether human-ecosystem interactions within a protected area are sustainable and whether the levels of protection are adequate are key questions, as it is often difficult to monitor the effectiveness of protection (Andam et al., 2008; Leverington et al., 2010). In many cases, allowing activities in protected areas that support local livelihoods, such as sustainable harvesting of timber and NWFPs (Case Study 3 and Box 47) and sustainable tourism (Case Study 4) have been effective in providing positive incentives to local people to conserve the resources.
The Maya Biosphere Reserve was created in 1990 to protect the largest area of tropical forest in Central America. It occupies about 2.1 million hectares, including 767 000 hectares under strict protection, 848 400 hectares under multiple use (including concessions) and 497 500 hectares of private holdings in the buffer zone. About 533 000 hectares of concessions have been awarded in the multiple-use area with explicit conservation objectives (see Figure A).
Between 1994 and 2002, 14 concessions were awarded in the reserve, including industrial timber concessions ranging in size from 2 hectares to about 130 000 hectares. Twelve concessions were awarded to communities following the Peace Accords of 1996, which specified that by 1999 the Government was to award 100 000 hectares in concessions to small- and medium-scale farmers. The remaining two were awarded to private timber companies. Since then, two community concessions have been cancelled and one suspended because of heavy farming pressure, low economic potential and the presence of drug trafficking. Concessions currently cover 485 122 hectares (Gretzinger, 2016).
Certification by the Forest Stewardship Council (FSC) is a requirement for maintaining any concession. It has functioned as a mechanism for accountability and complements the monitoring capacities of public institutions, which are limited.
The community concessions are managed in an integrated way for diversified uses, including collection of NWFPs and tourism. However, the bulk of the revenues are from timber, especially high-value species such as mahogany (Swietenia macrophylla) (Rodas and Stoian, 2015). About one-third of the profits are reinvested in the forest through fire patrols and forest protection.
Overall, logging intensity is reported to be low in the community concessions. During 2012–2016, it was 0.7 m3 per hectare for mahogany (0.29 trees per hectare) and 1.6 m3 per hectare overall (Rodas and Stoian, 2015). The number of timber species harvested ranges from 4 to 19, with industrial concessions generally harvesting more species than community concessions.
Results in terms of biodiversity conservation in the concessions include sustainable levels of timber harvesting (Grogan et al., 2016), successful control of forest fires and reduced incidences of forest fires during El Niño and La Niña years (CONAP and WCS 2018), maintenance of jaguar populations (Polisar et al., 2016) and low to zero deforestation, which resulted in a 0.1 percent increase in forest cover between 2016 and 2017 (CONAP and WCS, 2018). In contrast, deforestation in the core-zone protected areas (not included in the concessions) has been more variable, averaging about 1 percent (Hodgdon et al., 2015).
Development-related outcomes include increased timber revenues, reduced outmigration, enhanced employment opportunities, social investments, capacity-building and improved access to bank credits as a result of the concessionaires’ increasing credibility:
▸ Between 2012 and 2016, community concessions earned about USD 25 million from timber sales. In concessions with more diversified production (wood and NWFPs) and greater capacity for value addition, the forest income of participating households was 1.6 to 2.8 times the poverty line (Stoian and Rodas, 2018).
▸ Forest income (which represents approximately 38 percent of family income) plus the social services provided by the concessions, such as scholarships and health care, have helped to reduce emigration. On average, remittances in the concession areas contribute only 2 percent of family income (Stoian et al., 2018).
▸ Employment opportunities in production and commercialization of NWFPs, such as xate palm fronds (Chamaedorea spp.), ramón seeds from the breadnut tree (Brosimum alicastrum), honey and pimiento, are particularly important for women.
▸ Concessions have invested their profits in community projects such as infrastructure (road construction and maintenance), health services and education (scholarships, teacher remuneration). Surveys showed that community members preferred in-kind distributions and reinvestment of forest income to cash (Bocci et al., 2018; Stoian et al., 2018).
▸ Concession management and certification requirements provided opportunities and motivation to strengthen the technical and administrative capacity of the community enterprises.
▸ Communities can access finance through banks that accept the Annual Operating Plan as collateral. Many communities finance logging operations through up-front payments (with interest incorporated in the payment).
The Mountain Partnership Products (MPP) initiative is a certification and labelling scheme that provides technical and financial support to smallholder mountain producers to create enterprises, enhance their marketing skills and boost their livelihoods by improving the value chains of mountain products such as organic food, textiles and tourism services. The initiative promotes short, domestic value chains while ensuring transparency and trust between producers and consumers, fair compensation for the primary producers, conservation of agrobiodiversity and preservation of ancient techniques. Each product has a narrative label that tells the story of the product’s origins and cultivation, processing and/or preservation methods, nutritional value (in the case of foods) and role in the local culture, enabling consumers to make informed purchases. To date, the initiative has supported about 10 000 farmers, of whom 6 000 are women.
One of the products supported by the MPP initiative is honey from stingless Tetragonisca angustula bees, an indigenous forest product carefully harvested by a cooperative of 160 women of the Guarani community in Serranía del Iñao National Park, Chaco Province, Bolivia (Plurinational State of). Guarani families have reared bees since ancient times. The honey has become a rare good, however, as deforestation and the introduction of more productive European honeybees has reduced the distribution of the 350 known stingless bee species (members of the tribe Meliponini). Perfectly adapted to the local environment, stingless bees are crucial pollinators; their displacement could lead to a significant loss of biodiversity in forests in Bolivia (Plurinational State of). This initiative thus helps not only to provide a livelihood to beekeepers and conserve the bees but also to maintain the existing plant biodiversity through pollination.
Jordan is a semi-arid and drought-prone country. It has limited forest cover of 88 000 hectares, concentrated in the highland areas, which are characterized by a Mediterranean climate. The forests have a crucial role in conserving fauna and flora in Jordan, but forest and rangeland degradation has resulted in soil erosion, damage to watershed areas, loss of biodiversity and loss of valuable ecosystem services (MoP and MoE, 2008). In an effort to conserve its limited forest resources and forest-related biodiversity, the country has declared some of these forests as national reserves and delegated the authority to manage them to the Royal Society for the Conservation of Nature (RSCN), a national NGO.
The 32 000-hectare Dana Biosphere Reserve (DBR), established in 1989 (Figure A), is Jordan’s largest nature reserve. It embraces four different biogeographical zones and six vegetation types including an important patch of relatively intact juniper forest (Juniperus phoenicea). It is also home to the southernmost remaining forest community of cypress (Cupressus sempervirens). A total of 891 plant species have been recorded (of which three are new to science) (RSCN, 2018). The reserve is home to 449 animals, of which many are rare and some threatened with extinction; these include the sand cat (Felis margarita), the Syrian wolf (Canis lupus arabs), the Nubian Ibex (Capra nubiana), the lesser kestrel (Falco naumanni) and the Egyptian spiny-tailed lizard (Uromastyx aegyptia) (RSCN, 2018). So far, 25 animals listed as Endangered or Vulnerable have been found in the reserve, making it an area of global importance (RSCN, 2018). DBR is part of a larger area identified by BirdLife International as the Dana Important Bird Area. The most important tree species in this larger area is the Mediterranean cypress (Cupressus sempervirens).
RSCN’s flexible conservation approach integrates environmental, social and economic goals, local people’s livelihoods and the local economy. DBR is home to four ethnic communities, distributed in about 16 villages or settlements in and around the reserve, with a total population of 31 000 people who are all involved, in one way or another, in the management of the reserve. The reserve management plan is well integrated in the local plans for economic and rural development. The reserve provides the local communities with 85 permanent jobs and hundreds of part-time jobs. Local communities also earn income from the sale of handicrafts, medicinal and aromatic plant products and produce from hunting and from hosting visitors in their houses and serving them traditional foods.
Regulation of livestock grazing under the management plan that has had positive results. The plan includes a provision allowing community members to bring their animals to graze in some parts of the reserve in the dry season, when fodder outside the reserve becomes scarce. The communities are also trained in the practice of rotational grazing. Most of the local communities have nomadic and pastoral backgrounds, and the regulated grazing adopted in the management plan represents a significant support to their livelihood; this has contributed to a strong sense of ownership among local communities and commitment to protecting the reserve. The total monetary value of the feed that the reserve provides to the 17 500 head of livestock owned by the local communities is estimated at approximately USD 2 219 000 annually (RSCN, 2018).
The biosphere reserve is attractive to an array of local and international tourists because of its biological and archaeological significance. Development of ecotourism infrastructure, together with revenue from fees, sale of wood and NWFPs and tourist activities, has allowed RSCN to generate significant income to support the conservation and sustainable management of the reserve. RSCN has established a guesthouse, an ecolodge, a campsite with 30 tents accommodating up to 120 people and an array of hiking trails (RSCN and Wild Jordan, 2017). The success of tourism in the reserve has helped RSCN to gain the trust of the Government and local people and to generate additional finance from national and external financiers for use in conservation activities and in support to the livelihoods of the local communities. RSCN has also provided capacity-building opportunities for local communities in entrepreneurial skills for running small business projects and in organizing cooperatives with legal status to facilitate the procurement of loans from national lending institutions to fund community-based projects.
The iconic Nubian Ibex is a vulnerable species according to the IUCN Red List.
© Royal Society for the Conservation of Nature, Amman, JordanLocal women trained by RSCN on handicraft production as an alternative income-generation activity.
© Royal Society for the Conservation of Nature, Amman, JordanProtected areas have led to improved forest condition, particularly where the needs of local and forest-dependent people have been taken into account. Evidence from Brazil suggests that the performance of protected areas under different governance regimes (sustainable use, indigenous lands, strict protection and other variations) is closely related to location, deforestation pressure and enforcement (Soares-Filho et al., 2010). Studies suggest that extractive reserves in Brazil resulted in a dramatic reduction of annual deforestation from 2.78 million hectares in 2004 to 460 000 hectares in 2012 – a 74 percent decrease (Instituto Socioambiental, 2015, cited in RRI, 2015).
In Bhutan, where more than 50 percent of land is within protected areas, assessments conducted 20 years after the initiation of the first Biodiversity Action Plan, developed in 1997 (Government of Bhutan, 1997), show positive results for conservation of species and biodiversity awareness. However, they also identify challenges, such as lack of coordination across a broad range of stakeholders; uncertainties related to the financial sustainability of protected-area management and technical means of implementation; conflict between policies; and difficulties in monitoring status and progress and in supporting local stakeholders. Human–wildlife conflict has also become an important issue; the reduced authority of local people to manage the impact of wildlife on crops and livestock has at times triggered backlash against conservation policies (Mongbo et al., 2011; Lham et al., 2019) (See also Box 51 in Sustainable hunting and wildlife management).
There is strong evidence of benefits from rights-based approaches for conservation of forest cover in protected areas, but not necessarily for conservation of the full range of diverse species (Campese et al., 2009). For instance, tourism and sport hunting might have a positive impact on some species but not on others (Sayer et al., 2017). A successful rights-based approach to protected areas depends on availability of capacity to exercise monitoring, support to communities in their traditional practices and enforcement of rules and regulations.
According to data provided by countries for FRA 2020, 422 million hectares of forests are primarily designated for the conservation of biodiversity, an increase of 111 million hectares since 1990. The area designated is now equivalent to 10 percent of the world’s forest area. Globally, the largest part was designated between 2000 and 2010; the rate of annual increase has decreased in the past decade (FAO, 2020) (Figure 42). Some of these areas are found within legally protected areas, while others are not. The reason this figure is well below the area of forest in protected areas reported above is that many protected areas are designated for multiple use (e.g. conservation of biodiversity combined with recreation or ecotourism) or for other primary purposes. Brazil, for example, reported almost all its protected areas as primarily designated for social services (for the protection of the culture and way of life of forest-dependent people) and only areas with restricted use as primarily designated for conservation of biodiversity.
The term “other effective area-based conservation measure” (OECM) was introduced into Aichi Biodiversity Target 11 of the CBD’s Strategic Plan for Biodiversity 2011–2020 (CBD, 2010a) in 2010, providing a modality for recognizing biodiversity conservation outside protected areas, where biodiversity conservation may not necessarily be the primary management objective.
CBD Decision 14/8, adopted in 2018, defines an OECM as “a geographically defined area other than a protected area, which is governed and managed in ways that achieve positive and sustained long-term outcomes for the in situ conservation of biodiversity, with associated ecosystem functions and services and, where applicable, cultural, spiritual, socio-economic and other locally relevant values” (CBD, 2018a). The same decision defines four criteria for identifying OECMs: the area is not currently recognized as a protected area; the area is governed and managed; the area achieves a sustained and effective contribution to in situ conservation of biodiversity; and associated ecosystem functions and services and cultural, spiritual, socio-economic and other locally relevant values are maintained.
Examples of potential OECMs in forest habitats identified by IUCN WCPA (2018) and Jonas et al. (2018) include:
▸ territories and areas conserved by indigenous peoples and local communities that are not officially protected areas (see Box 48);
▸ wildlife conservancies adjacent to national parks or protected areas;
▸ privately managed areas with primary conservation objectives and demonstrated effectiveness that are not reported as protected areas in national reports;
▸ areas of active habitat restoration to restore degraded ecosystems of high value for biodiversity and ecosystem services, e.g. restored coastal wetlands and mangroves;
▸ hunting reserves that maintain natural habitats and flora and fauna as well as viable populations of hunted and non-hunted native species;
▸ some areas of forest that are permanently set aside, such as old-growth, primary or other high-biodiversity-value forests, and that are protected from threats (see Case Study 5); and
▸ other areas that may comply with the OECM criteria such as military areas, sacred groves or Globally Important Agricultural Heritage Sites (see Box 32 in Chapter 4).
Territories and areas conserved by indigenous peoples and local communities (ICCAs, from the earlier term, “Indigenous and Community Conserved Areas”) are recognized as an important element in contributing towards Aichi Target 11, whether as formal or informal protected areas or as other effective area-based conservation measures. ICCAs vary, but usually have the following three characteristics (Borrini-Feyerabend et al., 2013):
▸ an indigenous people or a local community possesses a close and profound relationship with the site (territory, area or habitat);
▸ the people or community is the major player in decision-making related to the site and has de facto and/or de jure capacity to develop and enforce regulations; and
▸ the people’s or community’s decisions and efforts lead to the conservation of biodiversity, ecological functions and associated cultural values, regardless of the original or primary motivations.
ICCAs include collectively governed territories and areas, cultural sites, sacred places, refuge areas for particular species and sustainably used commons such as community forests and rangelands, transhumance routes and locally managed marine areas. UNEP-WCMC maintains an ICCA Registry (UNEP-WCMC, 2020). Although the number and extent of ICCAs have not been assessed, estimates suggest that they may cover an area equal to or greater than that of government-designated protected areas.
Rules and regulations for governing and managing ICCAs vary widely across a spectrum from unwritten customary laws passed down orally through generations to formal statutory laws. ICCAs need not necessarily be part of an official protected area system, and indeed some indigenous peoples or local communities may not wish to have their territory formally recognized as such.
Many inland fishes rely on freshwater habitats maintained and supported by forests. Upland forests provide soil stability, decrease destructive run-off during rainstorms and reduce the risk of landslides into downstream rivers. Healthy floodplain forests support natural river meanders, beaver ponds and slow-water side channels. Streamside forests provide shade, erosion protection, chemical buffering and nutritious terrestrial inputs to aquatic food webs. Across the Pacific Northwest of the United States of America and Canada, forests are being managed and restored to support freshwater biodiversity.
Many freshwater fishes historically found in forested habitats in this area are listed as threatened or endangered under the Endangered Species Act of 1973 (Government of the United States of America, 1973). Examples of large-scale and highly coordinated plans that have successfully supported aquatic biodiversity conservation and the associated socio-economic and cultural benefits of inland fish at least partially through forest management include the Northwest Forest Plan, Wy-Kan-Ush-Mi Wa-Kish-Wit and the Oregon Chub Recovery Plan.
The Northwest Forest Plan (USDA, n.d.a), one of the largest coordinated land-management plans ever implemented, brought an unprecedented shift from sustained timber yield to conservation aims. Initiated in 1994, the plan provides management direction for 10 million hectares of federal lands for 100 years by designating an extensive system of mature forest and riparian forest reserves, in combination with controlled timber harvest on other lands. The accumulated evidence suggests that over its first 20 years, the plan protected dense old-growth forests and successfully maintained habitats for threatened and endangered birds and a suite of aquatic organisms (Spies et al., 2018). Climate change and associated increases in wildfire activity have contributed to unexpected losses of old forests on lands covered by the plan; however, three essential elements of aquatic habitats for supporting inland fish biodiversity – water temperature, aquatic macroinvertebrates and physical conditions in riparian areas – have all shown improvements. These improvements are likely attributable to reductions in the extent of roads and to increases in the number of large trees in streamside riparian forests (Spies et al., 2018). Across low-gradient streams on public lands, improved stream conditions have been attributed to changes made in forest management standards and guidelines in the 1990s (Roper, Saunders and Ojala, 2019).
Wy-Kan-Ush-Mi Wa-Kish-Wit, meaning “spirit of the salmon”, is a plan created by the Nez Perce, Umatilla, Warm Springs, and Yakama tribes and coordinated by the Colombia River Inter-Tribal Fish Commission to restore culturally and nutritionally important anadromous Pacific salmon (Oncorhynchus spp.) (CRITFC, 2020). Adult salmon returns in the Columbia River Basin had declined from more than 15 million a year before European contact to fewer than 500 000 by the late 1970s. The plan has led to improvements in over 1 000 km of streams through actions such as planting of riparian trees and coordinated forest management across watersheds, as well as reintroduction of salmon in areas with healthy forests, thanks to collaboration by state and national governments and up to 25 tribes. Fish counts at Bonneville Dam in the lower Columbia River indicated that abundance of adult Chinook salmon (Oncorhynchus tshawytscha) increased substantially beginning in 2001, peaking at 1.3 million fish in 2015. Unfortunately, Chinook abundance has declined sharply in recent years, probably because of poor ocean conditions and high riverine water temperatures in 2015 – a strong reminder of the work yet to be done. Where and when salmon returns have increased, tribal members have harvested more salmon from a more diverse mix of species and over more days, and more tribe members, including younger generations, have found employment and income from fishing. Pacific salmon also contribute to terrestrial biodiversity by transporting nutrients, e.g. nitrogen, from the ocean back to the forested streams where they spawn. The salmon also transfer nutrients to riparian soils, both directly, via their rotting carcasses, and indirectly, through the brown bear (Ursus arctos) (Hilderbrand et al., 1999) and other foragers that consume them. These soil nutrients support the growth and improve the vigour of Sitka spruce (Picea sitchensis) by increasing needle area and thereby increasing photosynthesis rates (Reimchen and Arbellay, 2019).
The Oregon Chub Recovery Plan was published in 1998 with a goal to reverse the decline of the Oregon chub (Oregonichthys crameri), a small freshwater fish endemic to the Willamette River Valley of western Oregon (US Fish and Wildlife Service, 1998). The plan included activities to protect existing wild populations, to reintroduce chub into suitable floodplain habitats throughout its historical range and to increase public awareness of this conservation issue. The cumulative efforts of agencies, industry, scientists and public citizens led to the removal of the Oregon chub from the list of endangered and threatened species in February 2015, making it the first fish in the United States of America ever to be delisted as a result of managed recovery. Forest habitats in the Willamette National Forest, managed under the Northwest Forest Plan, were essential to the recovery and maintenance of the habitats on which these fish depend.
The success of all three cases rests on multidisciplinary planning and management at the landscape scale, involving forest ecologists, hydrologists, freshwater biologists, fish biologists and others, as a foundation for local on-the-ground action. Coordinated efforts to manage and restore forests to support aquatic biodiversity were undertaken over vast extents and with an understanding of connections between upstream and downstream areas, between forests and rivers and between human-dominated and wildland areas. Collaboration between individuals from different and even sometimes competing agencies, as well as from differing cultural perspectives, was also a key success factor.
In summary, OECMs provide an opportunity for documenting the spatial continuum of areas managed for biodiversity conservation, from state-owned protected areas to other forms of management on other public, private or traditionally owned lands that can make important contributions to biodiversity conservation even if conservation is not the primary management objective. Specifically, an OECM can complement protected areas by filling gaps, connecting habitats and conserving species that occur outside formally protected areas. However, as pointed out by Dudley et al. (2018), OECMs can contribute to this end only if the key drivers of biodiversity loss are addressed and if key enabling conditions are in place, such as the respect for human rights, secure tenure and social safeguards.
Biodiversity is already a well-recognized element of the concept of sustainable forest management. The role of forests in maintaining biodiversity is also explicitly recognized by the United Nations Strategic Plan for Forests 2017–2030 (UN, 2017a).
The 2016 United Nations Biodiversity Conference, held in Cancun, Mexico, called for the mainstreaming of biodiversity across all agricultural sectors and the tourism sector. The Global Environment Facility (GEF) Scientific and Advisory Panel describes mainstreaming biodiversity as: “the process of embedding biodiversity considerations into policies, strategies and practices of key public and private actors that impact or rely on biodiversity, so that it is conserved and sustainably and equitably used both locally and globally” (Huntley and Redford, 2014).
Mainstreaming biodiversity in forestry involves prioritizing forest policies, plans, programmes, projects and investments that have a positive impact on biodiversity at the ecosystem, species and genetic levels, and on ecosystem services (see example in Box 49). This involves enhancing the sustainable use of biodiversity in forest and ecosystems and minimizing the impact of the forest sector on all other ecosystems.
Mongolia is an impoverished country highly dependent on its natural resources. The majority of the population is spread across small urban centres and the vast steppes, where the predominant activity is herding cattle, sheep, goats, horses, yaks and camels. This, together with community forestry, provides employment, alleviates poverty and enables marginalized communities to participate in the national economy. Sustainable management of forests in Mongolia represents an alternative revenue source for many of the country’s poor, and participatory forest management has recently been piloted and introduced in the country.
The FAO-GEF-Government of Mongolia project “Mainstreaming biodiversity conservation, sustainable forest management and carbon sink enhancement into Mongolia’s productive forest landscape” aims at improving the management of over 460 000 hectares of forests, which include important habitats of endangered species such as musk deer (Moschus moschiferus) and saker falcon (Falco cherrug). The project, implemented by the Mongolian Ministry of Environment and Tourism in collaboration with provincial and district governments and with assistance from FAO and financial support from GEF, works directly with 101 Forest User Groups. All forest management plans developed with support from the project include biodiversity conservation objectives and wildlife-monitoring activities.
In addition to activities designed to enhance forest health, productivity and carbon stocks (e.g. pest control, fire prevention, forest-stand enhancement), the project promotes income-generating activities based on fuelwood, small crafts and NWFPs; these have opened up opportunities for multipurpose forest management by the Forest User Groups. Project monitoring data available to date indicate that the number of some wildlife species, including musk deer and wild boar, have increased in the project area.
Certification schemes (see example in Box 50) and REDD+ both have mandatory environmental and socio-economic safeguards that aim to conserve biodiversity. Several guidelines are available for mainstreaming biodiversity into forest management, including for production forests (ITTO and IUCN, 2009), planted forests (Carnus et al., 2006) and restoration efforts (Beatty, Cox and Kuzee, 2018).
The Atlantic rainforest once covered more than 100 million hectares in Brazil but by the year 2000 just 7 percent remained. However, these small, scattered fragments still harbour some of the world’s richest biodiversity. Some 450 tree species can be found in a single hectare, and more than half of them exist nowhere else on Earth. Of the 20 000 plant species so far recorded in this forest – around 8 percent of the global total – 8 000 are unique to the region (Ribeiro et al., 2009).
The arrival of pulp and paper industries and their eucalyptus plantations in this landscape could have proved the final straw. According to the Brazilian Forest Code (Law no. 12.651 of 1992), landowners in the region must preserve natural vegetation on 20 percent of their land (“legal reserves”) as well as in “areas of permanent protection” designed to maintain ecosystem integrity, for example as buffers around watercourses or to prevent erosion on steep slopes. Some companies try to circumvent even this minimum standard (Azevedo et al., 2017). However, forestry companies using forest certification schemes such as that of the Forest Stewardship Council (FSC) provide assurance of legal compliance, and some have gone further, identifying and managing areas of high conservation value and taking a lead in restoring the forest (New Generation Plantations, 2018).
Four pulp and paper companies participating in World Wildlife Fund’s New Generation Plantations platform manage more than 2 million hectares of land in the Atlantic forest biome, following sustainability principles set out by third-party certification schemes (Silva, Freer-Smith and Madsen, 2019). About half this area is planted with eucalyptus, primarily planted on former grazing land that had become heavily degraded. The rest is set aside for conservation. The companies have already restored tens of thousands of hectares, contributing to landscape-scale initiatives to reconnect forest fragments and secure the Atlantic rainforest’s future.
At the same time, the mean productivity (wood produced per hectare) of Brazilian eucalyptus has more than doubled since 1970 as the result of research and development in genetic improvement and forest management. This means that these plantations are some of the world’s most productive in terms of wood, while at the same time their owners manage and enhance the biodiversity in the landscape.
An increasing amount of research show evidence that forests managed by indigenous peoples and local communities are at least as effective at maintaining forest cover as those under stricter protection regimes (Porter-Bolland et al., 2012, Stevens et al., 2014; Blackman et al., 2017; Blackman and Veit, 2018, Tauli-Corpuz, Alcorn and Molnar, 2018). Community-managed forests outside protected areas can deliver not only improved forest cover but also other conservation benefits such as maintenance or increases in wildlife populations, as has been demonstrated in Australia, Brazil and Canada (Schuster et al., 2019), in Nepal (Anup, 2017) and in the United Republic of Tanzania (Case Study 6).
The United Republic of Tanzania has about 48.1 million hectares of forests covering approximately 55 percent of the total land area. Woodlands provide 95 percent of the country’s energy, both rural and urban, and 75 percent of the country’s materials for construction. Forests also provide various non-wood products and are important for water catchment. However, the forests are under intense pressure from human settlements, illegal logging, charcoal production, fires, mining and infrastructure development, which is leading to an estimated 372 816 hectares of forests being cleared each year (MNRT, 2015).
In its Nationally Determined Contribution to address climate change, the United Republic of Tanzania has recognized the importance of forests for both climate change adaptation and reaching the country’s emissions reductions goal. The country’s NDC is one of the few that emphasizes upscaling participatory forest management (PFM), along with coordinated implementation of REDD+ actions and strengthened protection and conservation of natural forests.
The United Republic of Tanzania has one of the most progressive legal frameworks for customary land rights recognition and PFM in Africa. Customary land rights are recognized within the boundaries of villages, and PFM has been mainstreamed as a government programme. In total, communities own almost 22 million hectares of forest land. PFM is most prevalent in the Miombo woodlands, which are estimated to account for more than 90 percent of the country’s forested land (Lupala et al., 2015).
Areas under PFM have seen a reduction in uncontrolled logging and other forest disturbances; a noticeable recovery of forest condition; a decrease in soil erosion and overgrazing and an associated improvement in water quality and quantity; reoccupation of beehives; and an overall increase in wildlife abundance (Patenaude and Lewis, 2014). Open-access forest areas, in contrast, are subject to unsustainable practices such as agricultural expansion, wildfires, excessive livestock grazing and illegal harvesting of timber and NWFPs (Blomley et al., 2008; Burgess et al., 2010).
The recognition of customary lands and the framework allowing devolution of land and resource rights to the local level, in keeping with the Voluntary Guidelines on the Responsible Governance of Tenure (FAO, 2012b), have given local people the autonomy to manage their own resources. Allowing communities to form their own governing bodies and make their own rules is the first step in empowering local people to manage forests and other natural resources sustainably. For example, collective management of the coastal village forest reserves in Bagamoyo District has avoided a range of threats, including unsustainable hunting, mining and wood extraction for timber, poles, charcoal and handicrafts, and thus deforestation within the reserves has been limited (see Figure A).
However, the PFM programme in the United Republic of Tanzania has not yet met its full potential in terms of contributing to livelihoods. Challenges include delays in implementation, lack of recognition of indigenous peoples, limited devolution of rights (especially in joint forest management) and difficulty in engaging pastoralists. While advances have been made in recognizing collective tenure rights, some larger forest governance issues still need attention, including incentive systems, strengthening of community institutions and increased investment and human resources.
Members of the Chaga tribal community in Shamble Juu village, United Republic of Tanzania.
©FAO/Felipe RodriguezMany assessments have also been conducted on the impacts of conservation and development projects on local communities (Plumptre et al., 2004; West, Igoe and Brockington, 2006; Sayer et al., 2007). However, not many studies consider outcomes for both conservation and local communities, and in practice demonstrable win–win solutions are rare (Southworth, Nagendra, and Munroe, 2006; Chan et al., 2007; McShane et al., 2011). Some of the shortcomings that have been identified include predetermined conservation goals and non-negotiable reserve boundaries (Sharpe, 1998); limited transfer of powers to local institutions (Ribot, 2002); resource capture by elites when forest management is decentralized (Persha, Agrawal and Chhatre, 2011); limited exclusion rights; and vulnerability of such programmes to shifting government policies and uncertain support (RRI, 2015).
The harvest and consumption of wildlife remain critical to the food security, health, cultures and livelihoods of millions of people. Unregulated hunting is a major cause of loss of certain species (see Chapter 3). However, contrary to the views of many, sustainable use is a proven mechanism for wildlife conservation. Indeed, in some places, consumptive wildlife users remain the primary contributors to wildlife management and state-run conservation efforts (Case Study 7).
Wildlife in the United States of America and Canada was relatively abundant when the first European settlers arrived, but by the late nineteenth century many species had become endangered or extinct through commercial exploitation. Numbers of American bison (Bos bison), for example, were reduced from more than 20 million to about 1 000 by 1889. By 1902, the passenger pigeon (Ectopistes migratorius), which had once numbered at least 3 billion, had become extinct in the wild. Other threatened species included elk (Cervus canadensis), mule deer (Odocoileus hemionus), white-tailed deer (Odocoileus virginianus), wild turkey (Meleagris gallopavo), wood duck (Aix sponsa) and pronghorn antelope (Antilocapra americana). A sense of social responsibility in the face of this resource crisis led to the rise of a resource-use philosophy based on citizen responsibility and natural limits, which eventually developed into a systematic arrangement of conventions, policies and laws known as the North American Model of Wildlife Conservation (US Fish and Wildlife Service, 2018; Mahoney and Geist, 2019). This model is based on seven main elements:
▸ Wildlife is a public trust resource.
▸ Elimination of markets for game: Commercial hunting and the sale of wildlife are prohibited to ensure the sustainability of wildlife population.
▸ Wildlife is allocated to the public by law (and not, for example, by market principles or landownership).
▸ Wildlife should only be killed for a legitimate purpose (food, fur, self-defence and the protection of property, including livestock); it is broadly regarded as unlawful and unethical to kill fish or wildlife (even with a licence) without making all reasonable effort to retrieve and make reasonable use of the resource.
▸ Wildlife is considered an international resource.
▸ Science is the proper tool for discharge of wildlife policy.
▸ Democracy of hunting, i.e. open access – as a result of which, hunters are large contributors to conservation funding.
This model has facilitated significant recoveries of both harvested and non-harvested wildlife species alongside sustainable consumption since the early twentieth century. Striking examples of this recovery include the wild turkey and white-tailed deer, both of which were important resources for indigenous peoples prior to colonization and both once having populations estimated at 10 million or more.
By the early twentieth century, populations of wild turkey had been reduced to 200 000 through unregulated hunting and habitat loss. Hunting organizations pushed for early legislation that facilitated wild turkey conservation and research. Initial attempts at restoration based on release of pen-reared birds proved largely unsuccessful. Improved capture techniques were later developed to trap wild birds which could then be transferred to suitable, unoccupied habitats. Beginning in 1986, a complex system of state-to-state transfer of birds was initiated. Today, wild turkey populations have recovered to near precolonial abundance, estimated at 7 million birds in 2013. Wild turkeys are now found in self-sustaining populations in 49 of 50 states in the United States of America, six Canadian provinces and central and eastern Mexico (Hughes and Lee, 2015).
White-tailed deer was similarly vulnerable to market hunting and habitat loss, and its population was reduced to 500 000 animals by the end of the nineteenth century. Hunters responded by promoting and helping to enforce hunting regulations, transplanting deer and funding conservation and management programmes. Many deer hunters even bought or leased land on which deer populations could be protected or propagated. Early reintroductions of deer to unoccupied habitats in eight states in the United States of America were conducted by private individuals wanting to establish deer herds that could eventually be hunted. Today, there are an estimated 30 million white-tailed deer in the United States of America and approximately 400 000 in Canada. The species is now the most popular big game animal in North America and remains an important food source, especially in rural communities.
To complement CBD Decision 14/7 on sustainable wildlife management (CBD, 2018b), the Center for International Forestry Research (CIFOR) and CBD, in collaboration with members of the Collaborative Partnership on Wildlife, put forward the following set of recommendations for the sustainable use of wild meat (Coad et al., 2019):
▸ Create an effective enabling environment. This may involve:
— revision of national hunting laws, in consultation with a broad group of stakeholders, to ensure that they consider both food security and conservation concerns and can be fairly and practically enforced;
— devolution of land tenure to indigenous peoples and local communities, with the support of a national enforcement agency; and
— development of regional and national wild-meat monitoring frameworks to foster evidence-based policymaking.
▸ Manage rural supply and reduce urban demand for wild meat. Interconnected interventions in the commodity chain can include community- or co-managed protected areas, wildlife ranching and community conservancies, payment for ecosystem services (PES) schemes and certification mechanisms. Companies involved in timber harvesting, mining or extensive agriculture in forest habitats must take steps to ensure the sustainability of wild-meat harvest and use within their concessions by providing food alternatives (such as meat from livestock) for their staff, helping to enforce equitable hunting regulations in collaboration with local communities and preventing the use of concession roads and vehicles by external commercial hunters. In newly urbanizing areas, where nearby wildlife populations are severely depleted but alternatives to wild meat are not widely available, governments and development agencies should help to develop viable alternative foods, such as meat from livestock. In large metropolitan areas where wild meat is generally consumed as a luxury product, interventions may include targeted campaigns to change consumer behaviour, alongside adequate enforcement of laws governing the trade of wild meat. One possible option for ensuring food security and nutrition, sustained local income and environmental health is to bolster the sustainable management of fast-producing wild species.
▸ Promote evidence-based participatory management. Projects set up to manage wildlife for meat must be carried out with full community engagement and consent. Furthermore, they must be designed to incorporate a theory of change and monitoring and evaluation for adaptive management, so that project successes and failures can inform future management interventions.
Since October 2017, a consortium of partners, including FAO, CIFOR, WCS and the French Agricultural Research Centre for International Development (CIRAD), has been implementing a seven-year Sustainable Wildlife Management Programme. This programme aims to halt unsustainable wildlife hunting, conserve biodiversity and natural heritage and strengthen people’s livelihoods and food security in 12 African, Caribbean and Pacific countries. In each country, the programme aims to improve the institutional and legal framework for the sustainable use of meat from wild species resilient to hunting or fishing, as well as the management of these wild species; to increase the supply of alternative protein; and to reduce the consumption of wild meat to sustainable levels. The programme emphasizes the importance of monitoring, evaluation, learning and knowledge for eventual upscaling. The initiative is funded by the EU.
Wildlife management also entails dealing with human–wildlife conflicts, particularly when there are no fences around protected areas in order to allow for migration of wildlife species. See Box 51.
Human–wildlife conflict (HWC) occurs when animals pose a direct and recurring threat to the livelihood or safety of people, often leading to the persecution of that species. In many regions these conflicts have intensified as a result of human population growth and changes in land use. In general, the consequences of HWC include destruction of crops, reduced farm productivity, competition for grazing lands and water, livestock predation, injury and death to farmers, damage to infrastructure and increased risk of disease transmission from wildlife to livestock. HWC often triggers negative sentiments towards conservation, especially when protected areas are being established or expanded.
HWC is of major concern to wildlife conservation and human well-being in Africa. For example, in 2017 more than 8 000 HWC incidents were reported in Namibia alone (World Bank, 2019). Hyenas killed more than 600 cattle in the Zambezi Region of Namibia between 2011 and 2016 and there were more than 4 000 incidents of crop damage, mostly caused by elephants moving through the region (NACSO, 2017a). HWC has also become a major problem in many countries in Asia and the Pacific. In Sri Lanka, for example, each year as many as 80 people are killed by elephants and more than 230 elephants are killed by farmers. The Sri Lankan elephant is listed as endangered, and only 2 500–4 000 individuals remain in the wild (IIED, 2019).
With specific reference to forests, a high density of large ungulates, for example deer, can cause severe damage to the forest and can threaten regeneration by trampling or browsing small trees, rubbing themselves on trees or stripping tree bark. This behaviour can have important economic implications and can lead to polarization between forest and wildlife managers (CPW, 2016).
Many responses have been developed to prevent and mitigate HWC, broadly categorized as lethal and non-lethal. They range from methods that require expensive infrastructure (e.g. electric fences) and government involvement (e.g. compensation and insurance schemes) to methods that can be carried out by individuals with low-cost tools (e.g. guarding of livestock, burning chilli pepper bricks) (Nyhus, 2016). Beehive fences, which are relatively affordable to build and maintain, are an innovative approach to human–elephant conflict that has been willingly adopted by farmers in Kenya. These fences are a natural deterrent that takes advantage of elephants’ instinctive avoidance of African honey bees while providing pollination services and “elephant-friendly” honey (King et al., 2017; Save the Elephants, 2019).
To grapple with the challenge, many countries are starting to explicitly include HWC in national policies and strategies for wildlife management, development and poverty alleviation. At the national level, cross-sectoral collaboration between forestry, wildlife, agriculture, livestock and other relevant sectors is key. FAO actively supports the efforts of member countries to better manage HWC by facilitating cross-sectoral dialogue, providing technical assistance in the development of national policies and legal frameworks and helping to share information on good practices and tools. For example, an HWC toolkit was developed in 2010 (Le Bel, Mapuivre and Czudek, 2010) for use by farmers and local communities in southern Africa and has now been adapted and translated into French for use in Central Africa (Nguinguiri et al., 2017).
Beehive fence in Kenya.
©Lucy KingAt the global level, Aichi Biodiversity Target 11 (to protect at least 17 percent of terrestrial area by 2020) has been exceeded for forest ecosystems as a whole, as evidenced both in the figures reported to FRA 2020 and in the study prepared by UNEP-WCMC for this volume. No attempt has been made to assess the overall effectiveness of forest protected areas, but given the 53 percent decline in the forest-specialist index between 1970 and 2014 (see Measuring forest vertebrate population trends), there is undoubtedly room for improvement.
In terms of “ecologically representative and well connected systems of protected areas,” the analysis of protected areas by global ecological zone (see New studies on trends in protected areas) indicates that less than 10 percent of subtropical humid forest, temperate steppe and boreal coniferous forest is currently protected.
Other areas that should be given high priority include areas with high values for both biodiversity significance and intactness, such as the northern Andes and Central America, southeastern Brazil, parts of the Congo Basin, southern Japan, the Himalayas and various parts of Southeast Asia and New Guinea (Figure 22).
Limited progress has been made on classifying specific forest areas as OECMs given that this is a recent concept, but guidance on this category is being developed and it has significant potential for forests.
As seen in the case studies in this chapter, original approaches to forest biodiversity conservation, both within and outside protected areas, demonstrate some measure of success in achieving a balance of positive biodiversity and socio-economic outcomes, perhaps offering opportunities for upscaling or replication. Common elements underlying successful outcomes include participatory approaches, attention to property rights, cross-sectoral approaches (also referred to as territorial or landscape approaches) and capacity-building. Economic approaches that result, directly or indirectly, in positive effects on local revenues or business opportunities can also play an important role in incentivizing positive biodiversity outcomes.
Sustainable forest management, as embedded in the United Nations Forest Instrument (United Nations General Assembly, 2008; UNDESA, 2016), includes forest biological diversity as one of its seven thematic elements.1 When successfully applied, it ensures positive results in terms of both conservation and socio-economic development outcomes. SDG Indicator 15.2.1 (Progress towards sustainable forest management) (see Box 52) is not easy to measure as no single quantifiable and measurable characteristic can fully describe the many social, environmental and economic dimensions of sustainable forest management. Recognizing this, FAO worked with partners to develop a methodology for reporting on this indicator, and a set of five sub-indicators was established to measure progress:
▸ forest area annual net change rate;
▸ above-ground biomass stock in forest;
▸ proportion of forest area located within legally established protected areas (indicating actions taken to protect and maintain biological diversity and other natural and cultural resources);
▸ proportion of forest area under a long-term forest management plan (indicating the intention to manage the forest for long-term purposes); and
▸ forest area under an independently verified forest management certification scheme (providing further qualification of the forest management).
▸ Sustainable Development Goal 15.2: By 2020, promote the implementation of sustainable management of all types of forests, halt deforestation, restore degraded forests and substantially increase afforestation and reforestation globally.
— SDG 15.2.1 Progress towards sustainable forest management.
▸ Aichi Biodiversity Target 7: By 2020, areas under agriculture, aquaculture and forestry are managed sustainably, ensuring conservation of biodiversity.
▸ United Nations Strategic Plan for Forests Goal 3: Increase significantly the area of protected forests worldwide and other areas of sustainably managed forests, as well as the proportion of forest products from sustainably managed forests.
— Target 3.2 The area of forests under long-term forest management plans is significantly increased.
The first three address the environmental values of forests, while the last two consider all dimensions of sustainable forest management, including the social and economic aspects. Data for the first four sub-indicators are collected through the FRA country reporting process, while data on certified forest area are obtained from the main certification bodies. For each indicator, a detailed description of definitions and methodology is provided in the SDG metadata repository (UN, 2020). The result is presented as a dashboard showing progress for each sub-indicator. While progress has been made on the last three of the sub-indicators, the first two are showing negative trends at the global level due to the net loss of forest area.
With regard to Target 3.2 of the United Nations Strategic Plan for Forests 2017–2030 (UN, 2017a) (see Box 52), figures reported to FRA 2020 indicate that the area of forest under long-term management plans has increased significantly in the past 30 years to an estimated 2.05 billion hectares (equivalent to 54 percent of the global forest area) in 2020 (FAO, 2020).
While the previous chapters indicate that progress is being made in conserving forest and forest biodiversity, the widespread loss of biodiversity continues to pose a serious risk to human well-being and security. In assessing a range of interactions among SDGs, IPBES (2019a) found that current negative trends in the status of biodiversity and ecosystems will undermine progress towards 80 percent (35 out of 44) of the SDG targets assessed. Thus, at issue are not only the effects of economic development activities on biodiversity but also the effects of biodiversity (or rather, biodiversity loss) on economic development.
This chapter looks at the trade-offs and synergies between biodiversity conservation and other sustainable development goals and provides examples of successful approaches. It further outlines some of the key elements of an enabling environment for balanced solutions and presents some innovative tools to help monitoring progress.
SOFO 2018 highlighted the potential contributions of forests to the SDGs, and a recent publication by the International Union of Forest Research Organizations’ Special Project on World Forests, Society and Environment (Katila et al., 2019) analyses the impact of the SDGs on forests. Both documents highlight the crucial role of forests in meeting the SDGs. While the different SDGs are interlinked and indivisible and actions that harness strong synergies between SDGs are mutually reinforcing, there may be trade-offs in the short term.
Three key messages in Katila et al. (2019) are particularly pertinent:
Human needs shape the value people place on forests. Given that people and their interests are very diverse, the implementation of one or more SDGs will, in many cases, result in both winners and losers, depending on the impacts on forests.
The assumption of an a priori positive correlation between forest conservation and societal development is misleading. Increasing the forest area is not always the best answer to complex development needs and while fulfilment of some of the SDGs might result in forest loss, this may drive social and economic development, e.g. through agricultural expansion or more space for housing and infrastructure.
It is crucially important that potential trade-offs implicit in the SDGs with respect to forests and other land uses are understood and are fully accounted for in societal and policy decisions. This must include thinking across different scales and generations. It must also include giving voice to forest-dependent people, who are at risk of being disregarded by efforts meant to advance the SDG agenda.
Loss of biodiversity tends to take a heavier toll on people who are already disadvantaged, particularly the poorest people, women, children and indigenous peoples. In areas where the losses threaten survival of people, such degradation often exacerbates conflict or migration and becomes a security issue. Biodiversity decline increasingly also threatens food security and nutrition (FAO, 2019a). As mentioned in Chapter 4, food production relies on the integrity of forests for vital ecosystem services that support sustainable agriculture and the resilience of agricultural systems in adapting to a changing climate. Yet at the same time, agricultural expansion is the biggest threat to forest ecosystem integrity, and deforestation is the main contributor of greenhouse gas emissions caused by agriculture, forestry and other land uses, which together account for 23 percent of all anthropogenic emissions (IPCC, 2019). Solutions to biodiversity loss therefore need to accommodate not only the needs of forests and adjacent populations, but also the needs of farmers, who are also, in the broad sense, forest-dependent people. For both biodiversity and people, climate change leads to broader ecosystem and habitat changes, increasing risks of damage and loss.
Dealing with the multiple inherent trade-offs between the SDGs is challenging, but at least emerging assessment frameworks make them more explicitly visible and provide ideas to policymakers on how to tackle different types of interactions (e.g. Nilsson, Griggs and Visbeck, 2016).
Ensuring positive outcomes for both biodiversity and people entails working with all stakeholders to find a realistic balance between conservation goals and demands for resources that support livelihoods (Kaimowitz and Sheil, 2007). This may mean, in some places at least, accepting standards that are lower than would be dictated by traditional conservation of untouched habitats but that may be sufficient to maintain essential ecosystem services and biodiversity while meeting local needs (in terms of resources, livelihoods and empowerment) sufficiently to help foster more positive attitudes towards protected areas and other conservation measures. Truly participatory approaches that empower local people, combined with incentives to develop alternative resources, can support more-sustainable forest management favouring both people and conservation.
Although few cases have successfully balanced biodiversity conservation and local livelihood needs (Hoffmann et al., 2012), this edition of SOFO presents some positive examples that show that it is possible.
As shown in Case Study 8, market tools such as organic and fair-trade standards can incentivize sustainable ecosystem management; this allows local people to reap economic benefits from forest products (in this case medicinal plants) while maintaining habitats for vulnerable wildlife (in this case the giant panda). Similar pathways could be explored with other wild plants and animals that share landscapes in other parts of the world – for example, baobab (Adansonia digitata) with endangered African bush elephants (Loxodonta africana) in eastern and southern Africa; American ginseng (Panax quinquefolius) with wood thrush (Hylocichla mustelina) in the United States of America; and Indian nard (Nardostachys grandiflora) with snow leopards (Panthera uncia) in Nepal (Jenkins, Timoshyna and Cornthwaite, 2018).
Despite the gains made from plant domestication, it is estimated that 60 to 90 percent of marketed medicinal and aromatic plant (MAP) species are still collected from the wild. Wild plants collected in and near forests provide important raw materials for the health care, cosmetic and food sectors, supporting the livelihoods of millions of people. However, overharvesting, land conversion and pollution are a major threat to wild species and their collectors in many regions of the world: One in five MAP species is threatened with extinction (Jenkins, Timoshyna and Cornthwaite, 2018).
Many wild plants share landscapes with other threatened species. Thus, sustainable wild harvesting and trade in plant ingredients underlies holistic management for other species and ecosystems at large.
China is a leader in international trade of MAPs, accounting for a reported export volume of 1.3 million tonnes valued at USD 5 billion in 2013 (15.6 percent of the world’s exports of MAPs). Wild-collected material may have contributed as much as USD 1.8 billion of this value (ITC, 2016). Most of this trade is linked to resources used in traditional Chinese medicine, over 70 percent of which come from wild medicinal plants. Chinese licorice (Glycyrrhiza uralensis), caterpillar fungus (Cordyceps sinensis), Barbary wolfberry or goji (Lycium barbarum), Poria cocos mushroom and Ligusticum jeholense root alone have an export value of USD 180 million a year.
In villages of the Upper Yangtze ecoregion, sale of medicinal plants contributes up to 60 percent of household income (Jenkins, Timoshyna and Cornthwaite, 2018). A decade of experience in the region with a panda-friendly model for conservation of Southern magnolia vine (Schisandra sphenanthera) has provided strong evidence that standards and norms can be effective in promoting sustainable resource management while boosting incomes and health of local and rural communities, particularly those that are poor and marginalized (Brinckmann et al., 2018).
The vine is found in deciduous mountain forests that also provide habitats for the giant panda (Ailuropoda melanoleuca). Its berries are used in the indigenous medicine of ethnic minorities in Sichuan as well as in traditional Chinese medicine. The EU–China Biodiversity Programme on Sustainable Management of Traditional Medicinal Plants supported the application of existing sustainability standards such as the United States Department of Agriculture’s wild crop harvesting practice standard (USDA, n.d.b) and FairWild (FairWild Foundation, 2019), and the development of new Standards for Giant Panda Friendly Products (WWF China, 2012). Collectors were also trained in methods for sustainable harvesting of Schisandra berries; for example, they learned to pick berries from the lower two-thirds of the vine, leaving the rest for birds and wildlife that spread the seeds through the forest. The application of the standards attracted long-term fair-trade agreements between the newly formed local trading cooperative and international companies, generating prices 30 percent higher than before. The model was expanded to 22 villages, increasing the number of households involved from 48 to 300, with a sixtyfold increase in wild Schisandra harvesting since 2009 to 30 tonnes of dried berries in 2017 (see Figure A).
Increased income provided communities with an incentive to harvest the berries sustainably and to maintain secondary forest habitats outside giant panda conservation areas (Brinckmann et al., 2018). The giant panda population has now stabilized and is even increasing in parts of its range (Sichuan Forestry Department, 2015, cited in Brinckmann et al., 2018), and its status on the IUCN Red List has shifted from Endangered to Vulnerable.
Panda climbing on tree.
Photo by Zoe Nicolaou on UnsplashA similar approach has been taken in the Western Ghats of India, where a project to apply the FairWild standard (FairWild Foundation, 2019) (currently the most comprehensive certification system for wild-sourced fungi, lichen and plants, excluding timber) has encouraged local communities, including Mahadev Koli tribal people, to harvest and sell the fruits of Terminalia chebula and Terminalia bellirica instead of harvesting the trees for fuelwood. The project has safeguarded about 2 000 T. chebula trees and 500 T. bellirica trees, thus protecting nesting and roosting sites of two of the region’s most spectacular birds, the great hornbill (Buceros bicornis) and Malabar pied hornbill (Anthracoceros coronatus) (Jenkins, Timoshyna and Cornthwaite, 2018; Yearsley, 2019).
As demonstrated in Case Study 9, truly integrated landscape conservation and management approaches have multiple benefits, not only for biodiversity and socio-economic development (such as income diversification, employment and women’s empowerment), but also for the continued provision of other ecosystem services such as safeguarding water resources, erosion protection and mitigating disaster risks. Such approaches embody the concept of sustainable forest management.
A participatory resilient watershed management project in Morocco illustrates how the reduction of disaster and climate risks faced by communities can reduce poverty while increasing biodiversity.
The Haute Moulouya Basin, located between High Atlas and Middle Atlas mountains in Morocco, is prone to water erosion, flooding and land degradation owing to its fragile terrain, arid climate and the silvopastoral and agricultural activities of its rural communities and neighbouring urban areas. Between 1970 and 2010, tree cover decreased by more than 30 percent and erosion rate increased by more than 60 percent. From 1995 to 2011, Outat river flooding events caused damage and losses valued at approximately USD 5.4 million.
A project implemented in two phases over nine years (2010–2019) applied a landscape and risk perspective to integrated watershed management in the Basin. For the site selection, a hazard and risk assessment was carried out to identify the locations with the highest risk. Risk-based co-management plans of two basins, covering approximately 160 000 hectares, were prepared, discussed and agreed upon at the provincial and community levels. The plans included structural measures, such as gully and sediment control on 400 hectares, and non-structural erosion control measures, such as reforestation and revegetation of denuded slopes.
The project restored 480 hectares of forest and pastureland through fencing, rehabilitation and agroforestry. Restoration included fencing of forests of native Quercus rotundoflia and Atlas cedar (Cedrus atlantica) and planting of Fraxinus dimorpha. Positive biodiversity outcomes included the natural regeneration of Phoenicean juniper (Juniperus phoenicea), cade juniper (Juniperus oxycedrus), Hertia maroccana, rosemary (Salvia rosmarinus) and other native shrubs.
The project addressed poverty and malnutrition in the communities through a range of income-generation programmes, including:
▸ planting of native medicinal plants;
▸ production of certified apple vinegar;
▸ distribution of beehives to nine cooperatives, generating 8 700 litres of honey in 2018 for a net revenue of USD 174 000;
▸ support for a women’s cooperative producing aromatic and medicinal plants such as rosemary, lavender, sage and rose, reaching an annual production of 850 litres of essential oils; and
▸ fruticulture, dairy processing and livestock programmes.
In addition to enhancing agrobiodiversity, these programmes supported income diversification, rural youth employment and women’s empowerment.
Community buy-in and initiative were instrumental to the success of the project. The cooperatives, communities and individuals involved in the project were willing to adopt innovative technologies and methodologies and have built on the project’s initial investments, taking ownership of the initiative. In most cases, operations have expanded. The medicinal-plant cooperative, for example, started a nursery to sell its plants and to ensure a consistent supply for its essential oil production.
The project demonstrated the necessary steps for considering risk at each stage of integrated watershed management, including the selection of sites, integrated watershed planning and project implementation. The communities saw that the measures were effective, and they have replicated the interventions at their own initiative. Innovative techniques, such as mechanical erosion control, are now also being implemented in other areas.
Herbal oil produced by Eljazera Women’s Cooperative for the Production and Valorization of Aromatic and Medicinal Plants.
©Yuka Makino/FAODespite decades-long efforts to establish and strengthen global governance frameworks concerning biodiversity, and despite some progress having been made, as described in this volume, it is evident that conservation goals set through the SDGs, the CBD and other global commitments and frameworks cannot be met by continuing current trajectories (IPBES, 2019a; UNEP, 2019).
Effective governance is critical for biodiversity conservation and seems to be the most important factor defining success in biodiversity-oriented policies (Baynham-Herd et al., 2018). While corruption and trade are widely recognized as crucial challenges for forest biodiversity, other aspects related to forest use, tenure rights and locus of decision-making also play a role in defining the enabling environment for biodiversity conservation.
With biodiversity underpinning sustainable development and with most of the threats to forest biodiversity originating outside the forest sector, it is imperative that all countries develop and implement a cross-cutting strategy to meet their biodiversity targets and integrate them with their efforts to meet Agenda 2030 and the SDGs.
To be effective, this cross-cutting strategy must include a goal-focused policy alignment between sectors and administrative levels.
Integrated land-use planning at national and subnational level, carried out in consultation with relevant stakeholders, is another crucial requirement and should include scenario development, the identification of priorities for additional protected areas – keeping in mind the need to target under-represented ecosystems or forest types, areas with high-biodiversity significance and intactness and key species or groups of species – as well as priority areas for restoration, creation of biological corridors and sustainable management of existing forests. The spatial analyses and assessments described in Chapters 2, 3, 5 and 6 can be relatively easily replicated at national and subnational level.
Coherent fiscal policies are needed if land-use patterns are to change – including first and foremost a review of agricultural subsidies, given that agriculture is the biggest driver of deforestation.
It is estimated that agricultural production needs to increase by 50 percent by 2050 relative to 2013 to meet the demands of a rapidly increasing human population and changing food habits in a scenario of modest economic growth (FAO, 2017e). Without a change in current ways of producing and consuming food, such an increase in production is likely to have a significant adverse effect on forests and biodiversity. Ensuring commitments to deforestation-free commodity chains, reducing food losses and waste, restoring the productivity of agricultural lands, adopting agroforestry and sustainable agricultural production practices and embracing diets that reduce demand for land conversion can all help mitigate negative impacts (see e.g. FAO, 2019a; FAO, 2019j; IPCC, 2019 and Willett et al., 2019. SOFO 2016 provided seven case studies showcasing how some countries have been able to simultaneously increase both food security and forest cover. See FAO (2016b) for the lessons learned. See also Forest and Land Use Coalition (2019) and Box 53 for transitions needed to move towards more sustainable agriculture and food systems.
In the recent authoritative assessment on the state of biodiversity in the context of food and agriculture (FAO, 2019a), the driver mentioned by the highest number of countries as having negative effects on regulating and supporting ecosystem services is changes in land and water use and management. Loss and degradation of forest and aquatic ecosystems and, in many production systems, transition to intensive production of a reduced number of species, breeds and varieties, remain major drivers of loss of biodiversity and ecosystem services. Key ecosystems that deliver numerous services essential to food and agriculture are declining rapidly.
The same assessment finds that the use of management practices and approaches regarded as favourable to the sustainable use and conservation of biodiversity for food and agriculture is increasing. Eighty percent of reporting countries indicate that one or more of a list of biodiversity-focused practices are being used in one or more types of production system (ibid.).
The sustainable use and conservation of biodiversity for food and agriculture call for approaches in which biodiversity is managed in an integrated way in the context of production systems and their surrounding landscapes. This requires in situ or on-farm management integrated into strategies at ecosystem or landscape levels, including crop-tree systems such as for shaded cocoa or coffee production, evergreen agriculture, silvo-pastoral or agro-silvo-pastoral systems, or biodiversity-friendly aquaculture in mangrove forests.
A range of pathways emerge that make agriculture and food systems more sustainable through integrated approaches, including mainstreaming of biodiversity. FAO recently launched a new vision for and approach to promoting sustainable food and agriculture that requires explicit consideration of cross-sectoral (e.g., crops, livestock, fisheries, aquaculture and forestry) and multi-objective (e.g., economic, social and environmental) policies and instruments, identifying possible synergies as well as balancing trade-offs between them (FAO, 2019j). At the core of that approach are five principles, endorsed by Member States in 2016:
▸ improved efficiency of the resources used in food and agriculture;
▸ direct action to conserve, protect, and enhance natural resources;
▸ protection and improvement of rural livelihoods, equity, and social well-being;
▸ enhanced resilience of people, communities, and ecosystems; and
▸ responsible and effective governance mechanisms.
SOURCE: FAO, 2019a; FAO, 2019j.
Reconciling food production and biodiversity conservation can be achieved through either land-sparing approaches, in which high-yielding agriculture in one area helps to spare other areas for nature conservation , or land-sharing approaches, where production and biodiversity conservation are integrated on the same piece of land, such as in productive agroforestry systems (Phalan et al., 2011). The latter can bring multiple benefits both for biodiversity and for farmers, including shade and microclimate regulation, soil fertility, disease control and income diversification in the face of climate, disease and market risks (Schroth et al., 2004).
Policies and practices of large agricultural companies also need to be aligned with biodiversity conservation goals. The New York Declaration on Forests, first endorsed in 2014, was a major milestone in this regard, linking efforts of governments, companies, civil society and indigenous peoples’ organizations to eliminate deforestation. However, as emphasized in its Five Year Assessment Report (NYDF, 2019), efforts to date have been inadequate to achieve systemic change. Similarly, an initiative tracking corporate commitments to deforestation-free supply chains (Forest Trends, 2017; Ceres, 2019) has shown that much more needs to be done, particularly for the four commodity chains that are the biggest drivers of deforestation and forest change (Figure 43).
As suggested by participants at the global conference “Working Across Sectors to Halt Deforestation and Increase Forest Area: From Aspiration to Action” (Box 38), “Agri-business should meet its commitments to zero-deforestation from the production and processing of agricultural commodities by 2020. Companies that have not made zero-deforestation commitments should do so. Commodity investors should adopt business models that are environmentally and socially responsible and involve and benefit local/community producers, distributors and other value chain actors through, for example, extension programmes and the joint design of sustainable land-use plans on corporate land.”
The Principles for Responsible Investment in Agriculture and Food Systems endorsed by the Committee on World Food Security in 2014 (CFS, 2014) is an important reference is this regard.
Some agricultural banks are leading the way, setting up funds, offering loans, technical assistance and other de-risking instruments, and deploying blended finance (the use of development finance or philanthropic money to mobilize private capital flows to emerging and frontier markets) to support investments in sustainable agriculture (see also Leveraging private finance in the following pages).
Land-tenure security underpins the potential for success of biodiversity conservation initiatives. While the majority of the world’s forests are publicly owned, an estimated 1.5 billion local and indigenous peoples have secured rights over forest resources through community-based tenure, and these local groups manage about 18 percent of the world’s forest area (RRI, 2015). Where such rights are effectively enforced, countries across Africa, Asia and Latin America are witnessing lower deforestation rates. A recent study in Peru, for example, found indications that giving indigenous communities title to land reduces forest clearing and disturbances soon after a title is awarded, in part through heightening formal and informal regulatory pressure on and within the communities involved (Blackman et al., 2017). See also Mainstreaming biodiversity in community-managed forests in Chapter 6.
Clearing of forests for agriculture to establish land tenure is still a common practice in many parts of the world, often on customary or public lands that are not well demarcated and are under weak management. Customary leaders or the state may prevent this activity by providing alternative lands to farmers or, where land is scarce, by providing long-term conditional land leases allowing users to practice agroforestry or other land and resource use compatible with biodiversity conservation. For example, this approach was successfully implemented in Lampung Province of Sumatra, Indonesia; poor farmers received 25-year leases to use state forest for agroforestry under the community forestry or Hutan Kamasyarakatan programme. The programme resulted in increased planting of timber and other multipurpose trees, as well as investments in land and management of soil fertility. Satellite imagery has shown a decrease in forest loss and an increase in the area under agroforestry in the programme sites (Kerr, Pender and Suyanto, 2008).
Securing local tenure rights presents an enormous opportunity for effective conservation at relatively low cost (Ding et al., 2016) – a solution that is not only socially just, but that also can reduce conflict (Tauli-Corpuz, Alcorn and Molnar, 2018) and, if implemented well, can simultaneously contribute to several SDGs.2 Land and forest rights can be negotiated to emphasize those that contribute to biodiversity conservation. However, interventions associated with securing local tenure rights require a careful review of the political, economic and legal context, as emphasized in FAO’s Voluntary guidelines on the responsible governance of tenure of land, fisheries and forests in the context of national food security (FAO, 2012b).
As a result of the adoption by many countries of the Indigenous and Tribal Peoples Convention in 1989 (ILO, 2017) and the near-universal approval of the 2007 United Nations Declaration on the Rights of Indigenous Peoples (UN, 2008a), increasing numbers of countries are giving legal recognition to the land and forest rights of indigenous peoples and local communities through legal and constitutional reforms. Several of these (e.g. Australia, Brazil, Colombia, Ecuador, India, Peru, the Philippines, South Africa and the United States of America) provide explicitly for recognition of such rights inside protected areas (RRI, 2015).
Free, Prior and Informed Consent (FPIC), a specific right that pertains to indigenous peoples, is recognized in a series of legal international instruments including the Indigenous and Tribal Peoples Convention, the United Nations Declaration on the Rights of Indigenous Peoples and the Convention on Biological Diversity. The right to FPIC not only allows indigenous peoples to grant or withdraw consent for a project at any stage, but also includes the right to determine what type of process of participation, consultation, and decision-making is appropriate.
Some countries provide for voluntary inclusion of community (and private) lands in protected areas and provide certain benefits to compensate for restriction of rights, such as protection from third-party encroachment and government allocation of concessions, sharing of tourism revenues or other financial or technical assistance; an example is the Indigenous Protected Areas Programme in Australia (Davies et al., 2013).
Many other countries do not recognize local community rights in protected areas but have adopted a variety of co-management systems on public and community-owned lands, hence targeting both conservation and development needs. Rights of communities may include some access, use and management rights. Co-management arrangements can provide local communities a way to maintain use and management rights to large contiguous areas of land held under customary rights. However, they tend to be highly centralized, and most initiatives fail to give due consideration to the needs of local communities or to incorporate traditional knowledge in management (RRI, 2015). Nevertheless, the successful cases are indicative of the potential of co-management systems (see example in Case Study 10). Another example is the extractive reserves in the Brazilian Amazon mentioned in Chapter 6 under Conservation effectiveness of protected areas.
Makuira National Park, covering 25 000 hectares on the La Guajira peninsula in northeastern Colombia (Figure A), is a sacred and cultural landscape for the Wayúu people, shaped by agriculture, grazing and selective forest use (Premauer and Berkes, 2012). The park encompasses a small and isolated mountain range with permanent humid forests on its peaks and upper slopes. The dwarf cloud forests found here are an oasis for endemic species and the only example of this ecosystem in Colombia (UAESPNN, 2005). Long before the establishment of the national park, the Wayúu protected many areas and landscape features because of their cultural taboos and respect for nature (Premauer and Berkes, 2012). When the national park was declared in 1977 without regard to indigenous territorial claims, conflicts ensued. Over the years, however a collaborative governance and problem-solving approach has evolved, which has been beneficial both for the Wayúu and for biodiversity conservation (Premauer and Berkes, 2012).
In 1984, the Wayúu people were granted land title over their ancestral territory under a form of collective land tenure called the resguardo, a type of indigenous reserve. Inside the resguardo, indigenous peoples hold rights to govern their economic, social and cultural development. Resguardo land covers one-third of the national territory of Colombia and more than 80 percent of forested areas with high-biodiversity values. It cannot be sold or confiscated. The rights of the Wayúu people to their ancestral lands is one of the key factors for successful conservation in Makuira.
The “Parks with People” policy for participatory conservation was developed in 1998–2000 and implemented nationally where indigenous territories overlap with protected areas, such as the case of Makuira National Park (Premauer and Berkes, 2015). This policy emphasizes recognition of indigenous rights, local governing authorities, cross-cultural management practices and conservation as management rather than preservation (Ingwall-King and Gangur, forthcoming).
In response to the “Parks with People” policy, the park management of the Makuira Park has been highly respectful of customary values and governance. For example, the park management spent three years building relationships with local people and legitimate customary governing authorities and learning about Wayúu social and political organization and territorial management practices. Consequently, in 2006, most Wayúu chiefs accepted to work with the park (Premauer and Berkes, 2015).
Furthermore, joint decision-making processes were adopted and the cultural and conservation objectives of the co-governance agreement were collectively decided through the creation of a council of 54 chiefs. Its meetings were held near the Wayúu territories, which spared chiefs long-distance travel, and mainly in the Wayúu language, which empowered Wayúu authorities to speak freely (Premauer and Berkes, 2015).
Managing the park as a territory or area conserved by indigenous peoples and local communities or ICCA (see Box 48) gives the Wayúu the autonomy to apply their customary values and practices as they see fit, for example, by engaging in hunting, harvesting forest products, livestock-raising and horticulture – human–environment interactions that have supported the Wayúu way of life for centuries (Premauer and Berkes, 2012, 2015).
The co-governance arrangement has helped the park and the Wayúu to overcome their differences in a number of ways:
▸ The park supports the Wayúu in the protection of their territory and by ensuring their right to free, prior and informed consent over any action to be taken in the park.
▸ The Wayúu help with control and monitoring of activities in the park, as the park staff is too small to control all access by intruders.
▸ The Wayúu and park authorities agreed to restrict access to mountain tops with cloud forests, which supported a cultural taboo for the Wayúu and conservation values for the park.
There have still been some conflicts, for example over tourism. However, the collaborative governance relationship is underpinned by common interests, particularly protection of the territory against external threats, which has had positive results such as the prevention of mining and prospecting activities in the park. These common interests have helped to build trust, respect and reciprocity (Premauer and Berkes, 2015).
The collaboration between park authorities and the Wayúu has helped to reduce illegal activities in the area, such as bird poaching and illicit extraction of wood (Premauer and Berkes, 2012). Although a lack of systematic data makes it difficult to evaluate biodiversity trends precisely, at the landscape level the extent of Makuira’s five types of vegetation, especially the cloud forest, has remained intact since the 1970s (Premauer and Berkes, 2012).
SOURCE: Premauer and Berkes, 2015.
Outside protected areas, some OECMs also recognize local rights in order to permit sustainable use while producing positive conservation outcomes. For example, the community-based approach to wildlife management in Namibia grants community institutions organized into conservancies legal rights to use and benefit from wildlife on their lands. This approach has resulted in substantial income generation as well as a dramatic increase in numbers and diversity of wild animals in the past two decades (NACSO, 2017b).
Financing is needed to both tackle the drivers of deforestation and to better conserve, manage and restore forests and their biodiversity.
Financing needed to shift to deforestation-free production of cattle, soya bean, palm oil and pulp and paper is estimated at roughly USD 200 billion annually (Tropical Forest Alliance, 2020), while the cost of implementing the CBD’s Strategic Plan for Biodiversity 2011–2020 (including but not limited to forest biodiversity) was initially estimated as USD 150 billion to USD 440 billion per year (CBD, 2012a). These figures may sound large, but are small when compared with current fiscal incentives for agriculture of over USD 700 billion per year (OECD, 2019a) or subsidies for fossil fuels, estimated at around USD 5.2 trillion in 2017, or around 6.3 percent of global GDP (Coady et al., 2019).
Despite recent attention to the role of forests in conserving biodiversity and mitigating climate change, current financing still falls well short of these targets. This must and can change. The report prepared by OECD for the G7 Environment Minister’s meeting in May 2019 (OECD, 2019b) clearly presents the socio-economic and business case for action to conserve biodiversity and many of the identified opportunities to scale up action for biodiversity would have a positive impact on forests. The variety of possible sources of finance is illustrated in Figure 44.
Long-term financing solutions increasingly rely on the private sector and on instruments that enable self-sustained financing, such as environmental funds. A number of innovative approaches show promise. The public–private partnership model of the Land Degradation Neutrality Fund, being developed by the Global Mechanism of UNCCD (UNCCD, n.d.), supports the transition to land degradation neutrality through land rehabilitation while generating revenues for investors from sustainable production on rehabilitated land, while the Landscape Fund proposed by CIFOR plans to issue restoration bonds following the model of green bonds (FAO and Global Mechanism of UNCCD, 2015). New financial products and industry investments complement traditional funding via corporate social responsibility and philanthropy. Although funding streams are relatively small, a wide and diversified range of instruments is available to generate funds for forest and biodiversity conservation (Table 7).
Leveraging private finance. The public sector has a critical role in leveraging private finance for conservation through both strong environmental regulation and provision of positive incentives. Even when these are in place, new sustainable land-use models are often perceived as risky investments, particularly if they are to be implemented in developing countries. As such, they require a partner, such as a government or multilateral financial institution, to lower the risk profile of investments by providing subordinate debt, first-loss guarantees and other structures for credit enhancement. Doing so can unlock significant amounts of private investment. Examples of this include the Tropical Landscape Finance Facility (a partnership between UNEP, World Agroforestry Centre, BNP Paribas and ADM Capital) to structure up to USD 1 billion in bonds financing sustainable commodity production, processing and trade and the Agri3 Fund (set up by a partnership between UNEP, Rabobank and IDH) to direct up to USD 1 billion in capital towards deforestation-free commodity production.
Another example is habitat conservation banking in the United States of America, which combines strong legislation and enabling institutional mechanisms to engage the private sector in protection of endangered species. Conservation banks are a compensation mechanism to facilitate compliance with the United States Endangered Species Act of 1973 (Government of the United States of America, 1973). Through this instrument, private landowners managing land for permanent habitat protection can issue credits subject to approval by the United States Forest Service, based on ecological functions and services. Projects and developers purchase these credits as compensation for their impact. By 2016 the number of conservation banks had reached 137, and the area of land under the scheme has increased by 288 percent since national guidelines for conservation banks were published in 2003 (Poudel, Zhang and Simon, 2019).
While information on the costs of managing forests within and outside protected areas is available in many countries, few attempts have been made to assess the costs and benefits of restoration efforts, and those that have been made have been poorly documented because of a lack of baseline data and consistent frameworks for tracking, understanding and sharing results and lessons learned. The Economics of Ecosystems and Biodiversity initiative, for example, reviewed over 20 000 restoration case studies and found that only 96 contained useful cost data (OECD, 2019b). This lack of information hinders further public and private investments in restoration activities, jeopardizing the chances of achieving restoration targets and their contribution to global goals on sustainable development, climate mitigation and adaptation and to biodiversity conservation and sustainable use. The Economics of Ecosystem Restoration initiative (Box 43 in Chapter 5) aims to help fill this information gap. Generally speaking, indications are that the benefits will often outweigh the costs. For example, a recent analysis estimates that restoring 350 million hectares of degraded forest areas globally could generate USD 7-30 of benefits for every dollar invested (Verdone and Seidl, 2017).
Payment for ecosystem services. Results-based payments for reduced carbon emissions from deforestation and forest degradation is currently the largest global scheme available to pay for ecosystem services provided by forests and it has already had a significant positive impact in terms of reduced rates of deforestation and associated loss of biodiversity. Payments for water-related forest ecosystem services are common in many countries, UNECE and FAO (2018) listed 101 active schemes in North America and 70 in EU countries.
PES schemes have also been used to reward and regulate certain practices that more directly support biodiversity conservation on private land. Such schemes have been used successfully to protect high-biodiversity areas, including important migration and dispersal areas for wildlife populations. However, these schemes can be difficult to implement where land tenure is unclear or insecure, as it is then difficult to attribute the environmental services to the providers (FAO, 2016c). This is a significant problem for PES in rural Africa, where 90 percent of lands fall under customary tenure regimes and lack any formal titles (Blomley, 2013). In some countries, NGOs assist communities in obtaining certificates of customary rights to help overcome this constraint. For example, in the Simanjiro plains of the United Republic of Tanzania, the grass-roots organization Ujamaa Community Resource Team has helped 38 communities of pastoralists and hunter-gatherers to obtain secure tenure rights across 620 000 hectares by obtaining certificates of customary rights of occupancy, enabling them to develop land-use plans for over 1 million hectares of land (Nelson and Sinandei, 2018). PES contracts established between some of the communities and tour operators have helped to obtain community support for maintaining wildlife dispersal areas through traditional rules of land use, while annual payments to the communities are designed to prevent conversion to farming in the future (Sachedina and Nelson, 2012). This approach has also served to reduce conflict and provide livelihood security to some of the most marginalized communities in the region.
Costa Rica addresses the issue of insecure forest tenure in PES by allowing owners lacking formal land titles the option of providing some proof of rights of possession (FONAFIFO, CONAFOR and Ministry of Environment, 2012) or the opportunity to borrow against future payments to meet the costs of legalizing their tenure (FAO, 2016c). Table 8 lists the ten largest national PES schemes.
Conservation easements. A conservation easement is “a voluntary, legal agreement that permanently limits uses of the land in order to protect its conservation values” (NCED, 2019). As with PES, conservation easements are frequently used to help incentivize conservation by private landholders with clear and secure tenure, including the management of large communal areas in the vicinity of national parks (FAO, 2016c). In such cases, landowners are required to forgo certain rights of use for specific benefits, often financial incentives (e.g. reduced taxes in Europe and the United States of America). In northern United Republic of Tanzania, conservation easement agreements set up between some communities and the private sector offer annual payments to communities and employment opportunities for forgoing additional agricultural expansion (Sachedina and Nelson, 2012).
Debt-for-nature swaps. The United States Tropical Forest Conservation Act (TFCA), enacted in 1998 and reauthorized in 2019 (TNC, 2019), offers eligible developing countries options for relieving certain official debts to the Government of the United States of America while generating funds in local currency to support tropical forest conservation activities. USAID (2017) reports that since 1998, 20 TFCA debt-for-nature agreements have been concluded with 14 countries: Bangladesh, Belize, Botswana, Brazil, Colombia, Costa Rica (two agreements), El Salvador, Guatemala, Indonesia (three agreements), Jamaica, Panama (two agreements), Paraguay, Peru (two agreements) and the Philippines (two agreements). Such agreements have involved USD 233 million in government funds and an additional USD 22.5 million from NGOs (The Nature Conservancy, Conservation International and the World Wide Fund for Nature). Another USD 83 million has been generated from a combination of interest income, capital gains, cost-sharing by grantees and co-financing of projects from additional donors, taking the total to over USD 330 million.
A number of countries are negotiating debt-for-nature agreements with private foundations, often with the support of NGOs (e.g. the United Republic of Tanzania, the Russian Federation and the World Wide Fund for Nature [WWF, 2018]). Such schemes represent a promising opportunity for debt relief and nature investment in Africa, a continent that has significantly increased its external debt in recent years.
At the national level, better metrics need to be in place to track trends in natural capital and the benefits of forests to people, to help ensure that development plans take into account the trade-offs and synergies between different land use options.
A particular need relates to the long standing requirement to extend the System of National Accounting to include metrics on the environment and its relationship to the economy (e.g. Repetto, 1992). First called for in Agenda 21 in 1992, a significant step forward was the adoption of the System of Environmental Economic Accounting (SEEA) Central Framework as an international statistical standard to account for environmental resources, their contribution to the economy and their role as a carbon sink in both physical and monetary terms (UN et al., 2014a). Forests have received particular attention as a specific natural capital asset in the SEEA (e.g. World Bank, 2017). The SEEA Experimental Ecosystem Accounting aims to further extend the SEEA to deliver ecosystem-based metrics on natural capital (UN et al., 2014b).
By providing a consistent framework for organizing information on natural capital and linking it with the system of national accounts, the SEEA is a key tool to integrate the benefits of forests, forest ecosystem services and forest biodiversity into economic planning (see e.g. Banerjee et al., 2016). Approximately 40 countries are currently using the SEEA in supporting biodiversity related policy-making and management (Ruijs and Vardon, 2019). Many countries also have detailed requirements for environmental impact assessments to be carried out prior to approving projects that entail the conversion of publicly-owned forests.
While policy and legal frameworks are often thought of in the country context, regional frameworks and collaboration can be very effective in strengthening governance and scaling up action (see Box 54). For example, the EU called for more coordinated action between countries and adopted the Birds Directive in 1979 and the Habitats Directive in 1992 in response to the high rates of species extinction, habitat destruction and ecosystem degradation and to help meet the targets and its commitments to the CBD. Central to the Habitats Directive was the creation of ‘Natura 2000’, an EU-wide ecological network comprising all areas protected under the Birds Directive (Special Protection Areas) and the Habitats Directive (Special Areas of Conservation). Stretching across 28 EU countries and covering 18 percent of the EU’s land area and 9.5 percent of its marine territory, the network includes some strictly protected nature reserves but mostly privately owned lands (EC, 2019b). Forest ecosystems represent about 50 percent of the network’s surface area. The Natura 2000 Biogeographical Process, launched in 2012, facilitates coordinated action across the member States and cooperation among various government and non-government stakeholders for effective implementation, management, monitoring, financing and reporting as well as enforcement of compliance with regulations across the network of sites. Despite the challenges and slow implementation, especially in marine habitats, Natura 2000 has proved to be successful in addressing the loss, fragmentation and degradation of critical habitats across the EU territory (Medaglia, Phillips and Perron-Welch, 2014).
▸ The Central African Forest Commission (COMIFAC) (COMIFAC, 2020) is an intergovernmental organization coordinating activities around the conservation and sustainable management of forests in Central Africa. Activities are guided by a subregional Convergence Plan. The second edition of this plan (2015–2025) has six priorities, one of which is the “conservation and sustainable use of biological diversity.”
▸ The Great Green Wall (Great Green Wall, 2019a), initiated in 2007, is an ambitious plan to plant a wall of trees 8 000 kilometres long across the width of Africa’s Sahel region. In recent years the initiative has evolved to more broadly promote a mosaic of sustainable land use and restoration practices. The Great Green Wall has been touted as Africa’s flagship initiative to combat climate change, biodiversity loss, land degradation, desertification and drought and aims to enhance livelihoods and improve food security and resilience. It highlights the importance of biodiversity for human well-being.
▸ The Sustainable Forest Management Framework for Africa (2020–2030) is designed to guide member States of the African Union and African Regional Economic Communities on forest-related priorities towards achieving the objectives of the African Union (AU) Agenda 2063 (African Union, n.d.) and the United Nations Agenda 2030. The priorities include enhancing the value of forests, markets, processing and trade, capacity development and knowledge management; promoting supportive political and institutional frameworks for sustainable forest management, enhancing the restoration of degraded forests and landscapes; and enhancing partnerships and resource mobilization.
▸ Forest Europe (the brand name of the Ministerial Conference on the Protection of Forests in Europe) is a pan-European voluntary high-level political process for dialogue and cooperation on forest policies in Europe. Forest Europe develops common strategies and guidelines for its 47 signatories (46 European countries and the EU) on how to protect and sustainably manage their forests.
▸ In December 2019, the Council of the European Union adopted a framework of actions to step up EU action to protect and restore the world’s forests (EC, 2019a). The framework has five priorities to conserve and sustainably manage global biodiverse forest. It highlights the contribution these actions will have towards the achievement of forest-related multilateral environmental agreements, as well as towards reversing the trend of deforestation.
▸ The Amazon Cooperation Treaty Organization promotes the conservation and sustainable use of forest resources in countries of the Amazon Basin, with forest-related biodiversity indirectly benefiting from some activities. The Leticia Pact for the Amazon (Leticia Pact, 2019), signed in 2019 by Bolivia (Plurinational State of), Brazil, Colombia, Ecuador, Guyana, Peru and Suriname, affirms regional cooperation and coordinated action for forest and biodiversity assessment, the fight against deforestation and forest degradation, combating illegal activities, prevention of fire and other disasters, and restoration, rehabilitation and reforestation initiatives.
Loss or conservation of biodiversity is often the result of human behaviour. Therefore, sustainable natural resource management requires human values, attitudes and behaviours that favour conservation and see humans as part of nature and nature as linked to human well-being (Saunders, Brook and Meyers, 2006; St. John, Edwards-Jones and Jones, 2010; Verissimo, 2013).
Unfortunately, while the public has become increasingly aware of environmental issues, most do not actively engage in behaviours that support a more-sustainable future (Bickford et al., 2012). Effective conservation interventions need to incentivize behaviour change, which requires an understanding of how specific attitudes towards nature translate into actions and how human behaviours can translate into positive biodiversity outcomes (Verissimo, 2013).
Enhancing environmental literacy. Environmental literacy can provide a foundation for achieving biodiversity conservation and sustainable forest management and can be promoted through education and evidence-based communication (McKeown, 2002). A new approach to education for sustainability must emphasize critical thinking, integrated principles and the use of acquired skills to turn knowledge into action (Schelley et al., 2012). Environmental literacy is often built through first-hand experience of nature, including involvement in outdoor activities that have an ecological focus and engagement in adaptive management (Saunders, Brook and Meyers, 2006; Bickford et al., 2012). Forest schools introduce an appreciation for nature at an early age (O’Brien and Murray, 2007).
One way to enhance environmental literacy is through citizen-science programmes that involve the public in collecting data or ecological studies, for example by engaging the participation of communities that live adjacent to protected areas or in locations threatened by invasive species (Box 55). Scientists can collaborate with grass-roots organizations, indigenous peoples and local communities to design programmes that impart knowledge of local ecosystems, increase understanding of conservation issues and empower local stakeholders to make informed decisions (Bickford et al., 2012).
Globally, many forests are continually subject to severe outbreaks of invasive species, which can have huge environmental and sociocultural impacts. Threat of forest invasive species is rising with increasing global trade and travel and is exacerbated by impacts of climate change. Managing invasive species and avoiding new introductions of species with known potential to become invasive require coordinated efforts by many actors, nationally, regionally and globally.
The New Zealand Biosecurity 2025 programme aims to create a movement of change where every citizen, business and organization in the country becomes a biosecurity risk manager. The programme highlights the vital role of inclusiveness and participation to make the national biosecurity system more resilient and future-focused to protect the country from pests and diseases.
The United Kingdom of Great Britain and Northern Ireland is looking at adopting the same strategy. A report by the country’s Environmental Audit Committee, citing plans by New Zealand to train 150 000 people in biosecurity by 2025 (Biosecurity New Zealand, 2018), calls for the United Kingdom to significantly expand its approach to public engagement in the fight against invasive non-native species, considered one of the top five threats to the natural environment in the United Kingdom of Great Britain and Northern Ireland. Invasive non-native species not only challenge the survival of some of the country’s rarest species but also damage natural ecosystems, costing the economy an estimated GBP 1.7 billion (more than USD 2.2 billion) per year. Caterpillars of the oak processionary moth (Thaumetopoea processionea), for example, can strip oak trees bare and also pose a human health hazard, while ash dieback, caused by the fungus Hymenoscyphus fraxineus, threatens to cause the loss of half of the country’s native ash trees within a century, which could cost the country GBP 15 billion (almost USD 20 billion). The Committee wants 1.3 million people to be taught how to spot outbreaks of invasive species, and also calls for establishment of a dedicated border force to improve biosecurity at national borders.
SOURCE: RNZ (2019).
Sharing success stories that celebrate effective conservation can empower people and promote action by demonstrating what can be achieved and how to achieve it (Nadkarni, 2004; Saunders, Brook and Meyers, 2006; Garnett and Lindenmayer, 2011) (see example in Box 56). Conservation stories have traditionally been communicated to the general public through the media, but such communication is often lacking in detail and accuracy (Nadkarni, 2004). Scientists, researchers, religious leaders and conservationists can communicate with the public in many other ways besides engaging in public-domain media, for example by serving as knowledge ambassadors. Celebrities and influencers can help reach a larger audience, particularly among the younger generation (Galetti and Costa-Pereira, 2017) (see example in Box 57). Depending on the audience, it can be helpful to communicate through stories and metaphors and to align the message with the ideologies or spiritual and religious beliefs of the audience. Communication with the public provides mutual benefits: the public gains awareness of environmental and sustainability issues, and the practitioners and the scientific community gain fresh perspectives that can help to shape action, research questions, policy and decision-support tools.
Tree Cities of the World is an international effort, promoted by FAO and the Arbor Day Foundation in the United States of America, to recognize cities and towns that are committed to maintaining, sustainably managing and celebrating their urban forests and trees. To receive recognition, a town or city must meet five core standards:
▸ Establish authority: The community has a written statement by city leaders delegating responsibility for the care of trees within the municipal boundary to a staff member, a city department or a group of citizens (a tree board).
▸ Set the rules: The community adopts policies, best practices or industry standards for managing urban trees and forests that describe how work must be performed, where and when the rules apply and penalties for noncompliance.
▸ Know what you have: The community has an updated inventory or assessment of the local tree resource, making it possible to establish an effective long-term plan for planting, care and removal of city trees.
▸ Allocate the resources: The community has a dedicated annual budget for the routine implementation of the tree management plan.
▸ Celebrate achievements: The community holds an annual celebration of trees to raise awareness among residents and to acknowledge citizens and staff members who carry out the city tree programme.
Wild for Life (https://wildfor.life), created by UNEP and Futerra in 2016, is a campaign to raise global awareness and mobilize millions of people, particularly young people, to support the protection of endangered species and advocate for ending illegal trade of wildlife.
Wild for Life aims to make the issue personal: to give a name and a face to these endangered species. To achieve this personal connection, the campaign features an online personality quiz that assigns a kindred species to each quiz taker based on distinctive characteristics and behaviours. Users are then invited to take a #WildforLife selfie combining the user’s image and kindred species and to share the photo on social media.
The campaign has engaged 25 partners from United Nations and government agencies, charities and media, including the World Bank, INTERPOL, the Jane Goodall Institute and Rovio Entertainment (creator of the Angry Birds franchise). It also features and is supported by more than 35 celebrities, influencers and goodwill ambassadors who have each given their face and name to an endangered species.
The campaign has reached over 1 billion people, including almost 330 million people in the key target market of China. More importantly, several species featured in the campaign obtained greater global support in the CITES process, and China announced a total ban on commercial trade of ivory by the end of 2017.
The success of the campaign can be attributed to its:
▸ leading with a positive example, concentrating on people’s love for and connection with nature and endangered species;
▸ presentation of the problem as actionable and solvable, suggesting that this is a battle that can be won with the participation of the audience; and
▸ creation of a fresh, engaging and heroic identity that stands out visually.
Biodiversity planning and decision-making in changing contexts depend on accurate knowledge and information. Knowledge of forest biodiversity at the population, species and genetic level remains limited for both plants and animals. However, much is being done to address the gaps in this area.
Accurate, efficient and cost-effective measurement and reporting of forest information is required for many international processes and the SDGs and as a basis for facilitating improved forest management and sustainable development. With the availability of new tools (Box 58), countries that previously lacked the capacity to collect the data required to make informed decisions can now obtain and analyse wide-ranging information with minimal resources and training (see example in Box 59).
Open Foris (www.openforis.org) is an innovative and accessible set of forest monitoring platforms and tools developed by FAO to enable users around the world to collect and analyse information autonomously and to report this information back to the global community. The tools are easy and intuitive to use, do not require prior skill and are free and open-source.
Open Foris has played a critical role in efforts to combat deforestation by lowering costs, removing barriers to collecting and analysing data and improving forest monitoring for many national governments.
Within Open Foris, the System for Earth Observations, Data Access, Processing and Analysis for Land Monitoring (SEPAL) is a big-data processing platform that combines supercomputing power, open-source geospatial data processing software and modern geospatial data infrastructures such as Google’s Earth Engine to enable researchers and technicians anywhere in the world to access and analyse satellite imagery and produce locally relevant results that can support decision-making.
Papua New Guinea is a well-known centre of biological endemism and species diversification. Despite their extent, size and rich diversity, its forests are poorly known from a scientific standpoint. To improve knowledge of the country’s forest biodiversity, the Government expanded the scope of the national forest inventory to include plants other than trees, birds and insects (moths, fruit flies and ants) in addition to tree biomass, tree-species diversity and soil chemical and physical characteristics.
National forest inventories rarely include details on biodiversity because it is difficult to assess. Papua New Guinea is collecting, recording and analysing this information using Open Foris tools developed by FAO for forest and land-use monitoring (see Box 58), including Collect Earth, which uses data from Google Earth in conjunction with Bing Maps and Google Earth Engine. These tools can be used with only one or two days’ training and enable national researchers to conduct biodiversity research that is much needed to support the development of appropriate forest management plans and policies. Nine students have already completed postgraduate research on topics related to the national forest inventory.
Collecting information for the national forest inventory, Papua New Guinea.
©FAO/Hitofumi AbeRemotely sensed data (see Box 60), coupled with ground-based data, are invaluable for tracking the state and trend of Earth’s natural resources. As illustrated in many studies presented in this volume, recent technological developments in satellite imagery and tools have significantly increased the ability to collect and analyse huge amounts of data.
Monitoring the Earth’s forest biodiversity using data from satellite-borne sensors has been ongoing for many years and occurs at a variety of complexities and scales. Some measurements of biodiversity are made directly (e.g. they can be derived solely from information obtained from the satellite), whereas most are made indirectly through the use of observable phenomena in satellite images as proxies for biodiversity and changes in biodiversity on the ground. Although there are examples from the scientific literature in which remote sensing has been used to identify and count animals in images, this section focuses largely on the use of satellite imagery to classify vegetation, both as it directly relates to forest biodiversity and as proxies for other kinds of diversity.
At their most basic, Earth-observing satellites are extremely useful for monitoring the state and trend of land cover (e.g. the biophysical properties of the land surface). Since the early 1970s, satellites launched specifically for the purpose of measuring and monitoring land cover have been providing data that make it possible to characterize the amount, distribution and dynamics of tree cover. These data can be used to estimate changes in tree cover over time for any area. They can thus be used to describe several of the most important factors affecting biodiversity, including presence or absence of tree cover, total area of tree cover (with more area generally meaning more biodiversity) and tree cover change (as deforestation often leads to decreasing biodiversity and reforestation can increase diversity).
The estimation of forest taxonomic diversity from satellite data is more complicated. It often involves relating satellite observations with field observations. In most cases, measured reflectance at the Earth’s surface is converted into a set of spectral indices. Each spectral index relates in some way to the condition of the vegetation, for example in terms of moisture content, photosynthetic behaviour and canopy cover percentage. These indices can assist in characterizing plant function, health, vigour and other key parameters. These parameters can then be related to ground-based observations of species assemblages. Once such a relationship is established, plant assemblages can be mapped across large spatial scales, from the country to the region and even globally.
Mapping species distributions from remote sensing takes two forms: indirect and direct. Indirect species distribution mapping can be improved through the incorporation of additional remotely sensed data, for example from weather- and climate-observing sensors, and other available data such as elevation and terrain (which can also both be derived from remotely sensed data). Combining data from multiple sources makes it possible to predict when and where plant-specific growing requirements are met and to model plant species extent over large areas. Direct mapping of species is possible through observation and detection of plant traits from satellite images – for example, by measuring vegetation height (e.g. to distinguish tall species from short species), tracking leaf-on/leaf-off state (e.g. to determine evergreen from deciduous trees) and observing mass flowering events (e.g. to track species within tropical or temperate forests). Recently, hyperspectral remote sensing (e.g. remote sensing of many hundreds of specific light wavelengths) has made it possible to detect individual tree species within forests simply based on each species’ unique spectral signature.
Finally, satellites can measure parameters important to large-scale ecosystem function and thus provide insight into changes over large areas that have a significant impact on forest biodiversity. For instance, satellites can detect tree mortality, species recruitment, rainfall patterns and other variables critical for characterizing biodiversity, and this information can be used to measure, monitor and predict changes in ecosystem function and, thus, biodiversity.
The next generation of satellites promises to be even more useful in providing measurements that can be immediately related to forest biodiversity, including direct, fine-scale observations of tree height, canopy characteristics and plant function. Such advancing technology, combined with more and better field data and, increasingly, the use of unmanned aerial vehicles (drones), will continue to enhance our ability to detect and monitor biodiversity.
An important area for further progress is the development and application of indicators for monitoring biodiversity. Examples include the fragmentation study in Chapter 2 (Forest intactness and fragmentation) and the forest-specialist index (Measuring forest vertebrate population trends) and biodiversity significance and intactness study (Assessing forest biodiversity) in Chapter 3. Other examples are given in Boxes 61 and 62.
In the face of rapid urbanization (UN, 2008b), biodiversity conservation will need to be extended to cities, which can have rich biodiversity (CBD, 2012b). In 2008, at the ninth meeting of the Conference of the Parties to the CBD, Singapore offered to lead in the development of a biodiversity index to track the efficacy of biodiversity conservation initiatives in cities.
The Singapore Index on Cities’ Biodiversity (SI), developed by the CBD Secretariat, Singapore and the Global Partnership on Local and Subnational Action for Biodiversity, has three components. It measures the native biodiversity that can be found in the city or area of assessment; the ecosystem services they provide; and the practices applied to govern and manage biodiversity (Table A). A user’s manual (Chan et al., 2014) provides details on how to apply it.
As of 2018, more than 30 cities across six continents had applied the SI (CBD, 2018c) (Figure A).
The SI has myriad uses, for example in master-planning of cities or regions or projects; decision-making and prioritization of resource allocation; complementing other environmental sustainability or performance indices; and contributing to guidelines for the development of local biodiversity strategies.
Multilayered planting of diverse tree species along Mandai Road in Singapore emulates the structure of a lowland tropical rainforest, reducing ambient temperatures; providing habitats and ecological linkages for fauna including primates, small mammals, birds and butterflies; capturing and storing carbon; and connecting people to nature, thus improving their physical, psychological and mental well-being.
©Lena ChanHabitat assessment using biodiversity indicators is a science-based, cost-effective way to measure forest ecosystem health and to support decisions for maintaining biodiversity and ensuring the provision of ecosystem services through sustainable management. As water quantity and quality (including sediment load, chemistry and temperature) are sensitive to changes in tree cover and forest management, freshwater biological indicators provide a good picture of changes in riparian ecosystem health over time.
Riparian habitat assessment tools generally look at many features related to biodiversity, including the presence, absence and/or abundance of plant and animal species, water quality, vegetation types, bank vegetation structure and channel and bank modifications. Such tools are now being used as part of citizen-science monitoring initiatives (Gurnell et al., 2019). Examples include the River Habitat Survey in the United Kingdom of Great Britain and Northern Ireland, the Rapid Biological Assessment of the United States Environmental Protection Agency, and the Blue Targeting Tool developed by WWF Sweden and Swedish forest-owners’ associations.
Smallholder forest owners in Sweden use the Blue Targeting Tool to determine the width of riparian buffer zone needed to protect inland waters, particularly small rivers. The tool consists of a single, double-sided page with a rapid assessment survey of binary (yes/no) questions based on scientific parameters and a scoring system (Henriksen, 2018). Conservation values included in the tool include special habitats/species, water bodies and riparian zones; human impact, including modifications to the watercourse; soil sensitivity, including topography and erosion risk; and added value, such as recreation, food production, cultural value and restoration. Based on the survey results, the water bodies are assigned to one of four categories according to their conservation needs:
▸ those where forestry activities can be carried out fairly close to the water;
▸ those requiring a larger riparian buffer zone;
▸ those requiring special conservation action such as removal of migration barriers or restoration of riparian buffer zones, habitat or hydromorphological conditions; and
▸ those requiring the widest possible riparian zone, where forestry operations need to be done with great consideration for the water.
Because of its effectiveness and simplicity, the Blue Targeting Tool has been adapted for other countries (Eriksson et al., 2018), including Finland, Latvia, Lithuania and Poland, and is currently being adapted for use in Brazil, in collaboration with the University of São Paulo and the Federal University of ABC, Brazil (Taniwaki et al., 2018).
As illustrated in this report, forests are highly diverse habitats harbouring the vast majority of the world’s terrestrial biodiversity. This diversity of forest ecosystems, species and genetic material underpins life on Earth.
People’s relationship with forest biodiversity varies between regions, countries and ecological zones and along the continuum from rural to urban; however, most of human society has at least some interaction with forests and the biodiversity they contain. Billions of people depend on forests for their livelihoods, food security and well-being. An estimated 2.4 billion people use wood-based energy for cooking. The role of forests and trees in mitigating climate change, regulating water supply, providing shade, windbreaks, feed and fodder and providing habitats for many pollinators renders them essential for sustainable food production.
The conservation and sustainable use of forests and trees within an integrated landscape approach, along the full continuum from intact forests to forest plantations to trees in agroforestry systems, agricultural fields and degraded land, is key to the conservation of the world’s biodiversity and the food security and well-being of the world’s people. It is, therefore, essential that biodiversity conservation be mainstreamed into forest management and that the many positive examples illustrated in this document be scaled up.
Yet, this is not enough. Based on information compiled for this report, it is evident that most of the goals and targets related to forest biodiversity have not been met and that the related SDGs are not on track to be met by 2030. It is also evident that current negative trends in biodiversity and ecosystems will undermine progress towards the Sustainable Development Goals.
Given that agricultural expansion is the main driver of deforestation, the biggest transformational change is needed in the way in which we produce and consume food. We must move away from the current situation where the demand for food is resulting in inappropriate agricultural practices that drive large-scale conversion of forests to agricultural production and the loss of forest-related biodiversity. Adopting agroforestry and sustainable production practices, restoring the productivity of degraded agricultural lands, embracing healthier diets from sustainable food systems and reducing food loss and waste are all actions that urgently need to be scaled up. Agribusinesses must meet their commitments to deforestation-free commodity chains and companies that have not made zero-deforestation commitments should do so. Commodity investors should adopt business models that are environmentally and socially responsible. These actions will, in many cases, require a revision of current policies – in particular fiscal policies – and regulatory frameworks.
On a positive note, forests are increasingly recognized for their role as a nature-based solution to many sustainable development challenges, as manifest in strengthened political will and a series of commitments to reduce rates of deforestation and to restore degraded forest ecosystems. We must build on this momentum to catalyse bold actions to prevent, halt and reverse the loss of forests and their biodiversity, for the benefit of current and future generations.
ADB. 2016. Illicit trade in natural resources in Africa –– A forthcoming report from the African Natural Resources Center. Abidjan. [also available at https://www.afdb.org/fileadmin/uploads/afdb/Documents/Events/IFF/Documents_IFF/ANRC_ILLICIT_TRADE_IN_NATURAL_RESOURCES.pdf].
AFR100. n.d. Home [online]. Midrand, South Africa. [Cited 18 December 2019]. https://afr100.org/
African Union. n.d. Agenda 2063: The Africa we want. In: African Union [online]. Addis Ababa. [Cited 13 January 2020]. https://au.int/en/agenda2063/overview
Agrawal, A., Chhatre, A., & Hardin, R. 2008. Changing governance of the world’s forests. Science, 320(5882): 1460–1462.
Aguilar, R., Quesada, M., Ashworth, L., Herrerias-Diego, Y. & Lobo, J. 2008. Genetic consequences of habitat fragmentation in plant populations: susceptible signals in plant traits and methodological approaches. Molecular Ecology, 17: 5177–5188.
Ahenkan, A. & Boon, E. 2011. Improving nutrition and health through non-timber forest products in Ghana. Journal of Health, Population and Nutrition, 29(2): 141–148.
Alix-Garcia, J., Sims, K.R. & Yañez-Pagans, P. 2015. Only one tree from each seed? Environmental effectiveness and poverty alleviation in Mexico’s payments for Ecosystem Services Program. American Economic Journal: Economic Policy, 7(4):1–40.
Alix-Garcia, J., McIntosh, C., Sims, K., & Welch, J. 2013. The ecological footprint of poverty alleviation: Evidence from Mexico’s Oportunidades Program. The Review of Economics and Statistics, 95(2): 417–435.
Alkire, S. & Santos, M.E. 2014. Measuring acute poverty in the developing world: robustness and scope of the multidimensional poverty index. World Development, 59: 251–274.
Andam, K.S., Ferraro, P.J., Pfaff, A., Sanchez-Azofeifa, G.A. & Robalino, J.A. 2008. Measuring the effectiveness of protected area networks in reducing deforestation. PNAS, 105(42): 16089–16094.
Angelsen, A., Jagger, P., Babigumira, R., Belcher, B., Hogarth, N.J., Bauch, S., Börner, J., Smith-Hall, C. & Wunder, S. 2014. Environmental income and rural livelihoods: a global-comparative analysis. World Development, 64: S12–S28. [online]. [Cited 3 January 2020]. https://doi.org/10.1016/j.worlddev.2014.03.006
Anup, K.C. 2017. Community forestry management and its role in biodiversity conservation in Nepal. In G.A. Lameed, ed. Global exposition of wildlife management [online]. [Cited 3 January 2020]. https://www.intechopen.com/books/global-exposition-of-wildlife-management/community-forestry-management-and-its-role-in-biodiversity-conservation-in-nepal
Azevedo, A.A., Rajão, R., Costa, M.A., Stabile, M.C.C., Macedo, M.N., Dos Reis, T.N.P., Alencar, A., Soares-Filho, B.S. & Pacheco, R. 2017. Limits of Brazil’s Forest Code as a means to end illegal deforestation. PNAS, 114(29): 7653–7658.
Balmford, A., Green, J.M., Anderson, M., Beresford, J., Huang, C., Naidoo, R., Walpole, M. & Manica, A. 2015. Walk on the wild side: estimating the global magnitude of visits to protected areas. PLOS Biology, 13(2): p.e1002074 [online]. [Cited 3 January 2020]. https://doi.org/10.1371/journal.pbio.1002074
Banerjee, O., Cicowiez, M., Horridge, M., & Vargas, R. 2016. A Conceptual Framework for Integrated Economic–Environmental Modeling. Journal of Environment and Development, 25(3): 276–305. [also available at doi: 10.1177/1070496516658753]
Barlow, J., Gardner, T.A., Araujo, I.S., Ávila-Pires, T.C., Bonaldo, A.B., Costa, J.E., Esposito, M.C. et al. 2007. Quantifying the biodiversity value of tropical primary, secondary, and plantation forests. PNAS, 104: 18555–18560.
Barros, F.M., Peres, C.A., Pizo, M.A. & Ribeiro, M.C. 2019. Divergent flows of avian-mediated ecosystem services across forest-matrix interfaces in human-modified landscapes. Landscape Ecology, 35(4): 879 [online]. [Cited 3 January 2020]. https://doi.org/10.1007/s10980-019-00812-z
Bastin, J.-F., Finegold, Y., Garcia, C., Mollicone, D., Rezende, M., Routh, D., Zohner, C.M. & Crowther, T.W. 2019. The global tree restoration potential. Science, 365(6448): 76–79.
Baynham-Herd, Z., Amano, T., Sutherland, W.J. & Donald, P.F. 2018. Governance explains variation in national responses to the biodiversity crisis. Environmental Conservation, 45(4): 407–418.
Beatty, C.R., Cox, N.A. & Kuzee, M.E. 2018. Biodiversity guidelines for forest landscape restoration opportunities assessments. 1st edition. Gland, Switzerland, IUCN.
Beck, H. 2008. Tropical ecology. In Jørgensen, S.E. & Fath, B.D. eds. General ecology: Encyclopedia of ecology, pp. 3616–3624. Elsevier, Oxford, UK.
Beech, E., Rivers, M., Oldfield, S. & Smith, P. 2017. GlobalTreeSearch: the first complete global database of tree species and country distributions. Journal of Sustainable Forestry, 36(5): 454–489.
Bello, C., Galetti, M., Pizo, M.A., Magnago, L.F.S., Rocha, M.F., Lima, R.A.F., Peres, C.A., Ovaskainen, O. & Jordano, P. 2015. Defaunation affects carbon storage in tropical forests. Science Advances, 1(11): e1501105 [online]. [Cited 3 January 2020]. https://doi.org/10.1126/sciadv.1501105
Belluco, S., Halloran, A. & Ricci, A. 2017. New protein sources and food legislation: the case of edible insects and EU law. Food Security, 9(4): 803–814.
Bengston, D.N., Butler, B.J. & Asah, S.T. 2008. Values and motivations of private forest owners in the United States: a framework based on open-ended responses in the national woodland owner survey. In D.B. Klenosky & C.L. Fisher, eds. Proceedings of the 2008 Northeastern Recreation Research Symposium, pp. 60–66. General Technical Report NRS-P-42. Newtown Square, Pennsylvania, USA, USDA Forest Service, Northern Research Station. [also available at https://www.nrs.fs.fed.us/pubs/gtr/gtr-p-42papers/09bengston-p-42.pdf].
Benítez-López, A., Alkemade, J.R.M., Schipper, A.M., Ingram, D.J., Verweij, P.A., Eikelboom, J. & Huijbregts, M. 2017. The impact of hunting on tropical mammal and bird populations. Science, 356(6334): 180–183.
Bennett, G. 2004. Integrating biodiversity conservation and sustainable use: lessons learned from ecological networks. Gland, Switzerland, IUCN.
Bennett, G. & Mulongoy, K.J. 2006. Review of Experience with Ecological Networks, Corridors and Buffer Zones. Technical Series No. 23. Secretariat of the Convention on Biological Diversity, Montreal, Canada.
Bentz, B.J., Régnière, J., Fettig, C.J., Hansen, E.M., Hayes, J.L., Hicke, J.A., Kelsey, R.G., Negrón, J.F. & Seybold, S.J. 2010. Climate change and bark beetles of the Western United States and Canada: Direct and indirect effects, BioScience, 60(8): 602–613.
Berman, M., Jonides, J. & Kaplan, S. 2008. The cognitive benefits of interacting with nature. Psychological Science, 19(12): 1207–1212.
Bernier, P.Y., Paré, D., Stinson, G., Bridge, S.R.J., Kishchuk, B.E., Lemprière, T.C., Thiffault, E., Titus, B.D. & Vasbinder, W. 2017. Moving beyond the concept of “primary forest” as a metric of forest environment quality. Ecological Applications, 27: 349–354.
BESNet. 2019. Thematic area: Biodiversity finance. In: Biodiversity and Ecosystem Services Network [online]. Nairobi. [Cited 3 January 2020]. https://www.besnet.world/biodiversity-finance-solutions
BGCI. 2019. GlobalTreeSearch. Botanic Gardens Conservation International. Richmond, UK. [Cited 31 December 2019]. www.bgci.org/globaltree_search.php
Bharucha, Z. & Pretty, J. 2010. The roles and values of wild foods in agricultural systems. Philosophical Transactions of the Royal Society B: Biological Sciences, 365(1554): 2913–2926.
Bickford, D., Posa, M.R.C., Qie, L, Campos-Arceiz, A. & Kudavidanage, E.P. 2012 Science communication for biodiversity conservation. Biological Conservation, 151(1): 74–76.
Billings, R.F., Clarke, S.R., Mendoza, V.E., Cabrera, P.C., Figueroa, B.M., Campos, J.R. & Baeza, G. 2004. Bark beetle outbreaks and fire: A devastating combination for Central America’s pine forests. Unasylva, 55: 10–15.
Biodiversity Indicators Partnership. 2018. Living Planet Index (forest specialists). In: Biodiversity Indicators Partnership [online]. Cambridge, UK. [Cited 3 January 2020]. https://www.bipindicators.net/indicators/living-planet-index/living-planet-index-forest-specialists
Biosecurity New Zealand. 2018. Biosecurity 2025 Implementation Plan. Strengthening the biosecurity system together. Ko Tātou This Is Us. Biosecurity New Zealand 2025. Ministry for Primary Industries, Government of New Zealand. [also available at: https://www.thisisus.nz/assets/Resources/163e2a594e/Biosecurity_2025_implementation_plan_full_version.pdf]
BirdLife International. 2019. World Database on Key Biodiversity Areas [online]. [Cited 3 January 2020]. http://www.keybiodiversityareas.org/home
Blackman, 
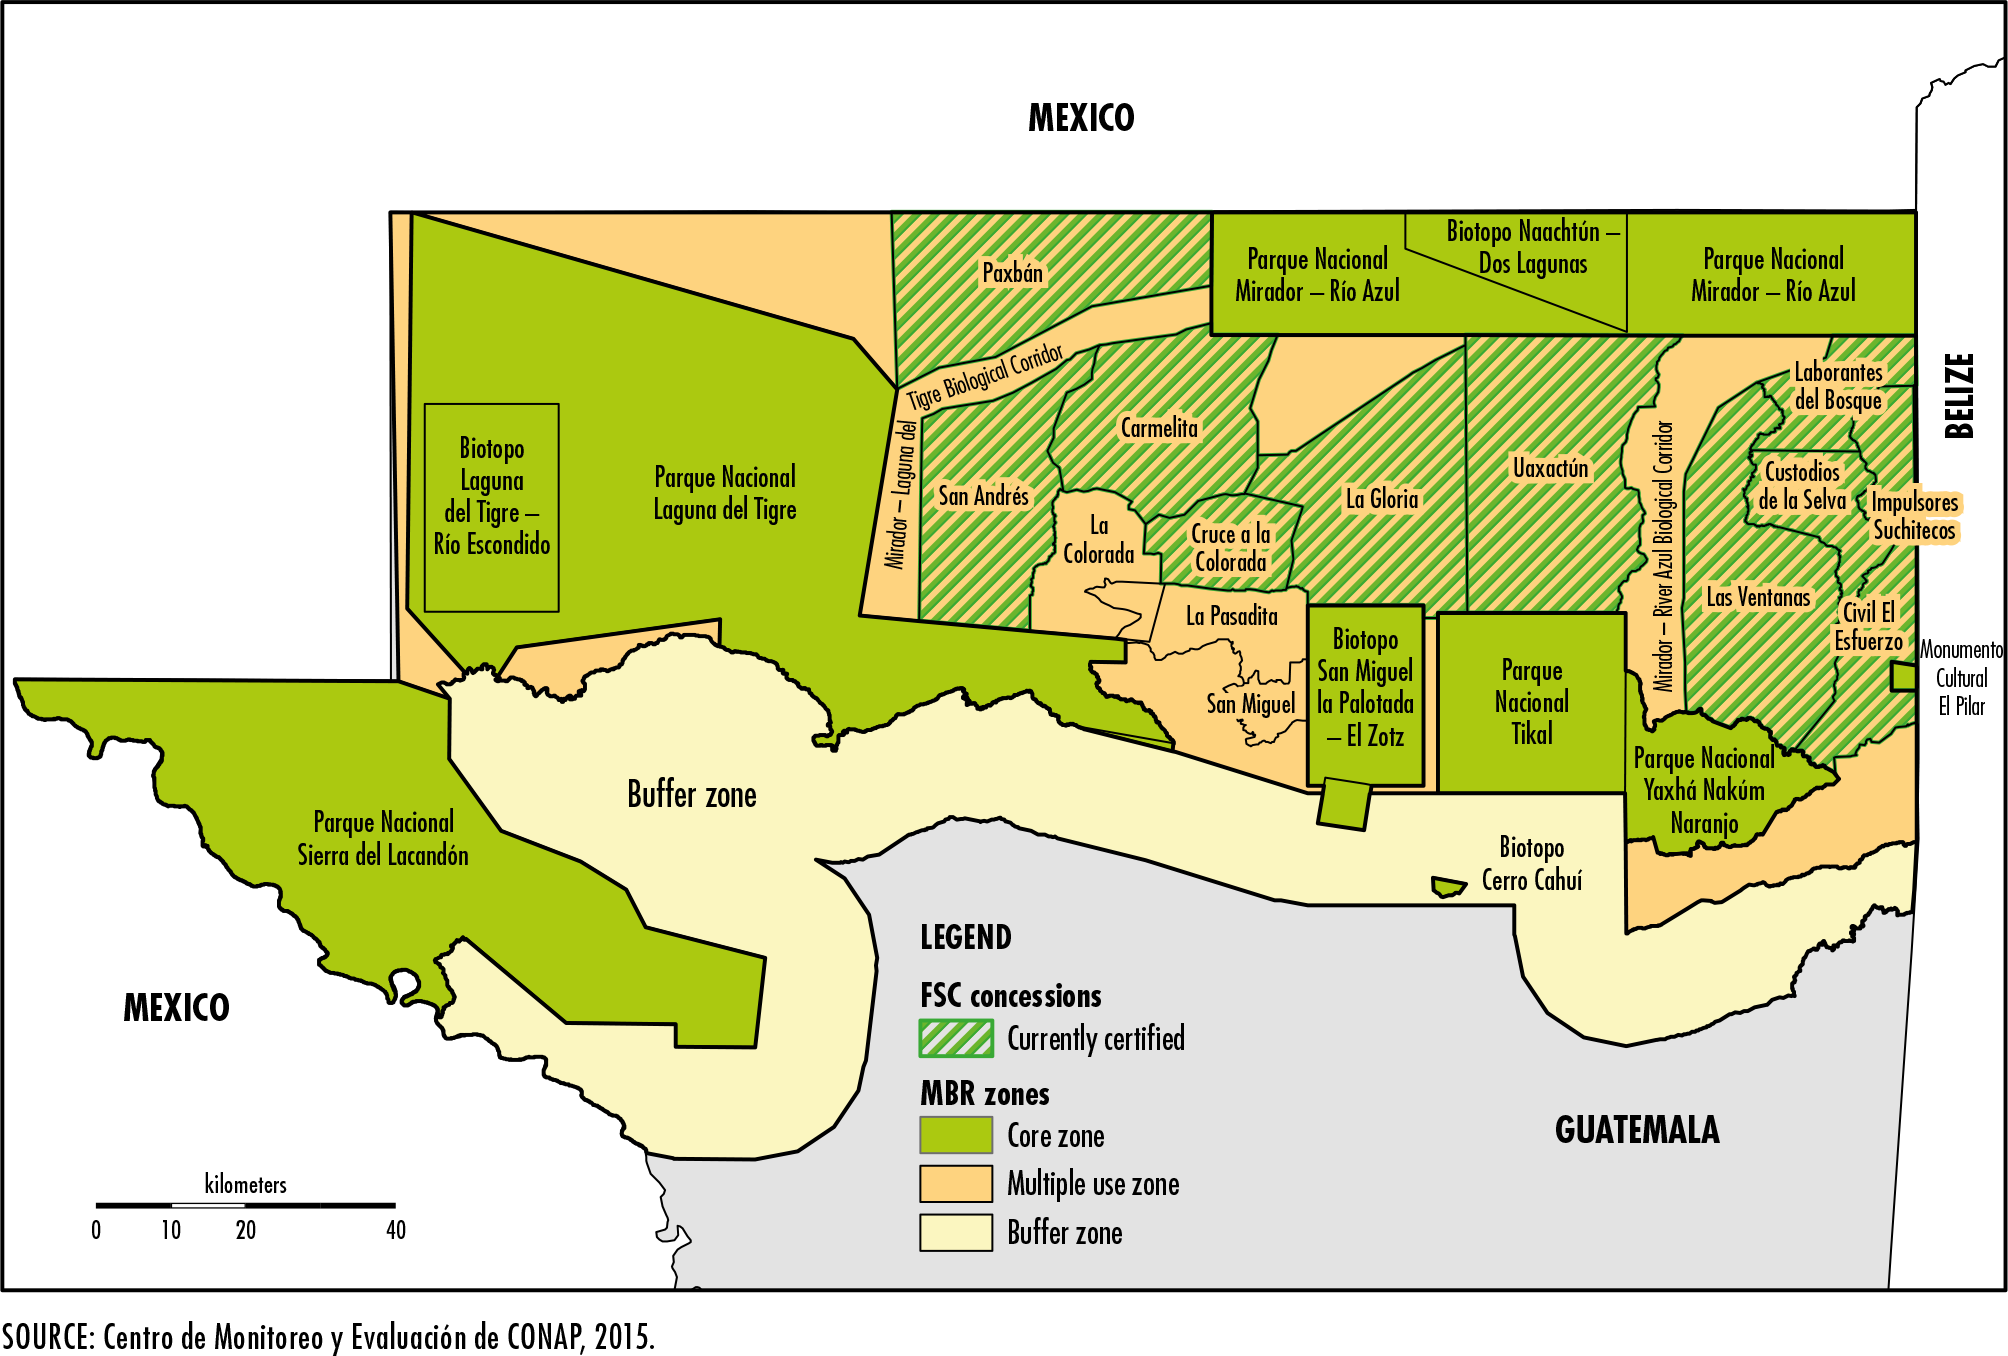
A. 2015. Strict versus mixed-use protected areas: Guatemala’s Maya Biosphere Reserve. Ecological Economics, 112: 14–24.
Blackman, A. & Veit, P. 2018. Titled Amazon indigenous communities cut forest carbon emissions. Ecological Economics, 153: 56–67.
Blackman, A., Corral, L., Lima, E.S. & Asner, G.P. 2017. Titling indigenous communities protects forests in the Peruvian Amazon. PNAS, 114(16): 4123–4128.
Blackwell, S. 2015. Resilience, wellbeing and confidence development at forest schools. In: Get children outdoors [online]. [Cited 3 January 2020]. http://getchildrenoutdoors.com/resilience-wellbeing-and-confidence-development-at-forest-schools
Blomley, T. 2013. Lessons learned from community forestry in Africa and their relevance for REDD+. Washington, DC, USAID-supported Forest Carbon, Markets and Communities Program. [also available at https://rmportal.net/library/content/fcmc/publications/CF_Africa.pdf].
Blomley, T., Pfliegner, K., Isango, J., Zahabu, E., Ahrends, A. & Burgess, N.D. 2008. Seeing the wood for the trees: an assessment of the impact of participatory forest management on forest condition in Tanzania. Oryx, 42(3): 380–391.
Bocci, C., Fortmann, L., Sohngen, B. & Milian, B. 2018. The impact of community forest concessions on income: an analysis of communities in the Maya Biosphere Reserve. World Development, 107: 10–21.
Bolognesi, M., Vrieling, A., Rembold, F., & Gadain, H. 2015. Rapid mapping and impact estimation of illegal charcoal production in southern Somalia based on WorldView-1 imagery. Energy for Sustainable Development, 25: 40–49.
Bontemps, S., Defourny, P., Radoux, J., Van Bogaert, E., Lamarche, C., Achard, F., Mayaux, P. et al. 2013. Consistent global land cover maps for climate modelling communities: current achievements of the ESA’s land cover CCI. In Proceedings of the ESA Living Planet Symposium, Edinburgh, UK, 9–13 September 2013, pp. 9–13. Paris, European Space Agency. [also available at https://ftp.space.dtu.dk/pub/Ioana/papers/s274_2bont.pdf].
Borrini-Feyerabend, G., Dudley, N., Jaeger, T., Lassen, B., Pathak Broome, N., Phillips, A. & Sandwith, T. 2013. Governance of protected areas: from understanding to action. Best Practice Protected Area Guidelines Series No. 20, Gland, Switzerland, IUCN.
Bowler, D.E., Buyung-Ali, L.M., Knight, T.M. & Pullin, A.S. 2010. A systematic review of evidence for the added benefits to health of exposure to natural environments. BMC Public Health, 10: Article number 456 [online]. [Cited 3 January 2020]. https://doi.org/10.1186/1471-2458-10-456
Boyce, M.S. 2018. Wolves for Yellowstone: dynamics in time and space, Journal of Mammalogy, 99(5): 1021–1031. https://doi.org/10.1093/jmammal/gyy115
Breed, M.F., Ottewell, K.M., Gardner, M.G., Marklund, M.H.K., Dormontt, E.E. & Lowe, A.J. 2015. Mating patterns and pollinator mobility are critical traits in forest fragmentation genetics. Heredity, 115(2): 108–114.
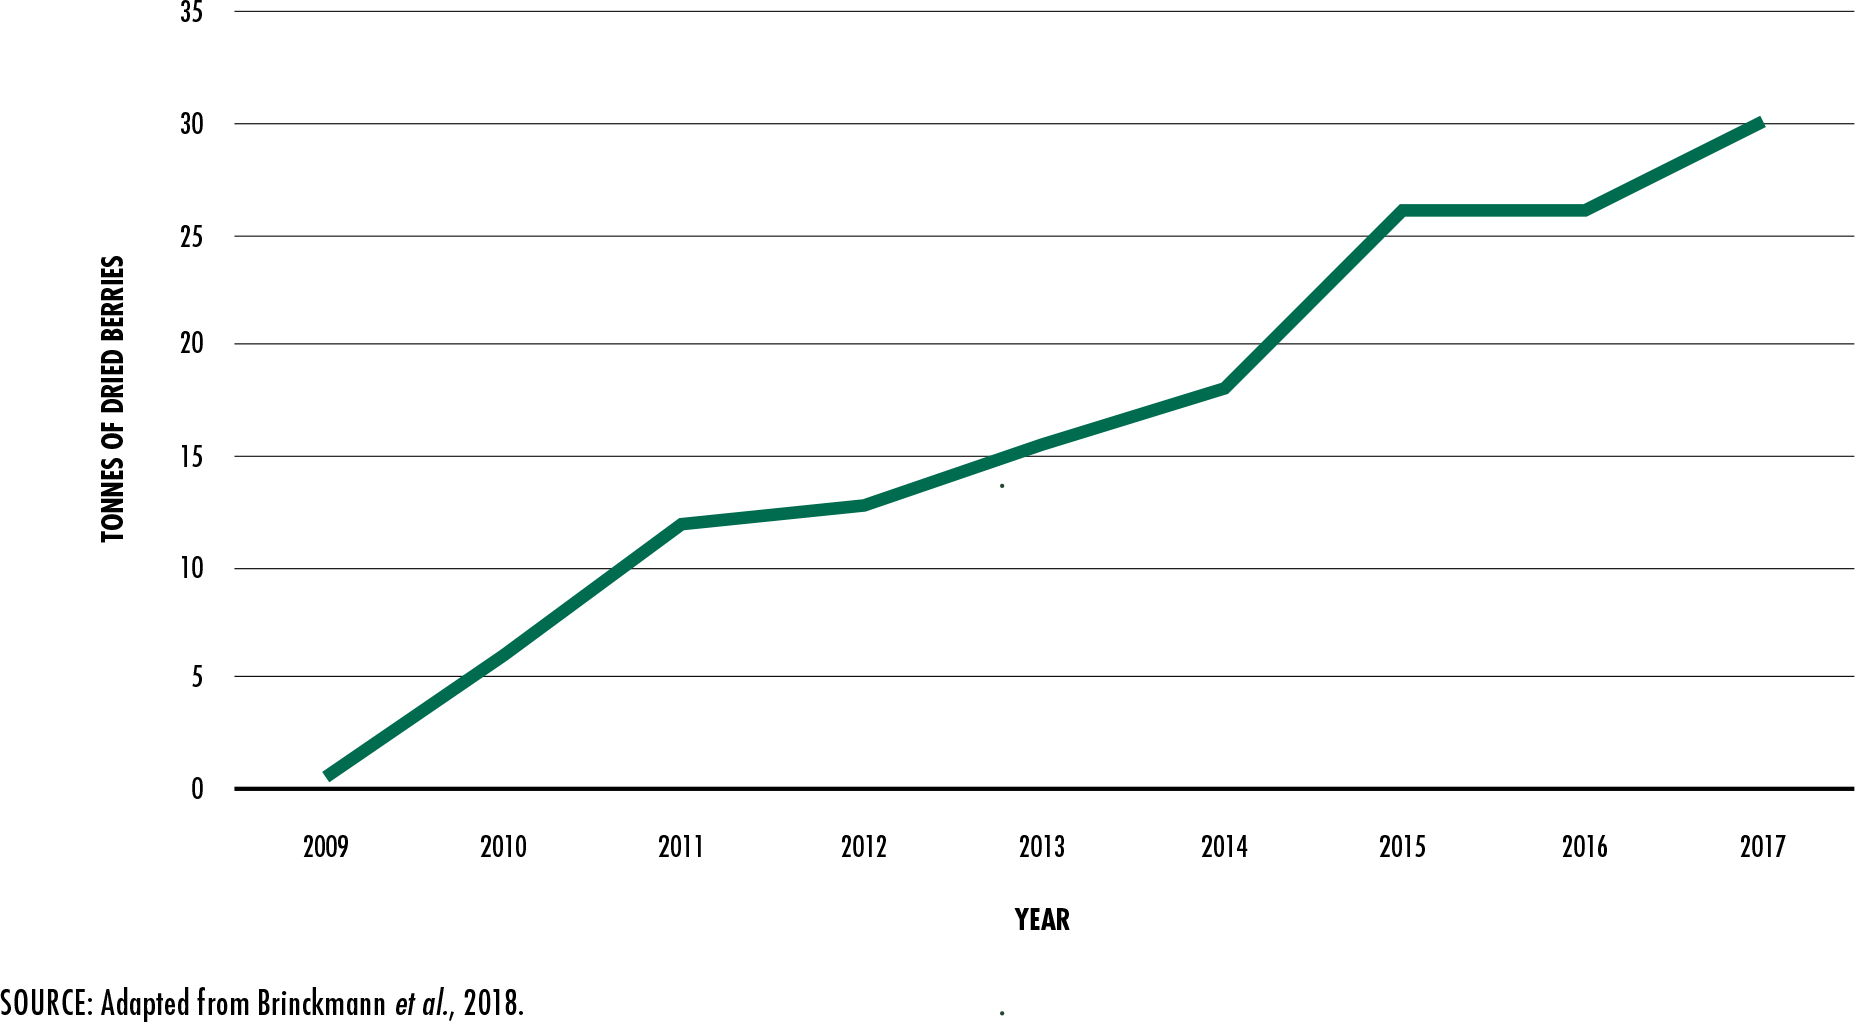
Brinckmann, J.A., Luo, W., Xu, Q., He, X., Wu, J., & Cunningham, A.B. 2018. Sustainable harvest, people and pandas: Assessing a decade of managed wild harvest and trade in Schisandra sphenanthera. Journal of Ethnopharmacology, 224: 522–534.
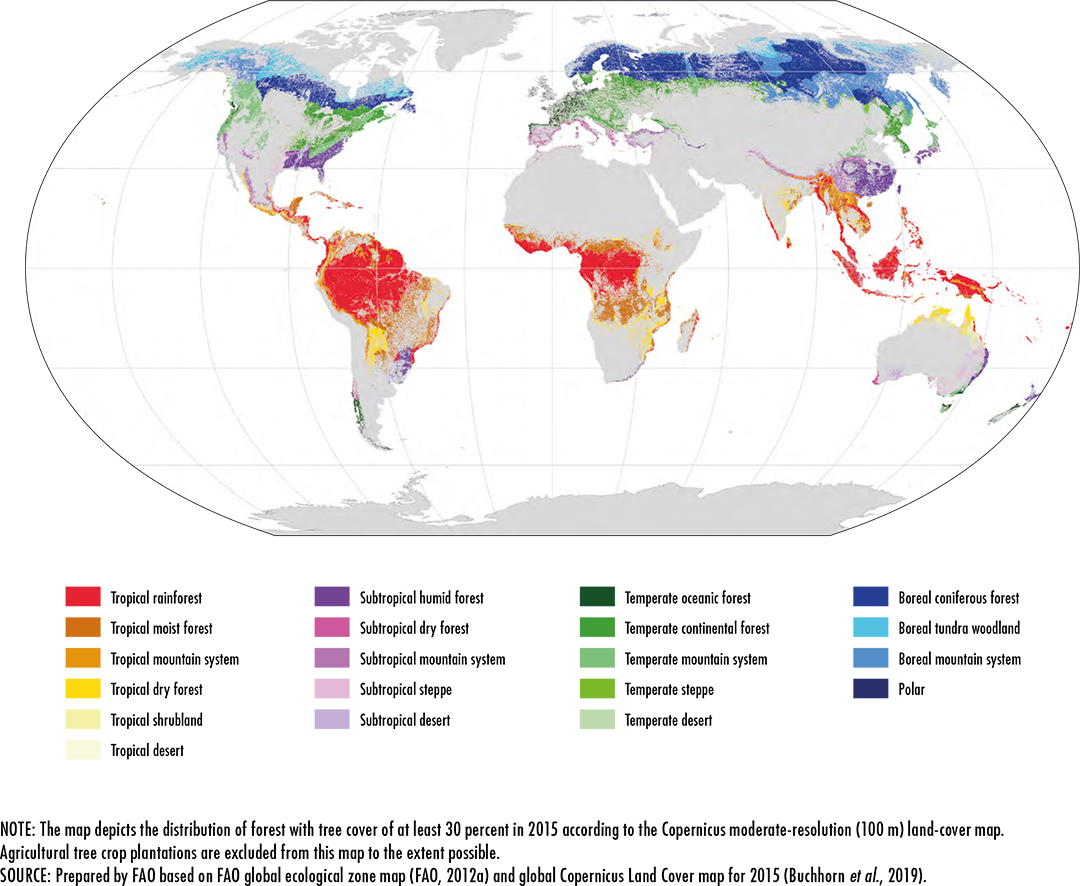
Buchhorn, M., Smets, B., Bertels, L., Lesiv, M., Tsendbazar, N.-E., Herold, M. & Fritz, S. 2019. Copernicus Global Land Service: Land Cover 100m: epoch 2015: Globe. In: Zenodo [online]. Geneva, Switzerland. [Cited 3 January 2020]. https://zenodo.org/record/3243509
Burgess, D., Bahane, B., Clairs, T., Danielsen, F., Dalsgaard, S., Funder, M., Hagelberg, N. et al. 2010. Getting ready for REDD+ in Tanzania: a case study of progress and challenges. Oryx, 44(3): 339–351.
Burley, J. 2002. Forest biological diversity: an overview. Unasylva, 209: 3–9.
Burlingame, B. 2000. Editorial: Wild nutrition. Journal of Food Composition and Analysis, 13: 99–100.
Busch, J. & Ferretti-Gallon, K. 2017. What drives deforestation and what stops it? A meta-analysis. Review of Environmental Economics and Policy, 11(1): 3–23.
Camara-Leret, R. & Denney, Z. 2019. Indigenous knowledge of New Guinea’s useful plants: A review. Economic Botany, 73(3): 405–415.
Camara-Leret, R., Fortuna, M.A. & Bascompte, J. 2019. Indigenous knowledge networks in the face of global change. PNAS, 116(20): 9913–9918.
Campese, J., Sunderland, T., Greiber, T. and Oviedo, G. (eds.) 2009. Rights-based approaches: Exploring issues and opportunities for conservation. CIFOR and IUCN. Bogor, Indonesia.
Canuto, M.A., Estrada-Belli, F., Garrison, T.G., Houston, S.D., Acuña, M.J., Kováč, M., Marken, D. et al. 2018. Ancient lowland Maya complexity as revealed by airborne laser scanning of northern Guatemala. Science, 361(6409): p.eaau0137 [online]. [Cited 3 January 2020]. DOI: 10.1126/science.aau0137
Cariñanos, P., Grilo, F., Pinho, P., Casares-Porcel, M., Branquinho, C., Acil, N., Andreucci, M.B. et al. 2019. Estimation of the allergenic potential of urban trees and urban parks: towards the healthy design of urban green spaces of the future. International Journal of Environmental Research and Public Health, 16(8): 1357 [online]. [Cited 3 January 2020]. https://doi.org/10.3390/ijerph16081357
Carnus, J.-M., Parrotta, J., Brockerhoff, E., Arbez, M., Jactel, H., Kremer, A., Lamb, D., O’Hara, K. & Walters, B. 2006. Planted forests and biodiversity. Journal of Forestry, 104(2): 65–77.
Carodenuto, S. 2019. Governance of zero deforestation cocoa in West Africa: New forms of public–private interaction. Environmental Policy and Governance, 29(1): 55–66.
Carr, D.L., Suter, L., & Barbier, A. 2005. Population dynamics and tropical deforestation: State of the debate and conceptual challenges. Population and Environment, 27(1): 89–113.
Castellanos, E., Regalado, O., Pérez, G., Montenegro, R., Ramos, V., & Incer, D. 2011. Mapa de cobertura forestal de Guatemala 2006 y dinámica de la cobertura forestal 2001–2006. Guatemala, Universidad del Valle de Guatemala, Instituto Nacional de Bosques, Consejo Nacional de Áreas Protegidas, Universidad Rafael Landívar.
Castello, L., Hess, L.L., Thapa, R., McGrath, D.G., Arantes, C.C., Renó, V.F. & Isaac, V.J. 2018. Fishery yields vary with land cover on the Amazon River floodplain. Fish and Fisheries, 19(3): 431–440.
CBD. n.d.a. COP decisions – COP2 Decision II/9: Forests and biological diversity. In: Convention on Biological Diversity [online]. Montreal, Canada. [Cited 19 December 2019]. https://www.cbd.int/decision/cop/?id=7082
CBD. n.d.b. What is forest biological diversity? In: Convention on Biological Diversity [online]. Montreal, Canada. [Cited 13 December 2019]. http://www.cbd.int/forest/what.shtml
CBD. 2006. Definitions. In: Convention on Biological Diversity [online]. Montreal, Canada. [Cited 13 January 2020]. https://www.cbd.int/forest/definitions.shtml
CBD. 2009. Invasive alien species. A threat to biodiversity. Montreal, Canada, Secretariat of the Convention on Biological Diversity. [also available at https://www.cbd.int/doc/bioday/2009/idb-2009-booklet-en.pdf].
CBD. 2010a. Decision adopted by the Conference of the Parties to the Convention on Biological Diversity at its tenth meeting. X/2. The Strategic Plan for Biodiversity 2011–2020 and the Aichi Biodiversity Targets. Tenth Meeting of the Conference of the Parties to the Convention on Biological Diversity, Nagoya, Japan, 18–29 October 2010. UNEP/CBD/COP/DEC/X/2. Montreal, Canada, Secretariat of the Convention on Biological Diversity. [also available at https://www.cbd.int/doc/decisions/cop-10/cop-10-dec-02-en.pdf].
CBD. 2010b. Linking Biodiversity Conservation and Poverty Alleviation: A State of Knowledge Review. CBD Technical Series No: 55. Montreal, Canada, Secretariat of the Convention on Biological Diversity. [also available at https://www.cbd.int/doc/publications/cbd-ts-55-en.pdf].
CBD. 2011. Nagoya Protocol on Access to Genetic Resources and the Fair and Equitable Sharing of Benefits Arising from their Utilization to the Convention on Biological Diversity - Text and Annex. Montreal, Canada, Secretariat of the Convention on Biological Diversity.
CBD. 2012a. Resourcing the biodiversity targets: A first assessment of the resources required for implementing the strategic plan for biodiversity 2011–2020. Montreal, Canada, Secretariat of the Convention on Biological Diversity. [also available at https://www.cbd.int/doc/meetings/fin/hlpgar-sp-01/official/hlpgar-sp-01-01-report-en.pdf].
CBD. 2012b. Cities and biodiversity outlook. Montreal, Canada, Secretariat of the Convention on Biological Diversity.
CBD. 2014. Global Biodiversity Outlook 4. Montreal, Canada, Secretariat of the Convention on Biological Diversity. [also available at https://www.cbd.int/gbo/gbo4/publication/gbo4-en-hr.pdf].
CBD. 2016a. Ecosystem restoration: short-term action plan. Decision XIII/5 of the Conference of the Parties to the Convention on Biological Diversity. Montreal, Canada, Secretariat of the Convention on Biological Diversity. [also available at https://www.cbd.int/doc/decisions/cop-13/cop-13-dec-05-en.pdf].
CBD. 2016b. Updated assessment of progress towards Aichi Biodiversity Targets 5 and 15. Thirteenth Meeting of the Conference of the Parties to the Convention on Biological Diversity, Cancun, Mexico, 4–17 December 2016. UNEP/CBD/COP/13/INF/12. Montreal, Canada, Secretariat of the Convention on Biological Diversity.
CBD. 2017. The ABS Clearing-House. In: Convention on Biological Diversity [online]. Montreal, Canada. [Cited 26 December 2019]. https://www.cbd.int/abs/theabsch.shtml
CBD. 2018a. Decision adopted by the Conference of the Parties to the Convention on Biological Diversity. 14/8. Protected areas and other effective area-based conservation measures. 14th meeting of the Conference of the Parties to the CBD, Sharm El-Sheikh, Egypt, 17–29 November 2018. CBD/COP/DEC/14/8. Montreal, Canada, Secretariat of the Convention on Biological Diversity. [also available at https://www.cbd.int/doc/decisions/cop-14/cop-14-dec-08-en.pdf].
CBD. 2018b. Decision adopted by the Conference of the Parties to the Convention on Biological Diversity. 14/7. Sustainable wildlife management. 14th meeting of the Conference of the Parties, Sharm el-Sheikh, Egypt, 17–29 November 2018. CBD/COP/DEC/14/7. Montreal, Canada, Secretariat of the Convention on Biological Diversity. [also available at https://www.cbd.int/doc/decisions/cop-14/cop-14-dec-07-en.pdf].
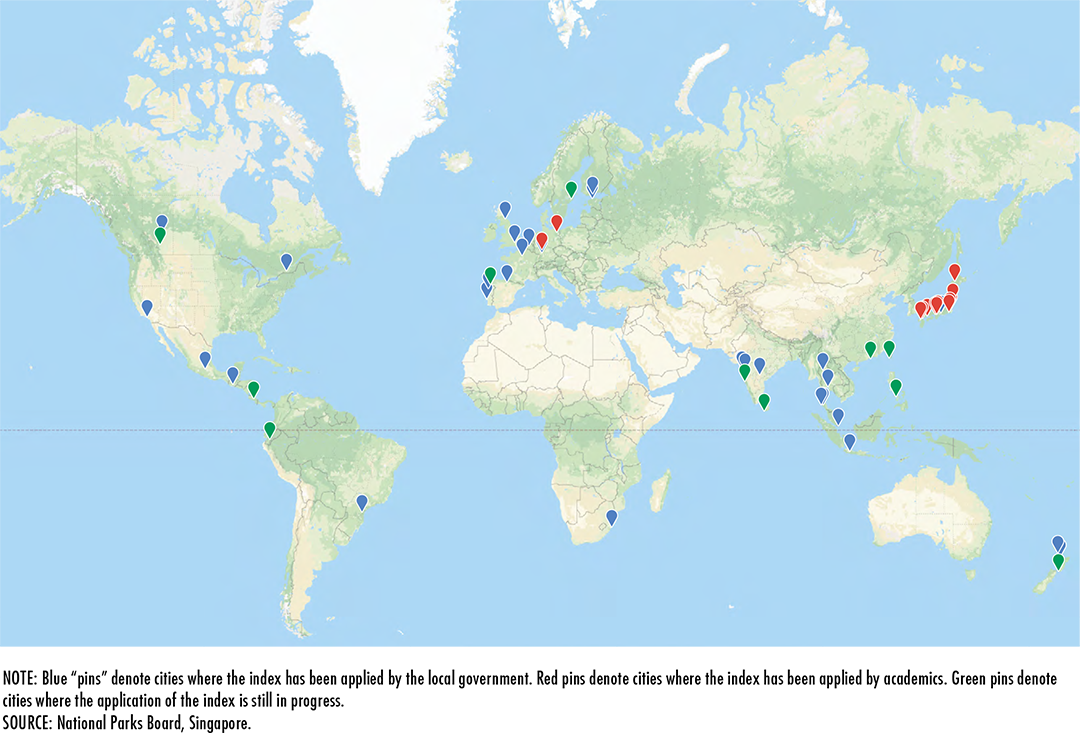
CBD. 2018c. Progress of the application of the Singapore Index on Cities’ Biodiversity. Note by the Executive Secretary. 14th meeting of the Conference of the Parties, Sharm el-Sheikh, Egypt, 17–29 November. CBD/COP/14/INF/34. Montreal, Canada, Secretariat of the Convention on Biological Diversity.
CBD. 2019. The Nagoya Protocol on Access and Benefit-sharing. In: Convention on Biological Diversity [online]. Montreal, Canada. [Cited 19 December 2019]. https://www.cbd.int/abs/
CBD. 2020a. Parties to the Nagoya Protocol. In: Convention on Biological Diversity [online]. Montreal, Canada. [Cited 13 January 2020]. https://www.cbd.int/abs/nagoya-protocol/signatories/
CBD. 2020b. The Access and Benefit-Sharing Clearing-House [online]. Montreal, Canada. [Cited 13 January 2020]. https://absch.cbd.int/
CEPF. 2020. Biodiversity hotspots defined. In: Critical Ecosystem Partnership Fund [online]. Arlington, VA, USA. [Cited 13 January 2020]. https://www.cepf.net/our-work/biodiversity-hotspots/hotspots-defined
Ceres. 2019. Out on a limb: The state of corporate no-deforestation commitments and reporting indicators that count. Boston, MA, USA. [also available at www.ceres.org/sites/default/files/reports/2019-06/OutOnaLimb.pdf].
CFS. 2014. Principles for responsible investment in agriculture and food systems. Rome. [also available at http://www.fao.org/3/a-au866e.pdf].
CGRFA. 2019. First report on the implementation of the Global Plan of Action for the Conservation, Sustainable Use and Development of Forest Genetic Resources. 17th regular session, Rome, 18–22 February 2019. CGRFA-17/19/10.2/Inf.1. Rome. [also available at http://www.fao.org/3/my877en/my877en.pdf].
Chan, K.M.A., Pringle, R.M., Ranganathan, J., Boggs, C.L., Chan, Y.L., Ehrlich, P.R., Haff, P.K., Heller, N.E, Al-Khafaji, K. & Macmynowski, D.P. 2007. When agendas collide: human welfare and biological conservation. Conservation Biology, 21(1): 59–68.
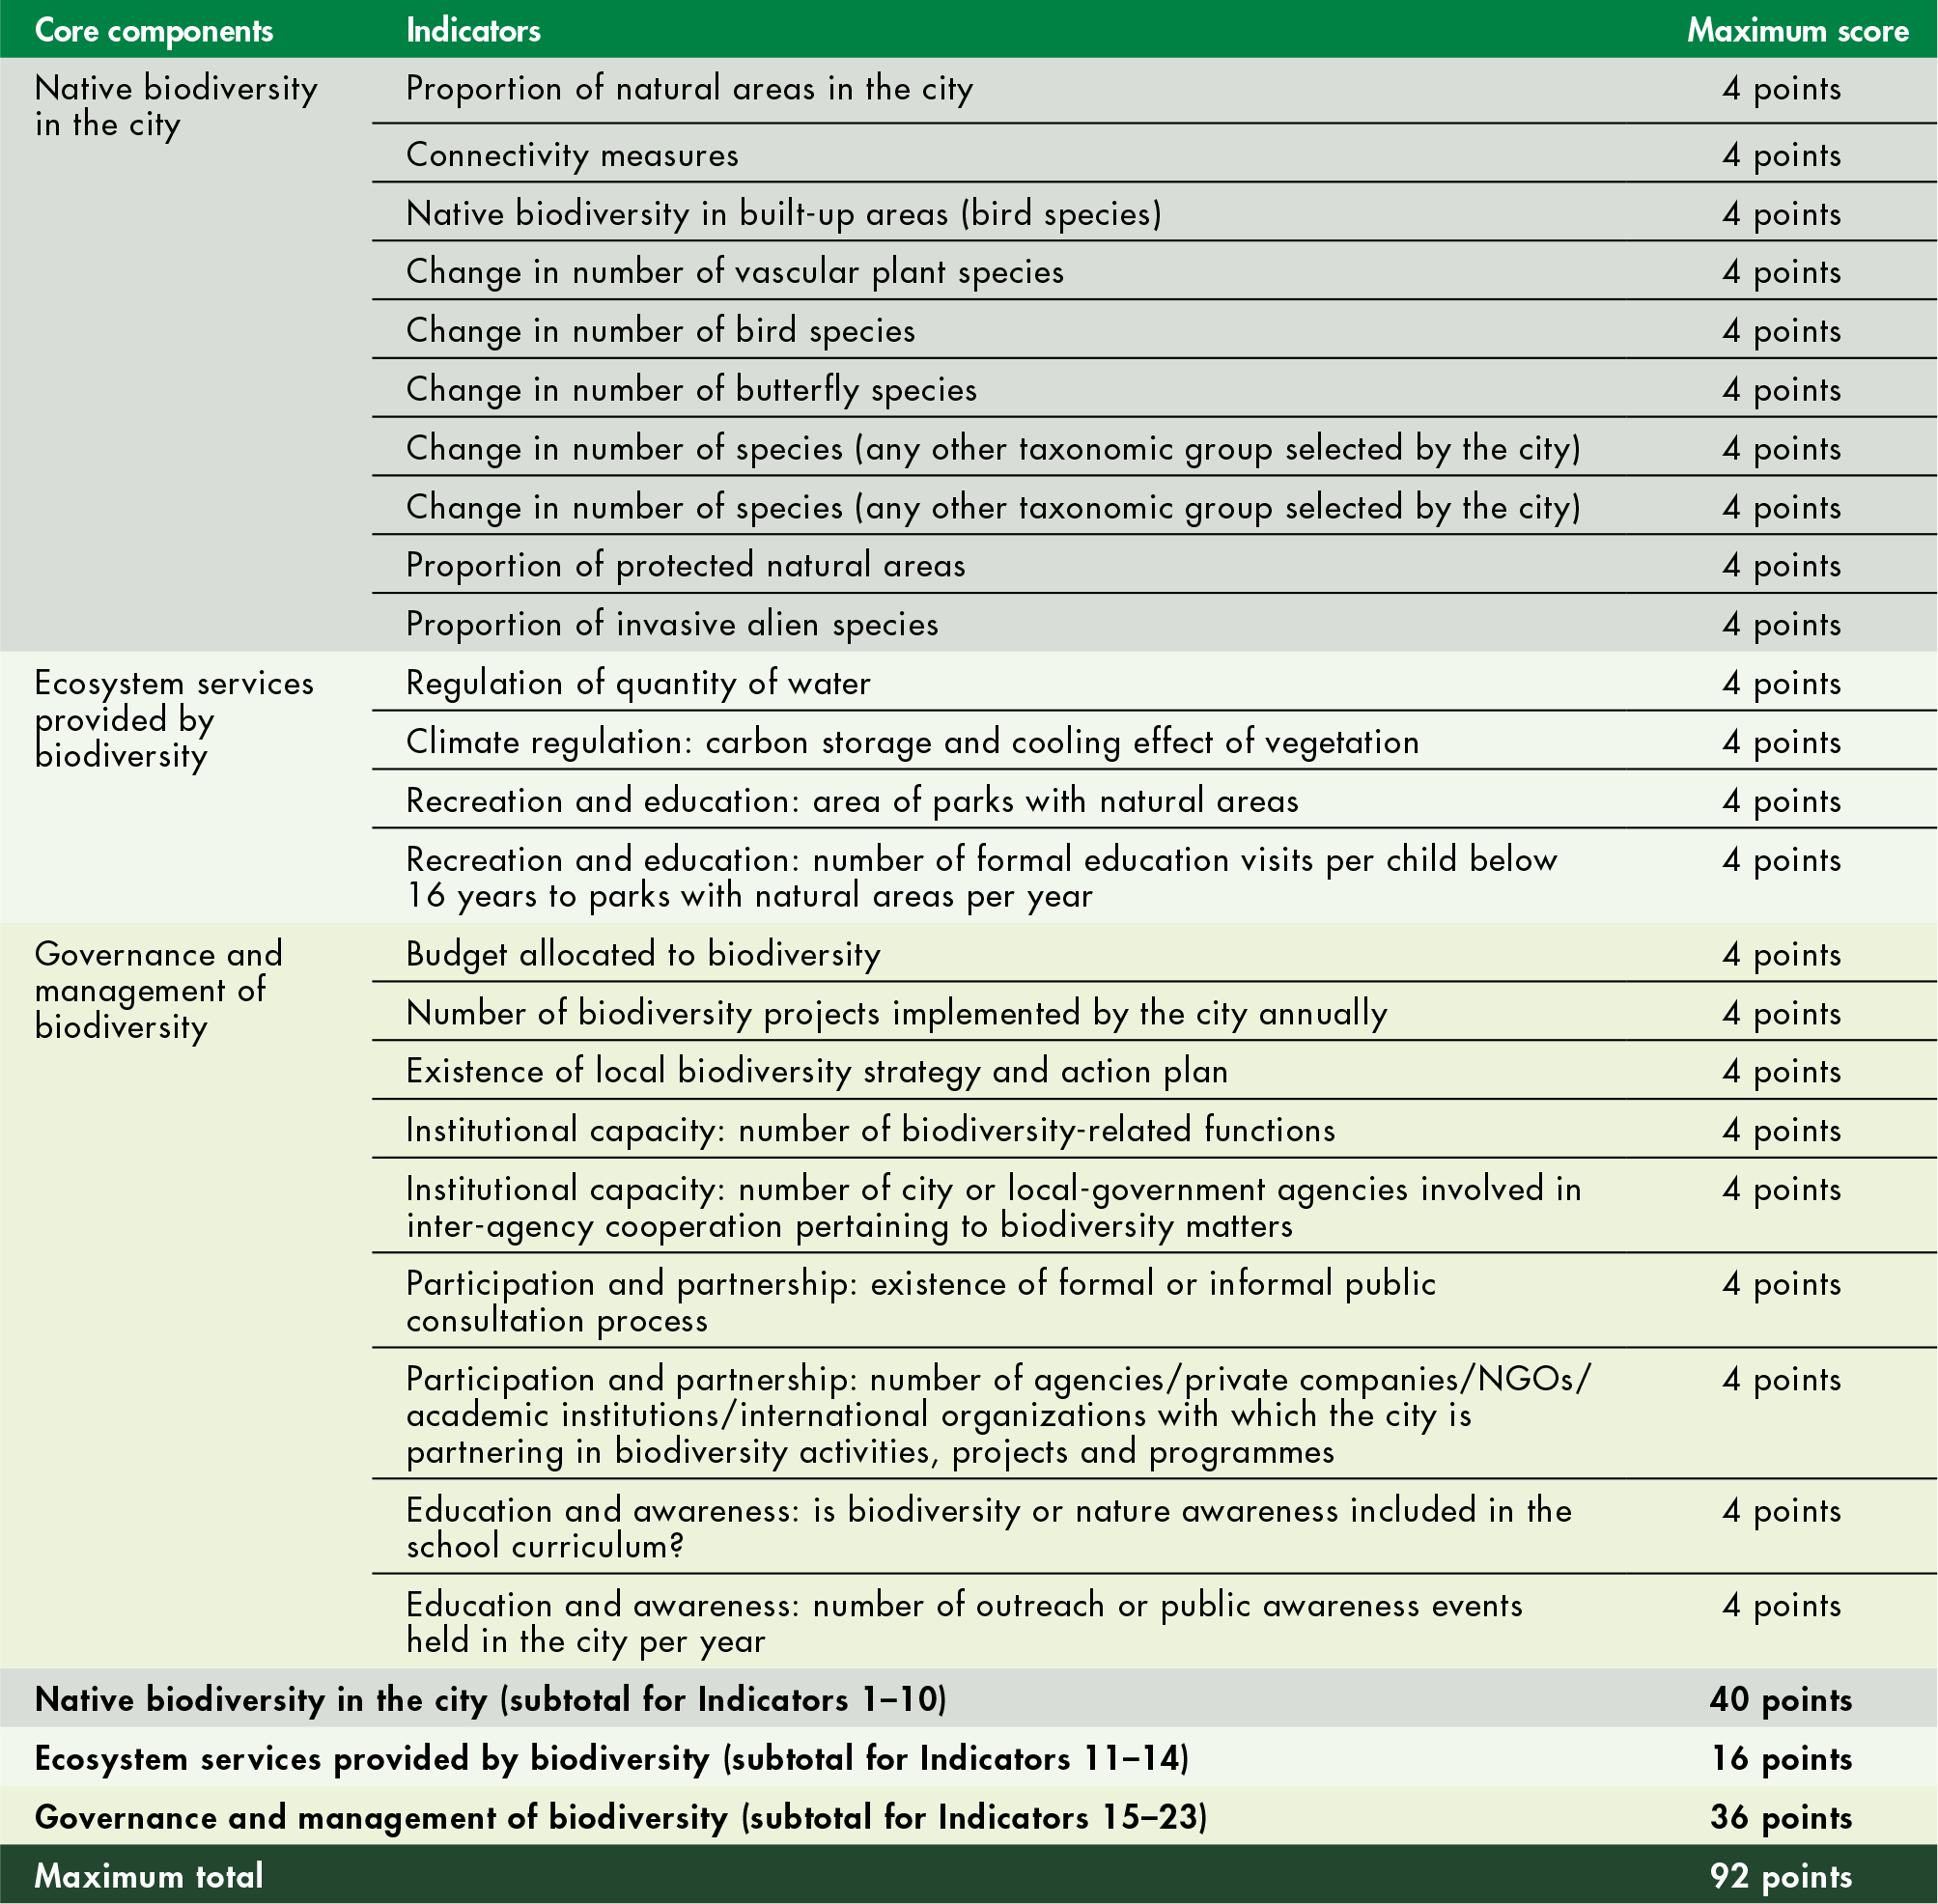
Chan, L., Hillel, O., Elmqvist, T., Werner, P., Holman, N., Mader, A. & Calcaterra, E. 2014. User’s manual on the Singapore Index on Cities’ Biodiversity (also known as the City Biodiversity Index). Singapore, National Parks Board, Singapore.
Chao, S. 2012. Forest peoples: numbers across the world. Moreton-in-Marsh, UK, Forest Peoples Programme.
Chazdon, R.L., Bodin, B., Guariguata, M., Lamb, D., Walder, B., Chokkalingam, U. & Shono, K. 2017. Partnering with nature: The case for natural regeneration in forest and landscape restoration. FERI Policy Brief. Montreal, Canada, FERI.
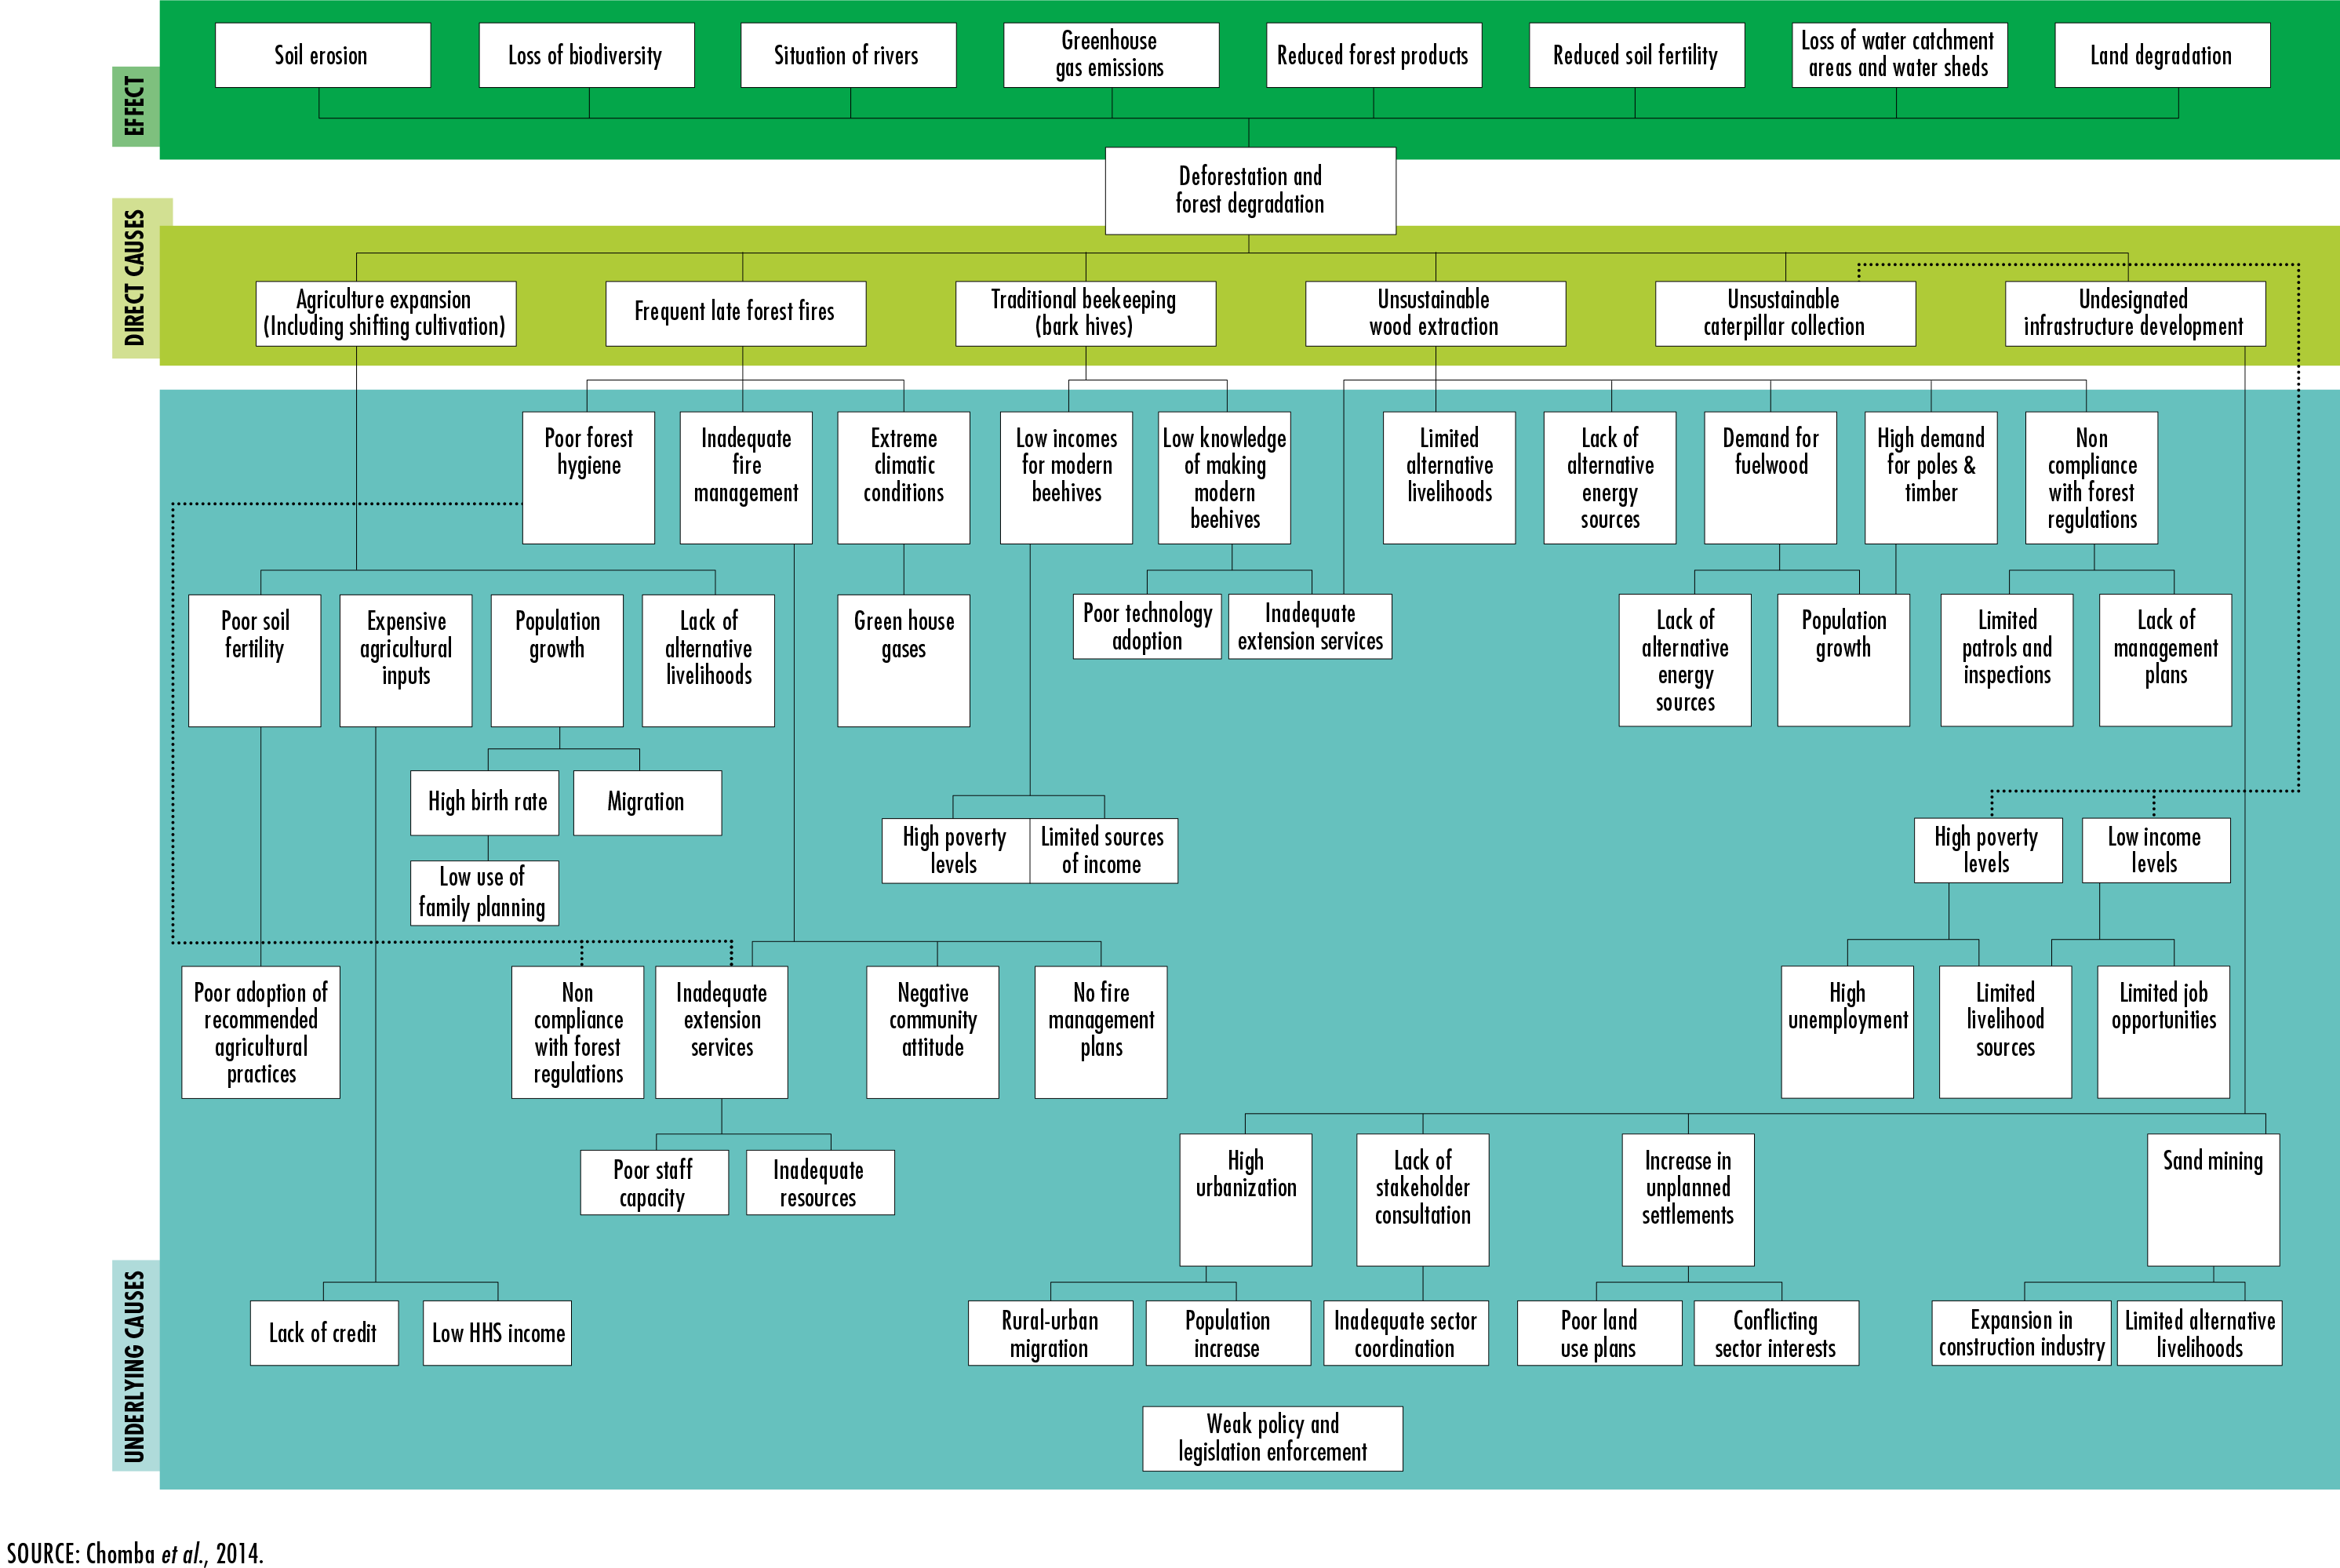
Chomba, B.M., Tembo, O., Mutandi, K., Mtongo, C.S. & Makano, A. 2014. Drivers of deforestation, identification of threatened forests and forest co-benefits other than carbon from REDD+ implementation in Zambia. A consultancy report prepared for the Forestry Department and the Food and Agriculture Organization of the United Nations under the national UN-REDD Programme. Lusaka, Ministry of Lands, Natural Resources and Environmental Protection. [also available at http://landforlions.org/data/documents/drivers-deforestation-Zambia-WEB_final.pdf].
CITES. 1983. Convention on International Trade in Endangered Species of Wild Flora and Fauna [online]. [Cited 19 December 2019]. https://www.cites.org/sites/default/files/eng/disc/CITES-Convention-EN.pdf
CITES. 2019. Projects and initiatives – Supporting sustainable management of endangered tree species. In: Convention on International Trade in Endangered Species of Wild Flora and Fauna [online]. Geneva, Switzerland. [Cited 4 January 2020]. https://www.cites.org/eng/prog/flora/trees/trees_project
Clean Cooking Alliance. 2015. Five years of impact 2010–2015. In: Clean Cooking Alliance [online]. New York, USA, United Nations Foundation. [Cited 4 January 2020]. https://www.cleancookingalliance.org/resources/reports/fiveyears.html
Coad, L., Fa, J., Abernathy, K., Van Vliet, N., Santamaria, C., Wilkie, D.S., El Biziri, H.R., Ingram, D.J., Cawthorn, D. & Nasi, R. 2019. Towards a sustainable, participatory and inclusive wildmeat sector. Bogor, Indonesia, CIFOR.
Coady, D., Parry, I., Le, N.-P. & Shang, B. 2019. Global fossil fuel subsidies remain large: an update based on country-level estimates. IMF Working Paper. Washington, DC, IMF.
COMIFAC. 2020. Commission des Forêts d’Afrique Centrale [online]. Yaoundé. [Cited 2 January 2020]. https://comifac.org/
CONAP & WCS. 2018. Monitoreo de la Gobernabilidad en la Reserva de la Biosfera Maya: Actualización al año 2017. Con el apoyo de USAID y el USDOI/ITAP. 56 pp. San Benito, Petén, Guatemala. [also available at: https://conap.gob.gt/wp-content/uploads/2019/10/MONITOREO-DE-LA-GOBERNABILIDAD-EN-LA-RBM.pdf]
Cook, B., Anchukaitis, K., Kaplan, J., Puma, M., Kelley, M. & Gueyffier, D. 2012. Pre-Columbian deforestation as an amplifier of drought in Mesoamerica. Geophysical Research Letters, 39(16): L16706 [online]. [Cited 4 January 2020]. https://doi.org/10.1029/2012GL052565
CPW. 2016. Sustainable wildlife management and human–wildlife conflict. CPW Fact Sheet 4. Rome. [also available at http://www.fao.org/3/a-i4893e.pdf].
CRITFC. 2020. The Plan: Wy-Kan-Ush-Mi Wa-Kish-Wit. In: Colombia River Inter-Tribal Fish Commission [online]. Portland, OR, USA. [Cited 1 January 2020]. https://www.critfc.org/fish-and-watersheds/fish-and-habitat-restoration/the-plan-wy-kan-ush-mi-wa-kish-wit/
Dargie, G.C., Lewis, S.L., Lawson, I.T., Mitchard, E.T.A., Page, S.E., Bocko, Y.E. & Ifo, S.A. 2017. Age, extent and carbon storage of the central Congo Basin peatland complex. Nature, 542(7639): 86–90.
Dave, R., Saint-Laurent, C., Murray, L., Antunes Daldegan, G., Brouwer, R., de Mattos Scaramuzza, C.A., Raes, L. et al. 2019. Second Bonn Challenge progress report – application of the barometer in 2018. Gland, Switzerland, IUCN.
Davies, J.D., Hill, R., Walsh, F., Sandford, M., Smyth, D. & Holmes, M.C. 2013. Innovation in management plans for community conserved areas: Experiences from Australian indigenous protected areas. Ecology and Society, 18(2): 14 [online]. [Cited 4 January 2020]. http://dx.doi.org/10.5751/ES-05404-180214
Dawson, I.K., Leakey, R., Clement, C.R., Weber, J.C., Cornelius, J.P., Roshetko, J.M., Vinceti, B. et al. 2014. The management of tree genetic resources and the livelihoods of rural communities in the tropics: Non-timber forest products, smallholder agroforestry practices and tree commodity crops. Global Forest Genetic Resources, 333: 9–21.
Deacon, R.T. 1995. Assessing the relationship between government policy and deforestation. Journal of Environmental Economics and Management, 28(1):1–18.
Delelegn, A., Sahile, S. & Husen, A. 2018. Water purification and antibacterial efficacy of Moringa oleifera Lam. Agriculture and Food Security, 7: Article 25 [online]. [Cited 4 January 2020]. https://doi.org/10.1186/s40066-018-0177-1
de Vries, S.M.G., Alan, M., Bozzano, M., Burianek, V., Collin, E., Cottrell, J., Ivankovic, M. et al. 2015. Pan-European strategy for genetic conservation of forest trees and establishment of a core network of dynamic conservation units. European Forest Genetic Resources Programme (EUFORGEN). Rome, Bioversity International.
Ding, H., Veit, P.G., Blackman, A., Gray, E., Reytar, K., Altamirano, J.C. & Hodgdon, B. 2016. Climate benefits, tenure costs: the economic case for securing indigenous land rights in the Amazon. Washington, DC, WRI.
Dirzo, R. & Raven, P.H. 2003. Global state of biodiversity and loss. Annual Review of Environment and Resources, 28: 137–167.
Dounias, E. & Ichikawa, M. 2017. Seasonal bushmeat hunger in the Congo Basin. EcoHealth, 14: 575–590.
Dourojeanni, M. 2017. [Opinión] ¿Las sociedades prehispánicas cuidaron mejor la Amazonía? In: SPDA Actualidad Ambiental [online]. Lima. [Cited 4 January 2020]. www.actualidadambiental.pe/opinion-las-sociedades-preshispanicas-cuidaron-mejor-la-amazonia/
Drescher, M. & Brenner, J.C. 2018. The practice and promise of private land conservation. Ecology and Society 23(2) [online]. [Cited 4 January 2020]. www.jstor.org/stable/26799076
Dudley, N., Jonas, H., Nelson, F., Parrish, J., Pyhälä, A., Stolton, S. & Watson, J. 2018. The essential role of other effective area-based conservation measures in achieving big bold conservation targets. Global Ecology and Conservation, 15: e00424 [online]. [Cited 4 January 2020]. https://doi.org/10.1016/j.gecco.2018.e00424
Duffy, J., Godwin, C. & Cardinale, B. 2017. Biodiversity effects in the wild are common and as strong as key drivers of productivity. Nature, 549: 261–264.
EC. 2019a. Communication from the Commission to the European Parliament, the Council, the European Economic and Social Committee and the Committee of the Regions: Stepping up EU action to protect and restore the world’s forests. COM(2019) 352 final. Brussels. (also available at https://ec.europa.eu/info/sites/info/files/communication-eu-action-protect-restore-forests_en.pdf).
EC. 2019b. Nature and biodiversity – Natura 2000. In: European Commission, Environment [online]. Brussels. [Cited 4 January 2020]. https://ec.europa.eu/environment/nature/natura2000/index_en.htm
Ege, M.J., Mayer, M., Normand, A.C., Genuneit, J., Cookson, W.O., Braun-Fahrländer, C., Heederik, D., Piarroux, R. & von Mutius, E. 2011. Exposure to environmental microorganisms and childhood asthma. The New England Journal of Medicine, 364: 701–709.
Eilers, E.J., Kremen, C., Smith Greenleaf, S., Garber, A.K. & Klein, A.-M. 2011. Contribution of pollinator-mediated crops to nutrients in the human food supply. PLOS ONE, 6(6): e21363 [online]. [Cited 13 January 2020]. https://doi.org/10.1371/journal.pone.0021363
Eriksson, M., Samuelson, L., Jägrud, L., Mattsson, E., Celander, T., Malmer, A., Bengtsson, K. et al. 2018. Water, forests, people: The Swedish Experience in building resilient landscapes. Environmental Management, 62(1): 45–57.
Erwin, T.L. 1982. Tropical forests: their richness in Coleopteran and other arthropod species. The Coleopterists’ Bulletin, 36: 74–75., cited by Dirzo, R. & Raven, P. H. 2003. Global state of biodiversity and loss. Annual Review of Environment and Resources, 28: 137–167.
ESA CCI. 2017. Global Land Cover Maps for 2015. In: Land Cover CCI Climate Research Data Package [online]. ESA Climate Change Initiative – Land Cover led by UCLouvain. https://www.esa-landcover-cci.org/?q=node/164
EU. 2011. Voluntary Partnership Agreement between the European Union and the Republic of Cameroon on forest law enforcement, governance and trade in timber and derived products to the European Union (FLEGT). 6 April. Official Journal of the European Union, 92: 4–125.
EU FLEGT Facility. n.d. FLEGT licensed timber – Essential information [online]. Brussels. [Cited 4 January 2020]. www.flegtlicence.org/home
Evans, N.P., Bauska, T.K., Gázquez-Sánchez, F., Brenner, M., Curtis, J.H. & Hodell, D.A. 2018. Quantification of drought during the collapse of the classic Maya civilization. Science, 361(6401): 498–501.
Fa, J.E., Currie, D. & Meeuwig, J. 2003. Bushmeat and food security in the Congo Basin: linkages between wildlife and people’s future. Environmental Conservation, 30: 71–78.
Fabricant, D.S. & Fransworth, N.R. 2001. The value of plants used in traditional medicine for drug discovery. Environmental Health Perspectives, 109(1): 69–75.
FairWild Foundation. 2019. The FairWild standard [online]. Cambridge, UK. [Cited 18 December 2019]. https://www.fairwild.org/the-fairwild-standard
FAO. 1989. Forestry and food security. FAO Forestry Paper No. 90. Rome. [also available at http://www.fao.org/3/T0178E/T0178E00.htm].
FAO. 1997. The State of the World’s Plant Genetic Resources for Food and Agriculture. Rome. [also available at http://www.fao.org/tempref/docrep/fao/meeting/015/w7324e.pdf].
FAO. 2006. Fire management: voluntary guidelines. Principles and strategic actions. Fire Management Working Paper 17. Rome. [also available at http://www.fao.org/3/j9255e/j9255e00.htm].
FAO. 2007. The State of the World’s Animal Genetic Resources for Food and Agriculture. Rome. [also available at http://www.fao.org/3/a-a1250e.pdf].
FAO. 2009. Declaration of the World Food Summit on Food Security [online]. Rome. [Cited 4 January 2020]. http://www.fao.org/3/w3613e/w3613e00.htm
FAO. 2010a. The Second Report on the State of the World’s Plant Genetic Resources for Food and Agriculture. Rome. [also available at http://www.fao.org/3/i1500e/i1500e.pdf].
FAO. 2010b. Global Forest Resources Assessment 2010 – Main report. FAO Forestry Paper No. 163. Rome. [also available at http://www.fao.org/3/i1757e/i1757e00.htm].
FAO. 2011a. International Plant Protection Convention. Rome, Secretariat of the International Plant Protection Convention. [also available at https://www.ippc.int/static/media/files/publication/en/2019/02/1329129099_ippc_2011-12-01_reformatted.pdf].
FAO. 2011b. State of the World’s Forests 2011. Rome. [also available at http://www.fao.org/3/i2000e/i2000e00.htm].
FAO. 2012a. Global ecological zones for FAO forest reporting: 2010 Update. Forest Resources Assessment Working Paper 179. Rome. [also available at http://www.fao.org/3/ap861e/ap861e00.pdf].
FAO. 2012b. Voluntary guidelines on the responsible governance of tenure of land, fisheries and forests in the context of national food security. Rome. [also available at http://www.fao.org/3/a-i2801e.pdf].
FAO. 2013a. Forests and trees outside forests are essential for global food security and nutrition. Summary of the International Conference on Forests for Food Security and Nutrition, Rome, 13–15 May 2013. Rome. [also available at http://www.fao.org/3/aq110e/aq110e.pdf].
FAO. 2013b. Edible insects – future prospects for food and feed security. FAO Forestry Paper No. 171. Rome. [also available at http://www.fao.org/3/i3253e/i3253e.pdf].
FAO. 2013c. Six-legged livestock: edible insect farming, collection and marketing in Thailand. RAP Publication No. 2013/03. Bangkok, Thailand, Food and Agriculture Organization of the United Nations, Regional Office for Asia and the Pacific. [also available at http://www.fao.org/3/a-i3246e.pdf].
FAO. 2014a. The State of the World’s Forest Genetic Resources. Rome. [also available at http://www.fao.org/forestry/fgr/64582/en/].
FAO. 2014b. Global plan of action for forest genetic resources. Rome. (available at http://www.fao.org/3/a-i3849e.pdf).
FAO. 2014c. State of the World’s Forests 2014. Rome. [also available at http://www.fao.org/3/a-i3710e.pdf].
FAO. 2014d. Women in forestry: Challenges and opportunities. Rome. [also available at http://www.fao.org/3/a-i3924e.pdf].
FAO. 2015a. The Second Report on the State of the World’s Animal Genetic Resources for Food and Agriculture. Rome. [also available at http://www.fao.org/3/a-i4787e.pdf].
FAO. 2015b. Global guidelines for the restoration of degraded forests and landscapes in drylands: building resilience and benefiting livelihoods. Forestry Paper No. 175. Rome. [also available at http://www.fao.org/3/a-i5036e.pdf].
FAO. 2015c. Global Forest Resources Assessment 2015. How are the world’s forest changing? Rome. 2nd edition. Rome. [also available at http://www.fao.org/3/a-i4793e.pdf].
FAO. 2016a. Follow-up to the second International Conference on Nutrition. 23rd session of the Committee on Forestry, Rome, 18–22 July 2016. COFO/2016/7.4. Rome. [also available at www.fao.org/3/a-mq485e.pdf].
FAO. 2016b. Payments for forest environmental services in sub-Saharan Africa: a practical guide. Accra, FAO. [also available at http://www.fao.org/3/a-i5578e.pdf].
FAO. 2017a. Sustainable woodfuel for food security. A smart choice: green, renewable and affordable. Working paper. Rome. [also available at http://www.fao.org/3/a-i7917e.pdf].
FAO. 2017b. Strengthening sector policies for better food security and nutrition results – Forestry. Policy Guidance Note 3. Rome. [also available at http://www.fao.org/3/a-i7215e.pdf].
FAO. 2017c. Non-wood forest products in international statistical systems. Rome. [also available at http://www.fao.org/3/a-i6731e.pdf].
FAO. 2017d. The Agadir commitment towards a Mediterranean regional initiative on forest and landscape restoration. AFWC/EFC/NEFC Committee on Mediterranean Forestry Questions – Silva Mediterranea, 22nd session, Agadir, Morocco, 22 March 2017. [also available at www.fao.org/forestry/45685-0ad87e3a1d4ccc359b37c38ffcbb5b1fc.pdf].
FAO. 2017e. The future of food and agriculture – Trends and challenges. Rome. [also available at http://www.fao.org/3/a-i6583e.pdf].
FAO. 2018a. Terms and definitions: FRA 2020. Forest Resources Assessment Working Paper 188. Rome. [also available at http://www.fao.org/3/I8661EN/i8661en.pdf].
FAO. 2018b. State of the World’s Forests 2018. Rome. [also available at http://www.fao.org/3/I9535EN/i9535en.pdf].
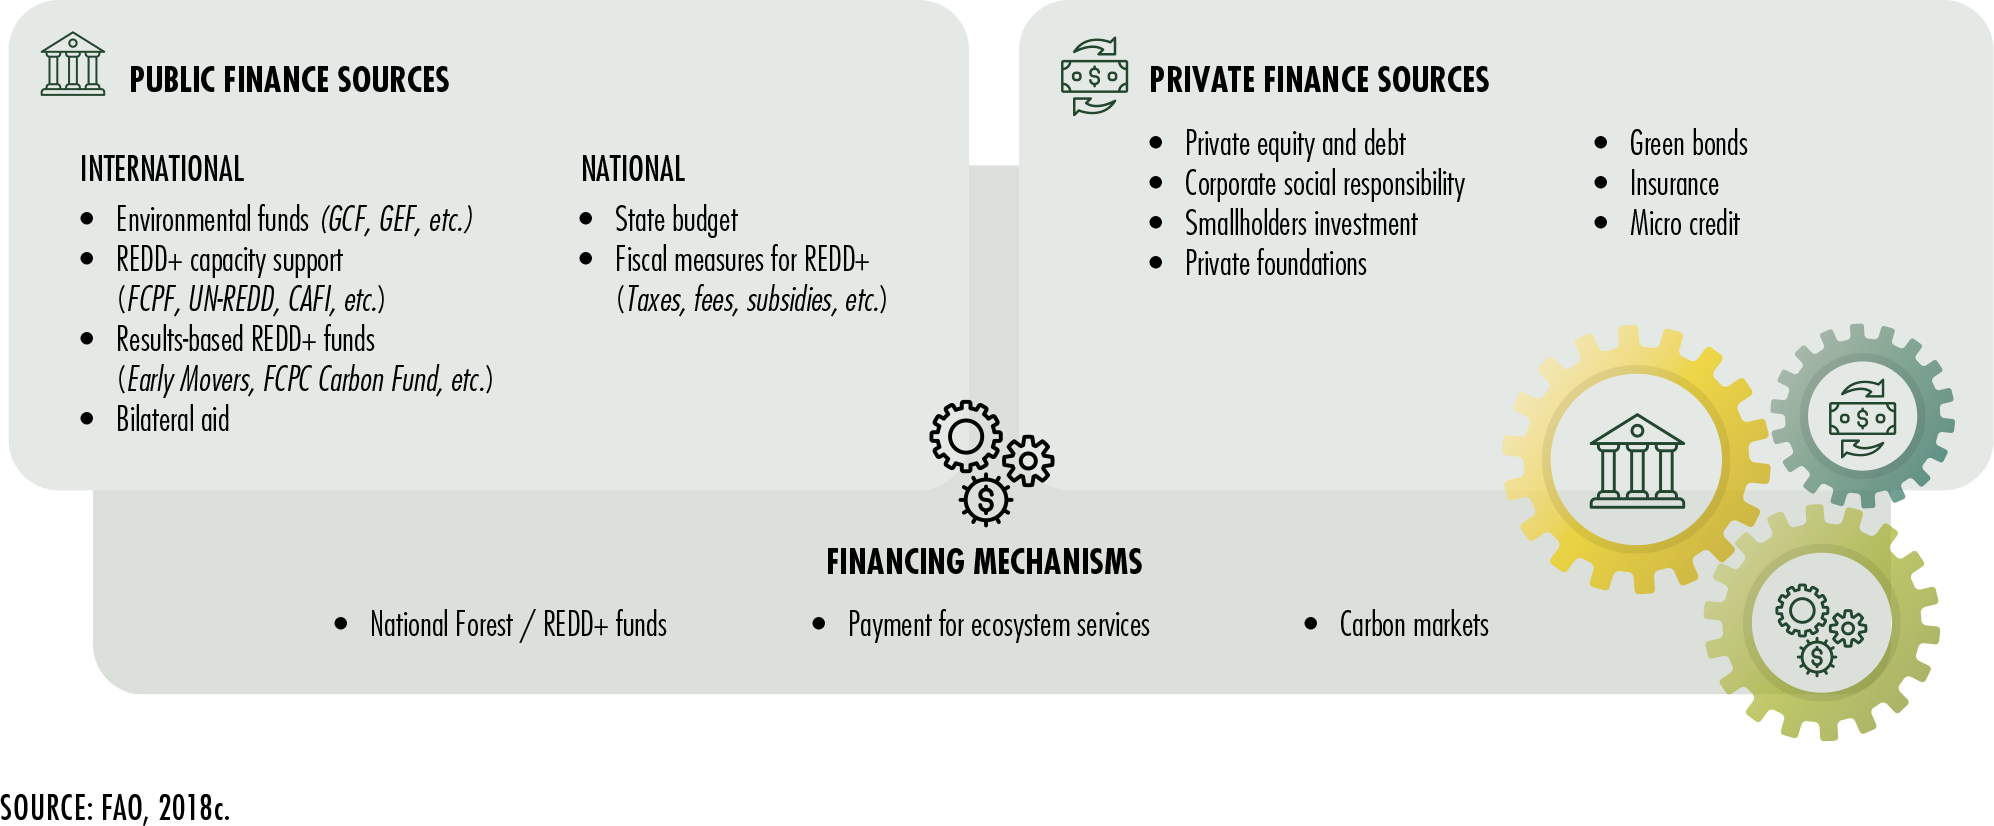
FAO. 2018c. REDD+ finance and investments. Rome. [also available at http://www.fao.org/3/CA0907EN/ca0907en.pdf].
FAO. 2019a. The State of the World’s Biodiversity for Food and Agriculture. Rome, FAO and Commission on Genetic Resources for Food and Agriculture. [also available at http://www.fao.org/3/CA3129EN/CA3129EN.pdf].
FAO. 2019b. The State of the World’s Aquatic Genetic Resources for Food and Agriculture. Rome. [also available at http://www.fao.org/3/CA5256EN/CA5256EN.pdf].
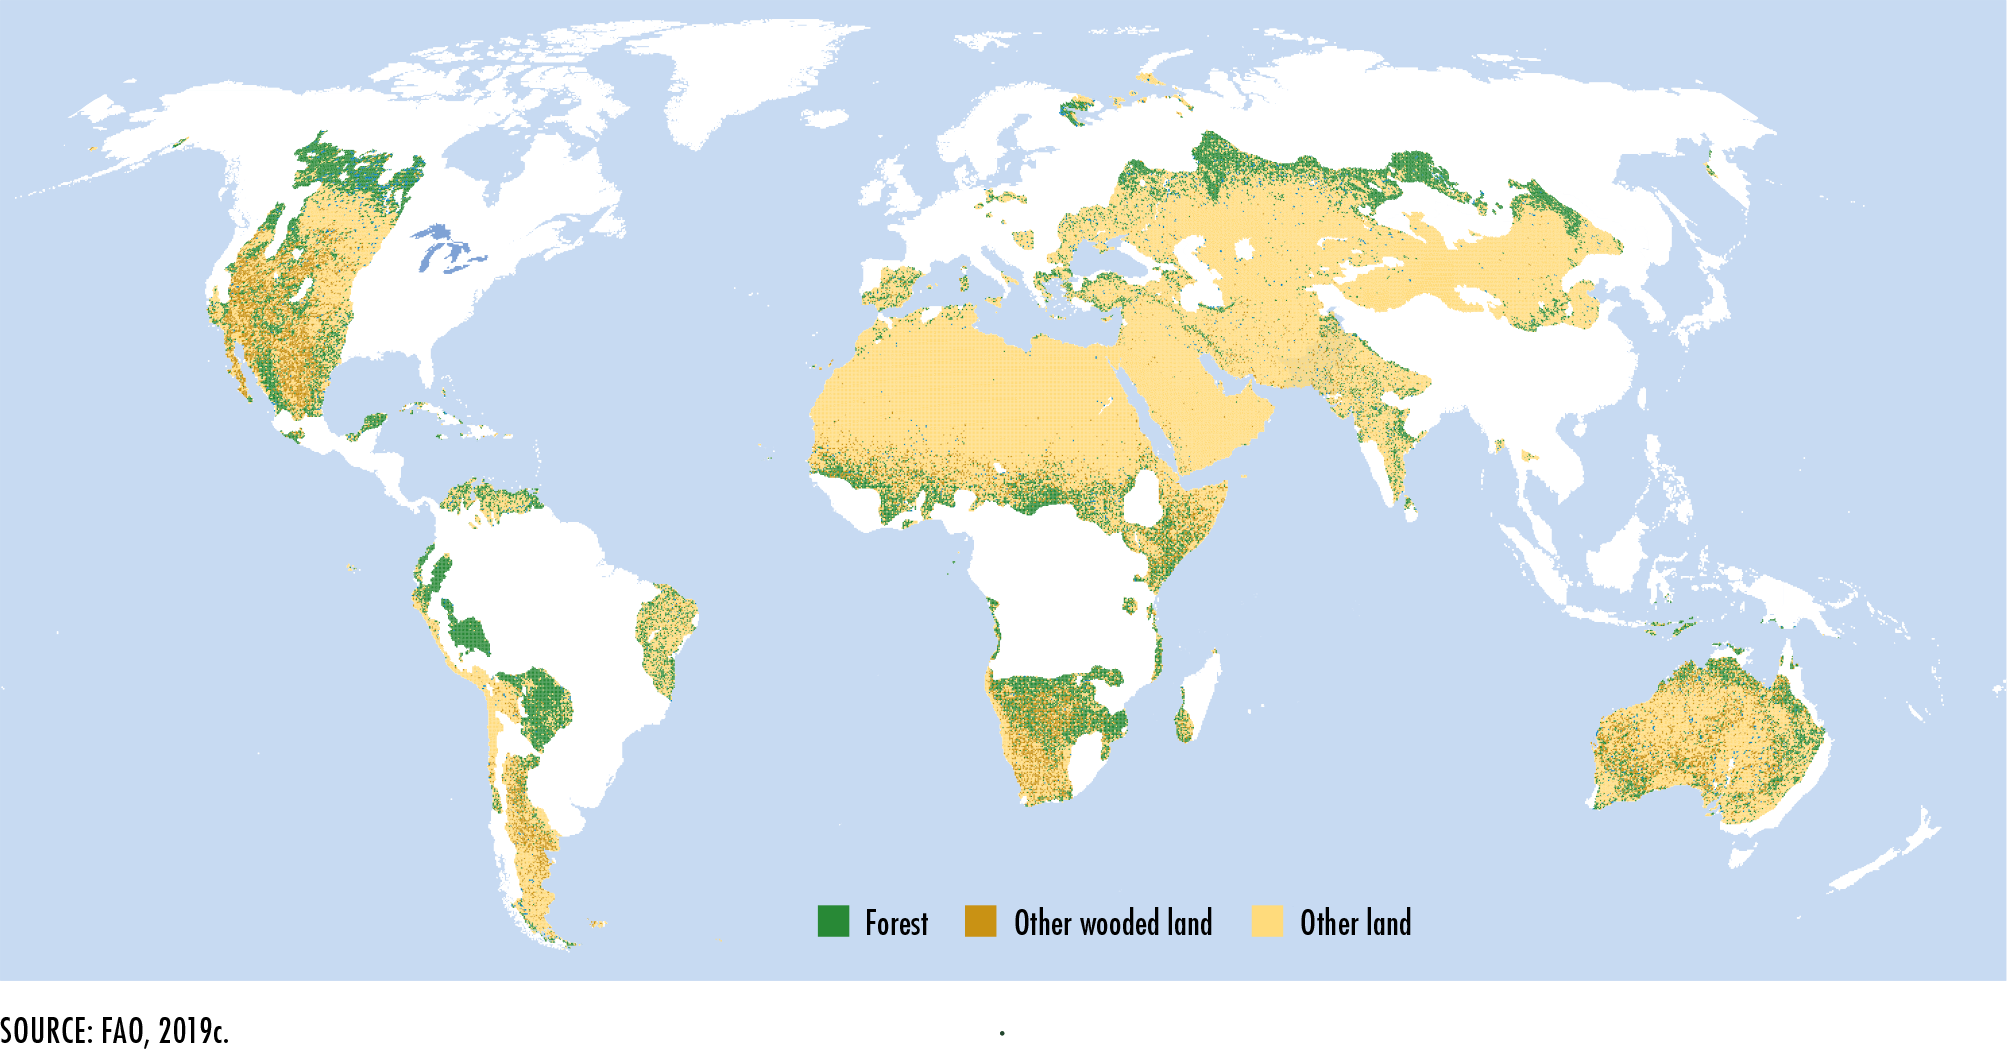
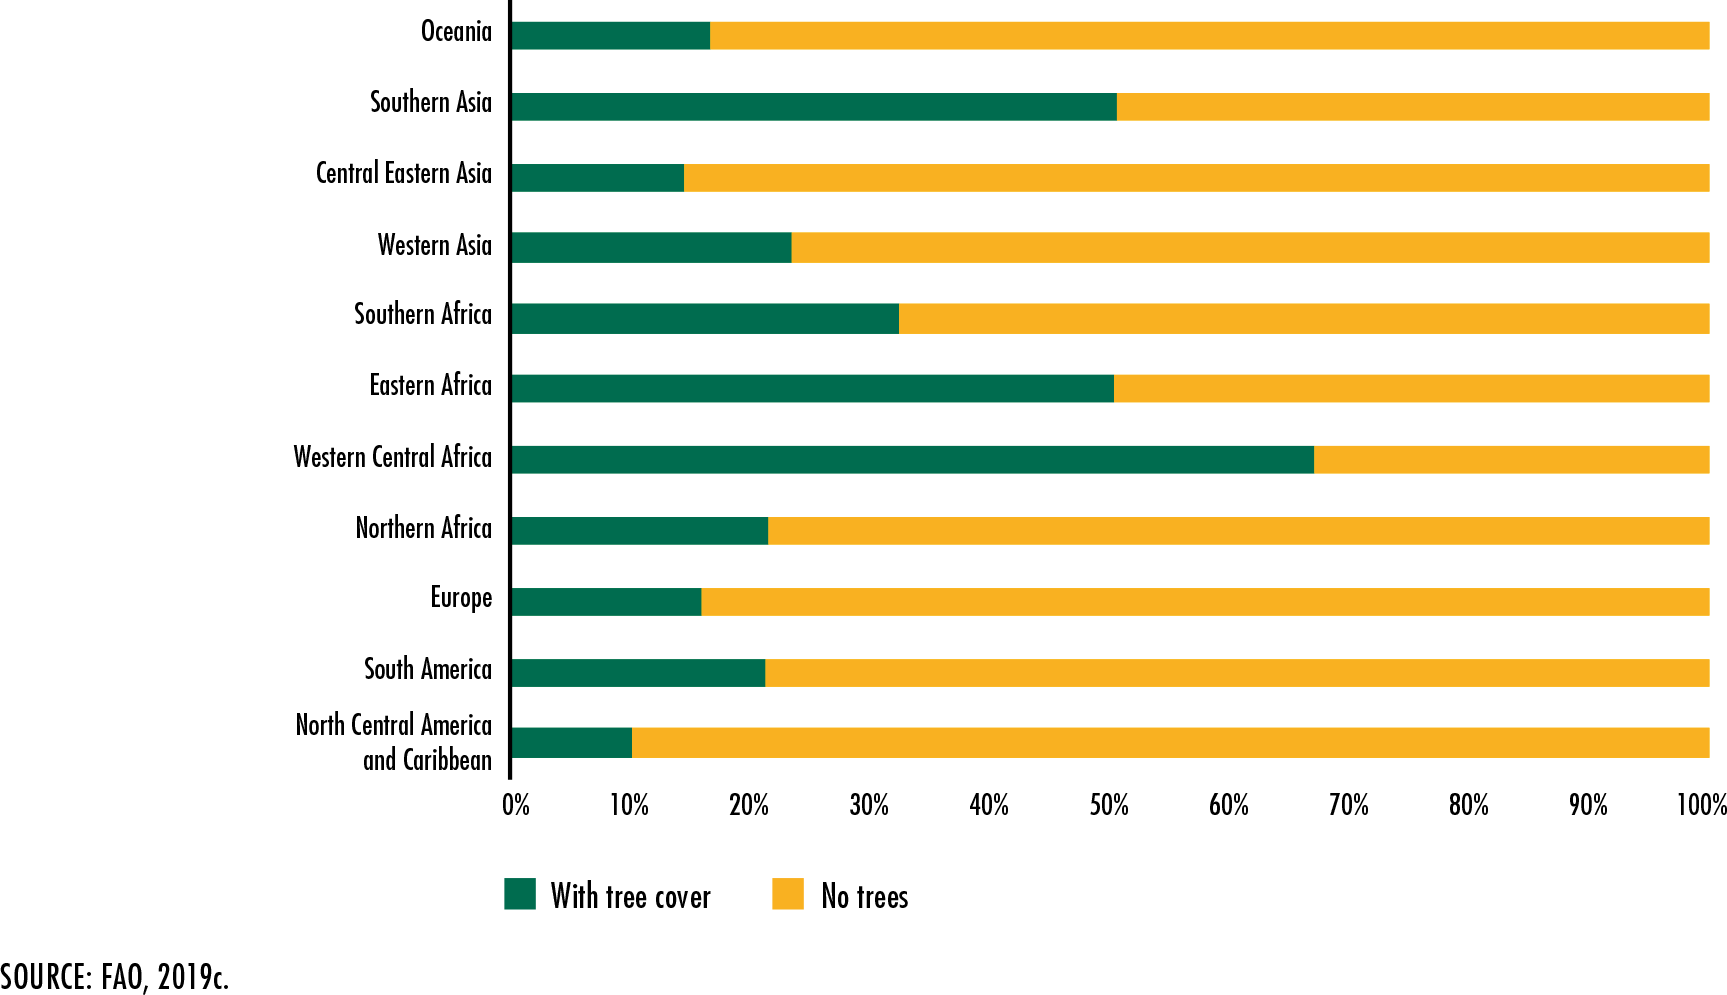
FAO. 2019c. Trees, forests and land use in drylands: the first global assessment – Full report. FAO Forestry Paper No. 184. Rome. [also available at http://www.fao.org/3/ca7148en/ca7148en.pdf].
FAO. 2019d. International Treaty on Plant Genetic Resources for Food and Agriculture [online]. [Cited 13 January 2020]. http://www.fao.org/fileadmin/user_upload/legal/docs/033s-e.pdf
FAO. 2019e. FAOSTAT. In: Food and Agriculture Organization of the United Nations [online]. Rome. [Cited 4 January 2020]. www.fao.org/faostat
FAO. 2019f. Collaborative Partnership on Sustainable Wildlife Management. In: Food and Agriculture Organization of the United Nations [online]. Rome. [Cited 18 December 2019]. http://www.fao.org/forestry/wildlife-partnership/en/
FAO. 2019g. Restoring forest landscapes through assisted natural regeneration (ANR) – A practical manual. Bangkok. [also available at http://www.fao.org/3/ca4191en/CA4191EN.pdf]
FAO. 2019h. Action Against Desertification. In: Food and Agriculture Organization of the United Nations [online]. Rome. [Cited 4 January 2020]. http://www.fao.org/in-action/action-against-desertification
FAO. 2019i. Championing sustainable agriculture in the 
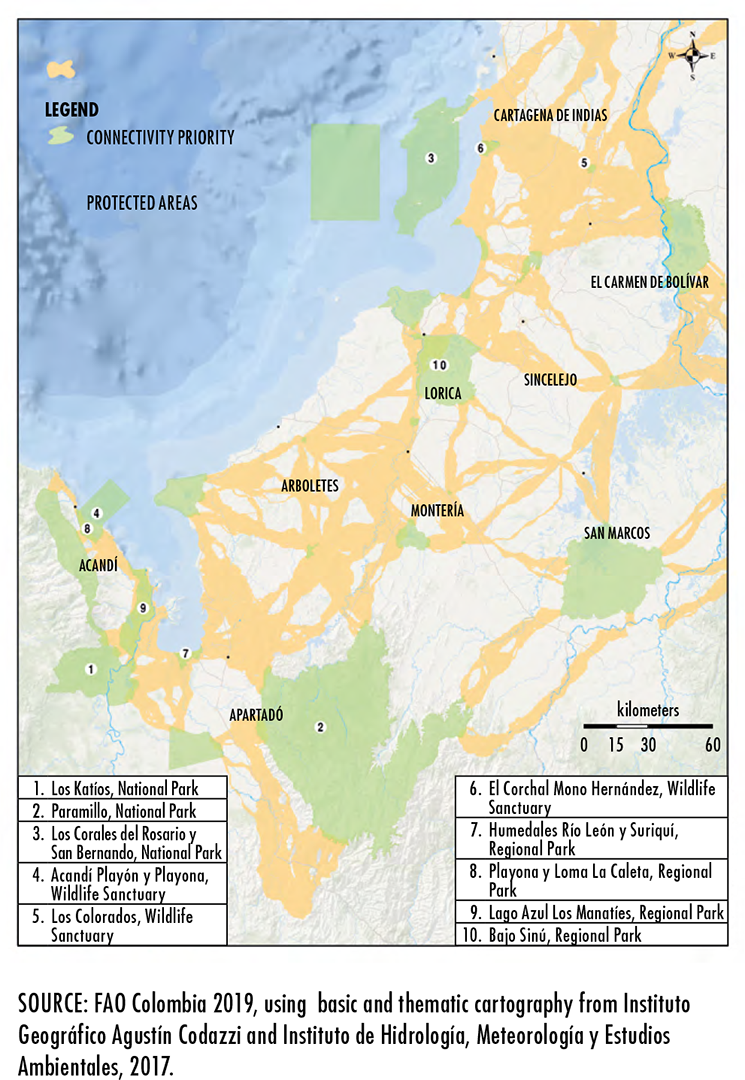
Caribbean Region of Colombia: a case study. Rome. [also available at www.fao.org/3/ca6753en/CA6753EN.pdf].
FAO. 2019j. Sustainable Food and Agriculture – An Integrated Approach, by Campanhola, C. and Pandey, S. (eds). FAO and Elsevier.
FAO. 2020. Global Forest Resources Assessment 2020 – Main report. Rome.
FAO. forthcoming. Analysis of 32 REDD+ Strategies. Rome.
FAO & CPF. 2018. A joint initiative of the Collaborative Partnership on Forests (CPF). Co-chairs summary report. Presented to the international conference on Working across Sectors to Halt Deforestation and Increase Forest Area – From Aspiration to Action, FAO headquarters, Rome, 20–22 February 2018.
FAO & Global Mechanism of UNCCD. 2015. Sustainable financing for forest and landscape restoration: Opportunities, challenges and the way forward. Rome, FAO. [also available at http://www.fao.org/3/a-i5174e.pdf].
FAO & Plan Bleu. 2018. State of Mediterranean forests 2018. Rome, FAO, and Marseille, France, Plan Bleu. [also available at http://www.fao.org/3/CA2081EN/ca2081en.PDF].
FAO & WRI. 2019. The road to restoration: a guide to identifying priorities and indicators for monitoring forest and landscape restoration, by Kathleen Buckingham, Sabin Ray, Carolina Gallo Granizo, Lucas Toh, Fred Stolle, Faustine Zoveda, Katie Reytar, Rene Zamora, Peter Ndunda, Florence Landsberg, Marcelo Matsumoto & John Brandt. Washington, DC, USA.
FAO, DFSC & IPGRI. 2001. Forest genetic resources conservation and management. Vol. 2: In managed natural forests and protected areas (in situ). Rome, IPGRI.
FAO, FLD & IPGRI. 2004. Forest genetic resources conservation and management. Vol. 3: In plantations and genebanks (ex situ). Rome, International Plant Genetic Resources Institute.
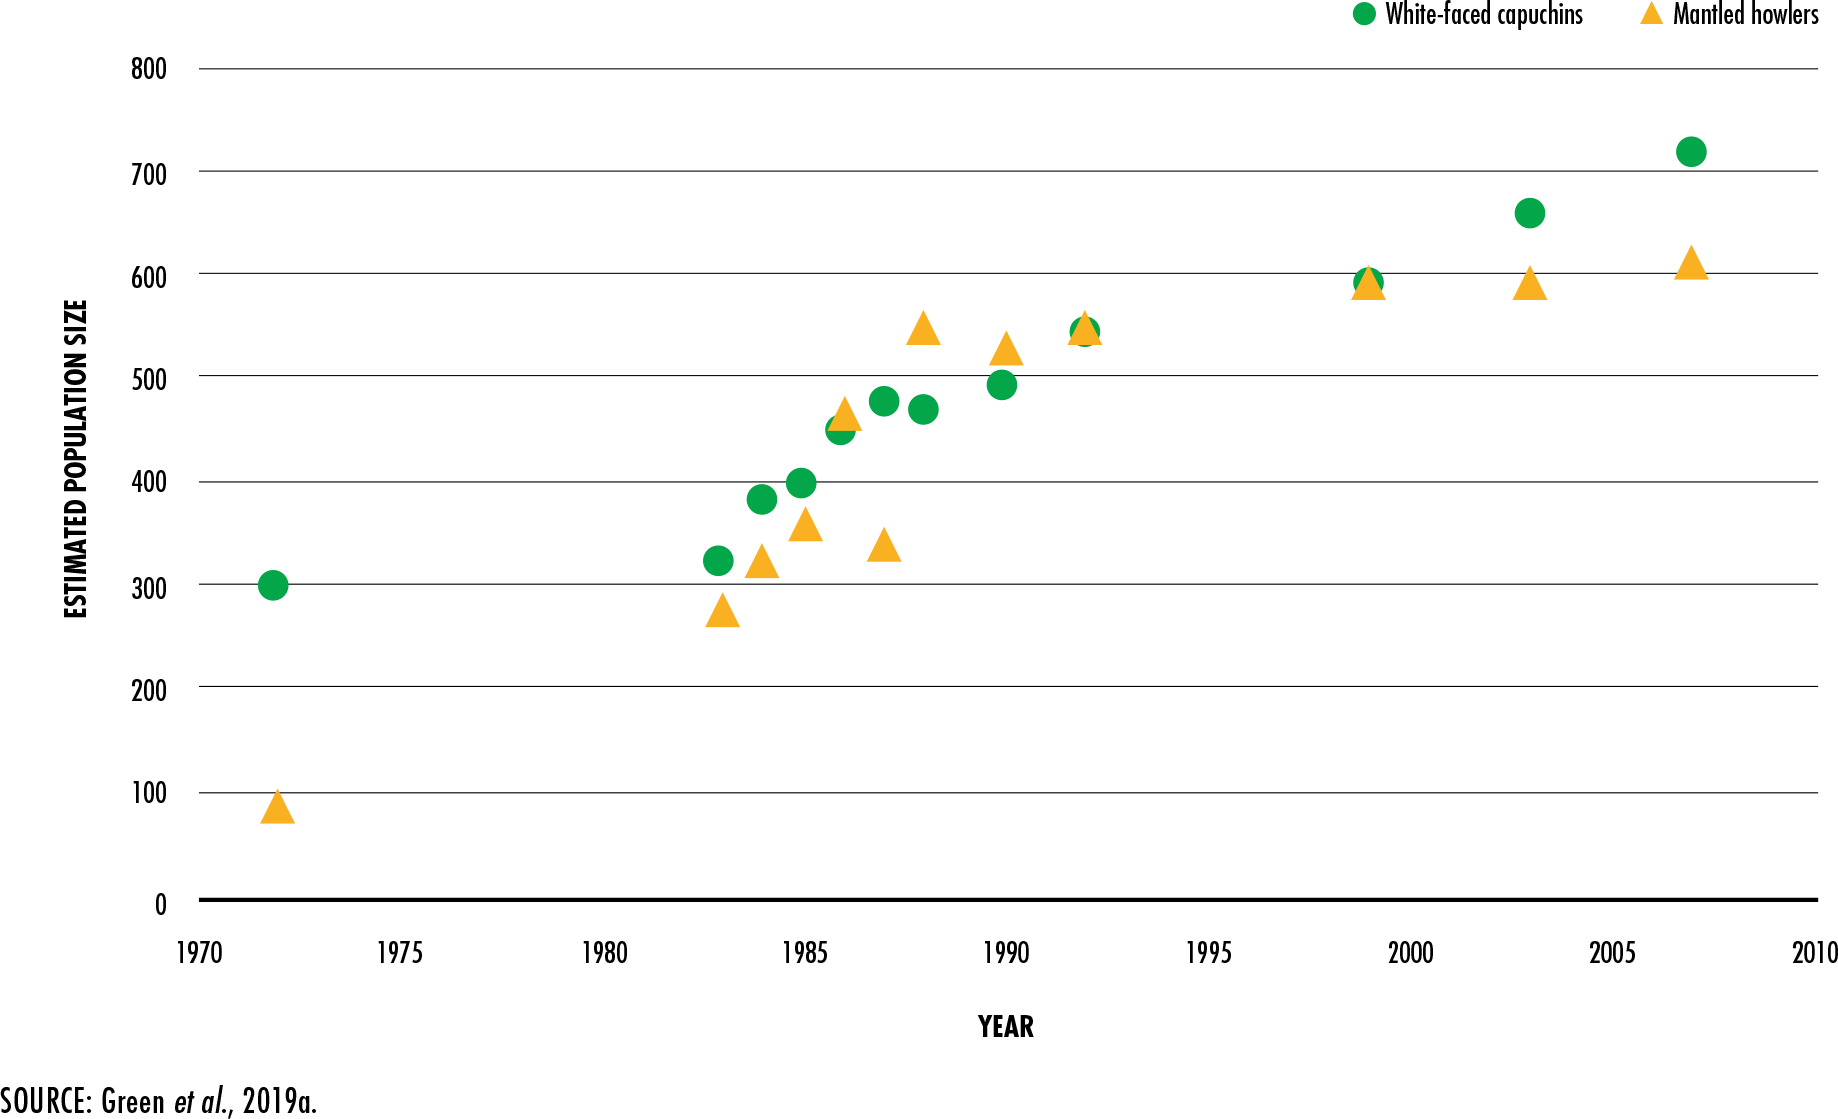
Fedigan, L.M. & Jack, K.M. 2012. Tracking neotropical Monkeys in Santa Rosa: Lessons from a regenerating Costa Rican dry forest. In P.M. Kappeler & D.P. Watts, eds. Long-term field studies of primates, pp. 165–184. Berlin, Springer.
Ferraro, P., Sanchirico, J., & Smith, M. 2019. Causal inference in coupled human and natural systems, PNAS, 116(12): 5311–5318.
Field, C.D., ed. 1996. Restoration of mangrove ecosystems. Okinawa, Japan, International Society for Mangrove Ecosystems.
Fisher, B. & Christopher, T. 2007. Poverty and biodiversity: Measuring the overlap of human poverty and the biodiversity hotspots. Ecological Economics, 62: 93–101.
Fluet-Chouinard, E., Funge-Smith, S. & McIntyre, P.B. 2018. Global hidden harvest of freshwater fish revealed by household surveys. PNAS, 115(29): 7623–7628.
FONAFIFO, CONAFOR and Ministry of Environment. 2012. Lessons learned for REDD+ from PES and conservation incentive programs. Examples from Costa Rica, Mexico, and Ecuador. Washington, DC, The International Bank for Reconstruction and Development/The World Bank.
Food and Land Use Coalition. 2019. Ten Critical Transitions to Transform Food and Land Use. [also available at https://www.foodandlandusecoalition.org/wp-content/uploads/2019/09/FOLU-GrowingBetter-GlobalReport.pdf]
Forest Europe. n.d. Home page [online]. Zvolen, Slovakia. [Cited 26 December 2019]. https://foresteurope.org/
Forest Europe. 2019. Human health and sustainable forest management, edited by Ľ. Marušáková & M. Sallmannshoferet. Forest Europe Study. Zvolen, Slovak Republic. [also available at https://foresteurope.org/wp-content/uploads/2017/08/Forest_book_final_WEBpdf.pdf]
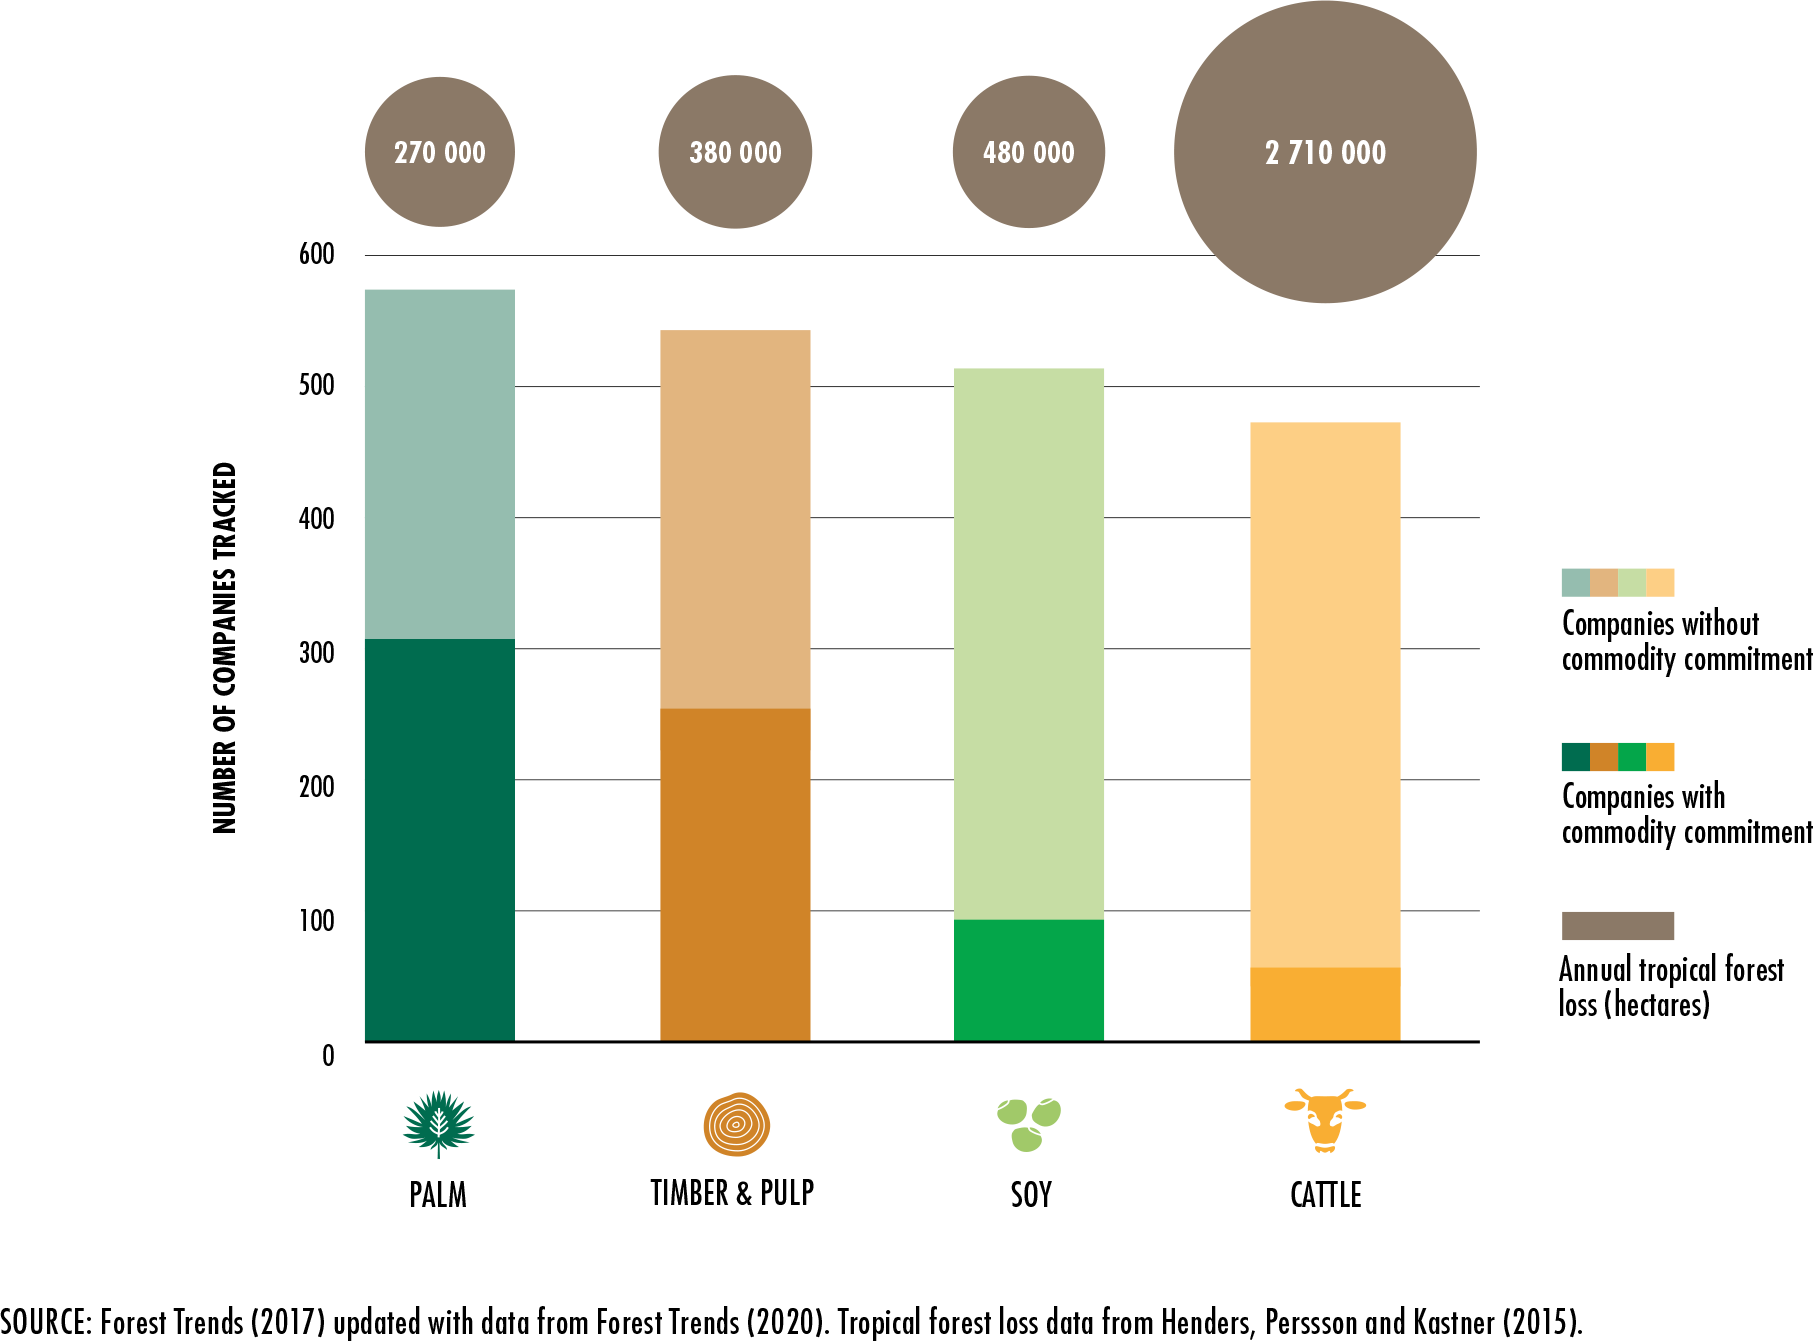
Forest Trends. 2017. Supply change: Tracking corporate commitments to deforestation-free supply chains, 2017. Washington, DC.
Forest Trends. 2020. Forest Trends Supply Change Initiative [online] [Cited 17 March, 2020]. http://supply-change.org/
Fritz-Vietta, N.V.M. 2016. What can forest values tell us about human well-being? Insights from two biosphere reserves in Madagascar. Landscape and Planning 147: 28–37.
Fung, E., Imbach, P., Corrales, L., Vilchez, S. Zamora, N., Argotty, F., Hannah, L. & Ramos, Z. 2017. Mapping conservation priorities and connectivity pathways under climate change for tropical ecosystems. Climatic Change 141: 77–92.
Gaisberger, H., Kindt, R., Loo, J., Schmidt, M., Bognounou, F., Da, S.S., Diallo, O.B. et al. 2017. Spatially explicit multi-threat assessment of food tree species in Burkina Faso: A fine-scale approach. PLOS ONE, 12(9): e0184457 [online]. [Cited 4 January 2020]. https://doi.org/10.1371/journal.pone.0184457
Galetti, M. & Costa-Pereira, R. 2017. Scientists need social media influencers. Science, 357(6354): 880–881.
Galway, L.P., Acharya, Y. & Jones, A.D. 2018. Deforestation and child diet diversity: A geospatial analysis of 15 sub-Saharan African countries. Health & Place, 51: 78–88.
Gardner, C.J., Bicknell, J.E., Struebig, M.J., & Davies, Z.G. 2017. Vertebrate populations, forest regeneration and carbon: a rapid evidence assessment. Canterbury, UK, University of Kent, Durrell Institute of Conservation and Ecology.
Garnett, S.T. & Lindenmayer, D.B. 2011. Conservation science must engender hope to succeed. Trends in Ecology and Evolution, 26(2): 59–60.
Garnett, S.T., Burgess, N.D., Fa, J.E., Fernández-Llamazares, Á., Molnár, Z., Robinson, C.J., Watson, J.E. et al. 2018. A spatial overview of the global importance of indigenous lands for conservation. Nature Sustainability, 1(7): 369–374.
Gayi, S. & Tsowou, K. 2016. Cocoa industry: Integrating small farmers into the global value chain. Geneva, Switzerland, UNCTAD. [also available at https://unctad.org/en/PublicationsLibrary/suc2015d4_en.pdf].
Gentry, A.H. & Dodson, C.H. 1987. Contribution of nontrees to species richness of a tropical rain forest. Biotropica, 19:149– 56, cited by Dirzo, R. & Raven, P. H. 2003. Global state of biodiversity and loss. Annual Review of Environment and Resources, 28: 137–167.
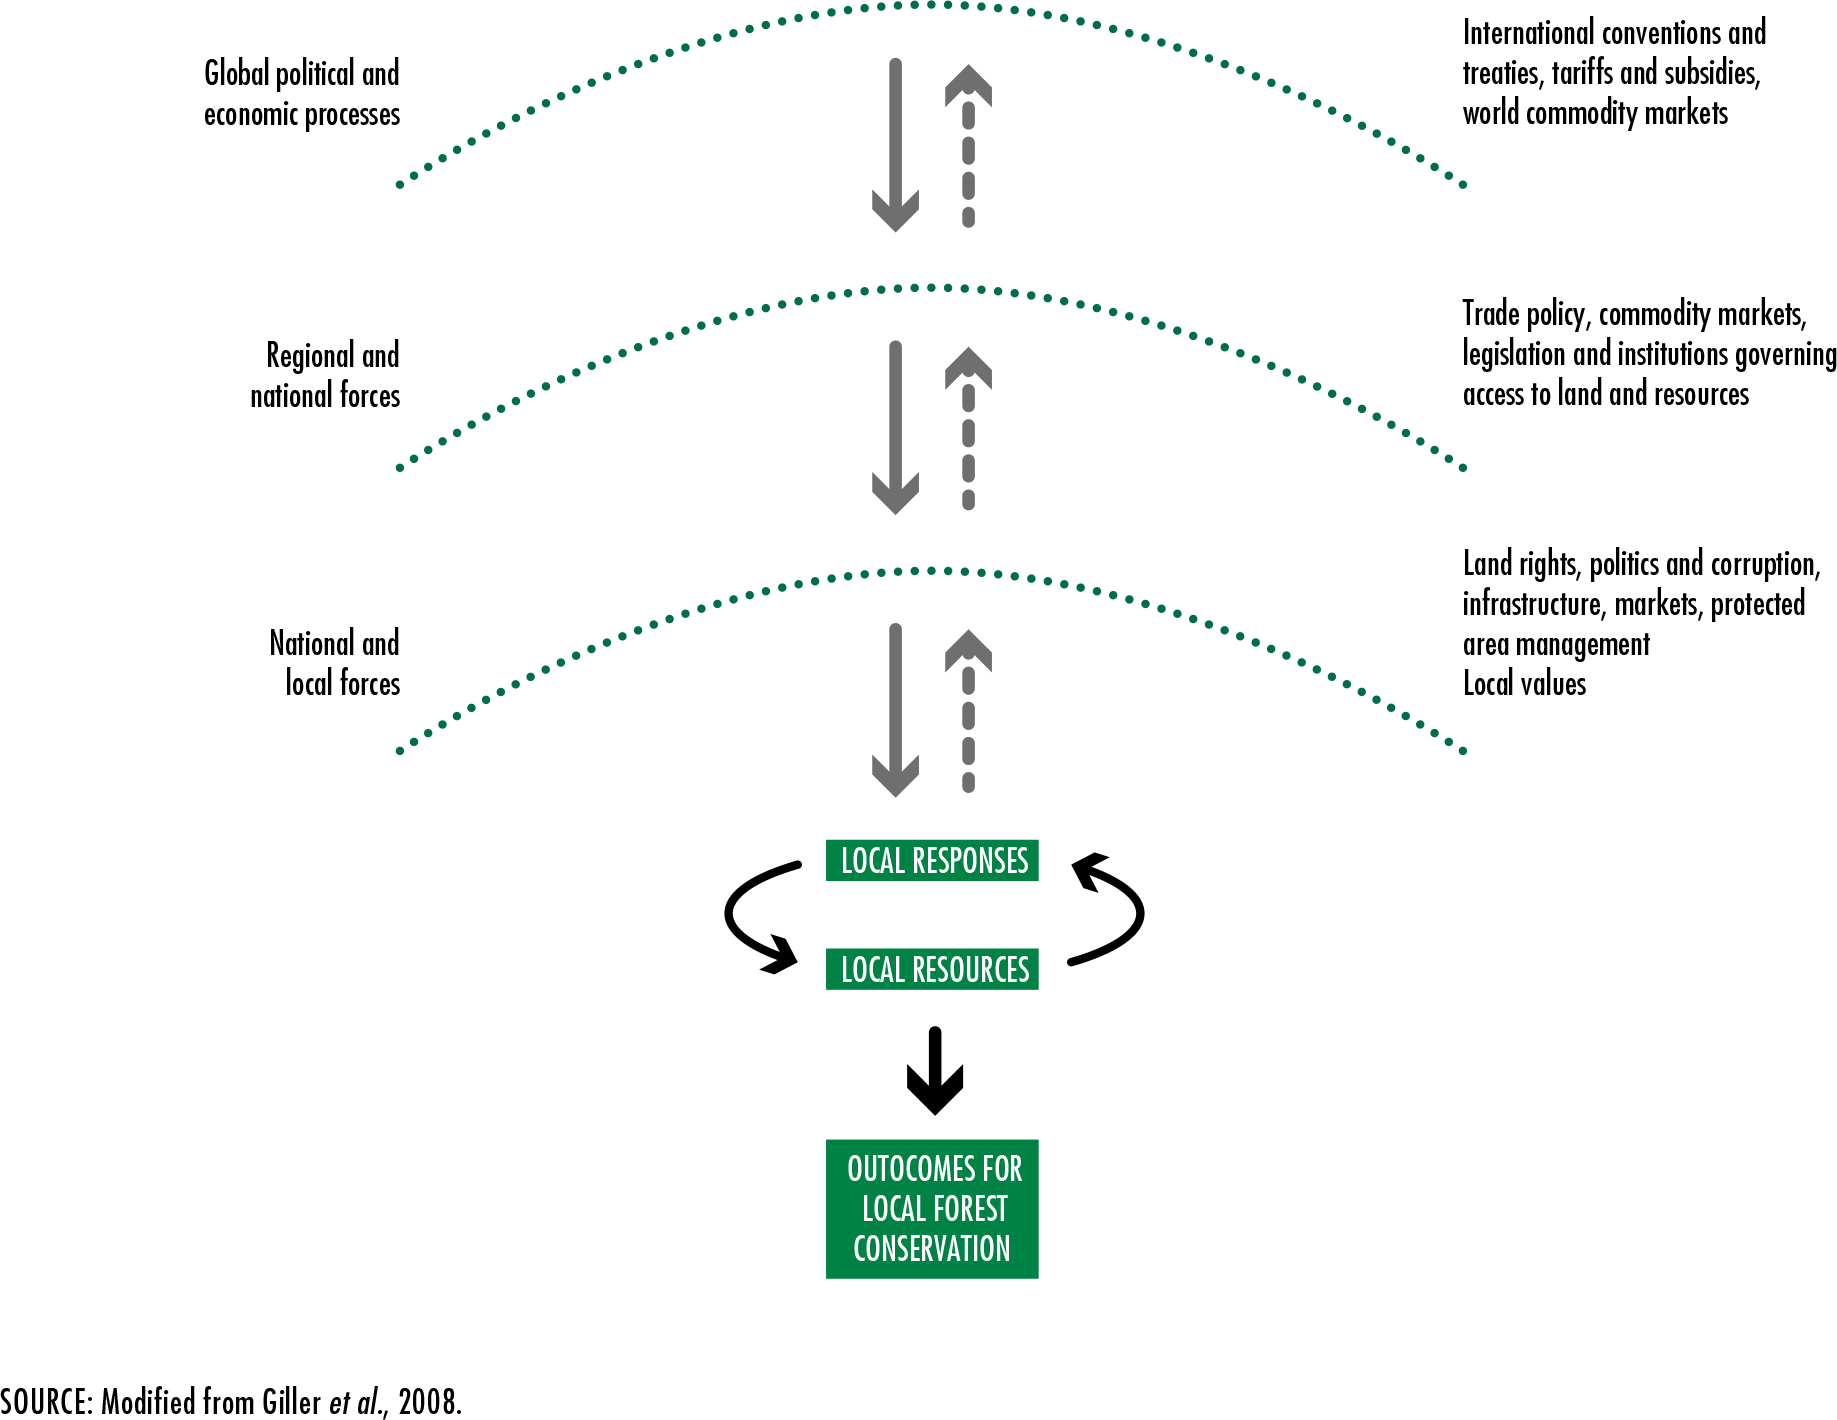
Giller, K.E., Leeuwis, C., Andersson, J.A., Andriesse, W., Brouwer, A., Frost, P., Hebinck, P. et al. 2008. Competing claims on natural resources: what role for science? Ecology and Society, 13(2): 34 [online]. [Cited 4 January 2020]. http://www.ecologyandsociety.org/vol13/iss2/art34/
Global Trees Campaign. 2020. Red lists. In: Global Trees Campaign [online]. [Cited 4 January 2020]. https://globaltrees.org/threatened-trees/red-list/
Golden, C.D., Fernald, L.C.H., Brashares, J.S., Rasolofoniaina, B.J.R. & Kremen, C. 2011. Benefits of wildlife consumption to child nutrition in a biodiversity hotspot. PNAS, 108: 19653–19656.
González-Oreja, J.A., Bonache-Regidor, C. & de la Fuente-Díaz-Ordaz, A.A. 2010. Far from the noisy world? Modelling the relationships between park size, tree cover and noise levels in urban green spaces of the city of Puebla, Mexico. Interciencia, 35(7): 486–492.
Gosnell, H. & Abrams, J. 2011. Amenity migration: diverse conceptualizations of drivers, socioeconomic dimensions, and emerging challenges. GeoJournal, 76, 303–322.
Government of Bhutan. 1997. Biodiversity Action Plan for Bhutan. Thimpu, Bhutan. [also available at www.cbd.int/doc/world/bt/bt-nr-01-en.pdf].
Government of the United States of America. 1973. Endangered Species Act of 1973. Washington, DC. [also available at https://www.fws.gov/international/pdf/esa.pdf].
GPFLR. n.d. What is forest and landscape restoration (FLR)? In: Global Partnership on Forest and Landscape Restoration [online]. [Cited 4 January 2020]. www.forestlandscaperestoration.org/what-forest-and-landscape-restoration-flr
Great Green Wall. 2019a. The great green wall. In: Great Green Wall [online]. Bonn, Germany. [Cited 31 December 2019]. https://www.greatgreenwall.org/about-great-green-wall
Great Green Wall. 2019b. Results. In: Great Green Wall [online]. Bonn, Germany. [Cited 4 January 2020]. www.greatgreenwall.org/results
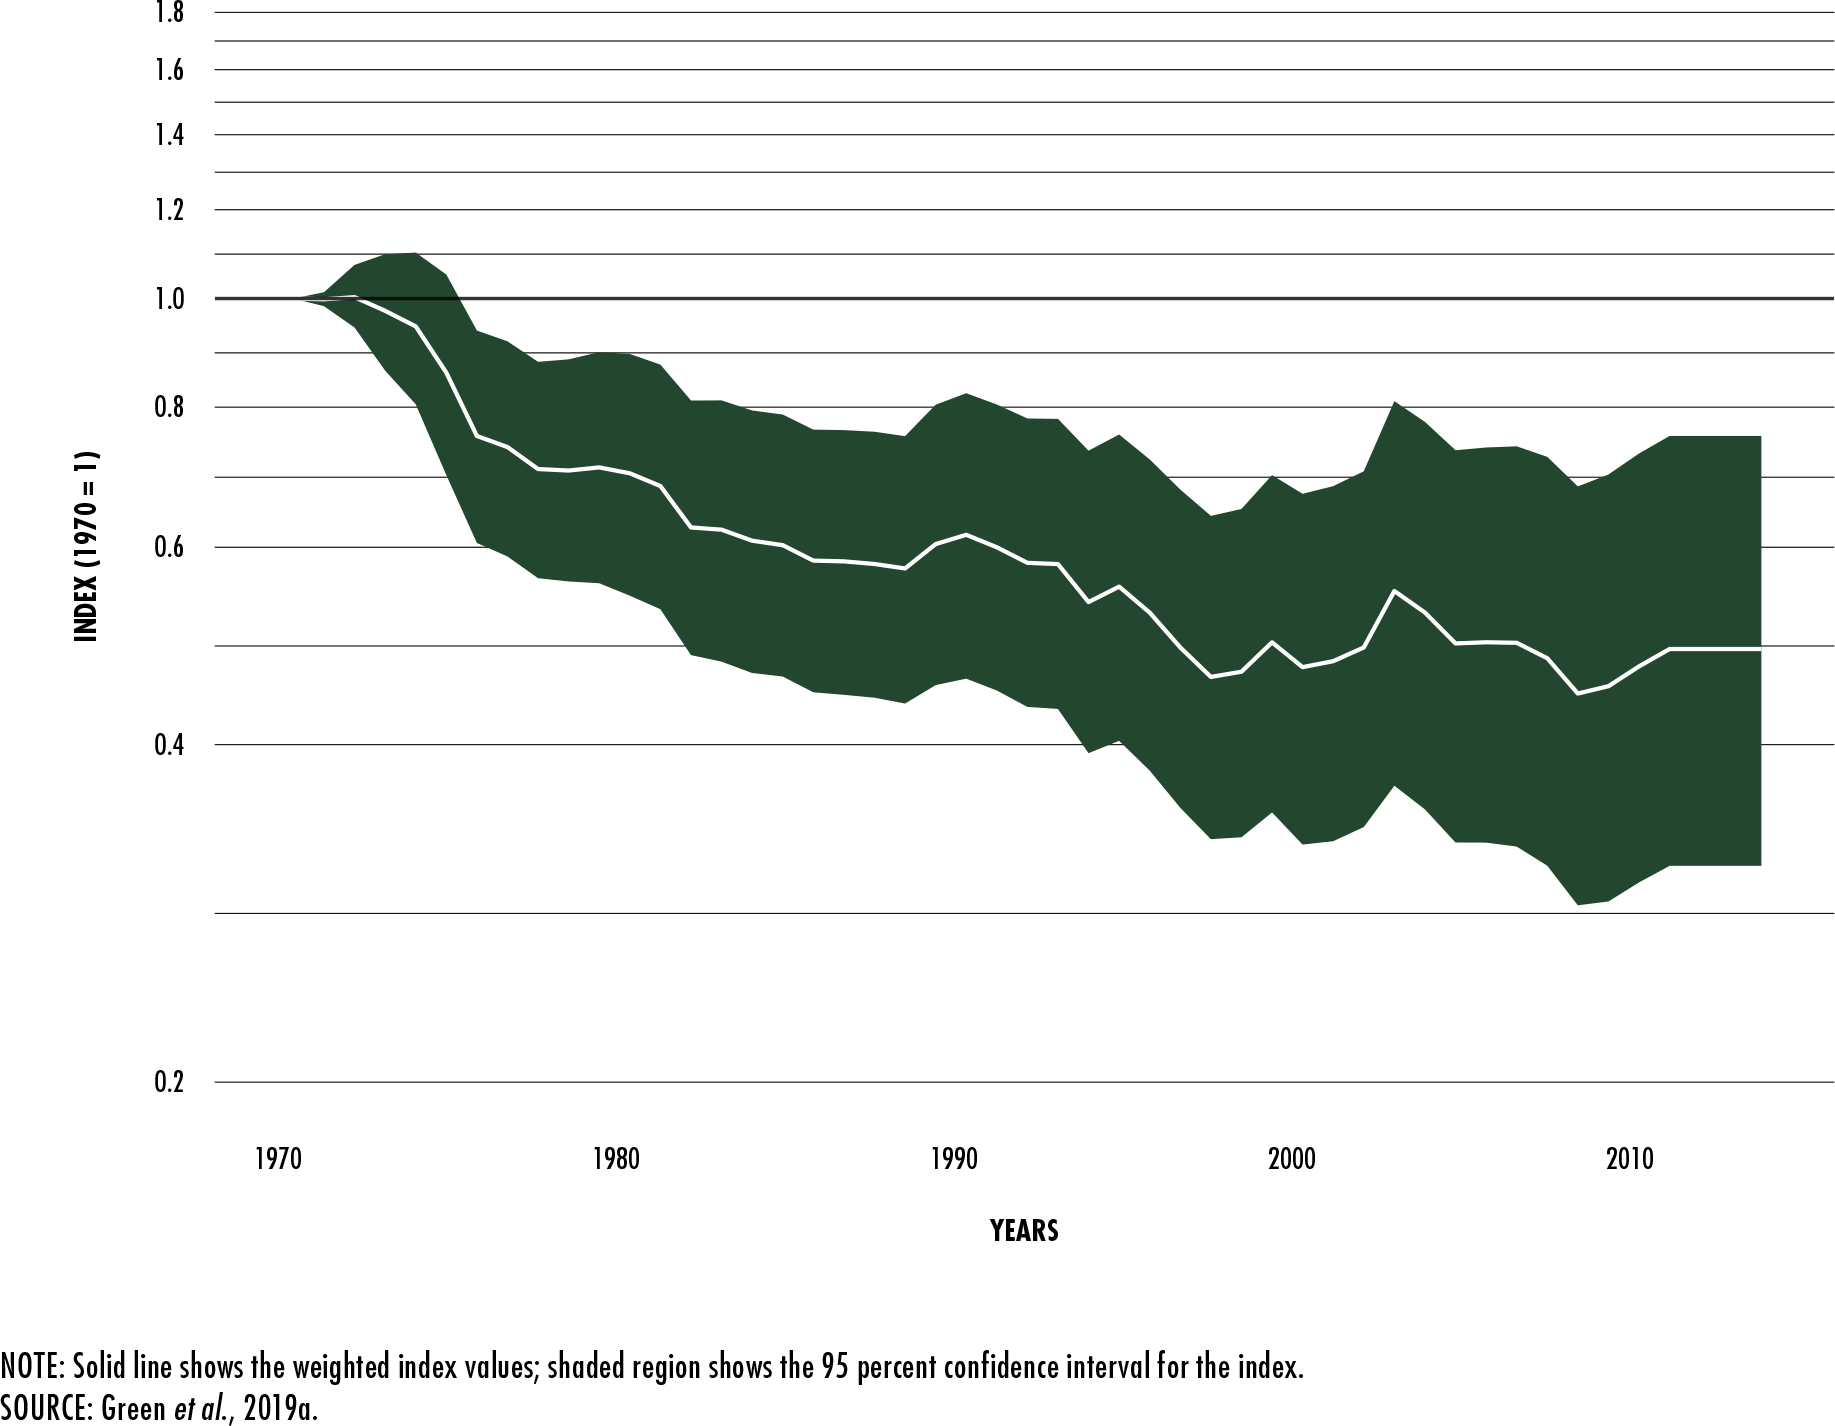
Green, E., McRae, L., Harfoot, M., Hill, S., Simonson, W. & Baldwin-Cantello, W. 2019a. Below the canopy: plotting global trends in forest wildlife populations. Woking, UK, WWF-UK.
Green, E., McRae, L., Harfoot, M., Hill, S., & Baldwin-Cantello, W., Simonson, W. 2019b. Below the canopy: global trends in forest vertebrate populations and their drivers. PeerJ Preprints, 7: e27882v1 [online]. [Cited 4 January 2020]. https://doi.org/10.7287/peerj.preprints.27882v1
Gretzinger, S. 2016. Latin American experiences in natural forest management concessions. Forestry Policy and Institutions Working Paper 35. Rome, FAO. [also available at http://www.fao.org/forestry/45023-0707f17f1cce86c7e4f4e870bf4edd2f0.pdf].
Groenewegen, P.P., Van den Berg, A.E., De Vries, S. & Verheij, R.A. 2006. Vitamin G: effects of green space on health, well-being, and social safety. BMC public health, 6(1), 149 [online]. [Cited 4 January 2020]. https://doi.org/10.1186/1471-2458-6-149
Grogan, J., Free, C., Pinelo, G., Johnson, A. & Alegria, R. 2016. Conservation status of five timber species populations in the forestry concessions of the Maya Biosphere Reserve, Guatemala. Turrialba, Costa Rica, CATIE.
Guariguata, M., Cronkleton, P., Duchelle, A. & Zuidema, P. 2017. Revisiting the ‘cornerstone of Amazonian conservation’: a socioecological assessment of Brazil nut exploitation. Biodiversity and Conservation, 26: 2007–2027.
Gurnell, A.M., England, J., Shuker, L. & Wharton, G. 2019. The contribution of citizen science volunteers to river monitoring and management: International and national perspectives and the example of the MoRPh survey. River Research and Applications, 35(8): 1359–1373.
Gurung, J.D. 2002. Getting at the heart of the issue: Challenging male bias in Nepal’s Department of Forests. Mountain Research and Development, 22(3): 212–216.
Haddad, N.M., Brudvig, L.A., Clobert, J., Davies, K.F., Gonzalez, A., Holt, R.D., Lovejoy, T.E. et al. 2015. Habitat fragmentation and its lasting impact on Earth’s ecosystems. Science Advances, 1: e1500052 [online]. [Cited 4 January 2020]. DOI: 10.1126/sciadv.1500052
Hansen, M.M., Jones, R., & Tocchini, K. 2017. Shinrin-yoku (forest bathing) and nature therapy: A state-of-the-art review. International Journal of Environmental Research and Public Health, 14(8): 851.
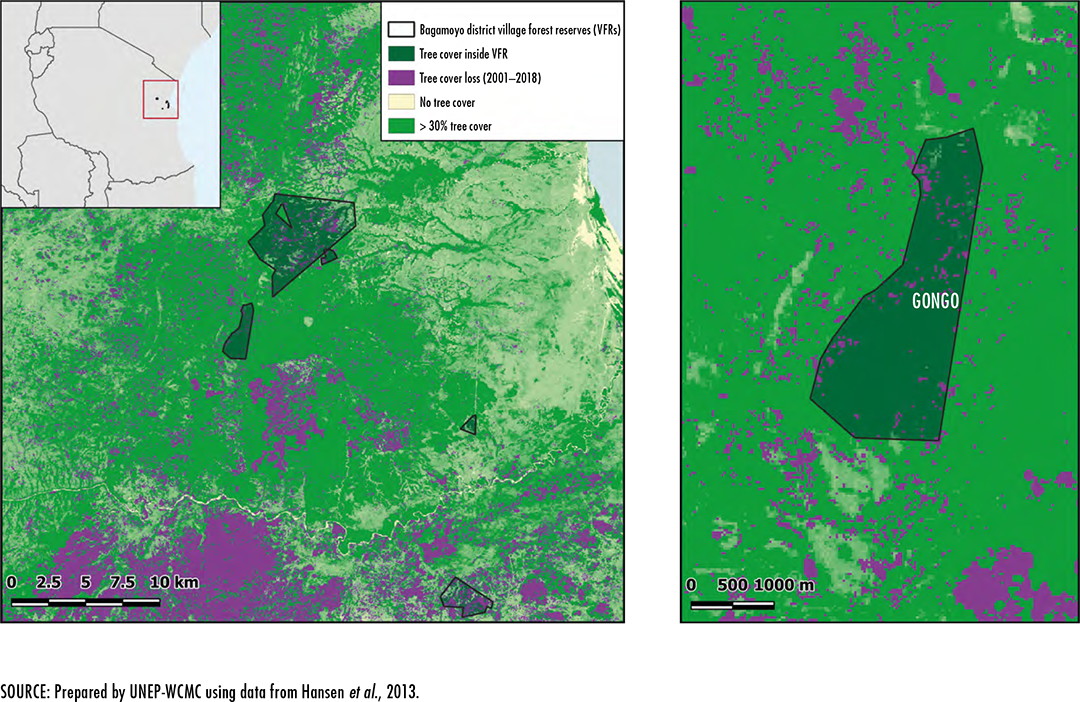
Hansen, M.C., Potapov, P.V., Moore, R., Hancher, M., Turubanova, S.A., Tyukavina, A., Thau, D. et al. 2013. High-resolution global maps of 21st-century forest cover change. Science, 342(6160): 850–853.
Hanski, I., von Hertzen, L., Fyhrquist, N., Koskinen, K., Torppa, K., Laatikainen, T., Karisola, P. et al. 2012. Environmental biodiversity, human microbiota, and allergy are interrelated. PNAS, 109(21): 8334–8339.
Hart, D. 2018. Man the hunted: primates, predators, and human evolution. New York, USA, Routledge.
Hartig, T., Mang, M., & Evans, G.W. 1991. Restorative effects of natural environment experiences. Environment and Behavior, 23(1): 3–26.
Health Council of the Netherlands. 2004. Nature and Health. The influence of nature on social, psychological and physical well-being. The Hague, Health Council of the Netherlands and the Advisory Council for Research on Spatial Planning, Nature and the Environment in the Netherlands.
Hegetschweiler, K.T., Plum, C., Fischer, C., Brändli, U.B., Ginzler, C. & Hunziker, M. 2017. Towards a comprehensive social and natural scientific forest-recreation monitoring instrument – A prototypical approach. Landscape and Urban Planning, 167: 84–97.
Henders, S., Persson, U.M. & Kastner, T. 2015. Trading forests: land-use change and carbon emissions embodied in production and exports of forest-risk commodities. Environmental Research Letters 10, no. 12, doi:10.1088/1748-9326/10/12/125012.
Henriksen, L. 2018. Blue Targeting – manual. How to do Blue Targeting for best management practice (BMP) for forestry along small streams. Swedish Forest Agency, EU Interreg project Water Management in Baltic Forests. [also available at https://www.skogsstyrelsen.se/globalassets/projektwebbplatser/wambaf/blue-targeting/blue-targeting-manual.pdf].
Hermosilla, T., Wulder, M.A., White, J.C., Coops, N.C., Pickell, P.D. & Bolton, D.K. 2019. Impact of time on interpretations of forest fragmentation: three-decades of fragmentation dynamics over Canada. Remote Sensing of Environment, 222: 65–77.
Heß, S., Jaimovich, D., & Schündeln, M. 2019. Environmental effects of development programs: Experimental evidence from West African dryland forests [online]. [Cited 13 January 2020]. http://hesss.org/Gambia%20Forest.pdf
Hilderbrand, G.V., Schwartz, C.C., Robbins, C.T., Jacoby, M.E., Hanley, T.A., Arthur, S.M. & Servheen, C. 1999. The importance of meat, particularly salmon, to body size, population productivity, and conservation of North American brown bears. Canadian Journal of Zoology, 77: 132–138.
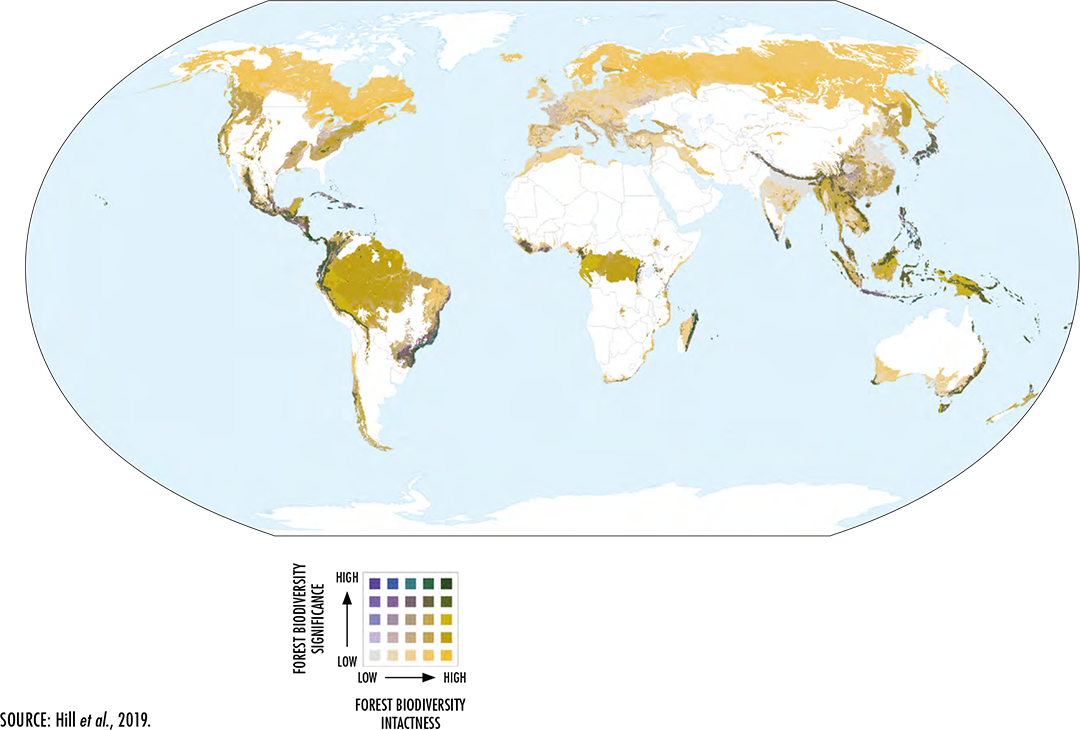
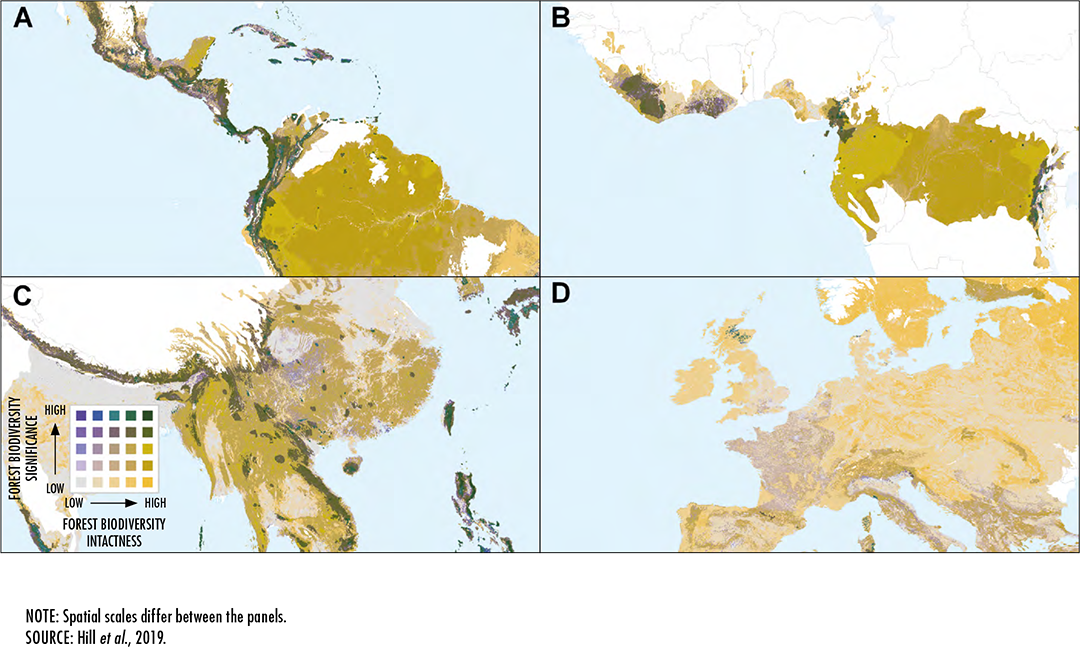
Hill, S.L.L., Arnell, A., Maney, C., Butchart, S.H.M., Hilton-Taylor, C., Ciciarelli, C., Davis, C., Dinerstein, E., Purvis, A. & Burgess, N.D. 2019. Measuring forest biodiversity status and changes globally. Frontiers in Forest and Global Change, 2: 70 [online]. [Cited 4 January 2020]. https://doi.org/10.3389/ffgc.2019.00070
Hlásny, T., Krokene, P., Liebhold, A., Montagné-Huck, C., Müller, J., Qin, H., Raffa, K. et al. 2019. Living with bark beetles: impacts, outlook and management options. From Science to Policy 8. Barcelona, Spain, European Forest Institute.
HLPE. 2017. Sustainable forestry for food security and nutrition. A report by the High Level Panel of Experts on Food Security and Nutrition of the Committee on World Food Security. Rome. [also available at www.fao.org/3/a-i7395e.pdf].
Hoare, A. 2015. Tackling illegal logging and the related trade: what progress and where next? Chatham House Report. London, Chatham House, The Royal Institute of International Affairs.
Hodgdon, B.D., Hughell, D., Ramos, V.H. & McNab, R.B. 2015. Deforestation trends in the Maya Biosphere Reserve, Guatemala 2000–2013. New York, USA, Rainforest Alliance.
Hoffmann, B., Roeger, S., Wise, P., Dermer, J., Yunupingu, B., Lacey, D., Yunupingu, D., Marika, B., Marika, M. & Panton, B. 2012. Achieving highly successful multiple agency collaborations in a cross-cultural environment: experiences and lessons from Dhimurru Aboriginal Corporation and partners. Ecological Management and Restoration, 13(1): 42–50.
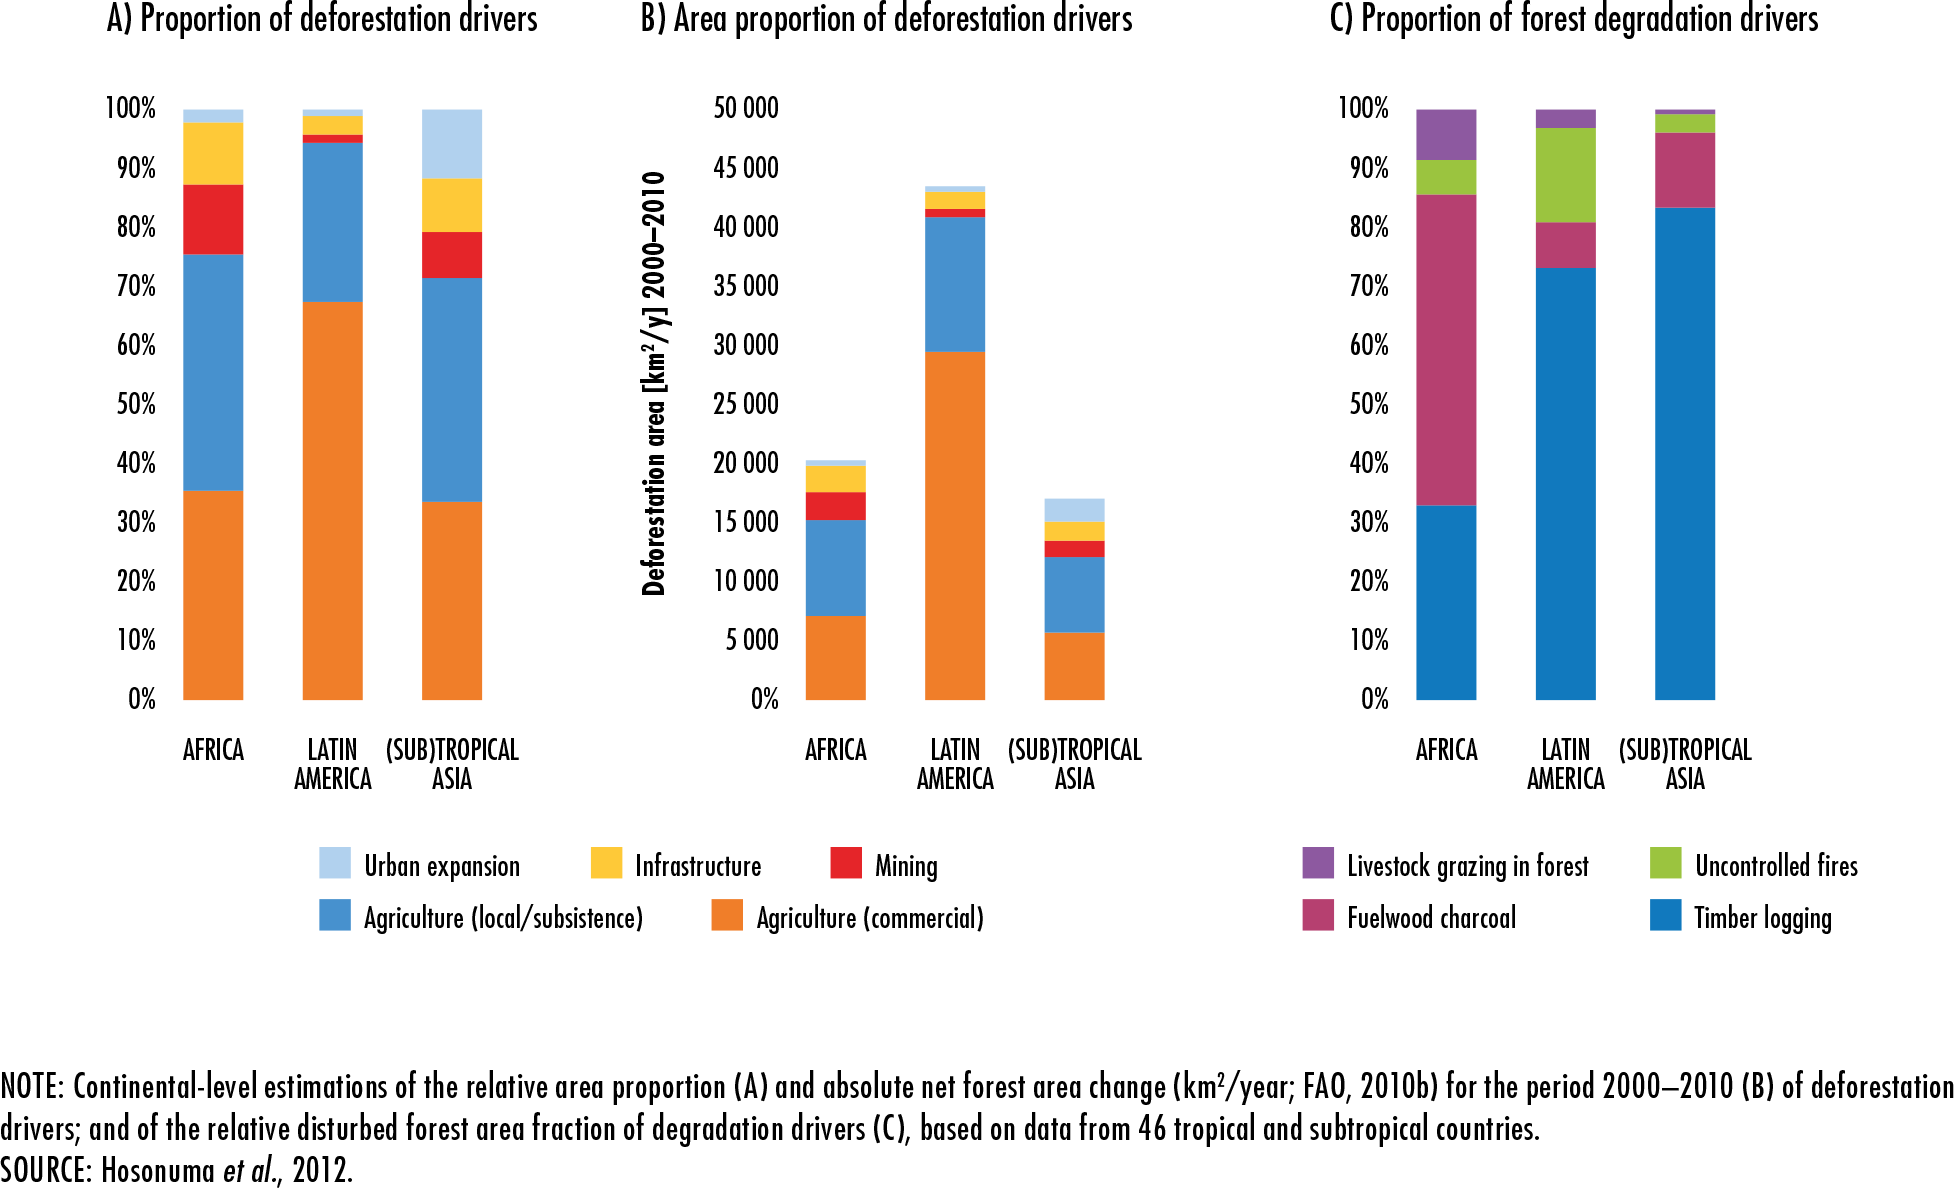
Hosonuma, N., Herold, M., De Sy, V., De Fries, R.S., Brockhaus, M., Verchot, L., Angelsen, A. & Romijn, E. 2012. An assessment of deforestation and forest degradation drivers in developing countries. Environmental Research Letters, 7(4): 044009 [online]. [Cited 4 January 2020]. https://doi.org/10.1088/1748-9326/7/4/044009
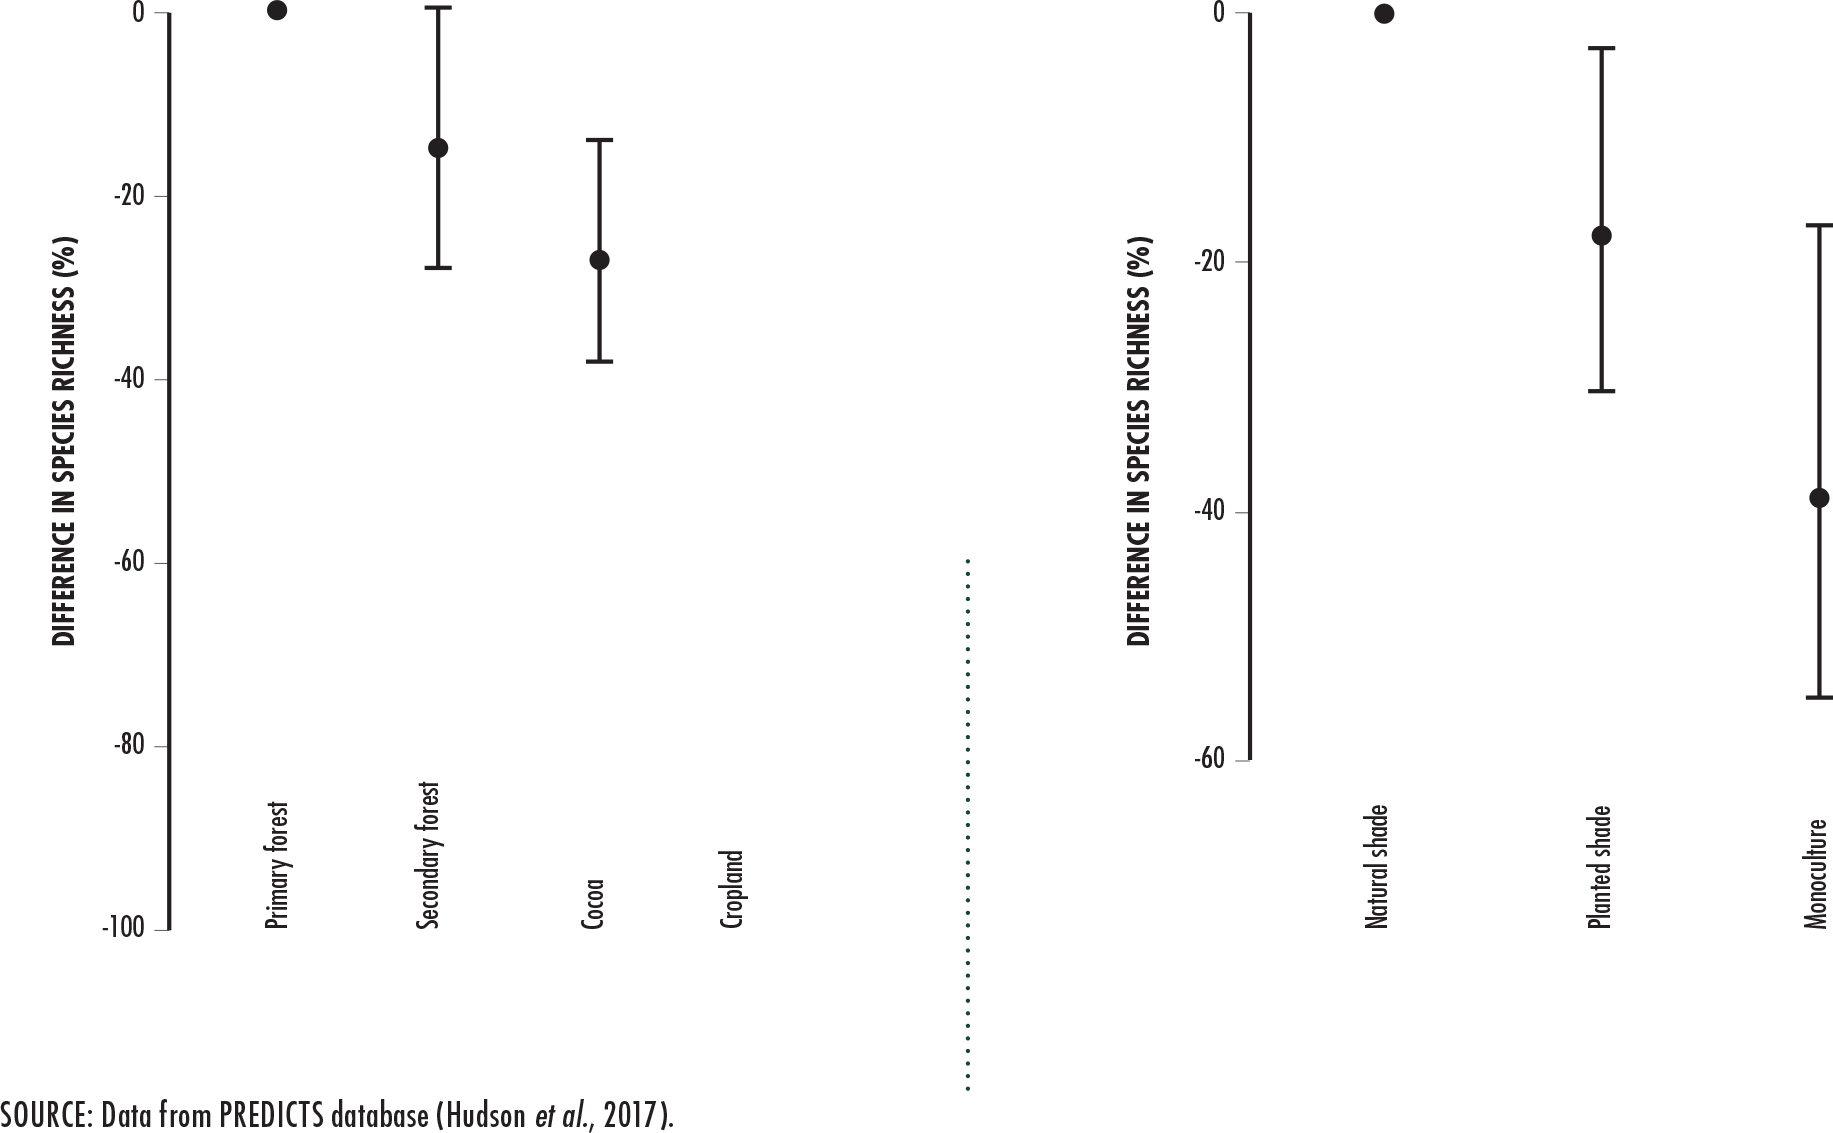
Hudson, L.N., Newbold, T., Contu, S., Hill, S.L., Lysenko, I., De Palma, A., Phillips, H.R. et al. 2017. The database of the PREDICTS project. Ecology and Evolution, 7(1): 145–188.
Hughes, T.W. & Lee, K. 2015. The role of recreational hunting in the recovery and conservation of the wild turkey (Meleagris gallopavo spp.) in North America. International Journal of Environmental Studies, 72(5): 797–809.
Huntley, B.J. & Redford, K.H. 2014. Mainstreaming biodiversity in practice: a STAP advisory document. Washington, DC, USA, GEF.
Ickowitz, A., Powell, B., Salim, M.A. & Sunderland, T. 2014. Dietary quality and tree cover in Africa. Global Environmental Change, 24: 287–294.
IDH. 2019. Green Cocoa Cameroon. In: IDH, The Sustainable Trade Initiative [online]. Utrecht, The Netherlands. [Cited 4 January 2020]. https://www.idhsustainabletrade.com/contact-directions/
IFAD & UNEP. 2013. Smallholders, food security, and the environment. Rome, IFAD.
IIED. 2019. Darwin Initiative Main and Post Project Annual Report: Livelihoods Insurance from Elephants (LIFE) in Kenya and Sri Lanka [online]. London. [Cited 4 January 2020]. https://pubs.iied.org/pdfs/G04412.pdf
ILO. 2017. NORMLEX – C169 – Indigenous and Tribal Peoples Convention, 1989 (No. 169). In: International Labour Organization [online]. Geneva, Switzerland. [Cited 2 January 2020]. https://www.ilo.org/dyn/normlex/en/f?p=NORMLEXPUB:12100:0::NO::P12100_ILO_CODE:C169
INAB. 2019. Cobertura forestal. In: SIFGUA – Sistema de Información Forestal de Guatemala [online]. Guatemala. [Cited 4 January 2020]. http://www.sifgua.org.gt/Cobertura.aspx
Ingwall-King, L. & Gangur, A. forthcoming. Integrating traditional knowledge into conservation policy and practice: a good practice review. Cambridge, UK, UNEP-WCMC.
Initiative 20x20. n.d. Healthy lands for food, water and nature [online]. Washington, DC. [Cited 18 December 2019]. https://initiative20x20.org/
Institute of Medicine. 2001. Dietary reference intakes for vitamin A, vitamin K, arsenic, boron, chromium, copper, iodine, iron, manganese, molybdenum, nickel, silicon, vanadium, and zinc. Washington, DC, National Academies Press.
Instituto Socioambiental. 2015. Advances and setbacks in territorial rights in Brazil. Brasilia. Cited in RRI. 2015. Protected areas and the land rights of indigenous peoples and local communities: current issues and future agenda. Washington, DC, RRI.
IPBES. 2016. The assessment report on pollinators, pollination and food production-policy platform on biodiversity and ecosystem services on pollinators, pollination and food production. Bonn, Germany.
IPBES. 2019a. Summary for policymakers of the global assessment report on biodiversity and ecosystem services of the Intergovernmental Science-Policy Platform on Biodiversity and Ecosystem Services. Bonn, Germany.
IPBES. 2019b. Chapter 2.2 Status and Trends – Nature. Unedited draft chapter for IPBES Global Assessment on Biodiversity and Ecosystem Services [online]. Bonn, Germany. [Cited 13 January 2020]. https://ipbes.net/sites/default/files/ipbes_global_assessment_chapter_2_2_nature_unedited_31may.pdf].
IPCC. 2019. Climate Change and Land: an IPCC special report on climate change, desertification, land degradation, sustainable land management, food security, and greenhouse gas fluxes in terrestrial ecosystems [P.R. Shukla, J. Skea, E. Calvo Buendia, V. Masson-Delmotte, H.-O. Pörtner, D. C. Roberts, P. Zhai, R. Slade, S. Connors, R. van Diemen, M. Ferrat, E. Haughey, S. Luz, S. Neogi, M. Pathak, J. Petzold, J. Portugal Pereira, P. Vyas, E. Huntley, K. Kissick, M. Belkacemi, J. Malley (eds.)]. [also available at: https://www.ipcc.ch/srccl/]
Irvine, K.N., Devine-Wright, P., Payne, S.R., Fuller, R.A., Painter, B. & Gaston, K.J. 2009. Green space, soundscape and urban sustainability: an interdisciplinary, empirical study. Local Environment, 14(2): 155–172.
Isted, A. 2013. An investigation into the benefits of forest school intervention for young people with ADHD in the education system (Examination paper). London, University of Greenwich.
ITC. 2016. Sustainable sourcing: Markets for certified Chinese medicinal and aromatic plants. Geneva, Switzerland.
ITTO. 2002. ITTO guidelines for the restoration, management and rehabilitation of degraded and secondary tropical forests. ITTO, CIFOR, FAO, IUCN and WWF International.
ITTO & IUCN. 2009. ITTO/IUCN Guidelines for the conservation and sustainable use of biodiversity in tropical timber production forests. ITTO Policy Development Series No. 17. Yokohama, Japan, ITTO.
IUCN. 2013. Mitigating human-wildlife conflict. In: IUCN [online]. Gland, Switzerland. [Cited 4 January 2020]. https://www.iucn.org/content/mitigating-human-wildlife-conflict
IUCN. 2016. A global standard for the identification of key biodiversity areas. Version 1.0. First edition. Gland, Switzerland.
IUCN. 2017. The IUCN red list of threatened species. Version 2017.3. http://www.iucnredlist.org.
IUCN. 2018. The Bonn Challenge barometer. In: InfoFLR [online]. Gland, Switzerland. [Cited 13 January 2020]. https://infoflr.org/bonn-challenge-barometer
IUCN. 2019a. The IUCN red list of threatened species. Version 2019-2. http://www.iucnredlist.org. Downloaded on 4 October 2019.
IUCN. 2019b. Over half of Europe’s endemic trees face extinction. In: IUCN [online]. Gland, Switzerland. [Cited 4 January 2020]. https://www.iucn.org/news/species/201909/over-half-europes-endemic-trees-face-extinction
IUCN WCPA. 2018. PARKS. The International Journal of Protected Areas and Conservation. Volume 24 Special Issue. Gland, Switzerland, IUCN.
Jalonen, R., Valette, M., Boshier, D., Duminil, J. & Thomas, E. 2017. Forest and landscape restoration severely constrained by a lack of attention to the quantity and quality of tree seed: Insights from a global survey. Conservation Letters, 11(4): e12424 [online]. [Cited 4 January 2020]. https://doi.org/10.1111/conl.12424
Jamnadass, R., McMullin, S., Iiyama, M., Dawson, I.K., Powell, B., Termote, C., Ickowitz, A. et al. 2015. Understanding the roles of forests and tree-based systems in food provision. In B. Vira, C. Wildburger & S. Mansourian, eds. Forests and food: Addressing hunger and nutrition across sustainable landscapes. Cambridge, UK, Open Book Publishers. http://dx.doi.org/10.11647/OBP.0085
Jayachandran S., de Laat, J., Lambin, E.F., Stanton, C.Y., Audy, R. & Thomas, N.E. 2017. Cash for carbon: A randomized trial of payments for ecosystem services to reduce deforestation. Science, 357(6348): 267–273.
Jenkins, M., Timoshyna, A. & Cornthwaite, M. 2018. Wild at home: exploring the global harvest, trade and use of wild plant ingredients. Cambridge, UK, TRAFFIC International.
Jonas, H.D., MacKinnon K., Dudley N., Hockings M., Jessen S., Laffoley D., MacKinnon D. et al. 2018. Editorial essay: Other effective area-based conservation measures: From Aichi Target 11 to the Post-2020 biodiversity framework. PARKS, The International Journal of Protected Areas and Conservation, 24 (Special issue on OECMs): 9–16.
Jorgensen, A., Hitchmough, J. & Dunnet, N. 2006. Woodland as a setting for housing-appreciation and fear and the contribution of residential satisfaction and place identity in Warrington New Town, UK. Landscape and Urban Planning, 79(3–4): 273–287.
Kaimowitz, D., & Sheil, D. 2007. Conserving what and for whom? Why conservation should help meet basic human needs in the tropics. Biotropica, 39(5): 567–574.
Kaplan, R. & Kaplan, S. 1989. The experience of nature – a psychological perspective. Cambridge, UK, Cambridge University Press.
Kapos, V., Lysenko, I. & Lesslie, R. 2002. Assessing forest integrity and naturalness in relation to biodiversity. FAO Forest Resources Assessment Programme Working Paper 54. Rome. [also available at http://www.fao.org/3/ad654e/ad654e00.htm].
Kareiva, P., Watts, S., McDonald, R. & Boucher, T. 2007. Domesticated nature: Shaping landscapes and ecosystems for human welfare. Science, 316(5833): 1866–1869.
Katila, P., Pierce Colfer, C., De Jong, W., Galloway, G., Pacheco, P., & Winkel, G., eds. 2019. Sustainable Development Goals: their impacts on forests and people. Cambridge, UK, Cambridge University Press.
Kawarazuka, N. & Béné, C. 2011. The potential role of small fish species in improving micronutrient deficiencies in developing countries: building evidence. Public Health Nutrition, 14(11): 1927–1938.
Kay, C.E. 2018. The Condition and Trend of Aspen, Willows, and Associated Species on the Northern Yellowstone Range. Rangelands, 40(6): 202–211. [also available at https://www.sciencedirect.com/science/article/pii/S0190052818300774?via%3Dihub]
Keenan, R.J., Reams, G.A., Achard, F., de Freitas, J.V., Grainger, A. & Lindquist, E. 2015. Dynamics of global forest area: Results from the FAO Global Forest Resources Assessment 2015. Forest Ecology and Management, 352: 9–20.
Kelleher, C.T., de Vries, S.M.G., Baliuckas, V., Bozzano, M., Frydl, J., Gonzalez Goicoechea, P., Ivankovic, M. et al. 2015. Approaches to the conservation of forest genetic resources in Europe in the context of climate change. European Forest Genetic Resources Programme (EUFORGEN). Rome, Bioversity International.
Kerr, J., Pender, J. & Suyanto, B.L. 2008. Property rights, environmental services and poverty alleviation in Indonesia. BASIS Brief 2008-03. Madison, WI, University of Wisconsin.
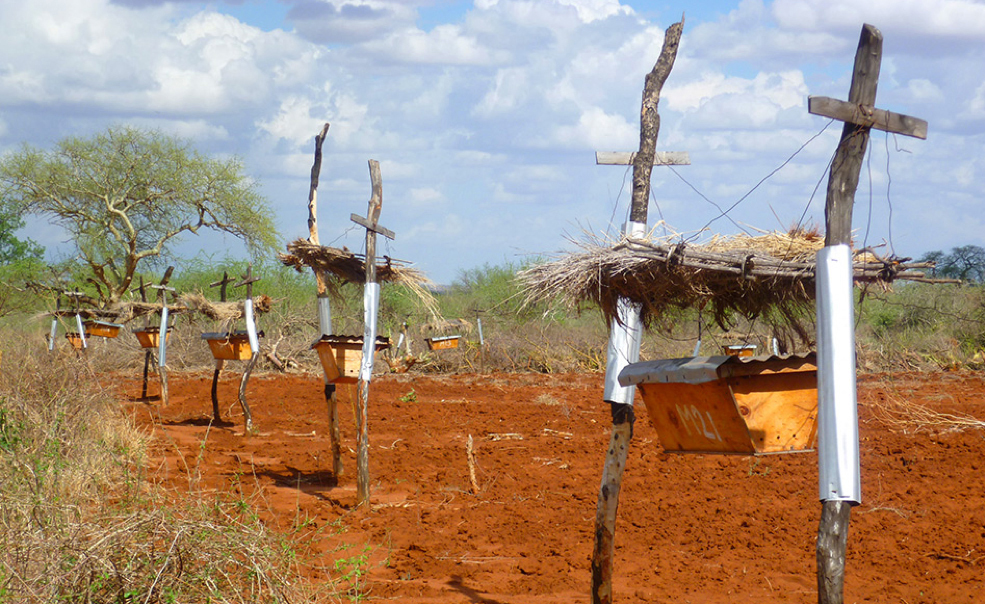
King, L., Lala, F., Nzumu, H., Mwambingu, E. & Douglas-Hamilton, I. 2017. Beehive fences as a multidimensional conflict-mitigation tool for farmers coexisting with elephants. Conservation Biology, 31(4): 743–752.
Klein, A.M., Vaissiere, B.E., Cane, J.H., Steffan-Dewenter, I., Cunningham, S.A., Kremen, C. & Tscharntke, T. 2007. Importance of pollinators in changing landscapes for world crops. Proceedings of the Royal Society B – Biological Sciences, 274: 303–313.
Koskela, J., Lefèvre, F., Schueler, S., Kraigher, H., Olrik, D.C., Hubert, J., Longauer, R. et al. 2013. Translating conservation genetics into management: Pan-European minimum requirements for dynamic conservation units of forest tree genetic diversity. Biological Conservation, 157: 39–49.
Koskela, J., Vinceti, B., Dvorak, W., Bush, D., Dawson, I., Loo, J., Kjær, E.D. et al. 2014. Use and transfer of forest genetic resources: A global review. Forest Ecology and Management, 333: 22–34.
Krishnan, S., Wiederkehr Guerra, G., Bertrand, D., Wertz-Kanounnikoff, S. & Kettle, C. forthcoming. Enhancing the cross-sectoral benefits from forests for pollination services at landscape scales: a review of management interventions. [tentative title]. FAO working paper. Rome, FAO and Bioversity International.
Lambin, E.F., & Meyfroidt, P. 2011. Global land use change, economic globalization, and the looming land scarcity. PNAS, 108(9): 3465–3472.
Lambin, E.F., Turner, B.L., Geist, H.J., Agbola, S.B., Angelsen, A., Bruce, J.W., Coomes, O.T. et al. 2001. The causes of land-use and land-cover change: moving beyond the myths. Global Environmental Change, 11(4): 261–269.
Laurance, W.F., Nascimento, H.E.M., Laurance, S.G., Andrade, A.C., Fearnside, P.M., Ribeiro, J.E.L. & Capretz, R.L. 2006. Rain forest fragmentation and the proliferation of successional trees. Ecology, 87(2): 469–482.
Le Bel, S., Mapuivre, G. & Czudek, R. 2010. Human–wildlife conflict toolkit: comprehensive solutions for farmers and communities. Unasylva, 236: 12–13.
Lefèvre, F., Koskela, J., Hubert, J., Kraigher, H., Longauer, R., Olrik, D.C., Schüler, S. et al. 2013. Dynamic conservation of forest genetic resources in 33 European countries. Conservation Biology, 27(2): 373–384.
Lele, S., Wilshusen, P., Brockington, D., Seidler, R. & Bawa, K. 2010. Beyond exclusion: alternative approaches to biodiversity conservation in the developing tropics. Current Opinion in Environmental Sustainability, 2(1): 94–100.
Leticia Pact. 2019. Leticia Pact for the Amazon. [Cited 2 January 2020]. https://id.presidencia.gov.co/Documents/190906-Pacto-Leticia-Amazonia-Ingles.pdf
Leverington, F., Lemos Costa, K., Pavese, H., Lisle, A. & Hockings, M. 2010. A global analysis of protected area management effectiveness. Environmental Management, 46(5): 685–698.
Levis, C., Costa, F.R., Bongers, F., Peña-Claros, M., Clement, C.R., Junqueira, A.B., Neves, E.G. et al. 2017. Persistent effects of pre-Columbian plant domestication on Amazonian forest composition. Science, 355(6328): 925–931.
Lham, D., Wangchuk, S., Stolton, S. & Dudley, N. 2019. Assessing the effectiveness of a protected area network: a case study of Bhutan. Oryx, 53(1): 63–70.
Li, Q., Morimoto, K., Kobayashi, M., Inagaki, H., Katsumata, M., Hirata, Y., Hirata, K. et al. 2008. Visiting a forest, but not a city, increases human natural killer activity and expression of anti-cancer proteins. International Journal of Immunopathology and Pharmacology, 21: 117–128.
Lindenmayer, D.B. & Fischer, J. 2006. Habitat fragmentation and landscape change: An ecological and conservation synthesis. Washington, DC, Island Press.
Linnell, J.D. & Alleau, J. 2016. Predators that kill humans: myth, reality, context and the politics of wolf attacks on people. In F.M. Angelici, ed. Problematic wildlife: A cross-disciplinary approach, pp. 357–371. Cham, Switzerland, Springer.
Liu, X., Li, Y., Guasch-Ferré, M., Willett, W.C., Drouin-Chartier, J.-P., Bhupathiraju, S.N. & Tobias, D.K. 2019. Changes in nut consumption influence long-term weight change in US men and women. BMJ Nutrition, Prevention & Health, 2(2) [online] [Cited 13 January 2020]. http://dx.doi.org/10.1136/bmjnph-2019-000034
Lo, M., Narulita, S. & Ickowitz, A. 2019. The relationship between forests and freshwater fish consumption in rural Nigeria. PLOS ONE, 14(6): e0218038 [online]. [Cited 4 January 2020]. https://doi.org/10.1371/journal.pone.0218038
Lobón-Cerviá, J., Hess, L.L., Melack, J.M. & Araujo-Lima, C.A. 2015. The importance of forest cover for fish richness and abundance on the Amazon floodplain. Hydrobiologia, 750(1): 245–255.
Lompo, D., Vinceti, B., Gaisberger, H., Konrad, H., Duminil, J., Quedraogo, M., Sina, S. & Geburek, T. 2017. Genetic conservation in Parkia biglobosa (Fabaceae: Mimosoideae) – what do we know? Silvae Genetica, 66(1): 1–8.
Lompo, D., Vinceti, B., Konrad, H., Gaisberger, H. & Geburek, T. 2018. Phylogeography of African locust bean (Parkia biglobosa) reveals genetic divergence and spatially structured populations in West and Central Africa. Journal of Heredity, 109(7): 811–824.
Luke (Natural Resources Institute Finland). 2018. 5+1 Steps towards a functioning insect economy. In: Luke, Natural Resources Institute Finland [online]. Helsinki. [Cited 4 January 2020]. https://www.luke.fi/en/51-steps-towards-functioning-insect-economy/
Lung, T. & Schaab, G. 2010. A comparative assessment of land cover dynamics of three protected forest areas in tropical eastern Africa. Environmental Monitoring and Assessment, 161(1): 531–548.
Lupala, Z.J., Lusambo, L.P., Ngaga, Y.M. & Makatta, A.A. 2015. The land use and cover change in Miombo woodlands under community based forest management and its implication to climate change mitigation: a case of southern highlands of Tanzania. International Journal of Forestry Research, Volume 2015: Article ID 459102 [online]. [Cited 4 January 4, 2020]. http://dx.doi.org/10.1155/2015/459102
Maas, J., Verheij, R.A., Groenewegen, P.P., de Vries, S. & Spreeuwenberg, P. 2006. Green space, urbanity, and health: how strong is the relation? Journal of Epidemiology and Community Health, 60(7): 587–592.
Mace, G.M. 2014. Whose conservation? Science, 345(6204): 1558–1560.
Mahoney, S.P. & Geist, V., eds. 2019. The North American model of wildlife conservation. Baltimore, MD, USA, Johns Hopkins University Press.
Maisels, F., Strindberg, S., Blake, S., Wittemyer, G., Hart, J., Williamson, E.A., Aba’a, R. et al. 2013. Devastating decline of forest elephants in central Africa. PLOS ONE, 8(3): e59469 [online]. [Cited 4 January 2020]. https://doi.org/10.1371/journal.pone.0059469
Maxwell, S.L., Fuller, R.A., Brooks, T.M. & Watson, J.E.M. 2016. The ravages of guns, nets and bulldozers. Nature, 536(7615): 143–145.
May, R. 2010. Tropical arthropod species, more or less? Science, 329(5987): 41–42.
Mbora A., Jamnadass R. & Lillesø J.-P.B. 2008. Growing high priority fruits and nuts in Kenya: Uses and management. Nairobi, The World Agroforestry Centre.
McDonell, E. 2019. Creating the culinary frontier. A critical examination of Peruvian chefs’ narratives of lost/discovered foods. Anthropology of Food, 14 [online]. [Cited 4 January 2020]. http://journals.openedition.org/aof/10183
McFarlane, R.A., Barry, J., Cissé, G., Gislason, M., Gruca, M., Higgs, K., Horwitz, P. et al. 2019. SDG 3: Good health and well-being – framing targets to maximise co-benefits for forests and people. In P. Katila, C.J. Pierce Colfer, W. de Jong, G. Gallowa, P. Pacheco & G. Winkel, eds. Sustainable Development Goals: their impacts on forests and people, pp. 72–107. Cambridge, UK, Cambridge University Press.
McKeown, R. 2002. Education for sustainable development toolkit. Version 2. [Cited 4 January 2020]. http://esdtoolkit.org/esd_toolkit_v2.pdf
McShane, T.O., Hirsch, P.D., Trung, T.C., Songorwa, A.N., Kinzig, A., Monteferri, B., Mutekanga, D. et al. 2011. Hard choices: Making trade-offs between biodiversity conservation and human well-being. Biological Conservation, 144: 966–972.
MEA. 2005. Ecosystems and human well-being: current state and trends. Washington, DC, Island Press.
Medaglia, J.C., Phillips, L.-K. & Perron-Welch, F. 2014. Biodiversity legislation study: a review of biodiversity legislation in 8 countries. London, The Global Legislators’ Organisation, Hamburg, Germany, the World Future Council, and Montreal, Canada, the Centre for International Sustainable Development Law. [also available at http://www.cisdl.org/wp-content/uploads/2018/04/Biodiversity-Legislation-Study.pdf]
MEF (Ministry of Environment and Forestry). 2018. The state of Indonesia’s forests 2018. Jakarta.
MERECP. 2007. Mount Elgon Regional Ecosystem Conservation Programme (MERECP), Work Plan (version March 2007). Nairobi, Kenya.
Min, Q. 2017. Learning from the past for the future: experiences of Hani Rice Terraces in coping with extreme drought. Presentation at a side event on Globally Important Agricultural Heritage Systems and Climate Change, 23rd session of the Conference of the Parties to UNFCCC, Bonn, Germany, 10 November.
MINEF. 1998. Décision No. 0108/D/MINEF/CAB du 9 février 1998: “Portant application des normes d’intervention en milieu forestier en République du Cameroun.” Chapitre VI, Articles 28, 29 et 30 – “Protection de la faune.” Yaoundé.
MINEF. 2001. Order No. 0222/A/MINEF of May 25, 2002 on “procedures for developing, approval, monitoring and control of the implementation of forest management plans for the production forests in the permanent forest estate.” Article 11(1) and (3). Yaoundé.
MINEPDED. 2013. “Readiness Preparation Proposal (R-PP) submitted to the World Bank’s Forest Carbon Partnership Facility (FCPF)” (unpublished).
MIPAAF. 2017. Comunicati stampa – Creato primo elenco alberi monumentali d’Italia [Press release – First list of monumental trees of Italy created]. In: Ministero delle politiche agricole alimentari e forestali [online]. Rome. [Cited 4 January 2020].https://www.politicheagricole.it/flex/cm/pages/ServeBLOB.php/L/IT/IDPagina/12052
MIPAAF. 2019. Elenco degli alberi monumentali d’Italia ai sensi della Legge n. 10/2013 e del Decreto 23 ottobre 2014 [List of the monumental trees of Italy under Law No. 10/2013 and the Decree of 23 October 2014]. In: Ministero delle politiche agricole alimentari e forestali [online]. Rome. [Cited 4 January 2020]. www.politicheagricole.it/flex/cm/pages/ServeBLOB.php/L/IT/IDPagina/11260
Mitchell, R. & Popham, F. 2008. Effect of exposure to natural environment on health inequalities: an observational population study. Lancet, 372(9650): 1655–1660.
Mittermeier, R.A., Myers, N., Thomsen, J.B., da Fonseca, G.A.B. & Olivieri, S. 1998. Biodiversity hotspots and major tropical wilderness areas: approaches to setting conservation priorities. Conservation Biology, 12(3): 516–520.
Mittermeier, R.A., Gil, P.R., Hoffman, M., Pilgrim, J., Brooks, T., Mittermeier, C.G., Lamoreux, J. & da Fonseca, G.A.B. 2004. Hotspots revisited: Earth’s biologically richest and most endangered terrestrial ecoregions. Colonia Centro, Monterrey, Mexico, Cemex.
Mittermeier, R.A., Turner, W.R., Larsen, F.W., Brooks, T.M. & Gascon, C. 2011. Global biodiversity conservation: The critical role of hotspots. In F.E. Zachos & J.C. Habel, eds. Biodiversity hotspots: Distribution and protection of conservation priority areas, pp. 3–22. Berlin, Springer, cited by IPBES. 2019b. Chapter 2.2 Status and Trends – Nature. Unedited draft chapter for IPBES Global Assessment on Biodiversity and Ecosystem Services [online]. Bonn, Germany. [Cited 13 January 2020]. https://ipbes.net/sites/default/files/ipbes_global_assessment_chapter_2_2_nature_unedited_31may.pdf
MNRT. 2015. National Forest Resources Monitoring and Assessment of Tanzania mainland (NAFORMA). Main results. Dar es Salaam, MNRT.
Molinario, G., Hansen, M., Potapov, P., Tyukavina, A. & Stehman, S. 2020. Contextualizing Landscape-Scale Forest Cover Loss in the Democratic Republic of Congo (DRC) between 2000 and 2015. Land 9(1), 23. [also available at https://doi.org/10.3390/land9010023]
Monbiot, G. 2013. Feral: Rewilding the Land, Sea and Human Life. Penguin.
Mongbo, R., Floquet, A., Choden, S. & Moreno Diaz, M.L. 2011. Protected areas – Not just for biodiversity conservation. The contributions of protected areas to the economic and social development in Bhutan, Costa Rica and Benin. Costa Rica, Universidad Nacional.
MoP (Ministry of Planning and International Cooperation) & MoE (Ministry of Environment Jordan). 2008. Integrated financing strategy for sustainable land management in Jordan. Final report. Amman. [also available at http://extwprlegs1.fao.org/docs/pdf/jor169877.pdf].
Mora, C., Tittensor, D.P., Adl, S., Simpson, A.G.B. & Worm, B. 2011. How many species are there on Earth and in the ocean? PLOS Biology, 9(8): e1001127 [online]. [Cited 5 January 2020]. https://doi.org/10.1371/journal.pbio.1001127
Mulenga, B.P., Tembo, S.T. & Richardson, R.B. 2019. Electricity access and charcoal consumption among urban households in Zambia. Development Southern Africa, 36(5): 585–599.
Myers, N. 1990. The biodiversity challenge: Expanded hot-spots analysis. Environmentalist, 10(4): 243–256.
Myers, N., Mittermeier, R.A., Mittermeier, C.G., da Fonseca, G.A.B. & Kent, J. 2000. Biodiversity hotspots for conservation priorities. Nature, 403: 853–858.
NACSO. 2017a. Human wildlife conflict – the hot potato. In: Namibian Association of CBNRM Support Organizations [online]. Windhoek. [Cited 5 March 2019]. http://www.nacso.org.na/news/2017/03/human-wildlife-conflict-%E2%80%93-the-hot-potato
NACSO. 2017b. Resources & publications: State of Community Conservation figures and tables. In: Namibian Association of CBNRM Support Organizations [online]. [Cited 18 December 2019]. http://www.nacso.org.na/resources/state-of-community-conservation-figures-and-tables
Nadkarni, N. 2004. Not preaching to the choir: Communicating the importance of forest conservation to nontraditional audiences. Conservation Biology, 18(3): 602–606.
Nasi, R., Taber, A. & Van Vliet, N. 2011. Empty forests, empty stomachs? Bushmeat and livelihoods in the Congo and Amazon Basins. International Forestry Review, 13(3): 355–368.
Nasi, R., Brown, D., Wilkie, D., Bennett, E., Tutin, C., van Tol, G. & Christophersen, T. 2008. Conservation and use of wildlife-based resources: the bushmeat crisis. Technical Series No. 33. Montreal, Canada, Secretariat of the Convention on Biodiversity, and Bogor, Indonesia, CIFOR.
Nature4Climate. 2019. Nature-based solutions: a summary of announcements and developments during the UN Climate Action Summit and Climate Week. In: Nature4Climate [online]. [Cited 5 January 2020]. https://nature4climate.org/news/nature-based-solutions-a-summary-of-announcements-and-developments-during-the-un-climate-action-summit-and-climate-week
NCED. 2019. What is a conservation easement? In: NCED, National Conservation Easement Database [online]. Greenville, SC, USA. [Cited 5 January 2020]. www.conservationeasement.us/what-is-a-conservation-easement
Nel, A. & Hill, D. 2013. Constructing walls of carbon–the complexities of community, carbon sequestration and protected areas in Uganda. Journal of Contemporary African Studies, 31(3): 421–440.
Nellemann, C., Henriksen, R., Kreilhuber, A., Stewart, D., Kotsovou, M., Raxter, P., Mrema, E. & Barrat, S., eds. 2016. The rise of environmental crime: A growing threat to natural resources peace, development and security. Nairobi, UNEP, and Oslo, Norwegian Center for Global Analyses (RHIPTO).
Nelson F. & Sinandei, M. 2018. Building stronger grassroots organizations that can take community land rights to scale. In: Land portal [online]. Amersfoort, The Netherlands. [Cited 5 January 2020]. https://landportal.org/blog-post/2018/03/building-stronger-grassroots-organizations-can-take-community-land-rights-scale
New Generation Plantations. 2018. Rainforest restoration in Brazil’s Atlantic Forest [online]. [Cited 13 December 2019]. https://newgenerationplantations.exposure.co/rainforest-restoration-in-brazils-atlantic-forest
Newton, P., Miller, D.C., Byenkya, M.A.A. & Agrawal, A. 2016. Who are forest-dependent people? A taxonomy to aid livelihood and land use decision-making in forested regions. Land Use Policy, 57: 388–395.
Nguinguiri, J.C., Czudek, R., Larrubia, C.J., Ilama, L., Le Bel, S., Angoran, E.J., Trebuchon, J.F. & Cornelis, D. 2017. Managing human–wildlife conflicts in central and southern Africa. Unasylva, 249: 39–44.
Nielsen, M.R., Meilby, H., Smith-Hall, C., Pouliot, M. & Treue, T. 2018. The importance of wild meat in the global south. Ecological Economics, 146: 696–705.
Nilsson M., Griggs D. & Visbeck M. 2016. Policy: Map the interactions between Sustainable Development Goals. Nature, 534: 320–322.
Nilsson, K., Sangster, M., Gallis, C., Hartig, T., De Vries, S., Seeland, K. & Schipperijn, J., eds. 2010. Forests, trees and human health. New York, USA, Springer Science + Business Media.
Nirmal, S.A., Pal, S.C., Otimenyin, S.O., Aye, T., Elachouri, M., Kundu, S.K., Thandavarayan, R.A. & Mandal, S.C. 2013. Contribution of herbal products in the global market. The Pharma Review, November–December 2013: 95–104.
Norgrove, L. & Hulme, D. 2006. Confronting conservation at Mount Elgon, Uganda. Development and Change, 37(5): 1093–1116.
Nowak, D.J., Crane, D.E. & Stevens, J.C. 2006. Air pollution removal by urban trees and shrubs in the United States. Urban Forestry & Urban Greening, 4(3–4): 115–123.
Nwaokoro, N. & Kwon-Ndung, E. 2010. Exploiting the potentials of Parkia biglobosa in Nigeria. Paper presented at Plant Biology 2010, Joint Annual Meeting of the American Society of Plant Biologists and the Canadian Society of Plant Physiologists– La Société Canadienne de Physiologie Végétale, Montreal, Canada, 31 July–4 August 2010.
NYDF. 2019. Protecting and restoring forests: A story of large commitments yet limited progress. New York Declaration on Forests Five-year assessment report. Amsterdam, Climate Focus.
Nyhus, P.J. 2016. Human–wildlife conflict and coexistence. Annual Review of Environment and Resources, 41: 143–171.
O’Brien, L. 2009. Learning outdoors: The Forest School approach. Education 3–13, 37(1): 45–60.
O’Brien, L. & Murray, R. 2007. Forest school and its impacts on young children: case studies in Britain. Urban Forestry & Urban Greening, 6(4): 249–265.
Ødegaard, F. 2000. How many species of arthropods? Erwin’s estimate revised. Biological Journal of the Linnean Society, 71(4): 583–597.
Odetokun, S.M. 1996. The nutritive value of baobab fruit (Adansonia digitata). Rivista Italiana delle Sostanze Grasse, 73: 371–373, cited by Manfredini, S., Vertuani, S. & Buzzoni, V. 2002. Adansonia digitata. Il baobab farmacista. L’integratore nutrizionale, 5: 25–29.
OECD. 2019a. Agricultural policy monitoring and evaluation 2019. Paris.
OECD. 2019b. Biodiversity: Finance and the economic and business case for action. Paris.
Olival, K.J., Hosseini, P.R., Zambrana-Torrelio, C., Ross, N., Bogich, T.L. & Daszak, P. 2017. Host and viral traits predict zoonotic spillover from mammals. Nature, 546: 646–650.
Ollerton, J., Winfree, R. & Tarrant, S. 2011. How many flowering plants are pollinated by animals? Oikos, 120(3): 321–326.
Olson, D.M., Dinerstein, E., Wikramanayake, E.D., Burgess, N.D., Powell, G.V.N., Underwood, E.C., D’Amico, J.A. et al. 2015. Terrestrial ecoregions of the world: A new map of life on Earth. BioScience, 51(11): 933–938.
Onana, J.-M., Cheek, M. & Pollard, B. 2011. Red Data Book of the Flowering Plants of Cameroon: IUCN global assessments. Richmond, Surrey, UK, Kew Publishing.
Ong, S. & Carver, E. 2019. The rosewood trade: An illicit trail from forest to furniture. In: YaleEnvironment360 [online]. New Haven, CT, USA. [Cited 5 January 2020]. https://e360.yale.edu/features/the-rosewood-trade-the-illicit-trail-from-forest-to-furniture
Oregon Fish and Wildlife Office. n.d. Northern spotted owl. In: U.S. Fish& Wildlife Service, Oregon Fish and Wildlife Office [online]. Washington, DC. [Cited 5 January 2020]. www.fws.gov/oregonfwo/articles.cfm?id=149489595
Orgiazzi, A., Bardgett, R., Barrios, E., Behan Pelletier, V., Briones, M.J.I., Chotte, J-L., De Deyn, G. et al. eds. 2016. Global Soil Biodiversity Atlas. European Commission, Publications Office of the European Union, Luxembourg.
Ostrom, E. & Nagendra, H. 2006. Insights on linking forests, trees, and people from the air, on the ground, and in the laboratory. PNAS, 103(51): 19224–19231.
Osuri, A.M., Ratnam, J., Varma, V., Alvarez-Loayza, P., Hurtado Astaiza, J., Bradford, M., Fletcher, C. et al. 2016. Contrasting effects of defaunation on aboveground carbon storage across the global tropics. Nature Communications, 7: 11351 [online]. [Cited 5 January 2020]. https://doi.org/10.1038/ncomms11351
Park, B.J., Tsunetsugu, Y., Kasetani, T., Kagawa, T. & Miyazaki, Y. 2010. The physiological effects of Shinrin-yoku (taking in the forest atmosphere or forest bathing): evidence from field experiments in 24 forests across Japan. Environmental Health and Preventive Medicine, 15: 18 [online]. [Cited 5 January 2020]. https://doi.org/10.1007/s12199-009-0086-9
Patenaude, G. & Lewis, K. 2014. The impacts of Tanzania’s natural resource management programmes for ecosystem services and poverty alleviation. International Forestry Review, 16(4): 459−473.
Paumgarten, F., Locatelli, B. & Witkowski, E.T.F. 2018. Wild foods: safety net or poverty trap? A South African case study. Human Ecology, 46(2): 183–195.
Payn, T., Carnus, J.M., Freer-Smith, P., Kimberley, M., Kollert, W., Liu, S., Orazio, C., Rodriguez, L., Neves Silva, L. & Wingfield, M. 2015. Changes in planted forests and future global implications. Forest Ecology and Management, 352: 57–67.
Pereira, H.M., Leadley, P.W., Proenca, V., Alkemada, R., Scharlemann, J.P.W., Fernandez-Manjarres, J.F., Araujo. M.B. et al. 2010. Scenarios for global biodiversity in the 21st century. Science, 330(6010): 1496–1501.
Peres, C.A., Thaise, E., Schietti, J., Desmoulieres, S.J.M. & Levi, T. 2016. Dispersal limitation induces long-term biomass collapse in overhunted Amazonian forests. PNAS, 113: 892–897.
Persha, L., Agrawal, A. & Chhatre, A. 2011. Social and ecological synergy: Local rulemaking, forest livelihoods, and biodiversity conservation. Science, 331(6024): 1606–1608.
Peters, C.M. 2000. Pre-Columbian silviculture and indigenous management of neotropical forests. In D.L. Lentz, ed. Imperfect balance: landscape transformations in the Pre-Columbian Americas, pp. 203–223. New York, USA, Columbia University Press.
Phalan, B., Onial, M., Balmford, A. & Green, R. 2011. Reconciling food production and biodiversity conservation: land sharing and land sparing compared. Science, 333(6047): 1289–1291.
Plumptre, A.J., Kayitare, A., Rainer, H., Gray, M., Munanura, I., Barakabuye, N., Asuma, S., Sivha, M. & Namara, A. 2004. The socio-economic status of people living near protected areas in the Central Albertine Rift. Albertine Rift Technical Reports, 4. Kampala, Albertine Rift Programme.
Polisar, J., de Thoisy, B., Rumiz, D., Dıaz Santos, F., Balas McNab, R., Garcia-Anleu, R., Ponce-Santizo, G., Arispe, R. & Venega, C. 2016. Using certified timber extraction to benefit jaguar and ecosystem conservation. Ambio, 46: 588–603.
Porter-Bolland, L., Ellis, E.A., Guariguata, M.R., Ruiz-Mallén, I., Negrete-Yankelevich, S. & Reyes-García, V. 2012. Community managed forests and forest protected areas: An assessment of their conservation effectiveness across the tropics. Forest Ecology and Management, 268: 6–17.
Potapov, P., Hansen, M.C., Laestadius, L, Turubanova, S., Yaroshenko, A., Thies, C., Smith, W. et al. 2017. The last frontiers of wilderness: Tracking loss of intact forest landscapes from 2000 to 2013. Science Advances, 3(1): e1600821 [online]. [Cited 5 January 2020]. DOI: 10.1126/sciadv.1600821
Poudel, J., Zhang, D. & Simon, B. 2019. Habitat conservation banking trends in the United States. Biodiversity and Conservation, 28(6): 1629–1646.
Poulsen, J.R., Clark, C.J. & Palmer, T.M. 2013. Ecological erosion of an Afrotropical forest and potential consequences for tree recruitment and forest biomass. Biological Conservation, 163: 122–130.
Powell, B., Hall, J. & Johns, T. 2011. Forest cover, use and dietary intake in the East Usambara Mountains, Tanzania. International Forestry Review, 13(3): 305–317.
Premauer J. & Berkes F. 2012. Makuira, Colombia: the cosmological centre of origin for the Wayúu people. In N. Dudley & S. Stolton, eds. Protected landscapes and wild biodiversity, p. 53–60. Gland, Switzerland, IUCN.
Premauer, J. & Berkes, F. 2015. A Pluralistic approach to protected area governance: Indigenous peoples and Makuira National Park. Ethnobiology and Conservation 4: 1–16.
Pretty, J. & Smith, D. 2004. Social capital in biodiversity conservation and management. Conservation Biology, 18(3): 631–638.
Price, R. 2017. Economic drivers and effects of the illegal wildlife trade in sub-Saharan Africa. K4D Helpdesk Report. Brighton, UK, IDS.
Rasolofoson, R.A., Hanauer, M.M., Pappinen, A., Fisher, B. & Ricketts, T.H. 2018. Impacts of forests on children’s diet in rural areas across 27 developing countries. Science Advances, 4(8): eaat2853 [online]. [Cited 5 January 2020]. DOI: 10.1126/sciadv.aat2853
Ratnam, W., Rajora, O.P., Finkeldey, R., Aravanopoulos, F., Bouvet, J.-M., Vaillancourt, R.E., Kanashiro, M., Fady, B., Tomita, M. & Vinson, C. 2014. Genetic effects of forest management practices: Global synthesis and perspectives. Forest Ecology and Management, 333: 52–65.
Redford, K.H. 1992. The empty forest. BioScience, 42: 412–422.
Redmond, I., Aldred, T., Jedamzik, K. & Westwood, M. 2006. Recipes for survival: controlling the bushmeat trade. London, Ape Alliance & World Society for the Protection of Animals.
Reed, J, van Vianen, J., Foli, S., Clendenning, J., Yang, K., MacDonald, M., Petrokofsky, G., Padoch, Ch., Sunderland, T. 2017. Trees for life: The ecosystem service contribution of trees to food production and livelihoods in the tropics. Forest Policy and Economics, 84: 62–71.
Reid, H. & Huq, S. 2005. Climate change-biodiversity and livelihood impacts. In C. Robledo, M. Kanninen & L. Pedroni, eds. Tropical forests and adaptation to climate change, pp. 57–70. Bogor, Indonesia, CIFOR.
Reij, C., Tappan, G. & Smale, M. 2009. Agroenvironmental transformation in the Sahel. Another kind of “Green Revolution”. IFPRI Discussion Paper 00914. Washington, DC, IFPRI.
Reimchen T.E. & Arbellay, E. 2019. Influence of spawning salmon on tree-ring width, isotopic nitrogen, and total nitrogen in old-growth Sitka spruce from coastal British Columbia. Canadian Journal of Forest Research, 49: 1078–1086.
Reimoser, F. 2000. Income from hunting in mountain forests of the Alps. In M.F. Price & N. Butt, eds. Forests in sustainable mountain development: a state of knowledge report for 2000, pp. 346–353. IUFRO Research Series No. 5. New York, CABI Publishing.
Repetto, R. 1992. Accounting for environmental assets. Scientific American, 266(6): 94–101.
Reyes-Garcia, V., Guèze, M., Luz, A.C., Paneque-Gálvez, J., Macía, M.J., Orta-Martínez, M., Pino, J. & Rubio-Campillo, X. 2013. Evidence of traditional knowledge loss among a contemporary indigenous society. Evolution and Human Behavior, 34(4): 249–257.
Ribeiro, M.C., Metzger, J.P., Martensen, A.C., Ponzoni, F.J. & Hirota, M.M. 2009. The Brazilian Atlantic Forest: How much is left, and how is the remaining forest distributed? Implications for conservation. Biological Conservation, 142(6): 1141–1153.
Ribot, J.C. 2002. Democratic decentralization of natural resources: institutionalizing popular participation. Washington, DC, WRI.
Ripple, W.J., Newsome, T.M., Wolf, C., Dirzo, R., Everatt, K.T., Galetti, M., Hayward, M.W. et al. 2015. Collapse of the world’s largest herbivores. Science Advances, 1: e1400103 [online]. [Cited 5 January 2020]. https://doi.org/10.1126/sciadv.1400103
Ripple, W.J., Abernethy, K., Betts, M.G., Chapron, G., Dirzo, R., Galetti, M., Levi, T. et al. 2016. Bushmeat hunting and extinction risk to the world’s mammals. Royal Society Open Science, 3: 160498 [online]. [Cited 5 January 2020]. https://doi.org/10.1098/rsos.160498
Ritchie, H., Roser, M., Mispy, J. & Ortiz-Ospina, E. 2018. SDG Tracker: Indicator 15.1.2. In: SDG Tracker [online]. Oxford, UK. [Cited 19 December 2019]. https://sdg-tracker.org/biodiversity#15.1.2
Rivers, M.C., Beech, E., Bazos, I., Bogunić, F., Buira, A., Caković, D., Carapeto, A. et al. 2019. European red list of trees. Cambridge, UK, IUCN.
RNZ. 2019. Calls to train a million UK volunteers to tackle invasive species. In: RNZ [online]. Wellington, New Zealand. [Cited 5 January 2020]. www.rnz.co.nz/news/world/401840/calls-to-train-a-million-uk-volunteers-to-tackle-invasive-species
Roberts, P. 2019. Tropical forests in prehistory, history, and modernity. Oxford, UK, Oxford University Press.
Rodas, A. & Stoian, D. 2015. Determinación de los beneficios socioeconómicos del aprovechamiento forestal percibidos por tres comunidades con concesiones comunitarias en el Petén, Guatemala. Report of the ADA Community Forestry Project in Mesoamerica. Petén, Guatemala, Bioversity International.
Rohr, J.R., Civitello, D.J., Halliday, F.W., Hudson, P.J., Lafferty, K.D., Wood, C.L. & Mordecai, E.A. 2019. Towards common ground in the biodiversity–disease debate. Nature Ecology & Evolution, 4: 24–33.
Rook, G.A. 2013. Regulation of the immune system by biodiversity from the natural environment: an ecosystem service essential to health. PNAS, 110(46): 18360–18367.
Roosevelt, A.C., Lima da Costa, M., Lopes Machado, C., Michab, M., Mercier, N., Valladas, H., Feathers, J. et al. 1996. Paleoindian cave dwellers in the Amazon: the peopling of the Americas. Science, 272(5260): 373–384.
Roper, B.B., Saunders, W.C. & Ojala, J.V. 2019. Did changes in western federal land management policies improve salmonid habitat in streams on public lands within the Interior Columbia River Basin? Environmental Monitoring and Assessment, 191:574 [online]. [Cited 5 January 2020]. https://doi.org/10.1007/s10661-019-7716-5
Rowland, D., Blackie, R.R., Powell, B., Djoudi, H., Vergles, E., Vinceti, B. & Ickowitz, A. 2015. Direct contributions of dry forests to nutrition: a review. International Forestry Review, 17(S2): 45–53.
Rowland, D., Ickowitz, A., Powell, B., Nasi, R. & Sunderland, T. 2017. Forest foods and healthy diets: quantifying the contributions. Environmental Conservation, 44(2): 102–114.
RRI. 2015. Protected areas and the land rights of indigenous peoples and local communities: current issues and future agenda. Washington, DC, RRI.
RSCN. 2018. Report on the benefits generated by local communities from DBR [in Arabic]. Amman, RSCN.
RSCN and Wild Jordan. 2017. Explore Dana: Jordan’s rift valley spectacular. Brochure. Amman, RSCN.
Ruf, F. & Zadi, H. 1998. Cocoa: from deforestation to reforestation. In: Smithsonian’s National Zoo & Biology Institute [online]. Washington, DC. [Cited 5 January 2020]. https://nationalzoo.si.edu/scbi/migratorybirds/research/cacao/ruf.cfm
Ruijs, A. & Vardon, M. 2019. Natural capital accounting for mainstreaming biodiversity in public policy making. In Vardon, M., Bass, S., and Ahlroth, S. eds. Natural Capital Accounting for Better Policy Decisions: Climate change and Biodiversity. Proceedings and Highlights of the 3rd Forum on Natural Capital Accounting for Better Policy Decisions, pp. 73–100. World Bank WAVES, Washington D.C.
Ruokolainen, L., Von Hertzen, L., Fyhrquist, N., Laatikainen, T., Lehtomäki, J., Auvinen, P. & Knip, M. 2015. Green areas around homes reduce atopic sensitization in children. Allergy, 70(2): 195–202.
Sabogal, C., Besacier, C. & McGuire, D. 2015. Forest and landscape restoration: concepts, approaches and challenges for implementation. Unasylva, 245: 3–10.
Sacande, M., Jøker, D., Dulloo, M.E. & Thomsen, K.A. eds. 2004. Comparative storage biology of tropical tree seeds. Rome, IPGRI.
Sachedina, H. & Nelson, F. 2012. The development of payments for ecosystem services as a community-based conservation strategy in East Africa. In J. Ingram, F. DeClerck & C. Rumbaitis del Rio, eds. Integrating ecology and poverty reduction: the application of ecology in development solutions, pp. 149–171. New York, USA, Springer.
Sarkar, D., Walker-Swaney, J. & Shetty, K. 2019. Food diversity and indigenous food systems to combat diet-linked chronic diseases. Current Developments in Nutrition, nzz099 [online]. [Cited 5 January 2020]. https://doi.org/10.1093/cdn/nzz099
Sassen, M. 2014. Conservation in a crowded place: forest and people on Mount Elgon, Uganda. Wageningen University. (PhD thesis)
Sassen, M., Arnell, A.P. & van Soesbergen, A. forthcoming. Mapping risks to biodiversity and ecosystem services from cocoa-driven deforestation in West Africa.
Sassen, M., Sheil, D., Giller, K.E. & ter Braak, C.J. 2013. Complex contexts and dynamic drivers: understanding four decades of forest loss and recovery in an East African protected area. Biological Conservation, 159: 257–268.
Saunders, C.D., Brook, A.T. & Meyers, O.E. 2006. Using psychology to save biodiversity and human well-being. Conservation Biology, 20: 702–705.
Save the Elephants. 2019. Welcome to The Elephants and Bees Project [online]. Nairobi. [Cited 5 January 2020]. https://elephantsandbees.com
Sayer, J.A., Campbell, B., Petheram, L., Aldrich, M., Perez, M., Endamana, D., Nzooh Dongmo, Z.-L. et al. 2007. Assessing environment and development outcomes in conservation landscapes. Biodiversity and Conservation, 16(9), 2677–2694.
Sayer, J.A., Margules, C., Boedhihartono, A.K., Sunderland, T., Langston, J.D., Reed, J., Riggs, R. et al. 2017. Measuring the effectiveness of landscape approaches to conservation and development. Sustainability Science, 12: 465–476.
Schelley, C., Cross, J.E., Franzen, W.S., Hall, P. & Reeve, S. 2012. How to go green: creating a conservation culture in a public high school through education, modelling, and communication. Journal of Environmental Education, 43(3): 143–161.
Schroth, G., Harvey, C.A., da Fonseca, G.A., Vasconcelos, H.L., Gascon, C. & Izac, A.M.N. eds. 2004. Agroforestry and biodiversity conservation in tropical landscapes. Washington, DC, Island Press.
Schroth, G., Läderach, P., Martinez-Valle, A.I., Bunn, C. & Jassogne, L. 2016. Vulnerability to climate change of cocoa in West Africa: Patterns, opportunities and limits to adaptation. Science of the Total Environment, 556: 231–241.
Schueler, S., Falk, W., Koskela, J., Lefèvre, F., Bozzano, M., Hubert, J., Kraigher, H., Longauer, R. & Olrik, D.C. 2014. Vulnerability of dynamic genetic conservation units of forest trees in Europe to climate change. Global Change Biology, 20: 1498–1511.
Schulp, C.J., Thuiller, W. & Verburg, P.H. 2014. Wild food in Europe: A synthesis of knowledge and data of terrestrial wild food as an ecosystem service. Ecological Economics, 105: 292–305.
Schuster, R., Germain, R.R., Bennett, J.R., Reo, N.J. & Arcese, P. 2019. Vertebrate biodiversity on indigenous-managed lands in Australia, Brazil, and Canada equals that in protected areas. Environmental Science and Policy, 101: 1–6.
Schweik, C.M. 2000. Optimal foraging, institutions and forest change: A case from Nepal. Environmental Monitoring and Assessment, 62: 231–260.
SEGeF. 2018. Suivi de la gestion de la faune dans les forêts de production [online]. Yaoundé. [Cited 13 January 2020]. http://151.236.37.239/segef/public/
Shackleton, S., Paumgarten, F., Kassa, H., Husselman, M. & Zida, M. 2011. Opportunities for enhancing poor women’s socioeconomic empowerment in the value chains of three African non-timber forest products (NTFPs). International Forestry Review, 13(2): 136–151.
Shaffer, L.J., Khadka, K.K., Van Den Hoek, J. & Naithani, K.J. 2019. Human-elephant conflict: a review of current management strategies and future directions. Frontiers in Ecology and Evolution, 6: 235 [online]. [Cited 5 January 2020]. https://doi.org/10.3389/fevo.2018.00235
Shanahan, D.F., Lin, B.B., Bush, R., Gaston, K.J., Dean, J.H., Barber, E. & Fuller, R.A. 2015. Towards improved public health outcomes from urban nature. American Journal of Public Health, 105: 470–477.
Sharpe, B. 1998. First the forest: conservation, community and participation in south-west Cameroon. Africa, 68(1): 25–45.
Shisegar, N. 2014. The impact of green areas on mitigating urban heat island effect: a review. International Journal of Environmental Sustainability, 9: 119–130.
Sichuan Forestry Department. 2015. The Pandas of Sichuan: The 4th Survey Report on Giant Panda in Sichuan Province. Chengdu, China, Sichuan Science and Technology Press. Cited by Brinckmann, J.A., Luo W., Xu Q., He X., Wu J., & Cunningham A.B. 2018. Sustainable harvest, people and pandas: Assessing a decade of managed wild harvest and trade in Schisandra sphenanthera. Journal of Ethnopharmacology, 224: 522–534.
Silva, L.N., Freer-Smith, P. & Madsen, P. 2019. Production, restoration, mitigation: a new generation of plantations. New Forests, 50(2): 153–168.
Sinovas, P., Price, B., King, E., Hinsley, A. & Pavitt, A. 2017. Wildlife trade in the Amazon countries: an analysis of trade in CITES listed species. Technical report prepared for the Amazon Regional Program (BMZ/DGIS/GIZ). Cambridge, UK, UNEP-WCMC.
Sirén, A. & Machoa, J. 2008. Fish, wildlife, and human nutrition in tropical forests: a fat gap? Interciencia, 33: 186–193.
Skole, D. & Tucker, C.J. 1993. Tropical deforestation and habitat fragmentation in the Amazon: satellite data from 1978 to 1988. Science, 260(5116): 1905–1910.
Soares-Filho, B., Moutinho, P., Nepstad, D., Anderson, A., Rodrigues, H., Garcia, R., Dietzsch,L. et al. 2010. Role of Brazilian Amazon protected areas in climate change mitigation. PNAS, 107(24): 10821–10826.
Solecki, R. 1975. Shanidar IV, a Neanderthal flower burial in northern Iraq. Science, 190(4217): 880–881.
Song, X.P., Hansen, M.C., Stehman, S.V., Potapov, P.V., Tyukavina, A., Vermote, E.F. & Townshend, J.R. 2018. Global land change from 1982 to 2016. Nature, 560: 639–643.
Southworth, J., Nagendra, H. & Munroe, D.K. 2006. Introduction to the Special Issue: Are parks working? Exploring human-environment tradeoffs in protected area conservation. Applied Geography, 26(2): 87–95.
Spies, T.A., Stine, P.A., Gravenmier, R., Long, J.W., Reilly, M.J., tech. coords. 2018. Synthesis of science to inform land management within the Northwest Forest Plan area. 3 volumes. General Technical Report PNW-GTR-966. Portland, OR, USA, US Department of Agriculture, Forest Service, Pacific Northwest Research Station.
Stanturf, J., Mansourian, S. & Kleine, M., eds. 2017. Implementing forest landscape restoration: A practitioner’s guide. Vienna, IUFRO-SPDC.
Stanturf, J.A., Palik, B.J. & Dumroese, R.K. 2014. Contemporary forest restoration: a review emphasizing function. Forest Ecology and Management, 331: 292–323.
St. John, F.A.V, Edwards-Jones, G. & Jones, J.P.G. 2010. Conservation and human behaviour: lessons from social psychology. Wildlife Research, 37: 658–667.
Stattersfield, A.J., Crosby, M.J., Long, A.J., and Wege, D.C. 1998. Endemic bird areas of the world: priorities for biodiversity conservation. Cambridge, UK, BirdLife International.
Stavert, J.R., Pattemore, D.E., Gaskett, A.C., Beggs, J.R. & Bartomeus, I. 2007. Exotic species enhance response diversity to land-use change but modify functional composition. Proceedings of the Royal Society B – Biological Sciences, 284(1860): 20170788 [online]. [Cited 13 January 2020]. https://doi.org/10.1098/rspb.2017.0788
Steffen, W., Richardson, K., Rockström, J., Cornell, S.E., Fetzer, I., Bennett, E.M., Biggs, R. et al. 2015. Planetary boundaries: Guiding human development on a changing planet. Science, 347(6223): 1259855 [online]. [Cited 5 January 2020]. https://doi.org/10.1126/science.1259855
Stevens, C., Winterbottom, R., Springer, J. & Reytar, K. 2014. Securing rights, combating climate change: How strengthening community forest rights mitigates climate change. Washington, DC, WRI.
Stoian, D. & Rodas, A. 2018. Successful community stewardship of tropical forests: evidence from community forest concessions in Petén, Guatemala. Paper presented at the 19th Annual Conference on Land and Poverty held by the World Bank in Washington DC on March 19–23, 2018 [online]. [Cited 5 January 2020]. https://cgspace.cgiar.org/bitstream/handle/10568/93439/Successful_Stoian_2018.pdf?sequence=1
Stoian, D., Rodas, A., Butler, M., Monterroso, I. & Hodgdon, B. 2018. Forest concessions in Petén, Guatemala: A systematic analysis of the socioeconomic performance of community enterprises in the Maya Biosphere Reserve. Bogor, Indonesia, CIFOR.
Stolton, S., Redford, K.H., Dudley, N., Bill, W., Corcuera, E. & Mitchel, B.A. 2014. The futures of privately protected areas. Gland, Switzerland, IUCN.
Strassburg, B., Beyer, H.L., Crouzeilles, R. Iribarrem, A., Barros, F., Siqueira, M., Sánchez-Tapia, A. et al. 2019. Strategic approaches to restoring ecosystems can triple conservation gains and halve costs. Nature Ecology & Evolution, 3: 62–70.
Sunderland, T., Sunderland-Groves, J., Shanley, P. & Campbell, B. 2009. Bridging the gap: how can information access and exchange between conservation biologists and field practitioners be improved for better conservation outcomes? Biotropica, 41(5): 549–554.
Sunderlin, W.D., Angelsen, A., Belcher, B., Burgers, P., Nasi, R., Santoso, L. & Wunder, S. 2005. Livelihoods, forest, and conservation in developing countries: an overview. World Development, 33(9): 1383–1402.
Tamosiunas, A., Gražulevičienė, R., Luksiene, D., Dedele, A., Reklaitiene, R., Baceviciene, M., & Milinaviciene, E. 2014. Accessibility and use of urban green spaces, and cardiovascular health: findings from a Kaunas cohort study. Environmental Health, 13: 20 [online]. [Cited 5 January 2020]. https://doi.org/10.1186/1476-069X-13-20
Taniwaki, R.H., Leal, C.G., de Barros Ferraz, S.F., Henrikson, L., Jägrud, L. & de Paula, F.R. 2018. Blue Targeting Tool: a simple forestry planning for riparian buffer zones adapted to Brazilian streams. Poster presented at the Joint Conference on Forests and Water, 2018, Valdivia, Chile. [also available at https://www.researchgate.net/publication/329102135_Blue_Targeting_Tool_a_simple_forestry_planning_for_riparian_buffer_zones_adapted_to_Brazilian_streams].
Tauli-Corpuz, V., Alcorn, J. & Molnar, A. 2018. Cornered by protected areas: replacing ‘fortress’ conservation with rights-based approaches helps bring justice for indigenous peoples and local communities, reduces conflict, and enables cost-effective conservation and climate change. Washington, DC, RRI.
The Guardian. 2020. A rewilding triumph: wolves help to reverse Yellowstone degradation. In: The Guardian [online]. [Cited 15 January 2020]. https://www.theguardian.com/environment/2020/jan/25/yellowstone-wolf-project-25th-anniversary
Tibesigwa, B., Siikamäki, J., Lokina R. & Alvsilver J. 2019. Naturally available wild pollination services have economic value for nature dependent smallholder crop farms in Tanzania. Scientific Reports, 9: 3434 [online]. [Cited 5 January 2020]. https://doi.org/10.1038/s41598-019-39745-7
TNC. 2019. Tropical Forest Conservation Act. Benefits for Natural Resources and the American People. In: The Nature Conservancy [online]. [Cited 15 February 2020]. https://www.nature.org/en-us/about-us/who-we-are/how-we-work/policy/tropical-forest-conservation-act/
Tracewski, Ł., Butchart, S.H.M., Donald, P.F., Evans, M., Fishpool, L.D.C. & Buchanan, G.M. 2016. Patterns of twenty-first century forest loss across a global network of important sites for biodiversity. Remote Sensing in Ecology and Conservation, 2(1): 37–44.
TRAFFIC. 2019. African elephants: elephant conservation and the global trade in ivory. In: TRAFFIC [online]. Cambridge, UK. [Cited 5 January 2020]. www.traffic.org/what-we-do/species/elephants-ivory
Triguero-Mas, M., Dadvand, P., Cirach, M., Martínez, D., Medina, A., Mompart, A., Basagaña, X., Gražulevičienė, R. & Nieuwenhuijsen, M.J. 2015. Natural outdoor environments and mental and physical health: relationships and mechanisms. Environment International, 77, 35–41.
Tropical Forest Alliance. 2017. The Role of the Financial Sector in Deforestation-Free Supply Chains. Tropical Forest Alliance and World Economic Forum, Geneva. [also available at https://www.vivideconomics.com/wp-content/uploads/2019/08/TFA2020_Framing_Paper_030117.pdf].
Turner, I. 1996. Species loss in fragments of tropical rain forest: a review of the evidence. Journal of Applied Ecology, 33: 200–209.
Turner, B.L. & Sabloff, J.A. 2012. Classic Period collapse of the Central Maya Lowlands: Insights about human–environment relationships for sustainability. PNAS, 109(35):13908–13914.
UAESPNN. 2005. Plan de manejo Parque Nacional Natural Macuira 2005–2009 [National Natural Park Makuira, Management Plan 2005–2009]. Bogota, Parques Nacionales Naturales de Colombia.
Udawatta, R.P., Rankoth, L.M. & Jose, S. 2019. Agroforestry and biodiversity. Sustainability, 11(10): 2879 [online]. [Cited 5 January 2020]. https://doi.org/10.3390/su11102879
UN. 1992a. United Nations Convention on Biological Diversity. New York, USA. [also available at https://www.cbd.int/doc/legal/cbd-en.pdf].
UN. 1992b. United Nations Framework Convention on Climate Change. New York, USA. [also available at https://unfccc.int/resource/docs/convkp/conveng.pdf].
UN. 1992c. United Nations Convention on to Combat Desertification. New York, USA. [also available at https://www.unccd.int/sites/default/files/relevant-links/2017-01/UNCCD_Convention_ENG_0.pdf]
UN. 2008a. United Nations Declaration on the Rights of Indigenous Peoples. New York, USA. [also available at https://www.un.org/esa/socdev/unpfii/documents/DRIPS_en.pdf].
UN. 2008b. World urbanization prospects: The 2007 revision. New York, USA.
UN. 2015. Paris Agreement. New York, USA. [also available at https://unfccc.int/files/essential_background/convention/application/pdf/english_paris_agreement.pdf].
UN. 2017a. United Nations Strategic Plan for Forests 2017–2030. In: United Nations Department of Economic and Social Affairs – Forests [online]. New York, USA. [Cited 5 January 2020]. www.un.org/esa/forests/documents/un-strategic-plan-for-forests-2030/index.html
UN. 2017b. New York Declaration on Forests (list of endorsers updated in July 2017). New York, USA. [also available at https://www.undp.org/content/dam/undp/library/Environment%20and%20Energy/Forests/New%20York%20Declaration%20on%20Forests_DAA.pdf].
UN. 2019a. The Sustainable Development Goals Report 2019. New York, USA.
UN. 2019b. General Assembly. Seventy-third Session. 107th plenary meeting, Monday, 16 September 2019, 10 a.m., New York. A/73/PV.107. New York, USA. [also available at https://undocs.org/en/A/73/PV.107].
UN. 2020. SDG indicators: Metadata repository. In: United Nations, Department of Economic and Social Affairs, Statistics Division [online]. New York, USA. [Cited 5 January 2020]. https://unstats.un.org/sdgs/metadata
UN, European Commission, FAO, IMF, et al. 2014a. System of Environmental Economic Accounting 2012 — Central Framework. New York. [also available at http://unstats.un.org/unsd/envaccounting/seeaRev/SEEA_CF_Final_en.pdf]
UN, European Commission, FAO, OECD, et al. 2014b. System of Environmental Economic Accounting 2012 — Experimental Ecosystem Accounting. New York. [also available at http://unstats.un.org/unsd/envaccounting/seeaRev/eea_final_en.pdf]
United Nations General Assembly. 2008. 62/98. Non-legally binding instrument on all types of forests. Resolution adopted by the General Assembly on 17 December 2007. A/RES/62/98. New York, USA. [also available at https://undocs.org/en/A/RES/62/98].
United Nations General Assembly. 2015a. Transforming our world: the 2030 Agenda for Sustainable Development. Resolution adopted by the General Assembly on 25 September 2015. A/RES/70/1. New York, USA. [also available at https://undocs.org/en/A/RES/70/1].
United Nations General Assembly. 2015b. Tackling illicit trafficking in wildlife. Resolution adopted by the General Assembly on 30 July 2015. A/RES/69/314. New York, USA. [also available at https://undocs.org/en/A/RES/69/314].
UNCCD. n.d. The LDN Fund – An impact investment fund for land degradation neutrality. In: United Nations Convention to Combat Desertification [online]. Bonn, Germany. [Cited 2 January 2020]. https://www.unccd.int/actions/impact-investment-fund-land-degradation-neutrality
UNCCD. 2018. Decision 7/COP.13. The future strategic framework of the Convention. Bonn, Germany. [also available at https://www.unccd.int/sites/default/files/relevant-links/2018-08/cop21add1_SF_EN.pdf].
UNCCD. 2019a. The LDN target setting programme. In: United Nations Convention to Combat Desertification [online]. Bonn, Germany. [Cited 5 January 2020]. www.unccd.int/actions/ldn-target-setting-programme
UNCCD. 2019b. The GGW aims to restore Africa’s degraded landscapes and transform millions of lives in one of the world’s poorest regions. In: United Nations Convention to Combat Desertification [online]. Bonn, Germany. [Cited 5 January 2020]. https://knowledge.unccd.int/publications/ggw-aims-restore-africas-degraded-landscapes-and-transform-millions-lives-one-worlds
UNCTAD. 2006. International Tropical Timber Agreement, 2006. TD/TIMBER.3/12. Geneva, Switzerland. [also available at https://treaties.un.org/doc/source/docs/tdtimber3d12_en.pdf].
UNDESA. 2016. Documents – UN forest instrument. In: United Nations Department of Economic and Social Affairs [online]. [Cited 18 December 2019]. https://www.un.org/esa/forests/documents/un-forest-instrument/index.html
UNDP. 2017. What is biodiversity finance? In: United Nations Development Programme – BIOFIN – The Biodiversity Finance Initiative [online]. New York, USA. [Cited 5 January 2020]. www.biodiversityfinance.net/about-biofin/what-biodiversity-finance
UNECE & FAO. 2018. Forests and Water. Valuation and payments for forest ecosystem services. Geneva. [also available at https://www.unece.org/fileadmin/DAM/timber/publications/sp-44-forests-water-web.pdf]
UNEP. 1979. Convention on the Conservation of Migratory Species of Wild Animals. Nairobi. [also available at https://www.cms.int/sites/default/files/instrument/CMS-text.en_.PDF].
UNEP. 2019. Global environment outlook GEO-6. Summary for policy makers. Cambridge, UK, Cambridge University Press.
UNEP-WCMC. 2007. A spatial analysis approach to the global delineation of dryland areas of relevance to the CBD Programme of Work on Dry and Subhumid Lands. Cambridge, UK.
UNEP-WCMC. 2020. Welcome to the global ICCA Registry [online]. Cambridge, UK. [Cited 5 January 2020]. http://www.iccaregistry.org/
UNEP-WCMC & IUCN. 2019. World Database on Protected Areas. In: Protected Planet [online]. Cambridge, UK. [Cited 31 December 2019]. https://www.protectedplanet.net/c/world-database-on-protected-areas
UNEP-WCMC, IUCN & NGS. 2020. Protected Planet Digital Report [online]. Cambridge, UK, Gland, Switzerland and Washington, DC. [Cited 18 December 2019] https://livereport.protectedplanet.net
UNEP-WCMC & UNSD. 2019. Assessing the linkages between global indicator initiatives, SEEA Modules and the SDG Targets. Working Document. [also available at https://seea.un.org/sites/seea.un.org/files/seea_global_indicator_review_methodological_note_post_workshop_0.pdf]
UNESCO. 1971. Convention on wetlands of international importance especially as waterfowl habitat. Paris. [also available at https://treaties.un.org/doc/Publication/UNTS/Volume%20996/volume-996-I-14583-English.pdf].
UNFCCC. 2011. Report of the Conference of the Parties on its 16th session, Cancun, Mexico, 29 November – 10 December 2010. Addendum: Part Two: Action taken by the Conference of the Parties at its sixteenth session. Decision 1/CP.16. The Cancun Agreements: Outcome of the work of the Ad Hoc Working Group on Long-term Cooperative Action under the Convention. FCCC/CP/2010/7/Add.1. Bonn, Germany. [also available at https://unfccc.int/resource/docs/2010/cop16/eng/07a01.pdf].
UNODC. 2016. World wildlife crime report: Trafficking in protected species 2016. Vienna.
USAID. 2017. Countries with TFCA Programs. In: UNAID [online]. Washington, DC. [Cited 2 January 2020]. https://www.usaid.gov/biodiversity/TFCA/programs-by-country
USDA. n.d.a. Northwest Forest Plan. In: United States Department of Agriculture, Forest Service [online]. Washington, DC. [Cited 2 January 2020]. https://www.fs.usda.gov/detail/r6/landmanagement/planning/?cid=fsbdev2_026990
USDA. n.d.b. 5022: Wild crop harvesting. In: United States Department of Agriculture, Agricultural Marketing Service [online]. Washington, DC. [Cited 2 January 2020]. https://www.ams.usda.gov/rules-regulations/organic/handbook/5022
US Fish & Wildlife Service. 1998. Recovery plan for the Oregon chub (Oregonichthys crameri). Portland, OR, USA.
US Fish & Wildlife Service. 2018. North American Model of Wildlife Conservation. In: US Fish & Wildlife Service, Hunting [online]. Washington, DC. [Cited 1 January 2020]. https://www.fws.gov/hunting/north-american-model-of-wildlife-conservation.html
US/ICOMOS. 2019. Heritage trees: international research and registries. In: US/ICOMOS [online]. Washington, DC. [Cited 5 January 2020]. https://usicomos.org/heritage-trees-international-research-and-registries/
Uusivuori, J., Lehto, E. & Palo, M. 2002. Population, income and ecological conditions as determinants of forest area variation in the tropics. Global Environmental Change, 12: 313–323.
Valencia, R., Balslev, H. & Paz y Miño, G.C. 1994. High tree alpha-diversity in Amazonian Ecuador. Biodiversity & Conservation, 3:21– 28, cited by Dirzo, R. & Raven, P. H. 2003. Global state of biodiversity and loss. Annual Review of Environment and Resources, 28: 137–167.
van Lierop, P., Lindquist, E., Sathyapala, S. & Franceschini, G. 2015. Global forest area disturbance from fire, insect pests, disease and severe weather events. Forest Ecology and Management 352: 78–88.
Van Vliet, N., Muhindo, J., Nyumu, J.K. & Nasi, R. 2019. From the forest to the dish: A comprehensive study of the wildmeat value chain in Yangambi, Democratic Republic of Congo. Frontiers in Ecology and Evolution, 7: 132 [online]. [Cited 5 January 2020]. https://doi.org/10.3389/fevo.2019.00132
Verdone, M. & Seidl, A. 2017. Time, space, place, and the Bonn Challenge global forest restoration target. Restoration Ecology, 25(6): 903–911. [also available at http://dx.doi.org/10.1111/rec.12512]
Verissimo, D. 2013. Influencing human behaviour: an underutilised tool for biodiversity management. Conservation Evidence, 10: 29–31.
Verschuuren, B. & Brown, S. eds. 2018. Cultural and spiritual significance of nature in protected areas: Governance, management and policy. Abingdon, UK, Routledge.
Vié, J.-C., Hilton-Taylor, C. & Stuart, S.N. eds. 2009. Wildlife in a changing world: an analysis of the 2008 IUCN Red List of Threatened Species. Gland, Switzerland, IUCN.
Vlam, M., van der Sleen, P., Groenendijk, P. & Zuidema, P.A. 2017. Tree age distributions reveal large-scale disturbance-recovery cycles in three tropical forests. Frontiers in Plant Science, 7: 1984 [online]. [Cited 5 January 2020]. https://doi.org/10.3389/fpls.2016.01984
Vogt, P. 2019a. Image object Accounting (Available in the free JRC software GuildosToolbox). Ispra, Italy, European Commission Joint Research Center, Directorate for Sustainable Resources. [also available at https://ies-ows.jrc.ec.europa.eu/gtb/GTB/psheets/GTB-Objects-Accounting.pdf].
Vogt, P. 2019b. Measuring Forest Area Density to quantify forest fragmentation. (Available in the free JRC software GuidosToolbox). Ispra, Italy, European Commission Joint Research Center, Directorate for Sustainable Resources. [also available at https://ies-ows.jrc.ec.europa.eu/gtb/GTB/psheets/GTB-Fragmentation-FADFOS.pdf
Vogt, P., Riitters, K.H., Caudullo, G., Eckhardt, B. 2019. FAO – State of the World’s Forests: Forest fragmentation. JRC Technical Report, EUR 29972 EN. Luxembourg, Publications Office of the European Union. [also available at https://publications.jrc.ec.europa.eu/repository/bitstream/JRC118594/technicalreport_fao_frag.pdf].
Vorontsova, M.S., Clark, L.G., Dransfield, J., Govaerts, R. & Baker, W.J. 2016. World checklist of bamboos and rattans. INBAR Technical Report No. 37, Beijing, INBAR.
Walker, X.J., Baltzer, J.L., Cumming, S.G., Day, N.J., Ebert, C., Goetz, S., Johnstone, J.F. et al. 2019. Increasing wildfires threaten historic carbon sink of boreal forest soils. Nature, 572: 520–523.
Watson, E.E. 2005. Gender-sensitive natural resource management (NRM) research-for-development. DFID NRSP Programme Development Report PD123: Gender Sensitive Research for Development. Cambridge, UK, University of Cambridge, Department of Geography.
Watson, J.E.M., Dudley, N., Segan, D.B. & Hockins, M. 2014. The performance and potential of protected areas. Nature, 515: 67–73.
Watson, J.E.M., Evans, T., Venter, O., Williams, B., Tulloch, A., Stewart, C., Thompson, I. et al. 2018. The exceptional value of intact forest ecosystems. Nature Ecology & Evolution 2: 599–610.
WEF. 2020. One trillion trees – World Economic Forum launches plan to help nature and the climate. In: World Economic Forum [online]. Geneva, Switzerland. [Cited 15 February 2020]. https://www.weforum.org/agenda/2020/01/one-trillion-trees-world-economic-forum-launches-plan-to-help-nature-and-the-climate/
West, P., Igoe, J., & Brockington, D. 2006. Parks and peoples: the social impact of protected areas. Annual Review of Anthropology, 35: 251–277.
White, M.P., Alcock, I., Wheeler, B.W. & Depledge, M.H. 2013. Would you be happier living in a greener urban area? A fixed-effects analysis of panel data. Psychological Science, 24(6): 920–928.
WHO. 2002. WHO Traditional medicine strategy: 2002–2005. Geneva, Switzerland.
WHO. 2016. Ambient air pollution: a global assessment of exposure and burden of disease. Geneva, Switzerland.
WHO. 2017. 5. Annex 5. Guidelines for the production, control and regulation of snake antivenom immunoglobulins. Replacement of Annex 2 of WHO Technical Report Series, No. 964. Geneva, Switzerland.
WHO. 2018a. Household air pollution and health. In: World Health Organization [online]. Geneva, Switzerland. [Cited 5 January 2020]. www.who.int/news-room/fact-sheets/detail/household-air-pollution-and-health
WHO. 2018b. Air pollution: Maps and databases. In: World Health Organization [online]. Geneva, Switzerland. [Cited 5 January 2020]. www.who.int/airpollution/data/en
WHO. 2019. Traditional, complementary and integrative medicine: About us. In: World Health Organization [online]. Geneva, Switzerland. [Cited 5 January 2020]. www.who.int/traditional-complementary-integrative-medicine/about
WHO. 2020. Q&A on coronaviruses (COVID-19). In: World Health Organization [online]. Geneva, Switzerland. [Cited 1 April 2020]. www.who.int/news-room/q-a-detail/q-a-coronaviruses
WHO/UNICEF. 2000. Global water supply and sanitation assessment 2000 report. Geneva, Switzerland, WHO/UNICEF Joint Monitoring Programme for Water Supply and Sanitation.
Wilcox, B.A. & Ellis, B. 2006. Forests and emerging infectious diseases of humans. Unasylva, 224: 11–18.
Wilkie, D.S., Wieland, M., Boulet, H., Le Bel, S., van Vliet, N., Cornelis, D., BriacWarnon, V., Nasi, R. & Fa, J.E. 2016. Eating and conserving bushmeat in Africa. African Journal of Ecology, 54: 402–414.
Willett, W., Rockström, J., Loken, B., Springmann, M., Lang, T., Vermeulen, S., Garnett, T. et al. 2019. Food in the Anthropocene: the EAT–Lancet Commission on healthy diets from sustainable food systems. Lancet, 393(10170): 447–492.
Willis, K.J. ed. 2017. State of the World’s Plants 2017. Richmond, Surrey, Kew Publishing.
Willis, K.J. ed. 2018. State of the World’s Fungi 2018. Richmond, Surrey, Kew Publishing.
Winfree, R., Williams, N.M., Dushoff, J. & Kremen, C. 2007. Native bees provide insurance against ongoing honey bee losses. Ecology Letters, 10: 1105–1113.
Winfree, R., Aguilar, R., Vazquez, D.P., LeBuhn, G. & Aizen, M.A. 2009. A meta-analysis of bees’ responses to anthropogenic disturbance. Ecology, 90: 2068–2076.
Witt, K.A. 2013. The nutrient content of Moringa oleifera leaves. In: ECHO Community [online]. North Fort Myers, FL, USA. [Cited 5 January 2020]. https://www.echocommunity.org/resources/a7ee06e3-40f2-4ef0-859e-4e64b90a56c8
World Agroforestry. 2009. The Agroforestree Database. In: World Agroforestry [online]. Nairobi. [Cited 13 January 2020]. http://www.worldagroforestry.org/output/agroforestree-database
World Bank. 2002. A revised forest strategy for the World Bank Group. Washington, DC.
World Bank. 2017. Guidebook on Ecosystem Accounting. Washington, DC. [also available at https://elibrary.worldbank.org/doi/pdf/10.1596/29829].
World Bank. 2019. Global Wildlife Programme Phase 2: Summarized version of child projects [online]. [Cited 5 January 2020]. https://www.thegef.org/sites/default/files/webdocuments/10200_PFD_Wildlife_Annex_ChildProjects.pdf
World Cocoa Foundation. 2017. Cocoa & Forests Initiative: Statement of intent. In: World Cocoa Foundation [online]. Washington, DC. [Cited 5 January 2020]. www.worldcocoafoundation.org/cocoa-forests-initiative-statement-of-intent/
World Land Trust. n.d. Golden-headed lion tamarin. In: World Land Trust [online]. Halesworth, Suffolk, UK. [Cited 5 January 2020]. www.worldlandtrust.org/species/mammals/golden-headed-lion-tamarin
WWF. 2018. WWF Tanzania set to implement debt for nature swap programme. In: WWF [online]. [Cited 5 January 2020]. wwf.panda.org/?324230/WWF-Tanzania-Set-to-implement-Debt-for-Nature-Swap-Programme
WWF China. 2012. Standards for Giant Panda friendly products. Chengdu, China.
Yearsley. 2019. FairWild project in India is a win-win-win for Terminalia trees, people, and hornbills. HerbalEGram, 16(6) [online]. [Cited 5 January 2020]. http://cms.herbalgram.org/heg/volume16/06June/FairWildTerminalia.html
Zhang, D. & Pearse, P.H. 2011. Forest economics. Vancouver, UBC Press.
Zhu, H., Xu, Z.F., Wang, H. & Li, B.G. 2004. Tropical rain forest fragmentation and its ecological and species diversity changes in southern Yunnan. Biodiversity and Conservation, 13(7): 1355–1372.
Zomer, R.J., Trabucco, A., Coe, R. & Place, F. 2009. Trees on farm: analysis of global extent and geographical patterns of agroforestry. ICRAF Working Paper 89. Nairobi, Kenya, World Agroforestry Centre.
ZSL & WWF. 2014. Living Planet Index [online]. [Cited 26 December 2019]. http://www.livingplanetindex.org/home/index