

Building upon the analysis of farm and production distribution by scale (presented earlier in this chapter) and the examination of land degradation and its impact on yield loss relative to native conditions (detailed in Chapter 2), this section explores the key issue of how agricultural production scale relates to the incidence and implications of land degradation and yield gaps. Evidence presented so far suggests that regions dominated by large landholdings often exhibit smaller yield gaps, as these farms benefit from economies of scale, advanced technology and optimized resource use. However, these same regions also display the strongest causal relationship between land degradation and yield gaps: given that production systems in these areas are already highly optimized, any decline in land quality can have a disproportionately large impact on yields. Moreover, intensive production practices commonly used in large-scale farming can accelerate processes such as soil nutrient depletion, erosion and other forms of ecological stress.65 Conversely, smallholder-dominated regions with limited access to inputs, credit and infrastructure tend to experience wider yield gaps. Yet, in certain contexts, smallholders have managed to narrow these gaps through targeted increases in input use or improved agronomic practices.66, 67
Quantifying how land degradation varies by farm size globally is challenging due to data limitations: comparing quantitative data on long-term degradation and yield loss across specific farm sizes over time would require data on the historical evolution of farm scales, which is not documented spatially. This lack of historical information hinders the ability to link farm size to current degradation status, which reflects cumulative impacts of the specific and evolving scales of production that have shaped the land over time.
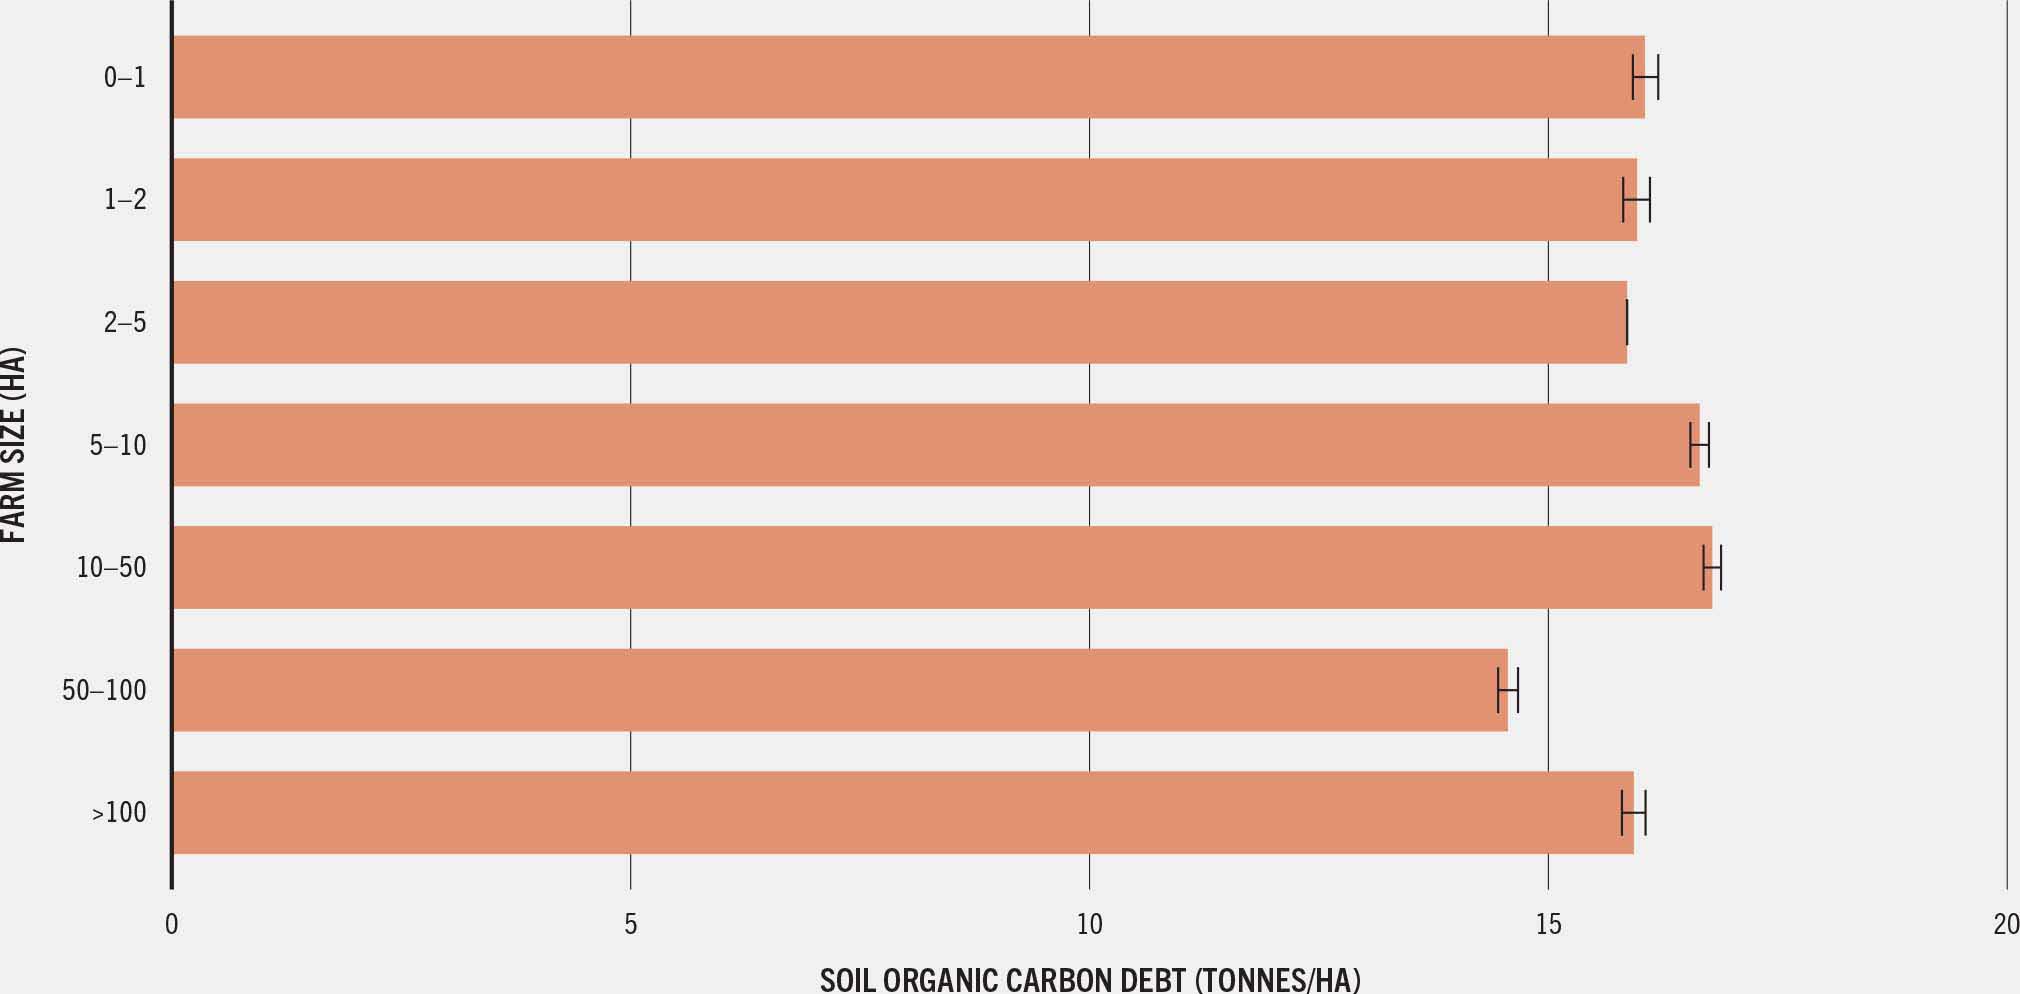
Nevertheless, combining a widely used map of global field sizes,68 calibrated with the data on current farm sizes from 131 countries presented above, with the current soil organic carbon debt used in Chapter 2, reveals interesting insights (Figure 22). Farms of all sizes have to deal with similar levels of SOC debt accumulated since the invention of agriculture. However, given uncertainties in the spatial mapping of all farm sizes, the figure conceals important heterogeneities that need to be assessed at high resolution to guide locally specific policies. In the rest of this section, broad inferences are drawn by comparing observed patterns of cropland degradation in regions presently characterized by different dominant production scales.
Figure 22 Average soil organic carbon debt by farm size
Exposure to land degradation and yield gap
At the global level, land degradation affects countries at all levels of economic and human development.69 The map presented in Figure 23 shows that some of the most degraded areas in the world – measured by SOC loss relative to the native conditions (see Chapter 2) – are located in high-income countries with large farm sizes. Other highly degraded areas are observed in regions where farm sizes are much smaller, including South-eastern and Southern Asia, as documented above. In these regions, the impacts of land degradation on human well-being are more pronounced due to overlaps with poverty, low institutional capacity and weak social safety nets.69, 70 To the extent that farm holding sizes are correlated with these socioeconomic indicators, understanding how exposure to cropland degradation and yield gaps varies by farming scale can contribute to developing policies to improve both land conditions and human well-being.
Figure 23 Soil organic carbon debt, percentage of native condition
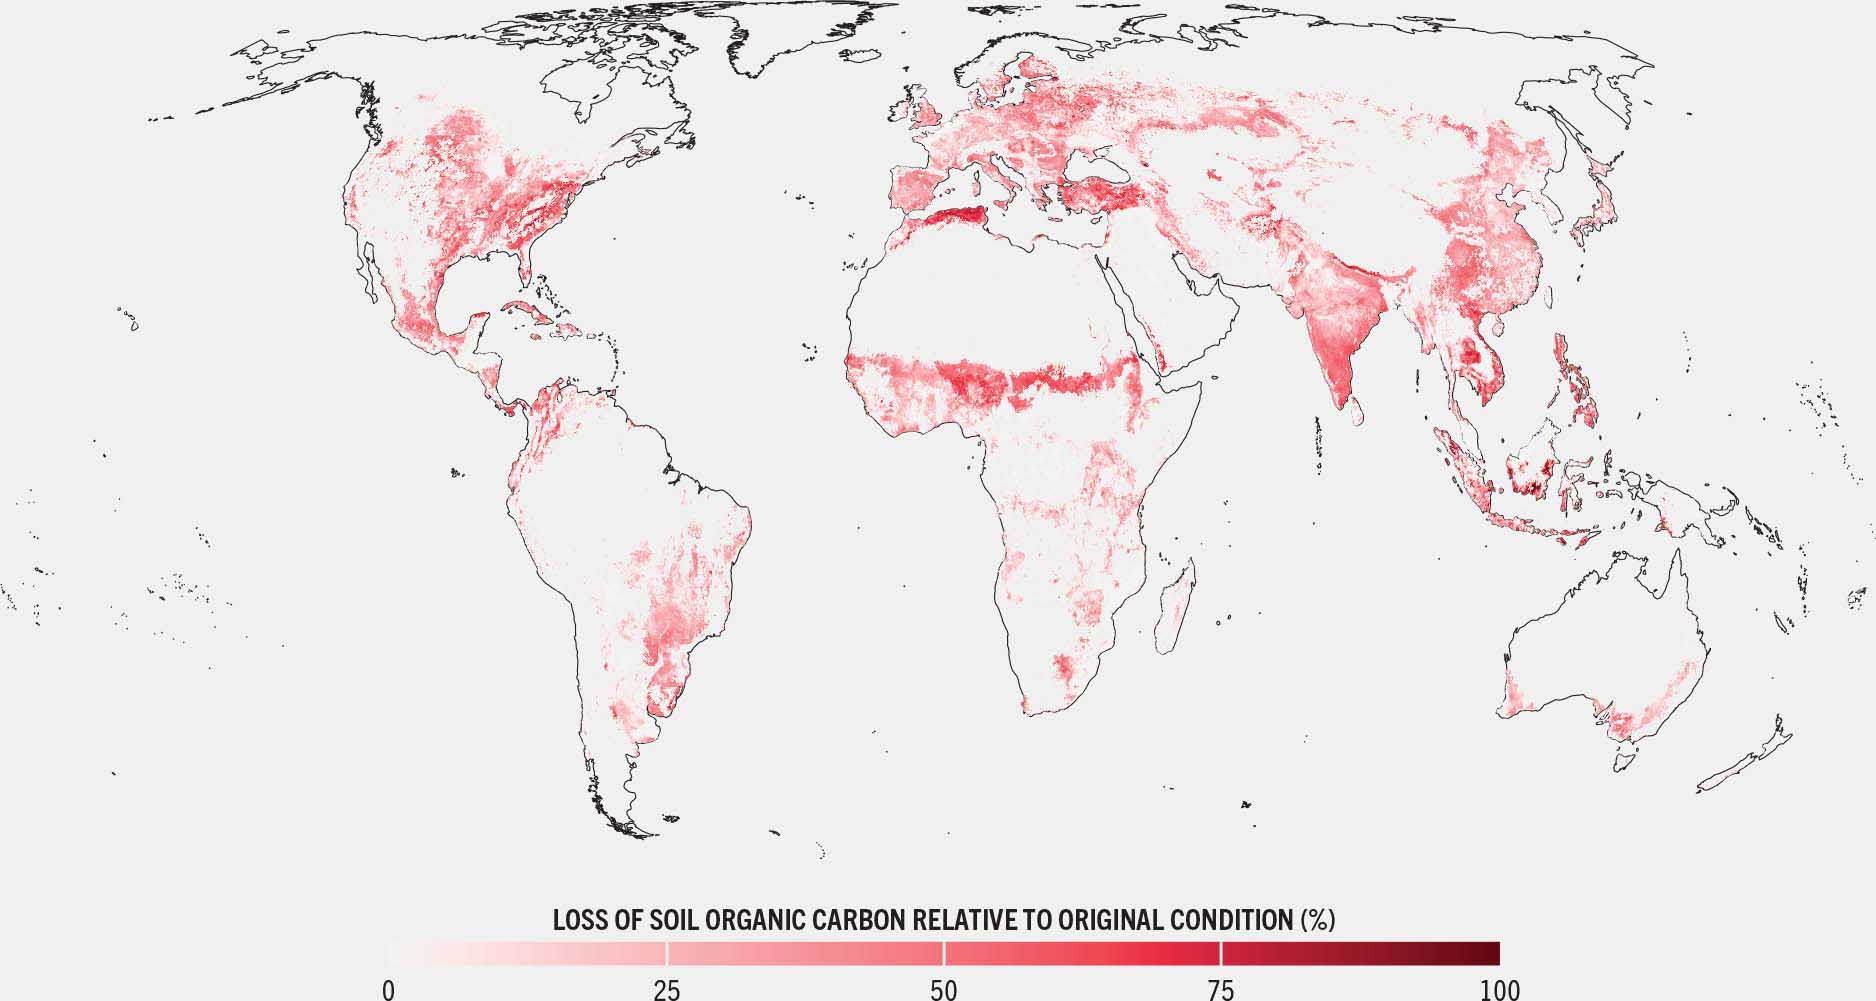
SOURCE: Hadi, H. & Wuepper, D. 2025. A global yield gap assessment to link land degradation to socioeconomic risks – Background paper for The State of Food and Agriculture 2025. FAO Agricultural Development Economics Working Paper 25-16. Rome, FAO.
Combining the understanding of farm size distribution across regions with the yield gap map in Chapter 2 (see Figure 8) provides insights into how farms of different sizes are likely to overlap with current yield gaps. Very low current yield gaps in regions with large farm sizes (Europe, United States of America and parts of Brazil) again point to the capacity of larger farms – especially in temperate or well-irrigated regions – to push yields closer to their agroecological ceilings, using inputs, machinery and modern management. Yet, because other yield determinants (e.g. water, nutrients, technology) are already close to optimal in these highly productive areas, land degradation has a disproportionately large impact on yields, amplifying its causal effect on yield gaps.
Sub-Saharan Africa presents the largest yield gaps and also has a high share of smallholders (75 percent); despite this, 75 percent of the land is managed by medium-sized farms (>2 ha). Conversely, Eastern, South-eastern and Southern Asia all have smaller yield gaps. In these regions too, the majority of the farms are smallholdings, with the difference that they also manage most of the agricultural land (>50 percent). Small-scale farms in Asia seem more able than African farms to compensate for the impacts of land degradation on current yields, largely through increased input use.71 At the same time, these regions also have the highest proportion of populations vulnerable to yield loss from long-term land degradation, underlining the importance of addressing accumulated land degradation for production. In contrast, small farms in Africa tend to have larger yield gaps that are more attributable to resource constraints, including low input use and mechanization rates, which need to be addressed to increase production sustainably.
In other words, regions with large farms, irrigation infrastructure and access to fertilizers tend to approach their yield ceilings, while smallholder systems in Africa, Asia and Latin America remain below potential. These global differences also reflect variations in water and nutrient access, market and infrastructure linkage, and farming practices.72 Box 14 highlights the important scale dependencies in terms of exposure to water stress that add to the difficulty in addressing yield gaps, especially in smallholder systems.
Box 14Scale dependencies in exposure to water stress and water consumption
Water is essential for agricultural production and comes in two forms: irrigated water from rivers, lakes, reservoirs and underground sources, otherwise known as blue water, and rainwater used directly by crops, referred to as green water. Agriculture is the largest consumer of both blue and green water globally.73 However, overuse of water resources has led to a worldwide water scarcity problem. Currently, more than 3 billion people live in water-constrained agricultural areas74 and 40 percent of global cropland is affected by reduced availability of water.75
Small-scale agriculture is more vulnerable to water scarcity than large-scale agriculture.34, 76, 77 A recent study covering 55 countries found that approximately 68 percent of harvested areas in small-scale agriculture are located in water-scarce regions, compared to 43 percent in large-scale agriculture.77 This higher exposure is due in part to the fact that small-scale agriculture is often situated in dry climate zones. However, even within the same climate zone, small-scale agriculture still faces greater water scarcity issues than large-scale agriculture.
Despite the higher exposure to water scarcity, small-scale agriculture uses much less blue water than large-scale agriculture.77 This is true in both water-abundant and water-scarce regions. Small-scale agriculture has less access to irrigation, which partly explains its lower blue water consumption. Additionally, small-scale agriculture tends to focus on food crops, which generally require less water than non-food crops.9, 33, 77 Beyond differences in types of crop and irrigation access and use, the fact that the majority of small-scale agriculture is located in dry climate zones, while more large-scale agriculture is located in fully humid regions, can further explain smallholders’ limited access to irrigation.77
Moreover, insecure land tenure can discourage smallholders from investing in irrigation systems,78 while limited extension services and technical support further hinder smallholder adoption, reinforcing their reliance on rainfed agriculture.78, 79 However, green water productivity on small farms is often low. More productive utilization of green water, by alleviating soil fertility stress, would enable small-scale agriculture to increase its nutrient production by more than 70 percent, even in water-scarce regions.77
In fact, small farm size combined with poor soil fertility among the poorest households represents a double poverty trap in Africa: they can neither produce enough for household needs nor restore the productive capacity of the soil.15 At the national level, such small farm sizes present a barrier to achieving greater food self-sufficiency as households have few incentives to invest in agriculture, leading to stagnation in agricultural productivity (referred to as the African Food Security Conundrum). This pattern also has implications for land degradation on both cropland and other types of land cover through land abandonment and extensification, creating a vicious cycle.
Exposure of cropland to climate change
Climate change – the quintessential threat multiplier – is expected to severely impact food security through its complex interactions with land degradation, water stress and productivity, exacerbating livelihood vulnerabilities, particularly for small-scale producers and rural communities. Rising temperatures, altered precipitation patterns and extreme weather events endanger ecosystem stability and reduce agricultural resilience.80 This is particularly the case in low-latitude regions (including sub-Saharan Africa and Southern Asia), where climate change is expected to negatively impact crop production and significantly reduce the variety of crop types that can feasibly be cultivated on existing cropland.81 These regions are heavily reliant on smallholder farming, making them particularly vulnerable to climatic disruption. With 3 °C of warming above pre-industrial levels, farms of all sizes in these areas will face heightened exposure to heat stress, dry spells and heavy downpours (Box 15).82 Furthermore, the decline in crop diversity is especially concerning for smallholders, who depend on diverse cultivation for resilience as well as nutrition.9, 81, 83 At the same time, climate change threatens the availability of livestock production by reducing feed productivity and quality, compromising animal health and increasing mortality from extreme weather events.84–87
Box 15Exposure of global agricultural land to future extreme weather
Increasing weather extremes are wreaking havoc on livelihoods, food security and nutrition, not only in farming communities but also across the world. The ramifications of weather extremes are profound, significantly diminishing global agricultural output93 and undermining the stability of global agrifood systems.94
In a 3 °C warmer world (from pre-industrial levels), 25 percent of agricultural land will face over two months of extreme heat, up from 16 percent (in a 1 °C warmer world), but frost exposure will decline from 7 percent to 5 percent of global agricultural land. Exposure to prolonged dryness and extreme precipitation will likely remain unchanged.
Shared Socioeconomic Pathways (SSPs) are scenarios that explore how global society, demographics and economics might evolve over the twenty-first century, influencing greenhouse gas emissions and climate change. Under the “middle of the road” pathway (SSP2-4.5), crop- and pasturelands will experience different weather shocks of varying magnitude and extent. Pasturelands will undergo more heat stress and prolonged dryness, while current croplands will face more combined heat and precipitation extremes.
Given the current geographic distribution of farms around the world, with smaller farms located predominantly in the tropics, small, medium and large farms will face different levels of exposure to weather shocks under a 3 °C global mean temperature (GMT) scenario, compared to 1 °C GMT (see figure). Panel A shows exposure to conditions that are too hot and too dry (measured by days above 35 °C and the longest dry spell), while Panel B shows exposure to conditions that are too cold and too wet (measured by days below 0 °C and maximum five-day rainfall).
Notwithstanding the potential evolution of underlying farm size distribution over the coming decades, this analysis shows that farms below 2 ha and those between 2 ha and 5 ha, in both cropping and pasture systems, will face more intense downpours compared to their counterparts. Cropland and pastureland exposure to prolonged heat stress and severe downpours is hump-shaped: medium-sized farms experience the highest exposure to heat stress and dry spells, while smallholders experience the greatest exposure to severe downpours. Additionally, on average, medium-sized pasture farms experience nearly double the increase in exposure (over eight additional days) to heat stress compared to small farms. Large farms (>50 ha), which predominate in the extratropics, will benefit most from a reduction in frost days, predicted to decrease from an average of seven to eight days to just four days during the growing season.
The diversity of farming systems documented here have varying sensitivities and capacities to adapt to weather extremes. As climate change progresses, these systems will face different combinations of weather-related challenges, requiring targeted and context-specific adaptation strategies. The projected rise in agricultural areas exposed to multiple, overlapping weather extremes underscores the urgent need for more holistic and integrated approaches to adaptation. Without such measures, the impact on land productivity, food security and livelihoods could be severe.
FIGURE CHANGE IN FUTURE EXPOSURE TO EXTREME WEATHER DURING THE GROWING SEASON BY FARM SIZE
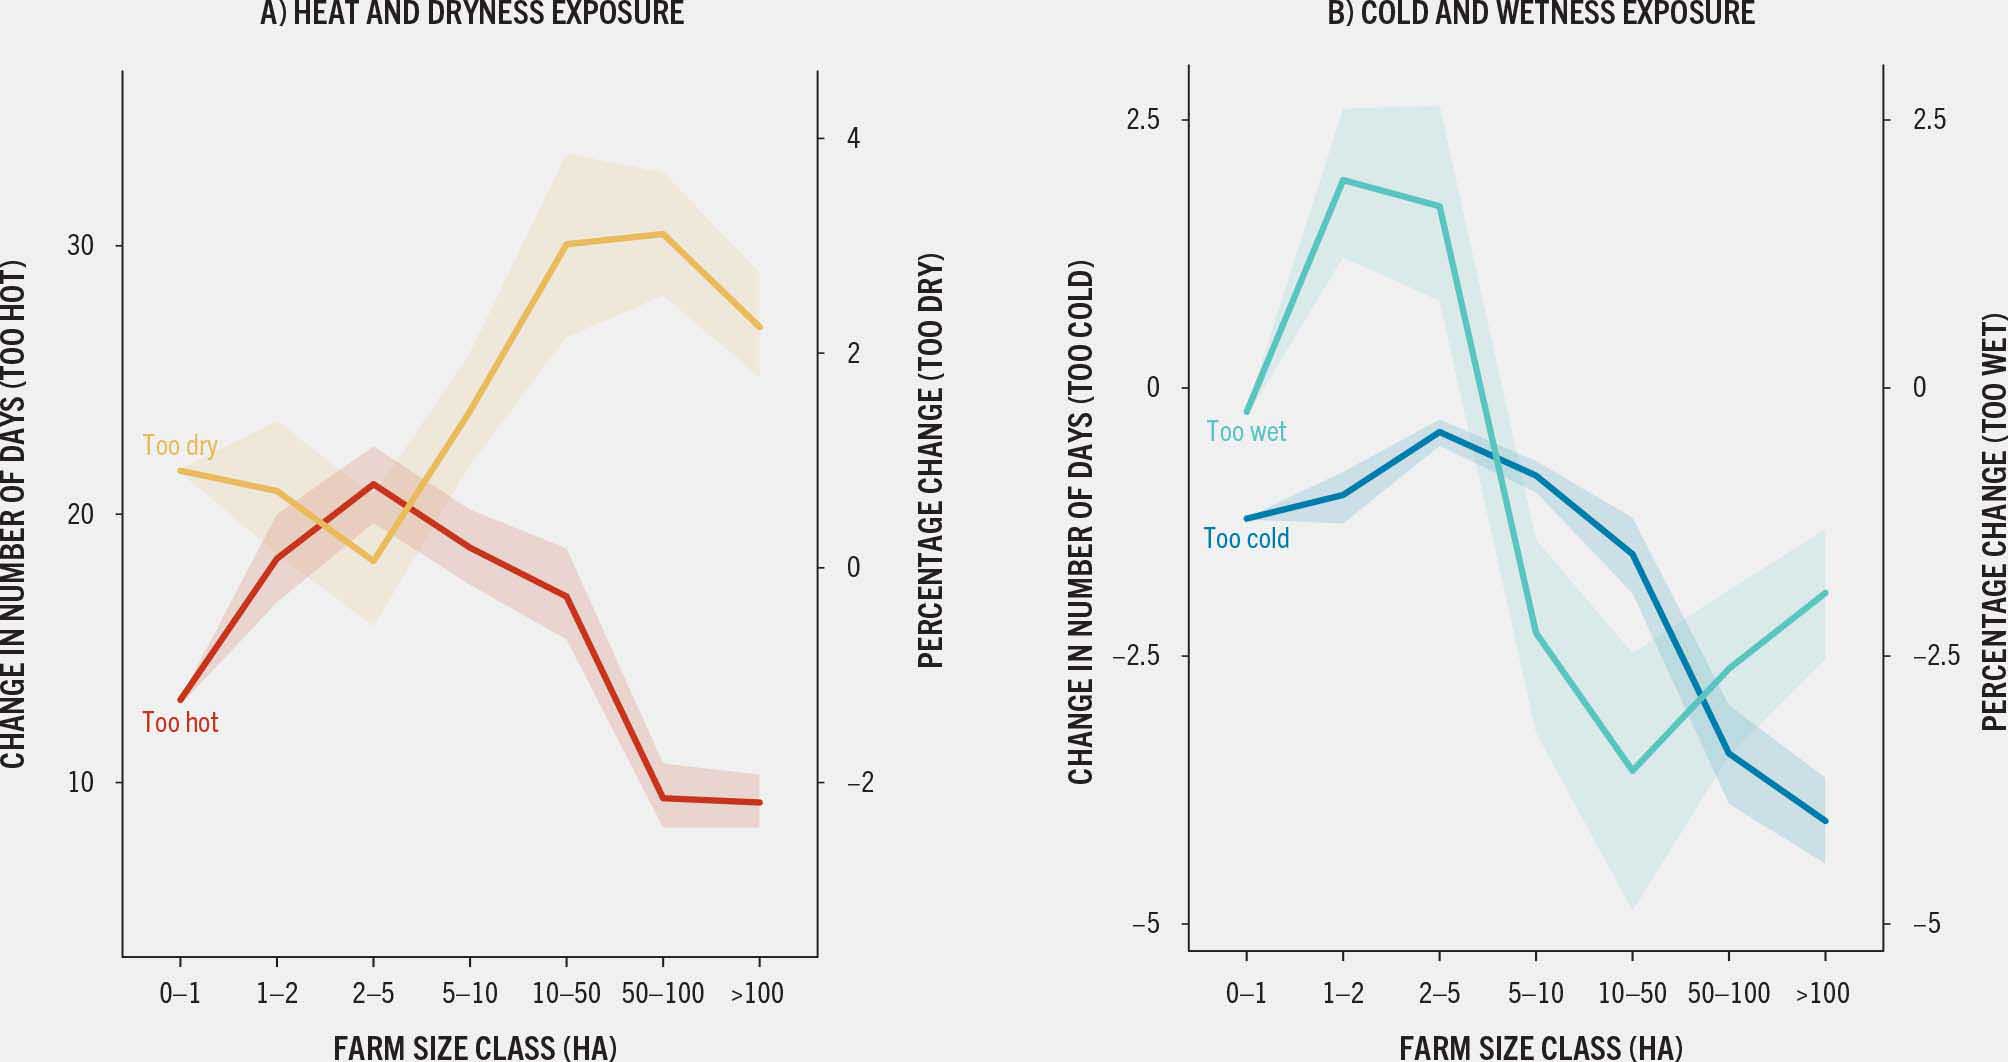
SOURCE: Bajaj, K., Mehrabi, Z. & Ramankutty, N. 2025. Exposure of global agricultural lands to extreme weather using CMIP6 projections of future climate. Unpublished.
Beyond extreme events, climate variability and uncertainty are also emerging as drivers of land degradation. Unpredictable rainfall and temperature patterns and shifting growing seasons may prompt farmers to adapt agricultural practices, including in ways that may unintentionally degrade land. For example, shortened fallow periods, deforestation, and heavy fertilizer and chemical use to secure yields can undermine long-term adaptation.88–90 Similarly, subsistence smallholders may respond to extreme heat by extensification,91 potentially contributing to land degradation due to land cover change. Furthermore, the link is bidirectional: degraded land is more vulnerable to climate variability92 and less responsive to inputs,1 creating a vicious cycle of risk to soil health and livelihoods.
The differences in exposure levels documented in Box 15 can function as both the cause and the effect in different production systems that lead to scale-dependent degradation pathways. Closing the yield gaps in many smallholder-dominated regions may present significant opportunities for improving productivity through intensification; however, such efforts must strike a balance between boosting short-term production and achieving long-term soil health as well as land degradation neutrality goals. Strengthening farmers’ knowledge, particularly on sustainable land and risk management practices, and addressing enduring constraints to adoption and tenure security are therefore essential to support adaptive responses that safeguard rather than compromise land quality.


