The transport topical section of the inventory contains a review of available road, railway, airport, harbours, and related library or gazetteer data layers. Dominant amongst the sources of data reviewed are the roads and railway station layers contained in ADC's WorldMap data library. ALLM provides the source and maintenance for the point railway station, harbour, and airports data layers of ADC's library. In comparison, EuropaTech's Global Insight Plus product provides the best source of harbour/port data based on both the number of features and then those containing valid UN-LOC codes. EuropaTech's airport data layer is also slightly more robust based on the inclusion of both ICAO and IATA encoding attribute fields. No value-added railway line data which were not based directly on NGA's VMap0 source layer were identified. The use of any of the data reviewed for the purposes of routing/network analysis was not tested. The availability of data covering bus stations was not evaluated for the inventory.
The RWDBII-Sv1.1 data library was not available in mid-2004 for direct comparison with the other data sources identified for the inventory. A subsequent cursory review of this library indicated that it could represent a fine medium scale source of seamless linear and then point transport data layers. These layers could be derived from the RWDBII-Sv1.1 at an estimated LOE of three days.
Five potential sources of linear roads data were identified for the inventory. Three of these sources are public domain and two are commercial products. In addition to these data, two public domain sources of related structural transport features such as bridges, tunnels, fords, and ferries were also identified. These findings are summarized in Table 7.1 below.
Table 7.1
Transportation infrastructure: roads and
related structural features
|
Data Type/Source |
URL |
Extent |
Scale |
Availability1 |
Notes |
|
LINEAR TRANSPORT FEATURES AND NETWORKS: ROADS |
|||||
|
NGA-VMap0 Ed.5 Road and trail linear data layers |
http://geoengine.nima.mil or set of four CDs via USGS Store |
Global |
1:1 M |
PD |
Ed.5 purportedly addresses connectivity supporting network routing analysis |
|
RWDBII-Sv1.1 Major, minor, and other roads data layers |
CD available from FAO or WHO |
Global |
1:3 M |
PD |
Features based on circa 1990s sources or original WDBII |
|
UNCS 1:5 million Roads data layer based on circa 1990 source maps |
UNCS data portal not currently available |
Global |
1:5 M |
CR, FQ |
Up to four classifications of roads based on Russian military maps |
|
Europa Technologies Roads data layer from Global Discovery product library |
Global |
1:1 M |
C, CR, LF, RD and FQ on maps for internal use |
Some localized updates, but generally straight translation of VMap0 roads and trails |
|
|
ADC WorldMap Roads data layer |
Global |
1:1 M |
C, CR, LF, RD and FQ |
The most up-to-date roads data layer reviewed for the inventory on maps for internal use |
|
|
TRANSPORT STRUCTURES: TUNNELS, BRIDGES, AND FERRIES {BOTH ROAD AND RAILW AY FEATURES ARE COVERED} |
|||||
|
NGA-VMap0 Road and railway transport structure line, point and miscellaneous line data layers. |
http://geoengine.nima.mil or set of four CDs via USGS Store |
Global |
1:1 M |
PD |
Features may be required to maintain network integrity of roads and rail layers |
|
NGA-GNS Gazetteer, feature class including: highways, roads, and railroad named locations |
Global |
variable |
Public Domain |
Some 5 700 hundred bridge, tunnel, or ferries outside of the continental US |
|
1 C=Commercial CR=Copyright; LF=License/Fee, PD=Public Domain; NC=Non-Commercial; FQ=Fair Quotation; RA=Restricted Access; RD=Registered Distribution
Based on ADC's sample data for the Namibian AOI, the company's WorldMap product appears to offer the most up-to-date and robust road and related vehicular infrastructure data layers evaluated. This data layer has purported routable extensions. In comparison, EuropaTech defines its roads product as only "representative". This definition was borne out by a preliminary evaluation of this product with the roads data layer of the VMap0.Ed5 derived for Africa. This evaluation showed that although EuropaTech's roads layer contained some highly localized value-added editions and then feature encoding, the vast majority of the features were directly derived from the VMap0 baseline.
A further comparison of the VMap0 Ed.5 roads layer with the road features in the VMap0 Ed.4/5 covering Africa, indicated that between the two editions only very localised additions had been made. This may provide some additional indication that ADC's offering would likely provide the most up-to-date roads layer. For example, in this latter comparison, while some roads were added to the VMap0 Ed.5 covering Somalia, no substantive changes were made overall for Africa and none within the Namibian AOI. The encoding attribution between the two VMap0 editions was not, however, compared. Further, it should again be noted that the metadata accompanying the VMap0 Ed.5 states that, "For Edition 5, verification procedures were performed to ensure that the ends of roads and railroad segments that were in close proximity to one another were connected together, so as to enhance the user's ability to perform network operations", (NGA-VMap0 2000). This facility or improvement was not, however, evaluated. A comparison of road data listed in Table 7.1 with the VMap1 1:250 000 data covering the Namibian AOI is presented in Figure 7.1 below.
Figure 7.1
Comparison of VMap0, VMap1 and commercial
roads data layers
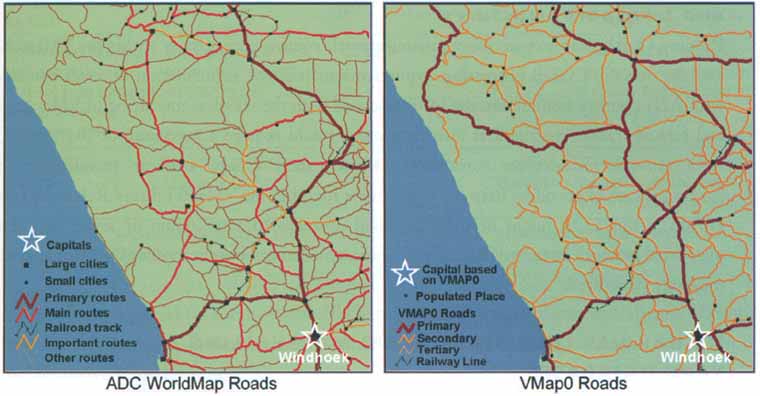
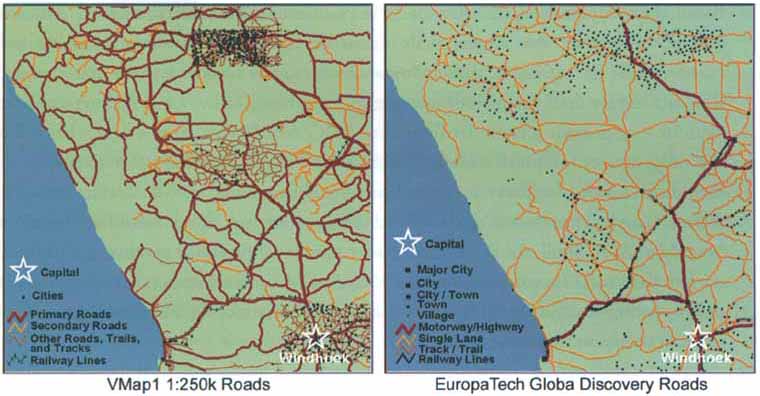
Although the VMap1 reference graphic in Figure 7.1 contains the greatest number of road features within the Namibian AOI, due to the incomplete global coverage provided by these data, this library was not included in Table 7.1 of the inventory. Again, as the ADC product purportedly contains a routable edition, (EuropaTech, 2003), and given the greater distribution of roads and their encoding depicted in the above figure, this product is likely the most robust data layer of roads available globally.
ADC's roads data layer is sourced and maintained by a company named Where-On-Earth, www.whereonearth.com. This company provides what it calls, the most intelligent map in the world. However, Where-On-Earth did not respond to an e-mail query concerning the direct availability of these data in conjunction with the inventory data review. With regard to public domain sources of roads data, the VMap0 provides the highest resolution globally consistent source of roads and related transport feature layers currently available.
Pending a further evaluation of any existing network/routing connectivity within the VMap0.Ed5, and any specific CGDB processing requirements such as the segmentation of roads coincident with AD1 country boundaries, the LOE associated with the seamless mosaicing of VMap0 roads and related transport structural features globally would require a maximum of five days. This LOE estimate includes the consolidation of the extant VMap0 attribute encoding and the harmonization of encoding between road features found in the VMap0 Library Reference layers. However, this LOE might need to be revised upwards to a minimum of seven days if the purported network connectivity needs to be maintained, cross-border topology created, and node topology structured.
Based on a comparison covering both the Namibian AOI and continental Africa, the VMap0 represents the largest scale source of linear railway lines available either commercially or within the public domain. However, as regards railway station data, as this data library does not include encoding differentiating railway marshalling yards from stations - or provide a name attribute - the ADC/ALLM data layer offers what is likely the only option for point railway stations. The NGA-GNS Gazetteer data base does include locations of railway yards and junctions, but railway stations features cannot be differentiated. There were no GNS rail features of any kind identified within the Namibian AOI. Similarly, the VMap0 railway yard layer provided no coverage of features within the AOI. In comparison, the ADC/ALLM railway station layer included ten unique listings within the AOI. Table 7.2 below, summarizes the finding of the inventory for Rail transport infrastructure.
Table 7.2
Transport infrastructure:
railways
|
Data Type/Source |
URL |
Extent |
Scale |
Availability1 |
Notes |
|
LINEAR TRANSPORT FEATURES AND NETWORKS: RAILW AY LINES |
|||||
|
NGA-VMap0 Ed.5 Railway linear data layer |
http://geoengine.nima.mil or set of four CDs via USGS Store |
Global |
1:1 M |
PD |
VMap0 Ed.5 purportedly contains co-connected road and rail linear data layers |
|
RWDBII-Sv1.1 Major, minor, and other Railroad data layers |
CD available from FAO or WHO |
Global |
1:3 M |
PD |
Features based on circa 1990s sources or original WDBII |
|
UNCS 1:5 M Railways data layer based on source maps, circa 1990 |
UNCS data portal not currently available |
Global |
1:5 M |
CR, FQ |
Up to four classifications of rail lines based on Russian military maps |
|
RAILW AY STATIONS AND MARSHALLING YARDS |
|||||
|
ADC WorldMap railroad station layer. This layer is maintained and provided to ADC by ALLM |
Global |
1:1 M |
C, CR, LF, RD and FQ on maps for internal use |
~54 000 stations globally, this was the only station data layer inventoried |
|
|
NGA-VMap0 Railroad yard and related features from transport structure line and point data layers |
http://geoengine.nima.mil or set of four CDs via USGS Store |
Global |
1:1 M |
PD |
Linear features required to maintain network integrity of railway line data layer |
|
NGA-GNS/GEOnet Gazetteer |
Global |
variable |
Public Domain |
~36 000 features globally, however, none represented within the Namibian-AOI |
|
1 C=Commercial CR=Copyright; LF=License/Fee, PD=Public Domain; NC=Non-Commercial; FQ=Fair Quotation; RA=Restricted Access; RD=Registered Distribution
Because, both ADC's and EuropaTech's product offerings match exactly the VMap0 railway line features, these commercial products were deleted from the linear data section of the above table.
The LOE associated with processing railway specific data from the VMap0 globally is estimated at two days. Processing related to the maintenance of any network topology in conjunction with these data was discussed under the LOE estimates for Roads in Section 7.1.2 above.
Five unique data layers containing Airport information were identified for the inventory of airports, airfields, and heliports. A summary of these five data layers is provided in Table 7.3 below.
The airport layer from the UNCS QID 1:5 million data library is not included due to the unavailability of these data for review and the fairly small scale of the library. Similarly, ADC's product offering was excluded due to the general lack of uniquely representative features which were not already covered by data layers from other sources, in particular the ALLM Gazetteer database.
Table 7.3
Transportation infrastructure: airports,
fields and heliports
|
Data Type/Source |
URL |
Extent |
Scale |
Availability1 |
Notes |
|
NGA-VMap0 Ed.5, DAFIF year 2000 based data layer |
http://geoengine.nima.mil or set of four CDs via USGS Store |
Global |
1:1 M |
PD |
DCW baseline 12 305 features, VMap0 Ed.5 has 9 809 features globally in four airfield classes |
|
NGA-GNS/GEOnet Gazetteer: Airport, Airfield, Heliport, Seaplane, and potentially Military Base designations |
Global |
variable |
PD |
~25 000 airports and 5 000 heliports, not including general military bases |
|
|
RWDBII-Sv1.1 Airport data layer |
CD available from FA O or WHO |
Global |
1:3 M |
PD |
~15 000 features circa 1990s, areas not represented equally |
|
Europa Technologies Airport data layer from Global Insight Plus and Discovery product libraries |
Global |
1:1 M |
C, CR, LF, RD and FQ on maps for internal use |
7 Classes of airfields (32 288) globally with ICAO, IATA, and elevation value encoding |
|
|
ALLM GeoData’s Global Gazetteer Airport data listing |
www.allm-geodata.com/ field_stats.htm |
Global |
Variable |
C, CR, LF |
37 869 Airfields globally with ICAO, IATA, with spot and computed elevation encoding |
1 C=Commercial CR=Copyright; LF=License/Fee, PD=Public Domain; NC=Non-Commercial; FQ=Fair Quotation; RA=Restricted Access; RD=Registered Distribution
Of the data layers presented in Table 7.3 it is difficult to determine which might present the most viable baseline resource. On the commercial front, EuropaTech's product offers the greatest number of geocoded features, while the ALLM Gazetteer offers the widest distribution/coverage based on the Namibian AOI. As each of these products contain both International Civil Organization (ICAO) and the IATA commercial codes for airports, as well as elevation information, the relative geographical area of interest would likely determine which product is more suitable. On the other hand, the VMap0 Ed.5 airport data layer was updated based on the January 2000 version of the U.S. Department of Defence Digital Aeronautical Flight Information File (DAFIF) and despite a lesser number of features, clearly lies within the public domain. In addition to DAFIF and elevation value encoding, like the DCW before it, this data layer contains a categorisation of each airport into one of four classes and basic ICAO encoding attribution.
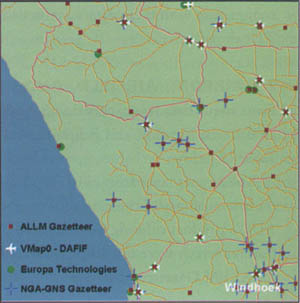
With the exception of the RWDBII-Sv1.1 data layer, a comparative overview of the remaining four data layers in Table 7.3 is depicted in the inset graphic at the right. Based on this graphic, it can be seen that a fairly robust airport dataset could be derived for a limited cost from public domain sources. This dataset could contain upwards of 35 000 airport features globally based on an LOE detailed as follows: VMap0 Ed.5 processing and harmonization with DCW data, 0.5 days; harmonization with NGA-GNS gazetteer of named airports and RWDBII-Sv1.1, 2.5 days (assuming GNS database has already been processed globally); and final dataset source and quality attribution, one day.
The products from EuropaTech and ALLM of course supply an immediate geosolution providing extensive access to airport data containing both ICAO and IATA encoding. However, despite the greater relative number of features in the EuropaTech product, if it can be verified that ALLM's copyright for the purposes of update extends to derivative public domain data, then this product used in conjunction with the public domain LOE process above may offer the best solution. The price indicated by ALLM for Airport features is US$2 500 dollars (ALLM, 2004a).
Five data layers providing highly variable coverage of harbours were itemized for the inventory. These five data layers are listed in Table 7.4 below.
Table 7.4
Transportation infrastructure:
harbours
|
Data Type/Source |
URL |
Extent |
Scale |
Availability1 |
Notes |
|
NGA-GNS/GEOnet Gazetteer: Harbours |
Global |
variable |
PD |
5 323 Named harbour locations globally |
|
|
RWDBII-Sv1.1 Harbours data layer |
CD available from FAO or WHO |
Global |
1:3 M |
PD |
~4 800 port features globally |
|
ADC WorldMap Harbour data layer |
Global |
1:1 M |
C, CR, LF, RD and FQ on maps for internal use |
5 358 Harbours globally, possibly maintained by ALLM |
|
|
Europa Technologies Harbour data layer from Global Insight Plus and Discovery product libraries |
Global |
1:1 M |
C, CR, LF, RD and FQ on maps for internal use |
4 842 Harbours globally, contains five letter UN-LOCODE |
|
|
ALLM GeoData’s Global Gazetteer, ports data listing |
Global |
Variable |
C, CR, LF |
5 476 Harbours globally data sample/encoding not provided |
1 C=Commercial CR=Copyright; LF=License/Fee, PD=Public Domain; NC=Non-Commercial; FQ=Fair Quotation; RA=Restricted Access; RD=Registered Distribution
Surprisingly, although both the ADC harbour data layer - which may be maintained by ALLM - and then ALLM's port locations data separately, each contain 500-600 more harbour features globally than EuropaTech product, at least for the Namibian AOI, EuropaTech's data layer provides better coverage. This latter dataset was also the only data layer reviewed which contained UN-LOCODE attribute encoding.
Although the RWDBII-Sv1.1 Port data layer contains some interesting attribute fields, including: a rank, vessel size capacity, world port index number, and whether oil can be handled; only the port of Walvis Bay was covered within the Namibian AOI. It was anticipated that the NGA-GNS data layer may provide at least some further public domain coverage of harbours, however, a comparison of these data with the ADC/ALLM and EuropaTech commercial products proved to be disappointing. This comparison is presented graphically in the inset graphic at the right. As can be seen, although the AOI was expanded slightly, still no NGA-GNS harbour data could be located in the AOI.

NGA's Harbour, Approach and Coastal (HAC) database may provide an extensive alternative to EuropaTech's commercial product. Unfortunately, successful access to these data on-line and a determination of the potential availability of the entire database to the UN could not be established.
No sources of digital aeronautical navigation routes could be identified during the timeframe of the inventory. Similarly, only one source of general digital maritime navigation routes could be established. This was NGA's Digital Nautical Charts (DNC), http://164.214.2.53/dncpublic. It is likely that other similar sources based on IHO, UK Admiralty, GEBCO or other charts may also be available. This could not however, be confirmed within the timeframe of the inventory. Lastly, similar to the NGA HAC-Harbour database presented above, direct on-line access to the NGA DNC chart database could not be accomplished despite repeated sessions.
The combined bathymetry (seafloor-elevation) and terrestrial elevation section of the inventory contains a review of globally consistent vector and raster databases which can be used to support base mapping and analysis. Although there is some potential overlap between the source databases, in order to better focus the discussion, this section has been divided into ocean Bathymetric and Terrestrial specific data subsections. These subsections have been further divided based on whether the source data are vector or raster. No globally consistent commercial sources were identified for this section of the inventory.
Four primary vector data sources were identified for inclusion in the inventory under this topical subheading. These sources are summarized in Table 8.1 below and represent, relatively, the greatest estimated LOE to process for Section 8 as a whole. The bathymetric contours and miscellaneous point ocean features of the RWDBII-Sv1.1 are not included in this table as they were briefly summarized in Section 4.1.4.
Table 8.1
Vector Based Bathymetric and Oceanic Data
Layers
|
Data Type/Source |
URL |
Extent |
Scale |
Availability |
Notes |
|
VECTOR BATHYMETRIC CONTOURS AND UNDERSEA FEATURES |
|||||
|
NGA-WVS+, Bathymetry layers starting at 1:3 million |
Global |
1:3 M |
Public Domain |
Data based on DBDB5 five-minute grid with an equivalent resolution of 1:4 000 000 scale |
|
|
NGA-VMap0 linear depth data layer |
http://geoengine.nima.mil or set of four CDs via USGS Store |
Global |
1:1 M |
Public Domain |
Smoothed contours based on earlier version of DBDB5/WVS data. |
|
NGA-GNS/GEOnet Gazetteer: Ocean and/or Undersea features |
Global non-USA |
Variable |
Public Domain |
~50 000 named Bays, Oceans, Seas, Reefs, Seamounts, Canyons and related underwater locations |
|
|
NGA-VMap0 polygonal Ocean-Seas data layer |
http://geoengine.nima.mil or set of four CDs via USGS Store |
Global |
1:1 M |
Public Domain |
Ocean & Seas delimited based on IHO 4th edition 1986 standard |
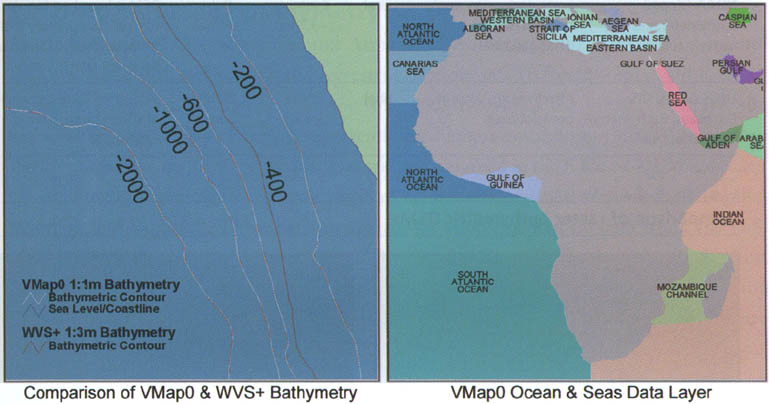
The library comprising the WVS+ includes both polygonal and linear vector data layers of bathymetry at the scales of 1:3, 1:12 and 1:40 million. According to the WVS+ meta documentation, the original source of these data is the NGA's Digital Bathymetric Database (DBDB5). Given the 1:3 million base scale for these data, the WVS+ vectors are more generalized than the similar layer available from the NGA's VMap0 data library. The 1:3 million WVS+ bathymetric contour layer however, contains a -400 metre contour which is not included in the VMap0 layer, where the values jump from -200 metres to -600 metres. It is suggested that the -400 meter bathymetric contour be added and harmonized with the less generalized 1:1 million scale VMap0 layer.
Given the availability of both smoothed and unsmoothed raster bathymetric databases which can be used as image backgrounds, the WVS+ polygonal bathymetric range data are likely redundant but could be integrated with the terrestrial elevation range data layer of the DCW presented in Section 8.3.1.
The bathymetric contour data layer of the VMap0 is again derived from the DBDB5. As discussed above, this data layer is less generalized than the 1:3 million WVS+ data. For this reason, the VMap0 data layer would be the recommended baseline for bathymetric contours. With the exception of the -400 metre contour, the contour interval for the VMap0 and the WVS+ are exactly the same with contour steps at: -200, -400, -600, -1 000, -2 000, -4 000, -6 000, and -8 000 metres. The RWDBII-Sv1.1 linear bathymetric data also contain: -3000; -5000; -7000; and -9000 metre bathymetric contours, but were not available for direct comparison to the VMap0 and WVS+ sources at the time this section was originally prepared in mid-2004.
The LOE associated with the processing of the VMap0 data, and its harmonization with the -400 m contour from the WVS+ would be one day; please see Figure 8.1 below for a graphical comparison of the VMap0 and WVS+ bathymetric contours. It would however, be suggested that these data are further harmonized with the coastline and terrestrial contour data to represent a single consolidated contours dataset. Such a dataset should include encoding as to the source for each vector in order to allow for the rapid creation of bathymetric, coastline, and terrestrial subsets as may be required by users. The LOE associated with the creation of such a consolidated dataset is discussed under the vector terrestrial elevation data subsection of the inventory.
The NGA's GNS Gazetteer contains some 50000 named bays, oceans, seas, reefs, seamounts, canyons and other underwater marine locations. The processing and attribution of these data should be considered as part of the seven day LOE associated with any processing of the GNS Gazetteer database globally.
Please see, section 4.1.2 Polygonal Oceanic Water Bodies for a summary of these data. Again, given the many slivers or null data areas found on this data layer for Africa, the LOE associated with processing this data layer globally is estimated at two days including the addition of missing IHO attribute encoding. A graphical representation of these data can be seen in Figure 8.1 below.
Figure 8.1
Vector bathymetric and ocean-seas data
layers
In addition to the RWDBII-Sv1.1 Laws of the Sea data layer discussed under Section 4.1.4 Linear Oceanic Features, a number of other vector data layers for oceanic features were identified during the inventory. These data are from sources such as: the 2003 General Bathymetric Chart of the Oceans (GEBCO) Millennium Edition[20], the ongoing Global International Water Assessment (GIWA), and again the NGA-WVS+ 2004 3rd Edition. GEBCO provides a number of gazetteer, chart reference, shoreline, and other vector data layers which could not be evaluated as to their uniqueness or coverage during the course of the inventory. GIWA provides what is effectively a global small-scale river basin dataset that extends from the continental landmasses (see also Section 10.3) to include large marine ecosystems. While the WVS+ data library includes polygonal data layers at various scales, that represent the USG's interpretation of territorial waters based primarily on buffering the 1:250 000 coastal/national boundaries.
Only two digital elevation model (DEM) sources of raster bathymetric data were identified as suitable for the inventory. Both of these global DEM databases are in the public domain. These DEMS are summarized in Table 8.2 and discussed below.
Table 8.2
Combined raster bathymetric and terrestrial
DEM databases
|
Data Type/Source |
URL |
Extent |
Scale |
Availability |
Notes |
|
NOAA-ETopo2 Bathymetry and terrestrial DEM |
Global |
2 minute |
Public Domain |
DEM is based on five data sources. The primary source for bathymetry is Smith and Sandwell (1997) |
|
|
USGS Global GIS Database, Bathymetry/ Terrestrial DEM |
Global |
30as |
Public Domain |
Smoothed 1 km derivative of ETopo2 bathymetry, w/GTopo30 |
Figure 8.2a
Comparison of raster bathymetric
DEMs
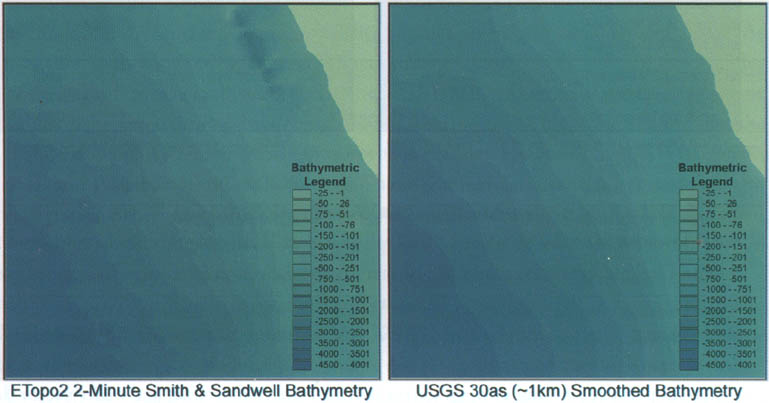
Similar to the vector data contained in the GEBCO Millennium Edition data library, the raster bathymetric and related oceanic data layers could not be accessed for review within the timeframe of the inventory and are therefore not included in Table 8.2. However, based on the 1-minute pixel size of its raster bathymetric layers, the GEBCO data library likely represent the highest resolution interpretation of publicly available global seafloor bathymetry. The latest revision of the GEBCO library is the 3rd or Centenary Edition published in 2003. In regards to updated bathymetry, the latest edition of the GEBCO library includes updates for areas of the Weddell Sea, the North Atlantic and the seafloor surrounding New Zealand. The GEBCO data library is available for purchase on CD-ROM for £99 non-commercial or £230 for commercial use, via the British Oceanographic Data Centre website, www.bodc.ac.uk/bodc_products_intro.html. Alternatively areas of up to 20°x20° can be downloaded via this URL. The GEBCO data are subject to copyright under a liberal fair-quotation EULA concerning non-commercial uses.
As with the GSHHS shoreline database discussed Section 4.1.1, the GEBCO data are formatted for use in the Generic Mapping Tools software, http://gmt.soest.hawaii.edu, and therefore effectively use (180°,0°) versus (0°,0°) as the central origin for the library. Similar to the ETopo2 dataset discussed below, the gridded GEBCO data includes both bathymetry and terrestrial elevation based on NOAA’s Globe DEM database.
The U.S. National Oceanographic and Atmospheric Administration's (NOAA) 2-minute DEM of combined bathymetry and terrestrial elevation data (ETopo2) replaces the earlier 5-minute ETopo5 DEM database. Prior to the 2003 release of the GEBCO library, the bathymetry data of the ETopo2 represented the highest resolution globally consistent seafloor data. The majority of the bathymetric data contained in the ETopo2 DEM are based on satellite altimetry combined with shipboard echo-sounding measurements as compiled by Smith and Sandwell. These bathymetric data are supplemented by data from: the U.S. Naval Oceanographic Office's Digital Bathymetric Data Base Variable Resolution (DBDBV); the International Bathymetric Chart of the Arctic Ocean (IBCAO); and, the DBDB5 where necessary. The terrestrial data of the DEM were generalized from the 30 arc second (as) GLOBE DEM having a nominal resolution of 1 km.
For the full DVD release of the USGS-AGI Global GIS Database, a smoothed 30as (1 km) derivative of the ETopo2 bathymetric data were integrated with GTopo30 DEM. Communications are still pending concerning the processes used by USGS to create this consolidated DEM. The DEM is however, very useful for the creation pseudo 3d, i.e. 2.5d, background images of bathymetry. A comparison of the terrestrial data of this DEM with the GTopo30 source DEM for Africa has shown a relative half to one-quarter pixel shift in these data. For this reason, given the wide availability and distribution of the GTopo30/GLOBE DEMs, it would be suggested that the terrestrial portion of the USGS smoothed DEM be replaced with the newly available SRTM30as DEM (see Section 8.4.3 below), to create a more unique - and perhaps better analytical - combined DEM of bathymetry and terrestrial elevation.
The level of effort required to create ESRI Grid formatted versions of: the GEBCO bathymetric and terrestrial DEM; the ETopo2; or some derivative 30as DEM(s) combining any of the above three bathymetric sources with the SRTM30as terrestrial DEM data globally should not exceed 2.5 days. Such processing should also include the creation of basic 2.5d image backgrounds as depicted in Figures 8.2b and 8.2c below.
Figure 8.2b
Examples of bathymetric/terrestrial
elevation image backgrounds
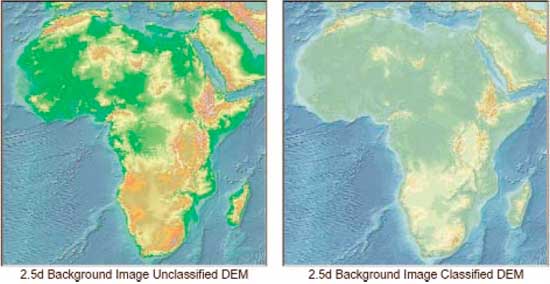
Figure 8.2b provides two different overviews of georeferenced image backdrops depicting integrated bathymetry and terrestrial elevation data. Such images are relatively easy to create and to process within the 2.5 day LOE stipulated above. Figure 8.2c depicts the ETopo2 bathymetry integrated with the SRTM 30as terrestrial DEM for a portion of the region affected by the December 2004 earthquake and tsunami in south-eastern Asia.
Figure 8.2c
Bathymetry covering south-eastern Asian
tsunami
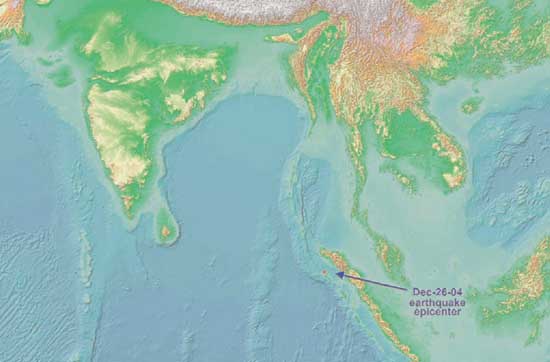
The image in Figure 8.2c represents only a small portion of a larger DEM and image background set of data generally suitable for scales smaller than 1:2 million. These data required less than one day to prepare due primarily to the relatively coarse resolution of the ETopo2 bathymetric inputs. In comparison, the LOE associated with the creation of continentally specific DEMs and 2.5d georeferenced image backgrounds suitable for use at scales larger than the above or representative of scales at or less than 1:1 million are more difficult to estimate. The creation of such higher resolution georeferenced images can require anywhere from three to ten days dependant on the process used and the number of images required at potentially varying scales. Before such a process could be considered, issues related to: the elevation break points and colours used in the base legend; the relative level of 3d exaggeration and potential sun angle; and whether derivative DEMs based on classifying ranges of elevation are also required, would at a minimum need to be addressed. Depending on these considerations, it could be expected that anywhere from three to six continental image backdrops could be created in a day.
As summarized in Table 8.3, the only source of vector based terrestrial elevation data identified for the inventory are the hypsographic layers and airport data layer of the NGA-VMap0 data library.
Table 8.3
Vector based terrestrial elevation data
layers
|
Data Type/Source |
URL |
Extent |
Scale |
Availability |
Notes |
|
VECTOR BATHYMETRIC CONTOURS AND UNDERSEA FEATURES |
|||||
|
NGA-VMap0/DCW Elevation-hypsographic polygonal, line, and point data layers |
Global |
1:1 M |
Public Domain |
Elevation range, contour, and spot elevation data layers from the VMap0 library |
|
|
NGA-VMap0 Airport data layer |
http://geoengine.nima.mil or set of four CDs via USGS Store |
Global |
1:1 M |
Public Domain |
Elevation attribute for ~ 10 000 airports globally |
The hypsographic data layers of the original 1992 DCW data library represent a relatively unchanged baseline for the elevation data layers comprising the VMap0 library. Between the two libraries there are however, a number of differences which can be detailed, (NGA-VMap0 2000):
The dropping of the original DCW unreliable elevation data class and the polygonal Elevation Range or Zone data layer containing Zone 1: -1 000 - 0ft, Zone 2: 0 - 1 000ft, Zone 3: 1 000 - 3 000ft, Zone 4: 3 001 - 7 000ft, Zone 5: 7 001 - 11 000ft, and Zone 6: Greater than 11 000ft from the VMap0;
Elevation values were changed from feet to metres for the VMap0;
Small closed contours incorrectly captured from the ONC Charts for the DCW as point features have been dropped between the VMap0.Ed3/4 and the VMap0.Ed5;
In the VMap0.Ed5, recognition is given to the fact that in some areas of the world, standard and supplemental contour lines may cross.
Figure 8.3.1
Examples of elevation backdrops and vector
base maps
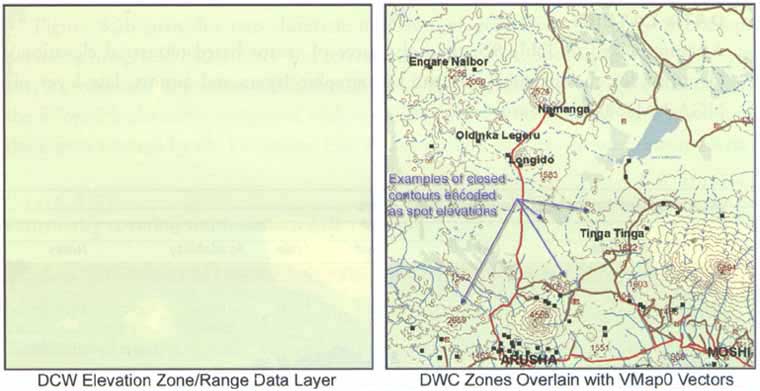
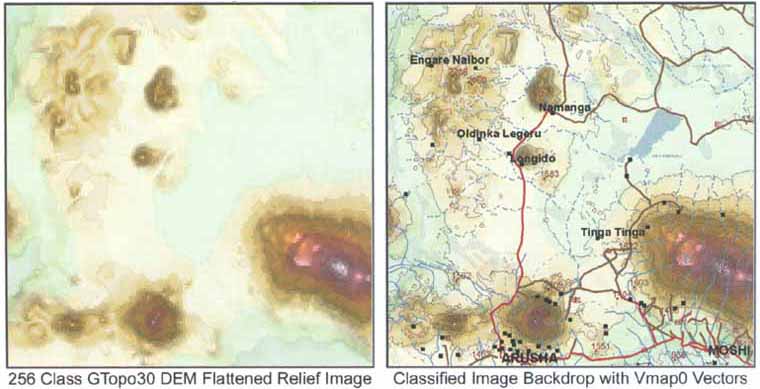
Given the availability of increasingly more robust raster terrestrial DEM data sources, the differences outlined earlier do not necessarily represent any loss with regard to either analytical or general base mapping capabilities. This can be seen in Figure 8.3.1, where a comparison of the DCW Elevation Zone data layer and a georeferenced image background produced from a DEM is provided. In this comparison, it can be seen that the dropping of the DCW Elevation Zone data layer, which was included in this first edition library to capture and potentially replicate the tinted elevation shading as depicted on the source ONC Charts, is more than compensated for by the addition of DEM derivative representations of elevation.
In order to present a more representative depiction of elevation relief, in Figure 8.3.1 the area surrounding Mount Kilimanjaro rather than one from within the Namibian AOI was chosen. The scale of the graphics in this figure are approximately 1:1 750 000 and overall this graphic shows that the reclassification of source DEMs and the use of legend break points and colours are likely a better avenue for approaching the creation of elevation backgrounds than processing the DCW elevation range/zone data. Given this, the DCW elevation zone data can be viewed as redundant, and allow for the VMap0 to be selected as the sole source of vector based terrestrial elevation data. The estimated LOE required to seamlessly process the linear contour and spot elevation data globally from the VMap0.Ed5 is 2.5 days. Reintegration and encoding of the points representing closed contours from the VMap0.Ed3/4 - which previously required a time-consuming reference to the source ONC Charts - with the VMap0.Ed5 would now only require an additional 0.5 days. The processing of the DCW elevation zone data would be estimated at three days, however.
As detailed under the Section 8.1.1, however, the consolidation of the VMap0 vector contour, linear coastline, and bathymetric contours should be considered. The level of effort associated with integrating these three data layers would be one day globally once the base data layers have been processed.
The integration of the roughly 9 800 airport features and elevation attributes with the VMap0 Spot Elevation data would require an LOE of only 0.25 days, and is therefore also suggested.
Eight public domain sources of global medium to high resolution terrestrial DEM data were identified for inclusion in the inventory. These data are summarized in Table 8.4.
Table 8.4
Raster terrestrial digital elevation
models
|
Data Type/Source |
URL |
Extent |
Scale |
Availability1 |
Notes |
|
Digital Terrain Level 0Elevation Data-DTED0 |
Global |
30as |
PD |
Available via NGA’s on-line server or as a DVD. Data have been supplanted by theG Topo30/Globe |
|
|
USGS-GlobalTopographic 30 ArcSecond Database-G Topo30 |
Global |
30as |
PD |
Mosaic of DTED tiles, usingVMap0 elevation data to fill gaps. Standard upon which the HYDRO1k hydrology is based |
|
|
NOAA-Global Land1 km Base Elevation-GLOBE |
Global |
30as |
PD |
Same as GTopo30 however, contains grids of min, max, & mean values created during processing |
|
|
USGS-HYDRO1kGlobal HydrologicalDatabase |
Global |
1 km |
PD |
Global hydrologically filledDEMs available based on six different continental equal area projections. |
|
|
NASA-Space ShuttleRadar TopographyMission (SRTM) 30asDEMs |
Global |
30as |
PD |
An update of the USGSG Topo30 with SRTM data used in place of original data when available |
|
|
NASA-SRTM 3asDEMs |
edc.usgs.gov/products/elevation.html |
Near-Global |
3as |
PD |
Highest resolution globalDEM data in PD, NASA processing of finished DEM expected mid-2005 |
|
NGA/NASA S RTM 1asDEMs |
edc.usgs.gov/products/elevation.html |
CurrentlyU S A Only |
1as |
PD-USARAelsewhere |
Baseline for the SRTM 3as& 30as DEMs, NGA has classified non-US data and is withholding from PD |
|
NASA/USGS MODISAster30 m DEM ImageScenes |
152.61.128.25 followed by either"/pub/asterdem/relative" or "/pub/asterdem/absolute" |
Sporadic globally |
30 m |
PD |
Highest resolution DEM data in PD, non-global& issues with the base interscene elevation values |
1 PD=Public Domain; RA=Restricted Access
No commercial source DEM data products were researched or evaluated for the inventory. Nor were country specific databases such as the high resolution U.S. National Elevation Database.
For the purposes of brevity, the above eight DEM sources have been further classified into four topical subheadings as discussed below. These discussions are followed by an extensive set of graphical presentations comparing the various DEM databases and their relative resolutions.
The still classified original edition NGA-Level1 3as (90 m) Digital Terrain Elevation Data (DTED) were used as a baseline to create a more generalized but globally consistent 30 arc second (1 km) DEM data product. This effort was broadly supported by the global geospatial community, with the primary contributors including: the NGA, the USGS-EDC, NASA-JPL, the Geographical Survey Institute of Japan, the Australian Surveying and Land Information Group, the University College London, the DLR-German Remote Sensing Data Center, and the NOAA-NGDC.
For the effort, the DTED data were supplemented by derivative DEM data for areas lacking DTED1 coverage. The primary source of such derivative data used to backfill the DEM were the vector hypsographic layers of the DCW. Other data used included: the Antarctic Digital Database, USGS 1-degree DEMs, the 1:100 000 International Map of the World, 1:100 000 Army Map Service - now NGA - maps, the New Zealand DEM; and the 1:100 000 Peru map. Where no additional source of elevation data were available to backfill the DEM, e.g. for portions of south central Africa, interpolation techniques were implemented. DCW drainage, lakes, and shorelines vectors were also used as potential masks during the mosaicing and DEM processing. The 30as pixel size is considered appropriate or representative for areas based on the DTED1, USGS DEM, and New Zealand DEM sources. Areas based on the DCW hypsography are also deemed suitable for this pixel size, while areas based on the other elevation sources might be considered degraded and less representative, (USGS, 1997). The inset graphic at the right, depicts the relative elevation sources used for the 30as DEM for Africa

These efforts resulted in two very similar DEM "products" which are now widely attributed to their USG based distribution agents. These products are entitled and attributed as: the USGS-GTopo30; and, the NOAA-Globe[21]. Based on processing in conjunction with the creation of continental DEMs for Africa, besides the tiling structure used for distribution, there are no discernible differences in the base DEM data between the two products. NOAA's Globe product however, includes additional raster grid data layers containing the: minimum, maximum, and mean elevation values used during processing of the final DEM. Subsequent to the GTopo30/Globe effort, the NGA has revised/updated its global DTED0 database using the GTopo30 for distribution via a DVD.
Irrespective of the source used to access the resulting 30as DEM data, some processing is still usually required to mosaic the DEM data for the creation of seamless DEMs at the continental level; please see Figure 2.3: Organizational or Tile Layout of VMap0, GTopo30 DEM, and Gazetteer Databases. Further, some artefacts do exist internal to either of these DEM products based on the original 1°x1° DTED0 tiles and then edges where the DEM transitions between DTED0, DCW, and other elevation sources, (see Figures 8.4a and 8.4b).
The LOE associated with processing either the GTopo30 or Globe 30as DEM data into ESRI Grid format and to create seamless mosaics for approximately six continental landmasses globally would be estimated at two days. Such processing should also at a minimum include the creation of a grid, or preferably a vector layer, containing the elevation sources comprising the DEM.
Building on the GTopo30 base DEM, the USGS-EDC in conjunction with UNEP and other collaborators produced what is known as the Hydro1k database. This effort was focused on the production of DEMs which have been filled to remove spurious or false hydrological sinks in the landscape - including some of the edge/transition artefacts mentioned above - to produce polygonal watershed and linear drainage network models. Six different subdatabases were produced for the effort based on continentally specific Lambert-Azimuthal Equal Area projections tailored to minimize area distortions. The hydrologically filled DEMs output by the effort are therefore based on a standard 1 km pixel size versus the original 30as pixel resolution. In addition to the hydrologically filled DEM, the Hydro1k also includes ancillary data grids representing slope and aspect. There is no LOE associated with the processing of the base DEM and ancillary grids of Hydro1k into ESRI’s Grid data format.
The SRTM data effort is based on a collaboration of the NGA and NASA, as well as, the German and Italian Space Agencies. The results of the effort will be the production of near-global DEMs at three resolutions: 30as (1 km), 3as (90 m), and 1as (30 m). The 30as and 3as are based on processing or aggregation of the baseline 1as DEM. All three DEMs are in decimal degrees using the "geographic" projection system and the WGS84 Spheroid or Geoid. With the exception of the 30as data - that are distributed in a tile structure similar to GTopo30 - the 3as and 1as data are based on a 1°x1° tile structure. Further, the NGA has not declassified the 1as SRTM DEM data for areas outside of the USA and it could not be determined if these data will ever be made available in the public domain. The coverage provided by the SRTM DEM data is depicted in Figure 8.4.3.
Figure 8.4.3
Coverage of SRTM DEM data
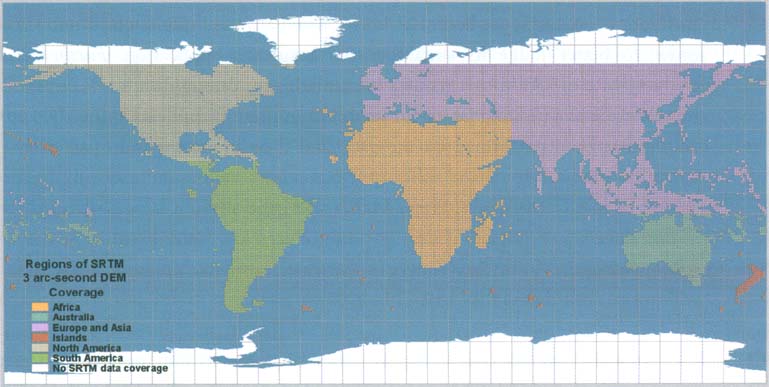
According to metadata documentation provided by NASA-JPL, the SRTM mission was launched on 11 February 2000 and flew for 11 days aboard the Space Shuttle Endeavour. The SRTM instrument consisted of a Spaceborne Imaging Radar-C (SIR-C) interferometer with a 60 meter-long baseline. As can be seen on the above graphic, the mission's goal was to image all landmasses between 60 degrees north latitude and 56 degrees south at least once. This goal was basically accomplished, with roughly 95 percent of the landmass being imaged at least twice, and some 50 percent three or more times. Since the primary source of error in synthetic aperture radar data produced by the SIR-C instrument is speckle - which has the same characteristics as random noise - averaging based on the number of imaging samples is a critical factor for determining the overall accuracy of a resulting DEM, (NASA-JPL, 2003).
The 30s SRTM data are currently available globally between 60°N and 60°S and have been backfilled using the GTopo30 to account for data voids and areas not originally covered by the mission. As of July 2004, "unedited" SRTM 3as data were made available via FTP download in directories consolidating tiles for North America, South America, Europe, Asia, Africa, Australia-New Zealand, and then smaller Pacific island states. One positive factor inherent in NASA-JPL’s processing of the SRTM 1as base DEM into the 3as DEM, is that the 3x3 averaging of the nine source 1as pixels into a single 3as pixel tends to further reduce speckle by roughly a factor of three. In addition to an FTP based distribution of the unedited SRTM 3as DEM data, potential users can also access these data via the USGS seamless server covering an AOI in a number of formats including the ESRI Grid format. However, problems were repeatedly encountered during attempts to access both the site and to then complete any "seamless" download of either 1as or 3as SRTM data.
According again to the documentation accompanying the “unedited” 3as data, NASA-JPL offers the following use caveats:
Users of SRTM data must be aware of certain characteristics of the data set (resolution, accuracy, method of production and any resulting artefacts, etc.) in order to better judge its suitability for a specific application. Further, a characteristic of SRTM that renders it unsuitable for one application may have no relevance as a limiting factor for its use in a different application. Lastly, no editing has been performed on the data, and the elevation data in particular contain numerous voids and other spurious points such as anomalously high (spike) or low (well) values. Water bodies will generally not be well-defined - in fact since water surfaces generally produce very low radar backscatter they will appear quite “noisy” or rough, in the elevations data. Similarly, coastlines will not be well-defined (NASA-JPL, 2003).
NGA commercially contracted a post-processing step to the “unedited” data that was completed in late 2004. This processing included: some editing, the flattening of water bodies, the delineation of coastlines, dampening to remove spikes and wells, and then the reformatting of the data into the DTED format. These data will represent the "edited" versions of the SRTM 1as and 3as DEMs which will supersede the original DTED Level2 1as (30 m) and Level1 3as (90 m) databases. According again to NASA-JPL, for the edited/finished DTED-Level1 data, NGA is using subsampling versus averaging methods for aggregating the 1as edited DEM baseline. Given this, NASA-JPL anticipates the reprocessing of the edited 1as DEM baseline into averaged 3as pixels after the NGA post-processing before providing the data to the USGS for public distribution.
As of February 2005, the edited SRTM DEM data are available for purchase only via the USGS-EDC as a set of 13 DVDs at a cost of US$60 per DVD, (i.e. no FTP or other on-line access to these data is currently available). These data are available in either DTED or BIL format. In addition to the unedited and finished SRTM DEM data, NASA-JPL also anticipates the release of the 1as SRTM radar image data to the public as separate 1°x1° tiles, once a suitable distribution site can be identified, (NASA-JPL 2004).
NASA-JPL and the NGA provided advanced copies of the 3as DEM data covering the Namibia AOI to facilitate the completion of this inventory. However, after some consultation the NGA could not grant access based on a similar request for 1as DEM data covering the Namibian AOI. Similarly, other than stipulating that any non-US 1as SRTM DEM data distributed must be held within a secure USG based facility, the NGA could not as of May 2004 provide guidelines whereby such requests could be facilitated through USG agencies for potential use by the UN to respond to non-peace keeping emergencies.
Level of Effort estimates for processing SRTM DEM data
The LOE associated with processing the SRTM 30as data and its integration with either a derivative of ETopo2 bathymetry or the bathymetry associated with the USGS-AGI Global GIS would again be 2.5 days. These data are in the same 16bit signed integer format used for the GTopo30. Specifications for any processing of these data should include: the creation of at a minimum six continental DEMs; and the creation of a grid, or preferably a vector layer, containing the elevation sources comprising the DEM. The creation of this latter dataset will also help to identify data void areas of the SRTM 3as DEM data and provide potential users with the ability to identify areas requiring further attention. Graphic examples comparing the SRTM-30as data to the 30as GTopo30 and the SRTM-3as can be seen in Figures 8.4a and 8.4c at the end of this section.
The LOE for processing the 3as data into seamless continental mosaics is much more difficult to estimate and should be weighed against the cost of ordering - what one would suppose are - seamless mosaics directly from the USGS-EDC. Unfortunately, the direct cost for placing such orders from the EDC could not be established via information available on-line. The formats offered via this method are the same as those available via the USGS seamless server and include: the ESRI Grid, BIL (integer data), and TIFF (32-bit floating point) formats.
Using continental Africa as baseline, the LOE required to access and process the SRTM-3as DEM data for Africa directly from the FTP site, would for require the download of some 3100 tiles, which in a compressed form equal almost 3.5gb[22]. Following this, the actual steps required to process these data after downloading would include: uncompressing and renaming the file extension for each file to BIL; the generation of valid WorldFiles for georeferencing; the ingestion of the data into ESRI Grid format; intermediate grid processing to account for the signed 16-bit format and to possibly assign null values to each grid; and lastly, the mosaicing of each 1°x1° grid tile DEM into some larger tiling format.
Unfortunately, establishing such a tile structure itself is somewhat problematic - at least for most standard grid formats and in particular the ESRI format - given that there is roughly a 2.4gb limit on the size of any one file comprising an ESRI Grid. It is also difficult to estimate when this limit would be reached to establish a minimum standard tile size. Further, the 2.4gb limit in general rules out the creation of standard continental mosaics unless more robust spatial formats such as ESRI’s ArcSDE are utilized. However, if the provision of such mosaics to users in much of the developing world is a consideration, the use of formats such as ArcSDE are not currently an option and the 2.4gb size remains a limiting factor.
Assuming that a standard tile size of 20°x20° could be achieved, 108 of these tiles would be required to provide worldwide coverage of the SRTM data between 60 degrees north latitude and approximately 60 degrees south. However, based on summary statistics derived from the GTopo30, it is anticipated that at a minimum 16 of these tiles would represent ocean areas without landmass. This number would increase if minor oceanic islands were further excluded from processing, leaving a maximum of 92 tiles which may need to be created.
Processing the SRTM-3as data into ArcGrid format using 15°x15° DEM tiles in conjunction with the FAO-AWRD for Africa, indicate an average output grid file size of only roughly 250 mb per tile. Given automated processing routines developed during this exercise, the estimated LOE for globally processing the SRTM-3as DEM data into 20°x20° tiles would be five days. With regard to the provision of seamless SRTM-3as data for either distribution to developing countries or for country specific base mapping, another option for consideration would be the creation of country specific mosaics with a standard 1° "buffer" of the DEM around each country. However, while this option might be sensible from the standpoint of base mapping, it may needlessly complicate the subsequent processing of regionally specific AOI(s) for analytical purposes. This option would also raise the estimated LOE significantly as it may require the creation of some 200 country based "tiles". Graphic examples comparing the SRTM-3as data to the SRTM-30as data and then the ASTER 30 m (1as) data are can be seen in Figures 8.4c and 8.4d at the end of this section.
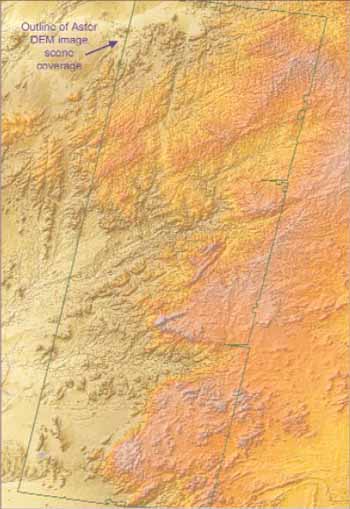
ASTER 30 m digital elevation models, available via the USGS-EDC EOS-Gateway as product AST14, are produced from the Advanced Spaceborne Thermal Emission and Reflectance Radiometer (ASTER) instrument aboard the TERRA satellite. The ASTER DEMs are based on stereo image pairs using bands 3N (nadir) and 3B (aft-viewing) from visible near-infrared acquired from 15 metre Level-1A ASTER images. It is projected that by the end of the six year TERRA mission in January 2006, all land surfaces below 82 degrees of latitude will be covered with base imagery. However, since the processing of DEMs is an on demand process with a current backlog of almost nine months, global ASTER DEM coverage should not be expected until sometime in 2008.
There are two DEM "products" which can be produced from the ASTER Level-1A imagery, absolute and relative. The absolute data have had local ground control points (GCPs) provided by end users resulting in DEMs with a vertical accuracy of >= 7m, while the relative DEM data have a vertical accuracy of >= 10 m. All ASTER-DEMs are based on the UTM coordinate and projection systems using the WGS84 spheroid. There are a greater number of relative versus absolute ASTER-DEMs currently available. Based on testing for the Namibian AOI, the process of creating mosaics of relative ASTER DEM scenes is complicated due the potentially wide variability between the base elevation values of adjacent DEM scenes.
However, until such time as the NGA releases the SRTM-1as (30 m) DEM data "globally" into the public domain - if ever - the ASTER 30 m DEM data represent the highest resolution public domain digital elevation data available. Currently, only relatively sparse coverage these data globally are available, as shown in Figure 8.4.4 below.
Figure 8.4.4
Coverage of ASTER DEM data
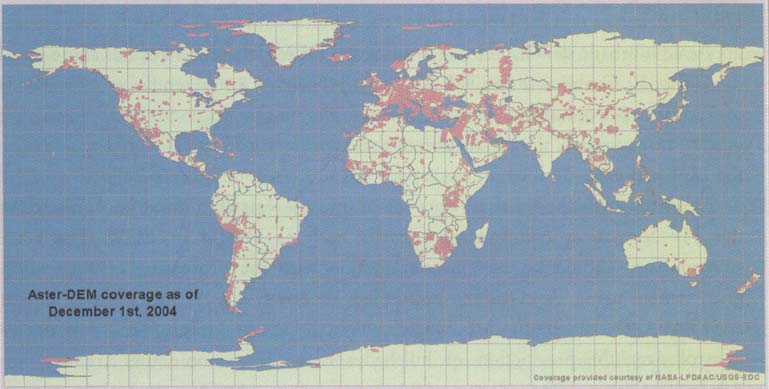
Accessing and then processing existing ASTER-DEM data is a fairly complex process, involving: the identification of potential ASTER image scenes, called granules, covering an AOI via the USGS EOS-Gateway; copying the more detailed Metadata available for each granule to obtain more exact georeferencing information; downloading the exiting 32-bit signed data in GeoTIFF format via the FTP sites listed in Table 8.4; intermediate processing of the data into the USGS-DEM format; the importation of these data into ESRI Grid format[23]; and, then any potential mosaicing and harmonization of the base elevation values between ASTER DEM scenes for "relative" DEMs using the SRTM-3as DEM as a baseline.
The LOE required to access and process the ten ASTER-DEMs providing partial coverage of the Namibian AOI, was 2.5 days. Given the experimentation involved in becoming aquatinted with these data, it is estimated that this LOE could easily be reduced by at least half. Graphic examples showing the ten ASTER-DEM scenes covering the Namibian AOI and comparing these data with the SRTM-3as DEM data are provided in Figures 8.4c and 8.4d at the end of this section.
The UNCS has obtained the full archive of both the relative and absolute ASTER DEMs as of December 2003. These data are used as needed and the UNCS has conducted several tests with good results where ground control points (GCPs) have been provided as inputs for the production of absolute DEMs, (UNCS 2004a).
It is highly recommended that in addition to any processing in conjunction with the above DEM data layers, that the UN considers the simultaneous production of slope, aspect, and greyscale hillshade data layers. For continental DEM data layers such as those based on the GTopo30, Globe or the SRTM-30as, such processing would require an estimated LOE of 0.25 days per continental mosaic. Assuming again that six continental mosaics would need to be processed, the production of these ancillary grid layers would add 1.5 days to the LOE estimates detailed previously for the 30 arc second DEM baselines.
Hillshade grids should also be processed into georegistered image backgrounds using the TIF format or compression formats such as MrSID or ECW. The SHADE subcommand should be used in conjunction with the processing of such hillshade grids when using ArcGrid to minimize shadows, i.e. SRTM30HS = hillshade(e:\STRM_GT30\srtmbath, 315, 45, shade,.00013) as ArcInfo/GIS provides more control over the production of hillshades than for example the ArcView Spatial Analyst module.
Hillshade grids or images are used as inputs in the creation of both georeferenced 2.5d colour hillshades and enhanced satellite image backgrounds. If the production of 2.5d colour hillshades or enhanced satellite image backdrops is based on further grid based processing using so-called hillshade-factor grids, then the actual hillshade grid will be utilized. While, if the USGS process for creating such backdrops is used, the greyscale hillshade image is combined with a base RGB image of the DEM, as defined by the elevation breakpoints of the legend, or the appropriate bands of the satellite image. In this process, the RGB image must then be converted to a CMYK image with the K-Black layer left empty. The greyscale image is then merged in as the K layer and the image converted back to RGB with enhanced 2.5d elevation.
Hillshade and 2.5d image backgrounds save costs by freeing general users from having to employ expensive add-on GIS Grid and 3D processing modules. Even though such backgrounds are only 2.5d representations of elevation, they allow for effective three dimensional visualizations. Due to this, it is suggested that in addition to the greyscale image processing, four colour hillshade DEM image backgrounds should also be considered. These backgrounds would include: 2.5d and ortho-flattened colour hillshades based on the unclassified source DEM; and, 2.5d and ortho-flattened colour hillshades based on classifying the source DEM into either 256 or 64 elevation classes, (see Figures 8.2b and 8.3.1 above, and the figures at the end of this section). Because 2.5d hillshades represent slightly degraded versions of the source DEM, the ortho-flattened hillshades provide not only a different representation of elevation, but the means to stretch the scale at which hillshades can be effectively utilized for the purposes of base mapping. For example, although a 30 arc second DEM can be used for 1:1 million scale base mapping, depending on the level of vertical exaggeration, 2.5d hillshades can only be used at scales of 1:1.5 million through 1:2.5 million. The production of both the classified and ortho-flattened hillshades allow these backgrounds to be used at scales of between 1:1.5 million and 1:750 000.
The LOE associated with the production of 2.5d greyscale and colour hillshade DEM image backgrounds is dependant on the number of backgrounds produced. The estimated LOE for producing five 30 arc second image backgrounds would average 1.25 days per continent.
The creation of intermediate resolution continental DEMs - and then hillshade image backdrops - based on the SRTM 3as DEM database should also be considered. Natively, the SRTM 3as DEMs can be used to create image backdrops compatible with 1:250 000 scale base mapping. The creation of the intermediate resolution continental DEMs, e.g. a DEM with a resolution of between 10as and 15as, would facilitate the creation of publication quality image backdrops suitable for base mapping at scales between 1:500 000 and 1:1.5 million.
The five figures presented on the following pages employed further grid based processing in conjunction with hillshade grids to produce comparative georeferenced image backdrops based on the GTopo30, SRTM-30as, SRTM-3as, and ASTER DEMs discussed previously.
Figure 8.4a
Comparison of 30 arc second GTopo30 and
SRTM-30as DEMs using 2.5d shaded relief
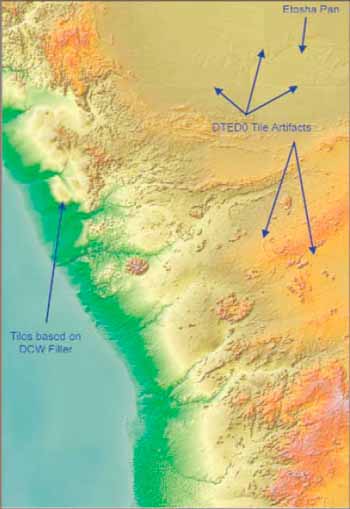
Shaded Relief based on GTopo30 30 arc second nominal 1 km posting DEM, Scale 1:4 M
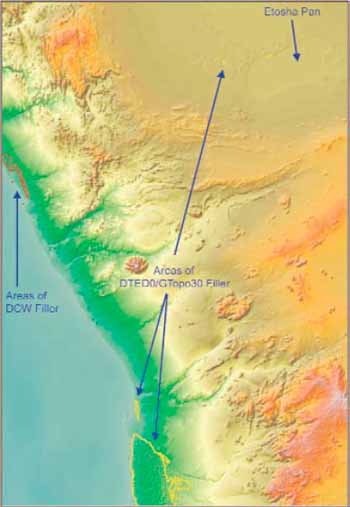
Shaded Relief based on 30as Space Shuttle Radar Topography Mission DEM data, Scale 1:4 M
Figure 8.4b
Examples of 2.5d enhanced satellite image
and ortho-flattened shaded relief based on 30as GTopo30
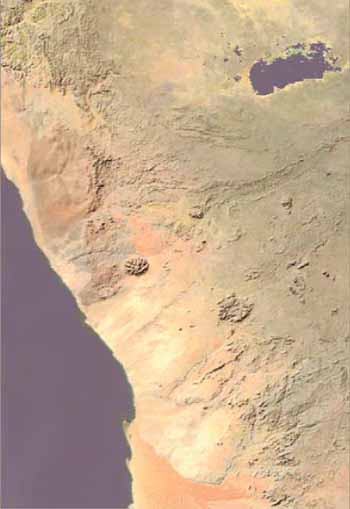
Enhanced MODIS ~1km Mosaic using GTopo30 derivative Shaded Relief, Scale 1:4 M
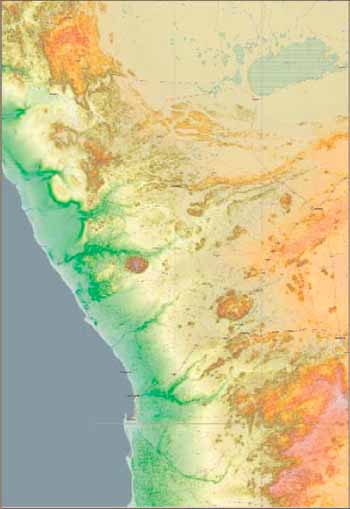
1:750,000 African Virtual Base Map with flattened GTopo30 Relief, depicted at scale of 1:4 M
Figure 8.4a
2.5d Shaded relief comparison of SRTM-3as
and SRTM-30as DEMs, with ASTER-DEM scene boundaries

Shaded Relief based on 3as SRTM nominal 90 m DEM data, Scale 1:4 M
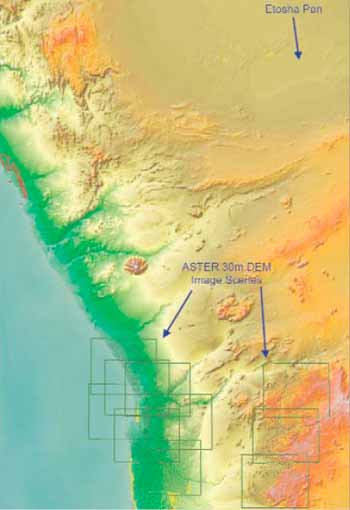
Shaded Relief of SRTM 30as DEM data with 30 m ASTER DEM Image Scenes/data, Scale 1:4 M
Figure 8.4d
2.5d Shaded relief comparison of SRTM-3as
(90 m) DEM and 30 m ASTER-DEM mosaics
Shaded Relief based on 3as SRTM DEM data for the Khomas region of Namibian AOI, Scale 1:1.1 M
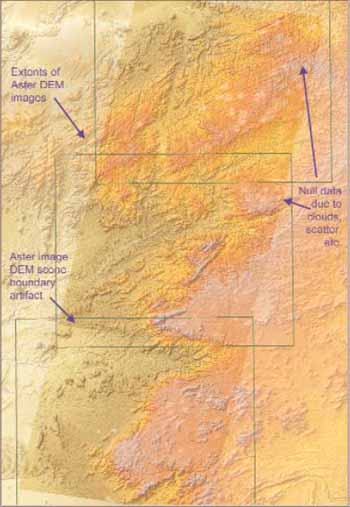
Shaded Relief based on 30 m ASTER DEMs with 3as SRTM DEM data as a backdrop, Scale,1:1.1 M
Figure 8.4e
Comparison of 28.5 m Ortho-TM satellite
image mosaic and 2.5d enhanced mosaic using 30 m ASTER-DEM
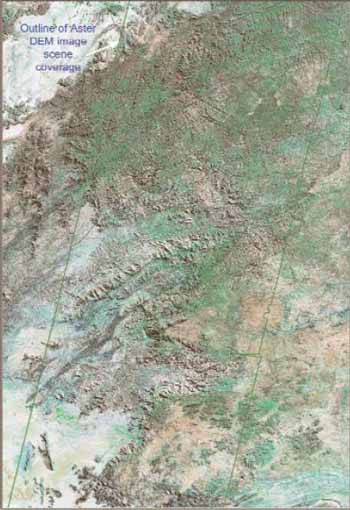
OrthoTM 30 m LandSat 4/5 mosiac with adjusted color balance, hue, contrast, Scale 1:1 M
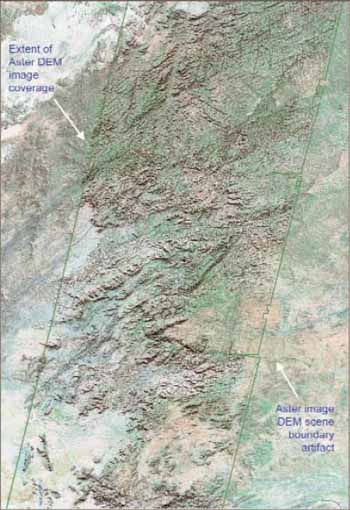
2.5d enhanced OrthoTM image using 30 m ASTER DEMs for Khomas region of Namibian AOI, Scale 1:1 M
The section presents the limited sources of geological and soil data identified for consideration in the inventory. With the exception of the six data layers available from the USGS-AGI Global GIS data library and their penultimate data sources, the physiographic/industry data layers of the NGA DCW/VMap0 and soils datasets from FAO and ISRIC, no other sources of globally consistent data were identified. For this reason, no tabular listings of these sources were prepared to summarize this section.
Five data layers from the USGS (http://webgis.wr.usgs.gov/globalgis) and American Geological Institute (AGI, www.agiweb.org/pubs/globalgis/) Global GIS were identified for inclusion in the inventory. There is little or no LOE associated with the processing of any of these data layers as long as they are accessed from the global DVD edition of the USGS-AGI Global GIS. These five data layers are summarized below, and include references to the source databases used for the Global GIS and a brief discussion of any potentially relevant DCW/VMap0 data layers.
The Geologic Age polygon data layer of the USGS-AGI Global GIS forms the basis for the creation of the Geologic Provinces data layer described in Section 9.1.2. Due to the inclusion of coastline and country boundary features provided by ESRI, the onward distribution of this database may be restricted to some degree. The dataset has been enhanced since the initial distribution of the continental subsets of the Global GIS and now contains encoding for both the geologic age and basic rock composition of each unit. For example, under the Palaeozoic Age, the following rock compositions can now be differentiated in the dataset: palaeozoic basic intrusives, palaeozoic granite, palaeozoic granodiorite, palaeozoic metamorphic facies, palaeozoic syenite, palaeozoic volcanics, palaeozoic igneous, palaeozoic intrusives, palaeozoic mafic intrusives, etc.
The Geologic Provinces of the World data layer of the Global-GIS provides: oil field, gas field, and oil well information to known geographic entities for assessing global petroleum provinces. Each province contains attribute encoding distinguishing the geologic characteristics of each province from those surrounding it. Available attribute encoding for these characteristics may include the dominant lithologies, the age of the strata, and the strata's structural style. The on-line reference for these data can be found at: http://energy.cr.usgs.gov/energy/WorldEnergy/WEnergy.html.
The point Ore Deposits data layer of the USGS-AGI Global GIS data library is based on a 1996 version of the USGS's Mineral Resource Data System (MRDS). The extant encoding of both the Ore Deposits data layer and the MRDS include a variety of attributes for both metallic and non-metallic minerals including: descriptive information about mineral deposits and/or commodities, the name of the deposit, its location, the type of commodity, its geologic characteristics, reserves, and publication references. This dataset can be distributed and included in hardcopy publications subject to a fair-quotation EULA. On-line access to this data layer can also be found via, http://mrdata.usgs.gov.
The point mines data layer of the Global GIS is comprised of some 224 096 mine locations globally and encoding attributes consolidated from the five data tables based on the 1996 MAS/MILS database. The MAS/MILS database - acronym unknown - was developed originally by the U.S. Bureau of Mines. The U.S. Bureau of Mines has since been closed and is no longer a USG agency. This database will at some point be integrated with the MRDS database discussed under Section 9.1.3 and was transferred to the USGS when the Bureau of Mines was closed. The MAS/MILS database contains a number of attributes including the mine name and any alternate name(s), the type of deed and ownership, the company holding the deed, and the mineral commodities potentially available or being extracted. These data are in the public domain.
In addition to the above source, both the DCW and the VMap0 libraries provide data layers containing polygon and point representations of mines, quarries, and oil fields. Based on processing of the DCW, VMap0.Ed3, and VMap0.Ed5 libraries for Africa, there are no discernible differences between these features; other than perhaps some slight generalization in VMap0 features due to processing/fuzzy-creep. For reasons discussed in Sections 9.2 and 10.1.1, however, the DCW may represent a better choice for the UN to consider.
The baseline source for the point Oil and Gas Fields data layer of the Global GIS data library could not be determined based on the metadata accompanying the library. Further, the meaning of the extant attribute encoding for the data layer could not be determined from the metadata, and the name for the oil or gas field is inexplicably not included. Further research is required to determine if the full attribute encoding and more extensive metadata are available from the on-line reference for this data layer via, http://energy.cr.usgs.gov/energy/WorldEnergy/WEnergy.html. As discussed in Section 9.1.4, the DCW and VMap0 also contain point and polygonal representations of major oil fields.
No globally or continental specific databases of Geomorphology were identified for the inventory. However, both the DCW and the VMap0 provide general 1:1 million scale data layers, i.e. the LCPOLY and GROUNDA layers respectively, which included some physiographic features, including lava, sand, wet sand, distorted surfaces, and natural landmark features. Previous to the release of the VMap0.Ed5, because the DCW data layer contained a number of other features - the encoding for some of which were dropped during the change to the VMap standard - this layer would have been the recommended choice for the UN to consider. However, due to the harmonization of coincident polygon boundaries from multiple data layers, which was instituted for the VMap0.Ed5 library based in order of preference on Coastline, Drainage Water Bodies, Built-Up Urban and Peri-Urban Areas, Physiographic Features, and finally the much expanded Vegetation layers, it has become more difficult to recommend the DCW as a baseline of physiographic features.
However, two factors still argue in favour of choosing the DCW as such a baseline over the VMap0.Ed5 to represent physiographic features. The first of these factors concerns the utilization of the DCW to represent these features on 1:1 million or small scale base maps where the harmonization of the VMap0 coincident boundaries would be negligible and hardly discernible in comparison to using the same features from the DCW. While in regards to the second factor, the inclusion of the "Undifferentiated Wetlands" feature class - which was dropped in the change of standards between the DCW and VMap0, see Figures 10.1.1a and 10.1.1b below - and the more complete/consistent representation of "Seasonally Inundated Lands" features contained in the DCW-LCPOLY data layer again favour of the DCW over the selection of the VMap0.
Regardless of the base library used to represent physiographic features. Users should be aware that numerous gaps, slivers, and terminal voids between features represented on one ONC Chart but not on adjoining charts potentially limit the reliability of layers from both source data libraries. Based on the creation of a seamless data layers for Africa from both sources, in addition to mosaicing and then potentially processing at least the VMap0 layer from the VPF format, at a minimum manual editing will also be required to remove gross gaps and slivers. For Africa, this editing required approximately 1.5 days for each source library. The LOE for processing either the DCW-LCPOLY or VMap0-GROUNDA layers data globally can therefore be estimated at seven days.
In addition to the seamless compilation and manual editing tasks, the consolidation of attribute encoding should also be considered mandatory for either data source. While, specific to the DCW, the processing of the linear physiographic layer PHLINE would be deemed appropriate.
Processing of the DCW annotation to provide potential map labels for features such as mountains, craters, escarpments and mountain ranges is included in the general processing of the annotation layers described previously in Sections 3.6.1 and 3.6.4.
In addition to the five data layers described above in Section 9.1, the USGS Global-GIS data library contains data layers on earthquake/seismic events and volcanoes.
The Earthquake point data layer of the USGS-AGI Global GIS is based on data available primarily from the 1996 NOAA NGDC Seismicity Catalog CD-ROM Collection containing major earthquake events from 2100 B.C. to 1995. The Seismicity Catalog is available for either purchase or download at, www.ngdc.noaa.gov/seg/fliers/ se-0208.shtml. These data were updated to year 2003 based on the monthly Preliminary Determinations of Epicenters (PDE) data available via FTP download, ftp://ghtftp.cr.usgs.gov/pub/pde/ from the USGS National Earthquake Information Center (NEIC). The data in the Global GIS represent a subset of data available from these sources. Encoding within the Global GIS data layer include the date, wave form attributes, and a magnitude between 0.1 and 9.9. According to the metadata accompanying the data layer, earthquakes with no computed magnitude are included, but there are very few events with magnitude less than 2.0. The Global GIS data are in the public domain, and updates can be coordinated through the NEIC and related global institutions via, www.neic.cr.usgs.gov/neis/epic/database.html and related links. The USGS-NEIC is a major contributor to the Global Seismic Hazard Assessment Program (GSHAP) under the framework of the United Nations International Decade for Natural Disaster Reduction (UN-IDNDR).
The actual international body charged with collating earthquake information worldwide is the International Seismological Centre (ISC), www.isc.ac.uk. However, given that the production of an ISC quarterly bulletin requires the integration and review of events, hypocentres and associated phases, from over 120 institutions worldwide there is a backlog of over a year and a half concerning the currency of the ISC database. For this reason - and due to the immediacy of threats as evidenced by the devastating impact of the events in Bam, Iran (2003) and Sumatra (2004) - UNGIWG may wish to evaluate the NEIC on-line FTP catalogue of seismic events available from 1990 to the present as a potential baseline. This baseline could be “updated” based on the ISC holdings, but kept current using the monthly and weekly data available from the PDE, ECR and WEEKLY directories under ftp://ghtftp.cr.usgs.gov/pub/.
The data contained in these directories are in flat ASCII files using a variety of standardized formats which can be easily ingested into a GIS, with the PDE formatted data containing a more summarized listing of the hypocentre for each event and the ECR formatted data containing both hypocentre and phase attributes. Until a full monthly event file is reviewed and posted to the FTP site, the weekly PDE and ECR formatted files in the WEEKLY directory can be used for currency. Similarly, until each weekly data file can be compiled, a file named “qedevents.txt” can be located under the WEEKLY directory. This file is updated daily and contains a summary report of events covering approximately the latest two week period. The spatial references in both the PDE and ECR formatted files are in decimal degrees of latitude and longitude with three decimal places of accuracy.
An ASCII file containing a daily record of seismic events that is updated every five minutes can be “fingered” via, http://neic.usgs.gov/neis/finger/quake.asc. The data in this file can again be seamlessly integrated into a GIS using simple macros and overlaid with the administrative, population, and other data previously inventoried to arrive rapidly at broad preliminary estimates of the potential population at risk from events of a certain minimum magnitude. For a graphical representation of the 26 December 2004 location of the Sumatran earthquake that was drawn from the above “quake.asc” ASCII file see Figure 8.2c, Bathymetry covering South-Eastern Asian Tsunami, presented earlier in Section 8.2. HTML versions of most of the above files containing specific event reports can be located via, http://neic.usgs.gov/neis/world/.
The point Volcano data layer of the USGS-AGI Global GIS is based on data made available from the Smithsonian Institution Global Volcanism Program. The data are current up through 1994. Based on the metadata accompanying these data, attribute encoding includes: basic geographic and geologic information for volcanoes active in the last 10 000 years; a unique volcano identifier; a name; the geographic location; elevation at the summit; the volcano type; its status; and lastly, the time range of the last recorded eruption. These data are in the public domain subject to fair-quotation. Updates of the above baseline of volcanic data current as of 2003 are available via the Smithsonian Institution Web site at, www.volcano.si.edu/gvp/links/index.htm.
Although linked to extreme wave events in oceans or confined water bodies, tsunamis are included under this section of the inventory because one of the primary causes of the “impulsive disturbance” triggering tsunamis are the geophysical, tectonic[25] and seismic events discussed previously in Section 9. However, unlike terrestrial occurrences of such events where a preliminary assessment of the population and infrastructure at risk can at least be preliminarily estimated, both the determination of events which may lead to a tsunami and then an assessment of the areas and populations at risk are currently much more difficult to model or estimate. An overview of the difficulties associated with the modelling of tsunamigenic events based on the historical record of available data can be found at the NOAA-NGDC URL, www.ngdc.noaa.gov/seg/hazard/tsuintro.shtml.
In addition to the above reference information on tsunamis, NOAA-NGDC also provides access to its historical data on tsunamis in both a tabular format at, www.ngdc.noaa.gov/seg/hazard/ tsu.shtml, or via an IMS map server at, http://map.ngdc.noaa.gov/website/seg/hazards/viewer.htm. These data form the baseline for a somewhat similar database currently focused on the pacific region available through the International Tsunami Information Center (ITIC), www.prh.noaa.gov/itic/ more_about/itsu/itsu.html, as developed by the Tsunami Laboratory in Novosibirsk, Russia, http://tsun.sscc.ru/htdbpac/. The ITIC is a subsidiary of the of the United Nations Educational, Scientific, and Cultural Organization, Intergovernmental Oceanographic Commission (UNESCO/IOC) and is the internationally mandated parent institution to International Coordination Group for the Tsunami Warning System in the Pacific (ICG/ITSU) that has been focused on tsunami-related activities in the Pacific region.
The UNESCO/IOC/ITSU Historical Tsunami Database covers the period from 47BC-2004AD and appears to be based in large part on a subset of the NOAA-NGDC tsunami database for the Pacific tsunamis. Given this, and links from the ITIC to the NOAA-NGDC tsunami-hazards IMS server for the mapping of tsunami events, it may be sufficient for the purposes of this inventory to provide a brief overview of the NOAA-NGDC historical tsunami database (HTDb). Further, due to the complexity involved with actually mapping the propagation of tsunamis and defining at risk locations, a summary overview of the seismic and tsunamigenic events on 26-12-2004 of the coast of Sumatra and affecting the eastern Indian Ocean is also provided.
The NOAA-NGDC Tsunami Database is comprised of three related data tables. The first table is the Significant Earthquake Table. This table, www.ngdc.noaa.gov/seg/hazard/sig_srch_idb.shtml is a subset of the USGS_NEIC earthquake database presented in Section 9.3.1, and currently, i.e. as of the end of February 2005, contains 5 970 events from 2150BC through 2004AD. In general this table only contains earthquakes of greater than a magnitude of 4.5, with the majority included having a magnitude greater than 6. Presumably, however, any event leading to a tsunami event as recorded in the related Tsunami table would also be represented. The following data fields are contained in the Significant Earthquake table: date, including Coordinated Universal Time (UTC) which was formerly known as Greenwich Mean Time; a link to any pictorial slides of the event; a link “forward” to any associated event in the Tsunami Table; location references based on country, name, and lat/long (decimal degrees, three places of accuracy) attribute fields; the focal depth of events in kilometres; four potential measures of Magnitude; the MMI or the 1931 Modified Mercalli Intensity; effects attribute fields encoding the numbers of deaths and an associated description code, number of injuries, damage in millions of 1995 U.S. dollars and a description code; and lastly, attribute fields for a reference and comments. It should be noted that the encoding for many of these attributes are either null or not valid across the historic records.
The second table of the Tsunami Database, www.ngdc.noaa.gov/seg/hazard/tsevsrch_idb.shtml is the actual Tsunami Table. Effectively, because this table contains cross-reference links both “back” to the Significant Earth Quake Table and “forward” to the Runups Table, it can be considered as the middle table of the database triad. The Tsunami Table currently contains 3 003 records and covers a timeframe from 2000BC through 2004AD. The data fields in this table include all of those contained in the previous table with the following exceptions: the number of wave Runups, including a cross-reference link to the Runups Table; a link to any associated triggering event in the Significant Earthquake Table; tsunami parameters including a cause code, a probability code rating the actual occurrence of a tsunami, two possible measures of the magnitude of the tsunami, a measure of Intensity, and the Maximum Runup height in metres (nominally amsl); a warning attribute field; and lastly, the addition of number and cause attributes for houses destroyed. As with the Significant Earth Quake Table, across the historic record many of the encoding attributes for the above fields are either null or invalid.
The third and final table of the NOAA-NGDC Tsunami Database is the Runups Table, www.ngdc.noaa.gov/seg/hazard/tsrnsrch_idb.shtml. As of February 2005, this table contained 6 961 tsunamigenic wave or runup events covering a period from 1410BC through 2004AD. As with the previous two tables, the Runups Table contains: date, location, reference, comments, and similar effects attribute fields. Unlike the previous tables, the Runup Table contains the following differences in its attribute fields: the Time attribute fields include UTC references of the Arrival and Travel times rather than the start time; a link or event association is provided “back” to Tsunami Table; the are no extant reference fields recording measures of any triggering earthquake event; rather, the only Measure attribute fields are specific to each Runup wave and include a code for the type of any measurements; a description indicating a qualitative assessment of any recorded measures of the runup, the maximum height in metres (nominally amsl), the horizontal Inundation of in-land flooding in metres, if available the Period in minutes related to the 1st cycle, and a final field encoding whether the first Motion of the wave was a rise or fall.
As again with the other two tables comprising this database, much of the encoding specific to the records of the Runups Table is either null or invalid. This includes the potentially critical Arrival and Travel UTC attributes, as well as those for the Inundation field. For example, the encoding for these three fields is invariably null for all 104 records in the Runups Table associated with the 26-12-2004 wave events arising from the Sumatran and related earthquakes in east Asia.
The NOAA-NGDC Tsunami Database is clearly in the public domain and can be distributed without problem subject to the fair-quotation of the USG as a provider in whole or part of the data. Given that these data can be accessed via the NOAA-NGDC IMS server indicated earlier or that UNGIWG could access the tabular database directly from NOAA-NCDC, there is no LOE associated with the processing of the Tsunami Database. However, neither the periodicity nor immediacy of any updates which may be available for this database could be determined.
As discussed in Section 9.4, the predictive modelling of an actual tsunamigenic event based on some triggering seismic activity is complex. Figure 9.4.2 provides an overview of the seismic events related to the 26-12-2004 Indian Ocean tsunami and highlights some of the difficulties involved with the modelling of tsunamigenic events occurring from either a single or series of earthquake events. In this graphic, scenes from an animation produced to describe the event by the Active Fault Research Center of the Japanese National Institute of Advanced Industrial Science and Technology were georegistered and integrated with earthquake and bathymetric data presented previously in the inventory. This was done in part because the runup records in the NOAA-NGDC tsunami database do again not contain valid UTC time attributes, but also to highlight two factors with regard to the modelling of tsunamigenic events:
1) a simple radial projection rippling out from the epicentre of an earthquake will not always be representative of the origin, direction or areas potentially impacted by any resulting tsunami; and,
2) the modelling of such events is still in its relative infancy with results which are currently more suitable for depictive rather than predictive representations of an actual event.
These factors can be seen in Figure 9.4 where earthquakes to the north of the primary magnitude 8.9 quake off the west coast of Northern Sumatra, i.e. the fourteen after-quakes of greater than magnitude 5.5 which occurred after and to the north of the primary along the oceanic ridge underlying the Nicobar and Andaman island chain, had not even occurred until well after the tsunamigenic was well under way. In fact, according to on-line information published in reference to the NOAA-NGDC tsunami database, prior to the 26 December 2004 tsunami, it was considered that in general due to the tectonic subduction of the Indo-Australian plate along its eastern margin beneath the Eurasian plate, “most tsunamis generated in this area are propagated toward the southwest shores of Java and Sumatra, rather than into the Indian Ocean”, (NOAA, 2005).
The potential discrepancies highlighted in Figure 9.4 and the text presented above, again serve to highlight the problems associated with the modelling of tsunamigenic events. They can however, be explained if the triggering event of the tsunami affecting Thailand, India, Sri Lanka, the Maldives and Somalia was either based on:
1) A massive subsurface subsidence into the Sunda Trench and Andaman Sea occurring within minutes of the largest 8.9 magnitude primary quake occurring off the coast of Aceh, Indonesia roughly between the islands of Pulau Simeule and Sumatra very near to the convergence of the Indian, Australian, Burmese, and Sundese tectonic plates at the Sunda Oceanic Trench.
2) A combination of the significant after-quakes occurring some hours later than 00:58 UTC along the Nicobar-Andaman Islands chain, resulting in multiple tsunamis comprising a much larger event, as Indian Plate was further subducted under the overriding Burma Plate.
Figure 9.4
Issues involved with modelling tsunamigenic
events from earthquakes, an overview of the seismic events related to the
26-12-2004 Indian Ocean tsunami
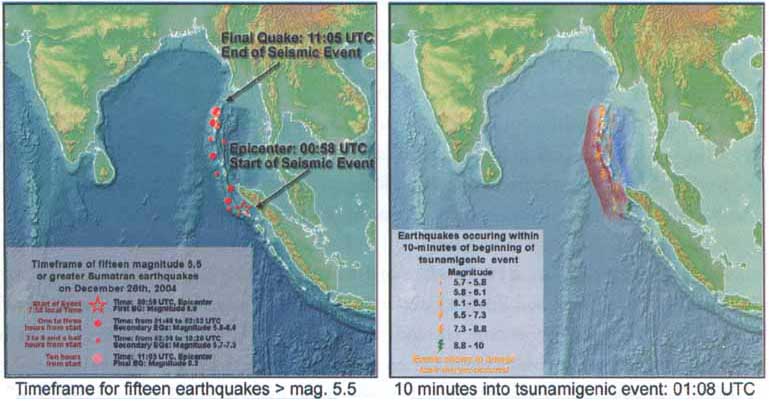
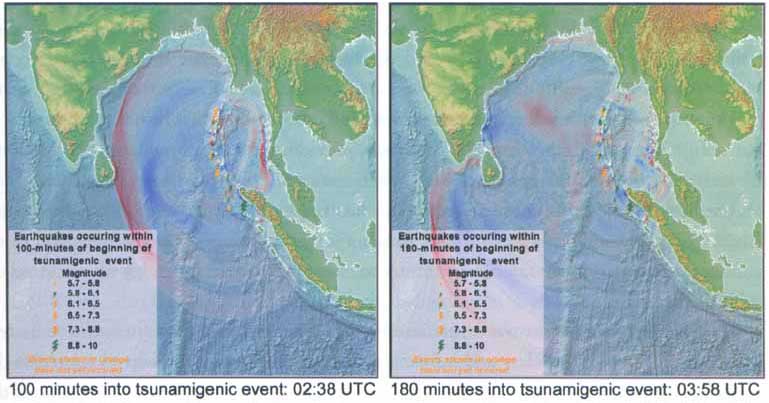
No globally or continental specific databases of Hydrogeology were identified for the inventory.
Only two primary global soils datasets were identified for the inventory. These two datasets are the ISRIC-WISE Global Soil Profile Data Set and the FAO Digital Soil Map of the World. Each of these datasets are based on collaborative efforts sponsored primarily by the Soil Resources Management and Conservation Service of the Land and Water Development Division of FAO in partnership with UNESCO, UNEP, the International Soil Reference and Information Centre (ISRIC), the International Institute for Applied Systems Analysis (IIASA) and a number of other cooperators. Additionally, each of these datasets provides a baseline for a fairly extensive set of derivative soils and related agroecological data layers at a variety of scales. The soil attributes of the two datasets have each been harmonized based on the original legend of the 1974 FAO/UNESCO Soil Map of the World as revised in 1988 by FAO and UNESCO. Of the two datasets, the FAO data have been copyrighted, while the ISRIC data appear to be fully in the public domain. However, both datasets are available at no cost subject to a fair-quotation EULA.
In addition to the above two datasets, a more resent and as yet globally incomplete effort entitled SOTER was also identified for the inventory. The SOTER effort is also discussed below and in conjunction with an effort named WOCAT represent a coordinated attempt to consolidate the above two primary datasets.
ISRIC-WISE Global Soil Profile Dataset, www.isric.nl/ followed by selecting Soil Profile Data, is currently in version 1.1 and was released in January of 2002. This dataset contains 4 882 soil profiles from 123 countries and supersedes previous versions of the WISE dataset. The dataset is available for download directly from ISRIC and is structured as a set of related tables in MS-Access format. The georeferencing information for each profile is provided in degrees, minutes, and in some cases seconds of latitude and longitude. An elevation attribute is also in some cases specified, as are slope, aspect, landform, and a legion of soil and crop specific attributes.
In addition to the global WISE dataset, ISRIC also distributes a dataset entitled, the IGBP-DIS Soil Data Set for PedoTransfer Function Development. This dataset was last updated 1996, and contains analytical data for 131 472 soil samples based on some 20 920 profiles in a generic dBase format. However, the georeferencing information associated with each sample is limited to a country descriptor based on standard ISO encoding.
Together the above two datasets, in conjunction with ISRIC's Soil Information System (ISIS) effort to collate data and information for illustrating the soil legend related to the FAO-UNESCO Soil Map of the World, may also provide somewhat of a baseline for the geocapturing of soil and related water conservation approaches under an effort entitled the World Overview of Conservation Approaches and Technologies or WOCAT. WOCAT is again a collaborative and long-term effort being undertaken by FAO and a number of national and international institutions based partially on the interest raised in response to the 1990 ISRIC et. al., 1:10 million Global Assessment of Human-induced Soil Degradation (GLASOD) map. However, as data derived from the GLASOD map have been largely superseded by more intensive efforts to place people on the landscape and attempts to marry the social and environmental sciences, (see Section 13 Agricultural and Economic Productivity), it is perhaps more important to introduce the available polygonal soil databases which represent a major spatial data component to any such composite analyses before returning to a brief discussion of WOCAT.
Soils data are a key determinate of environmental sustainability and agricultural suitability. These data therefore often represent a baseline geophysical dataset applicable across a cross-cutting range of studies including: agro-ecological zoning, land use planning, assessments of crop suitability and production, the potential spread of pollutants, and as an economic indicator of sustainability and poverty alleviation. However, only one globally consistent dataset of soils was identified for the inventory.
The FAO 1:5 million scale Digital Soil Map of the World
This FAO dataset is at a 1:500 000 scale Digital Soil Map of the World or DSMW, www.fao.org/landandwater/agll/dsmw.stm. The DSMW is based on the FAO/UNESCO Soil Map of the World and versions of this dataset are available in both vector and raster formats. The Digital Soil Map of the World was produced by FAO and UNESCO in partnership with UNEP and again a number of other institutional collaborators. The most recent version of the dataset is currently DSMW v3.6 published in early 2003. This latest version includes many encoding attributes suitable for use as either a direct analytical input or for the creation of derivative spatial data layers. The data are expressed as decimal degrees based on a geographic projection and a spherical datum. The scale of both the original map and the vector-formatted data is 1:500 000. For the raster versions of the dataset, a cell size of 5 arc-minutes (10 km at the equator) was chosen as representative for these data. The data are broken into ten individual datasets covering: Africa, North America, Central America, Europe, Central and Northeast Asia, Far East, Southeast Asia, and Oceania.
The LOE associated with processing these data into a single global coverage are not expected to exceed two days. However, regional differences in the encoding between the separates and the extensive programming routines accompanying FAO’s CD-ROM distribution may make such processing inappropriate for any data other than analytically specific outputs. According to the descriptive information accompanying the distribution CD-ROM, the QuickBASIC interpretation programmes and related data files enable users to interpret these data “in terms of agronomic and environmental parameters such as pH, organic carbon content, C/N ratio, clay mineralogy, soil depth, soil and terrain suitability for specific crop production, soil moisture storage capacity and soil drainage class”, (FAO-UNESCO, 2003). This database provides a baseline for many of the datasets or layers discussed under Section 13 of this report.
Global and regional Soil and Terrain (SOTER) databases
In order to facilitate the global modelling of agricultural potential, climate change, runoff, and related topical analyses the Soil Resources Management and Conservation Service of the FAO Land and Water Development Division produced a harmonized and consistent world soils dataset based on the DSMW at the scale of 1:250 000. The dataset is entitled, the World Soil Resources Map, and was produced in collaboration with UNEP, ISRIC, IIASA, the European Soil Bureau and National Soil Institutes.
Although, this global dataset will find numerous applications with global modellers, it represents only an interim output in regards to a longer term and more exhaustive effort to map soils globally according to a standard methodology at resolutions greater than, or at least equal to, 1:500 000. This effort has been termed SOTER for Soil and Terrain Databases. In addition to standardizing the methods and potentially increasing the resolution of baseline soil units, a further component of the SOTER exercise is to capture information pertaining to both potential soil degradation and sustainable agro-ecological suitability. The SOTER initiative is being promoted by FAO, UNEP, the International Union of Soil Science (IUSS), and the ISRIC. The original proposal for the effort targeted a scale of 1:100 000 for the global mapping; however, constraints and other factors have combined for the adoption of a more flexible approach regarding scale.
Although a more up-to-date report regarding the status of the SOTER effort could not be determined within the timeframe of the inventory, Table 9.6.2 represents the status and scale for the regional outputs resulting from the SOTER effort. In addition to these regional outputs, ISRIC also has access to some country specific soils datasets. These datasets are generally represented at scales larger than those either published or expected for the regional compilations listed in this table. The distribution of these data may however, be limited to national clients.
Table 9.6.2
Status of regional SOTER Soils and Terrain
compilations
|
Regional SOTER Dataset |
Scale |
Availability |
|
Soil and Terrain Database for Northeastern Africa |
1:1 M |
|
|
Soil and Terrain Database for Latin America and Caribbean |
1:5 M |
|
|
Soil and Physiographic Database for North and Central Eurasia |
1:5 M |
|
|
Soil and Terrain Database for Central and Eastern Europe |
1:2.5 M |
|
|
Soil and Terrain Database for Southern Africa |
1:2 M |
|
|
Soil and Terrain Database for Western Europe |
1:5 M |
pending |
|
Soil and Terrain Database for North Africa |
1:5 M |
not determined |
|
Soil and Terrain Database for West Africa |
1:5 M |
pending |
|
Soil and Terrain Database for Central Africa |
1:5 M |
not determined |
|
Soil and Terrain Database for Southeast Asia |
1:5 M |
pending |
|
Soil and Terrain Database for Middle East |
1:5 M |
not determined |
The SOTER databases are published and/or released under a non-restrictive copyright, subject to a fair-quotation EULA. More complete information, including the potential downloading of datasets, regarding the SOTER and other soils datasets discussed above can be obtained via the FAO Land and Water Development Division’s Web site at www.fao.org/ag/agl/agll/soter.stm, or from the ISRIC via www.isric.nl/.
WOCAT was briefly introduced in Section 9.6.1 and represents a network of soil and water conservation (SWC) specialists coordinated under the WOCAT Secretariat, www.wocat.net. The mission of WOCAT is to develop tabular toolsets which provide SWC specialists with a consistent format to share their knowledge of SWC techniques and technologies globally to a cross-sectoral user base concerned with sustainable land management practices. In addition to its effort to place people on the landscape in relation to more sustainable soil and land management practices, WOCAT is included in the inventory due to its addition of a geospatial component in its toolsets. Although, users can integrate their own map data in the WOCAT toolset, it is recommended that users adopt map units based on methodologies, and possibly data, developed for the SOTER effort discussed previously. The WOCAT manual states that “physiographic” maps conforming to the SOTER method have been prepared: at 1:500 000 for Asia, Latin America, and in draft for Africa; and at 1:2.5 million for Central and Eastern Europe, (FAO-WOCAT 2004). The source for these data may be the SOTER databases discussed above. However, no such continental databases were contained on the 2004 revision of the WOCAT CD-ROM, and none were available for download via the WOCAT Web site.
|
[20] GEBCO operates under the
auspices of the International Hydrographic Organization (IHO) and the UNESCO
Intergovernmental Oceanographic Commission (IOC). [21] The Globe DEM effort is equated with the GTop030 for the sake of brevity, but has resulted in a different data product containing potentially more diverse input data sources, quality checks, and outputs. Globe was developed by an international group of specialists, cooperating with the Committee on Earth Observation Satellites Working Group on Information Systems and Services, and the International Geosphere-Biosphere Programme's Data and Information System and Working Group IV/6 (NOAA, 1999). [22] The standard dimensions of each SRTM-3 tile contain 1201 lines and 1201 samples. The rows at the north and south edges, as well as, the columns at the east and west edges are identical to the edge rows and columns in the adjacent tiles with one pixel of overlap. [23] Optionally, the user could complete a full EOS-Gateway request to have the data loaded into a user/request specific FTP location, in a 32-bit signed HGF format that can be treated as a BIL file. However, attempts to import these signed 32-bit data directly into the ESRI Grid format were not initially successful. [24] The text in this subsection draws heavily on information contained in the metadata documentation accompanying USGS-AGI Global GIS, (USGS-AGI, 2003). [25] A comprehensive global and non-generalized source of current data related to plate tectonics, faults and oceanic trenches could not be identified within the timeframe of the inventory but likely exists within the USGS and similar institutions. |