![]()
![]()
![]()
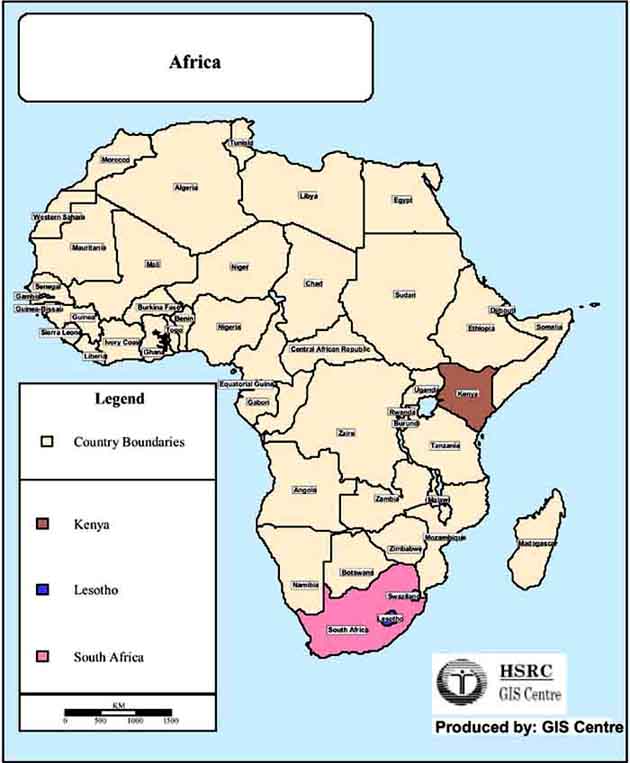
The impact of HIV/AIDS on the African region is clearly depicted in the table below which indicates the highest prevalence rate of the epidemic in the world according to the UNAIDS Report on the Global HIV/AIDS Epidemic (2000). Most of these countries are reflected in the map on the following page, drawing attention to the profound impact on the African continent. Particular attention is drawn to the countries that are the subject of this study.
As clearly articulated by Table One, countries worst affected by HIV/AIDS in the global context are predominantly African. This is a region that can least afford the direct and indirect costs associated with the epidemic as it is characterised by illiteracy, poverty and lack of access to housing, health care and nutrition. Altogether, at the end of 1999, there were 16 countries, all in Sub-Saharan Africa, in which more than one-tenth of the adult population aged 15 - 49 years were infected with HIV (Schonteich, 2001). Of these countries, Lesotho, South Africa and Kenya were the fourth, sixth and ninth worst affected in the world respectively. The ranking of the countries according to prevalence of HIV shows that the eight highest rates of infection are in the SADC region, including South Africa and Lesotho, which carries the major burden of HIV/AIDS in both the Sub-Saharan Africa region and also in the world. Six countries in East Africa, starting with Kenya, and then five other countries, only one outside of Africa, follow these:
TABLE ONE: Countries worst affected by HIV/AIDS
|
HIV/AIDS estimates in countries with HIV prevalence rates > 4% of adult population, end 1999 |
||||
|
Country |
Adult Rate (%) |
Adults & Children |
Adults (15-49) |
Orphans cumulative |
|
1. Botswana |
35.80 |
290,000 |
280,000 |
66,000 |
|
2. Swaziland |
25.25 |
130,000 |
120,000 |
12,000 |
|
3. Zimbabwe |
25.06 |
1,500,000 |
1,400,000 |
900,000 |
|
4. Lesotho |
23.57 |
240,000 |
240,000 |
35,000 |
|
5. Zambia |
19.95 |
870,000 |
830,000 |
650,000 |
|
6. South Africa |
19.94 |
4,200,000 |
4,100,000 |
420,000 |
|
7. Namibia |
19.54 |
160,000 |
150,000 |
67,000 |
|
8. Malawi |
15.96 |
800,000 |
760,000 |
390,000 |
|
9. Kenya |
13.95 |
2,100,000 |
2,000,000 |
730,000 |
|
10. Cen African Rep |
13.84 |
240,000 |
230,000 |
99,000 |
|
11. Mozambique |
13.22 |
1,200,000 |
1,100,000 |
310,000 |
|
12. Dijbouti |
11.75 |
37,000 |
35,000 |
7,200 |
|
13. Burundi |
11.32 |
360,000 |
340,000 |
230,000 |
|
14. Rwanda |
11.21 |
400,000 |
370,000 |
270,000 |
|
15. Cote d’Ivoire |
10.76 |
760,000 |
730,000 |
420,000 |
|
16. Ethiopia |
10.63 |
3,000,000 |
2,900,000 |
1,200,000 |
|
17. Uganda |
8.30 |
820,000 |
770,000 |
1,700,000 |
|
18. Rep. Tanzania |
8.09 |
1,300,000 |
1,200,000 |
1,100,000 |
|
19. Cameroon |
7.73 |
540,000 |
520,000 |
270,000 |
|
20. Burkina Faso |
6.44 |
350,000 |
330,000 |
320,000 |
|
21. Congo |
6.43 |
86,000 |
82,000 |
53,000 |
|
22. Togo |
5.98 |
130,000 |
120,000 |
95,000 |
|
23. Haiti |
5.17 |
210,000 |
200,000 |
74,000 |
|
24. DRC |
5.07 |
1,100,000 |
1,100,000 |
680,000 |
|
25. Nigeria |
5.06 |
2,700,000 |
2,600,000 |
1,400,000 |
|
26. Gabon |
4.16 |
23,000 |
22,000 |
8,600 |
|
27. Bahamas |
4.13 |
6,900 |
6,800 |
970 |
|
28. Cambodia |
4.04 |
220,000 |
210,000 |
13,000 |
Source: UNAIDS cited in Louwenson & Whiteside, 2001
The main consequence of the impact of HIV/AIDS in these affected countries is the reversal of the social and economic progress made during the last few decades, coupled with the serious negative impact both on households and organisations focused on development interventions. This is because infection with HIV will certainly result in AIDS-related death, whether soon after infection or several years later. This ensures that the epidemic will have an impact on the demographic structure of countries and communities (Haacker, 2002). AIDS-related mortality is leading to plummeting life expectancy and climbing infant and child mortality rates, with life expectancy at birth falling to less than 1950’s levels in highly affected countries. The demographic consequences of HIV/AIDS are clearly depicted in the table below:
TABLE TWO: Life expectancy & population growth, 2010
|
-------- Life expectancy -------- |
-----Population growth----- |
||||
|
Country |
Without HIV/AIDS |
With AIDS |
Years lost |
Without AIDS |
With AIDS |
|
Namibia |
70.1 |
38.9 |
31.2 |
2.8% |
1.2% |
|
Botswana |
66.3 |
37.8 |
28.5 |
1.9% |
0.2% |
|
Swaziland |
63.2 |
37.1 |
26.1 |
3.1% |
1.7% |
|
Zambia |
60.1 |
37.8 |
22.3 |
3.1% |
2.0% |
|
Kenya |
69.2 |
43.7 |
25.5 |
1.8% |
0.6% |
|
Malawi |
56.8 |
34.8 |
22.0 |
2.2% |
0.7% |
|
South Africa |
68.2 |
48.0 |
20.2 |
1.4% |
0.4% |
Source: Fourie and Schonteich, 2001: 31
HIV/AIDS especially affects mortality rates for the working age population and, due to mother-to-child transmission, child mortality (Haacker, 2002: 5). HIV/AIDS illnesses and deaths affect people in their most productive years - those between 15 and 49 years of age (FAO, 1994). Up to 60 percent of all new HIV infections are among 15 to 24 year olds, with female members of the population outnumbering the male members by a ratio of two-to-one in that population group (Balyamujura et al, 2000: 9). In Sub-Saharan Africa, 55 percent of the infections occur among women (Collins and Rau, 2000: 1), the only region in the world where female infection rates are higher than among men (Walker, 2002: 7).
Increased deaths, fewer births and reduced fertility will slow or potentially reverse population growth particularly in southern Africa (Collins and Rau, 2001: 1; Louwenson and Whiteside, 2001: 7). As a result of HIV/AIDS, Sub-Saharan Africa will have 71 million fewer people by 2010 and the increase in widows, widowers and orphans will expand dependency.
![]()
![]()
![]()