![]()
![]()
![]()
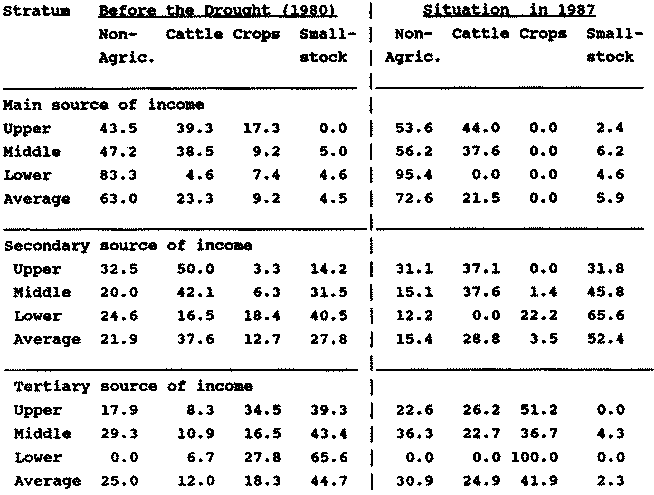
Sources of household income
32. Rural households can be seen as multi-sector, multi-resource production units. For a proper analysis of livestock management, we first have to understand the overall household situation and strategies. The majority of households in both regions derive income from agricultural and non-agricultural activities. Nonagricultural activities (e.g. wage employment, services, construction, remittances, etc.) have important functions as necessary supplements for subsistence in general, and for increased subsistence security in times of drought. This is demonstrated in Table 3 for the Palapye region. Non-agricultural activities were the most important source of income for two-thirds to three-quarters of the households. Cattle, crops and small stock follow as main sources in order of general importance. Small-stock provided useful supplementary income during the drought of the 1980s. Income from crop production was very limited even before the drought. Thus, a picture emerges of two leading economic activities (non-agriculture and cattle) supported and supplemented by small stock and crop production.
33. Table 3 shows clear stratum-related differences in terms of the diversity of income sources and stability over time. The upper stratum has a relatively reliable mix of income sources with primary income coming from cattle and non-agricultural activities, and secondary ones from cattle and small stock. On the other end, the lower stratum primarily depends on nonagricultural activities, and crop production as a secondary source. For the lower stratum, the latter source in particular has been subject to wide variations over the years. The middle stratum holds an intermediate position. Finally, it is important to note that the upper stratum is usually also most active and successful in crop and small stock production. Table 4 presents data, among others, on the size of livestock holdings, average crop yields and small stock flock size (Palapye) by stratum.
34. What are the general implications of socio-economic stratification for households' options to adjust to land pressure? Stratification is found to be positively related to ownership of transport and equipment such as boreholes and tractors (Table 4). This finding confirms that adjustment opportunities to mounting land pressure as discussed above, are generally more feasible for the upper stratum. Furthermore, there is a (defined) positive relationship between strata and cattle as the main source of rural wealth. Around 45% of the households do not hold cattle; another 25% have too few animals to raise cash or to use own draught power without negative impacts on their herd (Arntzen, 1989).
Table 3. Household income by sector and stratum in Palapye
Note: Rows add up to 100% for each year; non-agric. = nonagricultural income.
Source: Arntzen (1989).
These households will find it very difficult to meet basic needs and face a highly insecure economic situation. They are therefore likely to adopt a short-term survival strategy.
Table 4. Selected characteristics by stratum and region, 1980 and 1987
|
Region and Characteristic |
Socio-economic Stratum |
Average |
||||
|
Upper |
Middle |
Lower |
||||
|
Kgatleng (1980): |
||||||
|
|
Average herd size |
41 |
19 |
0 |
28.2 |
|
|
|
% of borehole owners |
27 |
6 |
0 |
16.2 |
|
|
|
Average cultivated area (ha./hh.) |
5.3 |
4.2 |
1.7 |
4.5 |
|
|
|
% of tractor owners |
6 |
0 |
0 |
2.1 |
|
|
|
Average yields (kg./hh) |
833 |
252 |
91 |
413 |
|
|
|
% of female-headed hh. |
18 |
18 |
31 |
23 |
|
|
Palapye Region (1987): |
||||||
|
|
Average herd size |
|
|
|
|
|
|
|
|
a. cattle |
85 |
18 |
0 |
28.6 |
|
|
|
b. goats |
28 |
16 |
8 |
14.9 |
|
|
% of borehole owners |
13 |
0 |
0 |
2.8 |
|
|
|
% of well owners |
46 |
54 |
0 |
44.6 |
|
|
|
Average cultivated Area (ha./hh.) |
6.1 |
3.6 |
2.5 |
3.6 |
|
|
|
% of tractor owners |
37 |
0 |
1 |
4.3 |
|
|
|
Average yields (kg/hh) |
59 |
48 |
6 |
35 |
|
|
|
% of hh. with transport |
93 |
60 |
17 |
43 |
|
|
|
% of hh. with fields |
98 |
99 |
94 |
98 |
|
|
|
% of hh. with goats |
98 |
85 |
52 |
75 |
|
Note: hh. = household.
Sources: Opschoor (1981); Arntzen (1989).
Herd holding and livestock management
35. There is no evidence that regional differences in stocking rates have influenced household involvement in livestock production, or the size of the average herd holding by households. In both regions, roughly 45 to 50% of the rural households do not hold any cattle. The average herd size is just under 30 in both regions. Although goats have a comparative advantage in degraded areas, we did not find a significant difference in the size of goat holdings in the two regions (Arntzen, 1989). The size of goat holding was found to be positively related to socio-economic stratification. Nonetheless, small stock do offer additional income opportunities to households with no cattle (Table 4). Opschoor (1981) estimated that 32% of the lower stratum households keep small stock in Kgatleng; in Palapye, the corresponding figure was 52%.
36. Overstocking could be an incentive for increased sales of cattle. This was not confirmed by our data. Off-take proved to be positively related to stratification, the upper stratum selling more frequently and in larger numbers. Cash needs are the most frequent reason for selling in both regions. Marketed offtake rates greatly fluctuate within regions and between years.
37. Livestock management in Botswana typically involves some herding and a prudent fallback strategy to secure year-round water for livestock. Apart from watering costs, cash expenditures are generally limited. Table 5 summarises management practices found in the study regions. The differences in herding practices between the two regions are not large. On the other hand, feeding practices show large differences. In the Palapye region, 44.5% of the livestock holders gave fodder to their livestock, compared with only 10.3% in Kgatleng in 1980 - i.e. prior to the drought. The difference can probably be attributed to government subsidies for fodder in 1987 - a drought year. The necessity to provide fodder appears to have been at the expense of other inputs such as salt and bonemeal. Proper fences have the advantage of private use of crop residues or grass inside the fence. In Palapye region, an estimated 23.8% of the crop producers use the residues for their own cattle only. No comparable data are available for Kgatleng.
Table 5. Selected livestock management practices by region (% of cattle holders)
|
Management Practices |
Kgatleng |
Palapye |
|
|
(1980) |
(1987) |
||
|
Location: |
|||
|
|
Cattlepost |
53.8 |
54.6 |
|
|
Mixed farming area |
46.2 |
45.4 |
|
Herding practices: |
|||
|
|
Permanent herding |
9.0 |
11.2 |
|
|
Hiring labour |
19.2 |
26.2 |
|
|
Movement of cattle |
n.a. |
10.1 |
|
Feeding practices: |
|||
|
|
Salt and bonemeal |
31.6 |
8.9 |
|
|
Fodder |
10.3 |
44.5 |
|
|
Private use of crop residues |
n.a. |
23.8 |
Source: Arntzen (1989).
38. Management practices are generally positively related to stratification. The upper stratum employs more varied management practices and more hired labour than the average livestock holder. For example, in Palapye, the upper stratum households hired labour more frequently (64.4% versus the average of 26.2%), were able to provide permanent herding more frequently (28.5% versus 11.2%) and gave fodder more regularly (68.5% versus 44.5%). Fodder subsidies thus benefit the upper stratum mostly. The upper stratum also makes better.
39. The surveys showed interesting differences in livestock watering due to different physical conditions both within and between the two regions. For example, in eastern Kgatleng, 90% of the farmers get their water supply for livestock from a river throughout the year (free of charge). Elsewhere in the region, livestock holders rely on costly boreholes, particularly during the dry season. In Palapye in contrast, 94% of the livestock holders use wells. These differences have an important implication for access to groundwater and subsequently to the surrounding grazing areas. In Palapye region, the majority of the middle stratum (54%) has guaranteed access to groundwater as compared to 6% in the Kgatleng region. As a result, the positive relationship between ownership of groundwater and strata, which was found in Kgatleng and which is typical for Botswana as a whole, does not hold for the Palapye region. In Palapye, access to groundwater and rangelands is less skewed. This finding is of particular importance because livestock holders presently consider lack of grass the main constraint to livestock development. Opschoor (1981) found that grass had become the most common constraint in Kgatleng: subsequent surveys in the same district as well as in the Palapye region confirmed this finding. Apparently, farmers are better able to resolve water problems than grazing ones.
40. In order to ascertain the impact of drought on livestock development, we asked livestock holders in Palapye region to compare pre-drought conditions (1981) with those prevailing during the 1987 (drought year) field-work. Although grazing conditions had deteriorated substantially, they were already far from good in 1981. Whilst in 1987 93% of the livestock holders judged rangelands to be in bad shape, the majority of farmers (55%) considered the availability of grazing to have been already poor in 1981. From this, we may conclude that inadequate grazing is a structural problem but also one which is occasionally enhanced by droughts.
![]()
![]()
![]()