![]()
![]()
![]()
Some of the results of the fishing experiments are commented on below. One should note, however, that most of the fishing forms part of a programme for “swept area” biomass estimation, and for this purpose the trawl stations are positioned in advance more or less randomly and with no intention of obtaining high catch rates. The catch rates thus do not simulate those of a commercial fishery.
All catches were sampled for composition in weight and numbers by species and size sampling was made of important species, using total length. The complete records of fishing stations are shown in ANNEX II.
The fish fauna on the shelf north of Benguela belongs to the Angola Current regime and is more diversified than that further south. A partition in an inner shelf down to 70 ml depth and an outer shelf 70 - 120 m shows assemblages of demersal fish dominated by grunts on the inner- and seabreams on the outer shelf. In addition comes the slope with the hake and the deep sea shrimps.
Benguela-Palmeirinhas
Table 1 shows the catch rates standardized to kg/hour for the main groups of resources on the two parts of the shelf and the slope. Both for the inner- and the outer shelf the highest catch rates were obtained up to about stations 70 which in a very general way indicates that the highest availability of fish was found from Benguela to Pta do Morro. The pelagic and demersal groups will be analysed further below. For Cephalopods the highest catch rates were obtained on the outer shelf and down to about 150 m on the slope. 70% of the catch was shortfin squid Illex coindetii of 12-13 cm mantle length, see ANNEX I and about 20% small sized African squid Alloteuthis africana. Catch rates up to 37 kg/hour were obtained for deepwater rose shrimp Parapenaeus longirostris and up to 17 kg/hour for the striped red shrimp Aristeus varidens. The spider shrimp Nematocarcinus africanus caused the high rate of station 85.
Table 2 shows the catch rates of the pelagic species by families from the two parts of the shelf. These data are not very meaningful as indices of abundance of these types of fish, but they give an indication of the availability of the various forms. Clupeids were hardly caught by bottom trawl. 70 % of the Carangid catches from the inner shelf consisted of lookdown, Selene dorsalis, for size compositions see ANNEX I. The bumper represented 20% of the catches and the remainder was mainly horse mackerel and false scad. Nearly 100% of the Carangid catches from the outer shelf was Cunene horse mackerel dominated by small sized fish as discussed above. The hairtails, most common on the inner shelf were generally of large size, in some hauls unusually large. About 60% of the barracudas were the guachanche species Sphyraena guachancho with S. spyraena making out the rest, see size compositions ANNEX I. Again the highest catch rates were made on the inner shelf probably as for the hairtails an effect of their role as predators on the aggregations of smaller fish there.
Table 1. Benguela to Pta das Palmeirinhas. Catch rates by main groups in bottom trawl hauls, standardized to kg/hour.
INNER SHELF
|
ST. NO. |
DEP. |
Pelagic |
Demersal |
Sharks |
Cephalopod |
Other |
|
37 |
39 |
11.8 |
11.3 |
|
|
61.0 |
|
38 |
50 |
217.1 |
718.9 |
|
|
18.1 |
|
40 |
44 |
692.7 |
495.2 |
|
2.2 |
39.8 |
|
46 |
53 |
451.2 |
238.8 |
|
|
58.4 |
|
47 |
41 |
23.7 |
164.6 |
|
6.0 |
14.0 |
|
53 |
70 |
187.8 |
68.6 |
|
12.6 |
8.5 |
|
54 |
20 |
2.0 |
9.6 |
|
|
273.0 |
|
55 |
63 |
106.5 |
1.0 |
|
5.7 |
18.5 |
|
62 |
28 |
13.0 |
21.5 |
5.2 |
|
9.0 |
|
63 |
29 |
161.8 |
372.4 |
|
|
44.8 |
|
64 |
30 |
1587.6 |
1080.0 |
|
|
486.0 |
|
65 |
18 |
6.4 |
60.0 |
|
|
4378.0 |
|
69 |
35 |
1987.8 |
700.6 |
5.0 |
|
90.0 |
|
71 |
25 |
50.3 |
57.5 |
|
0.0 |
5.9 |
|
72 |
42 |
387.1 |
|
|
|
9.4 |
|
77 |
28 |
8.2 |
18.7 |
|
|
38.0 |
|
78 |
48 |
11.1 |
6.4 |
|
0.3 |
29.2 |
|
81 |
65 |
41.3 |
3.9 |
|
2.0 |
3.5 |
|
82 |
18 |
56.2 |
52.0 |
|
|
6.8 |
|
83 |
36 |
112.8 |
928.2 |
2.4 |
|
10.3 |
|
88 |
34 |
27.4 |
|
|
0.1 |
4.4 |
|
89 |
16 |
80.1 |
31.2 |
|
|
8.0 |
|
90 |
45 |
92.2 |
16.2 |
|
0.0 |
4.0 |
|
98 |
16 |
|
8.6 |
|
|
|
|
99 |
61 |
242.0 |
1684.3 |
|
|
3.4 |
|
105 |
53 |
63.4 |
5.5 |
|
0.4 |
3.8 |
|
MEAN |
|
254.7 |
259.8 |
0.4 |
1.1 |
216.3 |
|
ST. NO. |
DEP. |
Pelagic |
Demersal |
Sharks |
Cephalopod |
Other |
|
39 |
105 |
|
555.2 |
|
|
10.0 |
|
41 |
94 |
189.0 |
690.8 |
|
|
24.6 |
|
42 |
103 |
30.6 |
476.7 |
|
|
43.3 |
|
44 |
97 |
77.0 |
49.9 |
|
4.3 |
12.0 |
|
45 |
82 |
292.4 |
434.6 |
|
11.2 |
7.8 |
|
48 |
77 |
142.2 |
12.9 |
|
2.0 |
6.0 |
|
52 |
100 |
199.5 |
106.1 |
|
4.2 |
8.0 |
|
56 |
84 |
471.7 |
512.0 |
|
21.0 |
5.9 |
|
58 |
117 |
74.0 |
37.7 |
|
1.1 |
57.9 |
|
60 |
111 |
39.0 |
108.2 |
|
6.6 |
5.2 |
|
61 |
90 |
356.8 |
128.4 |
|
|
20.4 |
|
66 |
113 |
45.9 |
56.2 |
|
0.7 |
203.8 |
|
68 |
120 |
8.4 |
15.4 |
|
11.0 |
181.9 |
|
70 |
77 |
26.0 |
14.8 |
|
0.1 |
6.0 |
|
73 |
84 |
58.6 |
273.6 |
|
|
1.9 |
|
79 |
84 |
12.4 |
148.8 |
|
49.8 |
1.5 |
|
80 |
101 |
52.9 |
60.6 |
4.4 |
5.2 |
2.3 |
|
86 |
110 |
34.6 |
2.3 |
|
5.4 |
12.9 |
|
87 |
85 |
145.2 |
123.8 |
|
3.4 |
2.2 |
|
91 |
86 |
69.4 |
32.4 |
|
28.0 |
2.0 |
|
92 |
108 |
269.6 |
134.6 |
18.0 |
24.0 |
6.8 |
|
93 |
78 |
102.0 |
540.6 |
7.4 |
22.2 |
41.8 |
|
96 |
121 |
0.1 |
27.8 |
|
38.3 |
1.6 |
|
97 |
75 |
32.4 |
32.6 |
|
3.3 |
9.1 |
|
100 |
103 |
389.4 |
15.5 |
|
15.2 |
59.5 |
|
104 |
86 |
52.4 |
20.5 |
|
25.5 |
2.6 |
|
MEAN |
|
122.0 |
177.3 |
1.1 |
10.8 |
28.3 |
INNER SHELF
|
ST. NO. |
DEP. |
Clupeids |
Carangids |
Hairtails |
Barracudas |
Scombrids |
Other |
|
37 |
39 |
|
5.3 |
5.4 |
1.0 |
|
72.3 |
|
38 |
50 |
|
66.4 |
148.5 |
|
|
739.2 |
|
40 |
44 |
|
24.0 |
666.8 |
|
|
539.1 |
|
46 |
53 |
|
2.4 |
446.4 |
|
|
299.6 |
|
47 |
41 |
|
6.0 |
10.5 |
6.5 |
|
185.3 |
|
53 |
70 |
|
120.8 |
67.0 |
|
|
89.7 |
|
54 |
20 |
|
2.0 |
|
|
|
282.6 |
|
55 |
63 |
|
16.2 |
59.0 |
25.6 |
|
30.9 |
|
62 |
28 |
|
13.0 |
|
|
|
35.7 |
|
63 |
29 |
|
20.0 |
|
138.8 |
3.0 |
417.2 |
|
64 |
30 |
|
513.0 |
|
804.6 |
|
1836.0 |
|
65 |
18 |
|
6.4 |
|
|
|
4438.0 |
|
69 |
35 |
2.0 |
1180.0 |
804.0 |
1.8 |
|
795.6 |
|
71 |
25 |
0.3 |
35.7 |
9.3 |
4.9 |
|
63.6 |
|
72 |
42 |
7.0 |
147.7 |
232.4 |
|
|
9.4 |
|
77 |
28 |
0.0 |
1.2 |
|
6.0 |
0.9 |
56.7 |
|
78 |
48 |
|
5.9 |
1.4 |
3.8 |
|
35.9 |
|
81 |
65 |
1.7 |
11.5 |
27.2 |
0.9 |
|
9.5 |
|
82 |
18 |
0.5 |
44.2 |
|
6.9 |
4.6 |
58.8 |
|
83 |
36 |
0.6 |
43.2 |
31.2 |
24.6 |
|
954.1 |
|
88 |
34 |
|
17.6 |
0.0 |
8.2 |
1.4 |
4.7 |
|
89 |
16 |
0.1 |
68.5 |
|
1.5 |
10.0 |
39.2 |
|
90 |
45 |
|
50.7 |
20.3 |
17.8 |
3.4 |
20.2 |
|
98 |
16 |
|
|
|
|
|
8.6 |
|
99 |
61 |
|
61.8 |
180.2 |
|
|
1687.7 |
|
105 |
53 |
2.8 |
56.4 |
4.2 |
|
|
9.7 |
|
MEAN |
|
0.5 |
96.9 |
104.3 |
40.5 |
0.9 |
489.2 |
|
ST. NO. |
DEP. |
Clupeids |
Carangids |
Hairtails |
Barracudas |
Scombrids |
Other |
|
39 |
105 |
|
|
|
|
|
565.2 |
|
41 |
94 |
|
176.4 |
10.0 |
|
2.6 |
715.4 |
|
42 |
103 |
|
18.0 |
12.6 |
|
|
520.0 |
|
44 |
97 |
|
72.9 |
|
|
4.0 |
66.2 |
|
45 |
82 |
|
144.4 |
144.6 |
|
3.4 |
453.6 |
|
48 |
77 |
|
|
140.4 |
1.8 |
|
20.9 |
|
52 |
100 |
|
199.5 |
|
|
|
118.3 |
|
56 |
84 |
|
471.7 |
|
|
|
539.0 |
|
58 |
117 |
|
74.0 |
|
|
|
96.7 |
|
60 |
111 |
|
39.0 |
|
|
|
120.0 |
|
61 |
90 |
|
313.6 |
43.2 |
|
|
148.8 |
|
66 |
113 |
|
45.6 |
0.3 |
|
|
260.8 |
|
68 |
120 |
|
1.4 |
7.0 |
|
|
208.3 |
|
70 |
77 |
|
1.2 |
24.8 |
|
|
20.9 |
|
73 |
84 |
0.2 |
38.0 |
20.4 |
|
|
275.5 |
|
79 |
84 |
|
6.8 |
|
|
5.6 |
200.1 |
|
80 |
101 |
0.1 |
52.4 |
|
|
0.4 |
72.6 |
|
86 |
110 |
|
22.0 |
|
|
12.6 |
20.6 |
|
87 |
85 |
0.8 |
142.4 |
|
|
2.0 |
129.4 |
|
91 |
86 |
0.0 |
69.4 |
|
|
|
62.4 |
|
92 |
108 |
|
263.4 |
|
|
6.2 |
183.4 |
|
93 |
78 |
|
102.0 |
|
|
|
612.0 |
|
96 |
121 |
|
0.1 |
|
|
|
67.7 |
|
97 |
75 |
|
|
30.4 |
0.8 |
1.2 |
45.0 |
|
100 |
103 |
|
35.8 |
353.6 |
|
|
90.2 |
|
104 |
86 |
0.8 |
49.8 |
1.8 |
|
|
48.6 |
|
MEAN |
|
0.0 |
90.0 |
30.3 |
0.1 |
1.4 |
217.7 |
Croakers and groupers made more occasional contributions to the catches. The cassava croaker Pseudotolithus senegalensis was only caught close inshore and represented 40% of the croaker catches while the canary dram Umbrina canariensis caught on the outer shelf provided 50%. The smaller grouper catches came both from the inner- and the outer shelf and consisted almost only of white grouper Epinephelus aenus.
Hake Merluccius polli was caught in the slope between 150 and 450 m with the highest catch rate 440 kg/hour at 300 m. The pooled size composition of the samples is shown in ANNEX I.
Table 4 shows the swept area estimates of mean densities by species and depth strata, based on 60 successful random bottom trawl hauls made. The bigeye grants dominates both the 0-50 and 50-100 m bottom depth zone followed by Pomadasys jubelini and Pomadasys incisus in the shallow waters and by Dentex marcrophthalmus in the 50-100 m zone. The deeper waters are dominated by cardinal fish Synagrops microlepis. The catchability coefficient applied in the estimation is 1.0.
Table 3. Benguela to Pta das Palmeirinhas. Catch rates of main demersal families in bottom trawl hauls, standardized to kg/hour.
INNER SHELF
|
ST. NO. |
DEP. |
Seabreams |
Grunts |
Croakers |
Groupers |
Hake |
Other |
|
37 |
39 |
9.9 |
1.3 |
|
|
|
72.8 |
|
38 |
50 |
34.9 |
670.4 |
13.5 |
|
|
235.2 |
|
40 |
44 |
70.4 |
419.2 |
3.0 |
2.6 |
|
734.7 |
|
46 |
53 |
20.0 |
218.8 |
|
|
|
509.6 |
|
47 |
41 |
28.6 |
100.0 |
|
36.0 |
|
43.7 |
|
53 |
70 |
0.8 |
67.8 |
|
|
|
208.9 |
|
54 |
20 |
|
9.6 |
|
|
|
275.0 |
|
55 |
63 |
1.0 |
|
|
|
|
130.8 |
|
62 |
28 |
3.8 |
17.0 |
|
0.7 |
|
27.2 |
|
63 |
29 |
|
354.4 |
18.0 |
|
|
206.6 |
|
64 |
30 |
27.0 |
853.2 |
199.8 |
|
|
2073.6 |
|
65 |
18 |
60.0 |
|
|
|
|
4384.4 |
|
69 |
35 |
|
668.8 |
31.8 |
|
|
2082.8 |
|
71 |
25 |
|
57.5 |
|
|
|
56.4 |
|
72 |
42 |
|
|
|
|
|
396.5 |
|
77 |
28 |
|
18.7 |
|
|
|
46.2 |
|
78 |
48 |
2.8 |
3.6 |
|
|
|
40.6 |
|
81 |
65 |
3.7 |
0.2 |
|
|
|
46.9 |
|
82 |
18 |
|
52.0 |
|
|
|
63.0 |
|
83 |
36 |
14.0 |
906.0 |
8.2 |
|
|
125.5 |
|
88 |
34 |
|
|
|
|
|
32.0 |
|
89 |
16 |
|
31.2 |
|
|
|
88.1 |
|
90 |
45 |
4.8 |
11.4 |
|
|
|
96.2 |
|
98 |
16 |
|
|
|
8.6 |
|
|
|
99 |
61 |
|
1670.4 |
|
13.9 |
|
245.4 |
|
105 |
53 |
5.5 |
|
|
|
|
67.6 |
|
MEAN |
|
11.0 |
235.8 |
10.5 |
2.3 |
|
472.7 |
|
ST. NO. |
DEP. |
Seabreams |
Grunts |
Croakers |
Groupers |
Hake |
Other |
|
39 |
105 |
435.2 |
|
120.0 |
|
|
10.0 |
|
41 |
94 |
662.8 |
1.6 |
26.4 |
|
|
213.6 |
|
42 |
103 |
436.2 |
|
37.5 |
3.0 |
|
73.9 |
|
44 |
97 |
49.9 |
|
|
|
|
93.3 |
|
45 |
82 |
371.6 |
59.2 |
2.4 |
1.4 |
|
311.4 |
|
48 |
77 |
5.0 |
4.1 |
3.8 |
|
|
150.2 |
|
52 |
100 |
105.6 |
|
0.5 |
|
|
211.7 |
|
56 |
84 |
494.3 |
11.3 |
6.4 |
|
|
498.6 |
|
58 |
117 |
33.1 |
|
3.4 |
1.2 |
|
133.0 |
|
60 |
111 |
103.6 |
|
|
4.6 |
|
50.8 |
|
61 |
90 |
16.4 |
112.0 |
|
|
|
377.2 |
|
66 |
113 |
16.8 |
|
38.2 |
|
1.2 |
250.5 |
|
68 |
120 |
15.4 |
|
|
|
|
201.3 |
|
70 |
77 |
0.4 |
14.4 |
|
|
|
32.1 |
|
73 |
84 |
5.0 |
267.6 |
1.0 |
|
|
60.5 |
|
79 |
84 |
10.2 |
138.0 |
0.6 |
|
|
63.7 |
|
80 |
101 |
0.6 |
60.0 |
|
|
|
64.9 |
|
86 |
110 |
2.3 |
|
|
|
|
52.9 |
|
87 |
85 |
31.4 |
53.4 |
2.4 |
36.6 |
|
150.8 |
|
91 |
86 |
28.4 |
4.0 |
|
|
|
99.4 |
|
92 |
108 |
79.6 |
|
0.9 |
54.0 |
|
318.4 |
|
93 |
78 |
441.0 |
99.6 |
|
|
|
173.4 |
|
96 |
121 |
8.6 |
19.2 |
|
|
|
40.0 |
|
97 |
75 |
20.8 |
|
1.2 |
10.6 |
|
44.8 |
|
100 |
103 |
3.5 |
12.0 |
|
|
|
464.2 |
|
104 |
86 |
20.5 |
|
|
|
|
80.6 |
|
MEAN |
|
130.7 |
32.9 |
9.4 |
4.2 |
0.0 |
162.3 |
|
ST. NO. |
DEP. |
Hake |
Seabreams |
Shrimp |
Sharks |
Cephalopod |
Other |
|
49 |
294 |
201.4 |
6.6 |
9.5 |
5.7 |
2.8 |
410.4 |
|
50 |
292 |
443.0 |
1.3 |
2.3 |
5.1 |
4.1 |
454.9 |
|
51 |
441 |
68.5 |
|
21.0 |
0.7 |
|
46.8 |
|
57 |
274 |
13.2 |
|
37.6 |
6.6 |
|
574.8 |
|
59 |
556 |
|
|
9.9 |
|
0.2 |
41.6 |
|
67 |
447 |
4.8 |
|
21.6 |
0.8 |
|
69.6 |
|
85 |
453 |
13.0 |
|
140.2 |
|
|
30.4 |
|
95 |
153 |
25.2 |
4.6 |
26.4 |
|
142.2 |
212.0 |
|
101 |
143 |
|
17.7 |
3.2 |
|
19.5 |
1980.9 |
|
103 |
269 |
9.3 |
219.9 |
6.2 |
|
3.1 |
965.6 |
|
MEAN |
|
77.8 |
25.0 |
27.8 |
1.9 |
17.2 |
478.7 |
Table 5 shows the estimated area of the shelf and the resulting biomasses for all demersal species and separately for the dominating species in each zone.
Table 5. Benguela-Palmeirinhas. Biomass estimates of groups of demersal fish by depth strata. Tonnes.
|
|
Total |
0-50m |
50-100m |
100-200m |
|
|
|
|
|
|
|
Shelf area nm |
4700 |
1750 |
1680 |
1280 |
|
Brachydeuterus |
18000 |
8000 |
10000 |
|
|
D. macrophthalmus |
6500 |
|
3500 |
3000 |
|
Pom. Jubelini |
2900 |
2400 |
500 |
|
|
Pom. Incisus |
6000 |
6000 |
|
|
|
Pagellus bellottii |
|
|
2300 |
|
|
All demersal |
61000 |
22000 |
19000 |
20000 |
In the 200-600 m bottom depth zone only 8 hauls were carried out. Dominating species were cardinal fish (Synagrops microlepis), greeneyes (Chloropthalmus atlanticus) and hake. The areal extension of this zone has been estimated to 1300 nm, and with the limitations of the few number of hauls in mind (n=8) the following biomass figures are indicated:
|
Cardinal fish |
4300 |
tonnes |
|
Greeneyes |
7500 |
tonnes |
|
Hake |
4400 |
tonnes |
Table 6 shows the catch rates by main groups for the successful hauls in the region, and divided by inner shelf, outer shelf and the slope, as above. The mean catch rate in the shallow waters of the pelagic species are reduced to less than one third of the level of the Benguela - Palmeirinhas region, indicating the considerable lower density level of the group. Likewise the catch rate of the demersal group is reduced to about half of the level further south. On the outer shelf, however, the mean catch rates are in close agreement with the results from the southern region. The pelagic species catch broken down to families, Table 7, show that the main pelagic family in the shallow waters is the clupeids (43%), followed by equal shares of carangids and hairtails (27 %). The clupeids are mainly Ilisha africana and some Sardinella maderensis, while the carangids are lookdown, bumpers and some juvenile horsemackerel. On the outer shelf the main pelagic family is the horsemackerel, almost exclusively one cohort of about 15 cm modal length. See ANNEX I on length frequency distributions. The catch rates of the clupeids on the outer shelf are negligible.
The catch rates of the main demersal families are shown in Table 8. The dominating group in the shallow waters is the grunts, mainly the bigeye grunt, Brachydeuterus auritus. Seabreams and croakers hold about equal shares in the total catch of demersal fish (25 and 27%). On the outer shelf the seabreams is the dominating group (56%), followed by grunts and croakers (23 and 16%).
Table 6. Pta das Palmeirinhas to Cabinda. Catch rates by main groups in bottom trawl hauls, standardized to kg/hour.
INNER SHELF
|
ST. NO. |
DEP. |
Pelagic |
Demersal |
Sharks |
Squid |
Shrimp |
Other |
|
114 |
64 |
214.2 |
260.9 |
|
45.0 |
|
63.8 |
|
115 |
34 |
22.0 |
98.1 |
|
11.0 |
|
15.6 |
|
120 |
17 |
228.3 |
114.0 |
|
|
3.0 |
60.7 |
|
121 |
34 |
144.0 |
106.5 |
|
|
1.8 |
37.8 |
|
125 |
56 |
12.8 |
54.8 |
|
0.2 |
|
7.0 |
|
127 |
65 |
8.9 |
16.7 |
|
9.0 |
|
8.0 |
|
128 |
64 |
18.1 |
51.9 |
9.8 |
3.8 |
|
12.2 |
|
129 |
14 |
11.4 |
1.2 |
|
2.0 |
|
7.8 |
|
136 |
13 |
141.8 |
70.1 |
1.6 |
1.0 |
|
34.0 |
|
137 |
25 |
|
39.3 |
|
1.8 |
|
15.0 |
|
138 |
41 |
1.0 |
1.0 |
|
3.2 |
|
3.2 |
|
142 |
64 |
48.0 |
199.8 |
|
|
0.0 |
1.4 |
|
143 |
44 |
33.6 |
441.8 |
5.0 |
|
7.4 |
19.2 |
|
148 |
9 |
294.9 |
316.2 |
2.1 |
|
84.0 |
94.8 |
|
149 |
44 |
2.6 |
137.2 |
|
0.6 |
0.5 |
3.8 |
|
156 |
11 |
247.4 |
140.4 |
7.6 |
|
1.3 |
79.4 |
|
157 |
16 |
93.7 |
73.0 |
6.0 |
|
1.4 |
23.6 |
|
158 |
34 |
2.9 |
42.8 |
|
|
|
2.7 |
|
159 |
30 |
5.6 |
172.2 |
6.2 |
|
|
6.8 |
|
160 |
45 |
12.2 |
173.6 |
5.6 |
6.6 |
|
5.2 |
|
171 |
55 |
1.0 |
41.6 |
8.7 |
3.2 |
|
0.2 |
|
MEAN |
|
73.5 |
121.5 |
2.5 |
4.1 |
4.7 |
23.9 |
|
ST. NO. |
DEP. |
Pelagic |
Demersal |
Sharks |
Squid |
Shrimp |
Other |
|
119 |
75 |
166.3 |
873.2 |
|
|
1.8 |
1.4 |
|
122 |
104 |
54.0 |
19.0 |
|
5.8 |
0.4 |
1007.4 |
|
130 |
75 |
17.6 |
706.0 |
2.2 |
0.5 |
|
23.5 |
|
131 |
103 |
1.5 |
44.8 |
|
7.2 |
|
5.0 |
|
132 |
125 |
0.4 |
39.5 |
|
3.0 |
|
7.6 |
|
134 |
73 |
16.2 |
543.4 |
|
|
|
15.4 |
|
135 |
87 |
1400.0 |
92.4 |
|
|
|
47.6 |
|
139 |
87 |
224.0 |
185.6 |
|
|
|
20.8 |
|
140 |
110 |
10.8 |
82.8 |
|
0.2 |
|
12.6 |
|
141 |
132 |
8.4 |
30.2 |
5.2 |
17.5 |
|
167.6 |
|
144 |
80 |
42.0 |
68.7 |
|
0.3 |
|
12.3 |
|
146 |
181 |
21.8 |
49.5 |
6.0 |
5.2 |
3.1 |
132.3 |
|
147 |
80 |
183.7 |
118.6 |
6.2 |
2.5 |
1.8 |
31.1 |
|
150 |
130 |
103.8 |
13.2 |
|
2.4 |
0.2 |
9.0 |
|
152 |
97 |
30.6 |
9.0 |
3.0 |
4.0 |
0.1 |
36.1 |
|
161 |
94 |
6.0 |
24.0 |
3.2 |
0.2 |
|
28.8 |
|
162 |
91 |
32.2 |
20.3 |
3.8 |
2.4 |
|
15.1 |
|
163 |
110 |
17.4 |
83.6 |
19.6 |
1.2 |
|
15.0 |
|
164 |
79 |
6.0 |
321.4 |
|
1.2 |
|
6.0 |
|
165 |
99 |
|
28.3 |
|
0.3 |
|
4.5 |
|
166 |
70 |
10.5 |
43.2 |
|
11.4 |
|
3.5 |
|
167 |
90 |
667.2 |
101.1 |
|
|
|
108.0 |
|
168 |
79 |
30.3 |
112.1 |
1.6 |
1.5 |
|
9.5 |
|
169 |
100 |
183.6 |
35.9 |
3.0 |
2.6 |
|
4.4 |
|
170 |
72 |
3.5 |
274.0 |
|
|
|
16.0 |
|
MEAN |
|
129.5 |
156.8 |
2.1 |
2.7 |
0.3 |
69.6 |
INNER SHELF
|
ST. NO. |
DEP. |
Clupeids |
Anchovies |
Carangids |
Hairtails |
Scombrids |
Other |
|
114 |
64 |
|
|
5.4 |
208.8 |
1.5 |
368.2 |
|
115 |
34 |
|
1.6 |
7.0 |
|
3.6 |
134.6 |
|
120 |
17 |
135.3 |
|
58.2 |
22.8 |
1.3 |
188.4 |
|
121 |
34 |
85.2 |
|
24.4 |
28.0 |
|
152.5 |
|
125 |
56 |
|
|
|
1.7 |
5.5 |
67.6 |
|
127 |
65 |
0.1 |
|
0.5 |
8.0 |
|
34.1 |
|
128 |
64 |
|
|
7.7 |
9.0 |
|
79.2 |
|
129 |
14 |
|
|
|
|
6.0 |
16.4 |
|
136 |
13 |
0.3 |
|
106.5 |
3.6 |
13.0 |
125.1 |
|
137 |
25 |
|
|
|
|
|
56.1 |
|
138 |
41 |
|
|
|
1.0 |
|
7.4 |
|
142 |
64 |
0.2 |
|
46.8 |
1.0 |
|
201.2 |
|
143 |
44 |
3.2 |
|
14.4 |
16.0 |
|
473.4 |
|
148 |
9 |
182.4 |
|
40.8 |
69.6 |
|
499.2 |
|
149 |
44 |
|
|
0.2 |
2.4 |
|
142.1 |
|
156 |
11 |
169.2 |
|
42.8 |
4.8 |
|
259.3 |
|
157 |
16 |
23.1 |
|
9.6 |
2.4 |
2.8 |
159.8 |
|
158 |
34 |
0.2 |
|
1.9 |
|
|
46.3 |
|
159 |
30 |
|
|
5.6 |
|
|
185.2 |
|
160 |
45 |
|
|
6.8 |
|
|
196.4 |
|
171 |
55 |
|
|
0.2 |
|
|
54.5 |
|
MEAN |
|
28.5 |
0.08 |
18.0 |
18.0 |
1.6 |
164.1 |
|
ST. NO. |
DEP. |
Clupeids |
Anchovies |
Carangids |
Hairtails |
Scombrids |
Other |
|
119 |
75 |
|
|
58.3 |
90.0 |
|
894.4 |
|
122 |
104 |
|
|
43.2 |
10.8 |
|
1032.6 |
|
130 |
75 |
|
|
17.6 |
|
|
732.2 |
|
131 |
103 |
0.1 |
|
1.4 |
|
|
57.0 |
|
132 |
125 |
|
|
0.4 |
0.0 |
|
50.1 |
|
134 |
73 |
4.2 |
|
5.1 |
|
|
565.7 |
|
135 |
87 |
|
|
1400.0 |
|
|
140.0 |
|
139 |
87 |
|
|
224.0 |
|
12.8 |
193.6 |
|
140 |
110 |
|
|
10.8 |
|
|
95.6 |
|
141 |
132 |
|
|
|
8.4 |
|
220.5 |
|
144 |
80 |
|
|
23.0 |
18.0 |
|
82.3 |
|
146 |
181 |
|
|
|
21.8 |
|
196.1 |
|
147 |
80 |
|
|
183.7 |
|
|
160.2 |
|
150 |
130 |
|
|
103.0 |
0.8 |
|
24.8 |
|
152 |
97 |
|
|
1.8 |
28.8 |
|
52.2 |
|
161 |
94 |
|
|
5.0 |
0.2 |
|
57.1 |
|
162 |
91 |
|
|
2.6 |
29.6 |
|
41.6 |
|
163 |
110 |
|
|
16.0 |
1.4 |
|
119.4 |
|
164 |
79 |
1.2 |
|
4.8 |
|
|
328.6 |
|
165 |
99 |
|
|
|
|
|
33.1 |
|
166 |
70 |
5.4 |
|
3.9 |
1.2 |
|
58.1 |
|
167 |
90 |
|
|
667.3 |
|
|
209.1 |
|
168 |
79 |
2.6 |
|
27.5 |
|
|
124.9 |
|
169 |
100 |
0.6 |
|
183.0 |
|
|
45.9 |
|
170 |
72 |
|
|
3.5 |
|
|
290.0 |
|
MEAN |
|
0.5 |
|
119.4 |
8.4 |
0.5 |
232.2 |
INNER SHELF
|
ST. NO. |
DEP. |
Seabreams |
Grunts |
Croakers |
Groupers |
Hake |
Other |
|
114 |
64 |
19.8 |
193.1 |
46.2 |
1.8 |
|
323.0 |
|
115 |
34 |
59.4 |
20.2 |
1.9 |
16.6 |
|
48.6 |
|
120 |
17 |
|
87.6 |
26.4 |
|
|
292.1 |
|
121 |
34 |
0.3 |
58.0 |
48.2 |
|
|
183.6 |
|
125 |
56 |
38.0 |
7.3 |
1.7 |
7.7 |
|
20.1 |
|
127 |
65 |
16.1 |
0.6 |
|
|
|
26.0 |
|
128 |
64 |
50.5 |
1.4 |
|
|
|
44.0 |
|
129 |
14 |
1.2 |
|
|
|
|
21.2 |
|
136 |
13 |
1.2 |
10.5 |
58.4 |
|
|
178.5 |
|
137 |
25 |
39.3 |
|
|
|
|
16.8 |
|
138 |
41 |
1.0 |
|
|
|
|
7.4 |
|
142 |
64 |
19.8 |
128.8 |
42.8 |
8.4 |
|
49.4 |
|
143 |
44 |
|
338.4 |
103.4 |
|
|
65.2 |
|
148 |
9 |
|
24.0 |
292.2 |
|
|
475.8 |
|
149 |
44 |
130.0 |
0.6 |
|
6.6 |
|
7.5 |
|
156 |
11 |
|
84.6 |
55.8 |
|
|
335.7 |
|
157 |
16 |
|
66.8 |
6.2 |
|
|
124.7 |
|
158 |
34 |
15.6 |
24.0 |
|
3.2 |
|
5.6 |
|
159 |
30 |
39.6 |
108.6 |
|
24.0 |
|
18.6 |
|
160 |
45 |
158.0 |
3.6 |
|
12.0 |
|
29.6 |
|
171 |
55 |
41.6 |
|
|
|
|
13.1 |
|
MEAN |
|
30.0 |
55.1 |
32.5 |
3.8 |
|
108.9 |
|
ST. NO. |
DEP. |
Seabreams |
Grunts |
Croakers |
Groupers |
Hake |
Other |
|
119 |
75 |
6.0 |
864.0 |
3.2 |
|
|
169.5 |
|
122 |
104 |
8.8 |
|
7.2 |
|
3.0 |
1067.6 |
|
130 |
75 |
351.6 |
2.6 |
342.8 |
9.0 |
|
43.8 |
|
131 |
103 |
24.6 |
|
20.2 |
|
|
13.7 |
|
132 |
125 |
39.5 |
|
|
|
|
11.0 |
|
134 |
73 |
398.5 |
|
27.4 |
117.4 |
|
31.7 |
|
135 |
87 |
92.4 |
|
|
|
|
1447.6 |
|
139 |
87 |
163.2 |
22.4 |
|
|
|
244.8 |
|
140 |
110 |
82.0 |
0.8 |
|
|
|
23.6 |
|
141 |
132 |
30.2 |
|
|
|
|
198.7 |
|
144 |
80 |
17.0 |
1.8 |
36.5 |
13.4 |
|
54.6 |
|
146 |
181 |
4.0 |
|
45.5 |
|
|
168.4 |
|
147 |
80 |
20.2 |
|
98.4 |
|
|
225.3 |
|
150 |
130 |
13.2 |
|
|
|
|
115.4 |
|
152 |
97 |
4.8 |
|
4.2 |
|
|
73.8 |
|
161 |
94 |
4.2 |
|
19.8 |
|
|
38.2 |
|
162 |
91 |
11.3 |
|
9.0 |
|
|
53.5 |
|
163 |
110 |
65.2 |
18.4 |
|
|
|
53.2 |
|
164 |
79 |
311.8 |
9.6 |
|
|
|
13.2 |
|
165 |
99 |
8.8 |
|
|
19.5 |
|
4.8 |
|
166 |
70 |
43.2 |
|
|
|
|
25.4 |
|
167 |
90 |
101.1 |
|
|
|
|
775.4 |
|
168 |
79 |
106.1 |
|
|
6.0 |
|
42.9 |
|
169 |
100 |
25.3 |
|
|
10.6 |
|
193.6 |
|
170 |
72 |
266.0 |
|
|
8.0 |
|
19.5 |
|
MEAN |
|
87.9 |
36.7 |
24.5 |
7.3 |
0.1 |
204.3 |
|
ST. NO. |
DEP. |
Hake |
Synagrops |
Greeneyes |
Shrimp |
Sharks |
Other |
|
108 |
248 |
20.7 |
138.4 |
|
26.3 |
|
230.2 |
|
109 |
449 |
340.2 |
|
|
14.9 |
17.5 |
59.6 |
|
110 |
288 |
|
1375.6 |
539.6 |
1.6 |
|
42.5 |
|
111 |
501 |
56.0 |
|
0.1 |
56.8 |
34.7 |
53.5 |
|
112 |
749 |
56.0 |
|
|
2.9 |
2.1 |
91.8 |
|
113 |
459 |
25.6 |
|
|
228.0 |
|
12.0 |
|
118 |
234 |
83.2 |
324.8 |
4.8 |
10.7 |
|
67.2 |
|
123 |
240 |
85.8 |
477.4 |
|
20.2 |
|
62.0 |
|
124 |
541 |
15.2 |
|
|
151.8 |
1.2 |
127.2 |
|
133 |
210 |
|
1067.1 |
|
1.8 |
|
196.7 |
|
145 |
211 |
|
49.0 |
|
0.6 |
5.6 |
247.7 |
|
153 |
304 |
10.0 |
6.0 |
7.0 |
23.9 |
20.0 |
99.1 |
|
154 |
351 |
36.8 |
|
1.2 |
97.6 |
36.4 |
72.6 |
|
155 |
449 |
40.0 |
|
|
2.4 |
24.4 |
93.8 |
|
176 |
501 |
86.8 |
3.5 |
|
75.3 |
25.9 |
36.4 |
|
177 |
403 |
359.1 |
7.6 |
|
61.3 |
28.5 |
86.6 |
|
178 |
292 |
28.8 |
2044.8 |
460.8 |
9.6 |
|
53.7 |
|
179 |
202 |
162.8 |
248.6 |
13.2 |
93.5 |
|
31.2 |
|
182 |
296 |
8.0 |
240.0 |
146.4 |
8.0 |
|
17.1 |
|
183 |
388 |
289.0 |
0.8 |
|
35.7 |
111.1 |
136.2 |
|
184 |
499 |
153.6 |
0.8 |
0.6 |
99.4 |
18.4 |
55.0 |
|
185 |
229 |
23.1 |
162.4 |
17.5 |
4.2 |
|
7.9 |
|
186 |
351 |
42.0 |
121.5 |
82.5 |
12.1 |
|
172.0 |
|
Mean |
|
83.6 |
272.5 |
55.4 |
45.2 |
14.2 |
89.2 |
Table 9 shows the swept area estimates of mean densities by species and depth strata, based on 75 successful random bottom trawl hauls made. The bigeye grunts dominates both the 0-50 and 50-100 m bottom depth zone followed by Pagellus bellottii and Pseudotolithus senegalensis in the shallow waters and by Dentex congoensis in the 50-100 m zone. The deeper waters are dominated by cardinal fish Synagrops microlepis, but also relatively high densities of hake, greeneyes (Chlorophthalmus atlanticus) and spider shrimp (Nematocarcinus africanus). The catchability coefficient applied in the estimation is 1.0.
Table 10 shows the estimated area of the shelf and the resulting biomasses for all demersal species and separately for the dominating species in each zone.
Table 10. Palmeirinhas-Cabinda. Biomass estimates of groups of demersal fish by depth strata. Tonnes.
|
|
Total |
0-50m |
50-100m |
100-200m |
|
Shelf area nm |
6400 |
2500 |
2100 |
1800 |
|
Brachydeuterus |
9500 |
4500 |
4000 |
|
|
Pagellus bellottii |
4800 |
1800 |
3000 |
|
|
Dentex congoensis |
4300 |
|
3200 |
1100 |
|
Dentex angolensis |
1500 |
|
600 |
900 |
|
Epinephelus aeneus |
1100 |
300 |
800 |
|
|
All demersal |
59000 |
19000 |
21000 |
19000 |
|
Cardinal fish |
21000 |
tonnes |
|
Hake |
5500 |
tonnes |
|
Greeneyes |
2500 |
tonnes |
|
Spider shrimp |
3700 |
tonnes |
Based on the findings from this first of a series of surveys we can conclude:
The round sardinella
The distribution of the round sardinella was limited to the area between Benguela and Pta. das Palmeirinhas, and was located to four distinct aggregations, one off Lobito-Benguela, one SW of Pta. do Morro, one off Cabo sao Braz and the last off Pta. das Palmeirinhas. No sardinella was aggregating north from Luanda.
The three southern concentrations was estimated to 160 000 tonnes and the best and most reliable of two estimates for the Palmeirinhas aggregation gave 44 000 tonnes. The total estimate for the stock of round sardinella is thus 200 000 tonnes.
On basis of the findings from the previous Dr. Fridtjof Nansen surveys in Angola, the biomass of both species of sardinellas was estimated to 400 000 tonnes for 1985 and reduced to 300 000 tonnes for 1986. The recent estimate of 200 000 tonnes thus points to a serious decline in the stock. The main part of the sardinella biomass is composed of large fish with no potential for further growth in stock biomass.
The Cabinda region together with Congo and southern Gabon usually forms the nursery grounds for the juvenile sardinella. From a recent survey in these waters we can conclude that there at present are no bigger amounts of juveniles which will recruit to the adult part of the stock.
A rebuilding of the sardinella stock is thus dependent upon strong protective measures on the remaining spawning stock and successful recruitment.
The cunene horse mackerel
The cunene horse mackerel was found widely distributed from Baja dos Tigres to Cabinda. The main part of the species was in a scattered distribution pattern forming only a few small and dense patches.
The biomass of the horsemackerel was estimated to 75 000 tonnes south of Pta. Palmeirinhas and 30 000 in the northern region.
The species was generally small in size, with a modal length of 13 cm south of Pta. Palmeirinhas, increasing to 15 cm northwards.
As most of the horse mackerel is juvenile fish still in fast growth the stock has a strong potential for further increase in biomass, given it is not exposed to premature exploitation.
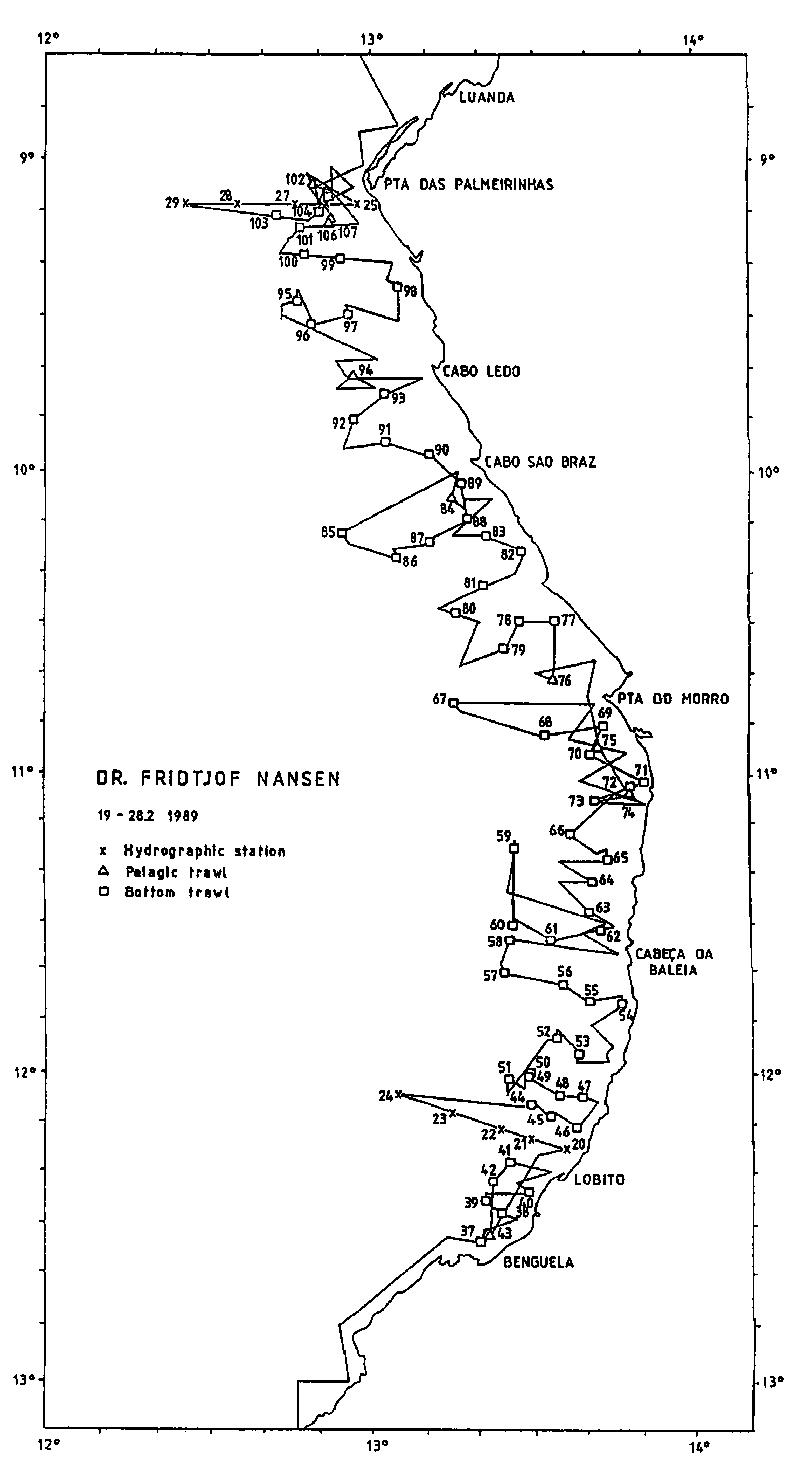
Figure 3. Temperature at sea surface and hydrographic profiles Benguela to Pta das Palmeirinhas.
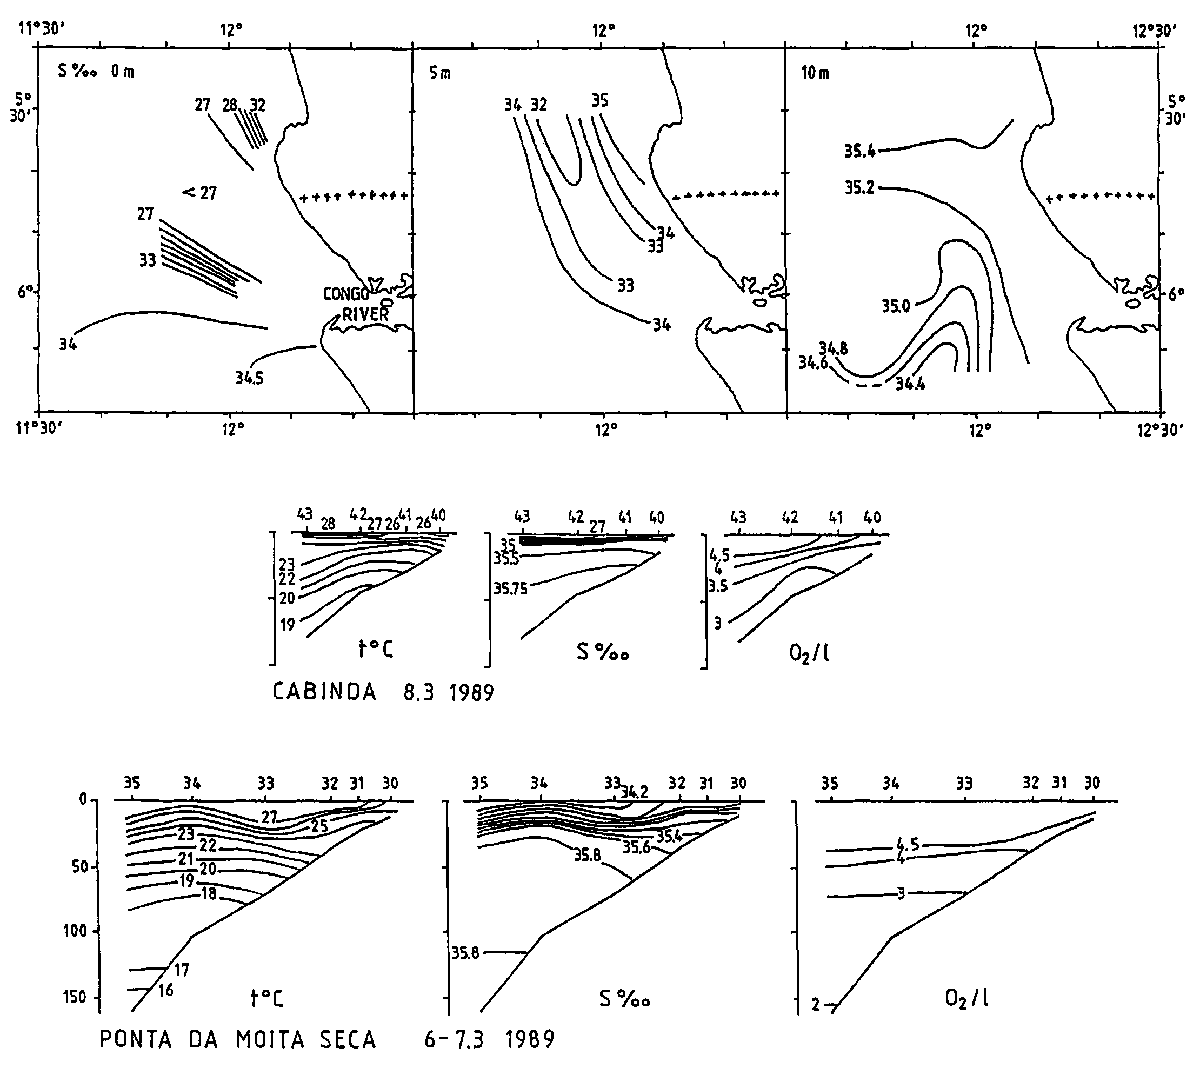
Figure 4a. Temperature at sea surface and hydrographic profiles Pta das Palmeirinhas to Cabinda.
Figure 4b. Temperature at sea surface and hydrographic profiles Pta das Palmeirinhas to Cabinda.
Figure 5a. Distribution of pelagic fish type 1, Benguela to Pta das Palmeirinhas.
Figure 5b. Distribution of pelagic fish type 2, Benguela to Pta das Palmeirinhas.
Figure 6a. Distribution of pelagic fish type 1, Pta das Palmeirinhas to Cabinda.
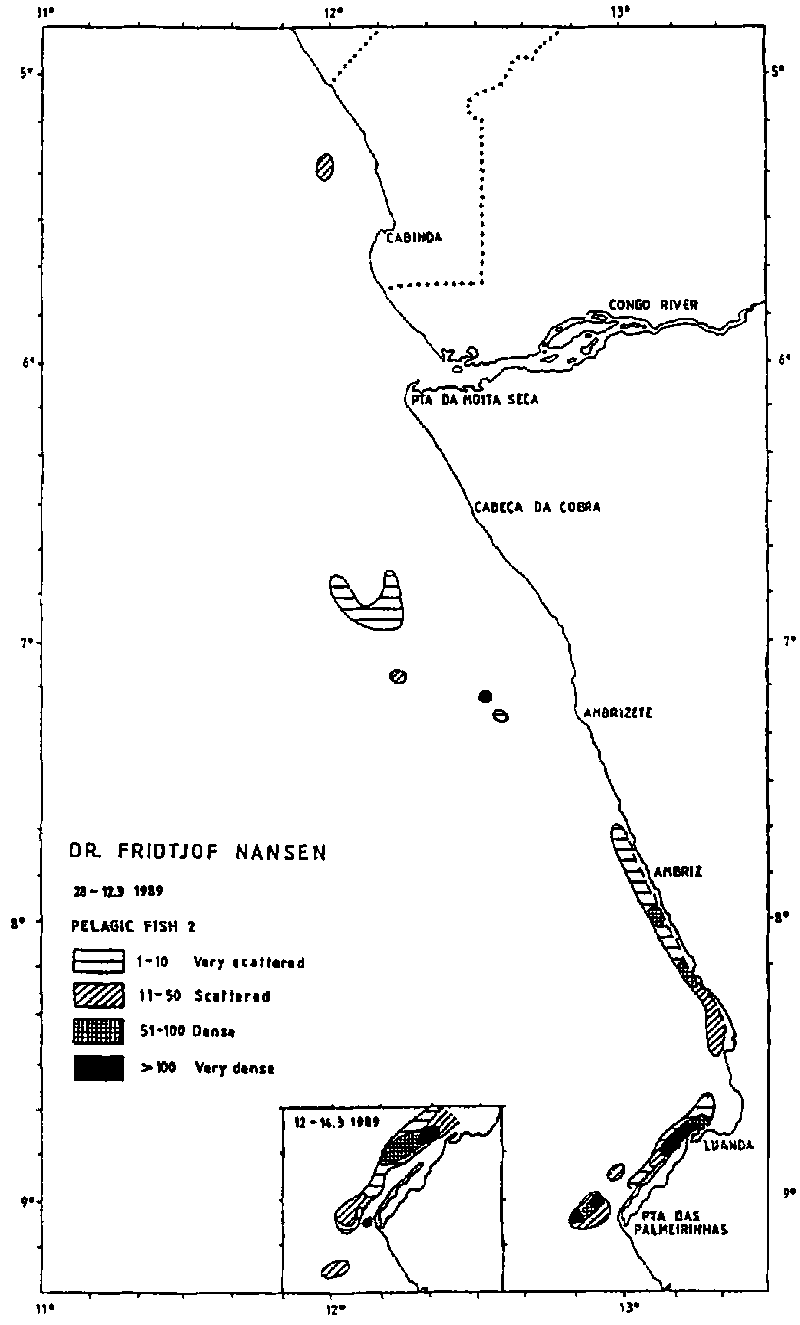
Figure 6b. Distribution of pelagic fish type 2, Pta das Palmeirinhas to Cabinda.
![]()
![]()
![]()