The validation of MODIS products
using ground site measurements
NET PRIMARY PRODUCTION
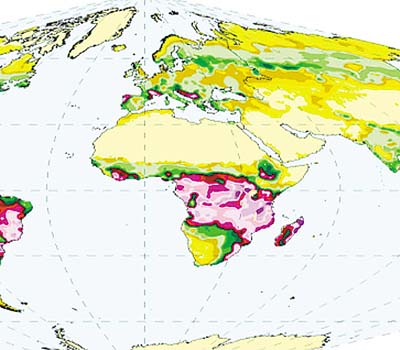
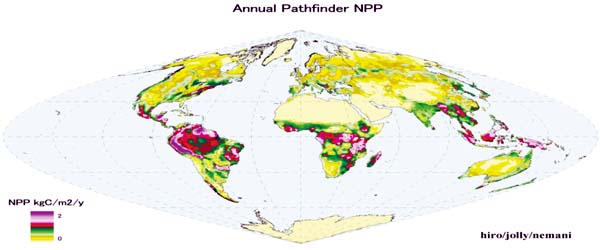
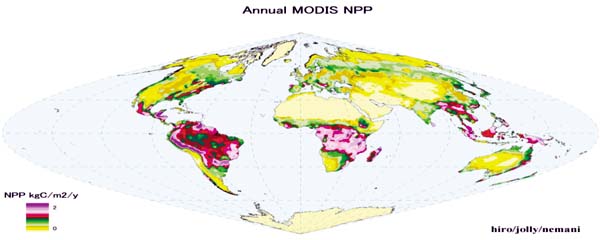
Data from the Moderate Resolution Imaging Spectroradiometer (MODIS) sensor has been used since 2001 by NASA scientists to produce eight-day estimates of Gross Primary Production (GPP) and annual estimates of Net Primary Production (NPP) for each 1-km2 cell of the Earth's terrestrial surface (Figure 1). These data have great potential utility for monitoring the NPP component of the global carbon cycle and for assessing regional responses to climate variation, including effects on agriculture and forestry. The assessment and validation of these products will require a network of sites focused on validation, and the goal of the GTOS NPP Demonstration Project is to coordinate that validation activity.
SYSTEMATIC VALIDATION ACTIVITIES

In 2001, the NPP Demonstration Project (in coordination with the BigFoot Project) organized a two-day international workshop to bring together potential contributors to a multi-site validation of the MODIS products (CFLUX 2001). Protocols for measuring NPP and for scaling NPP from plots to the 25 km2 (or greater) areas needed for MODIS product validation were discussed. In 2002, a more general MODIS Land Products meeting was held and some of the first direct comparisons with validation data of MODIS products were presented (e.g. Figure 2). Assessment of the MODIS products included analysis of multiple inputs to the MODIS GPP/NPP algorithm, notably land cover classification, 8-day fPAR (i.e. the fraction of photosynthetically active radiation absorbed by the vegetation), and surface meteorology.
Figure 1. Global annual NPP from MODIS for the first two years of MODIS data compared with long-term average NPP from AVHRR Pathfinder data, also using the MODIS NPP algorithm
1981 - 1999

2001 - 2002

by: Nemani, R., Keeling, C., Hashimoto, H.,
Jolly, W., Piper, S., Tucker, C., Myneni, R.,
Running, S., 2003
ECOSYSTEM MODEL-DATA INTERCOMPARISON PROJECT
The Ecosystem Model - Data Intercomparison Project (EMDI 2003) is another active organization that is generating data sets relevant to validating MODIS products. NPP estimates are made for areas of 0.5°×0.5°, using a variety of approaches that include mapping of land cover and area weighting of field NPP observations in each mapped class. Results are compared to outputs from globally applied light use efficiency algorithms driven by satellite data, or spatially distributed ecosystem process models driven by interpolated meteorological data. The EMDI Project held a workshop in July 2003 to focus on characterizing the environmental controls of NPP, assessing interannual variation in NPP, and performing model-data intercomparisons.
LOOKING AHEAD
Future plans for the NPP Demonstration Project and the BigFoot Project call for annual workshops to focus on the MODIS products from the previous year. MODIS products will be compared with ground-based observations in each biome, and parameters used in the MODIS GPP/NPP algorithm will be evaluated. These results will be used to update the Internet-based manual with background and protocols for measuring NPP and for scaling it to areas large enough to do validation of MODIS products. The workshop participants will also evaluate the global products for a given year in relation to the year's change in atmospheric CO2 concentration and to interannual variation in regional and global climate.
Figure 2. NPP at the Harvard Forest (HF) and the Konza Tallgrass Prairie (KTP) sites. (a) land cover (HF); (b) NPP (HF); (c) land cover (KTP); (d) NPP (KTP). After aggregation to the 1 km MODIS resolution, the mean and range for Panel b was 592 gC m-2 y-1 (455-666) while that for the comparable MODIS NPP product was 751 gC m-2 y-1 (738-789). Mean and range for Panel d was 318 gC m-2 y-1 (240-450) while that for the comparable MODIS NPP product was 374 gC m-2 y-1 (347-394).
|
a)
|
b)
|
|
|
|
|
c)
|
d)
|
RELATED LINKS
|
Bigfoot: |
|
|
CFLUX 2001: |
|
|
EMDI 2003: |
http://gaim.unh.edu/Structure/Intercomparison/EMDI/about_emdi.html |
|
Field Manual 2001: |