Until now you have made a large number of exercises using GIS. These exercises have given you an insight in the vast possibilities of GIS. Your problem now (after having finished this manual) is to apply these techniques to your situation, with your data. You probably do not have your data in similar files as the ones you used for the exercises in this manual. There are several sources for these types of files; most likely your country will have a national agency/institute for this type of information. Probably the Geography department of your national University will be able to point you to the right people. There are many public access sources on the internet, as www.esri.com, General Bathymetric Chart of the Oceans (http://www.ngdc.noaa.gov/mgg/gebco/gebco.html), etc. A look in search engines on the web will give results for specific data.
However, sometimes you will not be able to find the data you need, or you do not have the resources to acquire them. So the only solution is to make the files yourself. If you develop your own data sets in a GIS, you have to realize a very important issue, which is Quality of Data. Specialized GIS institutions can make high quality digitized Themes/layers as they use digitising tables and special software. With limited resources it will be difficult for you to reach their standards. However, with ArcView you can make Themes to analyse data of your own study area. In this chapter some guidelines are provided to create your own Themes/layers.
As you can imagine, there are three principle aspects when you are creating your own Themes/layers:
Georeferencing of the data. This is of utmost importance to avoid spatial distortion in areas and distances of your data as discussed in the Chapter Projection, on page 40.
Digitising your maps/images. The result of this will be a Theme (or several Themes) with points, and/or polygons, and/or lines.
Registering the images. It is important that ArcView knows the exact place in the mapped area where your data must be allocated to. When you register an image, map, data, you give ArcView georeferencing information of the image involved.
Once you have registered a Theme, map, or something similar, field data can be added to the Theme (see chapter Putting field data into a GIS, page 36).
Making your own GIS starts with maps, aerial photographs, etc, of the area you are interested in, after which data is added. An example of a map is presented in Figure 18.1, where the results of a biodiversity study in the floodplains of Pais Pesca are presented. In the figure you see sampling stations (red circle with cross), water bodies (dark blue), villages (brown), rice fields (green), roads (dark brown/red), etc. What is more important, the latitudes and longitudes are clearly indicated. With this information this figure is georeferenced, and can be registered into ArcView.
Registration of images in ArcView can be done with an Avenue script, written by Mark Cederholm[42]. This extension will be used in the next exercise.
FIGURE 18.1
Pais Pesca floodplain biodiversity
study
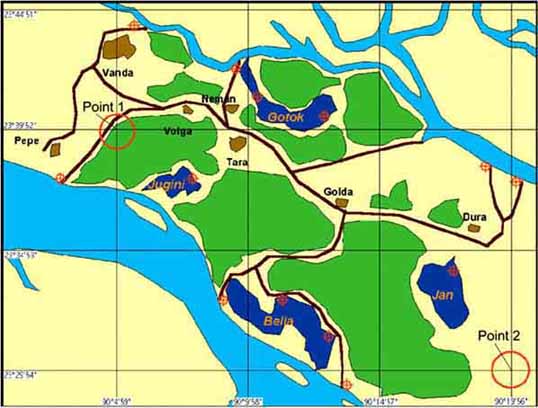
Only ‘.tiff’ and ‘.bmp’ images can be registered into ArcView with Cederholm’s extension. So when you scan an image, or make the image yourself, you have to make sure you save it as a ‘.tif’ or ‘.bmp’ file. You can find the file containing the above figure in the folder ‘RW_05_Geo’ with the file name: ‘Pais_Pesca_Biodiv_floodplain.tif’. First you have to copy this folder onto your hard disk, before you start working with this file (from the hard disk).
Before you can register this image, you will have to install Cederholm’s extension. Copy the file ‘Georeference Tiff image.avx’ from the folder ‘Extensions/Geo_ref’ on the CD to the folder of which the path ends like: ESRI\AV_GIS30\ARCVIEW\EXT32 on your hard disk.
1. Open ArcView; open a new View.
2. Set the working directory.
3. Set the projection to Category: ‘Projections of the World’, and Type: ‘Geographic’.
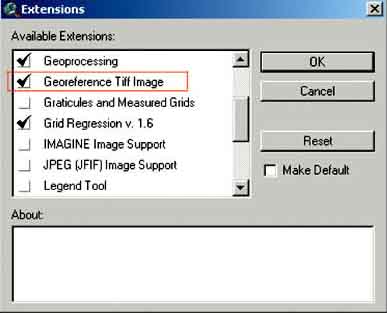
4. Activate via File/Extension... the ‘Georeference Tiff Image’ extension (Figure 18.2).
FIGURE 18.2
Georeference Tiff Image
extension
After this activation, you will see that on the button bar a new green button has appeared, the colour of the button is rather diffuse (Figure 18.3).
FIGURE 18.3
The new Georeference Tiff image extension
button

5. Add the image to the View. The image can be found in the file ‘Pais_pesca_Biodiv_floodplain.tif’, which is located in the folder ‘RW_05_Geo’. Remember that when you add this file to the View to change the data source type to ‘Image Data Source’ in the Add Theme window. Do you notice that the button of the Georeference Image extension has become brightly green? (Another point to remember: If you copy a file from a CD, its properties will be copied as well. In the case of a file on a CD, these are automatically set as read only. Remove this read only property as described on page 5.
The Georeference Tiff Image extension is straight forward. Two points on an image are selected, located diagonally and as far from each other as reasonably possible. Enter the geographic location of the two points and the map will be registered in ArcView. However, remember, ArcView works with Decimal Degrees (DD) and the map from the file contains the more commonly used Degrees, Minutes, and Seconds (DMS) system. Remember how to convert DMS into DD[43] (see Chapter: Points and degrees, page 35).
In the map we encircled the two points you need to use for this exercise (Figure 18.1), with the following coordinates:
TABLE 18.1
Georeferencing points of figure
18.1
|
|
Longitude |
Latitude |
X |
Y |
|
Point 1 |
90° 04’59” |
23° 39’52” |
90.08306 |
23.66444 |
|
Point 2 |
90° 19’56” |
23° 29’54” |
90.33222 |
23.49833 |
6. Zoom in on Point 1, and press the Georeferencing Image button in the toolbar.
7. Your pointer is now changed into a little cross (the georeference pointer). Place this cross on the crossing of the longitude and latitude lines in the red circle, and select this point by clicking your mouse.
8. The message ‘Point collected’ appears, press OK.
9. Zoom to Full Extent, zoom in on Point 2, press the Georeferencing image button again, place the cross (georeference pointer) on the crossing of the longitude and latitude lines in the red circle, and select this point by clicking your mouse.
10. The message ‘Use current point to complete rectangle?’ appears, press Yes. 11. The Georeference Points window pops up, where you are requested to ‘Enter Map Coordinates’(Figure 18.4). Use the DD-coordinates from the table above and press OK.
FIGURE 18.4
Georeference Points window
12. After you have pressed OK, you will see that the View goes back to Full Extent. If you move the pointer over the View you will see that the coordinates (in the top right corner) are changing.
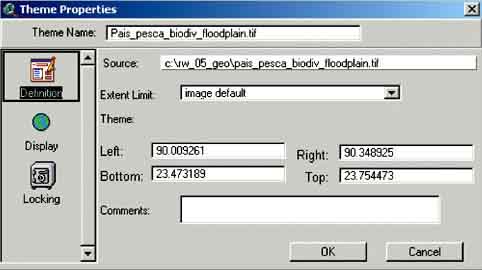
The image is now registered in this project. To check the registering process, open the Theme Properties, and you will see values for the Left, Right, Bottom and Top sides of the Theme (Figure 18.5).
FIGURE 18.5
Theme properties of the registered
image
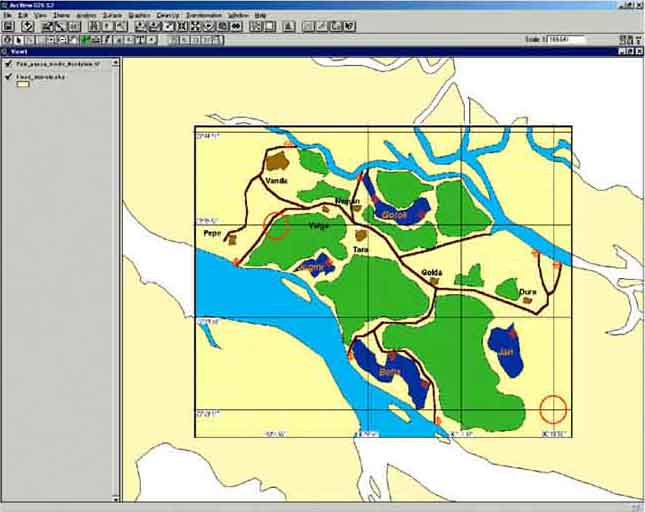
13. Save the project with a name of your own choice (menu bar: File/Save Project) You can check if the image was registered correctly by Adding the Theme ‘Flood_district.shp’ from the folder ‘12_calc_with_grids’ on your CD (remember that the Data Source Type of this Theme is Feature Data Source). After you have added this Theme, Zoom out, and you will see that the image fits perfectly into the ‘flood_district.shp’ Theme (Figure 18.6).
FIGURE 18.6
Two Themes, to check the registration
process
14. Close the Project, exit ArcView.
With the exercise above you have learned how to register an image on which coordinates were clearly indicated. However, it is possible that coordinates are not clearly indicated on an image. You can still reference such an image as long as you have the exact coordinates of two locations on the map.
The longitude and latitude of the villages in the ‘Pais_pesca_Biodiv_floodplain.tif’ image were recorded with a GPS and are presented below, with the corresponding XY coordinates. The next exercise is to register the image with the GPS readings of the villages Vanda and Dura.
TABLE 18.2
Coordinates of villages in figure
18.1
|
Village |
Longitude |
Latitude |
X coordinate |
Y coordinate |
|
Vanda |
90° 05’02’’ |
23° 43’14’’ |
90.08389 |
23.72056 |
|
Tara |
90° 10’33’’ |
23° 39’17’’ |
90.17583 |
23.65472 |
|
Pepe |
90° 03’38’’ |
23° 39’01’’ |
90.06056 |
23.65028 |
|
Volga |
90° 08’39’’ |
23° 40’41’’ |
90.14417 |
23.67806 |
|
Neman |
90° 09’20’’ |
23° 40’45’’ |
90.15556 |
23.67917 |
|
Dura |
90° 18’29” |
23° 35’48’’ |
90.30806 |
23.59667 |
|
Golda |
90° 13’30” |
23° 36’52’’ |
90.22500 |
23.61444 |
1. Start ArcView, open a new View.
2. Set your Working directory.
3. Set the projection (Category: Projections of the World, Type: Geographic).
4. Activate the Georeference Tiff Image-extension (File/Extensions...).
5. Add the Image (Image data source) ‘Pais_pesca_Biodiv_floodplain.tif’ located in the folder ‘RW_05_Geo’ to the View.
6. Click the Georeference Image-button.
7. Place the georeference pointer in the centre of the village Vanda and click your mouse, a pop-up window shows again, with remark: ‘point collected’, press OK.
8. Place the georeference pointer in the centre of the village Dura and click your mouse. You will be asked: ‘Use current point to complete rectangle’, press Yes.
9. Enter the Map Coordinates of Vanda and Dura and press OK.
10. Add the Theme ‘Flood_district.shp’ from the folder ‘12_calc_with_grids’ on your CD again and check if you registered the image correctly.
11. Take care: the XY coordinates are not attached to the Theme. If you open the open the Image Theme in a new project, you will have to repeat the above described procedures. However, if you save the project, the coordinates will be added automatically when the project is opened.
12. In order to attach the coordinates to the image file you need to convert the image into a World tiff-file. This is easily done with a small script ‘make a world file.avx’ also written and provided by Mark Cederholm.
13. Copy the file ‘Make a world file.avx’ from the folder /Extensions/Geo_ref/ on the CD to the folder of which the end of the path looks like: ‘ESRI\AV_GIS30\ARCVIEW\EXT32’on your hard disk.
14. In the File/Extensions menu activate the Make a World file extension.
15. On the button bar, the Make World File button appears.
16. Make the to be converted Image active (remember: pressing the legend of the Theme once, so that it looks like is a bit elevated). In this case the ‘Pais_pesca_Biodiv_floodplain.tif’.
17. Click the Make World File button.
18. A message ‘Done’ will pop up, press OK.
The extension has created a new small file with the extension ‘.Tifw’ where information on the coordinates is stored. As long as the original ‘.tif’ file and this ‘.Tifw’ file are located in the same folder, opening the ‘.tif’ file in a new View will result in an Image which is registered.
19. Close the Project and exit ArcView.
You can now proceed to digitize the data on the referenced map as explained below.
From your registered Image you can now abstract any data you need by digitising in ArcView. The newly created themes will automatically encompass the geo reference and can be further used to analyse your data in ArcView. Digitising is in principle nothing more then accurately tracing lines, polygons, points, etc. on your screen and saving them as a new theme.
The next exercise will show you how to do this by digitising the water bodies in the floodplain of Pais Pesca
1. Open ArcView and a new View.
2. Set your working directory.
3. Set the projection (Category: Projections of the World, Type: Geographic).
4. Add the image ‘Pais_pesca_Biodiv_floodplain.tif’ from the folder you used to work from in the previous exercise.
5. Check if the image is registered; in the upper right corner you should see values around 90 and 23. You could also check the Theme Properties table, menu: Theme/Properties..., (see Figure 17.5).
If the image is not registered, go back to the previous exercise (where you used the ‘Make a world file’ extension), and try again to make the file with the ‘.Tifw’ extension. Make sure you save this file in the same folder as where the Image file is located that you use in this digitizing exercise.
6. Go via the menu bar to View/New Theme.... In the dialogue box select ‘Polygon’ as the Feature type from the drop-down menu (Figure 18.7) and press OK.
FIGURE 18.7
The New Theme dialogue box
7. In the next dialogue box specify where to save the new Theme. Give the Theme a name, for the exercise you do now you can use the name: ‘Water_bodies.shp’. press OK.
A new Theme is now added to the View, which at the moment contains no features. The check box for the ‘Water_bodies.shp’ Theme in the View’s Table Of Content has a dashed line around it, indicating that the Theme can be edited (Figure 18.8).
FIGURE 18.8
Table Of Content indicating which Theme
can be edited

8. From the button bar select the Drawing Tool button. The Drawing Tool button is the tool button in the second row, far right (Figure 18.9).
FIGURE 18.9
The Drawing Tool button
9. Move the pointer to the Drawing Tool button, click and hold the mouse button to bring up a drop down list of the Drawing Tool buttons. Select the Draw Polygon button.
10. Zoom in on the water body you want to digitize (for this exercise select Jugini). After you have zoomed in on the waterbody, and made sure you have pressed the Draw Polygon button, you need to trace the outer borders of the waterbody with the pointer. Place the pointer on the position where you wish to start and click once. Move the pointer over the outer border, clicking every point where you change direction (Figure 18.10). After you have followed the outline of the waterbody, and have returned to your starting point, make a double-click, indicating you have finished the polygon (Figure 18.11).
FIGURE 18.10
Following the outline of a waterbody
FIGURE 18.11
The completed polygon. See the eight squares around it, indicating it is active
11. If you have made a mistake you can always delete the polygon you made and start over: After you completed the polygon, you will see there are eight squares around it. This means the polygon is active, and you can delete it. If these squares are not around the polygon, you first have to activate it. Select the polygon by using the Pointer tool
. First press the Pointer tool button in the button bar, then move the pointer to the polygon you want to delete, and click it (you will see eight squares appear around the polygon, meaning the polygon is active). When you now press the delete button on your keyboard, you will delete the polygon.
The first digitising is always a little bid rough and the shape you made never overlaps nicely with the original shape. So you have to continue editing.
12. To be able to edit the shape of the new polygon, you need to see the outline only: Go to the Legend Editor of the new Theme (either by double clicking on the legend, or through Theme/Edit Legend...), double click on the Symbol, the fill palette comes up, click on the colour button, select in the Color dropdown box ‘Foreground’, select the square with the cross, indicating you do not want any colour as foreground. After this, select in the Color dropdown box ‘Outline’, select a colour for the outline (in this example red is used). Close the Fill Palette, press Apply in the Legend Editor and close the Legend Editor (Figure 18.12).
FIGURE 18.12
The polygon, after changing the Legend to show only the outline in red
FIGURE 18.13
The polygon, after pressing the Vertex Edit tool button
13. Click on the Vertex Edit tool button
and you will see the outline of your Theme with small squares indicating the places were you clicked your mouse (Figure 18.13).
14. Zoom in on a part of the outline of the Polygon and press the Vertex Edit tool button again. You can now adjust the shape of the polygon (as explained below) until its outline follows the shape of the original image.
15. Move the pointer onto one of the squares, you will see that once you are on the square the pointer changes from an arrow into a cross. As soon as the pointer is changed into a cross, you can move the square on the outline by clicking your mouse keeping the mouse button pressed, moving the square to the spot where you want it and release the mouse button (‘drag and drop’). By doing this you can change the shape of the polygon.
If you need more points where the direction of the outline changes, you can add a square to the outline. Move the pointer to the outline, and you will see that it changes from an arrow to a circle with a cross inside. Once you see this, you can click your mouse. By doing so, you have added a square which you can move around as described above.
Once you are satisfied with the outline of the digitized water body, use the same procedure to digitize the other water bodies of the Image, each time starting with using the Draw Polygon tool button.
16. After you have digitized all polygons satisfactory, the editing session should be ended: Go via the menu bar to Theme/Stop Editing. A message will pop up asking you ‘Save edits to Water_bodies.shp’ Press Yes to save your edits.
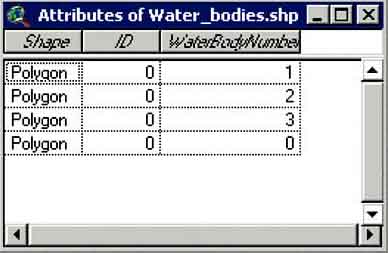
17. Open the Attributes table of the ‘Water_bodies.shp’ Theme. You will see only two columns. You might want to add a field to add the names of the different waterbodies. In Chapter ‘How to edit your Theme table and do calculations?’ on page 31 is explained how to add a field to an attribute table. One problem rests though, and that is how to know which record belongs to which polygon. As explained in the same chapter, you can edit the table by adding a field for the names of the different water bodies. Now add per record a number (Figure 18.14).
FIGURE 18.14
The Attributes table of the New Theme,
with the added field ‘WaterBodyNumber’
Now you have to determine which record belongs to which polygon: Press the
Select tool button on the button bar. 
18. Select one record in the attribute table by moving the pointer to a record, click your mouse. You will notice that the record you selected becomes yellow.
FIGURE 18.15
The Attributes table with a record selected
19. Close the attribute table of ‘Water_bodies.shp’. Now you will see in the View that one of the polygons is coloured yellow. This is the polygon that you selected in the attributes table. So now you know the number of the polygon, and you know which polygon in the View is connected to that record. The name of the waterbody is shown in the ‘Pais_pesca_Biodiv_floodplain.tiff’ Image.
20. Determine the Names of all waterbodies, and add them to the Attributes of Water_bodies.shp table.
After making this Theme, containing polygons representing waterbodies, another Theme to be made could be a Theme showing the positions of the roads. What would be the feature type of this Theme?[45]
1. Open the View of your current project.
2. Go via the menu bar to View/New Theme.... In the dialogue box select ‘Line’ as the Feature type from the drop-down menu and press OK.
3. Save the New Theme with the filename: ‘road.shp’ in the dialogue box that pops up. Make sure you save it in the appropriate folder and on the appropriate drive.
The ‘road.shp’ Theme is added to the map legend, with the dashed line round its checkbox indicating that the Theme is editable. Go to the Legend Editor (menu bar: Theme/Edit Legend...) and change the Symbol in such a way that it will be clearly visible (change the colour into purple, and width to 2).
4. From the Drawing tool button drop-down list select the Draw Line tool
button.
5. Choose a road in the Image you want to digitize, and follow the same procedure as you have followed digitizing a polygon; Click along the length of the road, until you have reach the end of the road, end the line by double-clicking. Select the line tool again and digitize the next part of the roads, etc.
After you have digitized all roads that you wanted to digitize, save your work: Via the menu bar go to: Theme/Stop Editing. Click Yes to save edits.
The line that you worked on last is highlighted (with yellow). Click the Clear
Selected Features  tool button to deselect
it.
After a polygon Theme, and a line Theme, you will make in the following exercise a point Theme. This type of Theme is the ideal way to store data, if you have made specific measurements on a specific location. For this exercise you will digitize the locations of the sampling stations on the ‘Pais_pesca_Biodiv_floodplain.tif’ Image.
6. Open the View of your current project.
7. Go via the menu bar to View/New Theme.... In the dialogue box select ‘Point’ as the Feature type from the drop-down menu and press OK.
8. Save the New Theme with the filename: ‘Sampling_stations.shp’ in the dialogue box that pops up. Make sure you save it in the appropriate folder and on the appropriate drive.
The ‘Sampling_stations.shp’ Theme is added to the map legend, with the dashed line round its checkbox indicating that the Theme is editable.
9. From the Drawing tool button drop-down list select the Draw Point tool
button.
10. Zoom in on the sampling station you want to digitize (sampling stations are indicated by a red circle with a red cross). After you have zoomed in on the sampling station, and made sure you have pressed the Draw Polygon button, move the pointer to the centre of the sampling station, and click it with your mouse. After having selected one sampling station, go to the next and select if following this procedure.
11. When you have added all sampling stations you can finish editing the new Theme; go via the menu bar to Theme/Stop Editing. Press Yes to save the edits.
After these exercises you know how to register an image of which at least two locations are georeferenced, and you can use this image to make three types of Themes (polygon, line, and point Themes). Previously (Putting field data into a GIS, page 36) you have learned how to add data to existing Themes, which you practised in these exercises as well.
If you want to get some more experience registering, then try to register the map of the Rio Uneixu[46] in Brazil.
1. Start ArcView, Open a new View;
2. Set the working directory;
3. Set the projection (Category: Projections of the World, Type: Geographic); and
4. Add the image ‘Rio_Uneiuxi.tif’ located in the folder ‘RW_06_Brasil_Geo’.
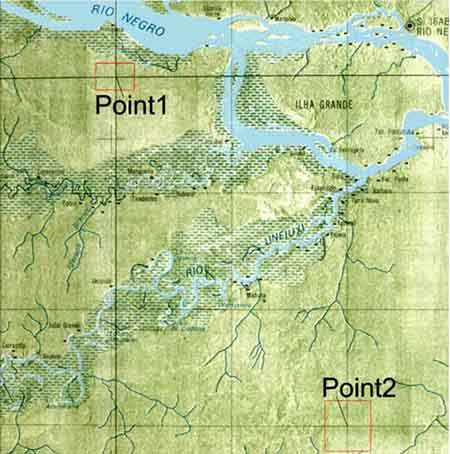
You will see the scan of a map of an area in the north of Brazil. Unfortunately, the latitudes and longitudes of the lines you see in the image, which are normally written on the map, are not known. The only data that came with this map is that one point in the red squares (Figure 18.16) has the values: X: -65.06941 and Y:-0.72384, while the other point the following data contains: Latitude: 0°27’4” (S), Longitude: 65°15’9” (W) (The letters S and W mean south and west).
FIGURE 18.16
Image of Rio Uneiux with georeferenced
points
Recalculate the obvious DMS values of the second point into decimal degrees. Pay special attention to the fact that the points are south of the Equator, and west of the Greenwich Meridian[47].
Determine which values belong to which point, keep in mind the fact that the points are south of the Equator, and west of the Greenwich Meridian[48].
5. With the (calculated) values of both points, register the image, using these points, in ArcView.
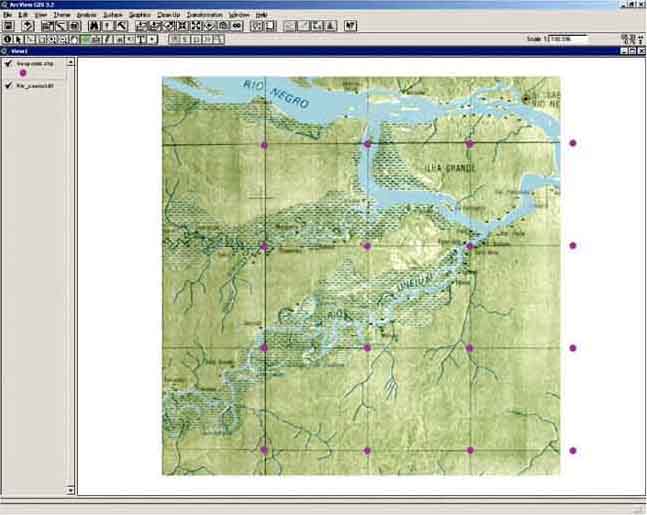
Check this registration: Add the Theme ‘Geopoints.shp’ from the folder: ‘RW_06_Brasil_Geo’ to the View. If you have done everything correctly, you will see that the points will be on the crossings of the Latitude and Longitude lines, except for four points which will be outside the area of the image.
You can also add the Theme: ‘Large rivers of the world.shp’ from the same folder. You will see that rivers from this Theme do not correspond precisely with the rivers in the Image you have registered, but come very close. Over time rivers may change their courses, which we see here (Figure 18.17).
In the folder ‘RW_06_Brasil_Geo’ you will find the file ‘Villages.xls’. This file contains the locations and names of the villages on the map. You can use this file to make a point Theme on the map you have just registered. Try to do this, as is explained from page 36, Putting field data into a GIS, and keep in mind that all points are west of the Greenwich Meridian, and south of the Equator, meaning that both the X’s and Y’s will have negative values. If you want to check the outcomes of your calculations, check the file ‘Solution_Villages.xls’ in the folder ‘RW_06_Brasil_Geo’.
FIGURE 18.17
The Attributes table with a record
selected
| [42] The script is provided
on the CD but can also be downloaded from http://www.pierssen.com/ArcView/ArcView.htm.
The name of the downloadable file is ‘stuff.zip’. [43] DD= Degree + Minutes/60 + Seconds/3600. [44] Adapted from an exercise provided by Paul Eastwood and Geoff Meaden. [45] In this case the most appropriate feature type would be ‘Line’. [46] Courtesy of Paulo Petry Bio-Amazonia Conservation Intl. Projeto Radam, Brasil, Carta Imagem Radar, Santa Isabel do Rio Negro SA.20-V-A, MIR-56 1:250 000, Ministério do Exercito - Depto. de Engenharia e Comunicações, Diretoria de Serviço Geográfico 5a DL Brasilia, DF. published in 1984. [47] both X and Y values will be negative!!!! [48] Point 1: Latitude: 0°27’4”(W), Longitude: 65°15’9”(S) (=X: -65.2525, Y: -0.451111), Point 2: X:65.06941, Y: -0.72384. |