Table 96 compares the potential and current situation of areas under irrigation, irrigation water requirements and total water use for each major basin group. The current water use in column 7, available from AQUASTAT [21a], is based on information provided by the countries. It must be noted here, that methods for calculating agricultural water withdrawal vary from country to country, which may lead to some inconsistencies. For example, Somalia probably only included the water withdrawal for the full and partial control irrigation schemes, estimated at 50000 ha and not the water withdrawal for the 150000 ha of spate irrigation. This may explain the low figure of current irrigation water requirement (4000 m�/ha per year) for the Shebelli-Juba basin, calculated by dividing the total current water use (column 5) by the total area under irrigation (column 4). Also, the area under irrigation in column 4 represents the area equipped for irrigation. It may be possible, that only part of the equipped area in the basins is actually irrigated, which again may lead to lower figures for irrigation water requirement, if dividing total water use by the equipped area. However, it is estimated that most figures in this table reflect reasonably well the situation at basin and continental level. The potential water requirement for the whole continent is estimated at about 614 km� per year, which is almost five times the current agricultural water use, estimated at 128 km per year.
TABLE 96 Comparison of potential and current situation on areas under irrigation and water requirements by basin
Basin |
Potential situation |
Current situation |
Actual water use as % of potential water req.* |
||||
total area |
total water requirement |
gross water req. per ha |
total area |
total water use |
gross water use per ha |
||
(1) |
(2) |
(3)=109*(2)/1 |
(4) |
(5) |
(6)=109*(5)/(4) |
(7)=100*(5)/(2) |
|
Senegal river |
420 000 |
14.37 |
34 000 |
118 150 |
2.67 |
22 500 |
18.6 |
Niger river |
2 816 510 |
55.02 |
19 500 |
228 240 |
2.43 |
10 500 |
4.4 |
Lake Chad |
1 163 200 |
16.53 |
14 000 |
113 296 |
1.00 |
9 000 |
6.0 |
Nile river |
8 000 000 |
100.00 |
12 500 |
5 078 604 |
60.78 |
12 000 |
60.8 |
Rift Valley |
844 010 |
7.91 |
9 500 |
193 496 |
2.08 |
10 500 |
26.3 |
Shebelli-Juba |
351 460 |
5.00 |
14 000 |
199 000 |
0.78 |
4 000 |
15.6 |
Congo/Zaire river |
9 800 000 |
158.86 |
16 000 |
35 767 |
0.68 |
19 000 |
0.4 |
Zambezi river |
3 160 380 |
37.30 |
12 000 |
146 869 |
2.67 |
18 000 |
7.2 |
Okavango |
208 060 |
1.45 |
7 000 |
0 |
0.00 |
0 |
0.0 |
Limpopo river |
295 400 |
3.45 |
11 500 |
241 381 |
1.77 |
7 500 |
51.3 |
Orange river |
390 000 |
4.88 |
12 500 |
302 722 |
2.29 |
7 500 |
46.9 |
South Interior |
54 000 |
0.28 |
5 000 |
250 |
0.00 |
8 000 |
0.7 |
North Interior |
71 000 |
1.00 |
14 000 |
232 500 |
1.82 |
8 000 |
182.0 |
Mediterranean Coast |
850 000 |
8.19 |
9 500 |
1 606 700 |
12.11 |
7 500 |
147.9 |
North West Coast |
1 200 000 |
12.00 |
10 000 |
1 000 750 |
8.11 |
8 000 |
67.6 |
West Coast |
5 112 750 |
90.09 |
17 500 |
310 883 |
2.52 |
8 000 |
2.8 |
West Central Coast |
835 000 |
11.00 |
13 000 |
28 450 |
0.20 |
7 000 |
1.8 |
South West Coast |
1 807 900 |
24.43 |
13 500 |
70 000 |
0.34 |
5 000 |
1.4 |
South Atlantic Coast |
84 200 |
0.85 |
10 000 |
84 000 |
0.63 |
7 500 |
74.1 |
Indian Ocean Coast |
1 500 000 |
15.99 |
10 500 |
862 110 |
6.57 |
7 500 |
41.1 |
East Central Coast |
1 927 460 |
20.94 |
11 000 |
178 610 |
1.79 |
10 000 |
8.5 |
North East Coast |
78 050 |
1.11 |
14 0;)0 |
24 574 |
0.21 |
8 500 |
18.9 |
Madagascar |
1 500 000 |
23.25 |
15 500 |
1 087 000 |
16.14 |
15 000 |
69.4 |
Islands |
34 990 |
0.32 |
9 000 |
30 109 |
0.30- |
10 000 |
93.8 |
Total |
42 504 370 |
614.22 |
14 500 |
12 173 461 |
127.89 |
10 500 |
20 8 |
*: A figure of > 100% means. that at present fossil water is used for irrigation, while the irrigation potential figure is based on the use of renewable water resources only.
The area under irrigation (12.2 million ha) is less than 30% of the irrigation potential (42.5 million ha). Although considerable potential for future expansion still exists, several observations have to be made:
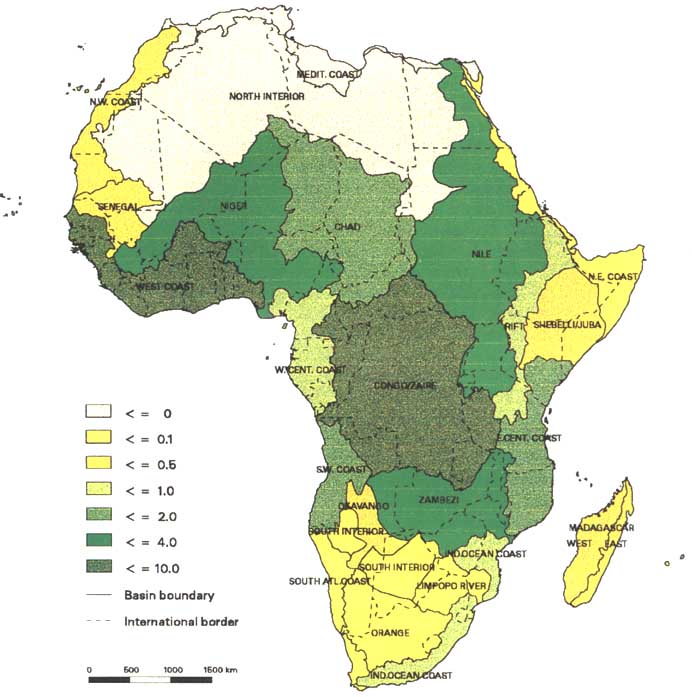
• Over 60% of the irrigation potential is located in humid regions, and almost 25% in the Congo/Zaire basin alone. These are the regions where potential for rainfed agriculture is also high and where irrigation is mainly supplementary irrigation. It is also in these regions that irrigation is at present least developed. Out of a potential of 9.8 million hectares for the Congo/Zaire basin, only 1% has been developed so far.
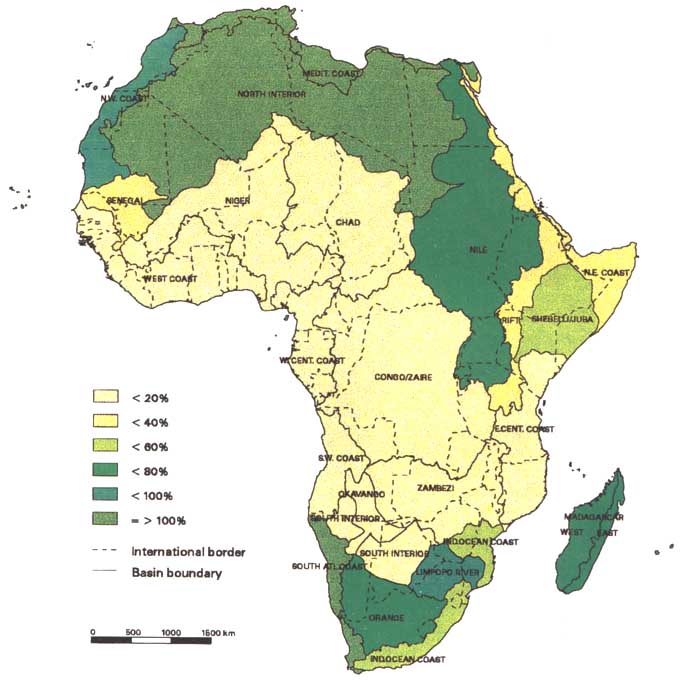
• In the regions where irrigation is most important for agriculture, between 60% and more than 100% of the potential (when considering only renewable water resources) is already irrigated. Most of the areas presenting the best potential are already under irrigation. New development will typically require higher investments in terms of water regulation or transportation, or will take place on less productive soils.
• Out of the 12.2 million hectares considered under irrigation, it is estimated that over 50% need rehabilitation if they are to be managed to the maximum of their potential. As some irrigation systems function badly or not at all, rehabilitation could also contribute to improving irrigation performance. However, innovative thinking and research are needed to avoid the same failures recurring in the future. Farmers should be actively involved, as they have valuable knowledge regarding deficiencies of the existing system. Investments in rehabilitation and modernization should be used to provide incentives for management reform in existing bureaucratically-run irrigation projects.
The figures of this study concern mainly the physical potential with some considerations about technical and economic feasibility. It is impossible to integrate complex issues, including economic, political, social and environmental aspects, into a purely quantitative assessment exercise at the scale of a continent. However, in addition to the physical resources, socioeconomic and environmental as well as political considerations will determine the real possibilities for irrigation development and the choices to be made on the use of water in a river basin, as presented in a schematic way in Figure 1.
Any economic activity, and changes to it, can have different impacts upon men, women and children. This also applies to the water development sector and, thus, any assessment of the net development contribution to a social system such as an irrigation system requires a social analysis, where gender analysis is one component for ensuring that policy and projects are effective, efficient and will have a significant development impact [8].
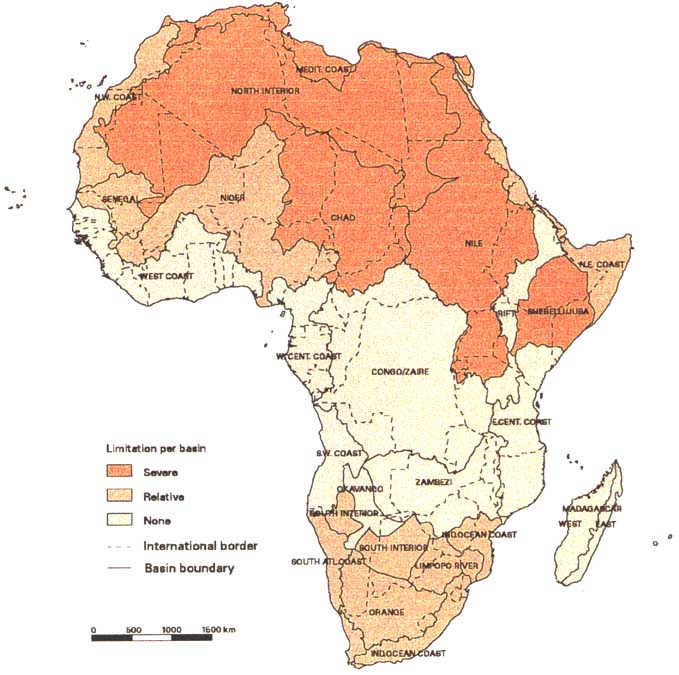
FIGURE 14 Irrigation potential in Africa: water as a limiting factor
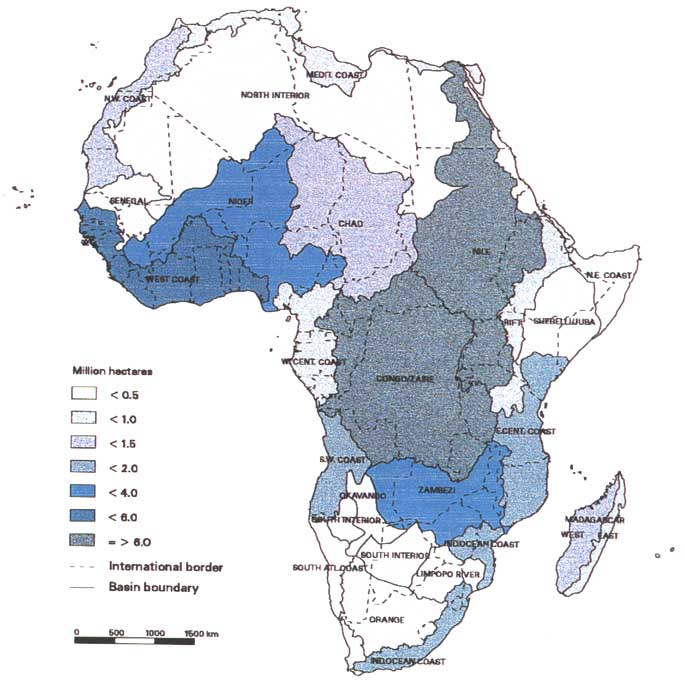
FIGURE 15 Irrigation potential in Africa (in millions of hectares per basin)
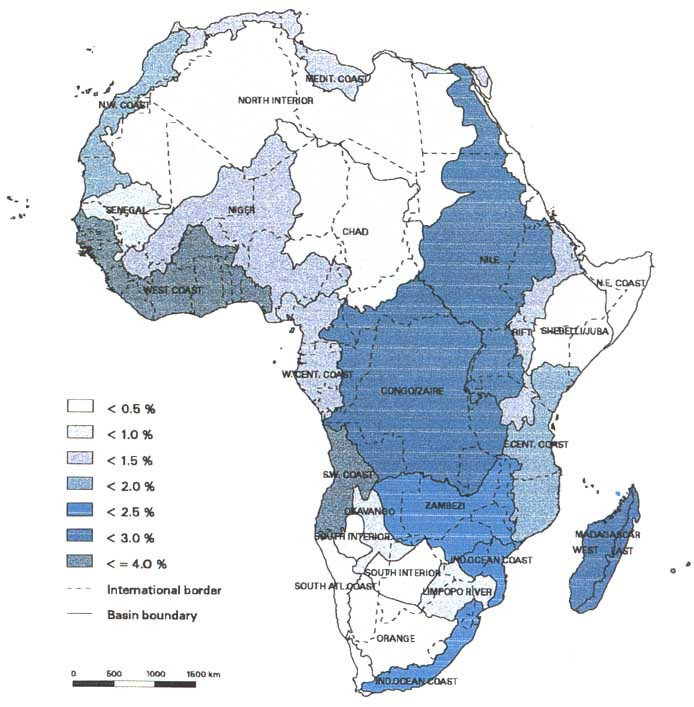
FIGURE 16 Irrigation potential in Africa as % of basin area
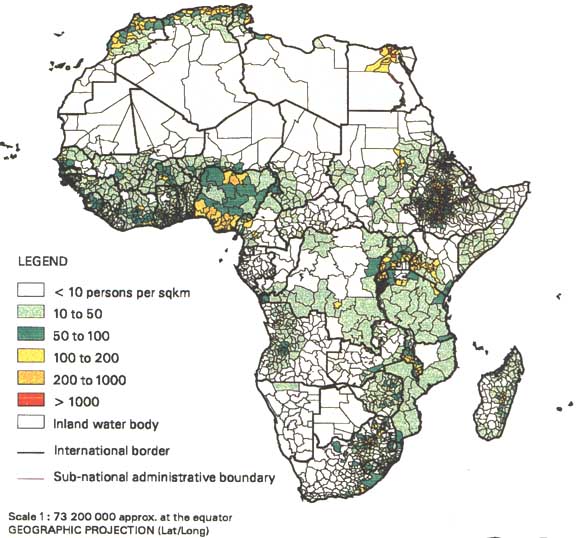
FIGURE 17 Africa: density of population by administrative unit (estimated for 1994)
FIGURE 18 Irrigation in Africa (as percentage of basin potential)
FIGURE 19 Possibilities for irrigation expansion (in millions of hectares per basin)