![]()
![]()
![]()
Livestock feeds provide the basic nutrients required for animal production, including energy, proteins and amino acids (macro-nutrients), and minerals, vitamins and other micro-nutrients. Feeds may be broadly classified as concentrates and roughages, depending on their composition. Concentrates are feeds that contain a high density of nutrients, usually low in crude fibre content (less than 18% of dry matter (DM)) and high in total digestible nutrients. Roughages are feeds with a low density of nutrients, with a crude fibre content over 18% of DM, including most fresh and dried forages and fodders. Definitions of these feeds and their nutrient contents vary somewhat in the literature; terminology used in this report follows that of FAO (eg. FAO 1983).
Concentrates may be high in energy, referred to as energy concentrates, such as cereals and milling by-products, or high in protein, with over 20% crude protein, referred to as protein concentrates. Concentrates may be fed in raw or milled forms as individual feeds (sometimes referred to as straights), or may be blended or formulated into balanced rations for particular production purposes (compound feeds). Compound feeds may be mixed on-farm but are also produced by the commercial feed compounding industry. Available published data on compound feeds mainly refer to the latter.
Raw materials for concentrate feeds are commonly classified into the following categories:
Cereals: the main cereals are rice, wheat, barley, oats, rye, maize, sorghum and millet
Grains: all cereals except rice
Course grains: all cereals except wheat and rice
Food grains: grains used for human food consumption
Feed grains: unmilled grains to be used as livestock feeds
Milling by-products: by-products from the milling of cereals and pulses, such as brans and pollards
Feed-grain substitutes: dried roots and tubers (chiefly cassava and sweet potatoes), or by-products of crop processing such as molasses, maize gluten feed, distillery and brewery grains, dried citrus pulp etc. In some classifications, 'roots and tubers' are classed separately while the latter kinds of feeds may be regarded as 'other concentrates' or 'non-conventional concentrates'.
Oil meals and cakes: products of oilseeds (including copra, cotton seed, groundnuts, linseed, palm kernels, rapeseed, sunflower seed and soyabeans) and fish after extraction of their oil component either by expeller methods (oilcakes) or solvent-extraction methods (oilmeals).
Other concentrates: other energy or protein concentrates including processed livestock products (inedible fats and oils, meat, blood and bone meal and milk products) and industrial products such as urea and single-cell protein.
Non-conventional feeds and processed harvested forages: these include a variety of feeds not widely used in commercial livestock diets; some may be considered as concentrate feeds after processing, such as dried lucerne (alfalfa) leaf meal, dried cassava leaf, cassava pulp, processed pea and bean meals, sal and rubber seed meals, citrus pulp wastes and others.
The primary role of concentrate feeds is to provide concentrated sources of necessary nutrients for livestock production. These nutrients include not only macro-nutrients of energy and protein but also important specific nutrients such as amino acids, fatty acids, enzymes, vitamins, minerals and others.
Both monogastric and ruminant livestock are fed concentrates. Monogastric livestock have a limited capacity to digest fibre and thus require diets of higher nutrient density with a higher proportion of concentrate feeds and less roughage, particularly for intensive poultry and pig production systems. Less intensive monogastric production systems may utilise smaller amounts of conventional concentrates to supplement available feeds in the form of wastes or by-products of human food preparation, together with some forage feeds.
Many ruminant production systems also use concentrate feeds. In intensive systems, especially for milk production and in fattening periods for meat production, concentrates may form a high proportion of diets (over 30% and 70% respectively). Ruminant production systems of lower intensity sometimes utilize concentrate feeds to supplement roughage based diets, either to mitigate the seasonality of forage supplies, or to meet the higher nutrient requirements for particular classes of stock or animals in critical physiological states, such as lactating cows, weaner calves or draught animals.
Two specific additional consequences of concentrate feeding are important to note in the context of environmental impacts of feed utilization. The first is that improvements in livestock productivity are generally associated with improved biological efficiency of feed use; the second is the role of concentrate feeds in promoting better utilization of roughage feeds for ruminant livestock.
Livestock production and productivity The consequences of increased livestock productivity are that the total outputs of livestock products may be increased, or that required production levels may be achieved from fewer animals. In either case, the efficiency of production is improved, requiring less total feed per unit of livestock product.
Improved efficiency of feed-use is a consequence of an increase in the proportion of feeds going to useful production (ie growth, milk production or draught power output) as production increases, and thus a reduction in the proportion going to maintenance of the animal. Improved individual animal productivity also leads to changes in livestock numbers and population structures required to maintain particular levels of production. Thus, fewer breeding animals and replacements are required due to longer productive lives, improved reproductive and survival rates, and shorter rearing periods. Increases in the overall efficiency of feed-use in production systems through these changes can be very substantial.
Improvements in productivity and feed efficiency through the improved use of concentrate feeds can be achieved in all livestock production systems. In systems already based solely on concentrate feeds, useful improvements may still be derived from improved quality and better balancing of nutrients to requirements (see Chapter 3). In less intensive systems, productivity and efficiency can be improved several fold. Both will have important effects on demand for concentrate feeds and on environmental impacts.
Utilization of roughage feeds The feeding of small amounts of concentrate feeds can increase the utilization of roughage feeds by ruminant livestock in some feeding systems. Improvements in the digestibility of roughages are due to the provision of necessary nutrients (especially degradable protein) to promote rumen fermentation, resulting in increased fibre digestion and intakes of roughages, reduced wastes from unconsumed and undigested feeds, and increased animal productivity and efficiency. These effects can be particularly important in feeding systems based on relatively poor quality roughages, such as in many small-holder and semi-intensive ruminant systems. It may be noted, however, that at higher levels of feeding with better quality roughages, and with cereals and/or high-sugar concentrates, substitution effects occur so that fibre digestion and roughage intakes may be reduced by increased concentrate feeding. This occurs particularly in intensive dairy production systems, with the consequences that increases in productivity in these systems may result in an increased demand for concentrate feeds.
Concentrate feeds have varying roles in feeding systems for ruminant animals, depending on the roughage or forage resources available and the required levels of productivity. The major roughage and/or forage resources may be distinguished as follows (after Preston and Leng (1987), for example):
Systems based on straws and agro-industrial by-products:
Fibrous crop residues (stovers and straws)
Fibrous agro-industrial by-products ( eg bagasse, palm pressed fibre, cocoa pods, rice hulls, pineapple wastes, sisal bagasse and pulp)
Sugar cane processing by-products (tops, pith, molasses, pressed cane stalk etc)
Bananas and plantains
Systems based on fresh cut forages:
Cut and carry forages (grass, legumes, tree fodders)
Sugarcane (whole crop)
Systems based on grazing:
Extensive grazing on unimproved native pastures
Improved pastures with legumes
Intensive grassland
All of these systems may require to be supplemented with different types of supplements to provide particular nutrients to improve feed utilization and efficiency. Thus, fibrous crop residues may require additional fermentable or non-protein nitrogen, and some will require additional readily fermentable energy and nitrogen (eg molasses and urea). Balanced supplies of less fermentable proteins and starches may be required, together with other necessary fatty acids, amino acids, vitamins and minerals. Seasonal changes in feed resources cause additional changes in supplementary nutrient requirements.
A variety of concentrate nutrient sources may be used to provide balanced diets. These will include traditional commodities such as cereals, brans, oil seed residues, roots and tubers, but also agro-industrial sources such as urea, molasses, fish meal, blood and bone meals, synthetic amino acids and many others. While the latter may not be used in large quantities, they may be particularly important in certain feeding systems. Concentrates vary considerably in their specific nutrient contents (not only between types, such as cereals compared to oilmeals, but within types, such as cotton seed compared to soyabean meal). The selection of concentrates to provide necessary nutrients must take account of these differences.
The major production systems in which concentrate feeds are consumed to a significant extent may be identified as:
Cattle milk production
Beef production
Pig meat production
Poultry meat production
Poultry egg production
Poultry production includes chickens, ducks, geese, turkeys and other fowls, though chickens form the largest proportion of these (by both numbers of birds and demand for feeds). In addition to the above production systems, some intensive feeding of fattening sheep and goats occurs in certain areas (eg. in Europe and N America, West Africa, North Africa and Middle East), and buffaloes are fed in similar systems to cattle in some areas (eg. Italy and Asia), though the overall amounts of concentrate feeds consumed by these classes of livestock are relatively small. Fish farming systems, especially for prawns, are also locally important consumers of concentrate feeds.
Within these broad classifications of species and products, however, are a great range of systems varying in intensity of production and in levels of productivity. These systems differ considerably in the types and amounts of concentrate feeds used, and in the nature and degree of environmental impacts. The different intensities of production and feed-use are described in Table 1.
Poultry and pig production systems range from the most intensive large scale systems based entirely on compound concentrate feeding to low-intensity traditional subsistence production systems. The latter utilize concentrates mainly in the forms of crop or human food processing by-products and wastes, though because of their wide distribution throughout the world consume appreciable quantities of these feeds.
Cattle production systems similarly range in intensity from the most intensive feed-lot dairying and cereal-fed beef systems to small-holder subsistence dairy production. Ruminants generally utilize a wider range of conventional and non-conventional feeds than monogastric animals, even in the most intensive systems. In total, small-holder dairy and beef production systems probably do not account for a large proportion of concentrate feeding, though they may be the main users in some localities.
Milk and meat production systems based entirely on forages are not included in the classification in Table 1. These include grassland based milk production such as in New Zealand, and the many extensive milk and meat production systems with various species of livestock (such as camelids in S America, equids in Asia, cattle, camels and small ruminants in semi-arid Africa, etc). These systems make virtually no use of concentrate feeds and opportunities for their intensification by this means in the future are limited.
Table 1 Major livestock production systems using concentrate feeds
|
Production system |
Types of feeding systems and feeds used |
|
Poultry egg production, Poultry meat production, Pig meat production: |
|
|
Intensive; high potential single-purpose hybrid breeds; |
|
|
|
Compound concentrate feeds; high quality ingredients, feeds formulated for multiple stages of production; intensive housing, usually environment controlled; high productivity, high efficiency of feed use; large scale commercial production for sale. |
|
Semi-intensive/small-holder; dual purpose indigenous or indigenous cross improved breeds; |
|
|
|
Improved traditional systems; limited straight concentrate feeds, use of wastes, by-products and non-conventional concentrate feeds (especially for pigs); roughage feeds included in pig diets; moderate to low productivity and efficiency of feed use; production for household consumption and sale of surpluses. |
|
Traditional (unimproved scavenging); indigenous breeds; |
|
|
|
Scavenging feeding systems, including use of household wastes and some food processing by-products; low productivity, production for subsistence. |
|
Cattle milk production |
|
|
Intensive, zero grazing; high potential dairy breeds; |
|
|
|
Cut fresh and/or conserved forages with balanced compound feeds or on-farm mixed concentrates; stocking densities variable (2->10 LU/ha) depending on forage feed sources on- or off-farm; rations formulated for multiple phases of production, high quality ingredients, high productivity, high efficiency of feed use; large scale commercial production. |
|
Intensive, grazing based; high potential dairy breeds; |
|
|
|
Intensive cultivated pasture grazing based systems (at least seasonally), with balanced compound feeds or on-farm mixed concentrates, stocking densities commonly 2-5 LU/ha, rations formulated for multiple phases of production; preserved forage feeding in non-grazing season; high quality ingredients, high productivity, high efficiency of feed use; large scale commercial production. |
|
Semi-intensive; grazing or stall feeding, moderate potential dairy or dual-purpose dairy and beef breeds; |
|
|
|
Cultivated and improved natural grassland grazing or cut fresh or conserved forage systems, stocking densities typically <2 LU/ha, with supplementary concentrates (sometimes compounded or mixed straight concentrates); locally available and on-farm ingredients, greater reliance on available cereal milling and crop processing by-products, unconventional concentrates and lower quality feeds; moderate productivity, production for commercial trade. |
|
Small-holder traditional; mixed grazing and stall-feeding, unimproved multi-purpose breeds; |
|
|
|
Natural grasslands and crop residue grazing, supplementary stall-fed forage feeding systems, concentrates only in form of household wastes and by-products, or unconventional concentrates, low productivity, production for household use and local trading of surpluses. |
|
Beef production: |
|
|
Intensive calf rearing; improved dairy breeds and beef x dairy crosses; |
|
|
|
Milk replacer and calf rearer compound concentrate feeding systems, with minimum roughage, for veal production or for subsequent cereal based fattening; high growth rates, high efficiency of feed use. |
|
Intensive cereal based fattening; improved beef breeds and beef x dairy crosses; |
|
|
|
Cereal based minimum roughage feeding systems, high growth rates and efficiency of feed use; feeding period 9-12 months, slaughter at 12-15 months |
|
Intensive grazing/forage or conserved forage based systems; improved beef breeds; |
|
|
|
Grazing, cut fresh or conserved forage systems with balanced compound or on-farm mixed concentrates, stocking densities typically 2-5 LU/ha, finishing on forage and supplemental concentrates, high growth rates, slaughter at 12-18 months depending on seasonality and time of birth. |
|
Mixed semi-intensive/extensive grazing and intensive finishing systems; indigenous and improved indigenous or temperate cross beef breeds; |
|
|
|
Seasonal grazing +/- conserved forage based systems, improved natural pastures to extensive rangelands or uplands (ranch or communal grazing), often with marked seasonality, stocking densities <2 LU/ha, some supplementary concentrates used in breeding herd, intensive mixed forage and concentrate feeding for fattening (may be grazing or feed-lot based, feeding period 3-5 months), usually with intermediate store or over-wintering/dry season phase, use of variety of conventional and unconventional locally available concentrates, moderate to low overall growth rates, slaughter 18-24 months (semi-intensive) and 2-4 years (extensive). |
|
Small-holder stall-fed fattening systems; indigenous and some improved indigenous and crosses |
|
|
|
Stall-fed stored crop residues and crop processing by-product concentrates, feeding periods 3-12 months, slaughter 2-5 years. |
LU = Livestock units, defined as 1 temperate Bos taurus cow of approximately 500kg (Sere 1994).
2.3.4. Occurrence of concentrate feeding systems by farming systems and regions of the world
The mix of livestock production and feeding systems that utilize concentrate feeds varies across the different farming systems and geographical regions of the world. Table 2 illustrates the occurrence of concentrate feeding systems within the farming systems recently classified by FAO (Sere 1994). The latter distinguish livestock production in landless, grassland-based and rain-fed or irrigated mixed (crop and livestock) farming systems in (a) the temperate and tropical highlands, (b) the humid and sub-humid tropics and sub-tropics, and (c) the arid and semi-arid tropics and sub-tropics, as outlined in Appendix 1.
Intensive pig and poultry production systems are classified as landless monogastric systems. These systems occur in any part of the world wherever market demand, feed supplies and the availability of support services allow. They are usually associated with centres of human population and higher levels of income. Semi-intensive and traditional small-holder pig and poultry systems occur widely in mixed farming systems across all regions of the world.
Types of ruminant production systems are more determined by agro-climatic conditions. Cattle milk production systems based on intensive grazing or cut forages occur especially in temperate Europe and N America, but also in parts of Oceania. These systems make intensive use of productive sown pastures and forages, with stocking densities typically in the range of 2-5 LU/ha. They use large amounts of concentrate feeds (20-30% of total feeds). Intensive zero-grazing systems based on irrigation occur mainly in semi-arid and arid areas (Israel, California, Saudia Arabia), utilizing irrigated fodders and concentrate feeds. Semi-intensive and small-holder cattle (and buffalo) milk production systems occur quite widely within both rainfed and irrigated mixed farming systems. They can occur in all agro-climatic zones but are less common in the arid and semi-arid zones (unless partially irrigated) because of problems of feed and water supply.
For beef production, intensive grazing and cereal feeding systems also occur mainly in the temperate zones. Mixed semi-intensive and extensive systems (with or without intensive fattening phases) occur mainly in semi-arid zones, with some in sub-humid zones (for example in S America but limited by tsetse distribution in Africa).
Thus, it is evident that a wide variety of concentrate feeding systems occurs within each of the broad classes of farming systems outlined by Sere (1994). Aggregate feed demand and utilization within broad farming systems and regional zones is thus difficult to estimate (though attempted in Section 1.4.4. below).
Table 2 Occurrence of main livestock production systems utilizing concentrate feeds within farming systems classified by FAO(1)
|
FARMING SYSTEMS |
LIVESTOCK PRODUCTION SYSTEMS USING CONCENTRATES (1) |
|
Rainfed mixed crop-livestock |
|
|
Temperate and tropical highlands (MRT) |
Cattle milk: |
|
Humid/sub-humid tropics and sub-tropics (MRH) |
Cattle milk: |
|
Arid/semi-arid tropics and sub-tropics (MRA) |
Cattle milk: |
|
Irrigated mixed crop-livestock |
|
|
Temperate and tropical highlands (MIT) |
Cattle milk: |
|
Humid/sub-humid tropics and sub-tropics (MIH) |
Cattle milk: |
|
Arid/semi-arid tropics and sub-tropics (MIA) |
Cattle milk: |
|
Grassland based livestock |
|
|
Temperate and tropical highlands (LGT) |
Cattle milk: |
|
Humid/sub-humid tropics and sub-tropics (LGH) |
Cattle milk: |
|
Arid/semi-arid tropics and sub-tropics (LGA) |
Milk production: |
|
Landless livestock |
|
|
Landless monogastrics (LLM) |
Poultry eggs, poultry meat, pig meat: |
|
Landless ruminants (LLR) |
Cattle milk: |
1. See Sere (1994) for definition of farming systems, Table 1 for description of livestock production systems, and Appendix 1 for definition of world regions
NB Table does not include intensive or extensive grazing-based milk or beef production systems which do not involve the use of concentrate feeds (eg New Zealand dairy cattle, extensive ranching and pastoralism)
According to the most recent global review (FAO 1989), concentrate feeds constituted about a quarter of all feeds fed to livestock in the mid 1980s (including roughages and grazing on a grain equivalent basis). This proportion was growing at the rate of about one percentage point every five years to that time. In developed countries concentrates comprised almost 40% of total feeds but in developing countries only 12%. Cereals constituted half to three-quarters of this concentrate, with most of the remainder provided by cereal milling residues and oilmeals (including fishmeal). Pulses provided about 2% and roots and tubers 4.3% of total concentrate feeds dry matter in 1986 (with total concentrates defined by FAO 1989 as cereals, brans, oilmeals, pulses, and roots and tubers).
Other concentrates are provided by ingredients such as molasses, dried grass and other forage products, milk and other animal derived products, and agro-industrial by-products such as citrus pulp, sugar beet pulp and brewing wastes. Estimates of the total quantities of these components are not readily available. Estimates based on FAO data in the early 1980s (FAO 1983 and FAO 1985) suggest that they may provide a further 12-15% of the total concentrates as defined above. In the EU in 1986/87 these feeds provided 12% of overall concentrates in metabolizable energy terms (Janssens, 1990). A global overall figure for the contribution of these feeds to total concentrates (fresh weights) has been assumed in following analyses to be 12%.
For this study, recent information on the availability and utilization of concentrate feeds has been derived by analysis of data compiled in FAO Agrostat and USDA PS&D databases, as described in Appendix 2. (It may be noted that these data sources differ in origin, coverage of countries and commodities, and in some definitions of commodities, as outlined in Appendix 2; comparisons between databases of quantities of commodities utilized or traded is thus not always possible, though comparisons within datasets of regional proportional utilization and time trends will be more reliable).
Analyses are presented in following sections in two different regional classifications. Where possible, data are provided within geographical regions of the world (see Table 5 below). Information on the utilization of feeds by livestock production systems (in Section 2.4.4.) is also provided within economic and aggregated geographical regions as defined by Sere (1994). Details of classifications of regions and systems are provided in Appendix 1.
The analyses presented focus mainly on commodities derived from crop production. These commodities provide the greatest proportion of concentrate feed resources and are presumed to represent the greatest potential environmental impact of the demand for concentrates. Data are presented to illustrate the major patterns of current consumption, and therefore current environmental impact, and the trends in concentrate consumption in order to predict future impacts. Results of the analyses of feed consumption are presented in following sections in Chapter 2 and in Appendices 2 and 3. Data on production and trade are presented in Chapter 3 and Appendix 4. Data on the proportions of total production and land areas used to provide feeds are presented in Chapter 4 and Appendix 5.
Table 3 summarises FAO Agrostat data on the global total utilization for feeds of cereals, brans, oilseeds, oil cakes and meals, and roots and tubers over the period 1965/67 to 1990/92. Annual total consumption of these concentrate feeds amounted to 982 million mt averaged over 1990/92 (852 mill. mt excluding roots and tubers). (Note that quantities are expressed in commodity fresh weight 'as fed' terms. Data do not include pulses, 'other' concentrates or non-conventional feeds as defined in Section 2.2. Use of pulses may be estimated at 2% of total concentrates, amounting to 26 mill. mt in addition to the total shown for 1990/92 in Table 3, while 'other' concentrates comprise about 12% of the total or an additional 134 mill. mt). (Analysis of USDA PS&D data for the same periods provides slightly higher estimates of feed consumption in 1990/92 for cereals (631 mill. mt) and oilseeds (23 mill. mt), though similar estimates for oilmeals including fishmeal (115 mill. mt)).
Table 3 Global total utilization of concentrate feed resources 1965/67 to 1990/92
|
|
Global total utilization for feeds (1) ('000 mt per year) |
|||
|
Commodity (2) |
1965/67 |
1975/77 |
1985/87 |
1990/92 |
|
Cereals (3) |
354,808 |
496,343 |
629,802 |
600,516 |
|
Brans (4) |
72,359 |
87,155 |
113,222 |
118,946 |
|
Oilseeds (5) |
3,291 |
4,129 |
9,666 |
13,463 |
|
Oilmeals and cakes (6) |
41,301 |
66,201 |
103,631 |
119,263 |
|
Sub-total |
471,759 |
653,830 |
856,322 |
852,118 |
|
Roots and tubers (7) |
131,328 |
126,606 |
133,243 |
129,860 |
|
Total |
603,087 |
780,436 |
989,565 |
982,049 |
Source: Analysis of FAO Agrostat data
1. Annual consumption calculated as three year averages for 1965-67, 1975-77, 1985-87 and 1990-92; growth rates calculated as annual compound percentage rates between averages
2. Commodity weights are fresh 'as fed' weights; NB 'roots and tubers' includes some commodities with high moisture contents
3. Cereals including coarse grains (maize, barley, oats, rye, sorghum, millet, buckwheat, triticale, fonio and quinoa), wheat and milled rice used for feed
4. Brans including milling residues of all cereals (including rice) and pulses
5. Oilseeds including coconut, cotton, groundnut, hempseed, linseed, mustard, palm kernel, poopy seed, rape, safflower, sunflower, sesame, soyabean
6. Cakes and meals (defined as in section 2.2.) of the above oilseeds, including also oil extracted residues of olive, maize germ and rice bran, and fishmeal
7. Roots and tubers including cassava, dried cassava, cassava starch, flour and tapioca, potatoes (and products as for cassava), sweet potatoes, taro, yams and cocoyams
Cereals constitute the major proportion of concentrate feeds, amounting to over 60% of the total including roots and tubers. Brans, oilseeds, oilcakes and roots and tubers constituted 12%, 1.4%, 12% and 13% respectively of total concentrates in 1990/92 (as defined in Table 3). The contributions of cereals and brans to the total have remained constant over the recent 25 years, while oilseeds and oilcakes have increased markedly and roots and tubers declined over the period.
Global total consumption of all feeds increased consistently over the period 1965/67 to 1985/87, by 29% and 26% respectively in the two decades to 1985/87 (at annual average rates of 2.6% and 2.4%/yr). Latterly, since 1985/87, total consumption has stabilised mainly due to recessions in OECD countries and restructuring in former centrally planned economies, as outlined in Chapter 3. Consumption of oilseeds and meals has continued to grow particularly strongly throughout the period, including since 1985/87. Table 4 shows the annual percentage growth rates in the utilization of different types of feeds.
Table 4 Average annual growth rates in global total utilization of concentrate feed resources 1965/67 to 1990/92
|
|
Average annual growth rates in utilization of feeds (1) (% per year) |
||
|
Commodity |
1965/67-1975/77 |
1975/77-1985/87 |
1985/87-1990/92 |
|
Cereals |
3.41 |
2.41 |
-0.48 |
|
Brans |
1.88 |
2.65 |
0.49 |
|
Oilseeds |
2.29 |
8.88 |
3.37 |
|
Oilmeals and cakes |
4.83 |
4.58 |
2.85 |
|
Roots and tubers |
-0.37 |
0.51 |
-0.51 |
|
Total |
2.61 |
2.40 |
-0.15 |
Source: Analysis of FAO Agrostat data, see Table 3 for details of commodities
1. Annual consumption calculated as three year averages for 1965-67, 1975-77, 1985-87 and 1990-92; growth rates calculated as annual compound percentage rates between averages
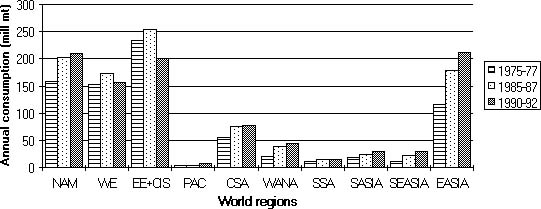
Changes in consumption of total concentrates within regions from 1975/77 to 1990/92 are illustrated in Figure 1. Consumption has slowed or declined since 1985/87 in North America (+3%), Western Europe (-10%) and E Europe and the states of the former USSR (CIS) (-21%) but has continued strongly in East Asia (+18%) and in most other developing regions. Over the whole period from 1975/77, consumption has more than doubled in W Asia and N Africa (WANA) and SE Asia, and increased by 61% in S Asia respectively, though from relatively low bases. In contrast, increases in Sub-Saharan Africa (SSA) have been only 33% and in Central and Southern America (CSA) 43%. Of most significance globally is the rate of increase on an already large base in E Asia (+83% from 1975/77 to 1990/92).
Figure 1 Annual consumption of total cereals, brans, oilseeds, oilmeals and roots and tubers concentrate feeds 1975/77 to 1990/92
Trends in annual average growth rates of consumption of total concentrates in different world regions are illustrated in Table 5. Growth rates have generally declined over recent periods in developed regions (though not in Oceania dominated by Australia and New Zealand).
Table 5 Average annual growth rates in regional utilization of total concentrate feed resources 1965/67 to 1990/92
|
|
Average annual growth rates in utilization of feeds (1) (% per year) |
||
|
Region (2) |
1965/67-1975/77 |
1975/77-1985/87 |
1985/87-1990/92 |
|
Developed regions |
|
|
|
|
North America |
0.39 |
2.59 |
0.61 |
|
Western Europe |
2.34 |
1.27 |
-2.03 |
|
E Europe and CIS |
5.01 |
0.82 |
-4.55 |
|
Oceania |
2.07 |
4.36 |
7.44 |
|
Developing regions |
|
|
|
|
C and S America |
3.62 |
3.44 |
0.46 |
|
W Asia and N Africa |
4.30 |
6.52 |
2.61 |
|
Sub-Saharan Africa |
2.64 |
2.19 |
1.40 |
|
S Asia |
2.59 |
2.72 |
4.25 |
|
SE Asia |
4.30 |
6.73 |
6.29 |
|
E Asia |
1.25 |
4.42 |
3.40 |
|
World |
2.61 |
2.40 |
-0.15 |
Source: Analysis of FAO Agrostat data, see Table 3 for details
1. Annual consumption calculated as three year averages for 1965-67, 1975-77, 1985-87 and 1990-92; growth rates calculated as annual compound percentage rates between averages
Growth has been more consistent and more buoyant in developing regions, except for Sub-Saharan Africa and Central and Southern America in recent years. Growth has been particularly strong in all Asia regions.
The proportional consumption of the different types of concentrate feeds in regions of the world in 1990/92 is presented in Table 6. Data on actual levels of consumption in 1975/77 and 1990/92, and on annual percentage growth in consumption of the different feeds between these dates are tabulated in Appendix 2.
Table 6 Proportions of concentrate feed types utilized in different world regions in 1990/92
|
|
Utilization of concentrate feeds by world regions (% world totals) |
||||
|
Region (1) |
Cereals |
Brans |
Oilseeds and meals |
Roots and tubers |
Overall |
|
Developed regions |
|
|
|
|
|
|
North America |
29 |
6.8 |
21 |
0.9 |
21 |
|
Western Europe |
15 |
9.2 |
30 |
12 |
16 |
|
E Europe and CIS |
24 |
8.1 |
10 |
29 |
21 |
|
Oceania |
0.9 |
0.5 |
0.4 |
0.1 |
0.7 |
|
Developing regions |
|
|
|
|
|
|
C and S America |
7.3 |
6.7 |
8.0 |
12 |
7.9 |
|
W Asia and N Africa |
4.8 |
7.0 |
3.3 |
0.4 |
4.2 |
|
Sub-Saharan Africa |
0.3 |
3.7 |
1.5 |
1.5 |
1.0 |
|
S Asia |
0.4 |
13 |
8.7 |
0.01 |
3.0 |
|
SE Asia |
2.3 |
9.2 |
3.8 |
0.7 |
3.0 |
|
E Asia |
16 |
35 |
12 |
44 |
22 |
|
World |
100 |
100 |
100 |
100 |
100 |
Source: Analysis of FAO Agrostat data (mean annual consumption for 1990-92, on commodity fresh weight basis)
1. World regions as defined in Appendix 1
Three regions, N America, EE+CIS and E Asia now each consume over 20% of world concentrate feeds, and W Europe a further 16%, amounting to 80% of the world total concentrates. Poorer developing regions still have very low levels of consumption such as in SSA (1%), S Asia (3%) and SE Asia (3%), despite high populations.
Developed regions are still major users of cereals, oilseeds and meals, with over 60% of global consumption of each, while developing regions make proportionally greater use of brans and roots and tubers. Brans are particularly important in Asian regions, where rice bran is a major feed resource. Roots and tubers consumption is highest in E Asia (mainly sweet potatoes in China) and in E Europe and CIS.
Changes in regional patterns of consumption follow the annual growth rate trends outlined above. Most notably, the proportions of world consumption utilized in WE and EE+CIS have declined (from 20% to 16% and 30% to 21% respectively from 1975/77 to 1990/92), with similar declines across all feed types. Meanwhile, the share of world consumption in E Asia has increased from 15% to 22%. Developing regions in general have increased their share of feed utilization, a trend which will continue as growth in demand for livestock products continues in these regions.
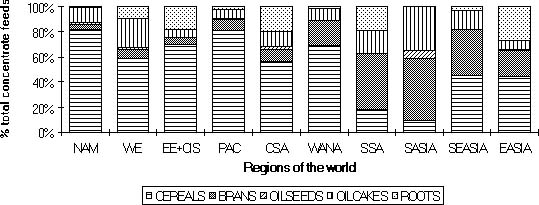
Composition of concentrates fed in world regions Figure 2 shows the percentage composition of concentrates consumed in 1990/92 in different regions of the world (see Appendix 2 Tables 7 and 8 for data). In developed regions, cereals consistently provide the major proportion of concentrate feeds, varying in 1990-92 from 59% in WE to over 80% in NAM and Oceania (PAC). Cereals are the main concentrates also in CSA and WANA. In other developing regions, brans are relatively more important, providing 20-50% of total feeds. Oilseeds and meals are significant resources in all regions, but especially in S Asia (SASIA) where they constituted a total of 41% of available feeds in 1990/92. Roots and tubers are most significant in E Asia and CSA, though still also important in EE+CIS (19%) and WE (10%).
Figure 2 Composition of concentrate feeds utilized in regions of the world 1990/92
Changes in the composition of feeds utilized within world regions between 1975/77 to 1990/92 are illustrated in Appendix 2. The most significant changes in the composition of concentrates have included increases in the proportions of oilmeals used across all regions of the world, but particularly in WE, CSA, S Asia and SE Asia. In NAM and WE there has been a shift in concentrate composition from cereals to oilseeds and meals, with relatively little change in other components.
Cereals have increased and brans generally decreased as proportions of total concentrates in the more rapidly developing regions of CSA, SE Asia and S Asia, in contrast to the patterns in SSA where cereal consumption has declined further (in absolute and proportional terms) from an already low base in 1975/77. The relative importance of roots and tubers feeds has declined consistently across all regions. Concentrate feed quality has thus generally increased as total consumption has increased.
World total amounts of the main specific feed commodities utilized are shown in Tables 7, 8 and 9 for cereals, oilmeals and roots and tubers respectively. Amongst cereals, maize is the most important feed, comprising over half of total cereals. Wheat and barley each comprise some 20% of total cereals, while sorghum, oats and millet together constitute less than 10%. Quantities of maize and wheat consumed as feed have increased progressively over the period 1975/77 to 1990/92. Barley, oats and sorghum utilization has recently declined.
Table 7 World total annual consumption of different cereals for concentrate feeds in 1975/77 to 1990/92
|
|
Annual utilization of different cereals ('000 mt) |
|||||
|
Year |
Maize |
Wheat |
Barley |
Oats |
Sorghum |
Millet |
|
1975/77 |
217976 |
71953 |
109405 |
37791 |
31937 |
1695 |
|
1985/87 |
308545 |
106651 |
129944 |
37437 |
38115 |
2752 |
|
1990/92 |
330796 |
118142 |
120805 |
27223 |
32426 |
2385 |
Source: Analysis of USDA PS&D data (mean annual consumption, on commodity fresh weight basis)
Other cereals used in concentrate feeds, not listed in Table 7, include rye (12-14 mill. mt/year) and small amounts of buckwheat, triticale, fonio and quinoa. In addition, small amounts of rice are fed in Asian regions, amounting to some 5-6 mill. mt/year (FAO 1989). These form an insignificant proportion of cereal use.
Amongst oilmeals and cakes, soyabean dominates, comprising over 60% of total oilmeals consumed. Cotton seed, rape and sunflower oilmeals each comprise about 10% of total consumption. Groundnut and palm kernel meals are of lesser importance globally. In addition to the tabulated commodities, smaller amounts of meals and cakes of copra, hempseed, mustard, linseed and safflower are fed.
Table 8 World total annual consumption of oilmeal commodities for concentrate feeds in 1975/77 to 1990/92
|
|
Annual utilization of different oilmeals ('000 mt) |
|||||
|
Year |
Soya bean |
Ground nut |
Cotton |
Rape |
Sun-flower |
Palm kernel |
|
1975/77 |
41911 |
3693 |
7201 |
3485 |
4324 |
603 |
|
1985/87 |
64995 |
4221 |
8962 |
8362 |
7610 |
1368 |
|
1990/92 |
71842 |
4824 |
10297 |
11101 |
8525 |
1808 |
Source: Analysis of USDA PS&D data (mean annual consumption, on commodity fresh weight basis)
Fishmeal provides a further 5-6 mill. mt/year. Utilization of all major oilmeals has increased progressively over the period 1975/77 to 1990/92, but particularly of soyabean, rape, sunflower and palm kernel meals (the latter from a relatively low base). Oilseeds (as distinct from oilmeals and cakes) constitute a relatively small proportion of total concentrates (<2%, compared to 12% provided by oilmeals). Amongst the seeds, soyabean and cotton seed are the main commodities making up 41 and 29% respectively of seeds fed (analysis of USDA PS&D data for 1990-92).
The most important roots and tubers (in fresh weight terms) are potatoes and sweet potatoes, these each comprising about 40% of total roots and tubers consumption (see Table 9 below).
Table 9 World total annual consumption of different roots and tubers commodities for concentrate feeds 1975/77 to 1990/92
|
|
Annual utilization of different roots and tubers ('000 mt) |
||||
|
Year |
Cassava |
Dried Cassava |
Potatoes |
Sweet potatoes |
Yams |
|
1975/77 |
17095 |
3288 |
80179 |
25595 |
305 |
|
1985/87 |
17287 |
7133 |
66720 |
41784 |
369 |
|
1990/92 |
17012 |
8668 |
52511 |
46218 |
381 |
Source: Analysis of USDA PS&D data (mean annual consumption, on commodity fresh weight basis)
On a dry matter basis, cassava, dried cassava, potatoes and sweet potatoes are each of similar importance, each comprising 20-25% of total consumption. Yams and other roots and tubers contribute less than 1% of the total. Feed consumption of potatoes has declined over 1975/77 to 1990/92 (mainly because of lower availability and demand in EE+CIS). Sweet potato consumption has almost doubled in the same period, mainly due to increased production in China.
The relative importance of commodities within regions is illustrated in Figures 3, 4 and 5 for the major cereals, oilmeals and roots and tubers commodities (data are presented in Appendix 2 Tables 9, 10 and 11). Maize is of particular importance in N America and CSA, but also in developing regions of SSA and Asia. It is relatively unimportant in W Europe and EE+CIS (20-25% of total cereal feeds) and Oceania (5%). In these regions, wheat and barley are the main cereals, each comprising about 30-40% of the total). Barley is particularly significant in WANA where it comprises over 50% of total cereal feeds. Sorghum is of lesser importance overall, but provides over 20% of cereal feeds in CSA and S Asia.
Amongst the oilmeals, soyabean is almost universally important except in Oceania, SSA and S Asia. In these areas, and in WANA, cotton seed meal is particularly important, providing 30-40% of total oilmeal feeds. Groundnut is locally significant in SSA, S Asia and SE Asia. Rape seed meal is notably important in S Asia (India) and utilization has been growing in WE and Oceania (Australia and New Zealand). Sunflower contributes over 10% of oilmeal feeds in WE, EE+CIS, WANA and SSA.
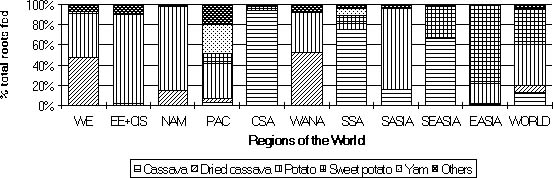
Utilization of roots and tubers feeds differs strongly between regions. Cassava is of primary importance in CSA, SSA and SE Asia. Dried cassava is prepared especially for WE and WANA markets. Potatoes are particularly important in EE+CIS (proportions of potatoes utilized are also high in N America and S Asia, though the total amounts of roots and tubers used in these regions is low). Sweet potatoes are used almost exclusively in E Asia (especially China) and to a lesser extent in SE Asia (see Wiersema, Hesen and Song, 1989 cited in Woolfe, 1992).
Figure 3 Regional composition of cereals utilized for concentrate feeds, 1990-92
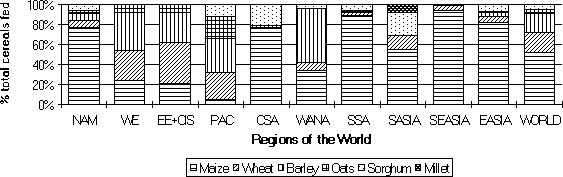
Figure 4 Regional composition of oilmeals utilized for concentrate feeds, 1990-92

Figure 5 Regional composition of roots and tubers utilized for concentrate feeds, 1990-92
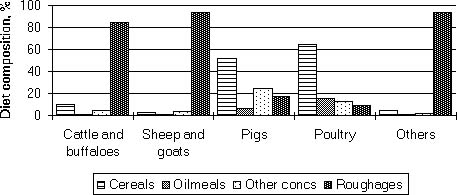
Concentrate feeds generally form a higher proportion of diets of monogastric than of ruminant livestock. Figure 6 illustrates global average diet compositions of different species reported by FAO (1983). Concentrate feeds make up over 80% and 90% respectively of the diets of pigs and poultry, though only 10% and 2% of the diets of the overall cattle/buffalo and sheep/goat populations respectively. Pig and poultry diets include, on average, some 50-60% cereals, 10-20% oilmeals and 15-25% 'other concentrates' (grain substitutes, milling by-products, non-conventional concentrates).
Figure 6 Aggregate world composition of diets for different species of livestock (after Wheeler et al 1981; in metabolisable energy equivalents)
Diet compositions vary between species and regions of the world. Pig and poultry diets in developed countries typically include 40-60% and 55-65% cereals respectively, and less than 15% milling by-products (Digest of Feed Facts and Figures 1990-91). In developing countries, diets generally include less cereals and more by-products. Typical formulations of compound feeds in India, for example, include 30-45% cereal brans (mainly rice) (Indian Poultry Industry Yearbook, 1990).
Ruminant concentrate feeds include higher proportions of 'other concentrates'. For dairy cattle in UK, for example, diets typically include 40-50% cereal milling by-products, 25% oilmeals and 20% of other ingredients such as molasses and sugarbeet pulp, though still including some 10-15% cereals (Digest of Feed Facts and Figures 1990-91). Some feeding systems for fattening beef cattle use high proportions of coarse grains as straight concentrates (for example barley in the UK) but in most cases a wide variety of milling and agro-industrial by-products may be incorporated in finishing diets (as in feedlot systems). In developing countries, the proportion of cereals in concentrates fed to ruminants is very low.
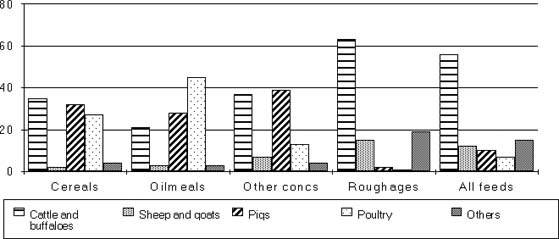
However, because of their large numbers and size, ruminant livestock actually consume roughly similar total quantities of concentrate feeds as pigs or poultry (see Figure 7). In metabolisable energy terms, cattle, small ruminants, pigs and poultry consumed averages of 35%, 3%, 33% and 29% respectively of total concentrate feeds in 1981.
Figure 7 World average utilization of feeds by different livestock species (after Wheeler et al 1981, in metabolisable energy equivalents)
Estimates of concentrate feed requirements have been made in this study for the farming systems and world regions classified by Sere (1994). These estimates have been based either on assumptions of per capita feed requirements (for ruminants), or on product outputs and feed conversion efficiencies (for non-ruminants). (This difference in approach was necessitated by the difficulties in estimation of feed efficiency for ruminant products across widely varying systems of production). Details of the assumptions required and the methods used are presented in Appendix 3.
Table 10 presents the estimated total concentrate feed requirements for the different farming systems and world regions, while Table 11 shows the consumption of concentrates by livestock species and outputs. Figures 8 and 9 illustrate (a) the comparative consumption of total concentrate feeds by farming systems and regions and (b) the consumption of concentrates for different livestock products. Appendix 3, Tables 3 and 4 present the data on the proportions of total requirements attributable to the different livestock production systems and livestock species respectively.
Global total concentrate requirements in 1992/93 are estimated at 996 mill. mt dry matter, or 1145 mill. mt fresh weight (assuming an average dry matter of 87%). This may be compared with totals of 1142 million mt (fresh weights) derived from FAO statistics on feed use of 982 mill. mt cereals, brans, oilseeds and meals and roots and tubers in 1990/92, plus the additional use of some 26 mill. mt pulses/year and 134 mill. mt 'other concentrates', see Section 2.4.1 and Table 3).
Table 10 Estimated annual utilization of concentrate feeds for all livestock production by world regions and production systems in 1992/93 ('000 mt dry matter)
|
|
Concentrate feed use for all livestock production by regions of the world ('000 mt dry matter/year) |
|||||||
|
Production system |
SSA |
WANA |
ASIA |
CSA |
OECD |
EE+CIS |
OTH DEVP |
Overall |
|
LGT |
1,398 |
798 |
492 |
1,929 |
3,687 |
0 |
0 |
8,304 |
|
LGH |
1,070 |
0 |
271 |
1,985 |
887 |
0 |
1,110 |
5,323 |
|
LGA |
1,782 |
567 |
0 |
392 |
2,391 |
0 |
1,029 |
6,162 |
|
MRT |
2,244 |
0 |
1,039 |
1,505 |
132,222 |
118,728 |
0 |
255,738 |
|
MRH |
4,733 |
0 |
15,584 |
19,827 |
6,459 |
0 |
0 |
46,603 |
|
MRA |
2,431 |
9,968 |
20,649 |
2,682 |
198 |
0 |
0 |
35,928 |
|
MIT |
0 |
0 |
30,122 |
4,208 |
29,489 |
9,629 |
0 |
73,448 |
|
MIH |
0 |
0 |
81,014 |
389 |
1,929 |
0 |
0 |
83,332 |
|
MIA |
51 |
12,066 |
33,558 |
2,493 |
6,275 |
0 |
457 |
54,900 |
|
LLM |
2,291 |
6,616 |
89,015 |
31,324 |
160,302 |
38,824 |
2,214 |
330,586 |
|
LLR |
0 |
1,165 |
0 |
0 |
19,794 |
74,517 |
0 |
95,476 |
|
Overall |
15,999 |
31,180 |
271,743 |
66,735 |
363,634 |
241,699 |
4,810 |
995,800 |
Source: Derived as described in Appendix 3
1. World regions and production systems as defined by Sere (1994), see Appendix 1
Figures in bold indicate major users of concentrates
Table 11 Estimated annual utilization of concentrate feeds for different livestock species and products by world regions and production systems in 1992/93 ('000 mt dry matter)
|
|
Concentrate feed use by regions of the world ('000 mt dry matter/year) |
|||||||
|
Species/ product |
SSA |
WANA |
ASIA |
CSA |
OECD |
EE+CIS |
OTH DEVP |
Overall |
|
Beef, veal and buffalo meat |
1,423 |
450 |
8,196 |
4,401 |
40,586 |
77,297 |
251 |
132,604 |
|
Small ruminant meat |
312 |
1,908 |
1,771 |
256 |
2,839 |
1,381 |
78 |
8,545 |
|
Cattle milk |
5,035 |
16,703 |
47,277 |
12,709 |
85,486 |
76,524 |
829 |
244,564 |
|
Pig meat |
2,114 |
21 |
128,617 |
13,416 |
135,744 |
53,885 |
639 |
334,436 |
|
Poultry meat |
3,612 |
6,535 |
30,789 |
21,961 |
62,743 |
14,139 |
1,954 |
141,733 |
|
Poultry eggs |
3,503 |
5,563 |
55,092 |
13,991 |
36,235 |
18,473 |
1,060 |
133,917 |
|
Overall |
15,999 |
31,180 |
271,743 |
66,735 |
363,634 |
241,699 |
4,810 |
995,800 |
Source: Derived as described in Appendix 3
1. World regions and production systems as defined by Sere (1994), see Appendix 1
Estimates of total consumption are dependant on the assumptions of feed intake and feed efficiency shown in Appendix 3. However, it may be noted that the relative or proportional requirements for feeds by the different systems, regions and species are not particularly sensitive to minor changes in assumptions on feed efficiencies and intakes, being mainly dependant on estimates of livestock populations and total outputs of products within systems and regions. Thus the estimates of the proportional requirements shown in Appendix 3 Tables 3 and 4 are reasonably robust.
OECD developed countries consume over a third (37%) of world total concentrates, with Asia and EE+CIS taking about a quarter each (see Figure 8 and Appendix 3 Table 3). Amongst the production systems, Landless Monogastric (LLM) systems (pigs and poultry) consume the most concentrates (about one third of the total). Mixed rainfed temperate systems (MRT), mainly consisting of dairy cattle in N America, Western Europe and EE+CIS, consume about a quarter of the total. Landless Ruminant (LLR) systems consume some 10 %, mainly for beef production, while the remainder (32%) is distributed evenly amongst the remaining mixed farming systems. Of the specific combinations of systems and regions, LLM and MRT systems in OECD countries, MRT and LLR systems in EE+CIS, and LLM systems in Asia each consume between 8-15% of total concentrate feeds. (It may be noted that much of the beef production assumed by Sere (1994) to derive from LLR systems in EE+CIS may be better classified in various mixed farming systems).
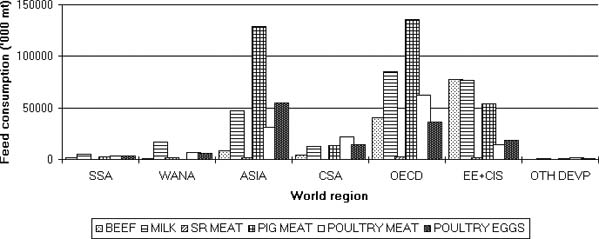
Amongst the species and products, pig meat production is estimated to consume the largest proportion of feeds (34%), especially in OECD countries and in Asia (see Figure 9 and Appendix 3 Table 4). Cattle milk production consumes almost a quarter of the total, mainly in OECD and EE+CIS, while poultry consumes a further quarter roughly evenly split between meat and egg production. Beef production is estimated to consume about 13% of the total (though this may be an overestimate as it includes consumption for dual purpose meat and milk production from non-specialist dairy cattle and buffalo populations, see Appendix 3). These figures are similar to estimates made in the early 1980s (FAO 1983), as reviewed in Section 2.4.3 above, representing a slight increase in consumption by poultry and a decrease in consumption by cattle and buffaloes since that time.
Overall, the consumption of concentrate feeds is split roughly 60% to monogastric livestock and 40% to ruminants. Amongst the regions using most concentrates, monogastrics' share of feeds appears highest in Asia (74%) and lowest in EE+CIS (33%) where ruminants consume the largest proportion (66%).
Figure 8 Estimated consumption of concentrate feeds in world regions and production systems, 1992/93
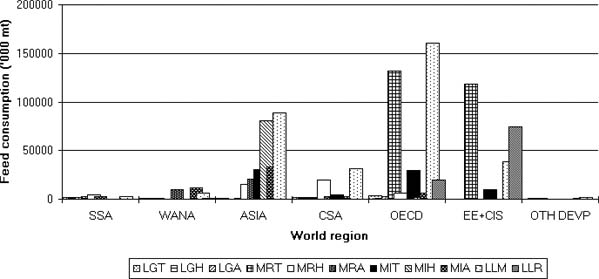
Figure 9 Estimated consumption of concentrate feeds for different livestock products in world regions, 1992/93
![]()
![]()
![]()