![]()
![]()
![]()
Vijay Paul Sharma[32]
Raj Vir Singh[33]
Steve Staal[34]
Christopher L. Delgado[35]
June 2002
This paper was produced as part of Phase I of an IFPRI-FAO project entitled "Livestock Industrialization, Trade and Social-Health-Environment Impacts in Developing Countries", funded by the Department for International Development (DFID), U.K., through the Livestock, Environment and Development (LEAD) initiative at FAO. Correspondence may be addressed to the scientific coordinator for the project, Dr. Christopher Delgado, IFPRI, 2033 K St, N.W., Washington D.C. 20006, USA. Email: [email protected]
Milk production is the most important agricultural activity in the Indian agricultural sector. At the national level, around 17% of the total value of agricultural production is derived from this sector. Its importance is further highlighted if the closely linked other livestock (meat, poultry, wool and hair, etc.) sub-sectors (accounting for a further 8.3%) are also taken into consideration. The milk sector generates a high proportion of agricultural output, especially in the northern and western parts of the country.
Milk production in the country was stagnant during the 1950s and 1960s and per capita availability declined. However, with the implementation of the Operation Flood (OF) Program in 1970 and other dairy development programs implemented by the State and Central governments, increased demand driven by increased population, higher incomes and urbanization, and with tight controls on imports of dairy products, milk output increased substantially in the country. This evolution was accompanied by an even more marked improvement in milk yields. India has emerged today as the largest milk producer in the world, surpassing 80 million tones, and this success story of Indian milk production has been written primarily by millions of smallholder producers. The OF program was instrumental in creating strong linkages among millions of smallholder producers and urban consumers. Prior to OF, the link between the producer and consumer was completely missing. It is well known that all this happened under highly regulated domestic markets, where commercial imports and exports of almost all dairy products had been banned for most of the time, and processing activity had been controlled through licensing which favored cooperatives over private entrepreneurs. However, termination of licensing requirements for setting up milk processing and product manufacturing under the MMPO in 2002 made India's dairy industry arguably one of the most deregulated industries in the world. The unmanaged deregulation of the dairy industry combined with a rapid increase in demand (domestic as well as global) for milk and dairy products, and distortions in the world dairy markets, it is widely believed, would lead to economic and social problems. These developments (domestic and international) would influence the scale of operation in dairy sector and may lead to social-health-environmental problems. Milk production certainly would become concentrated on large farms and in peri-urban or urban areas as a result of deregulation, which could have major implications for smallholder dairy producers and larger goals of employment-led economic growth, poverty alleviation, and environmental sustainability.
Like nearly all developing countries, India exhibits co-existing "organized" and "unorganized/informal" sectors for marketing of milk and dairy products. The organized or formal sector is relatively new in historical terms, and consists of Western-style dairy processing based on pasteurization, although adapted to the Indian market in terms of products. In some cases the traditional sector is quite well organized, with a complex net of market agents, with a variation in numbers of and roles of market intermediaries. The reasons underlying the existence of a large informal or traditional sector are the same as found in other countries: consumers are unwilling to pay the additional costs of pasteurization and packaging, and consumers often regard raw milk and traditional products obtained from reliable vendors as of better quality than formally processed dairy products. The dairy cooperatives comprise the single largest formal organization in terms of market share, and its share in total milk procurement has increased over a period of time and is further expected to rise in the future. However, the informal sector may still play an important role in the Indian dairy sector. The repeal of industrial licensing under new economic policy provided the opportunity for private entrepreneurs and multinational companies to invest in new processing capacities, which may lead to some structural changes in the production sector whereby the private entrepreneurs would try to reduce transaction costs and may promote large commercial dairy farms.
Commercial imports of dairy products were substantial until the early 1970s, but declined significantly in the 1980s and 1990s. However, the imports of milk powders and butter/butter oil increased substantially in the late 1990s, mainly due to low import duties on these two products as a commitment under the WTO Agreement. India has also started exporting small quantities of dairy products during the last decade, but its exports are still in their infancy. However, India has the potential to become one of the leading players in milk and milk product exports, because India is located amidst major milk deficit countries in Asia and Africa; also, the cost of milk production in India is one of the lowest due to cheap labor and traditional feeding systems. Despite these positive factors, there is a long way to go in order to improve the quality of Indian milk and milk products. In order to become globally competitive, significant investment has to be made in the supply chain of milk procurement, processing, and marketing. Also, training has to be given to the farmers and processors to improve the quality of milk and dairy products to bring them up to international standards. Animal welfare, which includes establishing norms for animal protection on the farm, during transport, and at the time of slaughter, is not currently covered under the WTO, but these issues are coming under increasing public scrutiny. Therefore, attention should be given by national authorities to reducing negative effects of commercialization of livestock farming and trade on the welfare of the animals.
Seasonality in milk production is well known in the Indian dairy sector and is more pronounced for buffaloes. Such fluctuations in supply and demand result in fluctuations in prices (producer and consumer), thus subjecting milk producers and consumers to large variations in prices during a year. The procurement prices are marginally higher during the lean season compared with the flush period. The WPI of milk relative to the WPI of food articles and all commodities decreased during 1990s, which indicates increased production of milk and/or imports of dairy products in the post-reforms era. Milk prices relative to milk input prices such as oil cakes, fodder, and cattle feed show that input prices have increased faster than milk prices in the 1990s. These trends in input prices indicate that increased milk production should come from productivity enhancement; otherwise, increases in costs will make milk and dairy products costly and unaffordable to the masses.
Of all the agricultural products, dairy product prices are the most distorted by domestic and export subsidies in developed countries, especially the European Union and the USA. World dairy product prices were expected to increase as a result of lowered market intervention in the forms of lower export subsidies and support prices and less public stocks in the post-WTO period. Stronger demand for dairy products was expected from a rise in consumer income, as economic growth becomes more broad-based in developing countries; and the gaps between EU and world dairy product prices were expected to shrink. However, world dairy prices witnessed a declining trend in the post-WTO period due to high WTO-compatible export subsidies, large support prices, and other protections. The fall in world prices had an adverse impact on domestic prices in many developing countries, including India.
Diseases, along with the non-availability of feed resources and nutrition, are the most important constraints to milk production. However, with smallholder production systems, the situation is more serious because of inadequate knowledge and access to appropriate corrective measures and resources. In India, the government, cooperatives, the private sector, and a few non-governmental organizations (NGOs) provide veterinary services and artificial insemination facilities to the dairy farmers. However, it is well known that the quality of the veterinary services provided by public sector institutions is poor, and that institutions providing these services are highly inefficient. Therefore, there is a need to restructure and reorient the livestock health and breeding services and extension services providing institutions to make the Indian dairy sector globally competitive.
In the light of the fast-changing global trade regime, the outlook for technological development in the Indian dairy sector appears to be bright. In order to tap the global dairy market to India's advantage, more scientific management of dairy animals in terms of breeding, feeding, health care, and management needs to take place. More concentrated milk production and milk sheds may develop. Efforts for clean milk production and animal health and welfare issues will occupy special significance. The Indian dairy industry will focus on value creation through an integrated approach to the market and the development of a range of value-added products and production and processing methods. The strategic objectives will be to provide a range of products that enhance health and well-being; new product innovations that respond to changes in food habits, lifestyle, and design; sustainable dairy production systems (socially, economically, and environmentally); food safety and quality; market access; and improved animal health and welfare, with a focus on vertical integration of the value chain.
The increase in demand for dairy products will put increasing pressure on dairy production systems. Traditional breeds and feeding practices are likely to give way to high-yielding breeds, intensification of production systems, increased disease risks, pollution and animal health issues, and a greater reliance on feeds and concentrates. Currently, Indian dairy farming is dependent on crop residues, natural resources, and open grazing as sources of feed; however, expansion of these traditional sources of feeds and fodder to support a large increase in dairy production is unlikely as available grazing areas and other common property resources (CPRs) are shrinking and are already degraded. Therefore, if milk production is to increase, then additional output will have to come from modern systems that are based on stall-feeding and that use more concentrates.
Rising human needs for milk and other livestock products have placed the environment in conflict with livestock. The rapidly increasing demand for dairy products in urban areas has given rise to haphazard growth of production centers in peri-urban and urban areas that are essentially detached from their supporting land base, and often generate a large amount of waste that contaminates the soil and groundwater. Foul odors usually emanate from animal wastes if not treated or disposed of properly, leading to air pollution. Livestock product processing plants release large amounts of waste into the environment, polluting land and surface waters as well as posing a serious human health risk. Because of weak infrastructure such as rural roads and communication, processing plants operate in urban areas where discharge of waste material is uncontrollable. Pollution of the food chain is also a major issue, and pesticides, nutrients, feed additives, hormones, and veterinary drugs used in excessive quantities can contaminate the food chain.
As discussed in the main report, the study is based on numerous official documents, newspaper and journal articles, and several interviews that were conducted with various stakeholders in the Indian dairy sector. The interviews were conducted on a 'not for attribution' basis to encourage candour, and therefore individual comments are not attributed by name. The goal of this section is by no means to provide an evaluation of livestock industrialization and its implications for social-health-environment issues, and indeed, this method does not lend itself to such a policy exercise. Instead, we hope to shed light on circumstances, actors, and forces that guided reforms in this sector in a particular direction, and by so doing, improve understanding how international and domestic forces influence the scale of operations in milk production, processing, and marketing in India and how these changes influence the attainment of social-health-environment (SHE) objectives. The study has identified some of the key policy/structural issues that need to be investigated both at the macro- and the micro-level (based on farm data) to find out answers to some of the issues raised in this report.
Dairying is an important part of the Indian agricultural economy. At the national level, about 17% of the total value of output from agriculture derives from this sector, placing Indian milk sector in first place followed by rice (14.4%) and wheat (8.7%) in 1998-99 (CSO, 2001). From chronic shortages, India has now become the largest producer of milk in the world, with estimated production of about 81 million tons in 2001. This success story of Indian milk production has been written primarily by millions of rural producers, and the major share of credit goes to women dairy farmers. In India, dairying is dominated by smallholder production systems; almost 70% of the milk producers in India are landless small and marginal farmers who own one or two animals. It is well known that the Indian dairy sector has developed in a highly regulated and protectionist economy. However, India initiated major macro-economic reforms in the early 1990s that encourage the liberalization of all sectors of the economy, and the dairy sector was no exception. This was reinforced with the signing of the Uruguay Round Agreement on Agriculture (URAA) in 1994. This increasingly exposed the Indian dairy sector to world dairy markets that have been highly distorted by policies of high tariffs, domestic support, and export subsidies in developed countries. There is likely to be restructuring of the dairy sector around the world, and it would be interesting to examine the likely implications of these changes for the Indian dairy sector under the new economic environment of trade liberalization and globalization.
This paper analyzes the changes in dairy markets, policies, and trade over the past two decades and discusses what can be expected in the next decade. We analyze the changes in production, consumption and trade, as well as the changes in policies and the industry structure, and discuss how various factors have affected the market and trade situation. The paper is organized as follows: we first discuss the macro-view of the Indian dairy sector. Then we discuss policy changes and the expected effects of globalization and trade liberalization on the scale and scope of production. In the next section we discuss the changes in the cost and return structure of dairy production and the processing sector, trends in input and output prices, and breeding and health services. In the last section we discuss the impacts of commercialization of the dairy sector on socioeconomic-health-environment issues.
Dairy enterprise is considered a "treasure" of the Indian economy, particularly for rural systems. It provides nutrition, draft animal power, organic manure, supplementary employment, cash income, and a 'cushion' for 'drought proofing' in India (Patel, 1993; Paroda, 1998). The sector involves millions of resource-poor farmers, for whom animal ownership ensures critical livelihood, sustainable farming, and economic stability. Dairying in the recent decades has been considered a vital component in the diversification of Indian agriculture, where crop farming is beset with stagnating growth and low absorption of unskilled agricultural laborers. In order to alleviate the problem of unemployment/under-employment and to maintain domestic tranquility, diversification of crop production into non-crop enterprises like dairy farming is of vital importance (Pandey, 2000; Alagh, 2002).
At the macro-level, the gross domestic product (GDP) from livestock is estimated about Rs. 98,421 crore (current prices), contributing about 22% to the agricultural gross domestic product (GDP) and about 5.5% to the national GDP (CSO, 2001). Among various livestock products, milk constitutes the major share (67%) in value of outputs from the livestock sector (Figure 1.1) and is the single largest commodity contributing to the value of output from agriculture.
During the last several decades, the contribution of agriculture and allied sectors to the national GDP has declined. Agriculture, which used to account for about 55% of the GDP in 1951-52, now accounts for around 25% of the GDP (GOI, 2002). However, the livestock sector in general and the dairy sector in particular have been among the few growth sectors in India. Its contribution to national GDP has increased from 4.8% in 1980-81 to about 5.5% in 1999-2000 (Table 1.1). The share of livestock in agricultural GDP has also increased from about 14% in 1980-81 to about 22% in 1999-00. In developing countries like India, official statistics often underestimate the overall contribution of livestock, for obvious reasons.
Table 1.1 Share of agriculture and livestock in the Gross Domestic Product of India (at current prices)
|
Year |
GDP (Agriculture) |
GDP (Livestock sector) |
Share of Livestock sector in Agricultural GDP (%) |
||
|
Rs. crore |
% share |
Rs. crore |
% share |
||
|
1980-81 |
42,466 |
33.41 |
5,913 |
4.83 |
13.92 |
|
1995-96 |
277,846 |
26.0 |
64,961 |
6.09 |
23.38 |
|
1996-97 |
334,029 |
27.0 |
74,700 |
6.04 |
22.36 |
|
1997-98 |
352,753 |
25.5 |
84,072 |
6.07 |
23.83 |
|
1998-99 |
428,680 |
26.6 |
96,905 |
6.01 |
22.61 |
|
1999-00 |
443,923 |
24.8 |
98,421 |
5.51 |
22.17 |
Source: CSO (2001)
The livestock sector alone provides regular employment to 18.4 million people in principal/subsidiary status, constituting about 5% of the total workforce (GOI, 2002). Dairying at the micro-level provides employment and income to more than 70 million farm families directly in India. Studies conducted across the country have indicated that on average, a milch animal provides annual employment ranging from 90 to 150 days depending on the breed and region. Around 10% of agricultural laborers seek gainful employment in dairy farming. It is estimated that each 6-10 kg per day of additional milk processed in India generate one person-day of employment for feeding and health care (National Livestock Policy, 1996; Mishra, 1999). With regard to income, an annual income of Rs. 1,200-10,000 per milch animal is realized, depending on breed and region. Dairying is found to provide about 20% of farm employment and about 30% of family income (Ramasamy, 2000).
Indian dairy farming is basically a smallholder production system, characterized by milk production by the masses rather than mass production of milk. More than 80 million households (about 73% of rural households) keep some type of livestock. The base for Indian dairying is provided by millions of landless agricultural laborers and marginal and small farmers who maintain one or two milch animals of low genetic potential for milk production, primarily fed on crop residues and byproducts, and reared with the help of under-employed family members, mostly female workers. Although dairying is becoming more commercialized in some areas, it predominantly remains subsistence farming constituting a complementary/supplementary enterprise to crop farming, with regular sales of surplus production.
Dairy farmers in India are by and large illiterate, resource-poor, and low risk-bearers. They often exhibit a low level of farming innovation; in the majority of cases, they are either non-adapters or late adopters of modern technologies. Their average family size is moderate, around 5 persons. The marketable surplus of milk is about 60% of total milk production.
On marginal farms, it was estimated that the introduction of dairy enterprise increases the average farm income from Rs. 12,801 to Rs. 18,163 showing an increase of 42% per annum. On small farms, a similar trend was observed, with average farm increasing from Rs. 33,301 to Rs. 70,664 (an increase of 112%) resulting from the introduction of dairy (Kalra, et al., 2000). A similar trend was observed in other situations. In a well-planned project on integrated milk and crop production for increased productivity, employment, and farm income in the villages around Karnal, conducted by the National Dairy Research Institute from 1995 onward in 40 villages around Karnal, it was observed that labor absorption of different groups of households due to dairy farming increased differently, with an average increase of 21% in the project area (225 man-equivalent days) over the control area (187 man-equivalent days) (Table 1.2). Not only did dairy enterprise increase income and employment, but it also increased female labor utilization in different groups of rural households. On average, female labor utilization in dairy enterprise was 81 man-equivalent days, or 33% of the total labor employment of 242 man-equivalent days in dairy farming. The share of female labor utilization varied in different groups, being maximum in landless laborers (46%) followed by medium farms (32%) (Singh, et al. 1995). Within dairy operations, 47% of labor is utilized for bringing fodder, 12% for grazing, 10% for chaffing, 15% for feeding, 7% for cleaning, and 10% for milking (Singh and Kairon, 1996).
Table 1.2 Employment in dairy farming systems
(MED/Household/Annum)
|
Category of households |
Control area |
Project area |
Percentage change |
|
Landless |
120.45 |
172.01 |
42.81 |
|
Marginal |
144.63 |
177.48 |
22.71 |
|
Small |
196.19 |
204.86 |
4.42 |
|
Medium |
242.73 |
313.90 |
29.32 |
|
Large |
436.63 |
448.49 |
2.72 |
MED: man-equivalent days
Source: Singh C.B., D.S. Sohi and J.P. Dhaka (1995)
Owing to their poor financial condition and poor networks of organized financial institutions, farmers more often than not approach private money lenders for credit and enter into some sort of marketing contracts for selling milk, normally to the disadvantage of farmers. On the other hand, regular milk vendors (dudhias) often provide credit at reasonable terms, an important source of financing to small farmers. Village-level extension workers (Gram sevaks), elite farmers of the village, and peer groups are the normal sources of information and modern technology for dairy farmers in the country. Kisan/Dairy melas also serve as sources of information to the farmers in selected areas.
India owns one of the largest livestock populations in the world. It accounts for about 57% of the world's buffalo population and 16% of the cattle population (GOI, 2002). Between 1951 and 1992, the period for which data are available from the Livestock Census, the stock of cattle and buffaloes together increased from 198.7 million to 289 million (45.4%). Cattle population grew by about 0.76% per year between 1951 and 1992, while buffalo population almost doubled (2.24% per year) during the same period (Table 1.3). This trend was uniform during all the inter-census years of this period, and both cattle (1.35%/year) and buffalo stocks (2.39%/year) witnessed a significant acceleration in growth from 1977 to 1982, compared to the previous five years. Between 1956 and 1961, the rate of increase of cattle (2.04%/year) as well as of buffaloes (2.66%/year) was the highest among all the sub-periods considered. This period also saw increases in agricultural production by increasing crop areas, which in turn required greater animal draft power. Secondly, the farmers saw incentives for increased milk production in the form of rising milk prices. The turning point in the bovine working male population was 1977. The male cattle population declined by over 12 million from 73.22 million to 61.14 million between 1977 and 1982, and the corresponding decline among male buffalo population was over 1.96 million (GOI, 1999). This declining trend, however, is not uniform across the states. Agriculturally progressive states like Punjab, Haryana, Andhra Pradesh, Kerala, Tamil Nadu witnessed a sharp decline in working male numbers due to farm mechanization, while the less progressive states like Assam, Bihar, Madhya Pradesh, Orissa, West Bengal exhibited increasing dependence on work animals.
Table 1.3 Growth pattern of livestock population in India: 1951-1992
(Million)
|
Species |
1951 |
1956 |
1961 |
1966 |
1972 |
1977 |
1982 |
1987 |
1992 |
|
Cattle |
155.3 |
158.7 |
175.6 |
176.2 |
178.3 |
180.0 |
192.45 |
199.69 |
204.58 |
|
Adult female cattle |
54.4 |
47.3 |
51.0 |
51.8 |
53.4 |
54.6 |
59.21 |
62.07 |
64.36 |
|
Buffalo |
43.4 |
44.9 |
51.2 |
53.0 |
57.4 |
62.0 |
69.78 |
75.97 |
84.21 |
|
Adult female buffalo |
21.0 |
21.7 |
24.3 |
25.4 |
28.6 |
31.3 |
32.5 |
39.13 |
43.81 |
|
Total bovines |
198.7 |
203.6 |
226.8 |
229.2 |
235.7 |
242.0 |
262.36 |
257.82 |
289.0 |
|
Total livestock |
292.8 |
306.6 |
335.4 |
344.1 |
353.4 |
369.0 |
419.59 |
445.28 |
470.86 |
|
Annual growth rates (%) |
1951-56 |
1956-61 |
1961-66 |
1966-72 |
1972-77 |
1977-82 |
1982-87 |
1987-92 |
|
|
Cattle |
0.43 |
2.04 |
0.07 |
0.24 |
0.19 |
1.35 |
0.74 |
0.48 |
|
|
Adult female cattle |
-2.76 |
1.52 |
0.31 |
0.61 |
0.45 |
1.63 |
0.95 |
0.73 |
|
|
Buffalo |
0.68 |
2.66 |
0.69 |
1.61 |
1.55 |
2.39 |
1.71 |
2.08 |
|
|
Adult female buffalo |
0.66 |
2.29 |
0.89 |
2.40 |
1.82 |
0.76 |
3.78 |
2.28 |
|
|
Total bovines |
0.49 |
2.18 |
0.21 |
0.56 |
0.53 |
1.63 |
1.01 |
0.94 |
|
|
Total livestock |
0.93 |
1.81 |
0.51 |
0.53 |
0.87 |
2.60 |
1.20 |
1.12 |
|
Source: Basic Animal Husbandry Statistics 1999, Department of Animal Husbandry and Dairying, Ministry of Agriculture, Government of India
Within the cattle stock, the share of crossbred cattle increased from 5.7% in 1987 to about 7.5% in 1992 (Table 1.4). After an initial slow start during the 1960s, crossbreeding picked up very fast, and the successive rounds of livestock census clearly established the speed with which crossbreeding spread in different parts of the country. In 1992, crossbred cattle constituted about 4.5% of total cattle and about 9.5% of total cows in the country. In states like Punjab and Kerala, the proportion of crossbred cows is substantially higher compared to other states. The density of total and female cattle and buffalo population per hundred hectares for selected states is presented in Tables 1.5 and 1.6. The density of crossbred cows increased from 2.7 in 1982 to 5.7 in 1992 while in case of indigenous cows it declined from 52.8 in 1987 to 49.8 in 1992, which shows the increasing importance of crossbred cows over indigenous cows. The density of female buffaloes also increased significantly from 30.2 to 36 between 1982 and 1992.
Table 1.4 Share of crossbred cattle in total cattle, and share of crossbred milch cows in total milch cows in major states: 1987-1992
|
State |
Share of crossbred cattle in total cattle |
Share of crossbred breedable cattle in total cattle |
Annual growth rate (%) |
|||
|
1987 |
1992 |
1987 |
1992 |
Crossbred cows |
Indigenous cows |
|
|
Andhra Pradesh |
3.15 |
4.42 |
4.83 |
8.36 |
8.71 |
-3.56 |
|
Bihar |
0.83 |
0.86 |
1.21 |
1.21 |
1.05 |
1.22 |
|
Gujarat |
4.46 |
6.12 |
4.66 |
5.96 |
8.63 |
3.35 |
|
Haryana |
11.01 |
19.52 |
12.72 |
22.73 |
12.67 |
-1.97 |
|
Himachal Pradesh |
7.13 |
12.98 |
8.95 |
16.97 |
16.79 |
-1.22 |
|
Karnataka |
7.07 |
4.75 |
10.60 |
7.14 |
-6.29 |
3.29 |
|
Kerala |
49.91 |
49.91 |
52.30 |
52.28 |
0.68 |
0.70 |
|
Madhya Pradesh |
0.38 |
0.73 |
0.52 |
1.03 |
15.14 |
-0.18 |
|
Maharashtra |
NA |
10.16 |
NA |
15.54 |
NA |
-2.97 |
|
Orissa |
4.13 |
4.33 |
5.80 |
6.20 |
1.31 |
0.06 |
|
Punjab |
55.80 |
55.96 |
62.08 |
61.86 |
0.47 |
0.58 |
|
Rajasthan |
0.67 |
1.03 |
0.72 |
0.99 |
8.71 |
1.06 |
|
Tamil Nadu |
12.21 |
19.82 |
15.25 |
24.35 |
10.91 |
-1.29 |
|
Uttar Pradesh |
9.83 |
9.74 |
8.93 |
9.33 |
1.32 |
0.55 |
|
West Bengal |
3.51 |
5.50 |
4.93 |
7.56 |
7.70 |
-2.97 |
|
All India |
6.33 |
8.40 |
7.44 |
10.16 |
7.09 |
0.01 |
Source: Basic Animal Husbandry Statistics 1999, Department of Animal Husbandry and Dairying, Ministry of Agriculture, Government of India
Table 1.5 Density of cattle and buffalo population in selected states of India
(numbers/1000 hectares)
|
States |
Cattle |
Buffaloes |
Total Bovine |
||||||
|
1982 |
1987 |
1992 |
1982 |
1987 |
1992 |
1982 |
1987 |
1992 |
|
|
Andhra Pradesh |
101.3 |
101.8 |
85.8 |
66.7 |
72.1 |
71.7 |
168.0 |
173.9 |
157.6 |
|
Bihar |
152.1 |
201.8 |
236.8 |
43.7 |
47.2 |
57.2 |
195.8 |
249.0 |
294.0 |
|
Gujarat |
64.1 |
60.1 |
61.8 |
31.4 |
43.4 |
47.9 |
95.5 |
103.4 |
109.7 |
|
Haryana |
40.2 |
46.9 |
36.5 |
57.8 |
81.7 |
74.7 |
98.0 |
128.6 |
111.2 |
|
Himachal Pradesh |
229.1 |
230.2 |
222.5 |
64.9 |
81.4 |
72.0 |
294.0 |
311.6 |
294.6 |
|
Jammu & Kashmir |
237.7 |
265.1 |
284.5 |
57.6 |
54.2 |
67.9 |
295.3 |
319.3 |
352.3 |
|
Karnataka |
100.6 |
83.4 |
106.1 |
32.5 |
33.0 |
34.3 |
133.1 |
116.3 |
140.4 |
|
Kerala |
106.6 |
117.5 |
115.7 |
14.1 |
11.3 |
9.7 |
120.7 |
128.8 |
125.4 |
|
Madhya Pradesh |
124.6 |
125.8 |
120.5 |
25.0 |
28.0 |
33.5 |
149.6 |
153.8 |
154.0 |
|
Maharashtra |
79.3 |
81.9 |
83.0 |
19.5 |
22.9 |
25.9 |
98.8 |
104.8 |
108.9 |
|
Orissa |
147.9 |
150.0 |
147.0 |
15.2 |
16.6 |
16.3 |
163.1 |
166.5 |
163.3 |
|
Punjab |
NA |
38.6 |
38.5 |
66.0 |
76.1 |
79.6 |
NA |
114.7 |
118.1 |
|
Rajasthan |
72.6 |
82.1 |
58.0 |
32.5 |
47.6 |
38.2 |
105.1 |
129.7 |
96.2 |
|
Tamil Nadu |
150.0 |
138.9 |
131.3 |
46.5 |
46.5 |
39.8 |
196.5 |
185.4 |
171.1 |
|
Uttar Pradesh |
105.6 |
107.7 |
99.8 |
63.7 |
74.7 |
78.2 |
169.3 |
182.4 |
178.0 |
|
West Bengal |
211.5 |
242.4 |
200.2 |
13.3 |
13.9 |
11.9 |
224.9 |
256.3 |
212.0 |
|
All India |
108.7 |
115.5 |
110.3 |
39.4 |
43.9 |
45.4 |
148.1 |
159.5 |
155.7 |
NA: data not available
Source: Livestock Census (various issues)
Table 1.6 Density of female cattle and buffalo population in selected states of India
(number/1000 hectares)
|
States |
Crossbred Cattle |
Indigenous Cattle |
Buffaloes |
||||||
|
1982 |
1987 |
1992 |
1982 |
1987 |
1992 |
1982 |
1987 |
1992 |
|
|
Andhra Pradesh |
0.9 |
2.1 |
2.9 |
49.0 |
44.1 |
34.1 |
52.0 |
58.9 |
61.1 |
|
Bihar |
0.8 |
0.9 |
1.1 |
62.8 |
95.2 |
111.6 |
31.6 |
34.2 |
41.4 |
|
Gujarat |
0.3 |
1.3 |
1.8 |
27.2 |
25.0 |
27.5 |
28.3 |
40.3 |
44.3 |
|
Haryana |
2.4 |
3.4 |
4.8 |
17.7 |
21.7 |
15.7 |
47.3 |
67.3 |
59.9 |
|
Himachal Pradesh |
7.9 |
10.5 |
20.2 |
100.8 |
99.9 |
91.9 |
60.5 |
67.8 |
68.8 |
|
Jammu & Kashmir |
10.1 |
31.1 |
39.6 |
121.5 |
114.4 |
111.8 |
46.9 |
45.3 |
56.3 |
|
Karnataka |
3.7 |
4.9 |
3.9 |
48.8 |
40.2 |
51.5 |
26.8 |
27.9 |
28.3 |
|
Kerala |
42.5 |
51.8 |
51.0 |
41.4 |
48.2 |
47.5 |
6.6 |
6.9 |
5.9 |
|
Madhya Pradesh |
0.2 |
0.3 |
0.6 |
59.8 |
59.7 |
56.2 |
20.0 |
21.8 |
22.7 |
|
Maharashtra |
1.7 |
NA |
6.6 |
34.9 |
39.3 |
33.0 |
15.8 |
18.7 |
21.1 |
|
Orissa |
1.8 |
4.4 |
4.5 |
70.1 |
69.6 |
67.6 |
7.0 |
7.5 |
7.4 |
|
Punjab |
NA |
15.5 |
15.6 |
NA |
8.6 |
8.8 |
53.3 |
67.5 |
71.2 |
|
Rajasthan |
0.2 |
0.5 |
0.5 |
42.2 |
48.8 |
34.9 |
28.1 |
41.9 |
33.3 |
|
Tamil Nadu |
7.8 |
11.8 |
19.3 |
67.0 |
63.2 |
57.8 |
36.8 |
39.1 |
38.7 |
|
Uttar Pradesh |
3.5 |
3.8 |
4.1 |
36.1 |
39.3 |
38.6 |
47.4 |
55.6 |
59.2 |
|
West Bengal |
5.4 |
6.2 |
8.7 |
106.6 |
122.1 |
105.2 |
4.4 |
4.4 |
3.9 |
|
All India |
2.7 |
4.3 |
5.7 |
48.6 |
52.8 |
49.8 |
30.2 |
34.8 |
36.0 |
NA: data not available
Source: Livestock Census (various issues)
The demand for livestock products, especially milk and meat, in India has increased considerably in the recent years, and has a strong potential for further growth. Several socioeconomic indicators underlie this trend. The per capita consumption of milk in many parts of the country is low compared to minimum nutritional standards and to that of many developed and developing countries. The demand for milk and dairy products is income-elastic, and growth in per capita income is expected to increase demand for milk and milk products. Empirical evidences show that the composition of the food basket of an average Indian is gradually shifting towards livestock products (Radhakrishan and Ravi, 1990; Kumar, 1998). Other socioeconomic and demographic factors such as urbanization, changing food habits, and lifestyle also reinforce growth in demand for dairy products.
The per capita availability of milk in the country has grown at a rate of 3.02% per annum from 1980-81 to 1990-91, and at 2.19% per annum from 1990-91 to 1998-99, with an average annual growth rate of 2.52% from 1980-81 to 1998-99 (Saxena, 2000). The imports of milk products have declined over the years, while exports have slightly increased. However, net imports of milk equivalent have been very small in relation to total domestic milk production (0.01%). Therefore, domestic consumption of milk has remained more or less equal to the domestic production of milk. Milk consumption varies widely across regions and economic groups, and also between urban and rural households. The changing consumption pattern of milk in the country is presented in Figure 1.2. Liquid milk comprises the largest single share of the dairy product consumption profile. The share of fat-based products like ghee showed a declining share, and that of western products like cheese and ice cream witnessed an increasing trend and is expected to increase further due to changes in food habits, marketing strategies, income levels, changes in demographic factors, etc.
A study conducted by the National Council of Applied Economic Research (NCAER) in dairy cooperative societies in Operation Flood (OF) areas showed that milk consumption levels in OF areas vary across size groups and regions and are substantially higher than the national average (Table 1.7). Between 1988-89 and 1995-96, the per capita consumption of milk increased from 290 gms to 339 gms at the aggregate level. A similar trend was observed for individual zones. The consumption of fluid milk rose sharply in the southern and eastern zones and remained almost constant in the western zone and declined in the northern zone (Shukla and Brahmankar, 1999).
Table 1.7 Per capita milk consumption (gm/capita) in Operation Flood Areas: 1995-96
|
Zone |
Landless |
Marginal |
Small |
Semi-medium |
Medium |
Large |
|
North |
452 |
422 |
515 |
541 |
687 |
678 |
|
West |
212 |
212 |
234 |
236 |
226 |
208 |
|
South |
304 |
271 |
308 |
304 |
300 |
389 |
|
East |
224 |
264 |
239 |
243 |
237 |
245 |
|
All Zones |
318 |
285 |
339 |
348 |
444 |
445 |
Source: Shukla and Brahmankar (1999)
Figure 1.1 Consumption patterns of milk and milk products in India: 1951-95
Source: Dairy India (1997)
Given the high income elasticity of demand for milk, the demand for milk and milk products is expected to grow at a rapid rate. A study conducted by Saxena (2000) using NSS data for 1993-94 showed that the income elasticity of demand for milk and milk products is higher (1.96 national level) in rural areas (ranging from 1.24 in Punjab to 2.92 in Orissa) compared to urban areas (ranging from 0.99 in Punjab to 1.78 in Bihar). The northern region in general and Gujarat in the western region show low-income elasticity of demand for milk and milk products. The high values of income elasticity for different states in the Eastern region - varying from 2.5 to 2.9 in rural areas and from 1.5 to 1.8 in urban areas show a very strong preference for milk and milk products with an increase in income in these regions. Further increases in per capita income and changing consumption patterns would lead to acceleration in demand for milk and other livestock products in India and is thus expected to give a boost to this sector. Radhakrishna and Ravi (1992), Gandhi and Mani (1995), Kumar (1998), Dastagiri (2001) and many others have also estimated demand and income elasticity of demand for milk and milk products, which show similar patterns (Table 1.8).
Table 1.8 Income/expenditure elasticity of demand and projections of demand for milk in India
|
|
Rural |
Urban |
Demand 2020 (million tons) |
|
Radhakrishna & Ravi (1992) |
1.15 |
0.99 |
n.a. |
|
Gandhi and Mani (1995) |
1.70 |
1.06 |
n.a. |
|
Kumar (1998) |
n.a. |
n.a. |
126.0 - 182.8@ |
|
Saxena (2000) |
1.96 |
1.32 |
85.7# |
|
Delgado, et al. (2001) |
n.a. |
n.a. |
132.0 |
|
Dastagiri (2001) |
1.36 |
1.07 |
147.21 |
Note:
#: Estimates for 2007-08;
n.a.: not available;
@:estimates based on 4% growth in GDP (126.0), 5% growth (142.7) and 7% growth in GDP (182.8);
According to a study conducted by Delgado et al. (2001), the per capita consumption of milk products in developing countries is expected to be on average only one-third that of developed countries in 2020, yet in aggregate terms, 60% of the world's milk consumption will take place in the developing countries. This is a major change from the early 1990s when the developed countries consumed 59% of the world's milk. The projected annual growth rate for milk is 4.3% from 1993 to 2020. Kumar (1998) projects a 2020 demand for milk of 142.7 million tons at 5% growth in GDP and 182.8 million tons at 7% growth in GDP. However, Saxena (2000) projected the total national demand for milk to reach its peak at 85.7 million tons in 2007-08 and decline thereafter. He argued that the domestic market may expand if a rise in per capita income in the future is more favorable towards lower income groups and regions, as the income elasticity for such groups and regions (eastern) is much higher than the average. There are wide differences in these estimates, and the differences are mainly due to different assumptions of elasticity, population projections, and other parameters. However, it is clear that domestic demand for dairy products is going to increase substantially in the years to come. Apart from this, there may be good opportunities in the export market. In order to cater to both domestic and external markets, the production of milk and dairy products should be targeted for rapid growth.
Milk production in the country was more or less stagnant during the 1950s and 1960s, and annual production growth was negative in many years. Milk production was estimated at about 17 million tons in 1950-51, rising to about 20 million tons in 1960-61 and 22 million tons in 1970-71. The annual compound growth rate during the first decade after independence was about 1.64% and this growth rate declined to 1.15% during the 1960s and the early 1970s. The performance of the Indian dairy sector over the last three decades has been extremely impressive. Milk production in the country has more than tripled to about 81 million tons between 1970-71 and 2000-01, with an average increase of about 4.5% per annum. The giant leap in milk production in the country is striking (Figure 1.3). It can be attributed mainly to increased demand driven by increased population, higher incomes and urbanization, and tight controls on imports of dairy products (Candler and Kumar, 1998). The period was also accompanied by the successful implementation of Operation Flood and other dairy development programs implemented by the State and Central governments, which although large in scale, only directly affected a small proportion of farmers. The growth in milk production during the decade of 1970s was about 4.5%, increasing to about 5.5% in the 1980s (Table 1.9). During the last decade (1990-91 to 2000-01), milk production in India increased at a growth rate of around 4.2%, which is much higher than the global rate of about 1%.
Table 1.9 Estimates of milk production and the growth rate of milk production in India: 1950-51 to 2000-01
|
Year |
Milk production |
Year |
Milk production |
|
1950-51 |
17.0 |
1991-92 |
55.7 |
|
1955-56 |
19.0 |
1992-93 |
58.0 |
|
1960-61 |
20.0 |
1993-94 |
60.6 |
|
1968-69 |
21.2 |
1994-95 |
64.0 |
|
1973-74 |
23.2 |
1995-96 |
66.2 |
|
1980-81 |
31.6 |
1996-97 |
69.1 |
|
1985-86 |
44.0 |
1997-98 |
70.8 |
|
1986-87 |
46.1 |
1998-99 |
74.7 |
|
1988-89 |
48.4 |
1999-00 |
78.1 |
|
1990-91 |
53.9 |
2000-01 |
81.0 |
|
Cumulative growth rate (%/annum) |
|
||
|
1950-51 to 1960-61 |
1.64 |
||
|
1960-61 to 1973-74 |
1.15 |
||
|
1973-74 to 1980-81 |
4.51 |
||
|
1980-81 to 1990-91 |
5.50 |
||
|
1990-91 to 2000-01 |
4.21 |
||
Source: Basic Animal Husbandry Statistics 1999, Department of Animal Husbandry and Dairying, Ministry of Agriculture, Government of India
The major milk producing states in the country are Uttar Pradesh, Punjab, Rajasthan, Madhya Pradesh, Maharashtra, Gujarat, Andhra Pradesh, Haryana, Tamil Nadu, and Karnataka, accounting for about three-fourths of total milk production in the country. State-wise shares of Indian milk production for selected years in the 1980-97 period are shown in Table 1.10. Uttar Pradesh is the largest milk producing state, producing about 13.5 million tons of milk, followed by Punjab (7.6 million tons), Rajasthan (6.2 million tons), Maharashtra (5.6 million tons), and Madhya Pradesh (5.4 million tons) in 1998-99 (GOI, 1999). During 1982-83 (TE), the top five milk producing states were Uttar Pradesh (18.5%), Punjab (10.1%), Rajasthan (9.8%), Gujarat (6.8%), and Haryana (6.6%), accounting for more than half of total milk production (Figure 1.4). However, in the triennium ending 1998-99, Gujarat and Haryana lost their position among the top five producers. The top five milk producing states in 1998-99 were Uttar Pradesh (18.1%), Punjab (10.1%), Rajasthan (8.2%), Madhya Pradesh (7.5%), and Maharashtra (7.4%), and these states accounted for about 51% of milk produced in the country. The share of Karnataka, Kerala, Madhya Pradesh, Maharashtra, Tamil Nadu, and West Bengal in total milk production increased between 1980-82 and 1996-98. In contrast, the share of Bihar, Haryana, Rajasthan, Uttar Pradesh, and West Bengal declined during this period.
Table 1.10 State-wise shares of Indian milk production, selected years
|
State |
1980 |
1985 |
1990 |
1992 |
1993 |
1994 |
1995 |
1996 |
1997 |
|
Percent of total milk production |
|||||||||
|
Uttar Pradesh |
18.1 |
18.6 |
17.3 |
18.4 |
18.1 |
17.7 |
17.9 |
17.9 |
18.3 |
|
Rajasthan |
10.3 |
9.4 |
7.3 |
7.9 |
8.2 |
8.0 |
8.2 |
8.5 |
7.8 |
|
Punjab |
10.2 |
9.3 |
9.6 |
9.6 |
9.9 |
9.7 |
9.7 |
9.8 |
10.4 |
|
MP |
7.2 |
6.7 |
8.0 |
8.4 |
8.2 |
7.9 |
7.7 |
7.6 |
7.6 |
|
Gujarat |
6.8 |
7.8 |
6.2 |
6.5 |
6.5 |
7.0 |
7.0 |
7.0 |
6.9 |
|
Haryana |
6.9 |
5.9 |
6.3 |
6.4 |
6.4 |
6.4 |
6.1 |
6.1 |
5.8 |
|
Bihar |
6.1 |
5.6 |
5.1 |
5.5 |
5.3 |
5.1 |
5.0 |
4.9 |
4.9 |
|
Tamil Nadu |
5.5 |
6.9 |
6.0 |
6.0 |
5.8 |
5.8 |
5.7 |
5.8 |
5.6 |
|
AP |
6.4 |
6.4 |
5.3 |
5.4 |
6.2 |
6.6 |
6.4 |
6.5 |
6.4 |
|
Maharashtra |
5.6 |
5.7 |
6.8 |
7.1 |
7.0 |
7.5 |
7.5 |
7.4 |
7.4 |
|
Karnataka |
4.5 |
4.4 |
4.4 |
4.5 |
4.5 |
4.7 |
4.8 |
5.0 |
5.6 |
|
West Bengal |
4.1 |
5.3 |
5.4 |
5.2 |
5.1 |
5.1 |
5.0 |
4.9 |
4.8 |
|
Kerala |
2.9 |
2.9 |
3.0 |
3.3 |
3.3 |
3.3 |
3.3 |
3.3 |
3.3 |
|
Others |
5.4 |
5.0 |
9.4 |
5.9 |
5.5 |
5.1 |
5.4 |
5.4 |
5.3 |
Source: Basic Animal Husbandry Statistics 1999, Department of Animal Husbandry and Dairying, Ministry of Agriculture, Government of India
Per Capita Availability
Though India is the largest milk producer in the world, its position in terms of per capita availability is low compared to some countries. The per capita availability of milk declined during the pre-OF period. Per capita availability was about 124 gms per day in 1950-51, which declined to 112 gms per day in 1970-71. But the dairy sector took a leap forward during the 1970s, 1980s, and 1990s. The per capita availability of milk increased from 112 gms in 1970-71 to about 214 gms per day in 1999-2000 (Figure 1.3). However, the present level of per capita availability is well below the world average of 285 gms and also less than the 220 gms recommended by the Nutritional Advisory Committee of the Indian Council of Medical Research (ICMR). It remains well above the average for developing countries, and is even higher than some countries that exhibit higher average GDP. However, this must be seen in the context of relatively low levels of consumption of other animal proteins in the form of meat, so that total animal protein intake remains low for many segments of Indian society.
Figure 1.2 Trends in milk production and per capita availability in India; 1950-51 to 2000-01
Source: GOI (2001)
There are wide inter-state and inter-regional disparities in per capita availability of milk. The per capita availability of milk is higher in the northern states like Punjab (880 gms/day), Haryana (592 gms/day) and Himachal Pradesh (330 gms/day), whereas the eastern states have low availability of milk (51 gms in Orissa to 123 gms in West Bengal per person per day) in 1997-98 (Figure 1.5). The per capita availability of milk is highest in Punjab, followed by Haryana, Himachal Pradesh, Jammu, and Kashmir (282 gms/day) and Gujarat (269 gms/day). Considering the per capita milk requirement recommended by the ICMR at 220 gms per day, only seven states, namely Punjab, Haryana, Himachal Pradesh, Rajasthan, Gujarat, and Uttar Pradesh have per capita availability of milk above this level. There is also a wide disparity in consumption of milk between the rural and urban areas. The per capita consumption of milk in the rural areas is substantially lower (121 gms per day) as compared to urban areas (400 gms/day) (Initiatives, 1999).
Figure 1.3 Milk production and per capita availability of milk in selected states in India; 1998-99
Source: GOI (2001)
Like nearly all developing countries, India has co-existing "organized" and "unorganized" sectors for the marketing of milk and dairy products. Sometimes called the "informal" sector, the unorganized sector may be more usefully thought of as the traditional milk market sector, comprised of the marketing of raw milk and traditional products such as locally manufactured ghee, fresh cheese, and sweets. The organized or formal sector is relatively new in historical terms, and consists of Western-style dairy processing based on pasteurization, though adapted to the Indian market in terms of products. In some cases the traditional sector is quite well organized, with a complex net of market agents, and shows variation in numbers of and roles of market intermediaries. It may also be relatively formal, in that market agents may pay municipal fees and have vendor licenses, albeit not specifically registered for the dairy trade. The reasons underlying the existence of a large informal or traditional sector are the same as found in other countries: consumers are unwilling to pay the additional costs of pasteurization and packaging, which can raise retail prices by over 100%, and consumers often regard raw milk and traditional products obtained from reliable vendors as of better quality than formally processed dairy products. It should be noted that, unlike some countries, the Indian government has generally adopted a laissez-faire approach to the informal sector, which has allowed it to expand with the growth in demand, and serve both small farmers and resource-poor consumers. It is useful to get an overview of the broad aggregate of this sector and understand the type of "informal sector" which competes with the organized sector (cooperatives and modern-style private factories) in the field of processing, procurement, and marketing of milk and other dairy products. Of the estimated milk production during 1999-2000 of about 78 million tons of milk, the organized sector, primarily through the dairy cooperatives and organized private dairies, handled 10-12% of the total milk production, or 15% of the marketed surplus, and the rest finds its way into India's large, complex, highly differentiated traditional private trade in milk and dairy products (see Figure 1.6). The share of the organized sector in total procurement has increased from about 3.7% in the early 1960s to about 12% in the mid-1990s. There are large regional variations in the types of operators and their operating procedures. Cooperative milk marketing has a relatively strong hold in the states of Gujarat, Rajasthan, Maharashtra, Tamil Nadu, and Karnataka, yet is subservient to unorganized sector. Dairy cooperatives have a particularly low profile in the eastern and northern parts of the country. By and large, the informal sector comprising private milk vendors, traditional dudhias/halwais, and others continues to have the lion's share of the procurement and marketing of milk in India. This situation is unlikely to undergo a major shift, given consumer preferences. The informal sector is a large employment provider and has traditionally offered a wide range of services to households and institutional consumers. In metro cities - Delhi, Mumbai, Chennai, and Kolkatta- the introduction of bulk vending machines has given a strong advantage to cooperatives. With more focus on global trade and quality standards, the organized sector (cooperatives and the private sector, including multinationals) can be expected to play a greater role than at present. At some point in the future, it might handle about 25-30% of the total milk produced in the country, yet leaving the major share of milk procurement and marketing to the informal sector. This will require an increased willingness by consumers to pay for the additional processing. Hence, the informal sector has a major potential role to play in milk procurement and marketing in India. In recent years, added emphasis has been given to clean milk production and ensuring quality standards as per international norms, which calls for greater responsibility, particularly on the part of informal sector, in meeting the set quality standards.
Figure 1.4 Relative shares of
main milk marketing channels in formal and informal markets in
India
As % of marketed surplus of milk:
Formal: 15%; Informal/traditional: 85%
Source: Dairy India (1997)
Governments' protectionist policies affect the prices received by producers, and the impact of such policy measures is reflected in the gap between domestic prices and the world price of a commodity. This gap shows the level of protection for the producers. It is well known that Indian agricultural policies have been strongly influenced by the need to achieve self-sufficiency in foodgrains since the 1960s, and in the dairy sector since the early 1970s. The import and export of dairy products was restricted through various non-tariff measures (NTBs) like quantitative restrictions (QRs) and canalization until the early 1990s. Competition within the country was also restricted through industrial licensing by restricting the entry of the formal private sector, including multi-national companies (MNCs), in the milk processing and the product manufacturing sector. Cooperatives were given preferential treatment for setting up milk processing plants. However, since the early 1990s, India has embarked upon a more liberal policy framework, which was reinforced with India becoming member of the WTO, exposing the Indian dairy sector to the world markets.
A comparison of nominal protection coefficients (NPCs) for the 1975-2000 period shows that the level of NPCs (at the official exchange rate) for major dairy products, namely skim milk powder (SMP), butter, butter oil and recombined milk, were well above unity for the average 26-year period of 1975-2000, and remained above unity even if estimates are considered at the shadow exchange rate (Figures 1.7-1.10). The trend in the estimates of incentive indicators is declining and estimates are much lower in the 1990s than the average of the entire period. This temporal behavior of NPCs is somewhat similar for all products. It is high during the late 1970s, declines during the early 1980s, again rises in the mid-1980s, and then gradually falls, and tends to approach unity and even goes below unity in the 1990s. It is important to note that the level of protection during the second half of the 1990s is only one-fifth of the level of protection during the second half of the 1970s. The gradual reductions in NPCs, especially after the second half of the 1980s, have been largely due to an improvement in world prices, and partially due to the falling exchange rate of the rupee. These results of NPCs indicate that India has not been an efficient import substituter of dairy products, if one compares Indian dairy prices with the world prices. However, the reason for this largely can be ascribed to the nature of world prices of dairy products, which have been highly distorted by the large export subsidies of the EU and the US. For example, the average export price (FOB) of SMP was about US$ 1,444 per ton in 1999; and the EU and the US paid about US$ 867 and US$ 950 per ton, respectively, as subsidies on SMP exports, more than 60% of the world prices (Sharma, 2001). There was some decline in the export subsidy to comply with commitments made under WTO, but the export subsidy as a percentage of world market prices showed an upward trend (Figure1. 11). If international prices were not artificially depressed by the policies of the EU and the USA, protection levels for Indian dairy products would have been much lower and even less than unity in most of the years. The estimates of NPCs at distortion-free prices (Netherlands domestic prices) are significantly lower, and even less than unity, in most of the cases for all dairy products considered in the study.
Figure 1.5 NPCs of skim milk powder (SMP) under importable hypothesis; 1975-76 to 2000-01
Source: Sharma and Gulati (2002)
Figure 1.6 NPCs of whole milk powder (WMP) under importable hypothesis; 1975-76 to 2000-01
Source: Sharma and Gulati (2002)
Figure 1.7 NPCs of butter oil/ghee under importable hypothesis; 1975-76 to 2000-01
Source: Sharma and Gulati (2002)
Figure 1.8 NPCs of liquid milk under importable hypothesis; 1975-76 to 2000-01
Source: Sharma and Gulati (2002)
Source: OECD (2001)
The comparison of NPCs for other important milk producing/consuming countries compared with Indian estimates provides very good insights about the distortions in the world dairy markets. Japan stands at the top with the highest protection (3.16 in 1995-99) given to its milk producers, followed by Switzerland (3.01), Korea (1.95), and the OECD region as a whole (1.19). India stands fourth with a NPC level of 1.45 at the given world market prices (Figure 1.12). However, if we compare the NPC figures calculated at distortion-free world prices for India, the NPC value drops to nearly 0.76, which is much lower than Canada and the EU levels. Comparison of NPCs of dairy products among different countries indicates that the dairy sector has been one of the most highly protected sectors in the developed countries. There is, however, a silver lining during the 1990s. The protection for dairy products in India has drastically come down, and in commodities like SMP, it has even become negative in some years during the 1990s. The high NPCs for Indian dairy products reveal that under a liberalized atmosphere, the sector may face difficulties in adjustment.
Figure 1.10 Estimates of NPCs of milk for selected countries: 1986-90 to 1995-99
Source: OECD (2001); For India: Sharma and Gulati (2002)
With the growth in demand and production, the protectionist policies of the 1970s and 1980s, followed by the economic policies of trade liberalization during the 1990s, the Indian dairy sector witnessed some marginal structural changes in milk production, processing, and marketing.
Among milch cattle, the population of low-yielding nondescript milch cattle showed a considerable decline, while the population of crossbred milch cattle exhibited a sharp increase, indicating farmers' preference for crossbreds for milk production. The marked shift in the sex composition of both the breeds of cattle in favor of females highlighted the declining importance of draft animals and the increased importance given to milk production. By and large, buffaloes continued to be the predominant milch animals contributing to milk production in India. The northern and western parts of the country have a predominance of buffaloes in milk production, while the eastern and southern parts are predominantly cow-milk-producing regions. In the southern region and parts of northern India, the crossbred population is on a steady rise, contributing to milk production.
With regard to management practices, owing to diminishing common property resources and pastures, the grazing of animals is on the decline and stall-feeding is on the rise. With regard to reproductive management, natural services are declining and artificial insemination is becoming popular in cattle and buffaloes. Along with rural dairy farming, urban and peri-urban dairy farming is being taken up to cater to urban milk demand through the informal market. The urban and peri-urban dairy farming involves rearing of crossbred cows and high-yielding buffaloes maintained on purchased feeds and fodders in stall-fed conditions, and following most of the modern dairy farming practices. This sub-sector has been contributing to milk production in selected areas of the country. But growing environmental concerns and health consciousness might impose checks on their extension and intensification and need to be investigated thoroughly.
In the formal sector, the industrial structure that emerged as a result of Operation Flood involved an organized sector consisting of dairy cooperatives, government milk schemes, and formal private processors. The informal sector, largely untouched, continued to be composed of small traders (dudhias, local halwais), urban milk producers, and intra-village trade directly from producers to consumers. Although dairy cooperatives comprise the single largest formal organization in terms of market share, they are engaged in active competition with the informal sector in small towns and peri-urban villages and with some private companies in urban milk centers. The share of the organized sector in total milk procurement has increased over a period of time and is further expected to rise in the new economic environment of liberalization and globalization. The repeal of industrial licensing under new economic policy provided opportunity for private entrepreneurs and multinational companies to invest in new processing capacities.
The share of organized sector in total milk procurement has increased from 3.68% in 1961 to about 10-12% in the mid-1990s (Table 1.11). These estimates are not very reliable, due to poor information for the unorganized sector and those plants below 10,000 litres per day capacity. Within the organized sector, the share of cooperatives is higher than private companies. The total milk procured by the cooperative sector has increased from 2,562 thousand kg per day in 1980-81 to 16,504 thousand kg per day in 2000-01 (Figure 1.13). The share of the western region was highest (47.85%) followed by southern region (3.75%) and lowest in the eastern region (3.89%). Among the states, the procurement by cooperatives is highest in Gujarat (4567 thousand kg/day) followed by Maharashtra (2,979 thousand kg/day), and low in the eastern states like Bihar (330 thousand kg), Orissa (94 thousand kg), and West Bengal (204 thousand kg). The number of dairy cooperative societies has also increased significantly from 13,284 in 1980-81 to 96,206 in 2000-01 (Figure 1.14). The number of farmer members has risen from 1.7 million to 10.7 million during the same period (Figure 1.15). The Anand pattern multi-tier cooperatives have strong backward linkages with the farmers and collect milk from rural producers through village dairy cooperative societies (Figure 1.16). The majority of private processors depend on contractors (through informal or formal contracts) and traders to procure milk from farmers (Figure 1.17). The private sector has the advantage of flexibility in pricing and in business policy decisions.
Table 1.11 National milk procurement by Operation Flood and other organized and informal sectors in India
(million tons and%)
|
|
1972 |
1980-81 |
1988-89 |
1994-95 |
1995-96 |
2000-01p |
|
Milk production |
23.00 |
31.60 |
53.70 |
64.10 |
66.10 |
81.00 |
|
Organized sector |
1.30 |
3.10 |
5.80 |
6.40 |
n.a. |
n.a. |
|
O-F Cooperatives |
0.24 |
1.01 |
3.58 |
3.75 |
4.00 |
6.02 |
|
Non-OF organized sector |
1.04 |
2.12 |
2.46 |
2.63 |
n.a. |
n.a. |
|
Share of co- operatives as % of organized sector |
18.56 |
32.33 |
61.33 |
58.77 |
n.a. |
n.a. |
|
Handled by informal sector |
19.65 |
21.73 |
28.46 |
56.72 |
n.a. |
n.a. |
Note: p: provisional figures; Figures in parentheses indicate%ages to total milk production
Source: Candler and Kumar (1998); NDDB (2001)
Figure 1.11 Trends in growth of dairy cooperative societies: 1980-2000
Source: NDDB, Annual Report 2000-01
Figure 1.12 Trends in Farmer members of dairy cooperative societies: 1980-2000
Figure 1.13 Anand Pattern Model
Source: NDDB (1987)
Figure 1.14 Milk procurement channels for private sector plants
With the recent changes in domestic policy (the repealing of licensing requirements under the MMPO) and trade policy (the removal of QRs on imports and exports of dairy products) the share of the private sector in milk procurement is expected to increase. This could lead to some structural changes in production sector, whereby the private processors will try to reduce transaction costs and may promote large commercial dairy farms.
In many areas of the country, dairy farms located within the city or in its periphery (peri-urban and urban dairy farms) still have a major sway over their traditional customers. These give cooperative as well as commercial dairies in many cities a good run for their money (Shah, et al., 1995). Customers often have a long association with the farm owner, and the quality and purity of milk is perceived to be the major advantage of these farms. Private vendors (dudhias) are dominant in the periphery of the cities and typically serve low- and middle-income consumers. They are not particularly known for good quality of milk, but nevertheless offer the lowest retail prices to consumers. These vendors collect milk from the doorsteps of milk producers of interior villages and offer sale to consumers first, and the remaining is supplied to halwais (sweet makers) or contractors, whichever is nearest at hand. In contrast to these operators in the unorganized sector, the cooperatives and some private units sell through the network of retailers. The commission offered by the cooperatives to these retailers is significantly lower than what is offered to them by private sector units.
India has an age-old tradition of drinking milk. About 89% of households consume loose milk whereas only 9% of households consume packaged milk (Roy, 2002). The penetration of branded milk is highest among high-income people and towns having a population of more than ten lakh. The acceptance of packaged milk is high in Maharashtra, Gujarat, West Bengal, Kerala, and Karnataka, and states with the potential for expanding the market for packaged branded milk (Orissa, Assam, Punjab, Haryana, Bihar, and Rajasthan). The quantity of liquid milk marketed by cooperatives has increased significantly from 2.8 million litres per day in 1980-81 to 13.4 million litres in 2000-01 (Figure 1.18). The share of the western region is highest (35.92%), followed by the south (31.44%), the north (22.81%), and the eastern part of the country (9.83%). The penetration of packaged branded liquid milk is expected to increase due to increased awareness about food safety and quality standards.
Figure 1.15 Trends in liquid milk marketing by cooperative dairy plants: 1980-2000
Source: NDDB, Annual Report 2000-01
Dairy has long been a highly regulated industry in India and in many other countries. However, in the early 1990s, the Indian dairy industry entered a period of domestic and trade policy reforms. Two major policy events - 1991 macro-economic reforms and the 1995 Uruguay Round Agreement (URA) - represented a significant modification of previous policies by opening up markets and limiting government restrictions. Although the extent to which such efforts would be carried forward in future policies (e.g., the next rounds of WTO negotiations) of the developed countries like the EU, USA, Japan, and Canada is uncertain, these changes retain significant potential to influence world dairy trade. The political importance of the dairy sector in most countries has resulted in a plethora of government interventions in dairy production, marketing, and trade. In addition to trade and domestic policy reforms, technological developments in the dairy and food processing industries will take on a greater importance in coming years.
Despite being the largest milk producer in the world, India is a minor player in the global trade of dairy products. The country was primarily an import-dependent country until the early 1970s, and most of the demand-supply gap of liquid milk was met by importing butter/butter oil and milk powders under food aid programs as gifts. The share of skim milk powder and butter oil imports in total milk throughput declined from about 41% during the mid-1960s to less than 1% during the early 1990s (Figure 1.19). This transition of the Indian dairy industry from a position of net importer to that of surplus was induced by strict import controls, growth in domestic production, and the efforts of Operation Flood and other dairy development programs. India started exporting surplus dairy products such as milk powders, ghee, butter, and cheese in the 1990s, however, the exports are negligible compared to both domestic production and international trade. The exports and imports of most dairy products were regulated through the Agricultural and Processed Food Products Export Development Agency (APEDA) and the National Dairy Development Board (NDDB) until the early 1990s; however, steps to liberalize dairy trade were initiated in the mid-1990s when imports of milk powder and butter oil were de-canalized and de-licensed. In the new Exim policy announced on March 31, 2002, the government removed all restrictions on the import and export of all dairy products (Economic Times, 2002).
Source: Dairy India (1995)
India's dairy product exports are occasional and primarily in the flush season. Although India exports a wide variety of dairy products, milk powder (80.2%) and butter, ghee, and other fat-based products (15.5%) remain the major export items (Figure 1.20). Imports of dairy products increased from nearly 1,000 tons (valued at Rs. 3.76 crore) in 1990-91 to as high as 29,500 tons (Rs. 18.1 crore) in 1999-00, and declined during 2000-01 to about 8,000 tons (Figure 1.21), while the exports of dairy products increased from 604 tons to about 6,327 tons during the same period, leading to a condition of essentially zero net imports. The major destinations for Indian dairy products are Bangladesh, UAE, the United States, and the Philippines. These export figures clearly demonstrate that Indian exports are still in their infancy. However, the country has the potential to become one of the leading players in dairy product exports, since India is located amidst major milk-deficit countries in Asia and Africa. Secondly, milk production in India is scale-neutral and labor-intensive. Due to low labor costs, the cost of milk production in the country is significantly low. Despite these positive factors, there is a long way to go in order to improve the quality of Indian milk and milk products. In order to become globally competitive, significant investment has to be made in the supply chain of milk procurement, processing, and marketing. Also, training has to be given to the farmers and processors to improve the quality of milk and dairy products to bring them up to international standards.
Figure 1.17 Share of major dairy products in India's exports of dairy products during 2000-01
Source: DGCIS (2001)
Figure 1.18 Trends in imports and exports of dairy products in India: 1990-2000
Source: DGCIS (various issues)
Commercial imports of dairy commodities were significant until the early 1970s, comprising of about 50% to 60% of throughput, but declined significantly in the 1980s and 1990s. However, the imports of milk powders and butter/butter oil increased substantially in the late 1990s, mainly due to low import duties on these two products as a commitment under the WTO Agreement. India is among the few countries who has low bound rates of duty for major dairy products like milk powders, butter, butter oil, and cheese (15-40%) as opposed to relatively high tariffs (100-150%) on less sensitive products like milk, cream, butter milk, and yoghurt (Figure 1.22). The small flow of cheap imports in the second half of the 1990s, mainly due to low import tariffs on the milk powders and other major dairy products, may have hurt some segments of the domestic industry, but was negligible in scale compared to the overall domestic market. Although imports of cheese are still low, they grew at a rapid rate during the 1990s.
Figure 1.19 Base (1986-88), bound (2004) and applied (2002-03) rates of duties for dairy products[36] in India
Source: GOI (2002)
The dairy sector can be represented by three separate segments/activities. The first activity, farm production, consists of milk production and transportation to milk plants. In the formal sector, processing is the second activity, with raw milk as the input and pasteurized milk and dairy products as the outputs. Transportation of products to the wholesale market and marketing (domestic and export markets) is the third activity.
The major stakeholders in the Indian dairy policy are milk producers, processors (cooperative, private, government, etc.), traders, wholesalers, retailers, informal sector processors and sellers, middlemen/contractors, consumers, the non-dairy industries, the government (central and state), veterinary drug manufacturing and marketing companies, as well as households without dairy animals (Figure 1.23). In what follows, we attempt to focus on the interests and concerns/problems raised by the producers, processors, and consumers in the context of the new policy environment that is emerging.
The narrative is based on numerous official documents, newspaper and journal articles, and several interviews that were conducted with various stakeholders associated with the dairy sector. These interviews were conducted on a 'not for attribution' basis to encourage candor; therefore, individual comments are not attributed by name. The result is necessarily interpretive and in providing our interpretation, we have been careful to triangulate and crosscheck views that were shared with us. The goal of this section is by no means to provide an evaluation of the outcome of the reforms in dairy sector thus far; indeed, this method does not lend itself to such a policy exercise. Instead, we hope to shed light on circumstances, actors, and forces that guided reforms in this sector in a particular direction, and by so doing, provide a basis for understanding how future reforms can best serve the interest of various stakeholders in this sector.
Views of Smallholder Producers
Smallholder dairy farmers are confronted with numerous issues in their farming situations that need to be alleviated. Since smallholder dairy farmers provide the base for Indian dairying, and prospects for the dairy industry in India are dependent on the prospects of millions smallholder dairy farmers spread across the country, their views merit attention. Smallholder dairy farmers are resource-poor in terms of land, capital, and management skills. The important issues facing them are:
The low genetic potential of milch animals
High costs of animal maintenance and meager marketable surplus of milk
High production costs, low milk prices, and low profitability
Problems of feeds and fodder, and rapidly declining community lands for grazing
Inadequate infrastructure for veterinary health care services, breeding, and marketing of milk
Low levels of education among dairy farmers and inadequate facilities for fostering information dissemination at village levels
Because of the emphasis to attain self-sufficiency in the production of food grains in the country, most farmers are producing wheat and paddy crops, leaving very low area for fodder production. Moreover, studies have revealed that the increase in prices of food grains is many times higher than the milk production, which serves as a disincentive for production of milk
Figure 1.20 Simplified conceptual representation of the Indian dairy sector stakeholders
Views of Private Processors
The importance of the cooperative sector in milk processing has not lessened in spite of the entry of the private sector after partial de-licensing of the dairy sector as a part of the macro-economic reforms. In fact, the delays in project approvals under the MMPO reveal that there is state intervention in innumerable ways, even though there is constant demand for the government to remove licensing requirements and leave it to the markets. Some of the important issues facing the private sector managers are as follows:
There are number of clearances-statutory and non-statutory-to be obtained for setting up a milk processing plant.
Under the Milk and Milk Products Order (MMPO), the requirement for registration with the MMPO and the renewal of licenses every three years was a major problem. However, the requirement of renewal of registration after three years was abolished in August 2001, which was a positive step towards the liberalization of the India dairy sector.
The powers given to Milk Controller under the MMPO to carry out inspection of milk processing units was also considered a problem by the private sector units.
The condition that each registered unit collect milk only in specified quantities and only from its registered milk sheds which are outside the existing cooperative/private sector dairies' milk shed areas is a major problem faced by the new private sector dairies. These restrictions have serious implications for economies of scale and scope in the processing sector.
The private sector considered MMPO to be backdoor licensing.
Some requirements related to environmental compliance result in considerable delays and thereby cost escalation.
The world dairy market is very thin and highly distorted in developed countries, particularly the EU, USA, Japan, and Canada; therefore, there is little scope for exporting dairy products to these countries.
The increased competition in domestic markets from cooperatives, the informal sector, and subsidized imports is perceived to be a major issue by the private sector.
Views of Cooperative Sector:
The promulgation of MMPO fueled a controversy in the dairy industry. When the dairy industry was de-licensed in 1991, the cooperative sector opposed the policy tooth and nail. Cooperatives felt threatened because the private units set up the plants in areas where cooperatives had invested for decades in raising productivity and developing milk potential in their milk sheds (Shah, et al., 1995). Some of the concerns of the cooperative sector are:
The competition from subsidized imports will be a big challenge for the cooperative sector. These subsidized imports will depress the domestic market prices as well as producer prices.
The private sector units do not invest in productivity enhancement programs, and poach on the territory of the cooperative sector where they have made massive investments.
Centralized procurement pricing controlled by the state federations/government prevents district cooperative unions from responding vigorously to competition from the private sector and informal channels, thus reducing the competitiveness of the cooperative sector plants.
There is a problem of over-staffing with an inefficient work force that leads to low efficiency and high overhead costs in the cooperative sector.
The bureaucratization of some of the state federations, political interference, the absence of marketing, and the commercial orientation of top management are major concerns of the cooperative sector.
The absence of a level playing field due to many government restrictions such as the necessity for permission from the registrar, cooperative societies, and other government functionaries for petty things makes these organizations less competitive.
Views of Informal Market Agents:
Our limited discussions with some of them suggest that they recognize that they lack training in milk handling and hygiene, and would welcome efforts to provide such training. However, they do not appear to be overly concerned about moves to regulate them, as they feel that they have a right to operate, and provide a service to both farmers and consumers.
Despite the importance of dairying in the Indian economy, especially for the livelihoods of resource-poor farmers and landless laborers, government policy towards this sector has suffered from the lack of a clear and strong focus. Agriculture including animal husbandry is a state subject under the Indian Constitution, and responsibility for development of the sector lies with the state governments, with the exception of specific tasks assigned to the central government. The first attempt to conceive a set of policies for livestock development in India was the Royal Commission on Agriculture (1928). The Commission recognized the role of draft animals, the problem of excessive numbers of cattle, and the scarcity of feed and fodder in the Indian agriculture. In the post-independence period, the shaping of government policy was greatly influenced by the colonial legacy. Government policies can be divided into three distinct phases (pre-Operation Flood, post-Operation Flood, and post-reform period) and areas (animal husbandry policy, policy on dairy processing and marketing, and policy towards cooperatives).
The budget allocation under five-year plans to the animal husbandry sector is an indication of the prioritization of the sector. However, in most states, the bulk of these allocations are eaten up by the wages, salaries, and other administrative costs of the government animal husbandry departments. The investment pattern in animal husbandry and dairying during various plan periods is given in Table 2.1. The plan outlay (at current prices) of central and centrally sponsored schemes under animal husbandry and dairying has increased from Rs. 22 crore in the First Plan to Rs. 1,545.64 crore in the Ninth Plan. The outlay for dairying increased from Rs. 781 crore in the First Plan to Rs. 900 crore in the Eighth Plan, and then declined in the Ninth Plan to Rs. 469.5 crore, which is substantially lower than the previous plan period; moreover, these figures are at current prices. The allocation of animal husbandry and dairying as a percentage of total plan outlay varied from 0.98% during the Fourth plan to about 0.18% during the Ninth plan (Figure 2.1). In the case of animal husbandry, a jump in plan outlay was seen in the Fourth Plan, when it almost doubled compared to the previous plan outlay. During this plan period, the efforts of crossbreeding programs and the establishment of veterinary health care facilities were increased. The percentage expenditure on the dairy sector compared to expenditure on animal husbandry and dairying varied from about 23.2% in the Fifth Plan to 88.4% in the Sixth Plan (Figure 2.1). The plan allocation for dairying declined to about 30% in the Ninth plan (one of the lowest in all plans). The declining trend of expenditure for dairying during the Ninth Plan was mainly due to the completion of OF. The year-wise expenditure under animal husbandry and dairying sector during 1980-81 and 1998-99 is given in Figure 2.2. Although the dairy sector occupies a pivotal position and its contribution to Indian agriculture is the largest, the plan investment made so far does not appear commensurate with its contribution and future potential for growth and development.
Table 2.1 Outlay and expenditure of central and centrally sponsored schemes under animal husbandry and dairying in India: First to Ninth Plan
(Rs. in crore)
|
Plan |
Total Plan Outlay |
Animal Husbandry |
Dairying |
Total |
|||
|
Outlay |
Exp. |
Outlay |
Exp. |
Outlay |
Exp. |
||
|
First |
1960 |
14.19 |
8.22 |
7.81 |
7.78 |
22.00 |
16.00 |
|
Second |
4600 |
38.50 |
21.42 |
17.44 |
12.05 |
55.94 |
33.47 |
|
Third |
8575.6 |
54.44 |
43.40 |
36.08 |
33.60 |
90.52 |
77.00 |
|
Annual Plan 1966-67 |
6625.4 |
41.33 |
34.00 |
26.14 |
25.70 |
67.47 |
59.70 |
|
Fourth |
15778.8 |
94.10 |
75.51 |
139.0 |
78.75 |
233.10 |
154.26 |
|
Fifth |
39426.2 |
- |
178.43 |
- |
54.03 |
437.54 |
232.46 |
|
Sixth |
97500.0 |
60.46* |
39.08 |
336.10 |
298.34 |
396.56* |
337.42 |
|
Seventh |
180000.0 |
165.19* |
102.35 |
302.75* |
374.43 |
467.94* |
476.78 |
|
Annual Plan 1990-91 |
- |
43.71 |
36.18 |
79.67 |
41.43 |
123.38 |
77.61 |
|
Annual Plan 1991-92 |
- |
57.97 |
43.28 |
97.49 |
77.99 |
155.46 |
121.27 |
|
Eighth |
434100.0 |
400.00 |
305.43 |
900.00 |
818.05 |
1300.00 |
1125.60 |
|
Ninth |
859200.0 |
1076.12 |
- |
469.52 |
- |
1545.64 |
- |
*: Outlay recommended by Planning Commission and includes works component also.
Source: GOI (various issues)
Source: GOI (1999)
Source: GOI (1999)
The poor productivity of Indian cattle was the central concern of livestock experts throughout the last century. The major objectives of the First Five-Year Plan for livestock development were to increase milk production, to improve milk supply to the large urban demand centers, and to improve the quality and supply of draft animals for agriculture. Selective breeding was chosen as the fulcrum of the Indian livestock policy. Launching the Key Village Scheme (KVS) was one of the strategies adopted under the First Plan to improve breeding, feed and fodder availability, disease control, and increased milk production. Artificial insemination was included as a tool for rapid breed improvement. Animal diseases were identified as a serious limitation to productivity improvement, but no major interventions to control diseases were set in motion, except investments in veterinary hospitals and dispensaries. For milk supply to urban areas, the policy was to promote government-owned dairy plants for handling milk procurement, processing, and marketing. The animals kept in cities were to be brought under a scheme of peri-urban cooperatives, where they were supposed to produce and supply milk to the government-owned dairies. In 1959, a government milk scheme (Delhi Milk Scheme, DMS) was set up in Delhi, the fourth city in the country to supply milk to the urban population. This scheme adopted the method of departmental milk procurement from the milk-producing areas around Delhi by setting up its own milk collection and chilling centers. Though the collection was started from small milk vendors, it ultimately created big contractors who purchased milk from the small vendors and supplied in bulk to the milk scheme. The Second Five-Year Plan maintained and continued the same policies and strategies with no major changes. The National Commission on Agriculture (NCA, 1976), however, concluded that the Key Village Scheme fell short of expectations because it did not stress feed and fodder development and marketing of milk due to a shortage of funds. A committee to review the KVS recommended adoption of crossbreeding on a selective basis to rapidly increase milk production.
The Third Plan emphasized the need to develop dual-purpose animals for milk as well as for draft purposes. The limited practice of crossbreeding nondescript indigenous cattle started during this plan. The Intensive Cattle Development Program (ICDP) concentrated in breeding areas of indigenous cattle and buffaloes. The ICDP concentrated on areas with high potential for breeding as well as feeding resources. During the Third Five-Year Plan (1961-66), 55 milk supply schemes for cities and industrial townships, eight rural creameries, and six milk product factories were established. During this Plan period, 23 liquid milk plants and 27 pilot milk schemes were in operation, and the daily average throughput of milk in the organized sector was 1,300,000 litres. Four milk product factories and three creameries were also commissioned. Work on the establishment of another 37 liquid milk plants was initiated.
Meanwhile, the Government of India took a far-reaching policy initiative in the dairy sector and articulated it into a plan during the period between Third and Fourth Five-Year Plans and the early years of Fourth Plan. This was dairy development through producers' cooperatives, and milk production based on milk sheds in the rural areas based on the successful experience of dairy cooperatives in Gujarat and elsewhere. This policy initiative contributed to the demand-led turnaround of the Indian dairy industry. Milk production grew substantially, at a rate even higher than the strong growth in wheat and rice production during the same period (World Bank, 1997). In both the organized and unorganized sectors, milk procurement, processing capacities, and urban supplies all grew in matching proportion, transforming India into one of the only self-sufficient and modern dairy countries in the Asian region, with few parallels in any other developing countries (Kenyan dairy grew as fast, and had a proportionately larger role of coops). This experience suggested that production increases in subsistence production systems occur primarily through the strong "pull" created by improved, remunerative, and reliable markets for rural producers by linking them to urban consumers, along with demand growth from urbanization and income increases. The influence of cooperatives in national dairy policy increased during the 1970s and 1980s.
To enhance the role of the formal dairy sector, the Government of India launched a massive dairy development program popularly known as "Operation Flood" (OF) from 1971 to 1996. The program was started with the help of the World Food Program (WFP), and continued with dairy commodity assistance from the European Economic Community (EEC) and soft loans/credit from the World Bank. The National Dairy Development Board (NDDB) was entrusted the task of implementing Operation Flood. The modus operandi was to organize small farmers into cooperatives, provide them with a steady year-round market, a remunerative price, and inputs for milk production enhancement such as veterinary first aid, vaccination against prevailing animal diseases, better feed and fodder, breed improvement through artificial insemination with the semen of proven bulls, and crossbreeding the indigenous cattle with high-yielding breeds. At the time, the program was unique in its approach, and was one of the first examples of what is now commonly known as the "monetization" of food aid. The gift dairy commodities received from the WFP and EEC were not freely distributed, but were sold to city dairies for recombination into milk, and the funds thus generated were reinvested into milk production enhancement activities. The overall impact of this coordinated and innovative effort has been to contribute to milk production growth in the country and help usher in a "White Revolution," making India the world's largest milk producer.
The program was implemented in three phases named Operation Flood (OF) I, II and III. OF- I, launched in 1970, aimed at setting up dairy cooperatives in 27 milk sheds covering 10 states of India so as to link them with the four cities of Bombay, Calcutta, Delhi, and Madras. This program was taken up with commodity assistance in the shape of 1,27,517 MT of skim milk powder (SMP) and 39,696 MT of butter oil (BO) from the World Food Program (WFP), and the program ended in March 1981. An expenditure of Rs.1,165.4 million was incurred. Even before the first OF was over, plans were afoot to launch its second phase, with larger allocation and targets.
OF-II was implemented during a seven-year period (1978-85) through a three-tiered cooperative structure. There was an overlapping of phases I and II from 1978 to 1981. A World Bank credit of US$ 150 million and EEC commodity assistance of about 2,16,584 MT of SMP, 62,401 MT of butter oil, and 16,577 MT of butter was provided. An expenditure of Rs.2,771.7 million was incurred. At the end of OF-II (March 1985) the project was operating in 136 milksheds covering 34,500 village-level Dairy Cooperative Societies (DCS) with the participation of about 3.6 million farmers. From 1985-87 when no aid was available, the erstwhile Indian Dairy Corporation (later merged with NDBB) financed the project for a total investment of Rs.2,093.2 million. (Is the total investment that of IDC plus NDB, or is that the amount that IDC financed in the project? - not clear)
For phase III, a loan of US$ 200 million from the International Bank of Reconstruction and Development (IBRD) and credit of about US$ 160 million from the International Development Association (IDA) of the World Bank was available. Commodity assistance (75,000 MT of SMP and 25,000 MTw of butter oil) from the EEC equivalent to Rs.2,227 million was also agreed to (although in the end much lesser quantities were actually received). Apart from this, Rs.2,063 million from the National Dairy Development Board's (NDDB) internal resources were also invested. Details of the Operation Flood period and the funding and achievements of key items under the three phases of the project are presented in Table 2.2. (note that Rs. are in millions here, but were in crores in previous section - perhaps should make consistent - millions would more user-friendly to non-Indian readers)
Operation Flood remained the pivot of government policy in the field of dairy development in India. City Milk Schemes and milk colonies declined as the regional and National Milk Grids started operating under the OF. In cities, government milk schemes co-existed with the Mother dairies; however, the former kept selling milk at subsidized rates for a long time due to political reasons, while Mother Dairies introduced aggressive, modern milk marketing and distribution systems.
Table 2.2 Salient Features of Operation Flood
|
Key parameters |
Operation Flood Phases |
||
|
Phase I |
Phase II |
Phase III* |
|
|
Date of start |
July 1, 1970 |
April 1, 1981 |
April 1, 1987 |
|
Date of ending |
March 31, 1981 |
March 31, 1985 |
April 30, 1996 |
|
Investment (Rs crore) |
116.50 |
277.20 |
137.95 |
|
No. of milksheds |
39 |
136 |
170 |
|
No of DCSs set up |
13,270 |
34,523 |
72,744 |
|
No of members (lakh) |
17.5 |
36.3 |
93.0 |
|
Average milk procurement (mkgpd) |
2.56 |
5.78 |
11.0 |
|
Liquid milk marketing (llpd) |
27.8 |
50.0 |
100.0 |
|
Processing capacity Rural dairies (llpd) Metro dairies (llpd) |
45.4 29.0 |
88.0 35.0 |
192.0 72.8 |
|
Milk drying capacity (MTPD) |
340.0 |
507.0 |
990.0 |
|
Technical inputs No. of AI centers No. of AI done/year Cattle feed capacity ('000 MTDP) |
4,868 |
7,802 |
10,915 |
|
States covered |
Andhra Pradesh, Bihar, Delhi, Gujarat, Haryana, Karnataka, Madhya Pradesh, Maharashtra, Punjab, Rajasthan, Uttar Pradesh, and West Bengal |
Andhra Pradesh, Assam, Bihar, Goa, Gujarat, Haryana, Himachal Pradesh, Jammu & Kashmir, Karnataka, Kerala, Madhya Pradesh, Maharashtra, Orissa, Punjab, Rajasthan, Sikkim, Tamil Nadu, Tripura, Uttar Pradesh, West Bengal, Andaman & Nicobar, Pondicheri, and Delhi |
Andhra Pradesh, Assam, Bihar, Goa, Gujarat, Haryana, Himachal Pradesh, Jammu & Kashmir, Karnataka, Kerala, Madhya Pradesh, Maharashtra, Orissa, Punjab, Rajasthan, Sikkim, Tamil Nadu, Uttar Pradesh, West Bengal, Pondicheri and Delhi |
*: Includes progress during April 1985 to March 1987, a period during which activities were funded by the NDDB (Rs. 209.0 crore)
Source: NDDB (2001)
An indicator of the success of Operation Flood is the quantity of milk procured and supplied to consumers through cooperatives. Average milk procurement increased from 2.56 million kg per day during Phase I to 11 million kg per day during Phase III. However, there are variations in the ratio of milk procured to total milk production across states. The striking pattern that emerges is the predominance of cooperatives in Gujarat and Maharashtra, where OF was particularly successful. About 30% of the milk produced in the Operation Flood areas is collected by cooperatives, compared to about 10% in India as a whole. Between Phases I and III, average liquid milk marketing increased from 27.8 lakh litres per day to about 100 lakh litres per day. The amount of milk supplied to consumers exceeded the milk procured from farmers during the First Phase of OF, as milk powder and butter oil received under the World Food Program were recombined to make liquid milk and sold along with fresh milk. The share of recombined milk has, however, declined significantly since the mid-1980s.
In 1989 the Government of India launched a Technology Mission on Dairy Development (TMDD) to coordinate the input programs for the dairy sector, and the program ended in March 1999. The Government also implemented an Integrated Dairy Development Program (IDDP) for promoting dairy farming, focusing mainly in non-Operation Flood areas.
The OFP was a major policy development, helping to provide the missing market link in the formal milk sector between the urban milk consumer and the rural producer through a network of cooperatives. The decision to promote dairy development through cooperatives was based on a number of considerations, chief among which was that dairying would be a means to provide an additional source of employment and income to small and marginal farmers as well as the landless in rural areas (NCA, 1976). Two other considerations which led to the choice of cooperatives for dairy development were: (1) cooperatives in a vertically integrated structure would be able to undertake development of the entire sector including provision of inputs to the producers, upgrading the productivity of the milch animals and at the same time keeping in view the consumer's interest; and (2) many countries around the world had adopted the cooperative structure for dairy development, suggesting that this framework is perhaps the best-suited for the dairy sector. Once the decision to adopt the cooperative structure as the means for dairy development was made, the remaining policies of the government were formulated to support the dairy cooperatives set up under OF. To support the development of the marketing and processing infrastructure, the government provided funds as grants and loans to the cooperatives.
To promote domestic production under cooperatives, they had to be protected from cheap imports through various measures such as quantitative restrictions on imports and exports and canalization. Domestically, competition from the private sector within the organized sector was restricted through licensing regulations under the Industrial Development and Regulation Act of 1951 to prohibit new entrants into the milk processing sector. Milk powder and butter (butter oil) were available in the international market at low prices, which made reconstitution of milk from these products cheaper than collecting and selling fresh milk. It was, therefore, necessary to restrict the availability of these cheap imports if indigenous production were to be encouraged. In the era of restrictive industrial and trade policies, canalizing imports of dairy products provided protection to the dairy sector. The Indian Dairy Corporation became the canalizing agency for the milk product imports. Thus, industrial licensing controlled domestic competition to the cooperatives from the organized private sector, and external competition was controlled by import canalization.
At the same time that OF helped develop the organized sector and raised the profile of dairy cooperatives, the indigenous informal sector was growing at nearly the same high rate, and still controls by far the largest proportion of milk marketed. A key policy ingredient of this change was rather a non-policy, which was the lack of regulatory restrictions on small-scale milk traders and traditional processors of dairy products. This allowed them to operate freely in a market environment and respond to the huge growth in milk and dairy product demand that occurred during this period. This also allowed the development of the complex informal market linkages shown in the previous section, which grew to serve the specific needs of both smallholder farmers and resource-poor consumers under a variety of different geographic and demographic settings.
In the early 1990s, the Government of India introduced major trade policy reforms, which favored increasing privatization and liberalization of the economy, and the dairy sector was no exception to this. The dairy industry was de-licensed in 1991 with a goal of encouraging private investment and the flow of capital and new technology into the sector. Although de-licensing attracted a large number of players, concerns on issues like excess capacity and the sale of contaminated/substandard quality of milk, as well as political pressure from the cooperative sector, induced the Government to promulgate the MMPO (Milk and Milk Products Order) in 1992 under the Essential Commodities Act of 1955. The MMPO regulates milk and milk products production in the country. The order requires no permission for units handling less than 10,000 litres of milk per day or milk solids up to 500 tons per annum (TPA). Thus, the largest share of the market, the small-scale indigenous or unorganized sector, remains unregulated. This allows the continued free hand of that sector, enabling it to continue to build on the large role that it played during the growth period of the 1970s and 1980s, and to provide most of the market linkages while the formal sector grows in importance. The MMPO prescribes state registration to plants producing between 10,000 to 75,000 litres of milk per day or manufacturing milk products containing between 500 to 3,750 tons of milk solids per year. Plants producing over 75,000 litres of milk per day or more than 3,750 tons per year of milk solids have to be registered with the Central Government. The MMPO also specifies that the registering authority must enforce the sanitary and hygienic regulations to ensure the quality of the production process. The status of registrations granted under MMPO as at March 2001 is given in Table 2.3.
Table 2.3 Registration granted under MMPO up to March 2001
|
|
Cooperative |
Private |
Others |
Total |
|
|
Number |
212 |
392 |
64 |
668 |
|
|
Capacity ('000 litres/day) |
28,394 |
30,339 |
7,270 |
66,003 |
|
|
Distribution: |
|
|
|
|
|
|
|
10,000-75,000 litres per day |
74 |
290 |
30 |
394 |
|
|
>75,000 litres per day |
138 |
102 |
34 |
274 |
Source: GOI (2002)
About 392 private plants with a total processing capacity of 30,339 thousand litres per day have been registered under MMPO as opposed to 212 cooperative dairies with a total capacity of 28,394 thousand litres per day. However, there were certain inherent weaknesses in the MMPO. Firstly, each milk processing plant has to identify its milk shed area where milk will be procured for processing, which should be outside the milk shed areas of existing processing plants. Therefore, in some cases, the milk shed areas are quite far away from the processing units, which increases the cost of transportation and also affects the quality of milk as many of the units do not have the required infrastructure (cold chain) to procure milk. This ultimately affects the quality of the product. Further, nearly 80% of the private dairies (in terms of number of units as well as capacity) are concentrated in the four states of Haryana, Punjab, UP, and Maharashtra. These four states are among the highest milk producing states in the country. One of the major problems in the Indian dairy industry after de-licensing has been low capacity utilization. The stringent regulations, government controls, and licensing requirements for new capacities have restricted large Indian and multi-national players from making significant investments in the sector. In the union budget for 2002, the MMPO was amended, and restrictions on new processing capacity were removed while the regulation on health and safety conditions will continue (GOI, 2002). This decision was applauded by the industry and is expected to have an impact on the structure of the Indian milk processing industry. It is possible that low capacity utilization is a result of rapid entry after liberalization, which is likely to be followed by a period of intense competition during which less efficient private firms will be weeded out.
The import and export of dairy products has been de-licensed and de-canalized, and trade in dairy products is freely allowed provided these units comply with the compulsory inspection requirements of concerned agencies such as the Export Inspection Council. The Bureau of Indian Standards has prescribed the necessary standards for dairy products, which are to be adhered to by the industry. In 1994-95, imports of Skim Milk Powder (SMP) and butter oil were de-canalized and restrictions on the remaining products have been removed since April 1, 2002. Moreover, there has been a significant reduction in the import tariffs of dairy products after trade liberalization. In 1995, India signed the Uruguay Round Agreement on Agriculture (URAA) and became a member of the WTO, which forced India to open up its dairy sector to the world markets. However, India laid down low import tariffs for dairy products in the Uruguay Round schedules.
Service Sector (Veterinary Institutions):
Over the past five decades, the number of veterinary institutions providing health care facilities has increased from about 2,000 in the early 1950s to about 50,850 in 1998 (7748 veterinary hospitals polyclinics, 15,554 veterinary dispensaries, and 27,543 veterinary aid centers. Veterinary aid for carrying out prophylactic and curative disease control is made available to livestock owners by the state governments through a network of these institutions. The state-wise distribution of the institutional infrastructure is shown in Table 2.4. These institutions are supported by qualified veterinarians (38,000) and other para-veterinary and supporting staff (70,000). More than 80% of the institutional growth-including in professional manpower-took place in the services sector of the livestock industry. The growth of the infrastructure in the services sector of the livestock industry is almost entirely in the form of veterinary institutions under state governments. The growing veterinary infrastructure has brought about a sharp decline in mortality rates.
Table 2.4 State-wise veterinary institutions and other institutional infrastructure for animal husbandry and dairying in India: 2001-02
|
|
VHP |
VD |
VAC/MD |
ICDP |
AI Centers |
Product Factories |
Milk Plants |
|
Andhra Pradesh |
280 |
1642 |
2610 |
- |
3657 |
8 |
64 |
|
Assam |
26 |
434 |
1213 |
11 |
1213 |
9 |
9 |
|
Bihar |
62 |
1154 |
3832 |
8 |
1652 |
- |
- |
|
Gujarat |
14 |
453 |
590 |
9 |
5564 |
11 |
19 |
|
Haryana |
607 |
859 |
759 |
7 |
2297 |
- |
7 |
|
Himachal Pradesh |
309 |
1259 |
14 |
1 |
894 |
- |
- |
|
Karnataka |
244 |
803 |
2191 |
2 |
5951 |
6 |
14 |
|
Kerala |
266 |
829 |
22 |
0 |
1890 |
9 |
14 |
|
Madhya Pradesh |
772 |
2344 |
90 |
22 |
2918 |
- |
- |
|
Maharashtra |
31 |
1156 |
2134 |
0 |
4076 |
56 |
30 |
|
Orissa |
58 |
482 |
2924 |
4 |
1971 |
6 |
25 |
|
Punjab |
1261 |
1535 |
45 |
- |
2129 |
- |
25 |
|
Rajasthan |
1180 |
285 |
1080 |
- |
2679 |
- |
- |
|
Tamil Nadu |
124 |
807 |
2533 |
20 |
3510 |
- |
- |
|
Uttar Pradesh |
2047 |
280 |
2720 |
7 |
4232 |
- |
- |
|
West Bengal |
110 |
612 |
3245 |
8 |
2207 |
- |
- |
|
India |
7748 |
15554 |
27543 |
114 |
48243 |
113 |
252 |
Note: VHP: Veterinary Hospital Polyclinics; VD: Veterinary Dispensaries; VAC/MD: Veterinary aid Centers (Stockmen Centers)/Mobile Dispensaries; ICDP: Intensive Cattle Development Program; AI Centers: Artificial insemination centers
Source: Annual Report 2001-02, Department of Animal Husbandry and Dairying, Ministry of Agriculture, GOI (2001)
Production Support Infrastructure
The infrastructure for production support includes a number of institutions like livestock breeding farms, special projects, AI centers, frozen semen production stations, liquid nitrogen plants, and a variety of other institutions. Of the production support infrastructure, the Artificial Insemination (AI) system gets priority as an essential service in the sector. The number of artificial inseminations performed increased from about 16 million in 1991 to nearly 18.8 million in 1997-98 (Table 2.5). However, barring the examples of Kerala and selected milk cooperatives under Operation Flood, the quality of the system's facilities and service are extremely inefficient. While the state and central farms were started with specific objectives and mandates, it is open to debate whether they have actually fulfilled those mandates. The High Powered Committee (HPC) that evaluated the central farms and allied institutions recommended the closure of many of the central breeding farms as well as of all the fodder and fodder seed farms, as they have not contributed to the development efforts of the country.
Table 2.5 State-wise artificial inseminations performed in India during 1991-1997
('000 Nos.)
|
|
1991-92 |
1992-93 |
1993-94 |
1994-95 |
1995-96 |
1996-97 |
1997-98 |
|
Andhra Pradesh |
1564 |
1627 |
1701 |
1731 |
1747 |
1829 |
2045 |
|
Assam |
127 |
87 |
50 |
54 |
NA |
43 |
28 |
|
Bihar |
828 |
813 |
661 |
449 |
NA |
NA |
NA |
|
Gujarat |
501 |
467 |
488 |
905 |
1613 |
1571 |
1528 |
|
Haryana |
713 |
725 |
700 |
677 |
654 |
589 |
609 |
|
Himachal Pradesh |
263 |
277 |
269 |
302 |
335 |
326 |
325 |
|
Karnataka |
1167 |
1185 |
1380 |
1980 |
2033 |
2191 |
2074 |
|
Kerala |
1367 |
1234 |
1353 |
1464 |
1240 |
1200 |
1200 |
|
Madhya Pradesh |
349 |
301 |
355 |
292 |
305 |
189 |
189 |
|
Maharashtra |
1387 |
1528 |
1700 |
1688 |
1779 |
1671 |
1671 |
|
Orissa |
262 |
309 |
319 |
423 |
535 |
1000 |
1000 |
|
Punjab |
989 |
1110 |
1168 |
1269 |
1377 |
1972 |
1909 |
|
Rajasthan |
501 |
599 |
583 |
472 |
NA |
NA |
NA |
|
Tamil Nadu |
2274 |
2511 |
2524 |
2556 |
2573 |
2526 |
2682 |
|
Uttar Pradesh |
2638 |
2810 |
2932 |
2985 |
3055 |
2832 |
2651 |
|
West Bengal |
634 |
681 |
690 |
636 |
701 |
616 |
628 |
|
India |
15990 |
16703 |
17316 |
18389 |
18194 |
18816 |
18794 |
Source: GOI (1999)
Milk Processing Infrastructure:
The dairy market India is dominated by the unorganized/informal sector. The organized sector is comprised of three segments; namely, the government, the cooperative and the private. While the unorganized sector exhibited the largest growth in absolute terms since the 1950s, the organized sector grew more rapidly and so grew in share, from 3.7% of marketed surplus in the 1950s to about 15% today. In terms of volumes of milk handled and value addition through processing and marketing infrastructure, the cooperative sector is the largest (49%), followed by the private sector (45%), and the government sector (6%). About 35% of milk produced in the country is retained in producer households and about 65% of it is traded in traditional channels (Dairy India, 1997). A substantial part of milk traded in traditional channels goes into traditional products and sweets manufacture after undergoing traditional processing in the organized sector. In terms of installed processing capacities, the cooperative and private sectors have almost the same capacity and the government sector has a small presence (Figure 2.3). Combined, the three sectors have the capacity to process one-third of the daily average milk production in the country, but they handle less than 20%.
The number of milk plants and milk processing capacities in major states and under three sectors is given in Table 2.6. However, the average size of plant in the cooperative sector is significantly larger than in the private sector. The proportion of private units registered with the state Registration Authority (10,000-75,000 litres/day) is higher compared to the cooperative sector (Figure 2.4). In contrast, the proportion of cooperative sector plants in plants registered with the Registration Authority (>75,000 litres/day) is higher.
Table 2.6 Number of registrations granted under the Milk and Milk Products Order (MMPO) in major milk producing states in India
('000 litres/day)
|
State |
Numbers |
Capacity |
||||||
|
Co-op. |
Pvt. |
Others |
Total |
Co-op. |
Pvt. |
Others |
Total |
|
|
Andhra Pradesh |
13 |
15 |
1 |
29 |
2905 |
1443 |
200 |
4548 |
|
Bihar |
6 |
1 |
0 |
7 |
485 |
120 |
- |
605 |
|
Gujarat |
17 |
3 |
7 |
27 |
6280 |
690 |
670 |
7640 |
|
Haryana |
5 |
37 |
2 |
44 |
400 |
4590 |
130 |
5120 |
|
Himachal Pradesh |
3 |
2 |
0 |
5 |
44 |
345 |
0 |
389 |
|
Karnataka |
14 |
19 |
1 |
44 |
1908 |
1110 |
400 |
3416 |
|
Kerala |
11 |
6 |
2 |
19 |
765 |
158 |
35 |
958 |
|
Madhya Pradesh |
10 |
4 |
2 |
16 |
1250 |
950 |
20 |
2220 |
|
Maharashtra |
35 |
64 |
38 |
137 |
4206 |
4875 |
3395 |
12476 |
|
Orissa |
8 |
0 |
0 |
8 |
212 |
- |
- |
212 |
|
Punjab |
13 |
32 |
0 |
45 |
1630 |
3955 |
- |
5585 |
|
Rajasthan |
14 |
16 |
0 |
30 |
1337 |
1347 |
- |
2684 |
|
Tamil Nadu |
25 |
13 |
0 |
38 |
4365 |
475 |
- |
4840 |
|
Uttar Pradesh |
32 |
177 |
0 |
209 |
2286 |
10191 |
- |
12477 |
|
West Bengal |
2 |
3 |
2 |
7 |
216 |
90 |
820 |
1126 |
|
India |
212 |
392 |
64 |
668 |
28394 |
30339 |
7270 |
66003 |
Source: Ravindra et. al. (2001)
Figure 2.3 Registrations granted under the Milk and Milk Products Order (MMPO) - Capacity
Figure 2.3 Registrations granted under the Milk and Milk Products Order (MMPO) - Number
Source: GOI (2002)
However, much of the processing capacity created in the private sector after the de-licensing of the Indian dairy industry is lying idle, with average capacity utilization about 60%. In the government sector too, most of the primary processing facilities installed in rural areas are not functional, and dairy plants in the smaller towns and cities are grossly underutilized. However, in the cooperative sector, capacity utilization is quite high (about 78%). These processing capacities include liquid milk processing and products manufacturing such as milk powders, table butter and white butter, cheese, ghee, condensed milk, and milk sweets.
Organized processing and marketing are relatively new to the Indian dairy economy. Dairy production, processing, and marketing were almost entirely in the household sector until independence. During 1930s and 1940s, there were efforts to form cooperatives in some parts of India; the first dairy cooperative was formed in Allahabad with milk and ghee traders as its members. Then cooperatives also arose in the Erode district of Tamil Nadu, the Surat district of Gujarat, and several parts of Maharashtra (Shah, et al. 1995). The presence of the organized sector and modern dairy processing was minuscule. The imperial government had set up city milk schemes to augment milk production from cattle colonies in the cities, and the demand for western products was met through imports and few private dairies. The indigenous dairy product market was served primarily by the traditional household sector.
Over the last five decades, the organizational structure of Indian dairy has significantly changed in many ways. One major shift is from subsistence dairy production to market orientation. The marketed surplus of milk in rural areas has increased significantly and the share of ghee in total marketed surplus of dairy products has declined. The production of ghee in the household sector has also declined rapidly due to changes in the institutional structure of the milk processing sector. The modernization and commercialization of dairying has led to new institutional structures, creating new opportunities for value addition. The institutions involved in dairy processing and marketing can be classified into two categories: organized and unorganized. The unorganized sector uses traditional methods/technologies, and the organized sector uses modern technologies/methods. A tentative categorization of milk processing institutions is given in Table 2.7. These institutions compete with each other in the areas of procurement and marketing of milk and dairy products, production and marketing of cattle feed, and supply of animal health care and breeding services (in some cases). The unorganized sector is a major player in the procurement and marketing of liquid milk and traditional products like ghee, Khoa, and other indigenous products. However, the share of the organized sector, particularly cooperatives, is increasing in milk procurement, as discussed in the earlier sections. In case of the ghee market, the share of the organized sector (both cooperative and private) is increasing, and that of unorganized sector (households) is declining. Private and cooperative units also dominate the markets for western products such as cheese, butter, baby milk foods, milk powders, and balanced feed. In the supply of animal health cover and breeding services, cooperatives and government agencies still maintain a dominant role, although private veterinary services are growing in importance, and serve up to 20% of farmers in some regions (Ahuja et al, 2000).
Table 2.7 Institutional structure in dairy processing and marketing in India
|
Sector |
Traditional technology |
Modern technology |
|
Unorganized/Informal |
||
|
Household sector |
Household level processing, Sweet shops (Halwais), Milk Vendors (Dudhias) |
Small sized private dairy processing plants/factories not registered (<10,000 litres/day) |
|
Organized |
||
|
Cooperative |
Early cooperatives |
Anand Pattern Dairy Co-ops, Mother Dairy |
|
Private |
- |
Medium-Large plants |
|
Government |
- |
City Milk Schemes, Government Creameries, Dairy Corporations |
Source: Shah, et al. (1995)
After de-licensing of the dairy industry, the milk processing sector has witnessed some changes, e.g., some of the state cooperative Milk Marketing Federations have joined strategic alliances for product manufacturing and marketing under well-established brand names. Likewise, some of the private sector dairy plants are manufacturing dairy products and have allied with large companies to market products under their brand names. The industry is expected to undergo some restructuring to achieve economies of scale in the processing sector, and the importance of the organized sector will increase, but the informal sector will still play an important role.
In a country like India where milk production is "by the masses" rather than by "mass production", smallholder dairy farmers occupy special significance in dairy development. The more than 50 million small, marginal, and landless households participating in varying degrees in milk production must be strengthened to enable them to produce clean milk efficiently and effectively. Dairying being a relatively scale neutral activity when opportunity costs of labor are low, animal rearing assumes particular importance in the context of small, marginal, and landless households for whom animal rearing ensures nutrition, fluid cash, and sustainable employment, as well as a means to increase inflation-resistant assets. Furthermore, gains from dairying may be distributed more equitably than crop production, since landholding is not a prerequisite to dairy production where feeds can be bought or bartered for manure or labor. Recognizing this fact, governments at national and state levels have included the livestock sector as a vital component in poverty alleviation and rural development programs, yielding good results. Of course, much more is desired in this direction, since the constraints facing this category of households are not comprehended properly, or attempts to redress the problems are not taken up properly.
In order to enable the enhanced and fruitful participation of small and marginal farmers and landless households in milk production and processing activities, the following issues assume relevance:
Better credit facilities in terms of short-term and long-term loans through organized financial institutions must be made available at the village level, which improves the participation of these households in milk production.
Creation of better infrastructure for procurement of production inputs and marketing of milk would be another intervention for facilitating participation.
Good networks of extension for disseminating information regarding scientific dairying and extending facilities for veterinary health care and AI at the village level would assist farmers' participation in dairy activity.
Attempts to augment feed and fodder base through policies of national and local governments are vital for small, marginal, and landless households to efficiently participate in dairy enterprises. More concerted efforts are needed in conserving and developing communal lands which are facing the 'tragedy of the commons.'
It is desirable to link more smallholder dairy farmers to urban consumers where the cooperative structure is weak, either through private or cooperative organized channels or appropriate policy mechanisms.
It is also desirable to improve efficiency in milk production and processing sectors through appropriate technological, economic, and institutional policy interventions.
The market-oriented economic policies under the wide umbrella of the WTO Agreements have brought into focus many new issues/concerns. It was hoped that the new trade regime would create a congenial climate for trade in agricultural commodities including livestock products, but the experience so far gives a mixed picture.
Although India produces about 14% of global milk production, its share in the global trade of dairy products is grossly negligible. The new trade regime is hoped to provide greater opportunities for India to tap the global market in dairy products. The two overriding factors for determining the competitiveness of the Indian dairy industry in world trade would be price competitiveness and high quality meeting international standards (Codex Alimentarius Commission FAO/WHO). In the light of the above requirements, in order to compete (home as well as world markets), milk has to be produced at a competitive price and hence measures to reduce costs of production have to be explored. Furthermore, with regard to quality assurance of milk, there must be a greater emphasis on clean milk production and a reduction in the antibiotics, pesticides, and other contaminant residues in milk. The product mix may undergo considerable changes in favor of more western dairy products such as cheese due to changing food habits and income levels.
The liberalized trade regime might attract more foreign direct investment (FDI) through multi-nationals or joint ventures and private entrepreneurs in the dairy field to harvest the export potential. This trend might pose a threat to the existing cooperative processors, unless cooperatives rise to the occasion and change in accordance with the recent trends. The informal dairy sector might suffer, at least in terms of opportunities for participating any growth related to exports, owing to its poor quality products that do not qualify for export. It may also face increasing problems in domestic markets due to increasing awareness about food safety and quality issues, and the willingness to pay for higher quality by consumers as incomes increase. Nevertheless, as predicted by Delgado et al. (1999), the domestic market demand can be expected to grow substantially in coming decades, so that the informal sector may have plenty of opportunities.
Consequent to the establishment of the WTO, the Agreement on Application of Sanitary and Phytosanitary Measures (SPS) entered into force. The SPS Agreement relates to protection of animal, plant, and human health or life from food-borne risks and animal- and plant-carried diseases. The Agreement sets important parameters governing the adoption and implementation of food quality and safety and animal health measures and recognizes the standards, guidelines, and recommendations determined by the Codex Alimentarius Commission (CAC) and Office International Des Epizootics (OIE) for international trade in the dairy sector. There are, however, some provisions in the Agreement which amount to non-tariff barriers to trade, e.g., article 3.3 allows a member country to introduce SPS measures more stringent than stipulated in the relevant international standards and some countries have taken advantage of this and set several SPS measures more stringent than relevant Codex standards.
The main focus of Codex standards and guidelines has been quality and food safety for human consumption. Codex standards have been formulated for a majority of dairy products that are internationally traded. The Codex standards inter alia include maximum permissible levels of contaminants/additives and hygienic requirements for production. Chemical contaminants for which standards have been set include heavy metals (lead), about 85 pesticide residues, and 10 veterinary drug residues in milk and milk products. For lead, a maximum level of 0.05 ppm in butter and 0.02 ppm in milk (in proportion to their concentration factor in milk products) has been recommended by the Codex Committee on Food Additives and Contaminants to the Codex Alimetarius Commission. In contrast, the Indian standard is 2.5 ppm for milk, which is much less restrictive than the Codex standards. Codex also set a maximum residue limit (MRL) for 83 pesticide residues as opposed to India's 24 pesticides. Likewise, while the Codex has MRLs for 10 veterinary drug residues and is considering MRLs for more, India has not as yet set MRLs for veterinary drugs. The 33rd Codex Committee on Food Additives and Contaminants has recommended a MRL of 0.5 ppb for Aflatoxin M1 in milk, while the Indian national limit is 0.03 ppm. The Codex has incorporated several provisions in its proposed Model Certificate for Export and Import of Milk Products that would be extremely difficult for India to comply with. Some of them are in contradiction with the OIE requirements and the system of milk production adopted by smallholder dairy farming.
Codex is concerned with the microbiological quality of dairy products, and has recommended measures to minimize microbiological contamination. Codex guidelines stipulate that the raw material should be produced in a manner that minimizes bacterial load, growth, and contamination. To achieve this, Codex recommends the application of the Principles of Hazard Analysis and Critical Control Point (HACCP) system. It is expected that application of HACCP System and other codes, guidelines, and recommendations will be made mandatory for international trade in the near future. To compete, the Indian dairy product export units will need to gear themselves to meet the international regulatory requirements and ensure not only that their plants get certified under the HACCP System, but also their primary production systems. Codex is also considering a Code of Practice on Good Animal Feeding, which includes the application of HACCP in feed manufacturing and the traceability of raw materials and quality defects to processes.
Under the SPS Agreement, an exporting country is required to provide evidence to importing countries that the products intended for export have originated from disease-free areas or relatively low-disease areas. Likewise, Codex standards stipulate that quality assurance systems such as HACCP and good hygienic practices should be employed in the entire food chain, including primary production. Although some flexibility has been granted to the developing countries in primary production, it is in India's interest to ensure conformity with the HACCP System throughout the chain from farmer to consumer to enhance the image of Indian dairy products. Some countries have adopted regulations that include unfairly stringent SPS measures, which are difficult for most developing countries including India to comply with. The European Union regulations on health rules for the production of milk, on maximum levels of Aflatoxin M1 in milk, and on the provisional list of countries authorized for export products into EU are some examples.
The domestic demand for milk and dairy products as well as the export potential for dairy products is immense; therefore, meeting domestic consumption growth and export demand poses a special challenge as well as an opportunity for the Indian dairy sector. In order to capture demand-led growth opportunities for those parts of the market that value high quality, a policy review is required to improve the quality and safety of dairy products and to ensure the efficiency and productivity of the entire food chain from farmer to consumer in conformity with international regulatory requirements and industry norms. In the recent past, the Indian dairy industry has taken some positive steps in this direction, as some milk processing plants in the organized sector (cooperative and private) have adopted HACCP certification to ensure the quality of products.
While the Codex Alimentarius proposes food safety and quality standards for its member countries, when a zoonotic animal disease threatens food safety, the Office International Des Epizooties (OIE) plays the role of proposing norms, guidelines and recommendations for Member Countries and the appropriate international organizations. These OIE activities cover the safety procedures for raw materials during production and first-stage processing before they enter the market.
Animal welfare, which includes establishing norms for animal protection on the farm, during transport, and at the time of slaughter, is a growing source of concern among animal protection organizations, consumers, and decision-makers. Although animal welfare is not currently covered under the World Trade Organization Sanitary and Phytosanitary Agreement, these issues are coming under increasing public scrutiny. Therefore, attention should be given by national authorities to reduce the negative effects of commercialization of livestock farming and trade on the welfare of the animals. The WTO recognizes the OIE as the relevant international organization responsible for the development and promotion of international animal health standards, guidelines, and recommendations affecting trade in live animals and livestock products.
Sustainable development strategies have a foundation in natural resource management. Recent decades have witnessed serious discussions and concerns with regard to natural resource management in India. Intensification of crop production and animal husbandry activities has resulted in heightened utilization of natural resources. It is feared that such an intensification of crop and animal husbandry activities will deplete the natural resource base beyond the rate of regeneration, potentially leading to many environmental imbalances.
In India, important natural resources like water (particularly groundwater), forest, grazing lands and pastures, and other village commons are being used properly in some cases, while in other cases they are being misused or abused. The forestland in many cases is misused and deforestation is taking place, which is a matter of serious concern. This has been resulted in negative effects on rainfall, temperature, soil erosion, and the like. In India, bovines and ovines are being blamed for destroying the natural resource base. This is particularly so in dryland farming conditions, where feeds and fodder are relatively scarce.
The likely benefits arising from growth in Indian dairy on natural resources are generally not well-perceived. Rather, it is thought that such a development will deplete the natural resource base. However, besides the economic benefits arising from the growth of dairy in the form of enhanced milk production, increased income and employment, and lowering of regional disparities, important natural resource benefits are also likely to accrue through the increased availability of organic manure for sustained crop production on shrinking land-holdings. Such benefits have been widely observed across developing countries, particularly where smallholdings mean that fallow times are reduced or nonexistent and soil nutrients are depleted. In such settings, manure takes on a high value both for its nutrient and organic matter contents, and is a key to sustaining crop intensification and nutrient management. In such cases of intensification, if the dairy farmers shift from open grazing to stall-feeding, it would reduce stress on land resources and lead to the regeneration of degraded grazing and common lands.
The problem of overgrazing comes into being when the existing stocking rate of livestock is more than the actual carrying capacity in the absence of feedstuffs being imported from outside the system. In most regions of India, the stocking rate is more than the actual capacity to maintain animals. Hence common property resources (CPRs) are exploited and often overgrazed. In India there are more than 80 million ha of CPRs/grazing lands, but this has now declined to less than 50 million ha. With regard to the seriousness of overgrazing, it has not yet assumed serious proportions, likely because of the use of crop-residues and other fodders from cropped land. However, one must not be complacent, but make efforts to limit overgrazing.
Present systems of livestock production have both positive (enhancing soil fertility through application of manure) and negative (water pollution and air pollution due to improper disposal of effluent from processing plants, global warming and climatic change) consequences for the environment at local, regional, and international levels. The main negative environmental effect of livestock production systems, which came into prominence during the early 1990s, relates to global warming and climate change. Ruminants, especially cattle and buffaloes, are a major source of methane (CH4) emissions. Methane is a greenhouse gas that has many times more weather warming potential than carbon dioxide (CO2). The major sources of methane within livestock production system are:
From digestive processes in animals (enteric fermentation)
From anaerobic decomposition processes in animal manure
From anaerobic decomposition processes of waste products from livestock processing
According to a recent study by Mishra and Dixit (2001), total methane emissions from the livestock sector in India were about 9.437 million tons in 1992. However, emissions per capita from the dairy sector are substantially lower compared to developed countries like US, where dairy farming is a commercial activity.
As with the wastes from dairy processing sector, the processing of milk results in waste products that are potentially damaging to the environment. A majority of the processes and management of wastes involve the use and disposal of water. The main polluting components of the dairy processing industry are presented in Table 2.8. The main polluting agents from dairy products are:
High organic matter concentrations, particularly proteins, fats, oils, and residues of additives, leading to high biological oxygen demand (BOD) for breakdown of these compounds in the water bodies
High insoluble organic and inorganic particle contents; a high suspended solid load
Release of toxic substances in some cases
Odors, and in some cases dust, that need to be controlled
Table 2.8 Milk processing sector environmental matrix
|
Resources |
Risks (-) |
Underlying factors |
|
Water |
Pollution of ground and surface water with organic material |
Poor management of processing waste |
|
Depletion of water resources |
Increased use of fresh water |
|
|
Air |
Dust |
Dust from milk powder processing |
|
Greenhouse gases |
Increased greenhouse gases emissions |
|
|
Bad odor |
Bad odor from waste and processing |
Most milk processing units in the organized sector in India have adopted good pollution prevention practices, such as reduction of product losses through better production control; collection of waste products for use in lower grade products such as animal feed; optimal use of water; recycling of wastewater; segregation of effluents from sanitary installations, processing, and cooling systems; and good hygiene and storage practices.
Consumer awareness combined with government pressure is leading to more environmentally sound production methods and products. Adoption and enforcement of environmental regulations is leading to awareness of companies in certain areas. Smaller units are unable to afford costs of meeting the regulatory requirements and/or waste treatment methods; therefore, some government support will help these small units.
The dairy sector has a number of specific characteristics that distinguish it from other agricultural sectors. Milk production in developing countries including India is characterized by a large number of small-scale producers, producing milk generally in a mixed system with crops. Although sometimes organized into farmer groups, they are generally price-takers, often with a weak and vulnerable position on the market, whether selling to the formal organized sector or the informal sector. Milk production in such a setting is usually highly labor-intensive and therefore provides supplementary employment opportunities in rural areas. Dairy farming is more than a purely market-oriented economic activity and plays multiple roles. For the dairy herd as a whole, these roles include manure to sustain crop production or for fuel; traction for plowing or for pulling loads; and critically, savings or credit. These savings through development of livestock assets can be used as financing in the absence of credit fund-planned lumpy expenditures or investments, or can also be used, in the absence of insurance, to cover emergency cash needs. These can add substantially to the implicit returns to dairy production, and affect the degree of supply response to milk price changes. (Moll et al, 2001) Milk has an additional characteristic: it is highly perishable, and as a consequence, milk requires high-cost transportation, and faces other transactions costs in marketing associated with establishing reliable market outlets.
The cost of milk production, processing, and marketing varies by the type of organization and the types of products produced. The input and output prices, types of inputs used and products produced, efficiency of various segments of the industry (production, processing and marketing), and technology determine the economics of milk production and processing. In this section, we examine changes in the domestic and world market prices of milk and dairy products and the prices of dairy inputs and animal health and breeding services during the last couple of decades.
Milk is an essential commodity in the Indian diet, since a large proportion of the population is vegetarian. Seasonality in milk production is well known in the Indian dairy sector. The milk production rises in winter months (flush season) and declines in the summer months (lean season). The data on raw milk procurement by milk processing plants shows that milk procurement by the cooperative sector has strong seasonal cyclical pattern (Figure 3.1). This cyclical trend of milk procurement is more pronounced for buffaloes and therefore for buffalo-dominated regions of the country. Such fluctuations in supply and demand result in fluctuations in prices (Figure 3.2), thus subjecting milk producers to large variations in output prices during the year. In the formal sector, the procurement prices are marginally higher during the lean season compared with the flush period (Figure 3.3). In the informal sector the seasonal price differential is likely to be greater, since small traders and an atomized market tend to transmit market supply and demand changes more efficiently, as is the case in other developing countries. Generally, formal and informal market prices will be correlated seasonally, although with a differential.
The trend in the wholesale price indices (at 1980-81 prices) for major livestock products as well as for all commodities during the period 1984-85 to 1997-98 is given in Table 3.1. Between 1984-85 and 1997-98, the WPI of baby food grew at the lowest rate (8.76%) while the price of butter has grown at the highest rate (10.14%) due to strong demand growth. The comparison of the price indices of dairy products and all commodities showed that the prices of dairy products increased marginally higher (9.26%) than all commodities (8.76%). However, the comparison of wholesale price indices for two periods, 1984-90 (pre-reform period) and 1991-96 (post-reform period) indicates that growth rates of all dairy product prices were lower in the post-reform period except baby food. The WPI of dairy inputs such as cattle feed, fodder and oil cakes increased slightly less than milk prices.
Figure 3.1 Seasonal pattern in milk procurement in selected district milk unions: 1997-98
Source: Records of Kolhapur and Ludhiana Milk Plants (2000)
Figure 3.2 Seasonal pattern in wholesale price index of milk in India: 2001
Source: GOI (2002)
Figure 3.3 Seasonal pattern in milk procurement prices in Ludhiana district of Punjab: 1997-98
Source: Records of Ludhiana Milk Plants (2000)
Figure 3.4 Trends in WPI of milk relative to WPI of food articles and dairy inputs: 1984-1997
Source: GOI (various years)
The comparison of the trends in the wholesale price index of milk with food articles and inputs in milk production such as cattle feed and oil cakes (Figure 3.4) shows that:
The WPI of milk increased sharply during the 1980s relative to the WPI of food articles and all commodities, signifying the rising demand for milk in urban areas
Milk prices decreased during the 1990s relative to the WPI of food articles and all commodities, indicating an increased production of milk and/or imports of dairy products in the post-reforms era
Milk prices relative to milk input prices such as oil cakes, fodder, and cattle feed show that input prices have increased faster than milk prices in the 1990s
Relative to the WPI of milk products, milk prices have increased at a slower rate during the 1990s
The trends in the WPI during the last one and half decades suggest that the dairy product prices have increased slightly faster than milk and all commodities WPI reflecting the increase in demand for dairy products due to rising income levels and changing food habits. The trends in input prices indicate that increased milk production should come from productivity enhancements; otherwise, increases in costs would make milk and dairy products costly and unaffordable to the masses. The trends towards crossbreeding and the greater use of animals with higher productivity, as discussed in earlier sections, may mirror these relative price trends.
Table 3.1 Wholesale Price Indices for all commodities, food articles and dairy products (Base: 1981-82=100)
|
Product |
1984-85 |
1991-92 |
1997-98 |
Annual compound growth rate (%) |
||
|
1984-91 |
1991-97 |
1984-97 |
||||
|
Milk |
132.6 |
264.8 |
348.6 |
8.82 |
6.08 |
8.21 |
|
Butter |
122.8 |
245.6 |
400.6 |
11.21 |
9.61 |
10.14 |
|
Ghee |
130.1 |
227.2 |
342.7 |
9.05 |
8.09 |
9.14 |
|
Baby food |
125.2 |
198.5 |
380.2 |
6.97 |
11.29 |
8.76 |
|
SMP |
120.4 |
220.9 |
372.0 |
9.36 |
8.46 |
9.34 |
|
Dairy Products |
121.9 |
224.6 |
370.3 |
9.09 |
8.53 |
9.26 |
|
Cattle Feed |
172.8 |
172.8 |
289.5 |
6.39 |
8.93 |
8.54 |
|
Fodder |
105.5 |
269.4 |
417.3 |
10.68 |
9.00 |
8.05 |
|
Oil Cakes |
NA |
225.1 |
354.7 |
NA |
8.61 |
NA |
|
Food articles |
131.8 |
241.1 |
388.0 |
8.58 |
8.34 |
9.47 |
|
All commodities |
120.1 |
207.8 |
329.8 |
7.86 |
8.18 |
8.76 |
Source: GOI (2002)
Of all the agricultural products, dairy product prices are the most distorted in the international market. These prices have been distorted by domestic and export subsidies given by developed countries, especially the European Union under its Export Restitution Scheme, and the US under its Dairy Export Incentive Program (DEIP). New Zealand is the only exporting country that does not subsidize its exports significantly, although Australia's exports levels are comparatively low (Figure 3.5) (IN FIG 5, MAY WANT TO SPELL OUT WHAT "PSE" MEANS TO BE CLEAR). For example, the US provided US$ 864 per ton export subsidies on SMP during March 2002, which was about two-thirds of the European Port (f.o.b.) price and almost twice those of the EU (Figure 3.6). The EU announced US$ 807 and US$ 1,544 per ton of export subsidies for WMP and butter, respectively, during March 2002. The EU increased its export subsidy on SMP from US$ 441 per ton in March to US$ 572 in April 2002, while for WMP, it increased from US$ 807 to US$ 906 per ton during the corresponding period (FAO, 2002). As a result of these distortions, the world prices of dairy products are often much lower than the domestic prices prevailing in the exporting countries (Figure 3.7). World dairy product prices (butter, cheese, and milk powders) were expected to increase as a result of less market intervention in dairy products in the forms of lower export subsidies and support prices and less public stocks in the post-WTO period. Stronger demand for dairy products was expected from a rise in consumer incomes, as economic growth becomes more broad-based in developing countries. The gaps between EU and world dairy product prices were also expected to be eliminated. However, important hurdles remain to expanding dairy trade through high export subsidies, tariffs, protection, and large support prices.
Figure 3.5 PSEs for milk in selected countries: 1986-91 and 1998-2000
Source: OECD (2001)
Source: FAO (2002)
Figure 3.7 Trends in world dairy product prices and the US market prices: 1996-2002
Source: USDA/FAS (2002)
After rising for most of 1995, international prices for dairy products peaked by year-end. Factors behind the buoyant prices of 1995 included the declining value of the US dollar relative to most other currencies, a surge in Russian imports, strong demand growth in many importing countries (particularly in Asia), unexpectedly strong domestic demand in several traditional dairy exporters, and production levels below expectations in Australia, New Zealand, and the United States. Among the major dairy products, butter prices benefited most from these strong prices.
However, dairy product prices-particularly those of SMP and WMP-started declining in 1996, and reached a nadir of about US$ 1200 per ton for SMP in May and June 1999, US$ 1,400 per ton for WMP during June and July 1999, and about US$ 1,300 for butter in the early part of 2000 (USDA/FAS, 2002). World dairy prices increased during 2000 and 2001 and witnessed a declining trend towards the end of 2001 and reached their lowest level of about US$ 1250 for SMP, US$ 1,425 for WMP and US$ 1,050 for butter during March 2002 (USDA/FAS, 2002).
The decline in world prices had an adverse impact on domestic prices in many developing countries, including India (any data to support this? Not show in any of the figures). This downward trend in world and domestic prices adversely affected the producer prices and, ultimately, producer income. The average milk price paid to producers in India was one of the lowest compared to developed countries like the EU, USA, Canada, Japan, etc. (Figure 3.8). (what were relative prices in previous years?)
Figure 3.8 Average milk prices (US$/100 kg) paid to producers in selected countries during 2000
Source: IDF (2001)
An efficient system of milk production depends largely on two factors: the yield level of an animal, and the level of its nutrition and maintenance. Milk productivity depends upon the breeds, quantity and quality of feed resources and feeding systems, animal health care and breeding facilities, and management practices. Of the non-genetic factors affecting productivity, feed resources and feeding systems are the most important, since the cost of feeding accounts for about two-thirds of the total cost of milk production in most cases. In smallholder systems, inadequate land and size of operation further constrains production. The major components in the cost (fixed and variable costs) of milk production include feed; labor; depreciation of animals, assets and equipment; animal health care and breeding; and interest on capital. The net returns from the sale of milk depend on the pricing policy and cost of milk production, and the pricing policy must consider a suitable margin of profit for the producer and at the same time affordable prices for the consumers. Besides the sale of milk, it should be noted that for smallholder farmers, implicit profit margins are substantially boosted by the non-marketed returns from manure, savings, etc., discussed above.
In computing the economics of dairy production, it is important to know pricing (valuation) of strategic inputs like feeds and fodder, labor, animal health care and breeding, and other miscellaneous inputs. In many situations, long dry periods such as in the western and northern parts of India result in inadequate availability of feed and large variations in its price.
Improved animal health care is also essential to increasing production. Along with the availability of feed resources and nutrition, disease is the next most important constraint to milk production. A variety of diseases affect milch animals, and efficient preventive and treatment measures can overcome these. However, with smallholder production systems, the situation is more serious because of inadequate knowledge and access to appropriate corrective measures and resources. In India, government, cooperatives, the private sector, and a few NGOs provide veterinary services to the dairy farmers. The veterinary institutions deliver veterinary services, artificial insemination, and other services at the center, and the dairy farmers have to take their animals to the center for treatment or for AI services. All the services offered by government are almost free or are highly subsidized; however, the quality of the services is poor and the institutions providing these services do not have adequate drugs and medicines in stock. In Gujarat, the prescribed fee per visit was Rs. 5 (Rs. 2 for small ruminants) including drugs and medicines, and in Kerala and Rajasthan, these are provided for free (Ahuja, et. al., 2001). However, the farmers rarely get only services at official rates and invariably pay significantly higher prices than what is legally mandated. The average price paid per visit (inclusive of drugs and medicines) was Rs. 128 in Rajasthan and Rs. 50 in Kerala (Ahuja, et al., 2001). In some regions where cooperatives have a strong presence, they provide preventive veterinary care for control of epidemics, curative veterinary services, extension support, inputs and services, artificial insemination, balanced cattle feed, improved fodder seeds, etc. to their members at subsidized rates. Total charges per home visit in selected states of India are presented in Table 3.2.
The government veterinary and AI centers, dairy cooperatives, and NGOs are primary providers of breeding facilities (AI) in the country. The government-prescribed rate for AI is quite low, varying from Rs. 5 in Gujarat to about Rs. 25 in Kerala. The price for AI services from dairy cooperatives in Gujarat varied from Rs. 5 to Rs. 35 (Ahuja et al., 2001). However, for home-delivered AI service by the government staff, the price is substantially higher, varying from Rs. 26 in Gujarat to about Rs. 88 in Kerala. The cooperative sector provides AI services at highly subsidized prices at home as well as the primary dairy cooperative society.
Table 3.2 Total charges per home visit
(Rs.)
|
Disease |
Gujarat |
Rajasthan |
Kerala |
||||
|
Govt. |
Co-op. |
Private |
Govt. |
Private |
Govt. |
Private |
|
|
General sickness |
153 |
49 |
173 |
275 |
214 |
175 |
140 |
|
Gynecological problem |
249 |
59 |
284 |
306 |
316 |
180 |
- |
|
FMD |
- |
- |
- |
292 |
- |
134 |
- |
|
Injury |
117 |
- |
- |
- |
- |
150 |
- |
|
Pneumonia |
- |
- |
- |
258 |
- |
- |
- |
|
HS |
- |
- |
- |
302 |
- |
- |
- |
|
Others |
146 |
50 |
157 |
314 |
- |
120 |
- |
|
Overall average |
161.2 |
51.5 |
202.2 |
332.8 |
286.4 |
178.0 |
204.2 |
Source: Ahuja, et al. (2001)
Credit is extremely important for increasing productivity and incomes of dairy enterprises, especially to those who are caught in the vicious circle of poverty. However, the effectiveness of dairy loans given under different programs such as the Integrated Rural Development Program (IRDP) has been extensively debated. Perhaps the most known criticism of the effectiveness of providing credit to the poor is attributed to Schultz (1964), who propounded the hypothesis that agriculture credit will be ineffective in improving productivity and income since investment opportunities are limited. Therefore, the analysis of efficiency in terms of physical output will help to identify the possibilities for increasing income while conserving resources. The role of efficiency may be viewed as an important component in policy-making to stimulate income and/or to promote resource conservation.
Credit for the dairy sector comes from two main sources: formal and informal. The formal channel consists of institutional credit provided by commercial banks, cooperative banks, regional rural banks, and other financial institutions. The informal channel consists of traditional moneylenders as well as non-governmental sources such as NGOs and SHGs. Institutional credit is available to farmers in villages to some extent, but the operational efficiency is very poor. The scheduled commercial banks' direct financing (short-term and long-term) to farmers up to 2.5 acres has increased significantly from Rs. 252.4 crores in 1980-81 to about Rs. 3,337.8 crore in 1999-2000 (Figure 3.9). For farmers with land holding between 2.5 and 5 acres, lending increased from 168.3 crore to 3,466.9 crore during the same period. The total loans disbursed increased from Rs. 1,014.4 crore in 1980-81 to Rs. 14,013.6 crore in 1999.2000. However, this amount is not sufficient to meet the requirements of the farm sector. As mentioned earlier, due to the non-provision of loans at the proper time, poor farmers fall prey to private moneylenders and engage in marketing contracts with the purchasers of their products. This is a situation is particularly common for vulnerable smallholder dairy farmers. Over 50% of the farm-level credit for small and marginal dairy farmers in India still comes from traditional moneylenders. In many cases, however, the milk traders who buy from smallholder farmers also provide microcredit at reasonable terms. This factor has allowed them to compete successfully with the cooperatives in many areas, since village level dairy coops are officially discouraged from providing credit to farmers. Accessibility, flexibility, and fewer procedural formalities are major strengths of the informal sector in spite of the high interest rates. A major constraint in agricultural credit in general, and the dairy sector in particular, is the high degree of loan defaults/overdue, which inhibits not only credit expansion but also the financial viability of lending institutions. The short-term and investment loans outstanding under cooperative credit system are presented in Table 3.3.
Source: Handbook of Statistics on Indian Economy, Reserve Bank of India, 2001
In a study by Singh (1999), the cost of credit including transportation charges, imputed value of labor spent, amount paid to different functionaries, and amount spent on various documents was found to be 12.89%. The analysis further revealed that the largest share of expenditure was made towards unofficial gratification at various levels and was observed to be about 51% of the total cost. This confirms the exploitation of the poorest sections of the society at the hands of the bank and other government officials due to the low political power that they wield. If the cost of credit is added to the interest rate, the amount to be paid above the principal during the entire period of loan utilization comes out to be around 39%, which is quite high and requires strong policy initiations to reduce it. Though the bank rate is generally 12-18%, for private moneylenders the interest rate ranged between 18 and 30%.
Table 3.3 Short-term and investment loans outstanding under cooperative credit system
|
Year |
Amount of Loans (Rs.crore) |
Ratio of Short-term to medium-term |
|
|
Short-term |
Medium-term |
||
|
1980-81 |
98 |
309 |
0.32 |
|
1981-82 |
133 |
326 |
0.41 |
|
1982-83 |
153 |
378 |
0.40 |
|
1983-84 |
184 |
397 |
0.46 |
|
1984-85 |
175 |
480 |
0.36 |
|
1985-86 |
199 |
482 |
0.41 |
|
1986-87 |
224 |
458 |
0.49 |
|
1987-88 |
331 |
559 |
0.59 |
|
1988-89 |
403 |
615 |
0.66 |
|
1989-90 |
538 |
682 |
0.79 |
|
1990-91 |
443 |
752 |
0.59 |
|
1991-92 |
482 |
842 |
0.57 |
|
1992-93 |
659 |
904 |
0.73 |
|
1993-94 |
732 |
984 |
0.74 |
|
1994-95 |
820 |
1106 |
0.74 |
|
Growth rate |
|||
|
1980-85 |
12.94 |
9.79 |
3.14 |
|
1986-94 |
14.08 |
10.35 |
3.73 |
Source: Singh and Kar (2002)
In light of the fast-changing global trade regime, the outlook for technological development in dairy sector appears to be bright. In order to tap the global dairy market to India's advantage, better scientific management of dairy animals in terms of breeding, feeding, and health care must take place. More concentrated milk production and milk sheds may develop, and efforts for clean milk production and good health care of animals may occupy special significance.
General developments in terms of quality of life, greater literacy, higher per capita income, and more industrialization and employment opportunities will have positive spin-off effects on dairy development. Until now, dairying has been concentrated in rural areas as a supplementary or complementary enterprise, and commercial orientation is missing. With technological development and the evolution of high-yielding crossbred cattle, the outlook is changing. Populations of high-yielding crossbred cows and buffaloes will primarily concentrate in peri-urban and progressive rural areas. Biotechnological applications for enhancing the productivity of milch animals will receive greater importance. Crossbred cow farms in Bikaner and Jodhpur in Rajasthan are being replicated at many other places. The quality of milk produced by these dairy farms is being utilized in the production of various indigenous milk products like Rasogulla, Gulab Jamun, Raj Bhog, Chum-Chum etc. These products, produced in a large number of milk product factories located in the area, are being exported to various parts of India and even to countries like Nepal and Bangladesh.
The Indian dairy industry will focus on value creation through an integrated approach to the market and the development of a range of products and production methods. This will involve a focus on market trends, competitiveness, technological clustering, spin-off industries, convergence of technologies and markets, and sustainability issues. The strategic objectives will be to provide range of products, suited to the increasing and changing structure of demand, which enhance health and well-being. New product innovations will be required that respond to changes in food habits, lifestyle, and design; as will sustainable dairy production systems (socially, economically, and environmentally); food safety and quality; market access; animal health and welfare issues; and a focus on vertical integration of the value chain (Figure 3.10).
Given the income-elastic demand for milk and dairy products and accelerating growth in per capita income levels, demand for milk and milk products will grow rapidly in India in the years ahead, and this will have a number of consequences which need to be addressed. This projected increase in demand for dairy products will put increasing pressure on dairy production systems; traditional breeds and feeding practices are likely to give way to high-yielding breeds, management of natural resources, intensification of production systems, increased disease risks, pollution, animal health issues, and a greater reliance on feeds and concentrates.
Feeding and nutrition has repeatedly been highlighted as the major constraint in animal production systems globally (ILRI, 1995). The importance of improved nutrition in dairy production is therefore a major consideration. Currently, Indian dairy farming is dependent on crop residues, planted and sometimes irrigated fodder, natural resources, and open grazing as sources of feeds; less than 5 million tons of cereals are fed to livestock. However, expansion of these traditional sources of feeds and fodder to support a large increase in dairy production is unlikely, as available grazing areas and other common property resources (CPRs) are shrinking and are already degraded. Therefore, if milk production is to increase, then additional output will have to come from modern systems that are based on stall-feeding and use more concentrates. According to Bhalla et al. (1999), the projected feed requirements for cereals in 2020 will be about 50 million tons (up from 3.7 million tons in 1993) if per capita income increases by 3.7% per year. Kumar (1998) has projected the total demand for cereals as feed at about 17 million tons. It is clear that if the increasing demand for milk and dairy products is to be met, it is likely that the agricultural sector will have to produce more grains for animal feed.
It is important that improved feeding and efficiency of feed use are clearly viewed in a farming system perspective, and that the following prerequisites are considered important (Devendra, 1999):
Estimates of the availability of total feeds and fodder (crops residues, forages, agro-industrial by-products, non-conventional feed resources)
Assessment of the extent of surpluses and deficits
Development of strategies to cope with shortfalls
In a vast country like India, where milk production is scattered among more than 70 million farm households, timely procurement of milk and making it available to the final consumer is a Herculean task. Marketing agents are the crucial media to link production centers with consumption centers. Broadly speaking, both organized and unorganized sectors are involved in milk procurement. In the unorganized sector the link between the producer and the consumer is through the intermediaries at the village and city level. At the village level, the basic intermediary is the dudhia/milk vendor, who handles the major share of trade. On average, about 85% of the total milk sold is handled by these vendors. They collect the milk from producers in rural areas both in the morning and evening. The studies have shown that on average, milk vendors collect milk from about 40-50 producers and the mode of conveyance adopted depends upon the area covered, quantity of milk collected, and the financial position of the vendor. Generally, the mode of conveyance used is the bicycle, moped, or motorcycle. The last mode is the most common mode. The collected milk by the vendors goes to the consumer through various channels-directly to the consumer; to the wholesaler in the city market; to the halwais, who sell milk in retail as well as use it in the manufacture of sweets; the creameries; and the milk collectors/contractors, who supply the milk in bulk to various private milk plants. It is generally observed that as the number of channels increases, the quality of milk deteriorates and the price paid by the consumer increases. The vendors have their own network for collection of milk and create their own market by giving advance payment to the producers. Generally, the vendors accept the milk from the producers without testing it for fat, SNF%, or any other adulteration, and similarly pass it on to the consumers without any quality certification. The investigations reveal that these vendors pocket their margin by reducing the quality. 20-25% of the total milk collected goes for cream separation; the cream is sold and the separated milk is added to the other milk reducing the cost of procurement and thus increasing the margin of profit.
In the organized sector, marketing agencies like dairy cooperatives, which have the obligation to reach villages of even meager marketable surplus, are operating in most parts of the country. The working of these cooperatives is a three-tiered system. At the village level, there is the producers cooperative society, where the members of the society-who themselves are the producers-pour the milk. The collected milk is sent to the milk union/chilling center through the hired trucks. At the union/chilling center, the milk is received, tested for quality, and chilled so as to improve the keeping quality of the milk. After chilling the milk, the milk is dispatched to the milk plant, where the milk is pasteurized, filled in sachets, and sold to the consumers through the various functionaries in the market.
The studies conducted in this field reveal that the procurement costs are composed of the costs of collection, transportation, chilling, and reception of milk at the plant; and the expenditure incurred on washing and sterilization of cans etc. The cost of collection, transportation, and chilling of milk for a milk plant varies from plant to plant, depending upon the distance and other infrastructure. Khokhar (1985) conducted a study in Uttar Pradesh and observed that the total cost of collection, transportation, and reception at milk plants was about 52 paise and the percentage shares of collection, transportation, and reception were found to be about 54%, 42%, and 4%, respectively. In Tamil Nadu, the overall cost of collection, transportation, chilling, and reception of one litre of milk was found to be 68, 42, 28, and 5 paise, respectively, bringing the total cost of procurement to Rs. 1.43 (Rangaswamy 2000). Each cost component varied with the quantity of milk handled and the seasons. The cost of collection was found to be as high as Rs. 1.24 for those collection centers collecting milk less than 5,000 litres and as low as Rs. 0.14 per litre, where the collection of milk was more than 42,500 litres. Similarly, costs of transportation varied from Rs. 0.14 to Rs. 0.56 for the varying quantity of milk transported. However, the costs of chilling and reception of milk ranged between 26 to 29 paise and 4 to 5 paise, respectively. To reduce cost, increasing the procurement by finding out the least cost route schedule was suggested.
In order to stimulate milk production and provide a remunerative marketing channel for the dairy farmers, the development of infrastructure like roads, communication facilities, and market intelligence assumes vital importance. Studies elsewhere, such as in Kenya, of the spatial effects on milk price paid, have found that even a few kilometers of additional road separating a farm from the main road can reduce milk price significantly (Staal et al, 2000).
With the continued modernization of the dairy industry leading to enhanced production and productivity of milk, the development of infrastructure for marketing of strategic inputs and milk, and other positive developments, the cost of production is likely to decline owing to the scale of operations and enhanced production efficiency. Due to the expanding of networks of cooperative and private sector market agents in all parts of the country, and the development of crossbred cattle and upgrading of buffaloes through their networks, milk production is increasing rapidly. As production increases, the procurement of milk is also bound to increase, and the costs of milk procurement may decrease if economies of scale can be realized. Since procurement by the organized sector in the recent past was low, most of the milk plants were running below their installed capacity. As a result, the costs of production for various products were high. The higher price of inputs and output makes products less competitive in the world market. With the increase in procurement, milk processing plants will run at optimum capacity and the costs of production will decrease considerably, making the products competitive in the world trade market.
The traditional role of the dairy sector in food security involves not only the provision of food for dairy farmers, but also a range of other products that can be sold or consumed by dairy owners to earn additional income, traction, and fuel. The major products of dairy animals are draft power, milk, manure as fertilizer or fuel, hides, and skins, as well as the less tangible benefits of financing and insurance discussed in earlier sections. The majority of dairy farmers in India are smallholders; each farmer usually owns a small number (1-3) of milch animals. The dairy animals are fed on crop residues and graze and scavenge on common pastures and wasteland. In contrast to this system, commercial production is generally intensive and based on the use of market-purchased inputs such as feeds and fodder. Dairy animals kept under the prevailing conditions of small-scale production have a low level of productivity. However, the rapidly increasing demand for milk and dairy products, coupled with changes in international trade policies and domestic reforms in India, is placing pressure on the Indian dairy sector to expand and adapt to the new economic environment. This change involves shifts in dairy functions, species, agro-ecological and geographical regions, and the structure and technology of both the production and the processing sectors. Milk production is growing fast and is moving closer to urban centers due to growing urban demand, good market access, and adequate infrastructure, resulting in environmental and human health problems. It is therefore essential that policy-makers and planners responsible for dairy development define future policies and strategies in the broad context of socioeconomic development and sustainable utilization of natural resources. This section discusses the likely impacts of industrialization of the Indian dairy sector on socioeconomic-health-environment outcomes.
As discussed earlier, the majority of livestock in India is still kept by smallholders and is mainly fed on crop by-products. Most milk is consumed, sold locally, or sold to informal traders, with only a relatively small share passing into the formal organized milk marketing channels. In the formal channels, the entry of the private sector including multinational companies (MNCs) was restricted in milk processing and product manufacturing through the Industrial Licensing Act regime up to the early 1990s and through MMPO until March 2002. However, as we enter the new millennium, many changes are expected in the production and processing sectors as the formal sector's share grows in response to changes in demand, consumer tastes, and consumers' willingness to pay for quality. The projected impact of these changes on the structure of dairy production and processing are:
Increase in crossbred population and herd size
The figures given in earlier sections clearly reveal that the population of crossbred high-yielding animals is increasing at a faster rate than local cattle. If this trend continues, milk production will increase significantly. The studies have also revealed that as production of milk increases, the marketed surplus of milk also increases. The higher the procurement, the lower the cost of producing the product, which will make the product competitive and remunerative. With the entry of the private sector into milk processing, the average herd size may go up because the private sector would like to reduce transaction costs in milk procurement, and therefore may promote large dairy farms.
Clean milk production
To compete in the world market as well as the domestic market, and to meet international quality standards, it is highly desirable to produce clean milk under hygienic conditions, which considerably increases the shelf life of the product.
Increase in scale and scope of operations in the milk processing sector
It is expected that with the opening up of the milk processing sector to private companies, the dairy industry will undergo major changes in terms of scale of operations and scope of production. In order to achieve economies of scale, existing plants will expand their capacity and large new plants will be set up in the processing sector. The dairy sector will link and converge with other food and fibre sectors. Information technology and biotechnology will become an integral part of the value chain. The product mix will also undergo some changes responding to changes in lifestyle, income levels, food habits, convenience, etc. These changes will, however, be determined by changes in demand for products linked to the formal sector.
The composition of the dairy industry is changing slowly in favor of the organized sector. The vendors give advance payments for the purchase of animals but are not in a position to dictate the terms. The payments made to them are at regular intervals and the price is also the same or slightly higher than that from the cooperatives. In the cooperatives, the union works for the development of breeds, provides improved seeds for fodder production, veterinary health care, and breeding facilities. Despite all this, vendors are not being excluded from the trade; a new link has arisen between the private milk processing plants and the vendors via contractors, who collect milk from the vendors and supply it to the plant. Some of the reasons for this are given below:
Short-term gain and risk
Indian farmers in general, particularly small and marginal farmers and landless agriculture producers, often act in a manner that appears shortsighted due to extreme risk aversion tendencies coupled with a high vulnerability to risks. Thus many cooperative services that may help them achieve higher average returns, like the improved treatment of animals, artificial insemination, provision of better variety seeds, and balanced cattle feed at subsidized rates, are not taken up because even if subsidized, they represent cash investments and higher risk exposure. As a result, farmers often choose not to sell milk to cooperatives because they do not highly value the other services offered, and prefer the milk collection services of informal vendors who generally pay higher prices. Such vendors also sometimes provide small loans at reasonable terms, and may even help procure and transport inputs such as feeds and minerals.
Collection from the producers' doorsteps
Another reason for the existence of vendors is that farmers do not have to sell the milk in the market or milk collection center; rather, the purchaser comes to their doorsteps and collects the milk. It is generally felt that the medium and large farmers do not like to carry milk to the society and stand in line along with marginal farmers, agricultural laborers, and tribal farmers. Vendors can thus sometimes offer a more convenient service.
Personal rapport
Since the vendor typically belongs to the same village or adjoining villages and goes to the city every day, he meets all his clients at least once or twice a day. Often, he obliges them by bringing things for them from the market. In such a way, he develops a personal rapport with his clients.
No testing
Vendors generally collect the milk from farmers without proper testing, bothering little about the quality of the product. Farmers sometimes take advantage of this and mix cow milk with buffalo milk before sale. Some of the farmers even adulterate the milk with water and present it to the vendors as mixed buffalo and cow milk. The vendors also often adulterate the milk further with skim milk or water.
Advance payment
One of the prime reasons for patronizing milk vendors is that they give credit in the form of advance payments. In some cases, the vendors even advance them money to purchase milch animals; and in return, the farmer gives the vendor milk until the loan is repaid. This way, the farmers are saved from paying repeated visits to the city to get loans from a bank. Under the OF system of cooperative development, village-level cooperatives are advised against giving credit to farmers, so this is a service against which cooperatives find it difficult to compete.
The same patterns of activity can be seen across South Asia and Sub-Saharan Africa, and are part of the reason why informal vendors, not private processors, comprise the main competition to the cooperative sector in many areas, and either limit the growth of cooperatives or bring about their demise. In spite of all this, the organized sector is growing, and milk procurement by the organized sector has increased from 4% to 10-15% in the last several decades. The changed trade regime might favor organized milk procurement systems that ensure quality standards. Informal sector marketing agents may grow less important as their scale of operation is small, and quality standards are not up to norms.
India has reformed its trade policy with regard to dairy products with the removal of quantitative restrictions and other NTBs on the imports of milk and dairy products, which can now be freely imported into India. With processed products for which there is direct competition, this policy may force local products to match imported dairy products both in terms of cost and quality. This change in import policy is in line with India's commitments to the WTO and domestic market reforms.
India is the largest producer of milk in the world but holds a negligible share in world trade. However, India has the potential to become one of the leading players in milk and milk product exports. India is located amidst major milk deficit countries in Asia and Africa. Major importers of milk and dairy products are Bangladesh, China, Hong Kong, Singapore, Thailand, Malaysia, the Philippines, Japan, UAE, Oman, and other gulf countries, all located close to India. On the other hand, there could be competition in domestic markets from subsidized imports of dairy products from developed countries.
Milk production in India is scale-neutral and labor-intensive; therefore, due to cheap labor, costs of milk production are significantly lower in India. There is also a vast market for the export of traditional milk products such as ghee, paneer, shrikhand, rasgolas and other ethnic sweets to the large number of Indians scattered all over the world. In anticipation of export opportunities and in view of the post-WTO scenario, India is gearing up to tackle the demands of the international market. Indian companies are getting ready to meet international standards. However there are certain concerns in export competitiveness such as:
Milk hygiene and quality control
Much of the process and product development in the past has been supply-driven rather than demand-driven. There have been considerable investments in the setting up of large-scale milk processing plants and dairy product manufacturing plants in the cooperative sector located on the periphery of cities. Attention should be paid to improving the quality of milk and maintaining a hygienic and sanitary environment in the processing plants. The immediate priority, therefore, should be to put in place a mechanism for good manufacturing practices and quality control to meet hygienic standards and to produce high-quality dairy products. The planners and policy-makers should take appropriate measures to meet the sanitary and phyto-sanitary specifications prescribed by the World Trade Organization (WTO), which range from the quality assurance of processed dairy products to the health status of livestock. Significant investments must be made in milk procurement, equipment, chilling, and refrigeration facilities. A vigorous training program to educate farmers to understand the importance of milk hygiene and clean milk production, and to adopt proper milk handling and cleaning of tools and devices, should be implemented in rural areas.
Productivity
The productivity of milch animals is of vital importance to dairy farmers because it has direct influence on the costs and returns, and finally the competitiveness, of dairy farming systems. Therefore, in order to have an exportable surplus in the long term and also to maintain cost competitiveness, it is imperative to improve the productivity of milch animals. It should nevertheless be recognized, as discussed earlier, that much of the returns through smallholder dairying come in forms other than milk. A shift towards high milk productivity may require a change in farmer objectives or incentives so that the relative value of the other outputs is lower than it is currently.
Development of value-added products
In the changing world scenario, there is a need to develop value-added dairy products employing modern processing methods and distribution systems, keeping in view the needs of the domestic markets and international trade. The demand pattern is shifting towards high-value products like cheese, butter, and ice cream. There is growing diversity in urban food habits and resulting demand for a variety of new products. The dairy industry should capitalize upon this situation. There is a need for the industry to strengthen the capabilities of research institutes, since it would benefit most from the outcome of research findings.
Brand image and collaborations
Brand image needs to be projected at leading international dairy trade fairs, particularly of those countries to which exports are targeted. Another step may be to encourage technical collaboration and marketing contracts with leading international dairy companies.
The changes in the sector will likely have salubrious effects on household nutrition, women's income and employment, and human health at large. Studies conducted in the field reveal that about 67% of the total marketed surplus of milk comes from marginal and small farmers and landless agriculture laborers. Even though their total milk production is small, some part of it may be sold at the cost of their personal consumption. (distress sale) (is there data on this? Seem quite speculative. In Kenya studies have shown that even where all milk is sold, it is often used to buy other nutrition food in larger quantities, such as beans/legumes). As a result of such distress sales, the reduced milk consumption may sometimes result in malnutrition and affect human health. In other cases, particularly when women control a significant share of the milk income, income from milk sales is used to buy higher quantities of other proteins such as beans and pulses. Overall, the evidence suggests that market-oriented milk production has positive health and nutrition effects in producing households, either directly through milk consumption, or through higher incomes. When the productivity/production of milk increases, consumption will also increase and improve the nutritional status of the households.
Dairying is an activity in which female workers do the majority of work looking after and maintaining animals. Thus, dairy farming provides gainful employment to women in rural areas. In some milk sheds, women's cooperative societies have arisen in which women do all the work (Sundaresan, 1973). Dairying can provide supplementary employment for rural labor and help raise productivity. NDDB's Perspective 2010 seeks enhanced participation of women in cooperatives as members and leaders because they are the major contributors to dairying. The goal is to increase their participation in cooperatives to 50% by the end of decade. To face this challenge, NDDB is assisting the District Unions to incorporate appropriate and effective strategies in their plans to achieve greater participation. The Women's Dairy Cooperatives Leadership Program (WDCLP), assisted by the European Union, is one of the major initiatives to increase the membership of women. The program also helps rural women to organize and run thrift and credit groups and other income-generating activities (NDDB, 2001).
The rapidly increasing demand for dairy products in urban areas has given rise to haphazard growth of production centers in peri-urban areas that are essentially detached from their supporting land base. This has led to animal concentrations that are out of proportion with the feed supply capacity of the local land and waste disposal facilities. Foul odors usually emanate from animal wastes, if not treated or disposed of properly, leading to air pollution. Animal wastes also contaminate soil and groundwater.
Traditionally, milk production activities in India have been closely integrated with crop production. However, environmental problems escalate with the scale and intensity of operations, ranging from the least worrisome in traditional systems to highly threatening in large-scale farms. Pollution problems in rural areas are internalized, as the small amount of waste produced is utilized in the form of fuel and/or organic manure to improve the soil fertility for crop and fodder cultivation. In industrial production systems, a huge quantity of waste is generated that is generally not treated before disposal. It would not only require careful planning but also large capital investment to create the necessary infrastructure for waste treatment and economic disposal.
Establishment of commercial dairy farms adjoining urban areas may create several social problems. The growth stimulus coming from strong demand for livestock products is not transmitted to the rural areas, where it could encourage broader development and more equitable wealth distribution. Small producers find it difficult to compete with large commercial units. Milk production in rural areas generates supplementary income and employment opportunities, which are adversely affected by the growth of peri-urban dairy farms. Notwithstanding constraints and threats posed by the growth of peri-urban dairy production centers, there are many qualitative and quantitative benefits of this structural change in that huge dietary improvements are observed from the regular and cheap supply of high quality milk and dairy products to urban people. In addition, benefits include the generation of employment and the provision of a profitable business to people engaged in the profession.
The threats, weaknesses, strengths, and opportunities associated with peri-urban dairy farms calls for a comprehensive analysis and subsequent actions to be taken by planners and policy-makers. Recently, the Government of India decided to relocate dairy farms from the urban centers (Delhi) to rural areas to alleviate the problem of environmental pollution and waste disposal. However, weak infrastructure and processing facilities, poor hygienic conditions, and lack of regulatory mechanisms in rural areas are limiting factors for the orderly growth of dairy industry.
Milk production in India takes place in millions of tiny farms and smallholdings (both in terms of land and animals) scattered throughout the country. However, the changing policy environment will have some impact on the organization of dairy production and processing sectors. The smallholder production system will face many constraints; therefore, some policy strategies are needed to involve smallholders in the decision-making process and development of the Indian dairy sector. Some of the constraints faced by small producers are discussed below:
The progressively shrinking farm size and fragmentation of land holdings will make dairy farming unviable and drive out a large number of dairy farmers at the bottom end of the smallholder spectrum.
Timely and adequate institutional credit at the farm level for dairy production is not available due to procedural complexities, high interest rates, and other problems.
Inputs and livestock health and breeding facilities for milk production are mainly in the domain of the public sector, and are generally inefficient and of poor quality.
India has many animal diseases, and control of these diseases is a low priority for the government, resulting in substantial losses.
The demand and supply balance of animal feeds and fodder is worsening, and this puts enormous pressure on natural resources.
Government policies prohibit the alternate use of milch animals due to social and religious compulsions, which limits the scope and viability of dairy production systems.
Liberalization of the Indian economy and implementation of WTO commitments has opened up global competition in the dairy sector, which exposes the smallholder producers to unfair and distorted trade competition due to distortions in world dairy markets.
The legal and regulatory framework has not kept pace with changes in the domestic policy environment and global trade regime. The MMPO Cooperative Societies Act continues to be restrictive rather than enabling.
Food safety issues have become more important, and consumers are looking for assurances that there will be no long-term effects from new practices, processes, or products. All these requirements represent an opportunity as well as a threat to smallholder producers.
Animal health and welfare requirements will also put pressure on smallholder producers.
The overarching strategic direction in Indian dairy sector will be to develop new, higher-value products and markets, which involves a focus on:
Understanding the market and preparing itself to respond to emerging market trends
Ensuring that the products are safe, free from residues, and are not impacted by trade barriers, animal welfare or animal health issues, and that they meet the range of functional and sensory quality standards that consumers demand
Producing products without depleting natural resources and affecting the environment
Restructuring the government regulatory and legal framework to enhance competitiveness of the milk production and processing sectors through vertical integration in production, processing, value addition, and marketing of dairy products in domestic as well as global markets
More emphasis on new production technologies like crossbreeding, supported by efficient extension services for technology transfer and delivery of animal health care and breeding facilities
Restructuring and revitalization of government animal husbandry departments, reorienting their mandate from curative veterinary care to preventive veterinary care, moving delivery of livestock services away from government, progressive privatization of services, and the creation of a disease-free zone as per OIE requirements to improve institutional efficiency
Improving the farmers' access to institutional credit through simplification of procedures, reduction in interest rates, etc.
Reorienting the priorities of research institutions and encouraging greater participation of different stakeholders such as farmers and industry in the decision-making process
Necessary quality measures (HACCP, ISO certification) need to be implemented along the entire chain from farmer to consumer to ensure that dairy products meet international standards as prescribed by the Codex Alimentarius Commission and the importing countries.
There is a range of ways in which the dairy sector contributes to changes in the global environment, such as contributions to greenhouse gas emissions (e.g., methane and nitrous oxide), effects on biodiversity, etc. Massive demand of the growing urban populations for milk and dairy products often causes environmental degradation when mixed farming systems decline and traditional farming is disrupted. The population explosion combined with poverty leads to poor management of livestock, which damages natural resources further. Overgrazing and deforestation due to ranching have degraded extensive land areas and adversely influenced biodiversity in many parts of the world. High animal concentrations in and around urban centers pollute the land and water through wastes from animal rearing and processing-related activities. Rising human needs for milk and other livestock products have placed the environment in conflict with livestock.
In the traditional smallholder dairy production system, a diverse and wide variety of feed resources such as crop residues, agro-industrial wastes and by-products, and pasturelands are used. The scope for increasing the conventional feed resources is limited, and grazing lands are being converted into croplands to grow food crops. The indigenous breeds of dairy animals, developed to cope with difficult environments and climatic stress, cannot match the demands for higher production. Therefore, the policy of the government has been to introduce exotic breeds to achieve higher productivity in a short time. More external market-purchased inputs are needed to obtain higher returns from high-yielding animals, and milk production is becoming increasingly crop-based. Increased attention to the livestock-environment interaction is thus of critical significance for sustaining the resource base.
Pollution from livestock systems can affect water supplies, the atmosphere, and the food chain directly, by the transmission of toxins and diseases through animal products. It is not surprising that developed countries are experiencing serious problems of livestock pollution, while in developing countries, pollution is less of a problem because of the small units, low stocking rates, and subsistence nature of production systems. In developed countries, nutrients are generally in oversupply; but in most areas of developing countries there exist chronic nutrient and energy shortages. The resulting strong demand for fuel and manure turns the wastes into valuable assets like dung cake and manure. However, pollution of the food chain is a major issue and nutrients, feed additives, hormones, and veterinary drugs used in excessive quantities can contaminate the food chain. Even when wastes are collected and utilized, significant leaching into air, water, and the ground occurs. Pollution of the environment from ammonia volatilization from intensive dairy production systems can add to nitrate pollution of water supplies and may contribute to the problem of acid rain. Methane release from ruminants is also a potential factor in global warming. Dust within livestock buildings and feed preparation areas can cause respiratory problems for livestock and humans, and it can also be the carrier of disease organisms and toxic substances. Gaseous emissions and odors are of concern to the neighbouring populace.
Pollution problems mainly arise through the increased intensity of production, and the reversal of this trend could combat this. However, this may be unrealistic in the face of increasing demand for livestock products. Recycling of animal wastes and wastes in the processing sector through technical innovations could markedly help pollution control. One method of controlling pollution from livestock systems is through legislation. The principle of "polluter pays" is now widely accepted, with a mechanism for imposition of financial penalties for any breach of law. The laws must set detailed standards for permitted pollution levels of a wide range of substances, and must include specifications for buildings and equipment with respect to waste disposal and contaminants. However, more important is the implementation of these rules and regulations, which is missing.
Ahuja, V., P.S. George., Sunil Ray., K.E. McConnell., M.P.G. Kurup., V. Gandhi., Dina. Umali-Deininger and Cee de Haan. 2001. Agricultural services and the poor - Case of livestock health and breeding services in India. Ahmedabad: Indian Institute of Management, Washington, D.C. The World Bank and Bern: Swiss Agency for Development and Cooperation.
Alagh, Y.K. 2002. Diversification into dairying (Keynote address). Indian Dairyman, 54(2) (February): 21-24.
Bhalla, G.S., P. Hazel and J. Kerr. 1999. Prospects for India's cereal supply and demand to 2020. Food, Agriculture, and the Environment Discussion Paper 29. Washington, D.C.: International Food Policy Research Institute.
Candler, W. and N. Kumar. 1998. India: The dairy revolution: The impact of dairy development in India and the World Bank's contribution. A World Bank Operation Evaluation Study. Washington, D.C.: The World Bank.
Central Statistical Organization (CSO). 2001. National Accounts Statistics, 2000. Delhi: Department of Statistics, Ministry of Planning, Government of India.
Dairy India. 1997. Dairy India-1997. P.R. Gupta (Ed.). Delhi: B.B. Nath Printers.
Dastagiri, M.B. 2001. Demand for livestock products in India: Current status and projections to 2020. Agricultural Economics Research Review (Conference Proceedings). Delhi: Agricultural economics Research Association (India).
de Haan, C., H. Steinfeld, and H. Blackburn. 1997. Livestock and the environment - Finding a balance. E.U. Development Policy Sustainable Development and Natural Resources, Produced by WREN Media Eye, U.K.
Delgado, C., M. Rosegrant and S. Meijer. 2001. Livestock to 2020: The revolution continues. Paper presented at the Annual Meetings of the International Agricultural Trade Research Consortium (IATRC), Auckland, New Zealand, January 18-19, 2001.
Delgado, C., M. Rosegrant, H. Steinfeld, S. Ehui and C. Courbois. 1999. Livestock to 2020: The next food revolution. Food, Agriculture, and the Environment Discussion Paper 28. Washington, D.C.: International Food Policy Research Institute.
Devendra, C. 2001. Smallholder dairy production systems in east and Southeast Asia: Expanding importance, environmental impacts and opportunities for improvement. Paper presented at the NDDB-ILRI South-South Workshop on Smallholder Dairy Production and Marketing - Constraints and Opportunities, March 13-16, 2001. Anand: National Dairy Development Board.
DGCIS. 1998. Monthly Statistics of the Foreign Trade of India, Annual Numbers (various March issues). Calcutta: Directorate General of Commercial Intelligence and Service.
Economic Times. 2002. Exim Policy 2002-07. Ahmedabad: Economic Times (Financial daily).
FAO. 2002. Export subsidies and world market prices - March 2002. Dairy Outlook. Rome: Food and Agriculture Organization.
Gandhi, V.P. and G. Mani. 1995. Are livestock products rising in importance? A study of the growth and behaviour of their consumption in India. Indian Journal of Agricultural Economics, 50(3) (July-September): 283-93.
GOI. 1997. Indian Livestock Census 1992, Vol. I: Summary tables. Delhi: Directorate of Economics and Statistics, Department of Agriculture and Cooperation, Ministry of Agriculture, Government of India.
GOI. 2001. Annual Report 2001-02. Delhi: Department of Animal Husbandry and Dairying, Ministry of Agriculture, Government of India.
Government of India (GOI). 1998. 1992 Indian Livestock Census Summary Tables Volume-I. Delhi: Directorate of Economics & Statistics, Department of Agriculture & Co-operation, Ministry of Agriculture, Government of India.
Government of India (GOI). 1999. Basic animal husbandry statistics 1999. Delhi: Department of Animal Husbandry & Dairying, Ministry of Agriculture, Government of India.
Government of India (GOI). 2000. Economic Survey 1999-2000. Delhi: Economic Division, Ministry of Finance, Government of India.
Government of India (GOI). 2002. Economic Survey 2001-02. Delhi: Economic Division, Ministry of Finance, Government of India.
ILRI. 1995. Global agenda for livestock research. (Eds. P.R. Gardiner and C. Devendra). Proceedings of a Consultation. Nairobi (Kenya): International Livestock Research Institute.
International Dairy Federation (IDF). 2001. World dairy situation 2001. Bulletin of the International Dairy Federation 368/2001. Belgium: International Dairy Federation.
Kalra, K.K., Raj Vir Singh and A. Kumar. 2000. Optimization model for resource allocation in mixed farming system of Haryana. Research Project Report: Karnal: National Dairy Research Institute.
Khokher A. K. 1985. Economics of milk procurement for feeder balancing dairy Partapur. M. Sc. thesis (unpublished): Kurukshetra (India): Kurukshetra University.
Kumar, P. 1998. Food demand and supply projections for India. Agricultural Economics policy Paper 98-01. New Delhi: Indian Agricultural Research Institute.
Kurup, M.P.G. 2001. Smallholder dairy production and marketing: Constraints and opportunities country paper: India. Paper presented at the NDDB-ILRI South-South Workshop on Smallholder Dairy Production and Marketing - Constraints and Opportunities, March 13-16, 2001. Anand: National Dairy Development Board.
Mishra, S.N and A.K. Dixit. 2001. Environmental contribution of livestock in India. Delhi: Society for Economic and Social Research (SESR).
Mishra, S.N. 1999. Status of livestock statistics in India, Journal of Indian Society of Agricultural Statistics. 52(3): 273-289.
National Commission on Agriculture (NCA). 1976. Reports covering Animal Husbandry (Part VII) and statistics (Part XIV). Delhi: Ministry of Agriculture and Irrigation, Government of India.
National Dairy Development Board (NDDB). 1987. From a drop to a flood: The Anand pattern Concept and achievements. Anand, India: National Dairy Development Board.
National Dairy Development Board (NDDB). 2001. Annual report 2000-01. Anand, India: National Dairy Development Board.
National Livestock Policy Perspective. 1996. Report of the steering group (National Livestock Policy). Delhi: Department of Animal Husbandry & Dairying, Ministry of Agriculture, Government of India.
OECD. 2001. Agricultural policies in OECD countries: Monitoring and evaluation, 2001. Paris: Organization for Economic Cooperation and Development.
OECD. 2001. Agricultural policies in OECD countries: Monitoring and evaluation, 2001. Paris: Organization for Economic Cooperation and Development.
OECD. 2001. The Uruguay Round Agreement on Agriculture: An evaluation of its implementation in OECD countries. Paris: Organization for Economic Cooperation and Development.
OECD. 2001. The Uruguay round agreement on agriculture: An evaluation of its implementation in OECD countries. Paris: Organization for Economic Cooperation and Development.
Pandey, U.K. 2000. Livestock in the household economy. keynote Paper presented at 8th Annual Conference of Agricultural Economics Research Association, 28-29 December 2000. Chennai: Tamil Nadu Veterinary and Animal Sciences University.
Paroda, R.S. 1998. Indian dairy industry in the emerging scenario. Keynote address delivered at XXIX Dairy Industry Conference, 28th November, 1998. Karnal: Indian Dairy Association (North Zone).
Patel, Amrita. 2000. Science and Nation Building. Jawaharlal Nehru Birth Cenetary Award Lecture, 2000. Jaipur: The Indian Science Congress.
Patel, R.K. 1993. Present status and promise of dairying in India. Indian Dairyman, 45(7) (July): 276-308.
Radhakrishna, R. and C. Ravi. 1990. Food demand projections for India. Hyderabad, India: Center for Economic and Social Studies. Mimeo.
Radhakrishna, R. and C. Ravi. 1994. Food demand in India. Hyderabad, India: Center for Economic and Social Studies. Mimeo.
Ramaswamy, N.S. 2000. Livestock and sustainable development. Paper presented at the International conference on Smallholder Livestock Production Systems in Developing Countries: Opportunities and Challenges held during 24-27th November. Trissur (India): Kerala Agricultural University.
Rangaswamy. 2000. Cost of collection, transportation and chilling of milk in a cooperative milk plant in Tamil Nadu. M.Sc. thesis (unpublished): Karnal (India): National Dairy Research Institute.
Ravindra, H., P.K. Maheshwari and K. R. Rao. 2001. Indian dairy industry: Present scenario and future investment potential. Food & Pack. 1(7) (September): 6-10.
Roy, Amit. 2002. Changing profile of the Indian market. Indian Dairyman 54(2) (February): 47-53.
Saxena, Rakesh. 1999. Comparative advantage and competitiveness of the Indian milk sector. Working Paper 142. Anand (India): Institute of Rural Management.
Saxena, Rakesh. 2000. Dynamics of demand for milk in this millennium. Paper presented at the XXX Dairy Industry Conference on Paradigm Shift in Dairying - Its Impact on the Indian Dairy Industry, December 8-9, 2000. Calcutta: Indian Dairy association (East Zone): 32-47.
Schultz T.W. 1964. Transforming traditional agriculture. New Haven: Yak University Press.
Shah, T., V. Ballabh, Pratima B. and J. Talati. 1995. Institutional structure for dairy development: India's post-independence experience. Indian Dairyman. 47(1) (January): 1-36.
Sharma, Vijay Paul and Ashok Gulati. 2002. Trade liberalization, market reforms and competitiveness of Indian dairy sector. IIM-IFPRI Collaborative research project report (draft): Washington, D.C.: International Food Policy Research Institute.
Sharma, Vijay Paul and Raj Vir Singh. 1994. Economics of milk production in Himachal Pradesh. Agricultural Situation in India 48(10). (January): 717-720.
Sharma, Vijay Paul. 2000. Assessing the effects of the WTO agreement on Indian dairy industry: What can we learn from past five years? Indian Dairyman. 52(11). (November): 7-26.
Sharma, Vijay Paul. 2001. The WTO Agreements and the Indian dairy industry: What can we learn from the first 5 years? World Dairy Situation 2001 (Special article), Bulletin of the International Dairy Federation (368/2001), Brussels (Belgium), pp. 16-18.
Shukla, R.K. and S.D. Brahmankar. 1999. Impact evaluation of Operation Flood on rural dairy sector. New Delhi: National Council for Applied Economic Research.
Singh C.B., D.S. Sohi and J.P. Dhaka 1995. Impact of integrated dairy and crop production technologies in the rural households. Karnal: Operational Research Project, National Dairy Research Institute.
Singh R.P. and Amit Kar. 2002. Cooperative credit system - emerging issues and policy options. Agriculture Today. April 2002: 26-30.
Singh Raj Vir and R.S. Kairon. 1996. Economics of milk production. National Seminar on Economic Independence in Dairying. Bikaner: Indian Dairy Association.
Singh, Ajmer. 1999. Economic analysis of dairy financing under IRDP in Haryana. Ph. D. thesis (unpublished): Karnal (India): National Dairy Research Institute.
Steinfeld, H. 1998. Livestock production in the Asia and Pacific region - current status, issues and trends. World Animal Review, 90(1): 14-21.
Steinfeld, H., C de Haan, and H. Blackburn. 1997. Livestock-environment interactions-Issues and options. E.U. Development Policy Sustainable Development and Natural Resources, WREN Media Eye, U.K.
USDA/FAS. 2001. Dairy, livestock and poultry division: World dairy prices (various issues). Washington, D.C.: U.S. Department of Agriculture, Foreign Agricultural Services.
USDA/FAS. 2002. FAS online: Dairy, livestock and poultry division, Dairy international prices (http://www.fas.usda.gov/dlp/deip): Washington, D.C.: U.S. Department of Agriculture, Foreign Agricultural Service.
USDEC. 1999. World dairy markets and outlook. 4(4) (Special issues, September-October). Washington, D.C.: United States Dairy Export Council: 2A-2B.
|
[32] India Dairy Team Leader,
Professor, Ahmedabad, India [33] Professor and Principal Scientist, National Dairy Research Institute, Karnal, India [34] Economist, International Livestock Research Institute, Nairobi, Kenya [35] Senior Research Fellow, International Food Policy Research Institute, Washington, D.C., U.S.A. [36] The bound rate of duty on milk powders (including baby milk foods) was raised from zero to 60% in June 2000 under tariff rate quota provisions of the WTO under which import of the first 10,000 tons of milk powder is allowed at a lower duty of 15% and any import above that ceiling attracts 60% duty. |
![]()
![]()
![]()
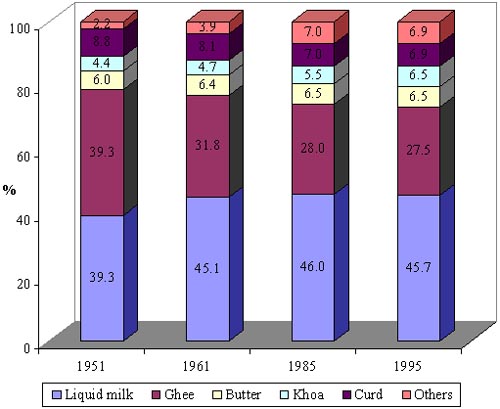
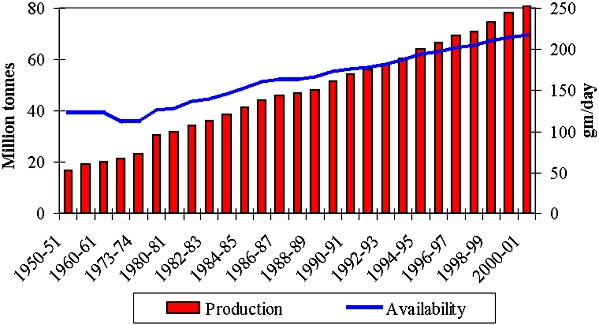
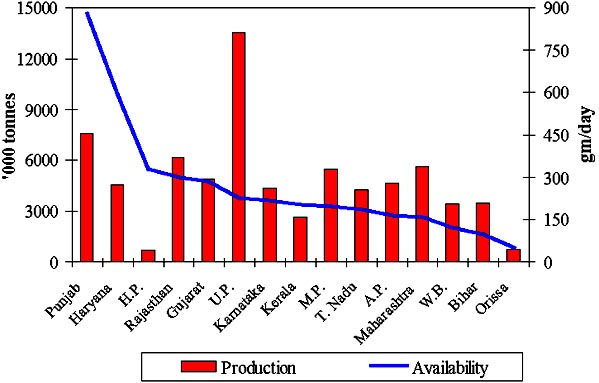
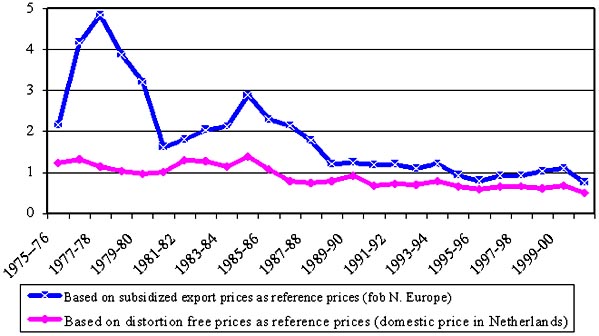
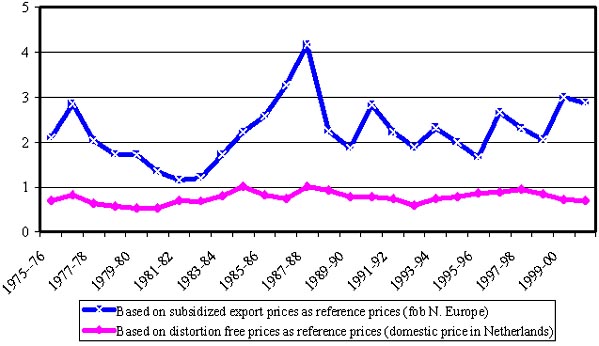
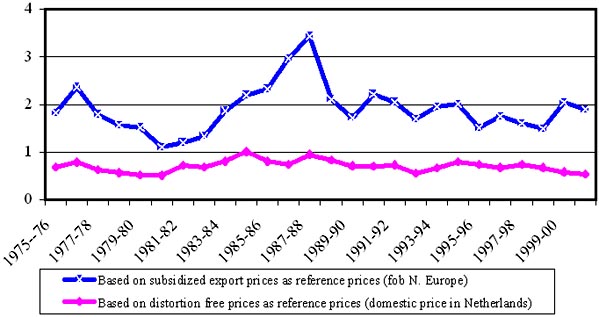
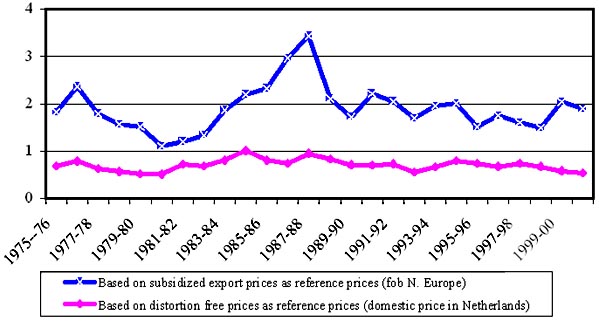
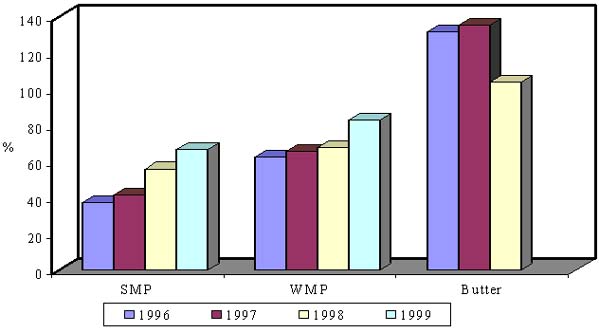
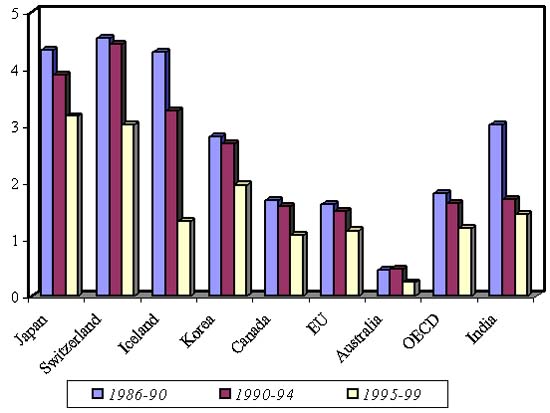
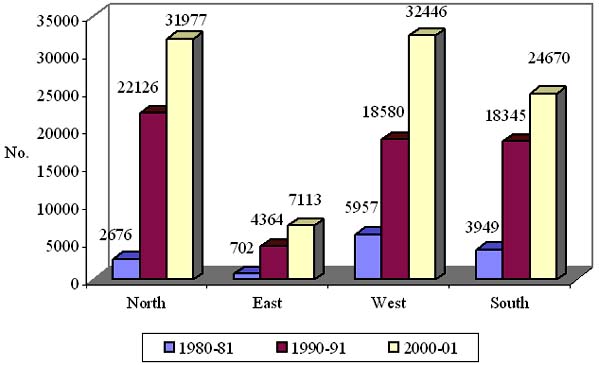
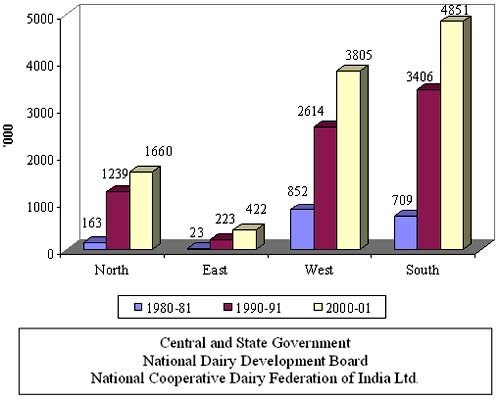
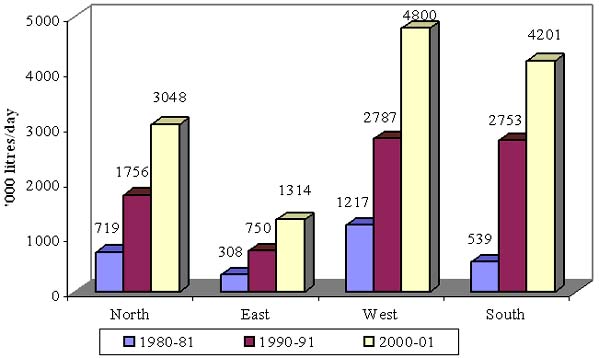
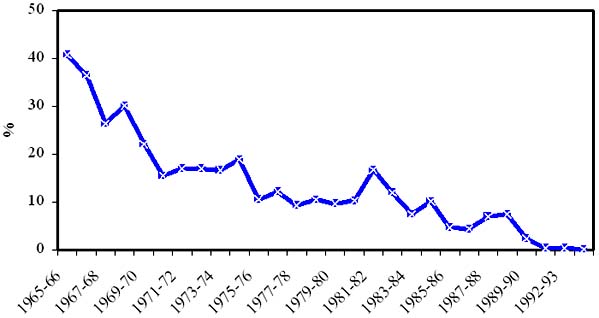
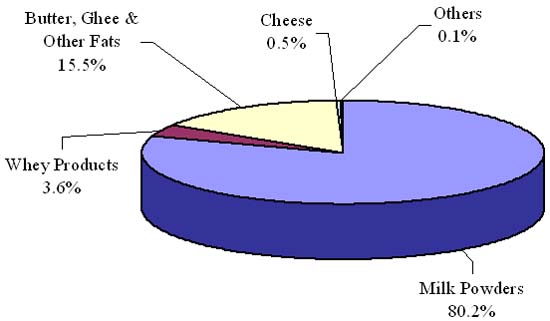
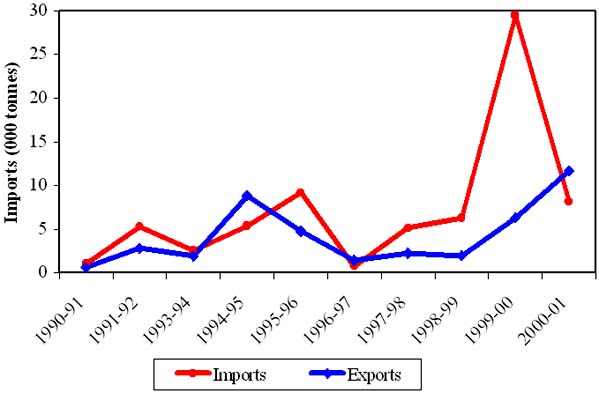
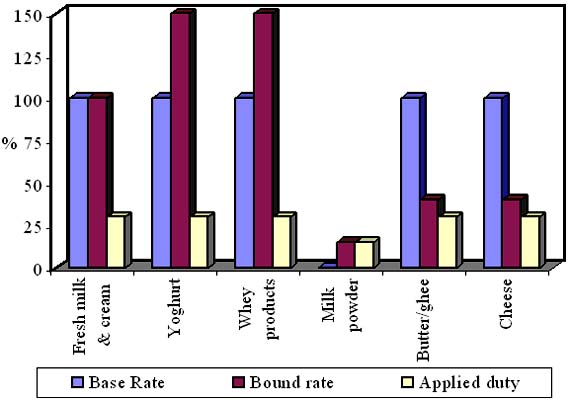
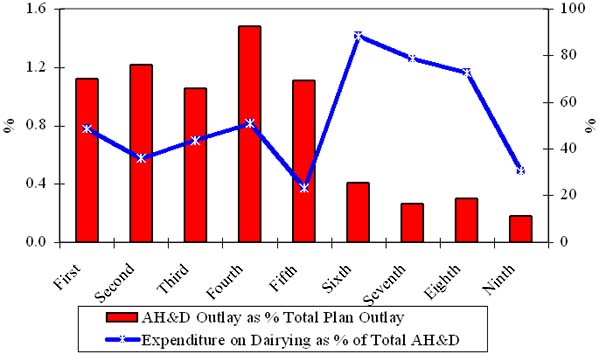
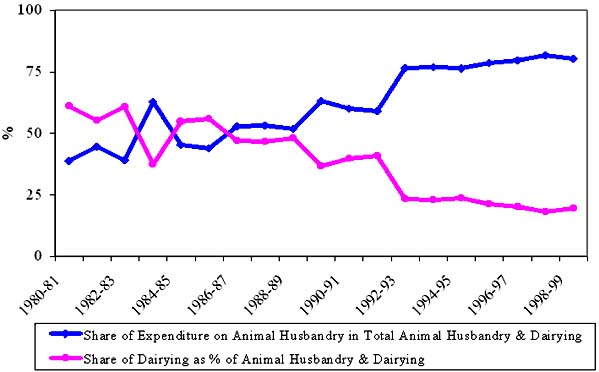
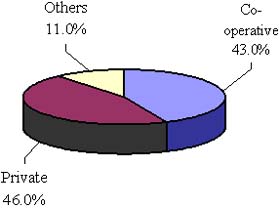
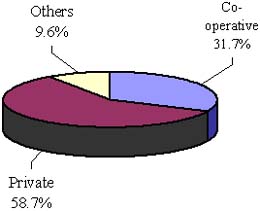
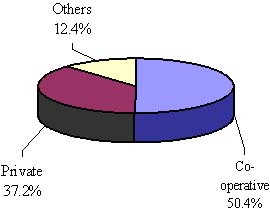
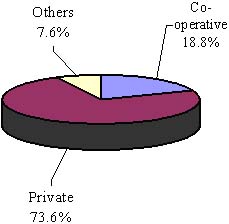
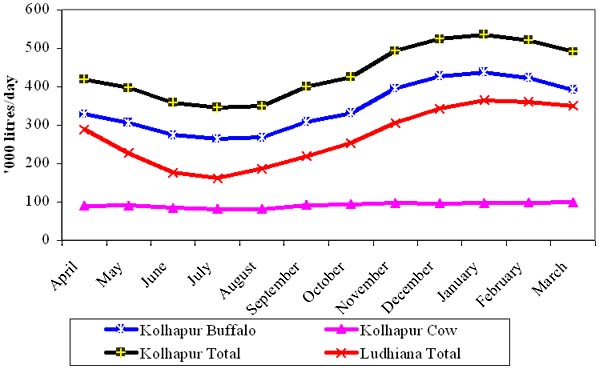
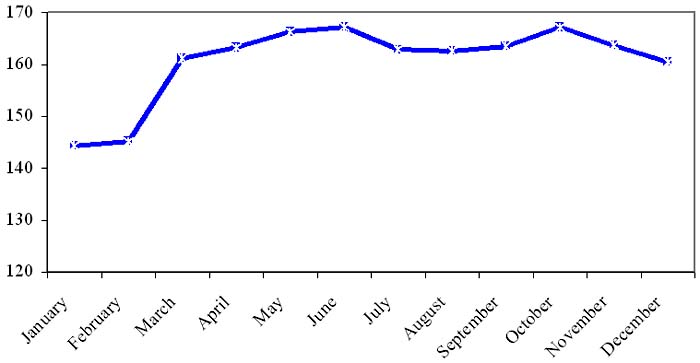
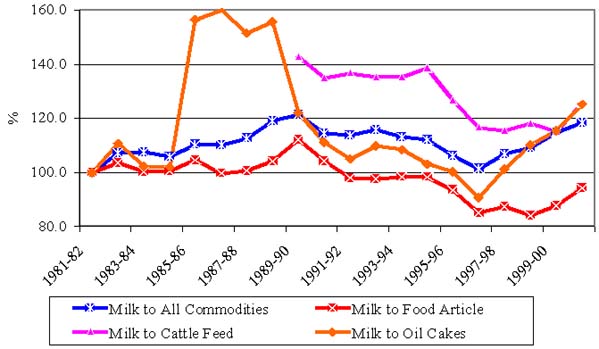
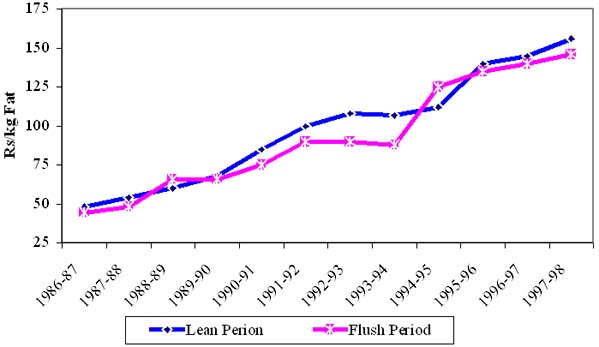
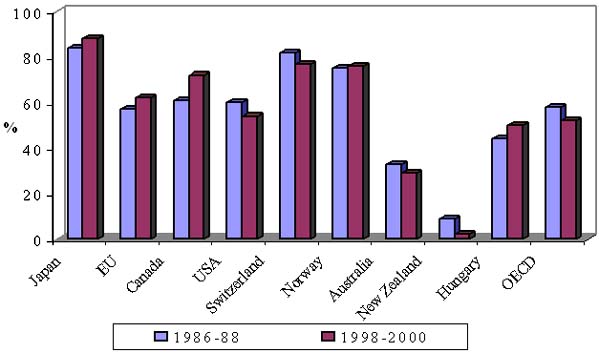
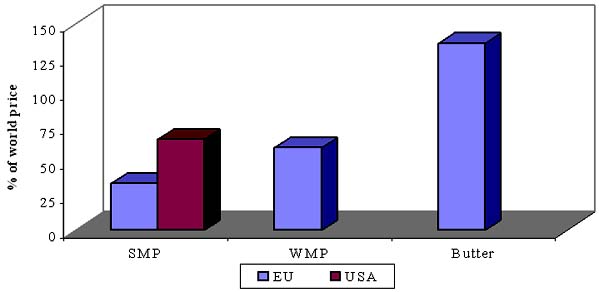
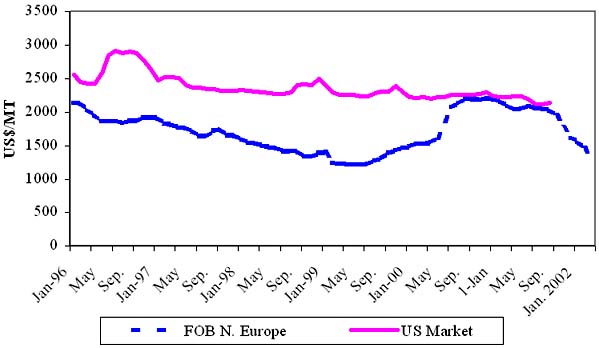
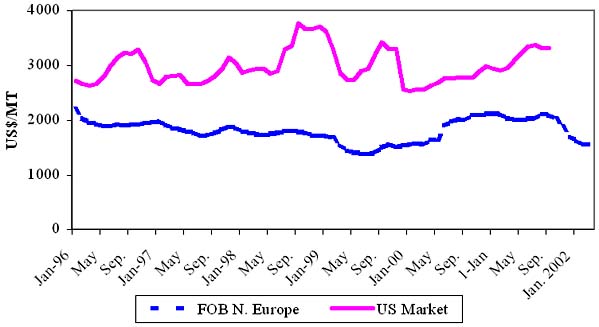
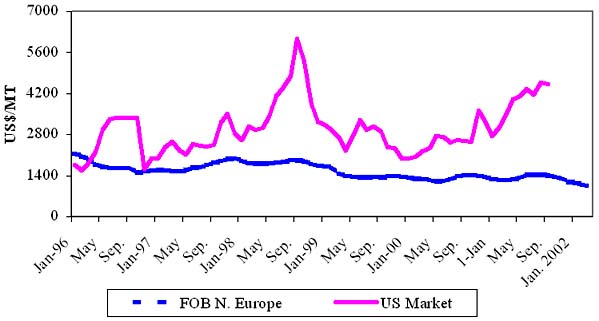
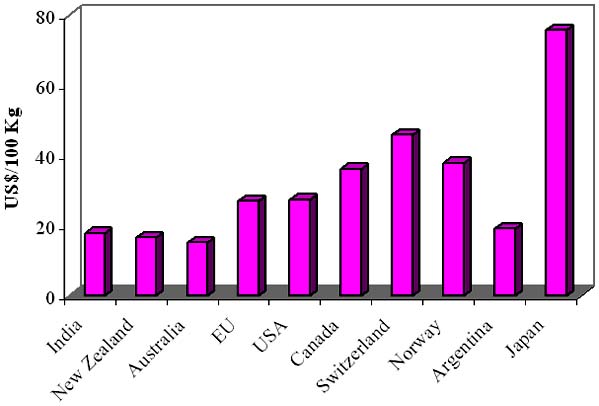
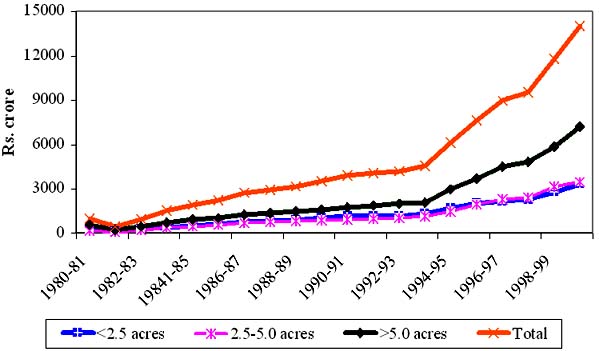