![]()
![]()
![]()
R. Mehta[37]
R. G. Nambiar[38]
S. K. Singh[39]
S. Subrahmanyam[40]
C. Ravi[41]
June 2002
This paper was produced as part of Phase I of an IFPRI-FAO project entitled "Livestock Industrialization, Trade and Social-Health-Environment Impacts in Developing Countries", funded by the Department for International Development (DFID), U.K., through the Livestock, Environment and Development (LEAD) initiative at FAO. Correspondence may be addressed to the scientific coordinator for the project, Dr. Christopher Delgado, IFPRI, 2033 K St, N.W., Washington D.C. 20006, USA. Email: [email protected]
1 Lakh = 100,000
1 Crore =1,00,00,000
1 Million = 10 lakh
1 Billion = 100 crores
1 US$ = Rs 47.53 (2001-02)
-----
Indian Financial Year = April-March
APEDA: Agricultural and Processed Food Products Export Development Authority
ASSOCHAM: Associated Chamber of Commerce and Industry
BCC: Broiler Coordination Committee
BIS: Bureau of Indian Standards
BoP: Balance of Payments
CII: Confederation of Indian Industry
CLFMA: Compound Livestock Feed Manufactures Association
CTIPPM: Central Training Institute for Poultry Production and Management
DOCs: Day Old Chicks
FAIDA: Food and Agriculture Integrated Development Action, Report
FCR: Feed Conversion Ratio
FICCI: Federation of Indian Chambers of Commerce and Industry
GIC: General insurance corporation of India
GMPs: Good Manufacturing Processes
IPDPs: Intensive Poultry Development Projects
IRDP: Indian Rural Development Programme
IREDA: Indian Renewable Energy Development Authority
IVRI: Indian Veterinary Research Institute
LES: Linear Expenditure System
MFPO: Meat and Food Products Order
NABARD: National Bank for Agriculture and Rural Development
NAFED: National Agricultural Cooperative Marketing Federation of India
NCDC: National Cooperative Development Cooperation
NECC: National Eggs Coordination Committee
NSS: National Sample Survey
NSSO: National Sample Survey Organisation
OGL: Open General Licence
SPF: Specific Pathogen Free
TBT: Technical Barriers of Trade
TRQ: Tariff Rate Quota
VH: Venketeshwara Hatcheries
WHO: World Health Organisation
By Rajesh Mehta
This paper attempts to study growth and development of India’s poultry industry over the last two or three decades from a range of perspectives - production and productivity growth, significance of poultry to national economy, scale of operations, processing and marketing, consumption and demand for poultry products, exports and imports, domestic policies including credit and other incentive structure, food safety issues, environmental issues, major constraints affecting the poultry sector and the future outlook. Some key results to emerge from this explorative study are:
1. Poultry is today one of the fastest growing segments of the agricultural sector in India. While the production of agricultural crops in India has been growing at a rate of 1.5 to 2 percent per annum during the last two decades, that of eggs has been rising at 6 percent per annum. India produced 37 billion eggs in the year 2000-2001 and ranked fifth in the world in egg production. Similarly the country produced more than 1000 million broilers in the same year.
2. The development of poultry is not uniform across regions. The northern region has recorded the highest per capita production of 72 eggs per annum followed by southern region with 59 eggs per capita per annum. Both eastern and western regions have recorded low levels of productions of about 20 eggs per capita per annum. The central region has recorded the lowest production level of only 9 eggs per capita per annum. Even within each of these regions, there are considerable variations in production. For instance, in the northern region, Himachal Pradesh has recorded the lowest production level of 13 eggs and Punjab has recorded the highest production level of 128 eggs per capita per annum. In the southern region, both Andhra Pradesh and Kerala have recorded the highest production level of 77 and 67 eggs per capita per annum respectively. On the other hand, Karnataka has recorded the lowest level of 37 eggs per capita per annum. In the eastern region, the performance of Bihar remains the lowest with a production level of 14 eggs per capita per annum. Among the three western states, Maharashtra attained the highest production level of 31 eggs per capita per annum, while Gujarat and Rajasthan achieved low production levels of about 10 eggs per capita per annum.
3. About 60 percent of this rapid growth in production is to be attributed to productivity increase. With the introduction of hybrid birds produced through pure lines, productivity has undergone a sea change. These breeds, which used to give 250 henhouse production of eggs per bird in the early 70’s now give a henhouse production of around 315 of eggs per bird. Similarly, in broilers the Feed Conversion Ratio (FCR) has improved - from a ratio of 3 kg. of feed to kg. of chicken meat in the early 70s, to around 2.0 kg. of feed to 1 kg. of chicken meat nowadays.
4. A distinctive feature of Indian poultry is that it is self sufficient in terms of availability of several world known brands of commercial hybrid chicks, essential equipment and machinery, medicines and vaccines, compounded poultry feed, disease diagnosis, services poultry training programmes, and technical and skilled manpower. The industry is supported by a strong genetic base, where the productivity levels of broilers and layers are equal to the productivity levels observed in developed countries like US and EU. India is also one of the few countries in the world which has put into place and sustained SPF egg production project.
5. The size of broiler farm has in general increased. Earlier broiler farms have had on an average a few hundred birds per cycle. Today, units with less than 5000 birds are very rare, and instead units with 10 to 15 thousand birds per week cycle is common. In terms of technology absorption too, farmers have tended to adopt newer technologies of feeding and watering system including management of health and hygiene. Small units are at a disadvantage because of high feed and transport costs, expensive vaccines and veterinary care services, and non-availability of credit. Some small units are reported to be shifting from layer to broiler production because output in broiler units can be realised in six weeks. And slowly a system of contract farming is seen emerging in these small broiler units: chicks, feed and medicines will be supplied by integrators and output will be sold to traders identified by integrators.
6. Although India is the world’s fifth largest egg producer and eighteenth largest producer of broilers, its per capita consumption is poor - 37 eggs and 1 kg of poultry meat as against the recommended levels of 180 eggs and 11 kg. of poultry meat per capita per annum. Here again there is considerable variation between rural and urban and also across the regions. Per capita consumption of eggs is only 7.7 per annum in rural areas as against 17.8 per annum in urban areas. In seven states, per capita consumption of eggs is less than 3.5 per annum. Similarly, per capita consumption of poultry meat is 0.24 kg in rural areas and 1.08 kg in urban areas.
7. The consumption data originating from the NSS rounds reveals many interesting facts. First, 42 percent of households do not eat fish, meat or eggs, i.e. vegetarians. The rest 68 percent of total households are non-vegetarians. Over time there has been a slow change from vegetarianism to non-vegetarianism. The change is more visible in rural areas than in urban areas. For instance, between 1987-88 and 1999-2000 the increase in the proportion of households consuming any one of the three items namely fish, meat or eggs is only one percentage point in urban areas, while in rural areas this proportion increased by 4 percentage points. Second, calculation of income elasticities of demand for different commodity groups show that the commodity group, meat or fish or eggs, occupy the second position in the consumption basket of rural people (milk and milk products occupying the first position), while in the urban consumption basket the cited group occupies the third position. The estimated income elasticity is 1.01 in rural areas and 0.66 in urban areas. Third, the price elasticity also follows the same order. Meat or fish or eggs have high price elasticity of 0.75 in rural areas and 0.68 in urban areas. Fourth, estimates of income and price elasticities calculated for each of the four expenditure groups show that these elasticities tend to decline as one move from poor to non-poor and rich. The income elasticity is low for the rich, 0.5 in rural and 0.6 in urban areas. The other three income groups in rural areas have high-income elasticities ranging from 1.3 to 1.7. In urban areas, only the expenditure class of very poor has income elasticity greater than unity. Price elasticities are greater than unity for very poor and poor in rural areas, and very poor in urban areas. One significant policy implication of these cited results is that there is lot of scope in raising the demand for poultry items in rural areas.
8. Yet another distinctive feature of Indian poultry is it is predominantly a market for live birds. For the consumer in India chicken is fresh only if it is cut before his eyes. As a result, retailers of live birds slaughter at their shops 98 percent of the chicken in a very unhygienic manner. The demand for processed and deep frozen chicken produced in modern processing plants slaughter houses is very small (2 percent of the total) and has not picked up as expected.
9. In 1980, when egg and broiler production was 10 thousand million and 30 million respectively, total employment was not so encouraging. As the income and employment in the crop sector started diminishing, the non-crop sector saw a big shift, which includes poultry and diary. With the demand for poultry increasing now and production level reaching 37 billion eggs and 1 billion broilers, this sector employs around 1.6 million people. At least 80 percent of the employment is generated directly by these farms, while 20 percent is engaged in feed, pharmaceuticals, equipment and other services required by the poultry sector. Additionally, there may be a similar number of people who are engaged in marketing and other channels of servicing the poultry sector.
10. Poultry industry in India has mainly grown with the enterprise of the private sector. However, government has also helped it to grow in a number of ways. The governmental measures include: direct funding of several research activities related to poultry breeding and health management, indirect support through the Agricultural and Processed food products Export Development Authority (APEDA) and the National Egg Coordination Council (NECC) and setting up a number of poultry estates in collaboration with agencies such as the National Cooperative Development Corporation (NCDC), National Bank for Agricultural and Rural Development (NABARD), state government and non-governmental organisation.
11. Imports of poultry meat, poultry preparation and eggs and egg products were restricted till 1st April 2000. This Export-Import policy of 2000-01 eased out import restrictions but hiked up tariffs. For instance: effective from April 2000, chicken may be imported without license, but subject to an import duty of 30 percent for whole chicken fresh/chilled/frozen, and 100 percent for cut in pieces; imports of grand parent breeding stock placed under OGL; some additives such as lysine, methane, chorine chloride and vitamins can be freely imported.
Besides easing out import restrictions, the government also eased out a regulation restricting poultry feed manufacture to small-scale enterprises with capital investment below an amount prescribed by the government. This regulation had in fact constrained the development of economies of scale in feed industry and thereby resulting in high feed costs. To remove this hurdle and thereby to stimulate large investment in the poultry feed industry, the government lifted this regulation in the 1997-98 budget.
12. Issues relating to animal welfare and environmental pollution by poultry units have been of increasing concern in developed countries like EU and US. But in India, these issues are not yet critical although they are discussed at length at various seminars and discussion on poultry production. But considering the globalization and international trade in poultry products, these issues may assume significance after a few years because of pressures from importing countries like EU.
13. The perceptions about the future outlook also appear to be most favourable to the poultry industry with all market fundamentals expected to demonstrate strong growth. The CII & Mekinsey report sets a growth rate of 20 percent per annum for the poultry sector in the coming years. The study sets a target of achieving a size of Rs.300 billion by 2005. To quote from the report “The poultry sector in India has potential to grow by 20 percent over the next 3 years. This will enable it to quadruple in size, growing from Rs.7.5 billion to approximately Rs.30 billion by 2005. The major driver for overall poultry demand is increasing consumer incomes and the high-income elasticity of poultry consumption. Demand for high quality processed poultry will be driven by retailers and should grow very rapidly”.
14. What prevents the growth of poultry industry in India? What policies/measures can facilitate their growth? A major problem affecting the Indian poultry industry is the lack of basic infrastructure - storage and transportation include cold chain. As a result, there are wild fluctuations in the prices of poultry products. A second problem is inefficient marketing system. Currently poultry products pass through various intermediaries before reaching the final consumer. The presence of so many intermediaries harms both the producer and the consumer. The producer does not get remunerative price for his product, while the consumer pays high price because of cascading of margins with so many intermediaries. A third problem relates to prices of feed resources. Maize or corn plays a major role in broiler production, as it constitutes 50-55 percent of broiler feed. As the broiler industry is growing at 15 percent per annum, the demand for maize is likely to increase. Presently India grows only 11 million tons of maize and 5 million tones are available for the poultry sector, which is not sufficient if the current growth rate is to be sustained. The required policy measures are: (a) improve infrastructure facilities which will help not only to stabilise the price of poultry products in the domestic market, but also make them available in far flung areas; (b) an efficient marketing channel that gives remunerative price to the producer, i.e. the marketing set up of the country should also grow on professional lines which may include traditional channels of traders to some extent in the intervening period; and (c) to increase maize production, we have to go for GMO varieties of seed, or alternatively find other sources/types of fed ingredients which can replace maize.
The History of Indian Poultry Development[42]
Before 1950, poultry keeping in India was largely a backyard venture. Not much attention was paid to breeding, feeding, disease control and management of birds. The poultry population was confined to indigenous birds, which are hardy but have low productivity. Some exotic birds of high productivity were introduced into the country by missionary organizations in the beginning of the 20th century. They bred exotic breeds, and distributed improved chicks to local farmers to supplement their income through poultry keeping. Three major centres were developed around Etah in Uttar Pradesh, Katpadi in Tamil Nadu, and Surat in Gujarat. During World War II, the army authorities set up a number of farms with improved birds for eggs production. Hatching eggs and improved poultry stock from these farms contributed to the population of improved birds in surrounding areas.
The first major step towards scientific poultry management was taken in 1939 with the establishment of the division of Poultry Research at the Indian Veterinary Research Institute (IVRI) at Izatnagar in Uttar Pradesh. In the early 40s, a vaccine against the dreaded Ranikhet disease was developed which conferred immunity to birds and facilitated commercial farming.
A beginning towards commercial poultry keeping was first made in the India’s first five-year plan (1951-56) with the launching of a pilot project in Orissa. Later that was transformed into an All India Poultry Development Programme during the second five-year plan (1956-61) - the foundation of modern poultry farming in the country. During the plan period, five regional breeding farms were set up to acclimatize the genetically superior stock imported in 1956 from America under the technical cooperation mission. Four multiplication farms with foreign collaboration were set up in the private sector for production of exotic chicks capable of laying 240 eggs a year. Under the Freedom from Hunger Campaign, some poultry stocks were imported from Australia in 1965 for government breeding farms. Intensive poultry development projects (IPDPs) were introduced to provide necessary inputs for profitable poultry keeping. All this led to rapid increase in the number of commercial farms.
Modern poultry farming which started in the early 70s with a head count of 4 million commercial broilers per year has picked up very fast[43] An indication of this is the rapid jump in the production of eggs, broilers and poultry meat. India produced 37 billion eggs, about 1 billion broilers, and 0.7 billion tonnes of poultry meat in 2000-2001 as compared to 10 billion eggs, 30 million broilers, and 0.18 billion tonnes of poultry meat in 1980-81.[44]
Growth of eggs production
The growth rate of eggs production was quite uneven during the last five decades of the 20th century. During the 60s and 80s the sector achieved a high growth rate of 8 per cent per annum. The growth rate was moderate during the 50s and 90s. The sector experienced the lowest growth rate of 3.8 per cent during the seventies. As a result of the high growth during 60s and 80s, per capita production of eggs jumped from 7 to 14 between 1960-61 and 1973-74. A similar jump is also observed in the 80s from 15 to 25. The production of eggs reached 37,000 millions (Table 2) in 2000-01, which comes to 37 eggs per capita per annum.
Growth of meat production
With a share of 66.7 per cent in poultry output (in value terms), meat is the most important product in the poultry sector. Poultry meat has to compete with mutton, beef and pork. Production of total meat increased from 179 million tonnes in 1980-81 to 735 million tonnes in 2000-01, according to official statistics. Meat production attained the highest growth rate of 15.9 per cent per annum[45] during the 80s. But the decade of 90s witnessed a steep deceleration in the growth rate of meat production to around 4.0 per cent per annum.
While the growth of total meat production has been uneven, the poultry sector maintained a relatively stable growth in meat production during the two decades. Production of poultry meat increased at 8.7 per cent per annum[46] in the 80s and 6.0 per cent per annum in the 90s[47]. Thus, the deceleration in the growth of poultry meat is not so high as in the case of total meat. On the other hand, the growth of mutton has always been low and deceleration in the 90s is very high. Thus, poultry meat has been growing at a higher rate than mutton as well as other meat since the 90s. The trends in production of eggs as well as poultry meat reveal that the poultry sector has been growing at an annual rate of 6.0 per cent since 1991. However, the trends also indicate steep deceleration in the growth rate of the poultry sector in the 90s as compared to the 80s, during which period eggs production grew at 8.8 per cent and meat production at 8.7 per cent per annum.
Table 1: Select Indicators of Poultry Development based on Official Statistics, 1999-2000
|
Eggs production (million no.) |
37000 |
|
Commercial broiler production (million no.) |
895 |
|
Commercial layer population (million nos.) |
146 |
|
Per capita poultry meat availability consumption (gram) |
850/year |
|
Per capita eggs consumption/availability (No.) |
35/year |
|
Value of poultry products (Rs. Million) |
102340 |
|
No. of Hatcheries |
750 |
|
Total poultry population (million nos.) |
3430 |
|
Source: |
1. Annual Reports of the Department of Animal Husbandry & Dairying, Ministry of Agriculture, Government of India |
|
|
2. National Income/Accounts Statistics, CSO, Government of India |
|
|
3. Monthly Statistics of Foreign Trade of India, Dept. of Central Intelligence and Statistics, |
|
|
4. Ministry of Commerce, Govt. of India. |
|
|
5. India Info line Sector Reports: Poultry, Internet edition. |
Poultry production in value terms has also recorded a steep climb - from Rs.7950 million in 1980-81 to Rs.102340 million in 1999-2000, an increase of 12 times[48]. The share of poultry meat has been rising more rapidly (Figure 1) than that of eggs - from almost equal in 1980, the poultry meat sector has almost doubled its output in 2000: eggs Rs.40050 million and poultry meat Rs.102340 million.
Table 2: Production of Eggs, Broiler and Poultry Meat
|
Year |
Eggs |
Broiler |
Poultry Meat |
|
1980-81 |
10060 |
30 |
179 |
|
1990-91 |
23300 |
190 |
412 |
|
1995-96 |
27300 |
330 |
578 |
|
1996-97 |
27500 |
400 |
659 |
|
1997-98 |
28510 |
600 |
692 |
|
1998-99 |
30000 |
700 |
720 |
|
1999-2000 |
36000 |
825 |
710 |
|
2000-01 |
37000 |
895 |
735 |
|
Source: |
(1) Indian Poultry Industry Yearbook |
|
|
(2) Annual Reports, Department of Animal Husbandry and Dairying, Ministry of Agriculture, Government of India, various issues. |
Figure 1: Production of Egg and Poultry, 1980-2000
Share in GDP
While the importance of agriculture in national income has been declining, the importance of livestock in general and the poultry sector, in particular has been increasing. For instance, the share of agriculture (including livestock) in GDP declined from 34.7 per cent in 1980-81 to 26.1 per cent in 1996-97, but the share of the livestock sector increased from 4.8 per cent to 6.0 per cent (Table 3). This relatively lower growth of agriculture resulted in the increase in the contribution of the livestock sector to agriculture from 13.8 per cent to 23.0 per cent. However, the trend in the 90s is not encouraging with a decline in the share of livestock income in GDP from 6.5 per cent in 1990-91 to 6.0 per cent in 1996-97. The share of livestock in GDP from agriculture remained at 23 per cent during the 90s.
Table 3: Shares of Agriculture and Livestock in Gross Domestic Product
(Percentage)
|
Year |
Agriculture in GDP |
Livestock in GDP |
Livestock in Agriculture |
|
1980-81 |
34.7 |
4.8 |
13.8 |
|
1985-86 |
29.9 |
6.0 |
20.1 |
|
1990-91 |
28.3 |
6.5 |
23.0 |
|
1996-97 |
26.1 |
6.0 |
23.0 |
Shares are computed from GDP at current prices
The poultry sector accounts for about 10 per cent of the livestock output. Poultry meat comprises of around two-thirds of the value of poultry output and eggs one-third.
The contribution of poultry output in India’s GDP still remains below 1 per cent. The share was 0.60 in 1980-81, and improved to 0.80 per cent in 1995-96; but has tended to decline since then. It was 0.57 per cent in 1999-2000 (Table 4).
Table 4: Value of output of Poultry as percent of India’s Gross Domestic Product (GDP)
(At Current Prices)
|
Year |
Value of output from poultry: |
Total GDP |
Share of poultry in GDP |
|
1980-81 |
7950 |
1308070 |
0.60 |
|
1990-91 |
37490 |
5110520 |
0.73 |
|
1995-96 |
86800 |
10732710 |
0.80 |
|
1997-98 |
103350 |
13900420 |
0.74 |
|
1998-99 |
102190 |
16160330 |
0.63 |
|
1999-2000 |
102340 |
17864590 |
0.57 |
Source: National Income/Accounts Statistics, C.S.O., G.O.I., various issues.
Employment
There are no reliable statistics on direct and indirect employment. However it is generally said that the poultry industry employs 1.6 million people directly and indirectly.
Export share
India’s participation in world trade of poultry has so far been negligible. The world trade in poultry in 1998 on exportable basis amounted to 5750 thousand tonnes (valued at $10,000 million). However, India’s poultry exports amounted to a meagre 407 tonnes ($21 million) - 0.007 per cent on volume basis and 0.2 per cent on value basis.
Livestock and poultry population[49]
Growth of the poultry sector depends partly on the size of poultry population and partly their productivity. Data on livestock population are available from the Livestock Census, which is conducted once in five years[50]. The total livestock population, which consists of mainly bovines and small ruminants, increased from 292.8 million in 1951 to 470.86 million in 1992 (Table 5). The annual growth rate of livestock population never exceeded 1.75 per cent per annum. On the other hand, poultry population increased from 73.5 million in 1951 to 307.0 million in 1992. The highest increase in poultry population occurred between 1977 and 1987. During this period, poultry population increased from 159.20 million to 275.32 million, implying an annual growth rate of 5.7 per cent per annum. The annual growth rate of poultry population was very low in the 60s at 1.8 per cent per annum, in other decades the growth rate was stable around 4 per cent per annum.
Table 5: Trends in Livestock and Poultry Population since 1951
|
Year |
Bovines |
Small Ruminants |
Total Livestock |
Poultry |
|
Population in Millions |
||||
|
1951 |
198.70 |
86.30 |
292.80 |
73.50 |
|
1956 |
203.60 |
94.70 |
306.60 |
94.80 |
|
1961 |
226.80 |
101.10 |
335.40 |
114.20 |
|
1966 |
229.20 |
106.60 |
344.10 |
115.40 |
|
1972 |
235.70 |
107.50 |
353.40 |
138.50 |
|
1977 |
242.00 |
116.60 |
369.00 |
159.20 |
|
1982 |
262.36 |
144.01 |
419.59 |
207.74 |
|
1987 |
275.82 |
155.91 |
445.28 |
275.32 |
|
1992 |
289.00 |
166.06 |
470.86 |
307.07 |
|
Annual Compound Growth Rates |
||||
|
1951-61 |
1.33 |
1.60 |
1.37 |
4.51 |
|
1961-72 |
0.35 |
0.56 |
0.48 |
1.77 |
|
1972-82 |
1.08 |
2.97 |
1.73 |
4.14 |
|
1982-92 |
0.97 |
1.43 |
1.16 |
3.99 |
Source: Livestock Census, various issues.
Population of hens increased from 108.7 million to 120.3 million between 1987 and 1992, indicating an annual growth rate of 3.1 per cent per annum. On the other hand, production of eggs increased from 17,795 million to 22,929 million during the above period, indicating a growth rate of 5.2 per cent per annum (Table 6). The productivity of eggs per hen increased from 164 to 191 per annum, indicating a growth rate of 3.1 per cent per annum. Thus, 60 per cent of the growth in eggs production can be contributed by productivity increase and 40 per cent are contributed by increase in the number of birds.
Table 6: Growth of Eggs, Hens, and Eggs per Hen
|
Year |
Number of Eggs (Million) |
Number of Hens (Million) |
Eggs Per Hen |
|
1987 |
17795 |
108.674 |
164 |
|
1992 |
22929 |
120.285 |
191 |
|
Annual Growth Rate |
5.20 |
2.10 |
3.10 |
Given the productivity of hens, the level of development of the activity in a state has to be judged on the basis of number of fowls per unit population. The national average of the number of fowls per 100 persons comes to 33.56 (Table 7). The highest density is observed in the northern region at 64.2 followed by the southern region with 55.9 birds per 100 persons. The central region has the lowest density of 10.8 fowls per 100 persons. The annual growth rate of total poultry population during 1987-92 is found to be 2.2 per cent per annum at the national level, which is same as the population growth rate. The eastern region experienced a steep decline of 1.66 per cent per annum.
Table 7: Poultry Population and Growth across States
|
State |
Total Poultry per 100 Persons |
Annual Growth Rate of Total |
|
Southern Region |
55.85 |
3.59 |
|
Western Region |
24.84 |
4.43 |
|
Northern Region |
64.20 |
5.09 |
|
Central Region |
10.75 |
3.86 |
|
Eastern Region |
32.12 |
-1.83 |
|
All India |
33.56 |
2.21 |
Poultry farming involves breeding and raising of chickens for various purposes[51]. Depending on the purpose, we can broadly divide it into breeding farms and commercial farms. Breeding farms produce day-old chicks. The buyers are farmers who are either layer farmers or broiler farmers. There is one more category of poultry farmers who also keep breeding stock along with hatcheries and commercial broiler farms. These entrepreneurs can loosely be called “integrators”.
There are, as per rough estimates, about one-lakh layer farmers and an equal number of broiler farmers[52]. About 70 per cent of these are small (3000-10,000 bird) and medium (10,000-50,000) farmers[53]. Only 10 per cent are large farms with units varying from 50,000 to 4 lakh birds. The remaining are marginal farmers with units up to 3000 birds. The whole organized poultry sectors uses hybrid varieties of poultry and has adopted cages. However, the small and marginal farmers operate on deep litter system.
Large units like Venketeswara Hatcheries (VH) have played a pivotal role in disseminating latest techniques in poultry keeping and animal health care through their large network of poultry services and laboratories under one umbrella. The VH group is the largest in the country where activities such as pure-line breeding, grandparents, parents, feed manufacturing, chicken processing, eggs processing, SPF production, poultry vaccine production, diagnostic services, manpower training, pet foods, etc. are undertaken under one umbrella.
A distinctive feature of Indian poultry is that it is self-sufficient, supported by a very broad and strong genetic base where the productivity levels of broilers and layers are equal to, if not superior, to the productivity levels in developed countries like US and the European Union. India is also one of the few countries of the world, which has put into place and sustained the SPF eggs production project, which can be called the last word in poultry technology.
There are a dozen processing units for broilers and about six units for eggs processing. Some of the eggs processing units like Balaji Foods of Venketeswara Hatcheries, and SKM (of Erode) have put in place the HACCP system in their processing units. Similarly, chicken processing units are following international hygiene standards; and that is why their products are bought by MNCs like Pizza Hut, Dominos, McDonald, and KFC etc.
Recently a new trend in the states of Karnataka, Tamil Nadu, Andhra Pradesh and Maharasthra is emerging which can loosely be given the name of contract farming. It is hoped that this system will evolve in the coming years as a true contract farming system in the poultry sector. This system will in the long run reduce the cost of production and may ensure better margins to the producer and will lead to more of processing in the broiler industry.
Venkey’s India Ltd. is one company, which is vertically integrated having its own breeding farm to processing unit. In the south, another group named Suguna is putting up a breeding farm along with a processing unit and a hatchery. It is hoped that in the future, this group will also be a big vertical integrator. Other groups like Godrej are also trying to show their presence in the broiler meat market.[54]
Regional variations in eggs production are very high (Figure 2). The northern region has recorded the highest per capita production of 72 eggs per annum followed by the southern region with 59 eggs per capita per annum. Both eastern and western regions have recorded low production levels of about 20 eggs per capita per annum. The central region has the recorded lowest production level of only 9 eggs per annum. Even within each region, variations in production are quite high. In the northern region, Himachal Pradesh has recorded the lowest production level of 13 eggs and Punjab has recorded the highest production level of 128 eggs per capita per annum[55]. In the southern region, Andhra Pradesh and Kerala have recorded the highest production level of 77 and 67 eggs per capita per annum. On the other hand, Karnataka has recorded the lowest production of 37 eggs per annum. Among the states in the eastern region, the performance of Bihar is the lowest with a production level of 14 eggs per capita per annum. Among the three western states, Maharashtra attained the highest production level of the 31 eggs, while Gujarat and Rajasthan achieved low production levels of about 10 eggs per annum. The central region is pushed to the lowest position because of Uttar Pradesh, where the per capita production is as low as 5 eggs per annum. Thus, among the major states, Uttar Pradesh, Rajasthan and Gujarat showed very poor performance with a production level of not more than ten eggs per annum. It is significant to note that the four southern states contribute 45 per cent of total eggs produced in India (Figure 3). Eggs production in this region has been growing at 5 per cent per annum. The northern region, which contributes 14 per cent to the nation’s eggs production, attained a growth rate of 5.5 per cent per annum. In the 90s states with low growth are Bihar (0.53 per cent) and Himachal Pradesh (1.1 per cent) as shown in Table 8.
Figure 2: State-Wise Eggs Production of India, 1998-99
Figures in parentheses represent production of Egg.
Figure 3: Region-wise Production of Eggs - A. Year 1992-93
Figure 3: Region-wise Production of Eggs - B. Year 1997-98
Table 8: Eggs Production in Major States during the Nineties
|
State/Region |
1992-93 |
1997-98 |
Annual Growth |
Per
Capita |
|
Jammu & Kashmir |
289 |
412 |
6.70* |
46 |
|
Himachal Pradesh |
70 |
74 |
1.11 |
13 |
|
Punjab |
2165 |
2910 |
5.67* |
128 |
|
Haryana |
517 |
637 |
4.57* |
34 |
|
Northern Region |
3041 |
4033 |
5.50* |
72 |
|
Andhra Pradesh |
3962 |
5751 |
7.71* |
77 |
|
Karnataka |
1359 |
1812 |
5.48* |
37 |
|
Kerala |
1774 |
2138 |
3.57* |
67 |
|
Tamil Nadu |
2845 |
3050 |
1.35** |
51 |
|
Southern Region |
9940 |
12751 |
5.03* |
59 |
|
Assam |
434 |
499 |
2.74* |
19 |
|
West Bengal |
2330 |
2634 |
2.65* |
35 |
|
Bihar |
1380 |
1420 |
0.53* |
14 |
|
Orissa |
527 |
825 |
6.93* |
23 |
|
Eastern Region |
4671 |
5378 |
2.63* |
23 |
|
Maharashtra |
2291 |
2766 |
4.00* |
31 |
|
Gujarat |
473 |
509 |
1.13 |
11 |
|
Rajasthan |
349 |
500 |
6.95* |
10 |
|
Western Region |
3113 |
3775 |
3.94* |
20 |
|
Madhya Pradesh |
1068 |
1348 |
4.50* |
18 |
|
Uttar Pradesh |
566 |
722 |
4.95* |
5 |
|
Central Region |
1634 |
2070 |
4.69* |
9 |
|
All India |
2293 |
28567 |
4.37* |
30 |
Rural-Urban Variation
Most of the poultry farms are located in rural areas or suburban areas of small towns. Their production - eggs and broilers - comes to market yards, which are located in places close to towns such as Delhi, Bombay, Chennai, Hyderabad, etc.
Some of the general trends about the consumption of poultry peculiar to India are described below.
1. The Indian consumers’ mentality is to purchase live broilers or freshly dressed broilers. Demand for processed and deep-frozen chicken produced in hygienic conditions in modern processing plants or slaughterhouses, has not picked up as expected. Out of total production, only 2 to 3 per cent is processed and the rest is sold live. There is further processing of chicken produces like patties, chicken salami, haryali chicken, tandoori tangri, chicken wings, chicken sausages, cutlets, chicken nuggets, kababs, samosas, etc which are sold under brand names. Other companies are also venturing to sell their chicken products under a brand name.
2. Urban centres - cities and towns where 25 per cent of India’s population live - account for 75 per cent of total poultry consumption in the country. For example, per capita eggs consumption in urban areas is reported to be 100, and goes up to 150 to 200 in four major metros namely Bombay, Calcutta, Delhi and Madras. Against this per capita consumption in rural areas is as low as 15 eggs and 0.15 gram of poultry meat per year. The low consumption in rural areas is attributed to non-availability and may be higher price.
3. Although India is the world’s fifth largest eggs producer, its per capita consumption (availability) is poor - 37 eggs per year. The situation is still worse for poultry meat - around 1 kg per year. Poultry consumption in India can increase only through a sustained promotion of eggs and broilers as low cost food items in terms of both their price and high nutritional contents. The National Institute of Nutrition (NIN) recommends a per capita consumption of 180 eggs and 11 kg of poultry meat a year to meet nutritional requirements. These figures speak of the large growth potential of this sector.
4. Eggs consumption is largely of table eggs. However usage in the confectionery sector is only marginal. Manufacturers of eggs powder consume less than 1 per cent of total eggs production in the country.
5. Poultry meat is emerging as a major source of meat of the future. Its share in total meat consumption is 22 per cent,[56] and has emerged as the third largest meat sector after the leading meat sectors - beef and veal and buffalo meat. This is shown in Table 9.
Table 9: Market Shares of Various Meats in Indian Meat Production/Consumption
(Per cent)
|
Year |
Beef & |
Buffalo |
Mutton/ |
Goat |
Pork |
Poultry |
|
1978 |
34 |
34 |
6 |
12 |
10 |
4 |
|
1988 |
33 |
32 |
5 |
13 |
10 |
7 |
|
1998 |
31 |
31 |
4 |
10 |
10 |
13 |
|
2001 |
30 |
30 |
3 |
8 |
7 |
22 |
Source: FAO Yearbook, Production
Household consumption of poultry products[57]
In the following sub-sections we examine the issues relating to household consumption patterns and demand for meat, fish and eggs. More specifically, we examine consumer preferences for poultry products (poultry meat and eggs) vis-à-vis other types of meat and fish, trends in consumption of poultry products and responsiveness of consumption of meat, fish and eggs to price and income changes. In India, data on consumption are available from two sources. The National Accounts Statistics provide estimates of availability of various commodities for private consumption derived by the commodity flow approach. These estimates are available only at the national level. Further, these estimates are not available for different income levels and hence are not suitable for examining the relationship between income and consumption. The National Sample Survey Organization (NSSO) conducts regularly consumer expenditure surveys covering all the states and presents detailed results at state level with break up for rural and urban areas. These data are extensively used in commodity demand studies in India. The present analysis is based on the NSSO data of various rounds from 1970-71 till 1999-2000. Since consumption of poultry products constitutes a small proportion in total consumer expenditure, the survey results of NSS are not available separately for poultry products. Expenditures on all types of ‘meat, fish and eggs’ are aggregated and treated as a single item. However, for two rounds viz., 38th and 50th rounds (1983 and 1993-94 respectively) data on the consumption of meat, fish, and eggs are given separately. In addition, the 50th round provides detailed data on consumption levels of different types of meat also. These data are used to find out the consumption of poultry products, namely poultry meat and eggs in comparison with other meat and fish. In addition to consumption levels in terms of quantity and value, the NSS data also gives the percentage of households reporting consumption for each of the broad groups of items. This information is used to understand the consumer preference patterns and changes in preferences over time.
Consumer preference patterns
A household reveals its preference for a commodity by consuming some quantity determined on the basis of the price of that commodity, prices of other related commodities and income. If a consumer is not at all consuming a commodity, it means that he has no preference for it. With a significant proportion of population being strict vegetarian, there is possibility that consumption of meat or fish or eggs may not be much. Data on the percentage of households reporting consumption of meat or fish or eggs at the national level during three NSS rounds are presented in Table 10. It is found that as many as 42 per cent of the households have not consumed any one of these items in rural as well as urban areas during the year 1999-2000. It is striking that such a large proportion of households does not consume even eggs. The change in the preference pattern over time is also very slow. In urban areas the increase in the proportion of people consuming any one of the three items is only one percentage point between 1987-88 and 1999-20000. Rural areas exhibit a higher shift in preference pattern in favour of this item. The percentage of people consuming meat or fish or eggs increased from 54 per cent in 1987-88 to 58 per cent in 1999-2000. Thus, there is a lot of scope for raising the demand for these items by changing the preference pattern. Further, the gap between rural and urban areas in preference pattern is completely closed. However, the quantities of consumption per capita may differ between rural and urban areas owing to price and income differences.
Table 10: Households Consuming Meat, Fish and Egg
(Per cent)
|
Year |
Rural |
Urban |
|
1987-88 |
54.1 |
56.8 |
|
1993-94 |
56.4 |
57.0 |
|
1999-00 |
57.9 |
58.0 |
As eggs are not treated as non-vegetarian food, we expect higher preference for eggs than for chicken or fish or mutton. Data on the households reporting consumption of eggs, meat and fish during the year 1993-94 indicate that preference for eggs is lower than preference for fish and almost same as preference for goat meat in rural areas (Table 11). While 31 per cent of households consumed fish, only 22 per cent of rural households consumed eggs. Goat meat, which is more expensive than chicken, is consumed by 20 per cent of households. The results indicate that eggs have not entered the vegetarian consumption basket and are not a preferred item in the non-vegetarian consumption basket in rural areas. In urban areas, eggs have significantly higher preference as compared to meat or fish. While about 28 per cent of the urban people consume meat as well as fish, 33 per cent consume eggs. This clearly shows that eggs have entered vegetarian diet in urban areas, but not in rural areas. Though rural people exhibit lower preference for eggs as compared to urban people, the change in the preference pattern in favour of eggs is higher in rural areas. The percentage of eggs consuming households increased from 17 per cent in 1987-88 to 22 per cent in 1993-94 in rural India while the corresponding increase in urban India is only from 33 per cent to 35 per cent. The preference for other poultry products (poultry meat) is lower than for eggs as well as for other meats. The lower preference for poultry meat than for eggs is understandable because of the latter in the vegetarian diet. But the lower preference for poultry meat indicates that people have stronger preference for goat meat or fish. The price of goat meat is much higher than that of poultry meat and the price increase is also steep for goat meat. But still the proportion of population consuming sheep or goat meat is higher than that of poultry meat. In rural areas, 31 per cent of households consume fish and 20 per cent of households consume goat meat, but only 7.5 per cent of households consume poultry meat. Similarly, in urban areas, about 28 per cent of the households consume goat meat as well as fish, but only 9 per cent of households consume poultry meat.
Table 11: Percentage of Households Consuming Poultry Products and Other Meat
|
Item |
Rural |
Urban |
||
|
1987-88 |
1993-94 |
1987-88 |
1993-94 |
|
|
Egg |
17.1 |
22.0 |
32.7 |
34.9 |
|
Poultry Meat |
- |
7.5 |
- |
9.0 |
|
Goat Meat |
- |
20.3 |
- |
28.0 |
|
Fish |
- |
30.7 |
- |
27.1 |
Regional variations in preference patterns are not only strong, but are also inconsistent with production levels. However, the inconsistency can be explained in terms of demand generated in neighboring states. The northern region with the highest per capita production of poultry products exhibits very low preference for poultry products. The percentage of households consuming eggs is as low as 11 in rural Punjab as compared to the national average of 22 per cent (Table 12). In the case of poultry meat, the percentage of consuming households is as low as 2.5 as compared 7.5 per cent at the national level. This low preference for poultry products is not due to high vegetarianism in the state as revealed by the fact that the percentage of households consuming goat meat is 16 per cent. The high production of poultry products in Punjab is not for local consumption, but probably for meeting the demand in Delhi. Only the four states in the southern region exhibit high preference for eggs and poultry meat. The percentage of households consuming eggs ranges between 25 per cent in Karnataka and 52 per cent in Andhra Pradesh. Andhra Pradesh leads in consumer preference for eggs as well as poultry meat. Andhra Pradesh, Assam, and West Bengal occupy top position in high preference for poultry products. Another four states viz., Kerala, Tamil Nadu, Karnataka and Maharastra are also important in generating demand for poultry products.
Table 12: Percentage of Households Consuming Meat, Fish and Egg: 1993-94
|
State |
Rural |
Urban |
||||||
|
Goat Meat |
Poultry Meat |
Fish |
Egg |
Goat Meat |
Poultry Meat |
Fish |
Egg |
|
|
Northern |
||||||||
|
Punjab |
15.6 |
2.1 |
0.4 |
11.2 |
20.7 |
2.3 |
0.5 |
15.5 |
|
Haryana |
7.9 |
0.3 |
0.1 |
3.3 |
13.9 |
1.7 |
1.6 |
7.7 |
|
Southern |
||||||||
|
Andhra Pradesh |
22.4 |
18.4 |
25.9 |
52.3 |
20.3 |
19.4 |
20.6 |
57.2 |
|
Kerala |
2.6 |
7.1 |
85.7 |
43.1 |
4.3 |
11.5 |
82.8 |
45.2 |
|
Tamil Nadu |
37.2 |
7.2 |
27.2 |
33.4 |
36.2 |
11.2 |
33.9 |
52.9 |
|
Karnataka |
11.5 |
9.2 |
13.5 |
24.9 |
13.7 |
11.3 |
11.7 |
36.0 |
|
Eastern |
||||||||
|
Assam |
18.8 |
29.8 |
94.2 |
51.1 |
46.1 |
34.6 |
85.9 |
66.1 |
|
West Bengal |
18.8 |
13.1 |
90.7 |
56.7 |
30.1 |
18.1 |
80.4 |
62.6 |
|
Orissa |
14.2 |
9.1 |
58.6 |
12.2 |
41.3 |
6.2 |
63.7 |
34.2 |
|
Bihar |
20.3 |
2.9 |
34.9 |
4.8 |
37.4 |
6.4 |
35.8 |
22.0 |
|
Western |
||||||||
|
Maharashtra |
37.0 |
0.2 |
16.7 |
21.2 |
40.5 |
8.4 |
26.9 |
37.7 |
|
Gujarat |
14.1 |
4.7 |
7.9 |
7.8 |
16.6 |
2.6 |
9.8 |
13.0 |
|
Rajasthan |
13.5 |
0.7 |
0.7 |
2.1 |
25.1 |
0.2 |
1.2 |
8.8 |
|
Central |
||||||||
|
Madhya Pradesh |
14.0 |
0.2 |
20.0 |
5.3 |
28.7 |
5.89 |
14.9 |
19.1 |
|
Uttar Pradesh |
21.4 |
0.9 |
9.9 |
7.1 |
22.6 |
0.8 |
5.5 |
16.9 |
|
All India |
20.3 |
7.5 |
30.7 |
22.0 |
28.0 |
9.0 |
27.1 |
34.9 |
Diversification of consumption basket
Changes in socio-economic and technological factors result in changes of consumption patterns and diversification of the consumption basket. Significant changes in consumption pattern have been recorded in recent times. There has been a continuous decline in per capita consumption of cereals since the beginning of the 70s. Various factors have been identified for this decline. Mechanization of agriculture, improvement in rural transport facilities, and easy accessibility of urban goods in rural areas are found to be important factors for decline in per capita consumption of cereals in rural areas (Rao, 2001). This decline in cereal consumption is an indication of diversification of the consumption basket that takes place in two ways. As income increases, the proportion of income spent on food declines and the proportion spent on non-food items increases. This is the universally accepted Engel’s law of demand. The application of this law results in diversification of expenditure from food to non-food items. Secondly, the food basket may also be diversified with a shift from cereals to non-cereal food. The welfare implications differ for each of these diversifications.
To understand whether the diversification of food basket is in favour of ‘meat, fish and eggs’, we have classified food into three broad groups, viz. cereals; meat, fish and eggs; and other food. The shares of these three items in total food expenditure are computed for all the years from 1970-71 to 1999-2000. To see whether the pattern of diversification varies across expenditure groups, the shares are computed separately for the bottom 30 per cent, middle 40 per cent, and top 30 per cent of the population. The results are shown in Figure 4. The results clearly indicate that non-food expenditure has been growing at a faster rate than food expenditure, leading to steep decline in the share of food expenditure (Table 13).
Figure 4: A. Trends in Budget Shares of Meat, Fish and Eggs in Rural India
Figure 4: B. Trends in Budget Shares of Meat, Fish and Eggs in Rural India
Table 13: Trends in Shares of Broad Commodity Items in Total Expenditure: Rural
|
Year |
Share in Total Consumer Expenditure (%) |
Share in Food Expenditure (%) |
|||||||
|
Cereals |
Meat, Fish & Egg |
Other Food |
Total Food |
Non-Food |
Cereals |
Meat, Fish & Egg |
Other Food |
||
|
Rural |
|||||||||
|
1970-71 |
40.7 |
2.9 |
30.0 |
73.6 |
26.4 |
55.3 |
3.9 |
40.8 |
|
|
1972-73 |
41.9 |
2.5 |
28.3 |
72.7 |
27.3 |
57.6 |
3.4 |
39.0 |
|
|
1973-74 |
44.6 |
2.6 |
27.8 |
75.0 |
25.0 |
59.5 |
3.4 |
37.0 |
|
|
1977-78 |
33.5 |
2.7 |
28.1 |
64.3 |
35.7 |
52.1 |
4.1 |
43.7 |
|
|
1983 |
32.8 |
3.0 |
29.8 |
65.6 |
34.4 |
50.0 |
4.6 |
45.4 |
|
|
1986-87 |
27.3 |
3.7 |
34.5 |
65.6 |
34.4 |
41.7 |
5.7 |
52.7 |
|
|
1987-88 |
26.5 |
3.2 |
34.0 |
63.7 |
36.3 |
41.6 |
5.1 |
53.4 |
|
|
1988-89 |
26.4 |
3.5 |
33.9 |
63.8 |
36.2 |
41.4 |
5.5 |
53.1 |
|
|
1989-90 |
24.3 |
3.6 |
36.4 |
64.3 |
35.7 |
37.8 |
5.6 |
56.6 |
|
|
1990-91 |
24.9 |
3.5 |
37.6 |
66.0 |
34.0 |
37.7 |
5.3 |
57.0 |
|
|
1991 |
24.2 |
3.4 |
35.5 |
63.1 |
36.9 |
38.4 |
5.3 |
56.2 |
|
|
1992 |
26.6 |
3.4 |
34.9 |
65.0 |
35.0 |
41.0 |
5.3 |
53.7 |
|
|
1993 |
26.1 |
3.6 |
35.5 |
65.2 |
34.8 |
40.0 |
5.5 |
54.5 |
|
|
1993-94 |
24.5 |
3.3 |
35.3 |
63.2 |
36.8 |
38.8 |
5.3 |
55.9 |
|
|
1994-95 |
24.6 |
3.2 |
33.3 |
61.1 |
38.9 |
40.3 |
5.2 |
54.5 |
|
|
1995-96 |
23.5 |
3.2 |
33.6 |
60.4 |
39.6 |
39.0 |
5.3 |
55.7 |
|
|
1997 |
22.2 |
3.0 |
33.6 |
58.7 |
41.3 |
37.8 |
5.1 |
57.2 |
|
|
1998 |
23.1 |
3.3 |
34.4 |
60.8 |
39.2 |
38.0 |
5.4 |
56.6 |
|
|
1999-00 |
22.4 |
3.3 |
33.7 |
59.4 |
40.6 |
37.6 |
5.6 |
56.8 |
|
|
Urban |
|||||||||
|
1970-71 |
23.2 |
3.6 |
37.7 |
60.8 |
35.6 |
38.1 |
5.9 |
61.9 |
|
|
1972-73 |
23.7 |
3.3 |
37.4 |
61.1 |
35.6 |
38.8 |
5.3 |
61.2 |
|
|
1973-74 |
27.2 |
3.4 |
37.1 |
64.3 |
32.3 |
42.3 |
5.3 |
57.7 |
|
|
1977-78 |
20.8 |
3.5 |
35.7 |
56.5 |
40.0 |
36.8 |
6.1 |
63.2 |
|
|
1983 |
19.6 |
3.6 |
35.8 |
55.5 |
40.9 |
35.4 |
6.5 |
64.6 |
|
|
1986-87 |
14.7 |
4.0 |
36.7 |
51.4 |
44.6 |
28.6 |
7.7 |
71.4 |
|
|
1987-88 |
15.0 |
3.5 |
37.3 |
52.4 |
44.1 |
28.7 |
6.8 |
71.3 |
|
|
1988-89 |
15.7 |
4.0 |
37.2 |
52.9 |
43.1 |
29.7 |
7.5 |
70.3 |
|
|
1989-90 |
14.3 |
3.8 |
37.2 |
51.5 |
44.7 |
27.8 |
7.5 |
72.2 |
|
|
1990-91 |
14.3 |
3.8 |
38.9 |
53.2 |
43.0 |
26.8 |
7.1 |
73.2 |
|
|
1991 |
14.2 |
3.6 |
38.3 |
52.5 |
43.9 |
27.0 |
6.9 |
73.0 |
|
|
1992 |
15.1 |
3.6 |
37.3 |
52.4 |
43.9 |
28.8 |
6.9 |
71.2 |
|
|
1993 |
15.4 |
3.7 |
38.5 |
53.9 |
42.3 |
28.6 |
6.9 |
71.4 |
|
|
1993-94 |
14.3 |
3.4 |
37.0 |
51.2 |
45.4 |
27.9 |
6.6 |
72.1 |
|
|
1994-95 |
14.6 |
3.4 |
35.4 |
50.0 |
46.6 |
29.3 |
6.8 |
70.7 |
|
|
1995-96 |
13.3 |
3.2 |
33.6 |
46.9 |
49.9 |
28.3 |
6.8 |
71.7 |
|
|
1997 |
13.5 |
3.0 |
33.1 |
46.6 |
50.4 |
29.0 |
6.5 |
71.0 |
|
|
1998 |
13.3 |
3.2 |
33.2 |
46.4 |
50.3 |
28.6 |
6.9 |
71.4 |
|
|
1999-00 |
12.5 |
3.1 |
32.4 |
44.9 |
51.9 |
27.8 |
7.0 |
72.2 |
|
Between 1970-71 and 1999-00 the share of food items in total expenditure declined from 73.6 to 59.4 per cent in rural areas and 60.8 to 44.9 per cent in urban areas. This diversification from food to non-food is only due to decline in the share of cereals in total expenditure. The share of meat, fish and eggs and that of other food have, in fact, increased during the period. Thus, non-cereal food expenditure is increasing at a higher rate. Within food expenditure, diversification is taking place from cereal to non- cereal food. The share of cereals in food expenditure declined from 55 per cent to 38 per cent in rural areas and 38 per cent to 28 per cent in urban areas between 1970-71 and 1999-00. On the other hand, the share meat, fish and eggs increased from 3.4 to 5.6 per cent in rural areas and 5.3 to 6.8 per cent in urban areas, and the share of other food increased from 40.8 to 56.8 per cent in rural areas and 61.9 to 72.2 in urban areas. However, the share of meat, fish, and eggs in total expenditure increased till the early 90s and then started declining. This pattern is observed for all the three expenditure groups in rural as well as urban areas. In other words, though the consumption basket is getting diversified, the expansion of expenditure on meat, fish and eggs is not sustained in recent years.
Levels of consumption of poultry products
While the percentage of households reporting consumption of a commodity reveals the preference pattern, the demand for the commodity is reflected in the level of consumption of the commodity. While the first stage in the expansion of demand for a commodity is broad coverage in consumption, consumption of recommended quantities is the second stage in the expansion of demand. In the case of poultry products, even the first stage of demand generation has not gone far ahead as indicated by the low proportion of households reporting consumption. However, it is essential to look at the data on consumption in terms of quantities. Table 14 provides estimates of per capita consumption[58] of poultry products, other meat, and fish for the year 1993-94, the latest year for which official statistics are available. The levels of consumption have to be compared with the recommended levels of consumption. The recommended levels are 180 eggs and 11 kg. meat per capita per annum. Per capita consumption of eggs is only 7.7 per annum in rural areas and 17.8 per annum in urban areas. Very low level of consumption is found in seven states with less than 3.5 eggs per capita per annum. These states are spread in all the regions except the southern region. Haryana and Rajasthan have a very poor record in eggs consumption with per capita annual consumption in rural areas being less than one egg. Urban consumption in these states is less than six eggs per annum as against the average consumption of 17.8 eggs per annum. In addition to these states, Punjab, Uttar Pradesh, Madhya Pradesh, and Gujarat also have a low level of less than 10 eggs per annum.
The level of consumption of total meat including fish is 3.6 kg. per capita per annum in rural areas and 4.8 kg per capita per annum in urban areas. But the consumption of poultry meat is only 0.24 kg in rural and 1.08 kg in urban areas. These results indicate that meat consumption levels are far below the recommended level and poultry meat has least priority. The states with negligible demand for poultry meat in rural areas are Haryana, Rajasthan, Madhya Pradesh, and Uttar Pradesh. The level of per capita consumption in these states is even less than 20 gm. per annum. The variation in urban areas is not so glaring as in rural areas.
Table 14: Annual Per Capita Consumption of Meat, Fish and Eggs: 1993-94
|
States |
Rural |
Urban |
||||||||
|
Poultry Meat |
Other Meat |
Total Meat |
Egg |
Fish |
Poultry Meat |
Other Meat |
Total Meat |
Egg |
Fish |
|
|
Northern |
||||||||||
|
Punjab |
0.12 |
0.60 |
0.72 |
5.64 |
0.02 |
0.72 |
0.73 |
0.12 |
8.76 |
0.00 |
|
Haryana |
0.02 |
0.72 |
0.74 |
0.96 |
0.0 |
0.60 |
0.61 |
0.6 |
5.88 |
0.06 |
|
Southern |
||||||||||
|
Andhra Pradesh |
0.60 |
2.04 |
2.64 |
17.28 |
1.32 |
0.60 |
2.19 |
2.76 |
25.56 |
0.96 |
|
Kerala |
0.36 |
2.52 |
2.88 |
24.00 |
16.20 |
0.12 |
2.28 |
2.88 |
29.88 |
19.44 |
|
Tamil Nadu |
0.24 |
1.80 |
2.04 |
12.72 |
2.04 |
1.20 |
2.05 |
2.40 |
30.48 |
2.04 |
|
Karnataka |
0.24 |
1.37 |
1.61 |
10.68 |
1.68 |
0.72 |
2.44 |
2.76 |
19.08 |
1.68 |
|
Eastern |
||||||||||
|
Assam |
0.96 |
0.85 |
1.81 |
13.44 |
5.16 |
1.32 |
1.56 |
2.88 |
29.88 |
6.48 |
|
West Bengal |
0.36 |
1.22 |
1.58 |
20.28 |
6.48 |
0.96 |
1.80 |
2.52 |
34.92 |
8.64 |
|
Orissa |
0.24 |
0.50 |
0.74 |
3.48 |
3.48 |
1.56 |
2.04 |
2.28 |
15.84 |
3.60 |
|
Bihar |
0.09 |
0.73 |
0.82 |
1.68 |
1.44 |
1.32 |
1.69 |
1.92 |
10.80 |
1.56 |
|
Western |
||||||||||
|
Maharashtra |
0.01 |
1.44 |
1.45 |
7.32 |
1.32 |
1.44 |
2.52 |
2.88 |
18.00 |
1.92 |
|
Gujarat |
0.12 |
0.50 |
0.62 |
2.04 |
0.24 |
0.72 |
0.96 |
1.08 |
5.16 |
0.48 |
|
Rajasthan |
0.03 |
0.65 |
0.68 |
0.84 |
0.05 |
1.20 |
1.25 |
1.20 |
4.44 |
0.12 |
|
Central |
||||||||||
|
Madhya Pradesh |
0.01 |
0.72 |
0.73 |
1.80 |
0.72 |
1.08 |
1.32 |
1.56 |
9.72 |
0.48 |
|
Uttar Pradesh |
0.04 |
1.33 |
1.37 |
2.52 |
0.48 |
0.84 |
3.12 |
3.12 |
7.68 |
0.24 |
|
All India |
0.24 |
1.20 |
1.44 |
7.68 |
2.16 |
1.08 |
2.04 |
2.40 |
17.76 |
2.40 |
Note: Meat and fish in kgs and eggs in number
Poultry meat and eggs have to compete with fish and other meats like goat meat, mutton, beef, etc. In order to understand the nature of competition between these products, correlation coefficients have been worked out using the cross-section data of different states for 1993-94 (Table 15). The results indicate that fish, eggs, and poultry meat have to compete with goat meat. When the preference for goat meat is very strong, there will be low consumption of both eggs and poultry.
Table 15: Coefficients of Correlation: Poultry and Other Meat Consumption
|
Item |
Poultry Meat |
Egg |
Fish |
Goat Meat |
|
Rural |
||||
|
Poultry Meat |
1.000 |
|
|
|
|
Egg |
0.583 |
1.000 |
|
|
|
Fish |
0.216 |
0.432 |
1.000 |
|
|
Goat Meat |
-0.412 |
-0.203 |
-0.627 |
1.000 |
|
Urban |
||||
|
Poultry Meat |
1.000 |
|
|
|
|
Egg |
0.582 |
1.000 |
|
|
|
Fish |
0.433 |
0.381 |
1.000 |
|
|
Goat Meat |
-0.497 |
-0.616 |
-0.494 |
1.000 |
Income and price elasticity
Estimates of income and price elasticity are needed to understand the how the effect of price and income changes on demand. Since no reliable estimates are available, a rough attempt has been made to estimate these elasticities. The details are given in Annexure I.
Expenditure and own-price elasticities for nine commodity groups are presented in Table 16. Since expenditure is a proxy for income, we use the term income elasticity for making it clearer. The complete set of elasticities is given in Annexure 1. Let us examine the pattern of income elasticities. Firstly, income elasticities are higher for rural consumers than for urban consumers for all the nine commodities. Secondly, income elasticities for food items are lower than for non-food items except fuel and light, which naturally goes with food items. Thirdly, in rural areas, ‘meat, fish, and eggs’ occupy the second position in elasticity with milk and milk products occupying the first position. In urban areas, this commodity group occupies the third position as the other food group also has higher elasticity than the meat, fish and eggs group. The income elasticity is 1.01 in rural areas and 0.66 in urban areas. These elasticity indicate that a given growth rate of income in rural and urban areas generates higher per capita demand in rural areas than in urban areas. Fourthly, price elasticity of demand also follows the same order of commodities as income elasticity. Meat, fish and eggs have high price elasticity at 0.75 in rural areas and 0.68 in urban areas. Thus, the difference between rural and urban areas in price elasticity is not so high as in the case of income elasticity. Increase in rural incomes and reduction prices result in high increase in demand for meat, fish and eggs.
Table 16: Income and Own Price Elasticity’s for Broad Commodity Groups
|
Commodity Group |
Expenditure Elasticity |
Price Elasticity* |
||
|
Rural |
Urban |
Rural |
Urban |
|
|
Cereal |
0.29 |
0.18 |
0.28 |
0.20 |
|
Milk& Products |
1.41 |
0.85 |
1.01 |
0.87 |
|
Edible Oils |
0.84 |
0.47 |
0.64 |
0.49 |
|
Meat, Fish&Egg |
1.01 |
0.66 |
0.75 |
0.68 |
|
Sugar and Gur |
0.98 |
0.37 |
0.73 |
0.38 |
|
Other Food |
0.80 |
0.76 |
0.65 |
0.81 |
|
Fuel& Light |
0.87 |
0.76 |
0.67 |
0.78 |
|
Clothing |
1.75 |
1.43 |
1.24 |
1.43 |
|
Other Non-food |
1.63 |
1.57 |
1.10 |
1.26 |
* Negative sign is omitted
Since the model is estimated for four expenditure groups, price and income elasticities are available for each of these groups (Table 17). In both rural and urban areas, income and price elasticities decline as we move from poor to non-poor and rich. The income as well as expenditure elasticities are low for the rich (0.5 in rural and 0.6 in urban areas). The other three income groups in rural areas have high-income elasticities ranging between 1.3 and 1.7. In the urban areas only very poor have income elasticity greater than unity. Price elasticities are greater than unity for very poor as well as poor in rural areas and very poor in urban areas. Thus, increase in the price of meat; fish and eggs lead to high decline in the consumption of the poor. One significant policy implication of the results is that any decline in the price of meat, fish and eggs in rural areas will increase the demand through expansion in the consumption of the poor. Similarly, improvement in the incomes of the poor also has significant impact on their consumption levels of meat, fish, and eggs.
Table 17: Expenditure and Price Elasticities for Meat, Fish and Eggs Group Across Income Levels
|
Income Group |
Expenditure Elasticity |
Price Elasticity* |
||
|
Rural |
Urban |
Rural |
Urban |
|
|
Very Poor |
1.42 |
1.41 |
1.38 |
1.30 |
|
Moderately Poor |
1.68 |
0.90 |
1.37 |
0.93 |
|
Non-poor |
1.27 |
0.78 |
0.84 |
0.77 |
|
Rich |
0.63 |
0.53 |
0.48 |
0.56 |
|
All Groups |
1.01 |
0.66 |
0.75 |
0.68 |
* Negative sign is omitted
Marketing of eggs is better organized than that of broilers. The National Eggs Coordination Committee (NECC), an all India association, representing layer farmers, traders, and other stakeholders, plays an important role. It also declares the farm gate price of table eggs. NECC has sought to eliminate middlemen and ensure remunerative price to the farmer. Prior to the establishment of NECC, middlemen controlled the trade and sucked away most of the margin in the business.
However, for broiler marketing, there is no similar national organization that looks after the producers’ interest. Some regional organizations (for example Broiler Growers’ Association) have come up, which are trying to organize farmers.[59] The broiler marketing is largely in the hands of big traders and commission agents in mandis (i.e. wholesale markets) like Ghazipur in Delhi and Crawford Market in Mumbai. In general, middlemen are vital links between producers and consumers.[60] The margin between the farm gate price of the broiler and the price paid by the consumer is about 20 to 25 per cent.
Wholesalers/distributors sell live birds to retailers; and retailers sell dressed birds to institutional customers/consumers. The pattern of selling of live birds varies from region to region. In the metros like Delhi and Bombay there are wholesale markets where prices are based on daily auctions.[61] Delhi’s Ghazipur mandi is the only market where live birds are sold by score.[62]
Chart 1: Marketing Channel for
Broiler from Hatchery to Consumer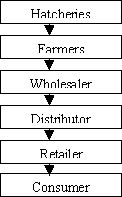
The following points regarding the current marketing system need to be noted:
Eggs are transported to long distances in pulp trays known as eggs trays by different modes of transport ranging from bicycles to trucks. As a result, the breakage and spoilage is about 2 to 4 per cent.[63]
Farmers transport live birds over long distances to trading centres or mandis. The birds undergo stress during transport that can result in loss of weight. Poor road infrastructure increases transportation time. If vehicles are not equipped for safe transportation of live birds, there are chances of 5 to 10 per cent mortality.
The Indian poultry sector has gone a sea change in terms of productivity with the introduction of hybrids produced through pure lines. Earlier, this country did not have a genetic pool and was completely dependent on imports of breeding stocks that did not perform in the hostile climatic conditions of India as compared to US and other western countries from where these breeds were imported. In the early 80s, companies like Venkateswara Research and Breeding Farm and Venco Research and Breeding Farm established their pure lines operations and with their genetic pool, hybrids acclimatized to Indian conditions were introduced in the country. Through continuous research and development, these breeds, which used to give 250 henhouse productions in the early 70s, now give a henhouse production of 315+ eggs per bird. This has immensely helped local farmers in terms of their profitability while feed prices have been increasing continuously.
Similarly in broilers, the Feed Conversion Ratio (FCR) has gone from 3 kg. of feed to 1 kg. of chicken meat, to 2.2 kg. to 1 kg. of chicken meat. This is comparable to the western countries despite the fact that in India we do not add tallow or other growth promoters including hormones for fattening the broilers.
The Indian poultry industry does not get direct or indirect subsidies/incentives. However some centre and state government schemes relating to rural development and poverty alleviation provide some incentives to marginal farmers involved in poultry production. Annexure II gives the details about financial assistance provided by the government of Goa, to marginal farmers for setting-up poultry farms and purchase of poultry farm equipment. However, the share of all these incentives is very small in total investment, and is declining over time.
The Indian agriculture sector gets direct/indirect subsidies in the form of fertilizer, pesticides, electricity, etc. Though the poultry industry is an integral part of agriculture and treated on par with the livestock sector in India, it faces restrictions on use of agriculture land, attracts higher electricity tariffs and sale tax than agriculture, pays tax on income earned from poultry farms, and is subject to different land/labour law. It is also not getting benefits like tax holidays as obtained by a number of Indian industries.
In this context, it is worth mentioning that a large number of products are reserved for exclusive manufacture in the small-scale sector. Till few years ago, the poultry feed sector was in the list of small-scale industry. In other words, the sector was not subject to higher investment and had to operate in the small-scale sector. The industry could not enjoy even the benefits of operating on large scale.
Although extensive literature exists on estimation of Effective Rate Of Protection (ERP), Domestic Resource Cost (DRC), etc. using alternate methods, no estimates are available for the poultry sector. We could not estimate these parameters owing to non-availability of comparable statistics on domestic and international prices of output and inputs.
Since the 80s, there has been a great change in both structure and size of the farm in layers and broilers. Particularly, broiler farms have grown rapidly both in terms of number and size. Earlier, broiler farms would mean a few hundred birds per cycle, whereas today over a period of time in these last two decades we can see farms with 10 to 15 thousand birds per week cycle; and the size of the farm, in terms of total capacity, has increased manifold. In terms of technology absorption, farmers have adopted newer technologies of feeding and watering systems including management, health and hygiene.
The poultry processing industry is growing at a very slow pace. In developed countries, almost 100 per cent of broilers produced are processed and sold as value added products in the form of portions, boneless, and further processed products. Even in countries like Thailand, Indonesia, Malaysia, etc. most chicken sold is processed and branded. In India, however, only around 2-3 per cent of the total poultry meat produced is sold in a processed form. The main hurdles for the growth of processing industries are:
The consumers’ preference for live and fresh chicken. For the consumer in India, chicken is fresh only if it is cut before his eyes. As a result, retailers of live birds at their shops slaughter 97-98 per cent of the chicken in a very unhygienic manner. India is predominantly a market for live birds. This is a question of mindset that will take time to change.
Inadequate infrastructure like lack of cold chain. In the absence of cold chain from processor to retailer it is extremely difficult to make the frozen, freshly chilled chicken available to consumer. Additionally, power shortage in the country makes it impossible and cost prohibitive to operate a cold chain at -20 degree centigrade at which chicken products are to be kept.
There has been a lack of promotional campaign for chicken products since some sections of the society are opposed to promotion of non-vegetarian foods. Recently the government has come with a notification where non-vegetarian foods have to be labelled prominently which creates a negative mindset in the society.
However, a pioneering effort to sell processed products on all India level from 1986 was made by Venkteshwara Hatcheries (VH) under the brand name of Venky’s. Now other companies have started efforts on a smaller scale in different regions. The names of some of these are
|
Riverdale |
Pune, Maharashtra |
|
Arambagh |
Calcutta, West Bengal |
|
Starchick |
Hyderabad, Andhra Pradesh |
|
Gold chick |
Hyderabad, Andhra Pradesh |
|
Godrej Realgold |
Bangalore, Karnataka |
|
Godrej Agrovet |
Bombay, Maharashtra |
|
Peninsula |
Bangalore, Karnataka |
|
Komarla Group |
Bangalore, Karnataka |
|
Suguna |
Coimbatore, Kerala |
In 1980, when eggs and boiler production was 10 thousand million and 30 million respectively, total employment was not so encouraging. As the income and employment in the crop sector started diminishing, the non-crop sector saw a big shift, which includes poultry and dairy. With the demand increasing now and the production level reaching 37 billion eggs and 1 billion broilers this sector employs around 1.6 million people. Whereas 80 per cent of the employment is generated directly by these farms, 20 per cent are engaged in feed, pharmaceuticals, equipment, and other services required by the poultry sector.[64] Additionally, there may be a similar number of people who are engaged in marketing and other channels of servicing the poultry sector.
The trends in India’s poultry exports/imports for the period 1985 to 1998 are shown in Table 18. It can be seen that eggs and eggs-based products account for most of India’s poultry exports. Exports of hatching and table eggs have increased dramatically due to higher demand from the Middle East and Southeastern countries - from 500 metric tons (Rs. 6.11 million) in 1985 to more than 65000 metric tons in 1998 (Rs. 608 million). Similarly exports of eggs powder increased from a meager Rs. 0.4 million in 1990 to more than Rs.500 million in 1996. After 1996, however, exports of eggs powder have tended to fall by 16 per cent in 1997 and 20 per cent in 1998. The factors affecting its exports are reported to be the subsidies granted by the European Union and US. India also supplies specific pathogen eggs to the European Union for pharmaceutical purposes (Table 19).
At the same time imports of poultry products have been negligible. One can attribute this to several reasons. First, India’s import policy has effectively banned or restricted imports of poultry products through its so-called negative list.[65] Though India has lifted or partially lifted import restrictions beginning from the early 90s, trade liberalization has bypassed the livestock sector so far. With some exceptions - imports for hotels and tourism industry, ‘imports used as inputs for exports’ and imports of inputs such as breeding stock, equipment, and machinery - imports were not generally permitted.[66] Second, imported poultry meat which will necessarily be frozen is not popular in India. Third, the high cost of refrigerated transportation makes imported poultry meat relatively more expensive than domestic meat.
Table 18: India’s Exports/Imports of Poultry
|
Exports (Quantity in metric tons, value in Rs. Million) |
|||||||
|
Year |
Meat Poultry Fresh |
Eggs for shell |
Eggs liquid, dried |
Poultry |
|||
|
Q |
V |
Q |
V |
Q |
V |
V |
|
|
1985 |
- |
- |
500 |
6.11 |
- |
- |
6.11 |
|
1990 |
- |
- |
1524 |
20.71 |
- |
0.38 |
21.09 |
|
1995 |
84 |
2.52 |
2635 |
138.67 |
- |
44.04 |
185.23 |
|
1996 |
2 |
010 |
65318 |
465.52 |
- |
554.96 |
1020.58 |
|
1998 |
50 |
1.49 |
65318 |
608.26 |
- |
377.86 |
987.61 |
|
B. Imports (Quantities in metric tons, value in Rs. Million) |
|||||||
|
1985-95 |
- |
- |
- |
- |
- |
- |
- |
|
1996 |
1 |
0.14 |
68 |
13.67 |
- |
- |
13.81 |
|
1997 |
1 |
0.14 |
140 |
9.78 |
- |
- |
9.92 |
|
1998 |
1 |
0.18 |
160 |
2.24 |
- |
- |
2.42 |
Source: FAO, Trade Year Book
Table 19: Export and Import of DOCs, Hen Eggs, SPF Eggs, Vaccines, etc.
|
Poultry Products |
Exports |
Imports |
|||||||
|
1991-92 |
1995-96 |
1997-98 |
1998-99 |
1991-92 |
1995-96 |
1997-98 |
1998-99 |
||
|
DOCs |
No |
109649 |
6841000 |
627000 |
214000 |
270308 |
119000 |
215500 |
122700 |
|
Hen eggs |
No |
4776720 |
8910000 |
14252000 |
9660000 |
18500 |
15000 |
1215000 |
35000 |
|
SPF Eggs |
No |
- |
109000 |
- |
- |
20280 |
82000 |
160000 |
280000 |
|
Vaccine |
Doses |
1838200 |
- |
- |
- |
180000 |
24000 |
39922 |
20015 |
|
Feather |
Kg |
2173 |
714 |
6988000 |
539000 |
- |
90 |
- |
- |
Source: Animal Quarantine and Certification Service Stations, Department of Animal Husbandry and Dairying, Government of India
Main export markets
Kuwait, Oman, Saudi Arabia, UAE, and Yemen have been major importers of India’s table and hatching eggs (Annexure III). Similarly, Germany, Austria, Japan, Netherlands, and Republic of Korea have been the most important markets for India’s eggs powder (Annexure III). Due to a downturn in sales to the EU and a decline in demand in Japan, eggs powder exports declined sharply in 1998. Exports of eggs power from India are reported to have slid down further in 1999 and 2000. At present, only three out of six plants are operating and exporting.
India also exports live poultry in the form of chicks below 185-gram weight (mostly DOCs). Details pertaining to these exports are reported in Table 20. The main overseas export markets for India’s live poultry are countries of the SAARC region.
Table 20: India’s Country-wise Exports of Live Poultry
Q = Numbers in Lakh, V = Rs. Lakh.
|
Country |
1994-95 |
1995-96 |
1996-97 |
1997-98 |
||||
|
FGDD (W£185G) |
Q |
V |
Q |
V |
Q |
V |
Q |
V |
|
Bangladesh |
4.22 |
29.79 |
14.52 |
112.2 |
16.23 |
100.78 |
1.50 |
11.97 |
|
Nepal |
1.00 |
4.44 |
0.2 |
3.74 |
0.67 |
5.58 |
0.66 |
2.49 |
|
S. Africa |
- |
- |
- |
- |
0.20 |
1.02 |
1.18 |
12.25 |
|
Sri Lanka |
0.40 |
2.16 |
- |
- |
- |
- |
2.14 |
16.32 |
|
UAE |
- |
- |
2.48 |
28.87 |
0.40 |
3.08 |
0.09 |
0.52 |
|
USA |
- |
- |
- |
- |
0.19 |
2.13 |
0.35 |
4.01 |
|
Subtotal |
5.62 |
36.83 |
17.93 |
144.90 |
17. 68 |
112.62 |
6.07 |
49.01 |
|
Others (W£185G) |
|
|
|
|
|
|
|
|
|
Bangladesh |
18.97 |
159.00 |
65.57 |
392.64 |
64.71 |
469.21 |
5.89 |
51.37 |
|
Nepal |
1.41 |
6.06 |
1.01 |
4.15 |
0.26 |
1.22 |
0.61 |
3.00 |
|
Oman |
0.06 |
0.52 |
0.23 |
2.07 |
0.49 |
5.62 |
- |
- |
|
S. Arabia |
0.10 |
0.81 |
0.89 |
8.67 |
1.82 |
16.56 |
0.20 |
1.32 |
|
Sri Lanka |
1.50 |
12.55 |
2.60 |
24.32 |
0.37 |
378 |
1.33 |
14.57 |
|
UAE |
- |
- |
0.65 |
7.31 |
0.05 |
0.58 |
- |
- |
|
Subtotal |
22.10 |
179.43 |
72.99 |
656.98 |
69.06 |
510.55 |
8.54 |
74.99 |
|
FGDD (W>185G) |
|
|
|
|
|
|
|
|
|
Bangladesh |
023 |
3.10 |
0.01 |
053 |
0.12 |
2.46 |
- |
- |
|
Nepal |
- |
0.18 |
- |
- |
- |
- |
0.19 |
1.10 |
|
Sri Lanka |
- |
- |
- |
- |
- |
- |
0.03 |
0.33 |
|
Switzerland |
- |
- |
- |
- |
0.08 |
169 |
- |
- |
|
UAE |
- |
- |
- |
- |
0.05 |
0.65 |
- |
- |
|
Subtotal |
0.23 |
3.28 |
0.01 |
0.53 |
026 |
4.90 |
0.33 |
1.56 |
|
Others (W>185G) |
|
|
|
|
|
|
|
|
|
Bangladesh |
- |
- |
0.50 |
6.20 |
0.76 |
7.76 |
- |
- |
|
Nepal |
- |
- |
034 |
4.81 |
- |
0.03 |
0.06 |
019 |
|
Sri Lanka |
0.04 |
0.78 |
0.02 |
1.35 |
- |
- |
0.17 |
1.70 |
|
UAE |
- |
- |
- |
- |
- |
- |
- |
- |
|
Subtotal |
0.04 |
0.78 |
0.85 |
12.36 |
0.76 |
779 |
0.23 |
1.88 |
|
TOTAL |
27.99 |
220.32 |
91.78 |
814.45 |
87.79 |
635.87 |
15.07 |
127.44 |
Source: Animal Quarantine and Certification Service Stations, Department of Animal Husbandry and Dairying, Government of India.
Producers of eggs and broilers are the major stakeholders in the Indian poultry industry. The industry has forward linkages with processors and backward linkages with hatcheries and feed suppliers. Since the commodity is perishable and delicate to handle, trade also plays an important role in the development of the industry. This section deals with the problems and interests of various stakeholders in the poultry industry ascertained through informal interviews.[67]
Problems of small farmers
Poultry farming is gradually getting concentrated in semi-urban areas and scale of unit is also increasing. Small units with less than 5000 birds have become very rare. The major problem with small units is marketing. When production is small, traders will not care much. The small units also face the disadvantage of fluctuating feed prices. Maize is the major feed ingredient whose price fluctuates very frequently. Small units cannot prepare the feed on their own. They have to buy finished feed, which is costly. For instance, the cost of the prepared feed is Rs.7/kg. while the price of the purchased feed is around Rs.8.00 per kg. Small units cannot buy the feed in large quantities when prices are low. Credit support for the small units is also poor. They depend on the informal credit market, which charges high rates of interest. It is reported that small units are shifting from layer to broiler production because of the short duration of each crop. Output in broiler units can be realized in six weeks. Because of this short period, a type of contract farming has been introduced in broiler units. Chicks, feed, and medicines will be supplied by integraters/hatcheries and output will be sold to traders identified by the hatchery. But there is no prior contract regarding the price of broiler. Layer units of small size are run with family labour and are close to residences. Fluctuation in the price of eggs is a major problem for the small units. Their cost of production is higher than that of large-scale units owing to diseconomies of scale. Commercial poultry cannot be treated as a supplementary activity for the members of the household. It is always a full time activity. A unit requires a minimum of two members, however small may be the size of the unit. But two members can handle 8000 birds. Hence small units cannot generate full employment even for family labour. It is suggested that units below 20,000 birds are not viable financially and are disappearing.
Large units face the problem of bio-security. In East Godavari district about 66 lakh birds are concentrated in a radius of about 15 km. All are very large units with more than 50,000 birds. Five years back, some disease spread and 50 per cent of the birds died. Though the remaining birds survived, there was no growth in them. The disease spread to all the units, as they were located in close vicinity. Then the farmers took two important measures at the suggestion of a veterinary specialist from Poona. They gave vaccine as a preventive measure. Even today this heavy vaccination is being continued. The farmers cannot take the risk of trying for cure measures after the attack of the disease. The chicks are highly sensitive and the disease spreads very easily. The quick spread is mainly because of the geographic concentration of the units. The disease spreads when trucks supplying feed or collecting of eggs move from one unit to the other. Hence, farmers started implementing strict bio-security measures like cleaning the tyres of the trucks before they enter the premises and keeping separate workers for taking care of chicks and growers. Since chicks and growers are highly sensitive to diseases, they have separated the grower unit from the layer unit. In the absence of strict regulations for establishing poultry units, externality problems arise. Each unit spends huge amount for solving the problems arising out of concentration. The concentration is mainly due to marketing advantages of concentration. This is a peculiar industry in which concentration is beneficial for the individual unit but harmful for the industry.
The farmers suggested that high feed prices could be tackled if the surplus stocks of cereals are supplied to poultry units. Though maize is preferred as the main grain in feed, other grains like rice and wheat can also be used.
Development of rural markets
The study of rural retail markets reveals that the gap between wholesale price at the production point and retail price in the villages is very high. It is reported in the Kavali area of Nellore district that eggs are sold in villages at Rs.1.75 each, while the price at the production point is Re.1.00. We studied two village markets in Ranga Reddy district. In Podur village, the headquarters of mandal, there is no supply of eggs to local merchants. They get small quantities from nearby town and sell at Rs.1.50, making a profit of Re.0.43 per egg. These merchants point out that transporting eggs is major problem because of their delicate nature. They charge a higher price to make up for breakage during transport and handling. In the second village, eggs are supplied, but the price is same. It is found that retail prices of eggs are not sensitive to changes in wholesale prices. As a result, a fall in wholesale price does not lead to increase in demand. The village retail traders/merchants said that they maintain the same price throughout the year as far as possible and make up for low profits realized in some season through high profits in another season.
Some producers feel that the NECC is not playing a proper role for solving the price problem. They feel that the poultry industry is in hands of the traders. When price is lowered they buy and store, and when price rises they reduce their purchases and release available stocks. A reduction in price is not leading to an increase in rural demand and clear surplus production. It appears that trader is the main beneficiary of these changes in prices. However, these views have to be taken with a pinch of salt. Discussions with a wholesale trader who is trading eggs from Andhra Pradesh to Calcutta, revealed certain problems faced by the poultry industry. Firstly, export demand for Indian eggs is restricted to Middle East countries. He further added that Indian eggs are not accepted in Europe because the feed contains too much of pesticides and the quality of fish used in the feed is poor. Unless pesticide use is regulated in the cultivation of maize and flocks are given smaller doses of antibiotics, egg quality cannot be improved.
There is a need for exploring external markets because of the recent spurt in production. Rural markets face transport problem. The packing technology presently adopted is suitable for wholesale trade, but not for retail trade. It is reported that packing cost is 10 paise per egg and transport cost for long distances is 14 paise per egg. Thus, by the time eggs reach the wholesaler, price increases by 24 paise. The semi-wholesaler adds 3 paise. But retailers add a minimum of 25 paise making the price spread quite large. One method of improving the rural market and demand is to allot some funds in nutrition programmes to supply eggs to schoolchildren. The reason for insensitivity of rural retail prices is lack of competition among retail traders. When eggs price is low, many small traders shift from other activities to this trade. When price rises, they leave the business. Thus, rural prices of eggs are insensitive to price changes.
It is suggested that unemployed youth may be provided loans for the purchase of vehicles for eggs distribution in rural areas. Some programmes like distribution of boiled eggs to schoolchildren will increase rural demand for eggs. The improvement in rural marketing has to be reflected in the responsiveness of rural prices to changes in producer prices.
Seasonality in demand
It is reported that demand for eggs is very low in summer and in certain days in a week. In some months in a year, eating of eggs is prohibited among certain sections. Further, when fish catching is high, demand for eggs is low. When fishing is prohibited in certain seasons, demand for eggs increases. Thus, while supply is continuous, demand faces ups and downs. This is another peculiarity of this commodity. Generally, for many commodities, seasonality arises in supply and demand is continuous. Demand for milk is continuous but supply is reduced in certain seasons like summer. One way out is to develop storage facilities or convert eggs into eggs powder and other items. So far units producing eggs powder have not succeeded because of lack of export demand because of low quality of eggs. Cold storage facilities help in preserving eggs for a long time. These facilities must be exclusively available for eggs as combining them with other commodities spoils the quality of eggs. At present, some cold storage facilities are available, but they are not exclusively used for eggs.
Broiler trade
In the rural areas of Andhra Pradesh, the demand for poultry meat is quite low because of the competition from mutton and fish. In certain villages fishing is an important activity. These activities restrict demand for poultry meat. Further, there is a feeling in rural areas that some poultry products have higher cholesterol, which causes heart diseases.
In Podur village, there is only one chicken shop. The trader buys live bird at Rs.36 per kg, i.e. 0.75 kg of chicken meat. As a result cost of chicken meat comes to Rs.48. He has to bear Rs.2 per kg towards transport. Since his selling price is Rs. 64, he derives a profit of Rs 14, or 22 per cent on his sale price. In the other village, Aluuru, in Chevella mandal, there is only one chicken shop, but there are several mutton shops. In this village, there is a feeling that eggs are a good food but poultry meat is not good for health. Thus, the market for chicken meat is restricted in this village (or say rural market). In urban markets prices for chicken is lower than that in rural areas. But environmental problems are created because the trader does the dressing at the shop and leaves the waste on the roadside. Street dogs and birds spread the waste. Only introducing regulations on retail trade in urban markets can solve this problem. As long as the processing is done in this way, there will be no demand for packed meat. It is better to activate the habit of buying packed meat at least in urban areas. Unless the present unhygienic method of processing is stopped, demand for processed meat cannot be generated. It is suggested that a beginning be made in metropolitan cities.
Health and environmental problems
It is reported that no health problems arose in and around poultry units. But foul smell is a common feature. It is reported that some of the units, which are close to villages, pacify the villagers by offering liberal donations for local festivals.
Defining status of poultry farming
It is argued by some poultry farmers that though the poultry sector is under the purview of the Ministry of Agriculture, there is considerable ambiguity regarding its status - whether it is agriculture or industry. The agricultural sector is entitled to 100 per cent exemption from income tax, concessional tariff for electricity and irrigation, exemption of sales tax/octroi, subsidy on fertilizers, pesticides, minimum support price for certain commodities, etc. Coming to industry, it is entitled to tax holiday for new industries, tax holiday for industry in backward areas, capital subsidy, etc. Poultry is perhaps the only sector, which does not enjoy any of these benefits. Hence, the poultry sector be accorded the status of agriculture and extended various benefits that are applicable to agriculture.
National poultry development board
To help eliminate constraints and to improve production of Maize and other feed ingredients, promote market, monitor progress and development of infrastructure, there is a need for creation of National Poultry Development Board.
Contract farming
Contract farming is not prevalent in Andhra Pradesh because of the scale of operations. But small-scale poultry units can be made viable only when contract farming is introduced. Contract farming in the poultry sector has to encompass contract between feed manufacturers and grain producers, especially producers of maize, and contract between poultry units and processors. However, rural marketing is the major constraint, which can be removed by the National Poultry Development Board on the lines of the National Dairy Development Board
NECC, a voluntary organization of farmers, does influence policy making for this sector but not to a very large extent. This organization undertakes promotion of eggs, etc. where farmers are stakeholders as well as beneficiaries. In addition to this, the poultry sector is represented in industry and commerce organizations like the Federation of Indian Chambers of Commerce and Industry (FICCI), Confederation of Indian Industry (CII) and Associated Chamber of Commerce and Industry (ASSOCHAM). In these organizations there are committees and sub-committees on agriculture through which representations are channelled to appropriate authorities.
The Ministry of Agriculture, Ministry of Commerce, Ministry of Finance, and Ministry of Food Processing Industries frame most of the policies for the poultry sector. APEDA is another organization, which works as facilitator for implementing different developmental schemes for the development of poultry. The Ministry of Food Processing Industries implements some of the schemes. In addition to this, some small groups of feed manufacturers like CLFMA and pharmaceutical industry also lobby with the government for their interests. Unfortunately, in India, policies are thrust on the industry and not formed in consultation with it.
Right from India’s second five-year plan, poultry has been given considerable importance. As a result poultry farming has emerged as one of the most important components of the livestock sector. The main strategy during the successive five-year plans has been to increase production of eggs and poultry meat through increased availability of quality chicks and supply of other inputs like balanced feed, health care, marketing and storage, and other infrastructure facilities. The measures have included:
Direct funding for several research activities related to poultry breeding and health management. This includes setting of various regional poultry breeding Farms and multiplication farms, introduction of Intensive Poultry Development Projects (IPDPs) to provide necessary inputs for profitable poultry keeping, setting up of a Central Training Institute for Poultry Production and Management (CTIPPM) in Bangalore etc.
Indirect support through the Agricultural and Processed Food Products Export Development Authority (APEDA) and the National Egg Coordination Council (NEEC) - the former for providing infrastructural support and incentives poultry exports, and the latter for promotion of egg marketing and consumption.
Setting up of a number of poultry estates in collaboration with agencies such as the National Cooperative Development Corporation (NCDC), National Bank for Agriculture and Rural Development (NABARD), state government and non-government organization (NGO). Plans are also afoot to set up a National Poultry Development Board to promote and coordinate various activities concerning poultry such as creating the necessary infrastructure facilities, advertising, and other promotional work in India and abroad.
Poultry keeping was recognized as an important activity for poverty alleviation. Small and marginal farmers, agricultural labourers, and other weaker section of society were provided government help by way of credit, subsidy and technical assistance for adopting poultry farming as a supplementary source of income. Efforts were made to strengthen the cooperative structure for production and marketing of eggs (during the 70s and 80s).
Imports of poultry products were banned or restricted through tariff and quantitative restrictions. For instance, all the items of the commodity group ‘live poultry’ (HS 02. 02 and 01.05) came under the restricted category, and could be imported only on the recommendation of the Department of Agriculture and Cooperation. Similarly, all items falling under ‘meat and edible offal of the poultry, fresh, chilled, as frozen (HS 02.07) were again restricted. The commodity group “birds’ eggs in shell, preserved or cooked” (HS 01.07) was also placed under the restricted category. Most of the processed poultry meat preparations and egg products attracted custom duty of 35 per cent (excluding of special additional duty of 4 per cent) during 2000-02. Though the duty was comparatively low, there were quantitative restrictions on its imports.
The plan expenditure on poultry
The government’s expenditure on poultry from the second five-year plan to eighth five-year plan is displayed in Table 21. Overall support from the government to poultry increased from Rs.28 million in the second plan to Rs.602 million in the seventh plan. In the eighth plan, poultry farming has been identified as one of the thrust areas. The proposed outlay for the livestock sector is Rs.28383 million.
Table 21: Central Government Expenditure on Poultry
|
Plan Period |
Expenditure on poultry (Rs. Million) |
Total Expenditure on Animal Husbandry of dairying (Rs. Million) |
|
|
Second Plan |
(1956-61) |
28.0 |
334.7 |
|
Third Plan |
(1961-66) |
46.0 |
770.0 |
|
Annual Plan 1966-69 |
(1966-69) |
NA |
597.0 |
|
Fourth Plan 1969-74 |
(1969-74) |
115.0 |
1542.6 |
|
Fifth Plan 1974-78 |
(1974-78) |
355.0 |
2324.6 |
|
Annual Plans 1978-80 |
(1978-80) |
NA |
2087.7 |
|
Sixth Plan 1980-85 |
(1984-85) |
426.0 |
8025.1 |
|
Seventh Plan 1985-90 |
(1985-90) |
602.0 |
12805.0 |
|
Eighth Plan |
(1992-93) |
NA |
28383.2 |
|
Total |
(1956-1997) |
1572.0 |
56869.9 |
|
Source: |
(i) Indian Poultry Industry Yearbook, 1994. |
|
|
(ii) Economic Survey, Government of India, various issues |
An infrastructure is in place at the government level to promote poultry industry by financing through nationalized banks and through National Bank for Agriculture and Rural Development (NABARD), though the interest rate is quite high. The National Egg Coordination Committee (NECC) helps in price support mechanisms through interventions during time of distress sales by marginal and small farmers.
General Insurance Corporation of India (GIC)
As banks and National Cooperative Development Cooperation (NCDC) have started financing small and marginal farmers in villages, poultry insurance has also been introduced under the Indian Rural Development Programme (IRDP).
GIC’s poultry insurance covers the following:
Comprehensive cover for poultry farmers
Epidemic poultry insurance through hatchery
Poultry insurance scheme for parent stock through hatcheries.
Agricultural and Processed Food Products Export Development Authority (APEDA):
APEDA is an autonomous organization attached to the Ministry of Commerce of the Government of India. The main function of APEDA is to build links between Indian producers and global markets.
APEDA undertakes the following development programmes:
Development of databases on products, markets, and services publicity and information dissemination.
Inviting official and business delegations from abroad.
Organizing of product promotions abroad and visits of official and trade delegations abroad.
Organization of seminars, workshops and awareness programmes on exports as well as latest farming processes.
Participation in international trade fairs in India and abroad.
Organization of buyer-seller meets and other business interactions
Information dissemination through APEDA’s newsletter, feedback series, and library.
Distribution of annual APEDA Awards.
Providing recommendatory, advisory, and other support services to the trade and industry.
APEDA also offers financial assistance under various schemes, which seek to promote and develop agro exports.
Some of the activities that are eligible for financial assistance are:
Strengthening of market intelligence and data base through studies and surveys
Quality up gradation
Development of infrastructure facilities
Research and Development
Development of packing quality Human resource development
Up gradation of meat processing facilities.
Under agricultural produce, APEDA has grouped the following categories of produce:
1. Fruits, vegetables and products
2. Meat and meat products
3. Poultry and poultry products
4. Dairy products
National Egg Coordination Committee (NECC)
Formed in 1982 to protect the poultry farmers’ interests, NECC is performing its role admirably to this very day.
NECC was set up in Pune in 1982 when a group of farmers came together to form an association. Membership fees to this day are Rs.1 only and there are 25,000 members. In the days preceding the setting up of NECC, the scenario looked quite bleak. Middlemen controlled the trade and sucked away most of the margin. This left the farmer with un-remunerative returns.
There were a host of problems in the 70s and the early 80s: with rises in the primary input costs such as medicines, feed, electricity, taxes, etc. coupled with domination by the middlemen. In 1981, a great crisis took place. Egg prices fell drastically and over 20,000 marginal poultry farmers lost their only source of livelihood. At that point of time, the prices were not even sufficient to recover the cost of production.
Determined to do something, a bunch of farmers, motivated by the late Mr. B V Rao (the father of the poultry industry in India) started a mass movement. They travelled through the length and breadth of the country holding over 300 meetings with traders and farmers. It was during this time that the concept grew very strong - “ My egg, my price, my life”. NECC was born on May 31, 1982. Today, NECC is performing its role well.
Activities of NECC:
1. Price declaration
2. Market intervention through NAFED and Agro Corpex India Limited ¾ Egg consumption is seasonal. Religious festivities and summer are times when egg consumption falls. NECC arranges for eggs to be lifted and sent to Agro Corpex to put in cold storage during such times.
3. Advertising, promotion, publicity and consumer education ¾ the ultimate objective of is to increase consumption of eggs. This is achieved through various means: films. exhibitions, poultry melas, exhibitions, vans and distribution of boiled eggs. Eggs are included in the mid-day meal scheme in Tamil Nadu. NECC participates in the Pune International Marathon and provides boiled eggs to the runners. If conducts healthy body competitions with the Rotary Club and provides literature to gynecologists. If they come out with brochures and leaflet that contain medical information about the benefits of eating eggs. These measures are also to increase the awareness level and educate the common people. Promotions are carried on at district and taluka levels Print and TV advertisements are meant for urban masses and serve mainly as reminders.
4. Extension activities - reviews and publications
5. Market research
6. Market identification and development:
Satna project. This was an effort to find out the effect of availability of eggs in an area. NECC opened a depot and eggs were brought from Andhra Pradesh to tide over the unavailability of eggs in the area. After six months, the consistent supply was quietly removed and left to the local authorities. It was seen that the natural demand did not fall and traders started making arrangements to procure eggs from other areas.
Egg cart scheme: Under this scheme, NECC designed and sold egg carts to unemployed young men. These people cooked and sold eggs as nutritious mini-meals. It was later found out that each cart was-selling up to 300 eggs every day on average. The scheme has been very successful in Madhya Pradesh and is being extended to other parts of the country. The beauty of this scheme is that it opens up new channels of selling of eggs and makes eggs more accessible to the common man. Banks provide 90% of the funding and the operator provides the rest.
7. Preparation and submission of papers to the government
There are 113 local committees and 24 zonal committees in all the important poultry markets. There is an executive committee at the apex level. Members are elected every two years. It is through these structures that prices are declared and maintained.
To enforce the price declarations more effectively, NECC promoted Agro Corpex India Limited. This is managed and owned entirely by farmers.
To encourage exports, NECC helps through market intervention.
Today, 75% of eggs and meat are consumed in urban areas. NECC understands that it is rural markets that are going to be the key to the future of the egg industry in India.
The target that NECC has set for the year 2015 is to increase per capita consumption of eggs from 36/year now to 180/year, which is the level, recommended by the National Institute of Nutrition; it also wants to increase meat consumption to 10.8 kg per year.
In 1991, India embarked upon a new economic policy of liberalization. Under the new policy the government has sought progressively to divest itself of its business enterprises, simplify rules and regulations governing industry, and liberalize taxation policies and foreign exchange regulations. Initially, the whole thrust of import liberalization was upon the industrial sector. Thus until 1997, the Indian market was closed to imports of most agriculture and consumer food products. The first major step towards liberalization of agriculture and consumer food products was taken in that year when the government announced its five-year (1997-2000) EXIM policy. Under this new policy import licensing restrictions (which had effectively banned imports) on agriculture and common products were fully or partially lifted by moving many of these items to OGL and making them freely importable. During the past three years, the government has moved roughly 700 agricultural products into OGL, opening the market for most consumer food products with the exception of most meat and poultry products, some fruits and vegetables, food grains, and some processed food items. Under its WTO commitment, India has agreed to eliminate all the remaining quantitative restrictions by April 1, 2001.
Imports of poultry meat, poultry preparation, and eggs and egg products were restricted till April 1 ‘2000. The exim policy of 2000 and 2001 eased out import restrictions but hiked tariffs. The details of the new duty rate structure are given in Section 3. Highlights are given below:
Effective April 2000, chicken may be imported without licence but subject to an import duty of 30 per cent for whole chicken fresh/chilled/frozen, and 100 per cent for cut in pieces
Imports of grand parent breeding stock placed under OGL
Some additives such as lysine, methanine, choline chloride, and vitamins can be freely imported.
Besides easing out import restrictions, the government also eased out a regulation restricting poultry feed manufacture to small-scale enterprises with capital investment below an amount prescribed by the government. This regulation had in fact constrained the development of economies of scale in the feed industry and thereby resulting in high feed costs. To remove this hurdle and thereby to stimulate large investment in the poultry feed industry, the government lifted this regulation in the 1997-98 budget.
People have the basic right to expect the food they eat to be safe and suitable for their consumption. Food borne illnesses and food borne injury are at best unpleasant’, at worst, they can be fatal. Outbreaks of food borne illness can damage trade and tourism and lead to loss of earning, unemployment, and litigation. International food trade and foreign travels are increasing and they are bringing important social and economical benefits. Eating habits too have undergone major changes in many countries over the last two decades and new food production; preparation and distribution techniques have been developed to reflect this. Effective hygiene controls, therefore, are vital to avoid the adverse human health and economic consequences of food borne illness, food borne injury, and food spoilage. Therefore, everyone including farmers and growers, manufacturers and processors, food handlers and consumers has a responsibility to ensure that food is safe, wholesome and suitable for human consumption.
The effects of globalization will continue to affect the developing countries like India and will result in fundamental changes towards our approach to animal production, particularly poultry production. We have already witnessed the influence that Europe has had in Asia, in terms of antibiotic growth promoters, drug free chicken production and usage of genetically modified organisms. It is inevitable that we will witness more changes in these areas. However, fortunately in India we do not use hormones and other growth promoters as they are used in US and other developed countries. In India, even animal fat like tallow and pig lard is also prohibited to be used in poultry production for fattening the broilers. In developed countries, the broiler industry is the victim of its own success. Whereas intensive selection and breeding has improved bird performance this has also led to pressures to reduce the cost and improve productivity. The customer of today takes affordability and quality for granted and is becoming increasingly more focused on food safety and other related issues of animal welfare. In India, consumers expect that they get safe and hygienic food and government is also looking at these issues. Towards this effect, the government has framed different rules under the Prevention of Food Adulteration Act and for export purposes poultry products are covered under the Export Quality Control Act of 1963, which is governed by the Export Inspection Council of India, and these regulations of health and hygiene are mandatory for processing plants. The domestic market is governed by organizations like the Bureau of Indian Standards (BIS), Directorate of Marketing and Inspection, and Meat and Food Products Order (MFPO) of the Ministry of Food Processing Industries. Government is trying now to harmonize its food standards with Codex standards and trying to put all these laws under one agency so as to avoid multiplicity of standard formulating agencies as well as implementation agencies. When poultry production is traded internationally, one of the major impacts of these transactions has been to see whether there is usage of hormones and other antibiotic growth promoters. EU has banned all antibiotic growth promoters with the exception of avilamycin and bambermycin. Consumers will definitely ask for safer and hygienic food in future and their future concerns and expectations from broiler industry would be as under:
1) Production and uniformity
2) Microbiological contamination
3) Meat quality and functional food
4) Mycotoxin contamination
5) Trade mineral requirements
6) Raw material utilization, usage of GMO and non-GMO ingredients
7) Removal of antibiotic growth promoters
8) Drug free chicken
9) Free range broiler production
10) No usage of animal by-products
11) HACCP implementation and supply chain auditing
12) Animal welfare
Providing safe, uniform, wholesome poultry products should be a priority of the broiler industry. There is no doubt that advances in biotechnology are helping to achieve this very objective. However, one must also ensure that consumers do not throw the baby with the bath water. India is seriously engaging itself with drug and pesticide residue problems.
History of major zoonoses such as Avian Flu Outbreak
In India very little work has been carried out in the area of zoonoses. Before independence, institutes like the Haffkine Institute, Mumbai; School of Tropical Medicine, Kolkata; Central Research Institute, Kasuali; King Institute, Guindy (Chennai), and Indian Veterinary Research Institute were connected with the research and control of human and animal diseases like pox, plague, rabies, typhoid, salmonella, etc. After independence, the National Institute of Virology, Pune (formerly called as Virus Research Centre) had contributed a lot in the area of viral disease transplanted from animals to humans. Presently, all the above institutions in association with National Institute of Communicable Diseases, New Delhi are engaged in research, diagnosis, and control of zoonotic diseases.
India is one of the few countries in the world where diseases like Avian Influenza have never been reported. The occurrence of other diseases like New Castle is of very low and sporadic. The government has been taking measures to control the disease with stamping out policy and mass vaccination. The disease is effectively controlled through mass vaccination using BP Vet Standards Multiple Live Vaccine and killed vaccines other bio-security measures being are adopted at the commercial farm level as well as strictly at the hatchery and breeder farm level.
The country has ultra-modern poultry vaccine manufacturing facilities, which were set up with technological collaboration with renowned laboratories to meet the British Pharmacopoeia Standards. For the production of these high quality vaccines the country is using specific pathogen free (SPF) eggs, production of which is also being carried out since 1984-85. The availability of SPF eggs locally and domestically has facilitated the mass and quality production of these vaccines this is supported by research and development work being undertaken by major vaccines manufacturing institutions. The country is producing over 2 billion doses of different poultry vaccines. Most modern poultry diagnostic and research centres have been set up with the network of satellite laboratories all over the nation for disease diagnosis. These laboratories monitor the health status for the poultry sector and also facilitates production oriented research facilities for poultry health coverage and surveillance all over the country. These laboratories have the latest facilities like sterile air handling systems, specialization in virology, histopathology, immunology, microbiology, FAT technologies, and Elisa, which are comparable to modern avian diagnostic laboratories in the developed world. These labs have helped ***immensely in bacterial and viral diseases. As a result of all these steps avian diseases has been controlled and incidences of other diseases across the country have been well under control. Rapid whole blood test programme regularly and constantly tests the entire layer and broiler purtlines, grandparents and parent breeders for salmonella while Elisa does the same for flock check system.
Additionally, there are more than one and a half dozen universities/institutes in the country, which have their own programmes for disease control and surveillance. State animal husbandry departments wherein a special segment has been created for poultry production and development support these.
Problems with drugs and pesticide residues
Residue levels of drugs and pesticides in food commodities are becoming a major concern for food regulators all over the world. Since residue levels cannot be changed drastically through various production techniques and because it is necessary to provide safe food to consumers, it is essential that adequate monitoring should be in place to eliminate the possibilities of the presence of the residue in food commodities in excess of the prescribed levels. Keeping this in view, most of the importing countries now insist on a residue-monitoring plan (RMP) to be put in place at the national level in the exporting countries.
India has prepared and implemented its own residue-monitoring plan for egg and chicken meat products, which is being implemented by APEDA. Guidelines have been issued by the government APEDA and include the following:
1) To establish the surveillance system to monitor the residues of drugs and pesticide in egg products exported to EU countries.
2) Residue monitoring is applicable only to 100% export oriented units of egg products to EU countries.
3) Egg products exported to EU will be sampled and tested by the nominated laboratories as provided in the plan.
4) Procedures for obtaining the test certificate.
5) Responsibility of the national reference laboratory which will monitor the work of other nominated regional laboratories by conducting surveillance, audit on six-monthly basis to ascertain the criteria laid down under these Residue Monitoring Plan is followed properly.
6) Responsibility of nominated laboratories which will submit bi-monthly statement of sample testing to the National Reference Laboratory as well as to APEDA.
7) Evaluation of the report of National Reference Laboratory and to ensure that test results submitted by the nominated laboratories on bi-monthly basis are properly implemented and conveyed and the other control measures suggested by the National Reference Laboratory are implemented.
RMP also identifies a list of laboratories, which have been approved and nominated by APEDA, for sample testing.
Lays down procedures to be followed by nominated laboratories for sampling and testing of egg products for exports. It also describes the methods of sampling for checking the levels of pesticide residues in egg products.
Describes methods of sampling for checking the levels of residues of pharmacological active substance in egg products.
Describes and gives a list of pesticides residue limits applicable for egg products.
Gives a list of maximum residue limits for pharmacological active substance.
The processors and government that includes a self-monitoring plan for egg producers or farmers who supply eggs or chicken to processing units are jointly implementing this monitoring plan. The programme is well defined wherein the farmer is also required to ensure that the birds or eggs they supply to processing units:
a) Do not contain residue levels, which exceed maximum permitted limits.
b) Do not contain any trace of prohibited substance or products.
c) Have not been administered unauthorised substances and proper withdrawal period has been observed.
d) The former should carry out random checks on feed, water, eggs, and excreta to ensure that nothing unwanted goes to the flocks in the farms.
e) Send samples to regional laboratories for testing and the results conveyed to the National Reference Laboratory and APEDA.
As a part of self-sufficiency policy in the pre-reform era, government persisted that India should have its own genetic programme and requested the VH group to bring in pure line so that the genetic base can be broadened and requirement of DOCs in country can be met domestically without depending upon import of grand parents. Pure line requires lot of R & D on continuous basis, which can be sustained, only if there is requirement for sufficient number of parents and grand parents otherwise this operation will be a total loss.
India has now become self- sufficient in terms of grand parents, parents, and DOCs. Over the years, the size of breeding farms has increased for layers and broilers. Similarly, productivity and FCR of layers and broilers have undergone significant changes during the last two decades. Layer birds, now give hen- house based productivity of 300 eggs (on average), and FCR is as close to 1.9-2.0 kg. for 1 kg. of broiler.
In egg processing, concerned egg processors have a contract with some poultry farms for the production of quality eggs (for conversion to egg powder). The egg processors keep a close control over quality of feed and management of farms and look after traceability and other factors, which are important in the production of egg powder. Loosely these farms can be called contract farms.
In the case of chicken processing, the processing units own some of the farms themselves and in other cases they procure broilers from contract farms.
In the case of egg powder (mostly 100 percent export oriented units) there is close relationship between egg processor and contract layer farmers. Similarly, chicken processing units also procure broilers from contract farms, and the supply chain is maintained. However, the processor sells value added products through a network of distributors/retailers directly to institutions where supply is in bulk or on yearly basis.
The agreement on the application of sanitary and phyto-sanitary measures sets out the basic rules for food safety for animal and plant health standards. It allows countries to set their own standards, but it also stipulates that regulations must be based on science. They should not arbitrarily or unjustifiably discriminate between countries where identical and similar conditions prevail.
The Technical Barriers of Trade (TBT) covers all technical regulations, voluntary standards and procedures, and ensures that these are met except when these are sanitary or phyto-sanitary measures as defined by the SPS Agreement. The TBT measures can cover any subject from car safety to energy saving devices to the shape of food safety cartons. In terms of food labelling requirements, nutrition claims and concerns, quality and packaging, regulations are generally not considered to be sanitary or phyto-sanitary measures and hence are normally subject of TBT measures.
One of the problems in these standards is that they are so stringent that many countries have difficulty in implementing them nationally. India has been no exception and is trying to harmonize its standards with Codex so that it falls in line with all these agreements. However, there is a feeling in the industry that sometime the importing countries particularly for egg products are using these measures discriminately. Though, Indian standards for egg processing plants have been derived from USDA and EU Regulations, many countries like Australia and Malaysia do not recognize these standards and even equivalence has not been granted for Indian standards by the developed countries. Similarly, the importing countries do not approve the veterinary certificate issued by competent authorities like export inspection agencies and insist on a separate health certificate issued by the veterinary authorities. In some cases, even the importing companies have their own specifications, which vary from their own national standards. It is, therefore, quite evident that despite the best spirit of SPS and TBT Agreements these measures in some or other garb are being used by the developed countries to hinder exports from developing countries. There is discrimination, in spite of the fact that there is a mention of special and differential treatment to be given to developing country members under Article 12 of the TBT agreement.
The Indian poultry sector, particularly egg processing units have already started integrating themselves with the global system in the light of the SPS and TBT agreements. Two of the egg processing units in India is already HACCP compliant. Similarly, the chicken processing units are in line for adoption of HACCP. If international agencies like FAO and USDA helped the developing countries in understanding the HACCP, and its benefits, the industry would be quite keen to adopt newer food safety, health, and hygiene systems. But it would not be out of place to mention that only bigger units who have the manpower, infrastructure and financial strength can adopt HACCP and ISO 9000 type of measures. Small and marginal farmers and small units engaged in processing may find it difficult to implement these systems.
HACCP systems, which essentially identify, evaluate and control hazards, which are significant for food safety, must essentially start from any person who directly handles packaged or unpackaged food, and is expected to comply with all the food hygiene requirements. He should also ensure that food will not cause harm to consumers when it is prepared or eaten and gives assurance that the food is acceptable for human consumption. The Indian poultry sector is also looking for domestic standards, which can ensure the above-mentioned requirements. Units engaged in exports of poultry products including eggs products have already adopted such systems as mandated by the Export Inspection Council Act, 1963. The Export Inspection Council has introduced a quality assurance and monitoring system manual on export of egg products, which is applicable from March 1998. The manual lays down standards for egg processing plants for health and hygiene and these standards have been adopted in line with USDA and EU Regulations. Similarly, for fresh poultry meat products a similar notification under the Export Quality Control Act, 1963 is being brought out which will cover all health and hygiene aspects of poultry processing plants. These regulations again have been derived from USDA and EU Regulations. While these are mandatory it may be noted that these regulations are for export purposes only. For domestic market, the Meat and Food Products Order (MFPO) and Bureau of Indian Standards (BIS) govern quality control. But it again would not be out of place to mention that the units which produce chicken for export purposes do not discriminate their products between domestic and export markets. It is expected that as the size of the units grow and more of processing units emerge in near future the health and hygiene quality control systems would be followed and the country would also be then integrated with the global systems of health and hygiene regulations.
There is no simple objective measure of welfare or general consensus of what welfare involves and, thus, all the emphasis to be given to any aspect of husbandry and economics. This arises because of inadequate understanding by at least some and possibly many people of one or more of the following disciplines: ethics, animal physiology, athology, diseases, pathology and epidimology. No individual can be fully conversant with all the complicated and technical aspects. There are so many divergent groups involved that they have opposite ideas, interpretation and objectives and it is difficult to arrive at a consensus applicable to all. Therefore, welfare of livestock is lost in the ensuing often acrimonious arguments. One of the difficulties arises from the large number of animals involved. One may consider 100,000 birds in one house as a small unit whereas a million birds is a reasonable size which is economically viable. Both may follow good health husbandry practices but both must face the inevitable welfare problems of environment, nutrition and disease control. One must also keep in mind that the present industrial agriculture is required to feed a very large human population. We can broadly put objectives and measures of animal welfare, which can be assessed, in poultry houses as under:
1) Visual inspection and resulting assessment, which should include the bird behaviour, which can be a subjective conclusion.
2) Ensure that freedom from thirst, freedom from pain, injury and disease, prevention of disease and treatment of injury, freedom of display of normal behaviour. These are normal poultry husbandry practices, which must be provided by entrepreneurs.
3) Good records, which provide readily available, accurate and objective assessment of welfare, which should include records of egg numbers, size, disease, mortality, feed and water consumption, etc.
4) Measurement of space available for hen.
5) Absence of behavioural anomalies like fear, hysteria, cannibalism, feather picking, and vent picking.
6) Measurement of husbandry and flock health should include individual body weight, ventilation rate, ammonia level, lighting intensity, feed consumption, feather cover, race schedules, etc.
7) Lab estimates of various physiological functions and hormone levels as to major lymphocytes ratio, heart and respiratory rates, blood pressure and adrenal functions.
Welfare assessment is, however, more complicated for several reasons. The information of the above criteria is acceptable to everyone. There are a large number of hens in major poultry houses where traditional systems or battery cages are used. Caged houses containing over 100,000 hens or even more are now being built and there may be small farms in deep-litters with a size of 500 or 1000 birds. It is generally easier visually to assess individual animals in small flocks up to 100 than larger flocks where individual birds can be overlooked. In cages, hens are presented to the observer in good light and in small numbers as each cage hold a small flock. However, in the smaller flocks of traditional system, sick and bullied hens are much more likely to be overlooked as they may be hidden by equipment or dark corners. This is an important challenge to both management and caretakers in cages and more importantly in traditional systems. In India, the medium and big farms keep birds in cages whereas small and marginal farmers still have the traditional deep-litter system. In Europe, issues of animal welfare, antibiotic and ground water quality may become major concerns and cages have to be done away with by 2012 but there is no such concern in India as of today. But considering the globalization and international trade in poultry products these issues may be live in India after few years because of pressures from importers from countries like EU. However, one has to find acceptable systems of production.
In US and EU, there is a great concern for waste disposal of poultry excreta as well as rendering material from processing units. This is more so in EU and USA since they have very intensive system of production because of the climate and most of the houses need heating systems because of the cold climate. In India, 99.9% flocks are kept in open houses and it is only in winter months, that too, in a few regions when the heating systems have to use for few days. The excreta of birds, whether in cages or through deep-litter is used as fertilizer by the agricultural farmers for different crops and as of today there is no such problem of excreta waste disposal.
Regarding waste from processing units of chicken, some of the units have got rendering plants, which properly use the blood, feathers, intestines, etc., and other waste material recovered from processing of the chicken. However, by-products from rendering plants are not reused in poultry production. Moreover, the poultry units in India are located in rural areas and as such do not cause any environmental problems. But looking into the future global concerns over such issues, India will have to look into these matters more objectively and make plans to sort them out.
In EU and US, there has been an increasing concern over environmental pollution since most of the houses use massive energy to provide heating and in turn these production units produce lot of ammonia and other gases. The processing units of chicken also produce plenty polluting elements and concerns has been raised time and again pertaining to the quality of ground water, risk of leakage of poisonous material, etc. In India, these issues are not yet critical, though, they are discussed now at various seminars and discussions on poultry production. As organic production systems are gaining relevance in Australia, EU, and other places organic production systems are designed to produce optimum quantity of food by using management practices that aim to avoid the use of agro-chemical inputs that, in turn, minimize damage to the environment and wildlife. These issues may crop up in India too after some years. However, the actual cost of organic production would be far higher than producing eggs and chicken in battery cages. With this extra cost, which is quite substantial, it is evidently clear that there will be very limited number of consumers who will prefer to buy organic egg or organic chicken. It would be not proper to ignore the disadvantage attached and inherent in organic production system.
The organic philosophy for clear environment is that production should be carried out in small flocks in small units which would create greater risk of infection which will lead to greater risk of diseases as medicines and feed additives will not be used for this type of farming. This will basically be inconsistent with the organic philosophy, which places emphasis on the balanced utilization of resources and environmentally correct production. The demand of such products will be tied to the geographical areas and classes where the purchasing power would be very high. Since growth promoters, hormones etc. are not used and there is not very intensive poultry production and houses are open there is a big difference between Indian and western production of broiler and eggs. Therefore, the problems may arise only when the international trade takes place and the countries raise objections to such production systems as not compatible with their own production systems. No serious thought has been given to this problem.
Presently there is no conflict between the producers of poultry products, farmers, and population living around them since these farms are not creating any health hazards. But as the urban population grows and moves towards rural areas and becomes more alive to environmental issues, this may become a problem of future as the poultry industry grows along. However, in urban areas some animal health welfare enthusiasts have been raising their voices for animal welfare and humane treatment to the livestock. For future, the following issues may become of some consideration even in India.
1) We have to become more efficient in circulating balanced nutrients and in reducing leakage of such nutrients in air and water.
2) We must develop more sophisticated production methods with lower turnover of raw materials and energy.
3) We have to increase our focus on sustainable forms of energy like solar energy, bio-fuels, etc.
4) We must maintain the biological diversity, as sustainable agriculture should also mean economically viable agriculture.
The poultry industry is highly dependent on feed ingredients. Feed alone constitutes 70 to 75 per cent of the cost of broiler and egg. Therefore, price movements in the feed sector will have a direct effect on the prices of eggs and broilers.
The main feed ingredients are maize, Soya, rice bran, groundnut cake, etc. Of these various ingredients, maize is the most crucial one in India.[68] Its production, like all other agricultural commodities, is also dependent on the monsoon. Very often there has been severe shortages of maize, and as a result the poultry sector has witnessed high feed prices.
Despite the setting up of a Maize Development Mission under the Technology Mission of the Government of India, maize production in the country has remained around 10 to 11 million tonnes a year. The poultry industry alone requires 5 million tonnes as of today.[69] It is estimated that the requirement of maize for poultry alone will increase to 31 million tonnes[70] by 2020 if the layer industry grows at the rate of 10 per cent per annum and broilers at 20 per cent. All this shows that maize will continue to remain a critical input for the poultry sector.[71]
The trends in wholesale prices of eggs, broilers, and fish are shown in Table 22 and Figure 5. The following points emerge from the trend:
i) Prices of both eggs and broilers have been rising steeply under the pressure of inflation during the last two decades. Egg prices are seen to have shot up by 6.6 per cent per annum (1982-98), and that of broilers by 6.1 per cent per annum.
ii) The price of fish however is seen to have galloped faster than that of eggs and broilers 9.8 per cent per annum between 1982-83 and 1998-99. A similar trend has been noticed for broiler/egg products vis-à-vis the price trend of mutton. As a result of this differential growth, the gap between the prices of poultry meat and mutton widened. The gap increased more rapidly after 1993-94. In fact the price of the mutton increased at twice the rate of increase of poultry meat.
Figure 5: Wholesale Price Index of Eggs, Fish, Broilers, 1982-98 (1980-81=100)
Table 22: Wholesale Price Indices of Eggs, Fish and Broilers
(1980-81=100)
|
Year |
Eggs |
Fish |
Broilers |
|
1982 |
106.9 |
118.7 |
116.2 |
|
1983 |
113.1 |
127.7 |
122.1 |
|
1984 |
122.4 |
123.3 |
131.3 |
|
1985 |
122.7 |
140.8 |
137.3 |
|
1986 |
130.3 |
150.5 |
140.8 |
|
1987 |
141 |
156.2 |
140.6 |
|
1988 |
152.3 |
164.3 |
157.3 |
|
1989 |
15137 |
170.1 |
161.9 |
|
1990 |
154.1 |
193.5 |
158.1 |
|
1991 |
188.6 |
216.4 |
175.9 |
|
1992 |
215.4 |
264.8 |
224.1 |
|
1993 |
229.7 |
331.2 |
245.1 |
|
1994 |
257.7 |
441.4 |
277.6 |
|
1995 |
275 |
535.1 |
259.3 |
|
1996 |
283.2 |
431.4 |
295.3 |
|
1997 |
323.1 |
500.4 |
304.8 |
|
1998 |
314.7 |
582.4 |
315.6 |
Source: Govt. of India, Ministry of Industry, Office of Economic Advisor, Index Numbers of Wholesale Prices in India, various issues.
The trends in the international price of poultry are given in Table 23 and Figure 6. A glance at this data shows:
i) Price of both eggs and chicken meat in the world market have climbed much faster (in terms of Indian rupees after adjusting for India’s exchange rate) than in the home market 10 to 11 per cent per annum as compared to around 6 per cent in the home market.[72]
ii) Price of eggs is relatively less in the home market than in US and European countries.
Figure 6: World Market Price Index of Eggs & Chicken Meat
Table 23: World Market Price of Eggs and Chicken Meat*
|
Year |
Eggs (Rs./MT) |
Chicken meat (Rs./MT) |
|
1982-83 |
10172 |
11506 |
|
1983-84 |
10050 |
11126 |
|
1984-85 |
11807 |
13256 |
|
1985-86 |
11068 |
13220 |
|
1986-87 |
13013 |
16180 |
|
1987-88 |
15754 |
17367 |
|
1988-89 |
16377 |
19765 |
|
1989-90 |
18432 |
23609 |
|
1990-91 |
22725 |
28217 |
|
1991-92 |
32202 |
39862 |
|
1992-93 |
37332 |
49898 |
|
1993-94 |
37581 |
45236 |
|
1994-95 |
36875 |
47120 |
|
1995-96 |
40704 |
48753 |
|
1996-97 |
48601 |
54100 |
|
1997-98 |
55152 |
63318 |
|
1998-99 |
53566 |
58185 |
* These prices are average unit values derived from world export totals - quantity and value. The dollar values are converted into Indian rupees by applying the prevailing exchange rate.
Source: FAO Yearbook- Trade
World market price changes and its potential impact on domestic price
Imports of poultry products have been negligible until recently because of a web of import restrictions. Only hotels and restaurants were permitted to import poultry meat under import licensing. Therefore, changes in international prices exerted very little impact on domestic prices. However, beginning April 1, 2001, all quantitative restrictions on India’s imports have been dismantled, and poultry items can be freely imported. This, it is feared, would lead to significant imports and unremunerative prices to local producers forcing them to close their shops. There are several reasons behind this alleged fear:
(1) Poultry processors in a large number of developed countries are said to earn their profits by selling their breast portion of chicken, which is conveniently promoted as lean/white meat at a premium price in their own markets. The leg portion (the leg quarter), on the other hand, is treated as dark meat and may get targeted for dumping in Asian markets at a throwaway price. In the Indian market, the thigh and leg quarters is preferred equally. Therefore, when imported leg quarters at throwaway prices are dumped in local markets local producers is definitely going to be hurt.
(2) Foreign governments, especially the US and EU, support poultry exports with subsidies such as the Restitution Money Scheme of the European Union, and the Export Enhancement Scheme of US in addition to cash subsidies given to poultry farmers. The amount of subsidy works out to be substantial.[73] The result is an un-level playing field in which the ball inevitably bounces towards the Indian market.
The costs of production of Indian poultry vary significantly over regions and over seasons. As mentioned earlier independent and small producers carry out a large production of the poultry sector. However the integrators are coming in some regions, particularly in South India, and to some extent in western and eastern India. The following paragraphs give the state of the position of different inputs and their related cost.
Types of feed
Poultry feed is divided into layer and broiler feed. In India two types of poultry feed are prepared. One is readymade in the form of mash or pillets. The second is use of concentrate by mixing energy ingredients. The concentrates are protein sources balanced in amino acids, minerals, vitamins, etc. They are mixed with energy sources such as maize, sorghum, or bajra[74] to prepare poultry rations.
The Indian feed industry is growing at a significant rate. The quality standards of Indian feeds are high and up to international levels. The feed industry has modern plants. It has latest equipments for analytical procedures. It has also least cost ration formulation.[75] Maize and soyabean are commonly used in poultry feed. Fish-meal and meat meal were popularly used in poultry feed. Owing to bacterial problems, meat-meal is not used, while the use of fish-meal also has significantly reduced.
The specifications of feed standards have been laid down by considering types of birds (layer/broiler), environment, quality of available raw material, etc. The Bureau of Indian Standards (BIS) and the Compound Livestock Feed Manufactures Association (CLFMA) have also laid down standard specifications. The specifications of BIS are only guidelines and their use as standards is not compulsory. The animal feed business is quite competitive in India.
Trends in the domestic price of an input - maize
The trends in the domestic price index of maize along with comparative international prices are shown in Table 24 and Figure 7. It can be seen that the international prices (unit values in Indian rupees) has been growing at a faster rate than in India. Further, a comparison of this table and Table 23 show that the domestic price of maize has been rising at the rate of around 7 per cent per annum as compared to 5-6 per cent in the case of eggs and broilers. As a result, the ratio of index of output price to feed price came down significantly in 1999-2000. This deterioration in relative price took place from 1994-95 onwards. Thus poultry experienced slow growth of output prices and high growth of feed prices especially after the mid-90s. Despite this high growth of input prices and slow growth of prices of poultry products, there is spurt in production. This adverse affects of price changes seems to be nullified by productivity improvement. The relationship between egg production and egg price (relative to feed price) shown in Figure 8 is found to be negative which can be explained only by technological changes.
Figure 7: Domestic and International Price Index of Input: Maize, 1982-99 (1982-83=100)
Table 24: Domestic and International Price Index of Input: Maize, 1982-1999
(1982-83=100)
|
Year |
Domestic Wholesale Price |
International Price |
|
1982-83 |
100 |
100 |
|
1983-84 |
105.16 |
119.66 |
|
1984-85 |
87.35 |
143.36 |
|
1985-86 |
112.51 |
124.67 |
|
1986-87 |
119.48 |
120.87 |
|
1987-88 |
126.19 |
106.06 |
|
1991-92 |
207.54 |
261.32 |
|
1992-93 |
199.54 |
332.28 |
|
1993-94 |
181.61 |
324.91 |
|
1996-97 |
292.19 |
514.23 |
|
1997-98 |
275.35 |
524.67 |
|
1998-99 |
280.45 |
456.79 |
Source: For domestic wholesale price index, see G.O.I., Index Numbers of Wholesale Prices in India, various issues, and for international price, the source is FAO Trade Yearbook. These prices are unit values in terms of US dollar and converted into Indian rupees by applying the prevailing exchange rate.
The annual average maize price in India during 1998-99 and 1999-2000 was around US $133 and US$124 per tonne, as compared to corresponding international prices of US$98 and US$92 in Argentina.[76] At present, the retail price of maize is around Rs 7,000 per tonne, showing an increase of 20-25 per cent during last 4-5 months.
Figure 8: Relative Price-Production of Eggs
Veterinary care services
In India, animal husbandry is a state subject. The state governments, in the initial stages (during the seventies) when the poultry industry was just picking up, provided veterinary care services to local farmers. With the coming of private companies in breeding, it was basically their effort, which has helped sustain the growth level, which we witness today in the poultry sector. The farmers are well aware of the need to safeguard the health of their birds. A number of hatcheries also provide this service to farmers. Animal Health Products and diagnostic facilities are readily available to most of the farmers. In this context it is worth mentioning that large farmers/integrators employ their own veterinary consultants. The danger of flock diseases is not very significant in India.
The country also produces vaccines required for poultry health in both private and public sectors. It would not be out of place to mention that vaccines produced by these institutions are with the use of SPF eggs as mandated and laid down by the British Pharmacopea.
The private sector is more prominent in vaccine production, production of animal health products, and other drugs required by the poultry sector. The role of government is that of a facilitator and administrator of different laws. Organizations of farmers like NECC are engaged in promotional activities than in production.
The prices of vaccines, animal, health products, and feed editivies are either comparable or slightly higher as compared to international prices. In terms of quality they meet international standards.
Hatcheries
India has a large number of hatcheries as well as a large number of all internationally known breeds. The farmers generally buy their DOCs from these hatcheries. Venkateshwara Hatcheries (VH) is the most important player in this sub-sector accounting for 65 per cent of the broilers market and 80 per cent of the layers market. It also sells grandparents and parents. VH supplies only Cobb100 to broiler farmers. The concentration of this breed in the Indian market can be due to many reasons: (i) it is considered the best performing breed in terms of production and liveability, (ii) imports of grand-parents were restricted till 1995-96, (iii) regular supply, (iv) support and related services such as animal health products, disease, and diagnostic services and manpower training, and (v) network of after-sale services throughout India.
The market price for DOC is different for layers and broilers. It is around Rs. 12-14 per DOC for broiler. However, this price varies significantly, depending upon many factors. The hatcheries employ different methods to maintain the prices in market. Last year, hatcheries had destroyed hatching eggs when supply was more than demand. Most of integrators in India produce their own chicks with the assumption that it will substantially reduce their production cost (of broiler). Some experts says that it can reduce DOC cost by 50 per cent, and this may be one of the reasons that the number of integrators is increasing in some regions of India, notably south and east.
As mentioned earlier, India can boast of very successful breeding operations including pure-line breeding operations duly supported by R&D, bio-security measures, and strict quarantine for the breeder flocks. These breeding operations are supported by hatchery operations, which observe strict bio-security measures as required by hatchery health and hygiene. The breeding flocks are duly and compulsory tested for salmonella. Disease and diagnostic laboratories are located in different regions along with institutions like the Indian Veterinary Research Institute. However, the private sector has set up its own sophisticated laboratories for disease surveillance and diagnostic services.
Cost price of different components of ‘whole chicken’: an illustration
Table 25 gives an illustrative cost structure of broiler production in India. As mentioned earlier, the cost structure varies significantly from region to region. Climate is one of the important factors in price difference over regions. In North India, the climate is extreme cold and hot as compared to other regions. This leads to extra cost on environmental control measures to maintain the temperature in hot and cold climates. Similarly, cost of feed also varies from region to region, because maize and Soya are produced in select belts of India. Overall, it can be said that the cost of production of a broiler in north India is relatively higher than in south and west India.
Table 25: Cost Price of Different Components of Broiler in India: An Illustration
|
|
Weight of Broiler = 1.75 kg. |
I. Rs/Broiler |
USD/Broiler |
|
|
Price of Day Old Chick (DOC) |
12.0 |
|
|
Feed Cost: |
|
|
|
|
|
Feed cost @ Rs. 9/kg. (3.85 kg. @ FCR = 2.2), for one bird |
34.65 |
|
|
Overheads: |
|
|
|
|
|
Interest costs, depreciation etc. |
1.5 |
|
|
|
Vaccination/medicines, etc. |
1.5 |
|
|
|
Electricity/water |
1.5 |
|
|
|
Labour and other miscellaneous expenses |
2.0 |
|
|
|
Total overhead per bird |
6.5 |
|
|
|
Cost of production of one bird of 1.75kg |
52.15 |
|
|
|
Allowing mortality of 5% |
2.6 |
|
|
|
Cost of production of one bird of 1.75kg |
54.75 |
|
|
|
|
I. Rs/Kg. |
|
|
|
Cost of production for 1 kg of live bird |
31.3 |
|
|
|
Transportation cost to poultry market |
2.0 |
|
|
|
Farmers margin |
1.5 |
|
|
|
Farmers price to wholesaler/distributor |
34.8 |
|
|
|
Wholesaler/distributor’s margins |
3.0 |
|
|
|
Distributor’s price to retailer |
37.8 |
|
|
|
Adjusting (by 50 per cent increase) for transportation cost, loss of weight on dressing (66%) etc., Rs./kg. |
56.7 |
|
|
|
Retailer margin |
6.0 |
|
|
|
Selling price |
62.7 |
1.30 |
Prices of live birds vary from centre to centre (even within a region) and the variation can sometimes be very large. Figure 9 gives value of annual average prices of a centre in south India during last seven years. It can be seen from this figure that prices were maximum during the mid 90s. However, by 1998 prices started declining, after showing an increasing trend from 1994 to 1996. In this context it should be remembered that wholesale prices of India started declining since 1996 as shown in Figure 5.
Figure 9: Average Annual Prices of Broiler in a Center in South India
As mentioned earlier, prices of eggs and broilers fluctuate due to seasonal variations, religious festivities, and demand-supply balance. A major function of NECC is to stabilize prices of eggs through market intervention. But for broilers, there is no such national organization like the one for eggs. Instead, there are several regional trade associations made up of traders and farmers (example: in Hyderabad, it is the Broiler Farmers’ Association and the Hyderabad Broiler Trader Association). These associations fix the price of the live bird (live bird rate = price of 1 kg of live bird) each day, taking into account demand-supply situation and the farmers’ production cost. The birds are sold to retailers at the live bird rate. Retailers add a factor of roughly 1.5 times to account for the weight loss in dressing and cleaning, as well as for transportation and handling. To this amount, the retailer’s margin is added to arrive at the final customer price.
As mentioned earlier, Delhi is the biggest wholesale market for broiler. Everyday thousands of broilers are auctioned. Although from surface it seems it is a competitive market, in actual practice there are very few traders in this market. They have formed a strong cartel and dictate wholesale prices. Delhi’s price remains prevalent in small wholesale markets in North India. Almost a similar market price structure exists in Mumbai. Local newspapers, in Mumbai, publish these prices daily. This published price has great influence in deciding wholesale and producer prices in nearby areas of Mumbai. Integrators are also trying to have an impact on wholesale prices in Mumbai.
The poultry industry, on the whole, has been facing a difficult situation for the past two to three years due to unremunerative price for the end products (eggs and broilers) on the one hand, and unprecedented increase in the cost of essential feed ingredients (maize) on the other. Between 1997-98 and 1998-99 the price of maize, for instance, has shot up by 42 per cent, but the price of eggs has gone down by 5 per cent while that of broiler has gone up by 5 per cent.
Emergence of integrators
Scale is one of the most important factors in the cost of production of a broiler. Although, India has not globally integrated with the world (particularly in this sector), size of poultry farms has significantly increased during last one decade or so. Cost seems to be one of the main factors for the emergence of integrators in recent past (say 5-6 years). Some factors which has led to the emergence of integrators are:
(i) Reduction in the margin cost at various stages of marketing
(ii) Unlike other agriculture products, Indian poultry is taxed at different stages of production. Integrators do not have to pay those taxes. For example, some state governments impose a tax of 2 per cent on sale of poultry feed. An integrator, producing both feed and other products, does not have to pay these taxes.
(iii) Contract farmers, who are an important component in the production process. A number of small and medium farmers have started working as contract farmers, because they get fixed return and their risk gets reduced.
(iv) Opening of the Indian market to foreign suppliers.
In the pre-reform period (pre-90s), India’s trade policy was complex and cumbersome. There were different types of import licences, alternate ways of importing, different categories of importers, etc. Imports of almost all commodities and goods, except especially permitted (sometime called commodities under the Open General Licence), were restricted and could be imported only against a licence. Items that can be imported under the open general licence are sometimes called free. In the pre-reform period the number of goods and commodities falling in the open general licence category was less than 10 per cent of all commodities/lines.
In the post-reform period, the coverage of open general licence has been enhanced. India has been consistently removing its quantitative restriction (QRs) for last couple of years. Although dismantling of QRs was started by India on unilateral basis during the mid 90s, most of the QR removals during 1997-2001 were due to dispute settlement proceedings of WTO.[77] The QRs of agricultural commodities (including poultry products) have been removed only in last two or three years.
In GATT, it had been decided to remove all types of QRs. India had also agreed to phase out its QRs on all commodities, except around 600 commodity/lines for reasons related to security, environment, health, etc.[78] under Articles XX and XXI of the UR agreement. However, India maintained QRs on imports of almost all items under provisions of Article XVIII:B of the Uruguay Round Agreement. This article recognizes that member countries, whose economies can only support lower standard of living and are in the earlier stages of development, may apply quantitative restrictions for balance of payments (BoP) position. The article relating to BoP mentions that a member country has to announce publicly a time-schedule for elimination of QRs. Keeping this factor in view, the US filed a dispute against India. A panel was constituted in November 1997 to examine the US allegation that the continued maintenance of QRs on India’s imports was inconsistent with the India’s obligations under the WTO agreement. The Appellate body of WTO,[79] recommended that Indian QRs are inconsistent with articles of GATT. Keeping this factor in view, India and US signed a mutual agreement,[80] on December 28, 1999, which ended the dispute between the two countries on earlier phase out of QRs. In this agreement, India had agreed to lift QRs for all items by April 1, 2001.
In this context, it should be remembered that though reduction in tariff rates was started in the early 90s on unilateral basis, there has been no significant decline in India’s applied rates after their levels were brought close to the bound levels for industrial products.
Tariff rates of poultry products
The basic custom (import) tariff rates of different products of the poultry sector for the financial years of 1999/2000 were in the range of 15 per cent (of meat and edible offal) to 40 per cent (of live poultry and food preparations of poultry products). During the same financial year, tariff rate of ‘maize for use for poultry feed’ was 0 per cent, which increased to 70 per cent in the budget proposals of 2000/1. However, the tariff rate had been declined to 15 per cent, with the adoption of the tariff-quota regime. All other products of the poultry sector attracted the tariff rate of 30-35 per cent[81] during last three years because QRs of these items were removed. The import policies of 2000/1 and 2001/2 have already removed QRs on all poultry products. Most of these products were ‘restricted items’ before 1999/2000.
After the removal of QRs of these items, tariff rate will be the most important instrument in India’s import policy. In the budget proposals for 2000/1, the government had announced 35 per cent tariff rate for items of the poultry sector (and items of other sectors) who’s QR was removed. It is very difficult to understand that tariff-equivalence of QRs for all the items are 35 per cent if the government wants to keep the same level of protection. It seems that the government considered this situation and revised tariff rates from the level of 35 per cent to 100 per cent for two processed commodities of the poultry sector[82]: HS 1601.00 (sausages and similar products of meat, meat offal, food preparations based on these products) and HS 1602.32 (other prepared or preserved meat of fowls of species; of poultry products). This leaves us to conclude that either (i) the government believes that the tariff-equivalence of most of poultry products is close to 35 per cent, or (ii) the government wants to restrict the import of products of these two commodity groups by protection through high tariff (100 per cent). This commodity group contains a large number of prepared and preserved meat. It is very difficult to believe that the tariff-equivalence of commodity groups defined by HS 1601.00 and HS 1602.32 is 100 per cent, while the tariff-equivalence of a very similar commodity group defined by HS 1602.39 (other prepared or preserved meat, meat offal or blood; other than turkey or of fowls of the species Gallus domestics, of poultry heading no. 0105) is 35 per cent.
In the Uruguay Round, a large number of countries fixed the level of tariff bindings, after estimating tariff-equivalence of QRs. India (and a large number of other developing countries) fixed the bound rates without examining their detailed implications. It was mostly because a large number of India’s imported commodities were subject to QRs. Hence, one could say that the binding rates for a large number of commodities were not appropriate (or tariff-equivalence of QRs). The binding rates for different commodities of the poultry sector are given in Table 26.
The Uruguay Round final binding rate for live birds and poultry products (including chicken, whole or cut-up pieces; fresh, chilled or frozen) is 100 per cent, while the binding rate of eggs and processed egg/poultry products is 150 per cent. However there are many exceptions, as shown in Table 26. The binding rate of frozen whole chicken (HS 0207.12) is 35 per cent. Similarly the binding rate of some products of processed poultry is around 55 per cent as shown in this table. This was owing to commitments made by India in the earlier rounds (earlier than the Uruguay Round) of negotiations. As a part of earlier commitments, the binding rate for maize (and a number of other agriculture products) was zero.
Table 26: India: MFN Tariffs and UR Bound Rates for Poultry Products
|
Harmonized System (Commodity Groups) |
India’s Import Policy |
UR Final Bound |
|||
|
HS Codea |
HS Description |
1999/00 |
2000/01& 2001/02 |
2002/03 |
|
|
Tariff Rate b |
Tariff Rateb |
Tariff Rateb |
Ratec |
||
|
01.02 |
Live bovine animals |
||||
|
0102.10 |
Pure-bred breeding animals |
40 |
35 |
30 |
100 |
|
Ex 0102.10 |
Cows, heifers, bulls, goats, sheep, and pureline poultry stock |
5 |
5 |
5 |
100 |
|
0102.90 |
Other |
40 |
35 |
30 |
100 |
|
Ex 0102.90 |
Grand Parent Poultry Stock and donkey stallions |
25 |
25 |
25 |
100 |
|
01.05 |
Live poultry, that is to say, fowls of the species Gallus domesticus, ducks, geese, turkeys and guinea fowls |
||||
|
0105.11 |
Fowls of the species Gallus domesticus; weighing not more than 185 g |
40 |
351 |
30 |
100 |
|
0105.12 |
Turkeys; Weighing not more than 185g |
40 |
35 |
30 |
100 |
|
0105.19 |
Other; Weighing not more than 185 g |
40 |
35 |
30 |
100 |
|
0105.92 |
Fowls of the species Gallus domesticus, weighing not more than 2000 g; other |
40 |
35 |
30 |
100 |
|
0105.93 |
Fowls of the species Gallus domesticus, weighing more than 2,000 g; other |
40 |
35 |
30 |
100 |
|
0105.99 |
Other; other than weighing not more than 185 g |
40 |
35 |
30 |
100 |
|
02.07 |
Meat, and edible offal, of the poultry of heading 01.05, fresh, chilled or frozen |
||||
|
0207.11 |
Not cut in pieces, fresh or chilled; Of fowls of the species Gallus domesticus |
15 |
35 |
30 |
100 |
|
0207.12 |
Not cut in pieces, frozen; Of fowls of the species Gallus domesticus |
15 |
35 |
30 |
352 |
|
0207.13 |
Cuts and offal, fresh or chilled; Of fowls of the species Gallus domesticus |
15 |
100 |
100 |
100 |
|
0207.14 |
Cuts and offal, frozen; Of fowls of the species Gallus domesticus |
15 |
100 |
100 |
100 |
|
0207.24 |
Not cut in pieces, fresh or chilled; Of turkeys |
15 |
35 |
30 |
100 |
|
0207.25 |
Not cut in pieces, frozen; Of turkeys |
15 |
35 |
30 |
100 |
|
0207.26 |
Cuts and offal, fresh or chilled; Of turkeys |
15 |
35 |
30 |
100 |
|
0207.27 |
Cuts and offal, frozen; Of turkeys |
15 |
35 |
30 |
100 |
|
0207.32 |
Not cut in pieces, fresh or chilled; Of ducks, geese or guinea fowls |
15 |
35 |
30 |
100 |
|
0207.33 |
Not cut in pieces, frozen; Of ducks, geese or guinea fowls |
15 |
35 |
30 |
100 |
|
Ex 0207.34 |
Fatty livers, fresh or chilled; Of ducks, geese |
15 |
35 |
30 |
352 |
|
Ex 0207.34 |
Not cut in pieces, frozen, of guinea fowl |
15 |
35 |
30 |
100 |
|
0207.35 |
Other, fresh or chilled; ducks, geese or guinea fowls |
15 |
35 |
30 |
100 |
|
0207.36 |
Other, frozen; Of ducks, geese or guinea fowls |
15 |
35 |
30 |
100 |
|
04.07 |
Birds’ eggs, in shell, fresh, preserved or cooked |
||||
|
040700.01 |
Of the species Gallus dom. and ducks for hatching |
35 |
35 |
30 |
150 |
|
040700.02 |
Birds’ eggs, in shell, fresh other than for hatching |
35 |
35 |
30 |
150 |
|
040700.09 |
Other |
35 |
35 |
30 |
150 |
|
04.08 |
Birds’ eggs, not in shell, and egg yolks, fresh, dried, cooked by steaming or by boiling in water, molded, frozen or otherwise preserved, whether or not containing added sugar or other sweetening matter |
||||
|
0408.11 |
Egg yolks: Dried |
35 |
35 |
30 |
150 |
|
0408.19 |
Egg yolks: other |
35 |
35 |
30 |
150 |
|
0408.91 |
Other than Egg Yolks: Dried |
35 |
35 |
30 |
150 |
|
0408.99 |
Other than Egg Yolks: other |
35 |
35 |
30 |
150 |
|
10.05 |
Maize (Corn) |
|
|
|
|
|
10059000.1 |
Maize for use for poultry or animal feed |
0 |
0 and 15/50 |
15/50 and 15/50 |
15/60* |
|
1601.00 |
Sausages & similar Products, of meat, meat offal or blood; food preparations based on these products |
40 |
100 |
100 |
150 |
|
16.02 |
Other prepared or preserved meat, meat or blood |
||||
|
1602.10 |
Homogenized preparations |
40 |
35 |
30 |
552 |
|
1602.20 |
Of liver of any animal |
40 |
35 |
30 |
150 |
|
1602.31 |
Of turkeys; of poultry of heading No. 01.05 |
40 |
35 |
30 |
150 |
|
1602.32 |
Of fowls of the species; of poultry of head no. 01.05 |
40 |
1004 |
100 |
150 |
|
1602.39 |
Other, of poultry of heading no. 01.05 |
40 |
35 |
30 |
150 |
|
1602.41 |
Of swine, Hams and cuts thereof |
40 |
35 |
30 |
552 |
|
1602.42 |
Of swine, Shoulders and cuts thereof |
40 |
35 |
30 |
552 |
|
1602.49 |
Of swine; Other, including mixtures |
40 |
35 |
30 |
150 |
|
1602.50 |
Of bovine animals |
40 |
35 |
30 |
150 |
|
1602.90 |
Other, including preparations of blood of any animal |
40 |
35 |
30 |
150 |
a. The commodity groups defined by the Harmonized System of Indian Trade Classification (HS-ITC), in 1999/2000.
b. These rates represent the Most Favored Nation (MFN) tariff rates defined as the Basic Custom Duty (ad valorem) in Indian custom classification. The different types of exemptions are not taken into consideration to work out the tariff rates.
c. The Uruguay Round final bound rates. The definition of HS Codes for some items was different during the year of UR commitments. The final bound rates are worked out after making correspondence between the custom classification (HS) of the Uruguay round negotiation period (1992) and custom classification (HS) of 1999/2000, 2000/1 and 2001/2.
* India has successfully re-negotiated raising bound import duty on a range of agriculture items, including maize, with ‘principal supplying interests’ like US, EU, Canada, Australia and New Zealand.
1 The basic custom duty of Grand Parent Poultry Stock is 25 per cent instead of 30 per cent
2 Commitments for these items were made in earlier rounds.
Sources:
(i) WTO, Country Tariff Schedule of India, 1995.
(ii) Government of India, Custom Tariff of India 1999/2000, 2000/2001, 2001/2002, 2002/2003.
Implication for the poultry sector
There has been some discussion on the underlying effects of trade liberalization. What can be said from this discussion is that it will not be easy for local industry to survive in the new trade environment. The domestic industry is definitely price competitive in eggs and to some extent in broilers. However, since countries like EU and US tend to subsidize its production/exports, the domestic industry is at a price disadvantage. This situation may lead to reckless cheap imports. It may also result in an erosion of the genetic base, and the country may be dependent completely on imports.
Credit is available from commercial banks, but the rate of interest is still very high compared to developed countries. The interest rate commonly applied in India is 12.5 per cent for priority sectors, which also include poultry, as compared to 3.5 to 4 per cent in US and other developed countries. Again, it is easier for the bigger units to procure credit from commercial banks than for small and marginal farmers because the latter has to give collateral guaranty, which is quite difficult for them. A number of units[83] have raised credit from the capital market.
There is no institution/infrastructure available for adopting clean technology in the country. However, poultry units particularly eggs processing plants and chicken processing plants have to adopt technology and systems like HACCP so as to be at par with international standards. The government of India through the Indian Renewable Energy Development Authority (IREDA) offers loans at concessional terms for generation of clean power through renewable energy sources, but this cannot be called an incentive. A large number of centre/state governments provide financial assistance for effluent treatment plants. The Department of Environment and centre/state pollution control boards conduct regular checks on the units to control pollution and keep them within the permissible limits.
Some of the units engaged in poultry equipment manufacturing (which is a part of the poultry sector) have gone for ISO 9000, and some laboratories dealing with diagnostic and research activities in poultry are trying to get accredition under ISO 14000. The concerned departments of environment regularly conduct environment audits to see that the system is in place and no violation is taking place.
In this context, it is worth mentioning that the countries, under the WTO framework have started negotiations for zero tariffs for international trade of equipments relating to clean technology under ‘market access for environmental goods and services’. India is actively participating in this negotiation and it is expected that it will be concluded soon. The conclusions of this agreement will lead India to import machinery and equipments at zero tariffs as compared to the present level of around 25 per cent.
Indian poultry processing units particularly, in those processing chicken are looking for newer technologies adopted by the processing plants in Europe and US. Similarly, newer technologies for transportation, handling, and stunning the birds will be developed in the next few years. As the processing sector picks up, newer technologies in terms of further processing, introduction of newer products, and marketing them extensively will also be new developments in the poultry sector.
On June 12, 2000, the Union Ministry of Finance had notified a duty rate of 15 per cent on imports of corn for the first 3,50,000 tonnes and for quantities above that, the duty rate would be 50 per cent. This Tariff Rate Quota (TRQ) is in consonance with the WTO Article XXVIII, and the negotiations initiated between India and its principal trading partners (in 2000) whereby duty rates have been lowered for some items and hiked for others with a TRQ thrown in.
During 1999/2000, India has successfully renegotiated the binding rates under the WTO framework on maize and some other agriculture products with its principal supplying interests. The negotiations have been conducted mainly for those agriculture commodities whose bindings have been made at rounds earlier than the Uruguay Round. Under Article XXVIII of GATT, India had agreed to keep its import duty on some agriculture items at 0 per cent, as India was a food deficit country when the pact was signed. India had not bothered to change the rate of these commodities in the Uruguay Round, probably because it was following the QR regime. The renegotiated agreement would enable the country to change the import duty on 17 items such as sorghum, jawar[84], maize, rice, spilt wheat, skimmed milk powder, etc. The deal was a part of a trade-off with agriculture exporting countries under which India has given more access on other items by decline/restructure in tariff bindings like groundnut oil (or developed countries would be allowed to raise their bound tariffs on certain items). India had to begin renegotiations of the bound rates with principal suppliers of the commodities in the light of removal of QRs. It began bilateral negotiations with principal supplying countries of WTO, following sharp increase in import of skimmed milk powder, which was estimated to be around 18000 tonnes between April and October 1999, as compared to import of 2000-3000 tonnes during the same period in 1998. As a part of these renegotiations, India will impose a custom duty of 15 per cent on import of skimmed milk/whole milk up to 10000 tonnes under the tariff-quota deal. Imports above 10000 tonnes would attract a 60 per cent duty. Similarly, the bound rate for in-quota of maize is 15 per cent up to 3,50,000 metric tonnes, while the corresponding rate for out-quota is 60 per cent.
Since this liberalization of corn imports in April 2000, domestic prices of corn have ruled much easier in 1998-99.[85] However, demand for corn by poultry is expected to increase by 5 lakh tonnes per year, and consequently imports are expected to play a larger role in the coming years.
In the medium to short run, domestic price of maize will be close to (or higher by 15 per cent) international price till imports are carried out through in-quota tariff rate. When, India’s demand for maize will significantly increase, India will have to import maize with out-quota tariff. Under the WTO commitment, India cannot increase in-quota tariff above 15 per cent and out-quota tariff above 60 per cent. In short we can say that the price of maize, in medium to long run, will depend on (i) level of applied tariffs (if applied rates are close to WTO commitment, domestic price will be significant higher than international price), and (ii) level of domestic production of maize. Domestic production will not increase unless producers get remunerative prices. At present the yield of maize is significantly low in India, as compared to other countries. However some commercial crops in UP have shown around 50 per cent higher yields as compared to India’s present average levels.
Keeping these factors in view one can say that there will be pressure on (i) government to reduce applied tariff rates of maize by the poultry sector, and (ii) farmers to use high yielding varieties to enhance productivity. Farmers may not shift to this crop unless they get reasonable return.
As mentioned earlier there are a numbers of agents in the present marketing structure. Table 26 shows a typical example of marketing agents and amount of margins received by them. The number of marketing agents and amount of margins vary from region to region it also depends on scale of production, etc. It has been noticed that the variable cost[86] of production of broilers in north India is relatively high compared to the production cost in other regions; the margins are also high in north India compared to south and west India.
It is also being noticed that the emergence of integrators may lead to lower cost and lower margins. Retailer - wholesaler margins are getting reduced due to the emergence of integrators in select markets like Mumbai and Coimbatore. One should test the following hypotheses using detailed investigation:
H1: Whether integration leads to emergence of lower margins.
H2: Whether integration leads to emergence of lower cost.
H3: Whether integration leads to emergence of small and medium farmers as contract farming.
Today, the world population is just over six billion people. By 2020, it is predicted that 7.5 billion people will inhabit the world. Despite a trend of staying away from meat in richer countries, these people will want to eat meat. By 2020, the world population is predicted to be eating 327 million tonnes of meat. The outlook for poultry meat appears to be most favourable among different types of meat, with all market fundamentals expected to demonstrate strong growth. World production, consumption, and trade are all seen by most international organizations to accelerate during the current decade. For instance, the USDA and FAPRI foresee an annual growth of 2.8 and 3.6 per cent in production and consumption. Most of this growth is expected to originate in non-OECD countries. Lower price of poultry meat relative to the price of other meats, combined with rising income and changing food habits in most of these countries is expected to strengthen the demand for meat. Therefore, in many countries with a relatively low per capita consumption (China, East Europe, etc.) the expected economic improvement should first favour the poultry sector.
The developing world including India will consume the majority of this extra meat. In 1997, the developing world consumed 111 million tonnes[87] of meat and it has been predicted that by 2020 the developing world would eat 230 million tonnes of meat. Poultry will continue its dominance accounting for 40% per cent of the meat eaten and India will not be any exception to this. Indian population in 2020 would be around 1350 million and this huge population needs to be fed. The poultry sector in India will witness drastic changes in terms of structure, poultry production, and processing in the next 20 years. In terms of structure the farm size will increase and we will witness bigger farms having their own breeding farms, feed mills, hatcheries, and processing units. The small units may exist in the short term but as the bigger integrators emerge the smaller units will cease to exist. This will also be hastened by the fact that the margins in the smaller farms will be on the decreasing trend, as the cost of production will increase with the increase in feed ingredients cost. The larger units will be able to survive because of their huge size and efficiency in production and overheads. Similarly, broiler farms will emerge from 1000 to 2000 per week cycle to 100,000 to 500,000 per week cycle supported by similar capacity processing plants having automation in all spheres of processing.
There will also be a role, which can be foreseen for genetically modified crops like maize and Soya. These crops will be the two very strong pillars to provide support to the poultry industry for its rapid growth. It is also expected that large investments will also flow into infrastructure development for production, processing, cold chain management, and marketing of poultry products. Virtually there will be a sea change in the marketing and cold chain facilities adopted for poultry products, which will be a very important factor to sustain the rapid growth in this sector. This will also lead to fundamental changes in the food retailing and particularly of poultry products retailing. We can foresee supermarkets along with corner stores emerging in the next 20 years. Increased pressures for supplies on food retailers and the chain reaction to the commodity raw materials will lead to structural changes in the whole supply chains and self-services related with the food chain. We will witness de-verticalization meaning a complete separation between processing and marketing activities in the chain as being now witnessed in some of the developed countries. There will be an increased availability of store brands or private label products, at times, produced under contract by the same companies that produced leading and well-known food brands taking into consideration the global markets and the international trade in poultry.
The progress in information technology will become part of everyday life. This will also help in shortening the distances for communication. The poultry meat retail business and suppliers will face a tremendous challenge to redefine their strategies for profitability and growth for future. Understanding the dynamics of consumer landscape will be a major factor for the companies to exert their competitiveness in the long run. Accordingly, the consumer market in this context will also change from simple to complex and according to different regions in the country. There will be consumers with high per capita income and there will be consumers with average and low incomes. At the same time, we may witness migration from rural to urban areas and the consumer profile will also change with the migration. Similarly, food consumption patterns for emerging economies like India will also change. But we may have some ethnic sub-groups who will exist in some eastern parts of the country or in some other far-flung areas that will have their own requirements as consumers. All this put together will have diverse consumer characteristics that will offer tremendous opportunities for the poultry sector through market segmentation. The difference in consumer characteristics will have to be matched by suppliers all along the value chain. They will have to take into consideration the historical, cultural progress, employment patterns, dominating food consumption patterns such as home food or prepared food with ingredients versus eating away from home. However, consumers will look for quality, variety, freshness, safety, and convenience. Consumers will be increasingly less willing to pay the price premium for all the qualitative characters, as they will consider it their right. Therefore, it can be foreseen that not only the retail sector will be consolidating but it will also be more global and internationalized. The time is not far off when bigger companies like Wal-mart in US, and European retailers like Ahold and Carrefour will also show their presence in India. However, many national and regional food retail suppliers within the national boundaries will also play an important role and will add value as domestic food retailers in collaborating with the international chains. In either case consolidation will continue to be the primary characteristics of food retailing and it will be the desire of these retailers to deal with a handful of suppliers in each category, which will increasingly help in consolidating the food value chain. This would, in turn, suggest an investment strategy that would position firms along the value chain to be in the top tier amongst segment competitors whereby the firm has focused on investments to leverage know how, captured economies of scale, and focused on long term assets components of the balance sheets because coordinating between the leading international food retailer and the chosen few is easy. Temporarily food retailers may experience declining sales and lower retails and in that scenario it is very likely that they will tend to pass on to their suppliers, the increasing pressure from stock retailers by extending their payment terms and conditions. Thus, the market will also witness a power struggle along with the value chain between food retailers and food manufacturers, food manufacturers and primary processors, and primary processors and farmers, as adequate maintaining will become more intense. Poultry retailers through intelligent management of their private labels will satisfy consumers and are likely to expand their presence in the food-manufacturing segment.
Temporarily while wet market will continue to play a role in remote and far-flung areas, retail chain stores in all form, big and small, will notably increase their importance. At the same time, the consolidation will continue among the retail chains and corner stores adding pressure to shake out winners and losers in food retailing as well as food manufacturing. The fact remains that consumers will be the kings and they will wakeup to their rights for claiming and wanting wholesome food and value for their money. At the same time, heterogeneity of characteristics of consumers in different regions and far-flung regions of the country in India would also mean that there are many options for food manufacturing companies to diversify in different consumer markets. Internationalization of the food retail business is going to be witnessed as the consumer delivers the message that he is the king. Each player in the food value chain manufacturer, supplier and retailer - will have to expand the box and formulate his strategies from being so inwardly focused.
In the next 20 years, the poultry sector is going to be concerned about food safety, animal welfare, food grade antibiotics, waste disposal, and environmental management. These factors will become basic to the fabric of poultry production in all phases of pullet, breeder, hatchery, broiler, feed mill, processing and cold chain. Technical aspects of broiler rearing like genetic package, environmental needs of the birds, management at the farm level, data collection, analyses, and education and human resources will continue to play their role. Looking into the future, however, it is evident that the efficiency of broiler when compared to all other meat animals for conservation of feed grains to animal edible protein presents production advantage where grain yield and water shortages are identified as significant factors for utilization of most of the grains in efficient way. The industry will make enormous progress in the next 20 years with regard to genetics, nutrition, housing, equipment, health, disease surveillance, diagnosis, and consumer acceptance. Along with this will be the challenges and opportunities which will be reflected in management skills, survival, and profitability of the industry as poultry meat will be poised to be the “Meat of Choice” not only in India but globally. Environmentally, the broiler industry will look for environment protection, environmentally free water, air and integrated health programmes. These needs of the industry appear simple, however, when we will be targeting millions of broilers on continuous basis under a variety of conditions in a typically integrated commercial complex, their implementation will become an increasingly challenging job. A typical integrated complex that places one million broilers per week will require 500 broiler houses along with variety of facilities, equipment, energy, and human power. The super seven management factors like facility, equipment, food and water, temperature, air quality, litter quality, sanitation and body maintenance are inter-related, inseparable and apply to broiler grown anywhere in the world. So these factors will be basic in the commercial broiler production system.
Operational factors like mechanical capabilities, basic concepts in ventilation, air quality, high temperature, hot winds, cold winds, relative humidity, and other biological principles will have to be controlled. Sophisticated computerized equipment for feed and water, incubation systems and monitoring environment will become commonplace in the industry. The broiler industry will be characterized as brutally competitive, innovative, customer focused, and generally profitable. The sector will be blessed with an extraordinary array of genetics in the avian species with technical expertise required. In one phrase, vertically integrated poultry operations will have to focus on optimizing performance. We conclude that the commercial broiler industry in the next 20 years will produce the “meat of choice” on global basis.
Some companies will identify, assess and implement a combination of genetics, facilities, and programmes that will optimize broiler performance and some will not. Such assessment would likely be a dynamic mixture of science based information, technology transfer and implementation, and continual assessment. It can be envisaged that broiler production will consist of teams of avian biologists, engineers, economists, statistician, food safety specialists, marketers, business administrators, and educators. Each one of them will address both immediate and long-term plan and their implementation. However, all these predictions depend on a variety of factors.
A recent study by CII and Mckinsey (1998) reports a large untapped potential for the poultry sector. According to the report, the poultry sector has potential to grow at 20 per cent per annum over the next 10 years. The study also sets a target of achieving a size of Rs.300 billion by 2005. Here are some excerpts from the report:
“The poultry sector in India has a potential to grow by 20 per cent a year over the next three years. This will enable it to quadruple in size growing from Rs.7.5 billion[88] to approximately Rs.30 billion (in real terms) by 2005. The major driver for overall poultry demand is increasing consumer incomes and the high-income elasticity of poultry consumption. Demand for high quality processed poultry will be driven by retailers and should grow very rapidly.
The demand for poultry has the potential to quadruple from 1.4 million tonnes today to at least 6 million tonnes by 2005. This growth rate of over 20 percent CAGR[89] is considerably higher than the 13% CAGR witnessed in India since 1980. Even this growth rate will nowhere begin to saturate demand. The demand potential in this sector is immense.”
“Apart from the general wet market demand for poultry, high quality processed chicken is also poised to take off as food retailers enter the market, growing at a rate faster than the rise in general demand. From today’s level of just 1 per cent of chicken consumption, processed chicken is expected to grow by more than 10 times over the next decade to reach as high as proportion of 10 to 15 per cent of total consumption by 2005”.
“As poultry players get increasingly cost conscious, faster integration of the industry can be expected. Integration will help the players’ aggregate margin, increase control on quality and bio-security, and achieve economies of scale. As in other markets, the integration process will include hatching, feed growing and production, managing farmers, and processing and distribution, but not necessarily breeding. Breeding will become the province of specialist players, who will supply on a contract basis to the processors.”
As detailed above, the small-scale sector will slowly cease to exist as it will either merge with bigger integrators or would hire out its facilities to bigger farmers. Similarly, the marketing structure will see a sea-change as the broiler produced will not come to the mandies (wholesale markets) like Gazipur (in Delhi) but will be taken by the bigger integrators and processors directly from farms. With processing facilities increasing all over the country in major pockets, marketing of live chicken will decrease and processed chicken will increase. This will result in diminishing role for the traders in different categories. As the concept of frozen chicken picks up the live market will remain in few corners and regions of the country which frozen retailers will not be able to reach.
Poultry meat exports reached an all time high of around 7,545,000 tonnes in 2001, which is a phenomenal increase over the 1990 figure of 2,496,000 tonnes (Figure 10). Nearly 38 per cent of it came from one country, i.e. the United States. The second largest exporter of poultry meat was Brazil, accounting for 13 per cent of world trade. Next in the order came Hong Kong with share of 11 per cent, followed by France (10 per cent) and Netherlands (8 per cent), as shown in Figure 11.
Figure 10: World Poultry Meat Export
Where are these exports of poultry meat going? The biggest market is Hong Kong, which accounts for about 15 per cent of world imports of poultry meat. Next comes China, which accounts for 12 per cent. Then comes Japan (8 per cent) followed by Saudi Arabia (5 per cent), and Mexico (4.8 per cent). Table 27 gives details.
Figure 11: Poultry Meat Exports by Countries
Table 27: Main Importing Countries (‘000 metric tons)
|
|
1995 |
2000 |
|
Mexico |
189 |
345 |
|
China |
263 |
877 |
|
Hong Kong |
688 |
1075 |
|
Japan |
549 |
584 |
|
Germany |
346 |
339 |
|
United Kingdom |
187 |
282 |
|
Saudi Arabia |
- |
362 |
At present, India’s exports and imports are negligible in spite of significant amount of production and consumption. Even conservative estimates show that India’s production/consumption of poultry meat may be close to that of Canada, the UK, or Mexico. India has huge export potential. To quote again from the CII and Mckinsey report, “The domestic markets are not the limit of potential in poultry. Once feed costs are lowered, Indian companies also have the potential to become large poultry exporters. Indian companies will have an inherent advantage because labour costs are a significant component of costs, accounting for at least 20 per cent of total costs of production in countries like US. The other two primary elements of cost (feed and DOCs) are very often similar in internationally competitive countries due to the increasingly global nature of technology and feed input technology”.[90]
Imports from countries like Thailand and Malaysia are becoming costlier. They are under pressure due to higher labour costs. Importing countries would than look to sources like India. India’s cost prices may be lower than that in a number of countries, but their markets are protected. A review of import policies of select countries leads to a firm conclusion. The member countries, particularly western countries, have adopted one or more instruments to protect their national interests such as producer’s interest, consumers’ interest, farmer’s interest, or implementation of ‘domestic policy objectives’. Some important instruments adopted by these countries are:
(i) Production subsidies
(ii) Export subsidies
(iii) Non-tariff measures
(iv) Special safeguard measure
(v) Tariff quota
India has not opted for any of these instruments in the Uruguay Round. It may have done so because (i) India’s imports were subject to different types of QRs, and (ii) India could negotiate for a relatively higher level of bound rates (for agriculture items). India’s export demand will also depend, to a large extent, on the outcome of on-going WTO negotiations.
India has huge potential in imports. After the removal of QRs in April 2001, India’s import has increased by more than 700 per cent. However, the amount of imports in total consumption is still negligible.
Traditionally, the broiler industry has concentrated on the optimization of parameters of growth rate, feed efficiency, and liveability. The increased consumer concern regarding quality and safety of food together with the rapid growth of HACCP approach to all phases of production will change the focus of the poultry producer in the coming decades. Increased consumer awareness in relation to nutrition and health will lead to growing demand for leaner meat. This will automatically open up tremendous opportunities for the poultry sector. If we are to optimize the production of high quality lean meat we will have to understand the manner in which birds require energy and nutrients for maintenance and growth of their tissues. For example bone, muscle, and fat have different rates of growth and maturation and the proportion of these tissues in the body of a chicken changes continuously as the bird grows. It is a relative proportion of these tissues, which determines the carcass value. Bone growth is very rapid during the first two weeks of life and then it slows down. Proper bone development is essential for the formation of skeletal structure that can adequately support the weight of the growing bird. But the components of the greatest commercial interest are muscle and fat. Muscle tissue consists predominantly of water and proteins with very small quantities of minerals, vitamins and fat. The bird has a predetermined genetic potential for the deposition of protein and fat. The challenge for the producer is to provide the environment, management and nutrition to allow the bird to express its genetic potential to full. In order to produce an ideal retail product required by the consumer it is essential that the producer have the knowledge of nutrients and energy requirements of the bird on each stage of growth. With this information there is an excellent scope for nutritional strategies to alter and optimize the carcass composition.
Similarly, amino acids play a vital and central role in the protein deposition and muscle tissue growth. Whilst under-feeding of amino acids is detrimental to growth, over-feeding results in excretion of excess nitrogen as uric acid that contributes to increased environmental ammonia levels. Therefore, the specification for amino acids should be based on specific economic objectives rather than traditional parameters. Minerals and vitamins are vital for optimum growth and development of immune system. Similarly, infectious diseases reduce growth and leave their impact on carcass quality. Consumers would like to know what has been fed to birds and in what conditions they have been produced. Therefore, manipulation of dietary nutrients for production of lean meat, as required by future consumers, will be necessary. Similarly, the consumer may require in future a carcass, which involves direct incorporation of nutrients such as omega-3 fatty acids, which protect against cardiovascular and inflammatory diseases in humans. The chicken is a natural choice for incorporation of Omega-3 fatty acids, which are absent in fish. This gives poultry producers an advantage in being completely tailoring their product to meet the demands of health conscious consumers. In summary, production of high quality retail products would require excellence and innovation in all parts of broiler chicken production chain from genetics to feeding, management, environment and health.
Women are engaged in the poultry sector as entrepreneurs in small numbers but as a work force in large numbers in western and southern India. They also own small and marginal farms in some far-flung and tribal areas. These farms may cease to exist with industrialization, as their margins will reduce dramatically over the years because of scale and size. Therefore, women employment may reduce if it is not replaced by employing similar number of women in industrialized poultry units.
Most of the poultry units in India are situated in rural areas or peripheral areas of small towns. However, live chickens are sold in markets from where they are brought by retailers. These small numbers are dressed by butchers cum retailers at their shops and materials like excreta, intestines, blood, etc. are thrown in the open or nearby dump yards. This leads to health hazards. But as expected that the broiler industry will grow big, and smaller farms will cease to exist and farmers will directly sell their produce to bigger integrators/processors. In this scenario small retailers of live birds will cease to exist and processed chicken will be sold through a network of retail, food stores or corner shops. On the one hand this will reduce the health and hygienic hazards as well as on the environment and would provide hygienically dressed chicken to consumers. But this may also lead to the displacement of small retailers of live birds unless and until they opt for keeping frozen chicken in their stores. Moreover, farms will have to adopt environmental friendly systems of poultry production. They will also have to face environment enthusiasts who have started raising their voice. This group will be more vocal in near future.
Major constraints affecting the poultry industry and relevant policy strategies are as follows:
Poor infrastructure: A major problem affecting the Indian policy industry is the lack of basic infrastructure - storage and transportation including cold chain. The result is wild price fluctuations. Hence there is an urgent need to improve infrastructure facilities. This will help not only stabilize the price of poultry products in the domestic market, but also make them available in far-flung areas.
Inefficient marketing system: Currently poultry products pass through various intermediaries before they reach the final consumer. The presence of so many intermediaries between the producer and the consumer harms the interest of both - the producer does not get remunerative price for his product, while the consumer pays high price because of the cascading of margins with so many intermediaries. A warranted step for the healthy growth of the industry is an efficient marketing channel that gives remunerative price to the producer. With the processing of chicken picking up, the marketing setup of the country should also grow on professional lines that may include the traditional channels of traders to some extent in the intervening period.
Feed resources: Feed constitutes 70-75 per cent of the cost of broilers and egg production. Therefore, if feed prices are sustained at some level throughout the year, prices of eggs and broilers will also remain at some level without much fluctuation. Maize or corn plays a major role in broiler production, as it constitutes 50-55 per cent of broiler feed. As the broiler industry is growing at 15 per cent per annum, demand for maize will also increase. Presently India grows only 11 million tonnes of maize and 5 million tonnes are available for the poultry sector, which may not be sufficient if the present growth rate has to be sustained. To increase maize production, we have to go for GMO varieties of seed, or alternatively find other source/types of feed ingredients, which can replace maize.
Disease control: With the expansion of the poultry industry and increased density, the risk factor involved with diseases is likely to increase. It is imperative that the country has a network of disease diagnostic centres along with national reference laboratories which can monitor and do surveillance work for disease control. The private sector is playing a key role in both establishing diagnostic centres and providing quality vaccines for the use of poultry farmers. These vaccines are produced as per international standards.
Health Certification: For ensuring safe food to the consumer, it is essential for the country to have standards in place for health and hygiene of the plant and products. Presently there is a multiplicity of agencies that are making standards and trying to implement them. Some of them are voluntary and some mandatory. The country needs a unified system of standardization where in food safety and health can ensure implementation of the good manufacturing process (GMP).
The Indian poultry sector has undergone a thorough transformation from backyard rearing to commercial farming in a short span of three decades. Poultry is today one of the fastest growing segments of the agricultural sector in India. While production of agricultural crops in the country has been growing at a rate of 1.5 to 2 per cent per annum during the last two decades, that of poultry has been rising fast - 6 to 7 per cent per annum in the case of eggs. India ranked fifth[91] in the world in egg production - 37000 million eggs in 2000. Similarly, India produced around 1000 million broilers last year. The number of broiler hatcheries too has grown: around 750 in the year 2000 against 77 in 1980. Capital investment in the poultry industry in 1999-2000 is estimated to be around Rs.130 billion, and the industry contributed Rs.102.34 billion to India’s gross domestic product during 1999-2000. The industry has also made significant progress in the areas of breeding, nutrition, management, and health care. Some of its major achievements include availability of several world known brands of commercial hybrid chicks,[92] essential equipment and machinery, medicines and vaccines, compounded poultry feed, disease diagnostic services, poultry training programme, and technical and skilled manpower. The industry can now be considered as self-sufficient to meet its requirements.
The industry is also poised for a dramatic growth in the next two decades. First, Indian population is projected to grow to 135 crores by 2020; with increasing scarcity of arable land and potable water, livestock and poultry are seen as the right answer to the ever increasing demand for high quality protein food for a nation characterized by malnutrition. Second, per capita consumption of egg and poultry is low, and with rising per capita income demand for poultry products is expected to grow. Third, there is already a marked shift from other meat types such as mutton and beef to poultry meat. Fourth, with the opening of the global market, India has tremendous scope to exploit the situation in its favour to achieve a respectable global position in poultry trade. All this provides the rationale for a substantial and sustained growth of poultry in the next two decades. A recent study entitled Food and Agriculture Integrated Development Action (FAIDA) by CII and Mckinsey (1998) projects a very bright future for the Indian poultry industry. According their evaluation, “the poultry sector in India has a potential to grow over 20 per cent a year over the next ten years. This will enable it to at least quadruple in size, growing from the present size of Rs.7500 crore[93] to approximately Rs.30,000 crore”[94]
The poultry industry in India is what it is because of its own concentrated efforts. In comparison to other livestock industries, the poultry industry in India is more scientific, better organized, and continuously progressing towards modernisation. It is going through a phase of integration in broiler, which is likely to change the face of the industry. There will be rapid changes towards integration as more farmers find it increasingly difficult to run farms with marginal profits or negative margins. The industry is modern, with pure-line breeding, latest vaccines, SPF eggs, veterinary healthcare products, state of the art processing units for eggs and chickens, the latest management practices, export of quality hatching eggs, etc. However, all is not well in the industry. Not all states/regions have been contributing to this effort. The four southern states and Maharashtra together contribute more than half of production of eggs. There are constraints and bottlenecks like high feed costs, lack of development of rural markets, seasonal/regional fluctuations in egg and meat prices, lack of cold storage facilities, etc. This paper is an attempt to probe deeply into these problems and challenges facing the industry. It attempts to describe the current status of the industry, identify problems and constraints facing the identity, trace future trends, and issues related to health and environment.
It is considered that the poultry sector in India, because of its nature, has basically grown with the enterprise of the private sector. However, some help has come from government also. The poultry sector is quite strong in terms of poultry production, i.e. number of hen house egg production per bird and FCR achieved in broilers. But the growth of Indian poultry processing sector will completely depend on the availability of feed ingredients like maize, soya, etc. in large quantities considering the fact that India grows around 10 to 11 million tonnes of maize only which is insufficient for the industry. Secondly, if these ingredients have to be made available genetically modified seeds will have to be introduced which will be another area of discussion and debate. Thirdly, the marketing structure including cold chain is very poor and does not have adequate strength in terms of infrastructure like good roads and electricity. This is another inhibiting factor for the growth of the poultry sector. Finally, the sector in the country as such is trying to integrate with global food safety, health, and hygiene systems that may need sometime and greater help in terms of human resources and training from USDA, FAO, Codex, etc. in the coming years. Food safety standards shall have to be also applied to the domestic sector, as there cannot be two standards -domestic and international - for food safety. Additionally, the issue of butchers who number in millions in the country will have to be addressed. They will be without a job if strict food safety standards are implemented. Similarly, the problems of small and marginal farmers who run their farms for food security and not completely on commercial lines will also have to be looked into. The following paragraphs contain some concluding remarks.
1. Consumption of animal foods is not widespread in India. Even consumption of egg is restricted to 22 per cent of the households in rural areas. All the states in South India, Assam and West Bengal and to some extent Maharastra exhibit high preference for eggs. Per capita consumption is very low in all the states except the four states in South India and three states in East India. Poultry products face stiff competition from goat meat. Growth in rural incomes has a higher impact on consumption than growth in urban incomes. The poor in rural as well as urban areas have high income as well as price elasticity of demand indicating that reduction in the price of poultry products and increase in the income of the poor are the most effective measurers for increasing consumption of poultry products.
2. Economic reforms initiated in the 90s have resulted in a shift from inward oriented policies of the past to an outward looking policy. This is certainly a major departure from a relatively protectionist policy pursued till mid-80s. At present, no industrial licensing is required for setting-up units in the poultry sector. Foreign investors now can actively participate in the sector. Poultry feeds are no longer restricted to production in the small-scale sector. For long, the domestic poultry industry has remained protected by non-tariff (quantitative restrictions) and tariff measures. However, the protected environment has recently been dismantled. The government under its scheme of phasing out all QRs has placed the entire range of poultry products in the category of open general license or sometimes called the free list. India had to do this, as per the dispute settlement proceedings of the WTO. The process of removal of QRs of the poultry sector began in 1995-96 and completed by April 2001.
Since the poultry sector is part of agriculture, India has made tariff commitments for all commodities of the poultry sector. The range of tariff binding rates varies from 35 to 150 per cent. The bound rate for a raw material of the poultry sector, i.e. maize, had been fixed at 0 per cent. India has successfully renegotiated, in early 2000, for raising the bound import duty (with tariff-quota regime) on maize with its ‘principal trading partners’. As part of its commitment, India cannot give export subsidy to its producers.
The impact of economic reforms has been noticed in the domestic poultry industry: (i) the size of operation of hatcheries has increased, (ii) a number of integrators have emerged, (iii) hatcheries and processing units have started raising finance from the capital market, (iv) a few processing units with up-to-date import technologies have emerged,[95] (v) the tax benefits[96] have been abolished, etc. However the impact of import liberalization has not seriously affected the industry because QRs in most of poultry products were abolished only in April 2001. After the removal of QRs, imports during 2001-02 have increased by more than 700 per cent. The integration of the domestic sector with the global economy will take few more years.
3. In the last 15 to 20 years the size of poultry farms has tremendously increased. In this process, many small farms have ceased to exist. They have proved to be inefficient for variety of reasons: (i) feed cost is relatively higher for small farmers because of the purchasing power of ingredients, (ii) veterinary care services, vaccines, etc. are expensive for small farms, (iii) transport costs for small farms are relatively higher than those for large farms, (iv) quality of feed (generally compound feed) may not be superior, (v) non-availability of credit, etc.
4. A decade or two ago, nobody talked about environment and other related issues. Today, people are becoming conscious of bio-security measures like clean air, ground water quality, wastage disposal and health hazards. Earlier the farms were managed by family and to a large extent by uneducated and unskilled laborers. The trend is changing. Most of the new poultry farms employ trained and skilled workers including semi-skilled laborers, supervisors, and trained farm managers. These changes in the management chain have affected farmers/farmers involved with this sector.
5. In the next decade, the poultry sector in India will witness drastic changes in terms of structure, production, and processing. The size of farms will increase, and they will have their own breeding farms, feed mills, hatcheries and processing units. Small units will cease to exist in the long run. We may witness genetically modified crops like maize, Soya, etc. Huge investment will also flow into infrastructure development, production, processing, cold-chain facilities and marketing. This may also lead to fundamental changes in food retailing, particularly of poultry products. We will witness complete separation between processing and marketing activities, with increasing availability of store brands. In the coming years, although wet markets will continue to operate in remote and far-flung areas, retail chain stores will noticeably increase their presence.
6. In the next decade, the Indian poultry sector will be concerned about health, food safety, animal welfare, waste disposal and environmental management. These factors will become important at different stages of poultry production like breeding, hatchery, broiler, feed-mills, processing, and cold-chain. The industry has to make enormous efforts with regard to genetics, nutrition, health, disease surveillance, diagnosis, and consumer acceptance. The broiler industry will have to look for environment protection, environmentally free water and air, and integrated health programme. On the surface all these seem simple but require tremendous efforts. It may be worth mentioning a few examples of failures where in spite of adopting environmentally controlled houses and supporting systems, the integrators had to close the units. They did not work in Indian conditions. Commercial broiler production has to adopt super seven management factors: facility, equipment, feed and water, temperature, air quality, litter quality, sanitation, and body maintenance.
The linear expenditure system (LES) model proposed by Stone (1954) is used to estimate a complete set of income and price elasticities. The model is estimated for nine commodity groups: 1) cereals and cereal products, 2) milk and milk products, 3) edible oils, 4) meat, fish and eggs, 5) sugar and gur, 6) other food, 7) fuel and light, 8) clothing and 9) other non-food. To overcome the unacceptable implication of linearity, the model is specified for four different expenditure groups separately so that linearity is implied only within each group. Expenditure groups are anchored to the poverty line. Taking the poverty line for each year, the very poor group is defined as the set of households whose per capita expenditure falls below 0.75 times the poverty line. The moderately poor group is one whose expenditure is above 0.75 times the poverty line, but below the poverty line. Households with expenditure above the poverty line, but less than 1.5 times the poverty line are designated as non-poor. The remaining households have expenditure more than 1.5 times the poverty line and they are designated as rich. Consumption data relating to 18 rounds of NSS from 1970-71 to 1998-99 have been used in estimating the model. Commodity prices have been constructed for this purpose separately for rural and urban areas using 1977-78 commodity weights derived from NSS 32nd round consumer expenditure survey data and the Economic Advisor’s Index Number of Wholesale Prices, various issues. Commodity prices are assumed to be the same for all the expenditure groups. The LES model is specified as
|
|
piqi = pici + bi (y - S ckpk) |
i=1,2,...n |
where y is total expenditure, pi and qi are price and quantity of i th commodity and bi and ci are parameters of the system. The parameter bi (=¶ piqi/¶ y) is called marginal budget share and ci is sometimes interpreted as committed quantities. The income and price elasticities can be derived as
hyi = bi/wi
hij = -dij + (dij - bi) pjcj/piqi
where dij =1 if i=j and zero otherwise.
The aggregate elasticities have also been computed using the formula
ei = Sc sic hcyi
eij = Sc sic hcij, c= 1,2,3,4 and i, j = 1, 2,...9
where ei and eij are the aggregate expenditure and price elasticities, sci is the share of cth expenditure class in the total consumption of i th commodity and hcyi and hcij denote the expenditure and price elasticities of cth expenditure class.
EXPENDITURE AND UNCOMPENSATED PRICE ELASTICITIES
|
ALL INDIA RURAL |
VERY POOR |
|||||||||
|
COMMODITY GROUP |
1 |
2 |
3 |
4 |
5 |
6 |
7 |
8 |
9 |
EXPENDTR |
|
1 CERL |
-.8396 |
.0202 |
-.0039 |
.0062 |
.0007 |
-.0138 |
-.0169 |
.0061 |
.0003 |
.8406 |
|
2 MILK |
-.1623 |
-1.5041 |
-.0079 |
.0126 |
.0013 |
-.0280 |
-.0344 |
.0124 |
.0007 |
1.7098 |
|
3 EOIL |
-.0961 |
.0244 |
-.9197 |
.0074 |
.0008 |
-.0166 |
-.0203 |
.0073 |
.0004 |
1.0124 |
|
4 MEAT |
-.1350 |
.0342 |
-.0066 |
-1.2750 |
.0011 |
-.0233 |
-.0286 |
.0103 |
.0006 |
1.4223 |
|
5 SUGR |
-.1082 |
.0274 |
-.0053 |
.0084 |
-1.0288 |
-.0186 |
-.0229 |
.0082 |
.0005 |
1.1392 |
|
6 O FD |
-.0962 |
.0244 |
-.0047 |
.0074 |
.0008 |
-.9322 |
-.0204 |
.0073 |
.0004 |
1.0131 |
|
7 FUEL |
-.0830 |
.0210 |
-.0040 |
.0064 |
.0007 |
-.0143 |
-.8075 |
.0063 |
.0003 |
.8740 |
|
8 CLTH |
-.1537 |
.0390 |
-.0075 |
.0119 |
.0013 |
-.0265 |
-.0325 |
-1.4511 |
.0006 |
1.6185 |
|
9 ONFD |
-.1053 |
.0267 |
-.0051 |
.0081 |
.0009 |
-.0181 |
-.0223 |
.0080 |
-1.0022 |
1.1094 |
EXPENDITURE AND UNCOMPENSATED PRICE ELASTICITIES
|
ALL INDIA RURAL |
MODERATELY POOR |
|||||||||
|
COMMODITY GROUP |
1 |
2 |
3 |
4 |
5 |
6 |
7 |
8 |
9 |
EXPENDTR |
|
1 CERL |
-.3576 |
.0186 |
-.0045 |
.0039 |
-.0009 |
-.0109 |
-.0058 |
.0066 |
.0181 |
.3324 |
|
2 MILK |
-.5488 |
-1.7104 |
-.0300 |
.0257 |
-.0058 |
-.0724 |
-.0385 |
.0440 |
.1209 |
2.2153 |
|
3 EOIL |
-.2204 |
.0498 |
-.7488 |
.0103 |
-.0023 |
-.0291 |
-.0155 |
.0177 |
.0486 |
.8896 |
|
4 MEAT |
-.4155 |
.0940 |
-.0227 |
-1.3696 |
-.0044 |
-.0549 |
-.0292 |
.0333 |
.0916 |
1.6774 |
|
5 SUGR |
-.2713 |
.0614 |
-.0148 |
.0127 |
-.9099 |
-.0358 |
-.0190 |
.0218 |
.0598 |
1.0953 |
|
6 O FD |
-.2488 |
.0563 |
-.0136 |
.0117 |
-.0026 |
-.8647 |
-.0175 |
.0200 |
.0548 |
1.0045 |
|
7 FUEL |
-.2368 |
.0535 |
-.0130 |
.0111 |
-.0025 |
-.0313 |
-.8081 |
.0190 |
.0522 |
.9558 |
|
8 CLTH |
-.5398 |
.1221 |
-.0295 |
.0253 |
-.0057 |
-.0713 |
-.0379 |
-1.7613 |
.1190 |
2.1792 |
|
9 ONFD |
-.3902 |
.0882 |
-.0214 |
.0183 |
-.0041 |
-.0515 |
-.0274 |
.0313 |
-1.2184 |
1.5751 |
EXPENDITURE AND UNCOMPENSATED PRICE ELASTICITIES
|
ALL INDIA RURAL |
NON-POOR |
|||||||||
|
COMMODITY GROUP |
1 |
2 |
3 |
4 |
5 |
6 |
7 |
8 |
9 |
EXPENDTR |
|
1 CERL |
-.1641 |
.0036 |
-.0036 |
-.0011 |
-.0012 |
-.0154 |
-.0040 |
.0047 |
.0002 |
.1808 |
|
2 MILK |
-.4603 |
-1.1774 |
-.0365 |
-.0111 |
-.0124 |
-.1568 |
-.0410 |
.0483 |
.0025 |
1.8447 |
|
3 EOIL |
-.2227 |
.0179 |
-.6053 |
-.0054 |
-.0060 |
-.0759 |
-.0199 |
.0234 |
.0012 |
.8926 |
|
4 MEAT |
-.3168 |
.0255 |
-.0251 |
-.8434 |
-.0086 |
-.1079 |
-.0282 |
.0333 |
.0017 |
1.2695 |
|
5 SUGR |
-.2945 |
.0237 |
-.0233 |
-.0071 |
-.7850 |
-.1003 |
-.0262 |
.0309 |
.0016 |
1.1802 |
|
6 O FD |
-.2182 |
.0176 |
-.0173 |
-.0052 |
-.0059 |
-.6501 |
-.0194 |
.0229 |
.0012 |
.8745 |
|
7 FUEL |
-.2630 |
.0212 |
-.0208 |
-.0063 |
-.0071 |
-.0896 |
-.7174 |
.0276 |
.0014 |
1.0541 |
|
8 CLTH |
-.6018 |
.0484 |
-.0477 |
-.0145 |
-.0163 |
-.2050 |
-.0536 |
-1.5247 |
.0032 |
2.4119 |
|
9 ONFD |
-.3816 |
.0307 |
-.0302 |
-.0092 |
-.0103 |
-.1300 |
-.0340 |
.0401 |
-1.0049 |
1.5295 |
EXPENDITURE AND UNCOMPENSATED PRICE ELASTICITIES
|
ALL INDIA RURAL |
RICH |
|||||||||
|
COMMODITY GROUP |
1 |
2 |
3 |
4 |
5 |
6 |
7 |
8 |
9 |
EXPENDTR |
|
1 CERL |
-.1552 |
-.0051 |
-.0030 |
-.0034 |
-.0022 |
-.0158 |
-.0039 |
.0019 |
.0143 |
.1724 |
|
2 MILK |
-.1526 |
-.7265 |
-.0162 |
-.0187 |
-.0120 |
-.0866 |
-.0216 |
.0105 |
.0782 |
.9456 |
|
3 EOIL |
-.1182 |
-.0217 |
-.5533 |
-.0145 |
-.0093 |
-.0671 |
-.0168 |
.0082 |
.0605 |
.7320 |
|
4 MEAT |
-.1014 |
-.0186 |
-.0108 |
-.4766 |
-.0079 |
-.0576 |
-.0144 |
.0070 |
.0520 |
.6283 |
|
5 SUGR |
-.1273 |
-.0233 |
-.0135 |
-.0156 |
-.5926 |
-.0723 |
-.0181 |
.0088 |
.0652 |
.7887 |
|
6 O FD |
-.1018 |
-.0187 |
-.0108 |
-.0125 |
-.0080 |
-.5237 |
-.0144 |
.0070 |
.0522 |
.6307 |
|
7 FUEL |
-.1009 |
-.0185 |
-.0107 |
-.0124 |
-.0079 |
-.0573 |
-.4762 |
.0070 |
.0517 |
.6253 |
|
8 CLTH |
-.2450 |
-.0449 |
-.0260 |
-.0300 |
-.0192 |
-.1391 |
-.0347 |
-1.1045 |
.1255 |
1.5180 |
|
9 ONFD |
-.2775 |
-.0509 |
-.0294 |
-.0340 |
-.0217 |
-.1575 |
-.0393 |
.0192 |
-1.1277 |
1.7189 |
AGGREGATE EXPENDITURE AND UNCOMPENSATED PRICE ELASTICITIES
|
ALL INDIA RURAL |
|
|||||||||
|
COMMODITY GROUP |
1 |
2 |
3 |
4 |
5 |
6 |
7 |
8 |
9 |
EXPENDTR |
|
1 CERL |
-.2828 |
.0056 |
-.0036 |
-.0000 |
-.0012 |
-.0144 |
-.0059 |
.0043 |
.0086 |
.2896 |
|
2 MILK |
-.2955 |
-1.0111 |
-.0239 |
-.0101 |
-.0109 |
-.1052 |
-.0302 |
.0264 |
.0555 |
1.4050 |
|
3 EOIL |
-.1677 |
.0080 |
-.6398 |
-.0051 |
-.0060 |
-.0585 |
-.0179 |
.0147 |
.0330 |
.8393 |
|
4 MEAT |
-.2103 |
.0124 |
-.0165 |
-.7501 |
-.0072 |
-.0711 |
-.0214 |
.0187 |
.0380 |
1.0076 |
|
5 SUGR |
-.1971 |
.0063 |
-.0161 |
-.0074 |
-.7261 |
-.0721 |
-.0211 |
.0173 |
.0403 |
.9759 |
|
6 O FD |
-.1616 |
.0081 |
-.0128 |
-.0048 |
-.0058 |
-.6509 |
-.0170 |
.0142 |
.0316 |
.7989 |
|
7 FUEL |
-.1827 |
.0145 |
-.0139 |
-.0033 |
-.0055 |
-.0583 |
-.6676 |
.0166 |
.0276 |
.8727 |
|
8 CLTH |
-.3379 |
-.0132 |
-.0305 |
-.0226 |
-.0174 |
-.1472 |
-.0390 |
-1.2410 |
.0960 |
1.7529 |
|
9 ONFD |
-.3060 |
-.0125 |
-.0276 |
-.0203 |
-.0160 |
-.1326 |
-.0359 |
.0249 |
-1.1019 |
1.6278 |
EXPENDITURE AND UNCOMPENSATED PRICE ELASTICITIES
|
ALL INDIA URBAN |
VERY POOR |
|||||||||
|
COMMODITY GROUP |
1 |
2 |
3 |
4 |
5 |
6 |
7 |
8 |
9 |
EXPENDTR |
|
1 CERL |
-.7248 |
.0255 |
-.0035 |
.0076 |
-.0025 |
-.0110 |
-.0081 |
.0030 |
.0142 |
.6995 |
|
2 MILK |
-.1644 |
-1.4485 |
-.0081 |
.0176 |
-.0059 |
-.0253 |
-.0188 |
.0070 |
.0328 |
1.6134 |
|
3 EOIL |
-.1000 |
.0358 |
-.9215 |
.0107 |
-.0036 |
-.0154 |
-.0114 |
.0043 |
.0199 |
.9811 |
|
4 MEAT |
-.1439 |
.0515 |
-.0070 |
-1.3043 |
-.0051 |
-.0221 |
-.0164 |
.0061 |
.0287 |
1.4127 |
|
5 SUGR |
-.0966 |
.0345 |
-.0047 |
.0104 |
-.8890 |
-.0148 |
-.0110 |
.0041 |
.0192 |
.9479 |
|
6 O FD |
-.1010 |
.0361 |
-.0049 |
.0108 |
-.0036 |
-.9421 |
-.0115 |
.0043 |
.0201 |
.9918 |
|
7 FUEL |
-.0958 |
.0343 |
-.0047 |
.0103 |
-.0034 |
-.0147 |
-.8891 |
.0041 |
.0191 |
.9400 |
|
8 CLTH |
-.1443 |
.0516 |
-.0071 |
.0155 |
-.0052 |
-.0222 |
-.0165 |
-1.3175 |
.0288 |
1.4169 |
|
9 ONFD |
-.1209 |
.0433 |
-.0059 |
.0130 |
-.0043 |
-.0186 |
-.0138 |
.0052 |
-1.0849 |
1.1871 |
EXPENDITURE AND UNCOMPENSATED PRICE ELASTICITIES
|
ALL INDIA URBAN |
MODERATELY POOR |
|||||||||
|
COMMODITY GROUP |
1 |
2 |
3 |
4 |
5 |
6 |
7 |
8 |
9 |
EXPENDTR |
|
1 CERL |
-.2157 |
.0068 |
-.0030 |
-.0005 |
-.0019 |
-.0021 |
-.0000 |
.0064 |
.0346 |
.1755 |
|
2 MILK |
-.2704 |
-1.3687 |
-.0239 |
-.0037 |
-.0151 |
-.0163 |
-.0005 |
.0503 |
.2714 |
1.3768 |
|
3 EOIL |
-.1323 |
.0259 |
-.7075 |
-.0018 |
-.0074 |
-.0080 |
-.0002 |
.0246 |
.1328 |
.6739 |
|
4 MEAT |
-.1771 |
.0347 |
-.0156 |
-.9335 |
-.0099 |
-.0107 |
-.0003 |
.0330 |
.1777 |
.9017 |
|
5 SUGR |
-.1210 |
.0237 |
-.0107 |
-.0017 |
-.6433 |
-.0073 |
-.0002 |
.0225 |
.1215 |
.6164 |
|
6 O FD |
-.1795 |
.0352 |
-.0158 |
-.0025 |
-.0100 |
-.9548 |
-.0003 |
.0334 |
.1802 |
.9142 |
|
7 FUEL |
-.1894 |
.0371 |
-.0167 |
-.0026 |
-.0106 |
-.0114 |
-.9964 |
.0353 |
.1901 |
.9647 |
|
8 CLTH |
-.4434 |
.0869 |
-.0391 |
-.0061 |
-.0248 |
-.0267 |
-.0008 |
-2.2491 |
.4451 |
2.2581 |
|
9 ONFD |
-.3636 |
.0712 |
-.0321 |
-.0050 |
-.0203 |
-.0219 |
-.0006 |
.0677 |
-1.5470 |
1.8516 |
EXPENDITURE AND UNCOMPENSATED PRICE ELASTICITIES
|
ALL INDIA URBAN |
NON-POOR |
|||||||||
|
COMMODITY GROUP |
1 |
2 |
3 |
4 |
5 |
6 |
7 |
8 |
9 |
EXPENDTR |
|
1 CERL |
-.1070 |
.0016 |
-.0024 |
-.0009 |
-.0017 |
-.0044 |
-.0006 |
.0037 |
.0184 |
.0933 |
|
2 MILK |
-.2023 |
-1.1391 |
-.0310 |
-.0115 |
-.0214 |
-.0557 |
-.0077 |
.0470 |
.2342 |
1.1875 |
|
3 EOIL |
-.0867 |
.0086 |
-.5100 |
-.0049 |
-.0091 |
-.0239 |
-.0033 |
.0201 |
.1003 |
.5088 |
|
4 MEAT |
-.1327 |
.0132 |
-.0203 |
-.7678 |
-.0140 |
-.0365 |
-.0050 |
.0308 |
.1536 |
.7788 |
|
5 SUGR |
-.0606 |
.0060 |
-.0093 |
-.0034 |
-.3537 |
-.0167 |
-.0023 |
.0141 |
.0702 |
.3558 |
|
6 O FD |
-.1357 |
.0135 |
-.0208 |
-.0077 |
-.0143 |
-.8148 |
-.0051 |
.0315 |
.1570 |
.7964 |
|
7 FUEL |
-.1600 |
.0159 |
-.0245 |
-.0091 |
-.0169 |
-.0441 |
-.9230 |
.0372 |
.1852 |
.9393 |
|
8 CLTH |
-.3387 |
.0337 |
-.0519 |
-.0193 |
-.0357 |
-.0932 |
-.0128 |
-1.8616 |
.3919 |
1.9876 |
|
9 ONFD |
-.3091 |
.0307 |
-.0474 |
-.0176 |
-.0326 |
-.0851 |
-.0117 |
.0718 |
-1.4133 |
1.8142 |
EXPENDITURE AND UNCOMPENSATED PRICE ELASTICITIES
|
ALL INDIA URBAN |
RICH |
|||||||||
|
COMMODITY GROUP |
1 |
2 |
3 |
4 |
5 |
6 |
7 |
8 |
9 |
EXPENDTR |
|
1 CERL |
-.1452 |
-.0040 |
-.0027 |
-.0018 |
-.0016 |
-.0062 |
-.0024 |
.0038 |
.0318 |
.1284 |
|
2 MILK |
-.0510 |
-.6878 |
-.0133 |
-.0091 |
-.0079 |
-.0308 |
-.0119 |
.0186 |
.1576 |
.6355 |
|
3 EOIL |
-.0287 |
-.0113 |
-.3837 |
-.0051 |
-.0045 |
-.0174 |
-.0067 |
.0105 |
.0888 |
.3580 |
|
4 MEAT |
-.0425 |
-.0167 |
-.0111 |
-.5648 |
-.0066 |
-.0257 |
-.0099 |
.0155 |
.1315 |
.5304 |
|
5 SUGR |
-.0200 |
-.0078 |
-.0052 |
-.0036 |
-.2648 |
-.0121 |
-.0046 |
.0073 |
.0618 |
.2490 |
|
6 O FD |
-.0564 |
-.0222 |
-.0147 |
-.0100 |
-.0088 |
-.7737 |
-.0131 |
.0206 |
.1745 |
.7039 |
|
7 FUEL |
-.0489 |
-.0192 |
-.0127 |
-.0087 |
-.0076 |
-.0295 |
-.6515 |
.0178 |
.1511 |
.6093 |
|
8 CLTH |
-.1043 |
-.0410 |
-.0272 |
-.0186 |
-.0162 |
-.0630 |
-.0243 |
-1.3285 |
.3225 |
1.3005 |
|
9 ONFD |
-.1223 |
-.0481 |
-.0319 |
-.0218 |
-.0190 |
-.0739 |
-.0285 |
.0446 |
-1.2238 |
1.5245 |
AGGREGATE EXPENDITURE AND UNCOMPENSATED PRICE ELASTICITIES
|
ALL INDIA URBAN |
|
|||||||||
|
COMMODITY GROUP |
1 |
2 |
3 |
4 |
5 |
6 |
7 |
8 |
9 |
EXPENDTR |
|
1 CERL |
-.2033 |
.0021 |
-.0027 |
-.0004 |
-.0018 |
-.0056 |
-.0021 |
.0041 |
.0267 |
.1830 |
|
2 MILK |
-.1061 |
-.8689 |
-.0179 |
-.0083 |
-.0114 |
-.0350 |
-.0103 |
.0271 |
.1795 |
.8514 |
|
3 EOIL |
-.0607 |
.0014 |
-.4908 |
-.0036 |
-.0060 |
-.0178 |
-.0054 |
.0142 |
.0923 |
.4763 |
|
4 MEAT |
-.0811 |
-.0017 |
-.0135 |
-.6810 |
-.0086 |
-.0267 |
-.0081 |
.0204 |
.1365 |
.6640 |
|
5 SUGR |
-.0483 |
.0026 |
-.0069 |
-.0023 |
-.3776 |
-.0129 |
-.0039 |
.0107 |
.0682 |
.3705 |
|
6 O FD |
-.0871 |
-.0063 |
-.0157 |
-.0078 |
-.0098 |
-.8075 |
-.0101 |
.0233 |
.1635 |
.7575 |
|
7 FUEL |
-.0968 |
.0000 |
-.0156 |
-.0068 |
-.0100 |
-.0300 |
-.7774 |
.0238 |
.1550 |
.7577 |
|
8 CLTH |
-.1474 |
-.0258 |
-.0307 |
-.0179 |
-.0190 |
-.0653 |
-.0219 |
-1.4308 |
.3332 |
1.4255 |
|
9 ONFD |
-.1618 |
-.0283 |
-.0335 |
-.0195 |
-.0207 |
-.0716 |
-.0242 |
.0488 |
-1.2646 |
1.5753 |
Financial Assistance for Setting-up of Poultry Farm by the Government of Goa, Directorate of Animal Husbandry and Veterinary Services
II.1. Schemes for setting up a Poultry Farm of 500 broilers/1000 layers
Purpose: To set up new poultry units of either 500 broilers or 1000 layers.
Eligibility: Any category of farmer.
Methodology:
Approach the Government Veterinary Doctor of the respective area for application form, which should be duly filled in and submitted to the same officer for onward transmission to the Director along with Officer’s recommendation.
The application will be scrutinized by the Directorate and then referred to the financial institutions indicated by the applicant. In this case, availing of loan is a must and the same can be availed only from Banks and not from Credit Societies.
The applicant has to arrange for the loan from the Bank.
After obtaining the loan the applicant can start with the construction work after obtaining all the Licences/N.O.C. from Gram Panchayat/Municipality and Health Department, or any other relevant authorities.
Once the project is completed and commissioned, the Utilisation Certificate may be obtained from the Veterinary Officer and Bank Manager.
The Bank will then claim the subsidy from the Department by forwarding the application submitted by the beneficiary, together with purchase statement, purchase receipts, utilization certificate, Insurance documents, Agreement Bond duly signed by the beneficiary and two witnesses signed in presence of Area Veterinary Doctor.
The beneficiary can purchase either 500 broilers or 1000 layers.
The subsidy will be 25% of the cost of the poultry unit set up, limited to Rs. 15,000/- (Rupees fifteen thousand only). This subsidy will be released only on completion of the proposed poultry unit and submission of final utilization certificate from the Area Veterinary Doctor and Bank Manager.
The units are to be run for a minimum period of three (3) years.
The beneficiary should make his own arrangements to market the produce.
II.2. Financial assistance for establishment of Modern Poultry Farm and purchase of Poultry Farm Equipments.
Guidelines: 25% of cost of plant machinery will be granted as subsidy subject to maximum of Rs.2.00 lakh to any individual for setting up poultry units. The minimum unit size should be 2000 broilers (500 broilers per fortnight) or 5000 layers. The beneficiary can start a unit with his own finance or by availing loan from the financial institution. In case the beneficiary avails loan from financial Institution subsidy will be released through the concerned financial institution.
Plant and machinery includes
Poultry shed.
Cages in case of cage system.
Store room.
First batch of day old chicks/layers.
Water pump and water tank.
Feather plucket.
Feeders and waterers
Electric fittings.
Eligibility: Any individual having some experience in poultry keeping.
Conditions:
The unit should be located in Goa.
The subsidy will be released only after completion of the unit and purchase of first batch of poultry birds.
Subsidy is admissible only for new equipment/machinery.
The beneficiary should run the unit for a minimum period of 10 years and an Agreement in this regard is to be signed by the beneficiary with the Department.
Procedure:
The Project Report of the proposed Units is to be submitted to the Director of Animal Husbandry and Veterinary services through the Area Veterinary Officer/Assistant Director alongwith the following documents.
Documents indicating ownership of Land in Form I & XIV or copy of Lease Deed or N.O.C. from the land Lord incase of Tenants.
In case of lease the same should be for a minimum period of 10 years from the date of starting the unit.
In case of Tenants N.O.C. from the Land Lord to run the Unit for a minimum period of 10 years from the date of starting the Unit.
From Panchayat/Municipality.
The concerned Officer after inspecting the site will submit the application to the Directorate with his observation.
The Project Report/papers will be scrutinized and approval of the project will be sent to the applicant.
After completion of the unit, the following documents are required to be submitted by the applicant for release of subsidy.
Bill, Vouchers pertaining to construction of Poultry sheds, Store Room.
Purchase receipt of equipments, Machinery and 1st batch of Poultry Birds.
Valuation certificate of shed and stores from the approved valuer.
The Veterinary officer/Assistant Director will submit all these documents along with his completion certificate to the Director of Animal Husbandry.
The Deputy Director will inspect the unit and submit his observations for sanctioning the subsidy by the Department.
Maximum unit cost admissible for subsidy
Layer Unit under cage system
|
Sr. No. |
Layer Unit |
Cost |
|
i) |
Poultry Shed 0.75 sq.ft per bird -- Cost of Construction |
Rs. 100/- per sq.ft. |
|
ii) |
Cost of cages |
Rs. 35/- per bird. |
|
iii) |
Electrification |
Rs. 3/- per bird. |
|
iv) |
Laying of water pipeline |
Re. 1/- per bird. |
|
v) |
Store room 280 sq.ft for 2800 layers ---- Cost of construction. |
Rs. 150/- per sq. ft. |
|
vi) |
Pump house, motor and fittings |
Rs. 12,000/- |
|
vii) |
Cost of water tank |
Rs. 5000/- |
|
viii) |
Cost of chicks |
Rs. 15/- per bird. |
Broiler Unit: under Deep litter system
|
Sr. No. |
Layer Unit |
Cost |
|
i) |
Poultry shed 0.75 sq. ft. per bird cost of construction. |
Rs. 150/- per bird. |
|
ii) |
Store Room 250 sq. ft. per 2000 birds -- Cost of construction |
Rs. 175/- per sq.ft. |
|
iii) |
Cost of Feeders and Waterers |
Rs. 10/- per bird. |
|
iv) |
Cost of Electrification |
Rs. 3/- per bird. |
|
v) |
Cost of pump house, water pump and fittings. |
Rs. 12,000/- |
|
vi) |
Cost of water tank. |
Rs. 5000/- |
|
vii) |
Cost of day old chicks |
Rs. 15/- per bird. |
Annex Table 3.A: India’s Export of Birds’ Eggs in shell, country-wise
Q = MT, V = Rs. Lakh
|
Country For Hatching |
1990-95 |
1995-96 |
1996-97 |
1997-98 |
||||
|
Q |
V |
Q |
V |
Q |
V |
Q |
V |
|
|
Bangladesh |
9.78 |
18.24 |
10.90 |
34.73 |
104.31 |
93.56 |
15.30 |
17.68 |
|
Iran |
9.50 |
35.18 |
2.50 |
14.46 |
23.35 |
16.51 |
- |
- |
|
Kuwait |
0.02 |
0.10 |
3..46 |
20.38 |
120.04 |
100.85 |
223.54 |
18989 |
|
Maldives |
20.34 |
26.96 |
7.61 |
7.43 |
- |
- |
6.77 |
2..66 |
|
Oman |
41.40 |
174.64 |
60.76 |
327.99 |
555.83 |
36685 |
950.90 |
703.21 |
|
Russia |
- |
- |
4.00 |
31.73 |
- |
- |
18.50 |
32.82 |
|
S.Arabia |
40.27 |
191.57 |
28.39 |
144.81 |
415.50 |
453.95 |
766.65 |
844.69 |
|
UAE |
16.96 |
79.83 |
107.14 |
425.67 |
1037.83 |
363.58 |
727.85 |
406.57 |
|
Yemen |
- |
- |
- |
- |
29.95 |
30.64 |
252.16 |
276.54 |
|
Subtotal |
141.26 |
538.99 |
226.10 |
1012.87 |
2326.97 |
1446.18 |
3674.70 |
3319.54 |
|
Non-Hatching |
||||||||
|
Bahrain |
- |
- |
0.40 |
0.45 |
138.03 |
39.88 |
115.24 |
30.27 |
|
Bangladesh |
- |
- |
3.60 |
2.83 |
4.00 |
2.49 |
6.20 |
14.17 |
|
Iran |
0.80 |
2.22 |
- |
- |
121.90 |
38.20 |
43.90 |
13.34 |
|
Kuwait |
- |
- |
7.00 |
6.96 |
308.30 |
11737 |
180.53 |
55.76 |
|
Maldives |
39.58 |
39.79 |
56.27 |
68.49 |
208.05 |
50.35 |
49.65 |
19.35 |
|
Oman |
4.00 |
4.19 |
16.25 |
18.43 |
2955.03 |
888.88 |
587.80 |
163.93 |
|
Poland |
- |
- |
- |
- |
40.00 |
46.94 |
- |
- |
|
Russia |
- |
- |
- |
- |
44.46 |
13.96 |
47.13 |
12.95 |
|
S. Arabia |
2352 |
17.49 |
0.16 |
0.24 |
30.43 |
10.41 |
6.39 |
6.50 |
|
UAE |
6.90 |
8.44 |
140.81 |
164.16 |
5046.63 |
1444.77 |
271467 |
762.33 |
|
Subtotal |
77.80 |
76.38 |
226.09 |
263.04 |
9003.83 |
2697.83 |
3850.83 |
1104.53 |
|
Others |
||||||||
|
Bangladesh |
- |
- |
2.36 |
2.42 |
23.06 |
10.72 |
- |
- |
|
Iran |
4.20 |
6.42 |
7.20 |
9.35 |
4.80 |
2.13 |
21.81 |
7.57 |
|
Japan |
- |
- |
- |
- |
22.00 |
35.51 |
- |
- |
|
Maldives |
1.21 |
1572 |
9.64 |
9.10 |
39.22 |
9.19 |
26.10 |
9.04 |
|
Oman |
4.01 |
508 |
28.90 |
36.06 |
313.94 |
9.54 |
39.30 |
118.01 |
|
S. Africa |
1.02 |
4.54 |
0.27 |
0.24 |
22.48 |
25.59 |
115.91 |
43.91 |
|
UAE |
0.10 |
0.55 |
26.40 |
34.21 |
1209.64 |
290.16 |
1141.63 |
327.40 |
|
Subtotal |
29.04 |
34.46 |
74.77 |
91.27 |
1732.91 |
516.23 |
1855.65 |
587.58 |
|
TOTAL |
248.10 |
649.78 |
526.96 |
1367.18 |
13063.87 |
4656.07 |
9381.18 |
5011.65 |
Source: DGCIS, Ministry of Commerce
Annex Table 3.B: India’s country-wise export of Birds’ eggs not in shell - fresh, dried, cooked and steaming in boiling water, molded, or frozen
Q = MT, V = Rs. Lakh
|
Country |
1995-96 |
1996-97 |
1997-98 |
|||
|
Egg Yolks, dried |
Q |
V |
Q |
V |
Q |
V |
|
Australia |
- |
- |
24..00 |
49.46 |
40.00 |
37.78 |
|
Austria |
- |
- |
152.00 |
209.13 |
270.00 |
304.83 |
|
Belgium |
- |
- |
278.00 |
438.85 |
46.79 |
55.31 |
|
Bulgaria |
40.00 |
46.12 |
- |
- |
- |
- |
|
Germany |
63.25 |
71.15 |
790.85 |
1113.51 |
422.69 |
562.27 |
|
Italy |
- |
- |
40.00 |
31.97 |
- |
- |
|
Japan |
- |
- |
183.00 |
323.19 |
307.80 |
658.33 |
|
Netherlands |
- |
- |
106.00 |
137.04 |
44.00 |
50.55 |
|
Norway |
- |
- |
12.00 |
17.59 |
21.00 |
26.45 |
|
Poland |
20..00 |
23.56 |
44.00 |
62.11 |
22.00 |
28.17 |
|
Russia |
- |
- |
45.00 |
71.38 |
48.00 |
89.07 |
|
Solomon Islands |
- |
- |
20.00 |
23.53 |
- |
- |
|
Thailand |
- |
- |
10.00 |
20.90 |
12.50 |
23.81 |
|
Subtotal |
123.25 |
141.18 |
1733.85 |
254352 |
1346.11 |
2037.50 |
|
Yolks, not dried |
||||||
|
Austria |
- |
- |
219.00 |
300.79 |
44.00 |
64.55 |
|
Belgium |
- |
- |
86.00 |
142.29 |
22.00 |
25.27 |
|
Germany |
- |
- |
462.25 |
696.49 |
52.65 |
60.75 |
|
Japan |
- |
- |
127.01 |
230.16 |
22.50 |
49.67 |
|
Netherlands |
- |
- |
70.00 |
106.98 |
112.33 |
159.33 |
|
Russia |
- |
- |
- |
- |
60.00 |
102.24 |
|
Thailand |
- |
- |
24.60 |
45.69 |
11.0 |
20.59 |
|
Subtotal |
- |
- |
999.66 |
1540.20 |
409.11 |
603.41 |
|
Eggs, dried |
||||||
|
Australia |
- |
- |
22.00 |
31.67 |
12.92 |
28.82 |
|
Austria |
- |
- |
92.00 |
138.15 |
91.50 |
136.77 |
|
Belgium |
11.50 |
12.73 |
135.00 |
94.92 |
- |
- |
|
Canada |
- |
- |
2200 |
6.27 |
- |
- |
|
France |
- |
- |
22.00 |
33.52 |
- |
- |
|
Germany |
86.00 |
116.89 |
107.75 |
142.24 |
198.00 |
257.24 |
|
Greece |
- |
- |
22.00 |
30.10 |
- |
- |
|
Japan |
40.00 |
70.59 |
42.05 |
79.83 |
66.65 |
140.45 |
|
Korea Dep Rep. |
- |
- |
20.00 |
25.35 |
- |
- |
|
Korea, Rep. |
30.00 |
32.66 |
60.00 |
67.42 |
44.00 |
59.70 |
|
Netherlands |
- |
- |
82.00 |
109.57 |
99.18 |
139.35 |
|
Russia |
- |
- |
- |
- |
22.00 |
36.47 |
|
Thailand |
10.00 |
21.26 |
27.00 |
49.14 |
37.34 |
43.90 |
|
Subtotal |
182.00 |
261.78 |
673.86 |
975.50 |
609.22 |
889.25 |
|
Eggs not dried |
||||||
|
Australia |
- |
- |
22.00 |
32.06 |
23.32 |
30.94 |
|
Austria |
- |
- |
22.00 |
35..03 |
136.96 |
177.58 |
|
Bahrain |
- |
- |
42.00 |
10.43 |
- |
- |
|
Belgium |
- |
- |
32.00 |
53.07 |
44.00 |
51.16 |
|
Germany |
22.50 |
24.81 |
189.50 |
264.55 |
111.32 |
161..98 |
|
Korea DP Rep |
- |
- |
20.00 |
24.24 |
- |
- |
|
Korea RP |
- |
- |
20.00 |
24.24 |
- |
- |
|
Netherlands |
- |
- |
- |
- |
160.80 |
214.94 |
|
UAE |
- |
- |
- |
- |
809.20 |
339.41 |
|
USA |
- |
- |
11.00 |
18.06 |
5.90 |
6.29 |
|
Subtotal |
22.50 |
24.81 |
462.20 |
49113 |
1660.30 |
1320.97 |
|
Total |
- |
434.29 |
- |
555034 |
|
4851.14 |
Source: DGCIS, Ministry of Commerce
Particulars of Units/Persons Interviewed
|
S.No. |
Name of the Respondent |
Address |
Type of Unit |
Bird Size |
|
1. |
Y. Subhash Chandrabose |
Musunoor North Trunk Road , Kavali (M) Nellore (Dist) |
Boiler |
3000 |
|
2. |
P. Ramesh Babu |
-do- |
Layer |
2500 |
|
3. |
Mohan |
-do- |
Broiler |
2000 |
|
4. |
Ramakrishna Reddy |
-do- |
Layer |
1500 |
|
5. |
Chitanya Poultry |
-do- |
Layer |
1.44 lakh |
|
6. |
Radhakrishana Reddy |
R.K. Egg Traders |
Export Eggs from East Godavari |
|
|
7. |
Srinivasa Poultry Farm |
Dupalapoodi |
Layer |
16000 |
|
8. |
SSRR Poultry Complex |
Mallapudi |
Layer |
1.2 lakh |
|
9. |
B. Damodar Reddy |
Pedda Ambarpet |
Broiler |
15000 |
|
10. |
Siva Reddy |
do- |
Broiler &Layer |
4000 |
|
11. |
Raji Reddy |
-do- |
Broiler |
4000 |
|
12. |
Narsimha Reddy |
-do- |
Broiler |
5000 |
|
13 |
Srinivas Reddy |
-do- |
Broiler |
6000 |
|
14. |
Shankar |
-do- |
Layer |
15000 |
|
15. |
Rajesh Debash |
Kanjewala, Delhi |
Broiler |
3000 |
|
16. |
Chanpasha |
Pudur (M&V) |
Egg |
|
|
17. |
Kirana Stores |
Ranga Reddy (Dist) |
|
|
|
18. |
Hankar |
-do- |
Egg |
|
|
19 |
Mahammad |
-do- |
Chicken |
|
|
20. |
Chicken Centre |
|
|
|
|
21. |
Balaiah |
Alur (V) |
Egg |
|
|
22. |
M. Ramachandraiah |
-do- |
Egg |
|
|
23. |
M. Srinivas |
-do- |
Egg |
|
|
24. |
Hari Prasad |
-do- |
Chicken |
|
|
|
|
Chicken Centre |
|
|
|
25. |
Viswanathan |
-do- |
Egg |
|
|
26. |
Mallesh |
-do- |
Egg |
|
|
27. |
Jangaiah |
-do- |
Egg |
|
|
28. |
Shankar |
-do- |
Egg |
|
|
29. |
Srinu |
Tarnaka |
Egg |
|
|
|
|
Kirana Stores |
|
|
|
|
|
Hyderabad |
|
|
|
30. |
Swetha Chicken Centre |
-do- |
Chicken |
|
|
31. |
L. Satyanarana Reddy |
Asst. Director |
||
|
32. |
R.R. Nair |
Joint Director of Animal Husbandry |
||
APEDA (2002), Certification Mark of Quality for Agricultural Products, APEDA, New Delhi.
Appleby, Michael C. (1991), “Do Hens Suffer in Battery Cages? A Review of the Scientific Evidence,” Institute of Ecology and Resource Management, University of Edinburgh.
BIS, Hazard Analysis and Critical Central Point, Bureau of Indian Standards, New Delhi.
CII (1997), Proceedings of the Seminar on Food Laws in India; October 6.
CII (2001), The Prevention of Food Adulteration Act and Rules (as on 4.01.2001).
CII, Lessons from International Comparisons and Practices in Food Legislation.
CII and Mckinsey (1998), Food and Agriculture, Integrated Development Action (FAIDA), Second edition.
Deshingkar, Priya (2002), “Political Economy of the Animal Feed and Food Contamination Debate in India,” Economic and Political Weekly, April 13.
Fakhruddin, A.K., Gahlot, R.K. Tanwar, and A.P. Singh, (2001), “Poultry Resource Management for Food Security and Export Promotion,” paper presented at the South Asian Regional Conference, Pune, September 24-26.
FAO (2000), Commodity Market Review: 1999-2000, Rome.
Indian Express (2002), “Food Standards Being Reviewed to Promote Innovation”, IndianExpress.Com, Press Release, February 5.
Jain, G.L. (2001) “Breeding Commercial Chickens under Tropical Conditions,” paper presented at the South Asian Regional Conference and Exhibition, Pune, September 24-26.
Mandal M.K., Nita Kandekar and Tapan Rajak (2001) “Backyard Farming in Tribal Areas: Present Status and Future Strategies,” paper presented at the South Asian Regional Conference, Pune, September 24-26.
Mani, M. and K. Viswanathn (2001), “Cold Storage of Chicken Eggs with Food Commodities,” paper presented at the South Asian Regional Conference, Pune, September 24-26.
Mehta, R. (2001), WTO, Liberalisation, and Industrial Sector: The Case of Market Access, RIS Occasional Paper No. 63.
Ministry of Agriculture, Department of Animal Husbandry and Dairying (2001), Procedure for Import of Livestock products into India, Notification, G.O.I., July 7.
Ministry of Commerce and Industry (2002), Export and Import Policy, April 2002-March 2007.
Ministry of Commerce and Industry (2002), ITC (HS) Classifications of Export and Import Items, April 2002-March 2007.
Ministry of Environment and Forests (2002), Annual Report 2001-2000.
Mishra S.C., C.K. Mohanty, P.K. Mishra and R. K. Dehuri (2001), “Present Scenario of backyard Poultry Farming Strategies for Improvement: A Case Report”, paper presented at the South Asian Regional Conference, Pune, September 24-26.
Nambiar, R.G. (1983), “Protection of Domestic Industry: Fact and Theory”, Economic and Political Weekly, Vol. 18, No. 1and 2, January 1-8.
Narahari, D. (2001), “Water Treatment: Efficient and Economic Methods,” paper presented at the South Asian Regional Conference, Pune, September 24-26.
Panda, B.K. and Rajvir Singh (2001), “Village Chicken Production India and Its Future Scope,” paper presented at the South Asian Regional Conference, Pune, September 24-26.
Rai, R.B. and P. Balakrishnan (2001), “Women and Backyard Poultry Production in Andaman and Nicobar Islands: Prospects and Problems”, paper presented at the South Asian Regional Conference, Pune, September 24-26.
Rath, M., S. Nayak and Iqbaluddin (2001) “Strategies for Future Development of Poultry Industry: Policies/Strategies and Constraints of Poultry Development in India,” paper presented at the, South Asian Regional Conference, Pune, September 24-26.
Rath, M., S. Nayak and Iqbaluddin (2001), “Strategies for Further Development of Poultry Industry - Policies/Strategies and Constraints of Poultry Development in India,” paper presented at the South Asian Regional Conference, Pune, September 24-26.
Reddy, C.V. (2001), “Sustainable Poultry Production for Poverty Alleviation and Human Development in South Asian countries,” paper presented at the South Asian Regional Conference and Exhibition, Pune, September 24-26.
Sachdev, A.K., Ram Gopal and Rajvir Singh (2001), “Estimation of Input Output Energy use for Diversified Mode of Poultry Development,” paper presented at the South Asian Regional Conference, Pune, September 24-26.
Saqib, Mohammed and Atul Kaushik (2001), “Exporting Environment Friendly Products: Scope for Organic Farming in India,” Rajiv Gandhi Institute for Contemporary Studies, Working Paper Series.
Sathe, B.S., K.R. Rao, D. Ravindra and O.K. Mahadevan (2001) “Contract Broiler Farming in India - Key issues” paper presented at the South Asian Regional Conference of Exhibition, Pune, September 24-26.
Seshaiah, M.P. (2000), “Sorghum Grains in poultry Feed,” in Technical and Institutional Options for Sorghum Grain Mold Management: Proceedings of and International Consultations, 18-19, May 2000, International Crops Research Institute for the Semi-Arid Tropics, Hyderabad.
Shah, R.J. (1987), “A Study of Personnel Management in the Department of Animal Husbandry: A Case Study of Poultry Development Programme,” submitted to All India Management Association, New Delhi.
Sharma, R.K., A.K.Banerjee, Harpal Singh and C.V. Singh (2001), “Strategies for Improving Productivity of Rural poultry Production Sub-system,” paper presented at the South Asian Regional Conference, Pune, September 24-26.
Sheldon B.L. (2001), “Critical Issues for Poultry Research and Development in the SAARC Region,” paper presented at the South Asian Regional Conference, Pune, September 24-26.
Sheokand, B.S.,(2001), “Sustainable Poultry Farming and Extension Education,” paper presented at the South Asian Regional Conference, Pune, September 24-26.
Shiva, Vandana (1996), More Than a Matter of Two Flies: Why KFC is an Ecological Issue.
Soni, B.K. (1994), “Asian Poultry Scene,” Indian Poultry Industry Yearbook.
Tisdell,C., T. Murphy and T. Kehren (1997), “Characteristics of Thailand’s Commercial Pig and Poultry Industries, with International Comparisons,” FAO.
Vaidya, S.V., The Indian Feed Industry, Food and Agriculture Organization.
Woodley Jackman (1994), “What is Wrong with Indian Poultry,” Indian Poultry Industry Yearbook.
WTO (1999), India-Quantitative Restrictions on Imports of Agricultural, Textile, and Industrial Products: Report of the Appellate Body, WT/DS90/AB/R, Aug. 23, 1999.
WTO (2000), India-Quantitative Restrictions on Imports of Agricultural, Textile and Industrial Products: Agreement under Article 21.3 (b) of the DSU, WT/DS90/15, Jan. 17, 2000.
Yadav, B,.P.S., J.J. Gupta, S. Doley and D. Agrahar-Murugkar (2001), “Status of Poultry Development in NEH Region,” paper presented at the South Asian Regional Conference, Pune, September 24-26.
1. Indian Poultry Industry Yearbook, 1994
2. FAO Year Book: Production
3. FAO Year Book: Trade
4. Annual Reports of the Department of Animal Husbandry of Dairying, Ministry of Agriculture, Govt. of India.
5. National Income Accounts Statistics, Central Statistical Organisation, Govt. of India
6. Monthly Statistics of Foreign Trade of India, Dept. of Commercial Intelligence & Statistics, Ministry of Commerce, Govt. of India.
7. Economic Survey, Govt. of India
|
[37] Indian Poultry Team
Leader, Research and Information System for the Non-Aligned and other Developing
Countries, New Delhi, India [38] Professor, Sardar Patel Institute of Economic and Social Change, Ahmedabad, India [39] General Manager, VH Group of Companies, New Delhi, India [40] Senior Fellow, Center for Economic and Social Studies, Hyderabad, India [41] Joint Director, Bureau of Economic and Statistics, Hyderabad, India [42] Shah (1987). [43] Table 1 gives some salient features of this industry. [44] Table 2 gives official figures of G.O.I. Some well-informed persons challenge these figures. To quote an example, G.O.I. department say that the production of broilers is around 0.9 billion accounting to government data, while the private sector experts say that it is more than 1 billion. However we rely, to large extent, on government data in this study. [45] Based on log-liner equation. [46] This casts some doubt on official statistics. It is very difficult to believe that the numbers of broilers in 1980-81 was 30 million and poultry meat production was 179 million kg, while the corresponding figures in 2000-01 are 895 million broilers and 735 million poultry meat. [47] These growth rates are based on official statistics and seem to be downward biased. [48] See Table 4. [49] This section is based on official statistics. [50] Livestock survey was also conducted in 1997. However, all-India statistics are not yet available. [51] In other countries, poultry consists of birds such as turkeys, ostrich, chickens, ducks, pigeons, geese, etc. But in India, poultry is largely related to chicken and to some extent ducks. [52] This is based on information supplied by experts in poultry. [53] See also Reddy (2001) [54] The operational procedure of the contract farming system is as follows. Mostly, layer sheds that have remained vacant following the recent crisis are being used. One-day-old broiler chicks and feed (and poultry health products, if necessary) are supplied by integrators and farmers get a fixed return on each broiler from the integrator. A number of integrators also give more return or incentives if FCR and mortality rates are relatively low. The farmer meets the expenses on labor, water, electricity, management and litter, while the expenses on medicines and vaccines are generally met by the integrator. In some cases, the integrator contacts wholesale trader in advance and the rates are fixed for lifting the birds. After the farmers’ flock is sold, production cost, in some regions, is worked out using a formula that takes into account the number of chicks purchased initially and their price, quantity and cost of feed, medicines, etc. and the number of birds sold, their body weight and the selling price. Depending on these figures, the amount to be paid to the farmer is worked out. For details, see Sathe et al. (2001). [55] However, some well informed industry experts doubt these official statistics. [56] This figure is based on India Infoline Sector Reports, Poultry, Internet edition. [57] Based on official statistics. [58] These estimates are based on consumption data. [59] However there are some exceptions. The Broiler Coordination Committee (BCC) in Tamilnadu generally announces benchmark prices at regular intervals. This price generally dictates the wholesaler and retailer prices in some parts of the southern region. [60] Farmers/producers transport live birds to major distribution centres after the birds reach the right weight (usually in about six weeks). There are established distribution centres of poultry trade in India which function according to regulations of local and state governments. [61] However, traders have a very strong lobby in fixing up these prices. For example, the prices fixed by traders in the Delhi wholesale (Gazipur) market rules almost through out north India. [62] 1 score = 20 birds. [63] See Jain (2001). [64] Experts’ views. [65] Negative list generally means that items cannot be freely imported. [66] This restriction has been removed with affect from April 1, 2001, as per India’s commitment to WTO (see the section on import liberalization). [67] The analysis of problems of producers, processors and retail trade is based on quick field surveys conducted in four districts in Andhra Pradesh viz., Ranga Reddy, Hyderabad, Nellore and East Godavari. The surveys in Ranga Reddy and Hyderabad districts focused on rural and urban marketing of poultry products. The survey in Nellore district is intended to understand the problems of small holders. East Godavari district has high concentration of large-scale poultry units. As many as one ten million birds are concentrated in a small area of ten kilometer radius in Anaparthi Mandal of East Godavari district. The survey in this district focuses on the problems of large-scale units. [68] Maize has gained importance in poultry because of its high energy. [69] The official statistics of maize production is quite reliable. Based on some well-informed sources the consumption of the maize by the poultry sector is around 5 million tonnes. [70] CII and Mckinsey (1998). [71] There is a possibility of substitution by other energy inputs like wheat etc to some extent. [72] According to some poultry experts, price of poultry meat has actually declined in the international market. [73] India can not give export subsidies as per WTO commitments. However, incentives for export promotion, international freight and internal transport can be provided. [74] A kind of millet, sometime known as Pearl Millet. [75] For details, see Vaidya. [76] See FAO (2000). [77] For details, see Mehta (2001) [78] It is very difficult to understand the inclusion of eggs in this list. [79] See WTO (1999). [80] See WTO (2000). [81] Except for four tariff lines of the poultry sector, whose tariff rate is 100 per cent. See Table 26 for details. [82] The government has revised the tariff rates of two more tariff lines of the poultry sector, i.e. HS 0207.13 (Meat and edible offal, of the poultry of heading No. 01.05: Cuts and offal, fresh or chilled) and 0207.14 (Meat and edible offal, of the poultry of heading No. 01.05: Cuts and offal, frozen). [83] Western Hatcheries (now called Venky’s) raised capital from the market during the early 90s. A few more companies have also raised credit from the capital market. [84] Also known as ‘great millet’. [85] The Poultry Federation of India (PFI) has, however, warned that the new import duty rates on maize could increase poultry feed costs by as much as 50 paise to one rupee/kg unless animal feed mills switched to other ingredients of less efficiency and lower nutritive value. [86] Fixed cost is also important in deciding about total cost of production of a broiler. It has been noticed that fixed cost is relatively high in west and north India compared to east and south India. This is particularly due to ‘area of housing’ cost in west India, and equipment for environment control measures in north India. [87] In 2001, the developing countries produced around 134 million tonnes of poultry meat. [88] The report was prepared in 1997. At present, the size is around Rs. 13 billion. [89] Compound annual growth rate. [90] CII and Mckinsey (1998). [91] Based on production figures are for the year 1998. FAO Year Book: Production. [92] India is the only country among developing countries that has pure-line breeding programme. [93] Output was Rs 75 billion in 1996 or 1997. At present, output is expected to be around Rs 130 billion. [94] CII and Mckinsey (1998). [95] Shairaz Foods, in technical collaboration with a Dutch company, entered the poultry sector with latest equipment like environment control system, but it had to close down within five years due to inefficiencies and Indian conditions. Similarly, another company diversified its production from transport to poultry, but it also failed due to unprofessional approach. [96] The poultry sector was getting around 100 per cent tax benefits on income, which was reduced to 33 per cent in the early 90s. Now they have been abolished. |
![]()
![]()
![]()