![]()
![]()
Discussion Draft for Comments:
Please do not cite or distribute
Nipon Poapongsakorn[139]
Viroj NaRanong
Uthai Kanto
Adis Israngkura
May 2002
This paper was produced as part of Phase I of an IFPRI-FAO project entitled "Livestock Industrialization, Trade and Social-Health-Environment Impacts in Developing Countries", funded by the Department for International Development (DFID), U.K., through the Livestock, Environment and Development (LEAD) initiative at FAO. Correspondence may be addressed to the scientific coordinator for the project, Dr. Christopher Delgado, IFPRI, 2033 K St, N.W., Washington D.C. 20006, USA. Email: [email protected]
This country report is part of the FAO-IFPRI led study “The on-going industrialisation of the livestock sector in the peri-urban areas of developing countries and its effects on the poor and on the environment.” The main purpose of the study is to analyze the on-going industrialization with a view to identifying the true costs and benefits in terms of the environment and equity and to device strategies for environmentally and socially more sustainable livestock development.
The study is divided into two phases. The first phase of the study (Phase I) comprises mainly descriptive and qualitative part of the study. The quantitative part, which will based on estimation of production frontier using data from field survey, and study on effects of scaling-up on livelihood, well-being, and poverty alleviation, would be carried on in Phase II.
Due to different nature of each livestock subsector, this report would deal with each subsector separately. The organization of this report is as follows. Section 1 provides an overview on effect of trade liberalization on agriculture and livestock in Thailand. Section 2 deals with poultry, specifically broilers and layers. Sections 3 and 4 deal with swine and dairy cattle, respectively. Each chapter covers the following issues: technological change in production in the last decade or two, effect of trade (or lack thereof) and trade negotiation, effect of government programs, distortions, and regulations, and characteristics of the firms, scale, and contractual arrangement. Section 5 discusses environmental issues and remedies. It analyzes effects of livestock industrialization on environment. When appropriate, it touches upon health-related requirements and effects on trade and consumer health as well as animal welfare requirements and their effects on production. It describes specific programs designed to remedy the environmental problem (e.g., in swine production). The last chapter syntheses the effect of technological changes (especially scaling-up) on production, contractual arrangement, and partly on environment and health.
Despite the rapid decline of the agricultural sector in the last two decades, agricultural exports have remained the significant source of foreign earnings as Thailand is still the world major exporter of rice, rubber, cassava, canned pineapple, sugar, chicken, shrimp and canned tuna, etc. Meanwhile the share of agricultural imports have risen as the expanding industries need to use more imported raw materials and the Thais have to import food and food products that cannot be competitively produced in Thailand. The importance of agricultural trade has been made possible by the outward oriented trade policy. However, the domestic pricing policy of agricultural products has a tendency to shift towards increasing subsidy in the form of trade distorted support measures
Since trade liberalization in Thai agriculture has been determined both by the government unilateral liberalization policy and the commitments under the Uruguay Round agreement on agriculture (AoA), this section will discuss both policy measures. The next section is an explanation of the implementation of the AoA. The key issues are what did Thailand give and get from the agreement. The discussion will emphasize the role of the livestock trade.
The Thai agriculture has long been open to foreign trade since 1855 when the Thailand was forced to sign the Bowring Treaty with the English government. Since export and import taxes were set at the rate not exceeding 5%, the Treaty resulted in the rapid expansion of agricultural trade and rice production in the late 19th Century. Today agricultural trade accounted for more than 85 percent of agricultural GDP. Meanwhile livestock trade accounted for more than 90 percent of livestock GDP. (see table 1.1).
Table 1-1 Degree of Trade Opening on Agriculture and Livestock sector
|
Year |
Degree of Trade Opening |
|
|
Agriculture |
Livestock |
|
|
1988 |
52.39 |
38.72 |
|
1989 |
55.66 |
36.49 |
|
1990 |
52.83 |
42.23 |
|
1991 |
52.18 |
44.14 |
|
1992 |
49.91 |
51.18 |
|
1993 |
55.20 |
48.46 |
|
1994 |
57.86 |
49.15 |
|
1995 |
56.77 |
45.98 |
|
1996 |
52.70 |
45.72 |
|
1997 |
58.15 |
68.53 |
|
1998 |
60.19 |
92.99 |
|
1999 |
61.63 |
71.41 |
|
2000 |
80.57 |
94.56 |
Sources : 1) NESDB 2) Department of Business Economics
Note: Calculated by TDRI
Beginning in the mid 1980s, there were a series of liberalization policies in response to both internal and external changes. In the mid 1980’s, the Thai agriculture began to rapidly lose its comparative advantage. Internally, the cost of production rose rapidly as the forest lands were exhausted, and the industrial booms began to attract large number of young workforce from the agricultural sector, resulting in an absolute decline in the size of agricultural labor force and rapid increase in real wage rate in the early 1990’s. Externally, there was a worldwide slump in agricultural prices. The Thai farmers were caught in a situation of cost-price squeeze. The situation was worsened when the Thai rice exports were seriously affected by the US subsidized rice export under the PL480 program. Moreover, the US government also used the super 301 law to sanction Thai exports if Thailand failed to strengthen the properly rights legislation and enforcement. The Thai government, therefore, decided to actively participate in the Uruguay Round in order to defend her interests. One of the major objectives of participation was to establish the multilateral trade disciplines governing world agricultural trade. To strengthening her position, Thailand joined the Cairns Group.
In the late 1980’s and early 1990’s, the globalization forces were at its height, thanks to the rapid world economic growth, particularly the miracle growth of the East Asian countries. While the Uruguay Round progressed slowly, many countries began to establish the free trade zone and regional economic cooperation. Thailand and her ASEAN neighbor decided to establish the ASEAN Free Trade Agreement (AFTA). In addition to the common preferential tariffs for manufacturing products AFTA has also been expanded to cover most of agricultural trade. In 1989, Thailand also joined the Asia-Pacific Economic Cooperation (APEC). In an attempt to reduce impediments to trade and investment, APEC has launched an Early Voluntary Sectoral Liberalization (EVSL) initiatives aimed at liberalizing trade in 15 sectors by 2005. But this initiative has not yet achieved the objective.
Before the conclusion of the UR, the government launched the major tariff reform. The objective of the 1994 reform is to improve the competitiveness of Thai exports by substantially reducing the average applied tariff rate from 30% in 1994 to 17% in 1997 and changing the tariff structure. The tariff structure reform is to reduce the number of tariff rates from almost 40 rates to 6 rates based on the value added escalation system. Several tariff reductions were made as part of this reform process in 1996, covering agricultural products, intermediate, parts and components and manufactured good. As a result, import duties fell from 19% of government revenue in 1994 to 13% in 1997.
In the wake of financial crisis in 1997, the government first reacted protectively by imposing high tariffs on imported luxuries and a 10 - percent surcharge on all goods subject to tariffs of 5% or more. But as part of the government’s package of measures to encourage investment, the surcharge was abolished and tariff rates on 600 tariff lines covering inputs used by Thailand’s main industries were reduced in August 1999. Then in August 2000, another round of tariff reductions of intermediate goods was made. As a result, the average applied MFN tariff was lowered to 17% in 1999 and 15% in 2000.
At the same time, Thailand has continued to streamline actual trade measures in order to facilitate international trade. The legislation on customs valuation was passed in 2000. The Customs Department has also streamlined the customs procedures, resulting in shorter time for customs clearance and valuation. Thailand maintains few quantitative restrictions on imports. It has also introduced few trade defense measures in accordance with the WTO rules, i.e., a new Anti-dumping and Countervailing Duty Act in 1999 to replace the old regulations. But it has not yet been able to make effective use of the new measures.
Thailand has made commitments in three areas under the UR Agreement on Agriculture (AoA), i.e., market access, domestic subsidy and export subsidy.
a) Market Access: Thailand has committed to reduce tariffs on 740 tariff lines, resulting in a reduction of 24% over the 1995-2004 period. The average final bound rate will be 32% in 2004, down from pre-UR average rate of 49%. The share of tariff bindings in agriculture has risen to 100% from 98% in 1995. However, the applied tariff rates have been lower than the bound rates. Because of the tariff reductions between 1994 and 2000, the average applied tariff for agricultural products has declined from 43% in 1995 to 32% in 1999 and 28% in 2000 (see Table 1.2).
Table 1-2 Tariff rate for Agricultural product during 1995-2004
|
Products |
Tariff Rate |
Outquota Tariff Rate Reduction (%) |
||||||||||
|
In Quota |
Out Quota |
1995 |
1996 |
1997 |
1998 |
1999 |
2000 |
2001 |
2002 |
2003 |
2004 |
|
|
1. Fresh milk |
20 |
46 |
45.5 |
45.0 |
44.5 |
44.0 |
43.5 |
43.0 |
42.5 |
42.0 |
41.5 |
41.0 |
|
1.1 Flavoured milk |
20 |
93 |
92.1 |
91.2 |
90.3 |
89.4 |
88.5 |
87.6 |
86.7 |
85.8 |
84.9 |
84.0 |
|
2. Skim milk powder |
20 |
240 |
237.6 |
235.2 |
232.8 |
230.4 |
228.0 |
225.6 |
223.2 |
220.8 |
218.4 |
216.0 |
|
3. Potatoes, fresh & chilled |
27 |
139.0 |
137.6 |
136.2 |
134.8 |
133.4 |
132.0 |
130.6 |
129.2 |
127.8 |
126.4 |
125.0 |
|
4. Onions, shallots, fresh & chilled |
27 |
158.0 |
156.4 |
154.8 |
153.2 |
151.6 |
150.0 |
148.4 |
146.8 |
145.2 |
143.6 |
142.0 |
|
5. Garlic, fresh or chilled |
27 |
63.0 |
62.4 |
61.8 |
61.2 |
60.0 |
60.0 |
59.4 |
58.8 |
58.2 |
57.6 |
57.0 |
|
6. Coconut, fresh & dried |
20 |
60.0 |
59.4 |
58.8 |
58.2 |
57.6 |
57.0 |
56.4 |
55.8 |
55.2 |
54.6 |
54.0 |
|
7. Copra |
20 |
40.0 |
39.6 |
39.2 |
38.8 |
38.4 |
38.0 |
37.6 |
37.2 |
36.8 |
36.4 |
36.0 |
|
8. Coffee, coffee husks & skins |
30 |
100 |
99.0 |
98.0 |
97.0 |
96.0 |
95.0 |
94.0 |
93.0 |
92.0 |
91.0 |
90.0 |
|
9. Tea |
30 |
100 |
99.0 |
98.0 |
97.0 |
96.0 |
95.0 |
94.0 |
93.0 |
92.0 |
91.0 |
90.0 |
|
10. Pepper, dried |
27 |
57.0 |
56.4 |
55.8 |
55.2 |
54.6 |
54.0 |
53.4 |
52.8 |
52.2 |
51.6 |
51.0 |
|
11. Maize |
20 |
81.0 |
80.2 |
79.4 |
78.6 |
77.8 |
77.0 |
76.2 |
75.4 |
74.6 |
73.8 |
73.0 |
|
12. Rice, including paddy, broken |
30 |
58.0 |
57.4 |
56.8 |
56.2 |
55.6 |
55.0 |
54.4 |
53.8 |
53.2 |
52.6 |
52.0 |
|
13. Soya bean, edible & inedible |
20 |
89.0 |
88.1 |
87.2 |
86.3 |
85.4 |
84.5 |
83.6 |
82.7 |
81.8 |
80.9 |
80.0 |
|
14. Onion seeds |
30 |
242.0 |
239.6 |
237.2 |
234.8 |
232.4 |
230.0 |
227.6 |
225.2 |
222.8 |
220.4 |
218.0 |
|
15. Soyabean oil & its fractions |
20 |
162.0 |
160.4 |
158.8 |
157.2 |
155.6 |
154.0 |
152.4 |
150.8 |
149.2 |
147.6 |
146.0 |
|
16. Palm oil & its fractions |
20 |
159.0 |
157.4 |
155.8 |
154.2 |
152.6 |
151.0 |
149.4 |
147.8 |
146.2 |
144.6 |
143.0 |
|
17. Coconumt oil & its fractions |
20 |
58.0 |
57.4 |
56.8 |
56.2 |
55.6 |
55.0 |
54.4 |
53.8 |
53.2 |
52.6 |
52.0 |
|
18. Cane or beet sugar |
65 |
104.0 |
103.0 |
102.0 |
101.0 |
100.0 |
99.0 |
98.0 |
97.0 |
96.0 |
95.0 |
94.0 |
|
19. Instant coffee & other extracts |
40 |
55.0 |
54.4 |
53.8 |
53.2 |
52.6 |
52.0 |
51.4 |
50.8 |
50.2 |
49.6 |
49.0 |
|
20. Soyabean cake |
20 |
148.0 |
146.5 |
145.0 |
134.5 |
142.0 |
140.5 |
139.0 |
137.5 |
136.0 |
134.5 |
133.0 |
|
21. Non-manufactured tobacco |
60 |
80.0 |
79.2 |
78.4 |
77.6 |
76.8 |
76.0 |
75.2 |
74.4 |
73.6 |
72.8 |
72.0 |
|
22. Raw silk |
30 |
257.0 |
253.9 |
250.8 |
247.7 |
244.6 |
241.5 |
238.4 |
235.3 |
232.2 |
229.1 |
226.0 |
|
23. Longans, dried |
30 |
59.0 |
58.4 |
57.8 |
57.2 |
56.6 |
56.0 |
55.4 |
54.8 |
54.2 |
53.6 |
53.0 |
Source: Ministry of Commerce
Despite the reduction in average tariff, the average applied tariff rate is still higher than most countries in Asia because there are a large number of tariff peaks in agriculture. About three quarters of tariffs exceeding 50% are in agriculture. Although the applied tariff rates on some agri-food products (particularly those in the meat, dairy and animal products) are very high, the bound rates, which are relevant to imports from WTO members, are much lower.
Thailand has tariffied all of the import quotas for 23 agricultural product groups into the tariff quotas (see Table 1.2) Out of the 23 product groups, 5 groups are either the products in the livestock sector or inputs used for livestock production. Although Thailand has failed to fill the import quotas of 14-15 products, the administration of tariff quotas does not appear to constitute a significant barrier to trade (WTO, 2000). The 23 tariff quotas can be divided into 3 groups. The first group comprises a number of traditional export commodities in which Thailand has strong comparative advantage and hence no need for import protection. They are, for example, rice, sugar, maize, coffee, longan, and coconut. The second group consists of import competing products which are required in large quantities by the agro processing industry, i.e., oil seeds, maize and concentrated milk. The actual imports of these products have exceeded the committed quotas by several times, except in a few years where there are abundant domestic supplies. Moreover, the applied in quota tariffs are also lower than the bound rates. The third groups are also import-competing products which have too small amount of quotas (subject to the low in quota tariffs) to be profitably imported. They are, for example, garlic, coconut oil, and milk. But it is also possible that the Public Warehouse Organization, which is given the sole responsibility for the import of certain quantities of products under the tariff quota, may not be able to profitably carry out its responsibility. It should also be noted some of the products with no imports are actually smuggled through the border. They are onion and garlic.
Although the tariff quota system does not result in significant trade barrier, the administration of quota allocation has always in favor of the large agro processing companies and the producer associations dominated by large - scale processing companies and large-scale commercial farms. As a result, the industrial structure has been affected since it is difficult for the new entrant to break into the markets, which are already dominated by a few oligopolists. In addition to tariff reduction and TRQ, the UR agreement also contains an agreement on trade related investment measures (TRIMS). Thailand used to impose the local requirements (LCR) on the production of a number of agricultural products, e.g., soybean oil, milk and silk. By 2000, only the importers of dairy products are subject to the LCR policy, which requires the importers of skim milk powder in local raw milk. In the case of prepared milk, the LCR is 2 to 1. Thailand was due to abolish the LCR for milk by the end of 1999. But the government has to request the CTG for an approval of an extension of the milk LCR policy until the end of 2003. The waiver is needed as the dairy farmers pressured the government.
b) Domestic Support: Thailand is one of a few developing countries that have notified large amount of trade-distorted domestic support (see Table 1.3). It has committed to reduce the Amber Box domestic support from 21,816 baht million in 1995 to 19,028 baht million in 2004. In addition to the Green Box support, Thailand is also allowed to provide product-specific support under the de minimis measures and support under the special and differential treatment measures which are exempt from the reduction commitment.
Table 1-3 Monetary value of distorting and non-distorting measures 1995 - 2004 and actual AMS 1995 - 1999
Unit: million Baht
|
Year |
Monetary value of measure commit to reduce1 |
Monetary value of measure exempt from the reduction commitment |
||||
|
Bound |
actual AMS |
Actual as a percentage of bound |
Green box2 |
subsidy on input of production 3 |
subsidy on investment4 |
|
|
(1) |
(2) |
(1) / (2) |
||||
|
1995 |
21,816.41 |
15,773.25 |
72.3 |
33,594.33 |
4,310.38 |
1,051.51 |
|
1996 |
21,506.64 |
12,932.47 |
60.1 |
41,145.31 |
9,323.35 |
2,893.96 |
|
1997 |
21,196.87 |
16,756.58 |
79.1 |
47,595.87 |
4,999.69 |
1,902.23 |
|
1998 |
20,887.10 |
16,402.10 |
78.5 |
42,826.82 |
4,600.43 |
529.28 |
|
19995 |
20,577.33 |
17,303.37 |
84.1 |
35,948.93 |
3,058.70 |
78.22 |
|
2000 |
20,267.56 |
(20,846.08)6 |
(100.0) |
- |
- |
- |
|
2001 |
19,957.79 |
N.A. |
(>100%)7 |
- |
- |
- |
|
2002 |
19,648.02 |
N.A. |
- |
- |
- |
- |
|
2003 |
19,338.25 |
N.A. |
- |
- |
- |
- |
|
2004 |
19,028.48 |
N.A. |
- |
- |
- |
- |
Source: Department of Business Economic, Ministry of Commerce
Notes:
1. This category refers to distorting measurements of support, such as price support, price intervention, etc.
2. This category refers to non-distorting measurements of support, such as subsidy on environmental conservation, research and development, establishing infrastructure, production restructuring, and rural development, etc.
3. This category refers to the special and differential treatment allowable for developing countries to provide input of production, such as the measure of financing on cheap seeds and fertilizer, etc.
4. This category refers to the special and differential treatment allowable for developing countries to encourage investment, such as the measure of financing on cheap machinery and appliances, etc.
5. The figure is a preliminary data.
6. Estimated by the author from the Farmer Assistance Fund (Bht 5,189.1 billion), BAAC (Bht 9,872.96 billion) and BOT (Bht 5,784.01). The number is still and overestimate.
7. Available data suggest that actual support might be much larger than the committed support. The proposed budget was Bht 5.2 billion from BOT, Bht 6.18 billion from FAF and Bht 19.96 billion from BAAC.
Tables 1.3 provides the committed and actual support between 1995 and 2001. The actual Amber Box support has steadily increased from 72% of the committed support in 1995 to more or less 100% in 2000. Although there is not yet complete information in 2001, it is believed that the actual support may exceed 100%. This is mainly because of the big jump in expenses for the rice price support program. In addition, Thailand also provide trade distorting subsidy under the de minimis category which jumped from 1,012 baht million in 1995 to 2,342 baht million in 1999.
The livestock sector receives very small amount of total trade distorting subsidy, most of which are in the de minimis category. The products that receive de minimis support are hen eggs, duck eggs, and swine, maize and soya beans. However, the subsidies for those products are only provided in the years of very low prices when there are farmers’ protests or requests.
Export Subsidy: Thailand has notified no export subsidy. However, the government has provided some exempt export subsidies in accordance with the AoA in some years. The subsidies are given only to certain products, particularly rice, in a form of packing credit facility, which are loans, provided to exporters at below-market interest rates. There are also Exim Bank’s credits, which finance the export of rice and other agricultural products.
Livestock Export: This paper will only discuss the performance of livestock trade after the UR agreement. The performance of the agricultural trade is beyond the scope of this paper and can be found in Poapongsakorn, et.al. 2002.
Thailand is one of the major exporters of frozen chicken, thank to the role of the agro-business companies which imported modern technology of chicken raising in the late 1970’s. Chicken exports jumped rapidly from about 40,000 tons in 1985 to almost 180,000 tons in 1992 and then declined to about 150,000 tons in the 1993-97 period. After that it surged rapidly to 220,000 tons in 1998 and jumped again from 245,000 tons in 2000 to more than 300,000 tons in 2001 (see Figure 1.1). Most of the chicken exports goes to Japan. But after 1997, exports to EU have surged rapidly.
Figure 1-1 Thailand’s total chicken exports
Although Thai exporters of chicken should have benefited from increased market access committed by the WTO members, the market access is not the major factor behind the sharp increase in Thai chicken export after 1997. It is true that after the UR Agreement, chicken export to the EU began to increase because Thailand receives export quotas from the EU as part of the compensation for the EU’s oil seeds policy. However, the major markets for Thai chicken exports are still Japan and the Asian market. But total chicken exports did not jump until 1998 after Thailand was badly hit by the financial crisis, which started in July 1997. As a result, the baht was floated and depreciated sharply by more than 40 percent since 1997. As a result, Thai chicken has become more competitive. Moreover, the BSE disease, which hit Europe in 1996 and 2001, has also significantly boosted the exports of Thai chicken to Europe. The flu disease which hit the Chinese chicken industry also helped increase Thai exports to Hong Kong and Japan because both countries import large amount of chicken from China.
Thailand is also the largest exporter of cassava pellets and chips. More than 90% of the export go to EU under the bilateral voluntary export restrain agreement between Thailand and EU. But before the UR conclusion, the EU launched a reform of its Common Agricultural Policy (CAP) in order to reduce the subsidy and the domestic prices of agricultural products. After the reform, the bilateral agreement with Thailand was built into the UR agreement on tariff quota system. Since the CAP reform has resulted in lower prices of cereals, which are raw materials for animal feeds, the demand for Thai cassava pellets has declined significantly. Total exports of cassava pellets to EU have always been less than the 5.25 million ton quotas. Changes in exports will depend on the relative prices of wheat and soybeans, and the exchange rate between the baht and the Euro.
Thai agricultural exports, particularly chicken, have also been subject to complaints and detention by the importing countries that they do not meet the SPS requirements. It is true that the SPS problems faced by some Thai exporters are caused by the below-standard process of production. For example, there are cases in which the importing countries allow imports from Thailand after the problems have been solved, e.g. the problem of URE in frozen chicken export to the Czech Republic (Chulalongkorn University 2001). But there are also doubtful cases of SPS measures imposed by some importing countries. The EU imposes an unrealistic regulation on imported cut-up chicken. The regulation stipulates that the temperature of the meat being cut up must be lower than 4-degree celcius. The Australian government had also delayed in disclosing a report on imported chicken for some years. When bacteria was found in Thai frozen chicken, the Korean officials did not specify the details of the infection. Finally, the Philippines government sent officials to inspect the Thai exporting slaughterhouses in 1998 but has not yet disclosed its report and a decision.
These two cases show that Thailand has not reaped export benefits from the market access committed by the WTO members. Poapongsakorn, et.al. (2002) also shows that Thailand has not been able to exploit the full benefits from the market access granted by the WTO members for Thailand’s major exports of rice and sugar.
Thailand’s exports of oilseeds and their products (e.g., soya beans) are minimal, depending on their surplus supplies in some good years. Egg exports are also very negligible, although Thailand has begun to export egg powder products for almost ten years.
Imports of Dairy Products, Oilseeds and Maize Dairy products, particularly skim milk powder, are major import item, which totaled 64,360 tons in 2001. The actual imports have always exceeded the tariff quota volume, and the applied tariff of 5% is much lower than the bound rate of 20% (see Table 1.2 and 1.4). Despite such large amount of import, some WTO members have complained about the delay in official approval of import.
Table 1-4 Tariff Quota and Tariff rate of Skim milk powder
|
Year |
Skim Milk Powder (Tons) |
Skim Milk Powder Tariff rate (%) |
||||
|
WTO |
Market |
Actual |
In Quota |
Out Quota |
Actual |
|
|
1995 |
45,000 |
55,000 |
55,000 |
20 |
237.6 |
5.00 |
|
1996 |
46,111 |
88,000 |
87,891 |
20 |
235.2 |
5.00 |
|
1997 |
47,222 |
88,000 |
88,000 |
20 |
232.8 |
5.00 |
|
1998 |
48,333 |
88,000 |
78,000 |
20 |
230.4 |
5.00 |
|
1999 |
49,444 |
68,500 |
54,951 |
20 |
228.0 |
5.00 |
|
2000 |
50,556 |
55,600 |
57,117 |
20 |
225.6 |
5.00 |
|
2001 |
51,667 |
65,000 |
64,360 |
20 |
223.2 |
5.00 |
Source: Department of Foreign Trade, Ministry of Commerce
The quota of skim milk powder distributed to the group of five manufacturers (see Table 1.5). These are 1) flavored milk producer 2) the condensed milk producer 3) the other dairy product producer 4) trade company and 5) the exporter company. But in 1995, there are 3 groups; namely, 1) a company; have imported skim milk powder before 2) Dairy Farming Promotion Organization of Thailand and 3) a company; condensed milk. In addition, milk entrepreneurs also imported whole milk powder for the production. The import quotas of whole milk powder were neither limited nor bound to the WTO agreements and it was taxed on the same rate as skimmed milk powder, i.e., and 5 percent. This led to an excess supply of raw milk in 2000 which prompted the government to raise the import tax to 18 percent and pumped in the budget to finance milk in school milk project in order to reduce the excess supply (see Table 1.5)
A second tariff quota is non-concentrated milk and cream. There has been no import of the item since 1995, suggesting that the 20% applied in-quota tariff is prohibitive. It is also more profitable to import milk in concentrated form than in liquid form.
Table 1-5 Quota Allocation of Skim milk powder by group, 1998-2001
|
Year |
Quota quantity allocated (tons) |
Total |
||||
|
Group 1 |
Group 2 |
Group 3 |
Group 4 |
Group 5 |
||
|
1995 |
8,217 |
25,000 |
21,783 |
- |
- |
55,000 |
|
1996 |
35,200 |
32,590 |
14,416 |
5,685 |
- |
87,891 |
|
1997 |
32,800 |
34,800 |
14,700 |
5,700 |
- |
88,000 |
|
1998 |
26,940 |
31,740 |
14,000 |
5,320 |
- |
78,000 |
|
1999 |
14,035 |
27,096 |
10,430 |
3,390 |
- |
54,951 |
|
2000 |
10,849 |
27,589 |
16,830 |
1,850 |
- |
57,117 |
|
2001 |
11,663 |
19,938 |
18,000 |
2,770 |
11,989 |
64,360 |
Source: Department of Foreign Trade, Ministry of Commerce
Despite the LCR policy, Thailand still has to import large amount of skim milk. This means that the demand for milk has increased rapidly as the result of higher income and policy to promote milk consumption in school. Although milk production has also increased at the annual rate of almost 10%, the supply of raw milk is still not enough to meet demand. The phase out of the LCR policy, therefore, will not be expected to seriously disrupt the domestic production because skim milk is not the good substitute for whole milk. However, the world price of milk is still highly distorted by the heavy subsidy in EU. Unless such subsidy is not substantially reduced, Thailand will need to maintain high import tariff to protect the poor dairy farmers who will have difficulty in adjusting to the lower milk prices after the abolition of the LCR policy.
Thailand has also had to import large amount of soybeans, soybean cake and maize as it s livestock sector has been growing rapidly both in response to the larger domestic market and the expanding export markets. Although Thailand may have comparative advantage in maize production, as she used to export maize, the total production has fell short of the higher demand from the animal feed industry in the recent years. In case of soybeans and soybean cake, Thailand does not have much comparative advantage. Despite decades of aggressive promotion and protection, average yield per hectare of soya beans is still disappointingly low and there is serious problem of alfa tax in. Therefore, the government should abolish the tariff quotas for soyabeans, soybean cake and maize and impose as low tariff as possible. Such policy will help maintain the competitiveness of the livestock industry.
As mentioned above, applied tariffs on imports of fresh, chilled, or frozen meat and duck are higher than the WTO bound rates. Moreover, since 1995 tariffs have also been substantially reduced on meat preparation. Therefore, imports of meat and ducks have increased in the recent years.
Table 1-6 Tariff Quota of Maize, Soya bean, Soya bean cake and skim milk powder 1995-2002
|
Year |
Maize (tons) |
Soya bean (tons) |
Soya bean cake (tons) |
Skim Milk Powder (tons) |
||||
|
Bound |
Actual import |
Bound |
Actual import |
Bound |
Actual import |
Bound |
Actual import |
|
|
1995 |
52,096 |
383,209 |
10,402 |
278,934 |
219,580 |
648,035 |
45,000 |
55,000 |
|
1996 |
52,385 |
299,756 |
10,460 |
422,625 |
220,800 |
799,990 |
46,111 |
87,891 |
|
1997 |
52,675 |
194,116 |
10,518 |
655,013 |
222,020 |
916,223 |
47,222 |
88,000 |
|
1998 |
52,964 |
265,789 |
10,575 |
744,049 |
223,240 |
1,070,827 |
48,333 |
78,000 |
|
1999 |
53,253 |
51,528 |
10,633 |
1,264,799 |
224,460 |
1,382,196 |
49,444 |
54,951 |
|
2000 |
53,543 |
50,689 |
10,691 |
1,370,481 |
225,679 |
1,309,869 |
50,556 |
57,117 |
|
2001 |
53,832 |
na |
10,749 |
na |
226,899 |
na |
51,667 |
289,315 |
|
2002 |
54,121 |
na |
10,806 |
na |
228,119 |
na |
52,778 |
64,360 |
Source: Department of Foreign Trade, Ministry of Commerce
Note: Thailand abolished the quota system for soya bean on 1 November 1996
During the past two decades, broiler chicken has become the star of Thai livestock exports. Thailand has just begun to export broilers just over two decades ago and has become one of the leading exporters worldwide. At one point, the amount exported was more than the amount consumed domestically. Last year, Thailand became the fourth largest broiler exporter after the US, Brazil, and slightly behind China.
Broiler chicken has been the most revolutionized livestock sector in Thailand. The success of the broiler revolution is the key that has kept its price down. Three or four decades ago, chicken prices were on par with, or sometimes higher than, pork and fish prices. At present, however, chicken is the least expensive source of protein and Thailand is now a leading broiler exporter. Broiler development has been largely undertaken by the private sector, with little intervention or assistance from the Thai government. In fact, it is arguably the case that the government has impeded its growth by protecting the soybean industry. Unlike cattle, broiler chickens sold today are much smaller in size than in the past. However, the raising period has also been shortened substantially to around 40 days. At the same time, the feed conversion ratio has improved substantially.
One major change in raising broilers in the 1990’s is housing. The evaporative cooling house (“evap house”) - a semi-automatic housing which uses large fans and water to cool down the housing that holds more than 10,000 chickens to 28 degree Celsius or less during the hot season in a tropical country like Thailand - has been attributable to the industry’s cost saving. The evap house could save labor and housing costs. More importantly, it increases growth and survival rates substantially. Many private firms claim that, technology-wise, Thailand’s broiler industry could compete with anyone in the world.[140] According to them, the disadvantage of the Thai broiler industry today is largely due to the government’s policy to protect soybean farmers that has caused the feed prices to be artificially high.
One major disadvantage that has hampered the competitiveness of the broiler industry is feed prices. Thailand is a country where farmers are still the majority of population[141] and the notion of “farmers” in Thailand usually refers to small crop farmers rather than livestock “business”. Therefore, in the last two decades, the MOAC (and, to some extent, the Ministry of Commerce, MOC) has taken pains to protect soybean and maize farmers, resulting in high prices of major animal feeds in Thailand. That Thailand has become a leading broiler exporter was the result of her cheap labor in the past and decades of experience of her major exporters, some of which become transnational corporations that invest not only in Asia but also in the US livestock industry.
Table 2-1 Cost of Raising Broiler in Major Exporting Countries
|
|
Cost (Baht/Kg.) |
|
Brazil |
14.06 |
|
USA |
15.96 |
|
Thailand |
21.66 |
Source: Computed based on US Broiler Performance Data (cited in Jiros, 2002)
Because Thailand’s advantage used to lie on her cheap labor and not on feed price, the types of Thai broiler exports that were most competitive in the past were boneless chicken, which is more labor intensive than boned chicken. This advantage began to cease since the wage rate in Thailand had risen substantially in the 1990’s (up until the financial crisis in 1997) and other Asian countries with cheaper labor costs - especially China and Vietnam--began to catch up on broiler export. Moreover, Thailand began to lose another past advantage, i.e., proximity to Japan, to China, who has become a more increasingly important broiler exporter to Japan in recent years.
As Thailand’s wage rate of unskilled labor soared in the 1990’s, the industry began to realize that it could no longer rely on cheap labor. As a result, some exporters have transformed their broiler export from frozen boneless chickens to processed or precooked chicken (usually in ready-to-reheat or ready-to-eat form). Processed and precooked chicken has become an important part of broiler export and has continued to grow steadily since 1991. In 2000, Thailand export about 69,329 tons of processed chicken, approximately 22.5 percent of the export quantity (see Table 2.2). However, it accounts for 36 percent of the export value (see Table 2.3). Processed chicken, therefore, have become the future of the Thai broiler export, where more emphasis would be placed on value added rather than export quantity or market share.
Table 2-2 Broiler Export Quantity, 1994-1999 (ton)
|
Year |
Frozen Broiler |
Precooked Broiler |
Total Broiler |
|
1994 |
152,903 |
15,996 |
168,899 |
|
1995 |
149,935 |
22,124 |
172,059 |
|
1996 |
137,215 |
31,555 |
168,770 |
|
1997 |
151,120 |
41,641 |
192,761 |
|
1998 |
212,479 |
62,336 |
274,815 |
|
1999 |
217,735 |
47,496 |
265,231 |
|
2000 |
240,905 |
69,329 |
310,234 |
|
2001f |
260,000 |
80,000 |
340,000 |
|
Average Annual Growth Rate 1994-1996 (%) |
-5.3 |
40.3 |
-0.0 |
|
Average Annual Growth Rate 1996-1998 (%) |
26.8 |
39.0 |
29.2 |
|
Average Annual Growth Rate 1998-2000 (%) |
6.5 |
5.5 |
6.2 |
|
Average Annual Growth Rate 1996-2000 (%) |
15.1 |
21.7 |
16.4 |
Source: Department of Business Economics, MOC and Thai Broiler Processing Export Association
Table 2-3 Broiler Export Value, 1994-1999 (million baht)
|
Year |
Frozen Broiler |
Precooked Broiler |
Total Broiler |
|
1994 |
9,846 |
1,850 |
11,696 |
|
1995 |
9,662 |
3,088 |
12,750 |
|
1996 |
9,085 |
3,372 |
12,457 |
|
1997 |
10,951 |
4,951 |
15,902 |
|
1998 |
16,639 |
8,655 |
25,294 |
|
1999 |
15,260 |
5,936 |
21,196 |
|
2000 |
15,689 |
8,750 |
24,439 |
|
Average Annual Growth Rate 1994-1996 (%) |
-4.0 |
35.0 |
3.2 |
|
Average Annual Growth Rate 1996-1998 (%) |
26.8 |
39.0 |
29.2 |
|
Average Annual Growth Rate 1998-2000 (%) |
-2.9 |
0.5 |
-1.7 |
|
Average Annual Growth Rate 1996-2000 (%) |
14.6 |
26.9 |
18.3 |
Source: Department of Business Economics, MOC and Thai Broiler Processing Export Association
Table 2-4 Background of broiler industry in Thailand
|
|
1998 |
1999 |
2000 |
2001(p) |
2002(f) |
|
Number of chicken raised (million birds) |
780 |
855 |
884 |
958 |
978 |
|
Production (‘000 tons) |
883 |
968 |
1,070 |
1,205 |
1,290 |
|
Consumption (‘000 tons) |
609 |
694 |
737 |
785 |
830 |
|
Export (‘000 tons) |
275 |
274 |
333 |
420 |
460 |
|
Export growth (%) |
42.0 |
0.0 |
21.5 |
26.1 |
9.5 |
|
Share of Export (%) |
31.1 |
28.3 |
31.1 |
34.9 |
35.7 |
Source: Thai Broiler Processing Export Association
Table 2-5 Broiler export in 2001
|
Destination |
Quantity (ton) |
Share (%) |
% Growth from 2000 |
|
Japan |
218,400 |
52 |
22 |
|
EU |
151,200 |
36 |
44 |
|
Other countries |
50,400 |
12 |
3 |
|
Total |
420,000 |
100 |
26 |
Source: Thai Broiler Processing Export Association
Note: preliminary data
There are also other two major trends that have affected the future of Thai broiler export, and possibly the way broilers are raised. First, consumers in developed countries have given more recognition on animal welfare. At present, the European Union (EU) has taken this issue on both broilers and layers. Many Thai exporters view the measure as protectionism. However, since the EU has been Thailand’s most important export market for broilers, major Thai exporters tried to comply with those standards. Many large-scale firms are rather optimistic, since they believe that Thailand is in a better position to follow these guidelines than a major competitor like the US. Many also push the Department of Livestock Development (DLD), Ministry of Agriculture, to set farm standards that would comply with the EU’s White Paper on Food Safety and Directives on Animal Welfare. Consequently the DLD has announced the “Farm Standard”--based on the EU standard, which would become compulsory for all exporting broiler farms in October 2002. In addition, some veterinarians have pointed out that following animal welfare guidelines has resulted in an increase in survival and growth rate and hence productivity rather than decreasing efficiency as many have feared.
The second trend is the emerging market of antibiotic-free broilers - especially in Japan. The Japanese importers used to pay about 20% premium for the antibiotic-free broilers, which is sufficiently high to cover the increased costs. However, as more broiler farms in Thailand are capable of raising and exporting antibiotic-free broilers, the premium appears to decrease. The EU does not require antibiotic-free broilers. However, it requires that the growers stop using antibiotics and vaccines for a certain period before slaughter.[142] Both countries’ more stringent demand has resulted in better farm management that have led to a reduction of antibiotic use in the broiler industry.
“Farm to table” is another measure on trace-ability that has transformed the Thai broiler industry. Since most large scale farms rely heavily on export, this effective tracking scheme forces them to comply with the export standard to avoid heavy punishment if they fail to comply.
As for the domestic market, the success of the broiler industry in keeping chicken prices down has contributed to a continual increase in chicken consumption in Thailand. Domestic per-capita broiler consumption has increased gradually from 3.5kg per annum in 1973 to around 12kg per annum in 1997. Per capita consumption had decreased slightly after the financial crisis, but has since rebounded to the 12 kg per annum in the year 2000 (Table 2.6).
Table 2-6 Per Capita Chicken Consumption, 1973-2001 (Kg./year)
|
Year |
Per capita consumption (Kg./year) |
|
1973 |
3.5 |
|
1977 |
4.0 |
|
1981 |
5.0 |
|
1982 |
5.5 |
|
1987 |
7.0 |
|
1990 |
7.8 |
|
1991 |
8.2 |
|
1992 |
8.2 |
|
1993 |
8.7 |
|
1994 |
9.2 |
|
1995 |
10.3 |
|
1996 |
11.2 |
|
1997 |
11.8 |
|
1998 |
10.8 |
|
1999 |
11.5 |
|
2000 |
11.8 |
|
2001 |
12.6(p) |
Source: Thai Broiler Processing Export Association
In the past, stringent export standards have led to a dual standard system where the domestic market is flooded by lower quality chicken (including chicken with more residuals such as antibiotics). Since, however, the majority of export now is not the whole bird but of certain parts (e.g., white breast to the EU and tight to the Japan), the rest of the chicken sold in the supermarket are more likely to be of the same export standard. More importantly, technological changes induced by export demand have spilled over to the rest of the industry because of its superiority in terms of efficiency.
Technological changes in the past two decades could be summarized in three interrelated areas, namely, breeding stocks, housing, and farm management. Together these have improved efficiency substantially, via decreasing raising day per crop and feed conversion ratio.
Table 2-7 Changes in day required in raising chicken 1983-2001
|
Year |
Days required to raise chicken |
||
|
Size 1.5 kilogram |
Size 1.8 kilogram |
Size 2.4 kilogram |
|
|
1983 |
|
56 |
|
|
1989 |
|
49 |
|
|
1994 |
|
45 |
|
|
2001 |
30 |
38 |
50 |
Source: Personal correspondence with Dr. Kitti Supchusakul
Breeding stock improvement has been crucial. However, Thailand, like most other countries, has to rely on foreign know-how (although CP, a Thailand-based MNC, owns a share of Arbor Acres and use to own the Avian brand solely). At present, grandparent stocks are solely imported and domestic improvements are unlikely in the foreseeable horizon.
Evaporative housing has accounted for productivity improvement (see Table 2.8) and as a result, it has become standard housing in the commercial broiler farms. At present, the import content is still high, although there are an increasing number of modified models of evaporative housing that substitutes some expensive equipment with local equipment, which are more cost-effective.[143]
Table 2-8 Feed Conversion Ratio in Broiler Production
|
|
Feed Conversion Ratio |
|
1980 |
2.2 |
|
1990 (before Evap Housings) |
1.9 |
|
2002 Present |
1.75 |
Source: Personal correspondence with Dr. Kitti Supchusakul
For farm management, although most of the know-how comes from abroad, the main pecuniary elements are animal drugs and vaccines. These elements are of concern, both in terms of cost and food safety. It turns out, however, that the solutions also come from abroad. As the requirements on food safety are more stringent over time, farms are required to rely more on non-chemical solutions and less on drugs and vaccines. In this respect, the broiler sector, which is highly dependent on the export market, has moved in the right direction. At present, drugs and vaccines account for about 4-5% of the cost (1.8 Baht per broiler). This is still substantially higher than in the US (about 1%). However, the figure is much better than in the past and far better than in other non-tradable livestock in Thailand, specifically in the swine industry.
One management technique is all-in-all-out system where chickens from every housing within a farm would be brought in or out in a short window period. This technique helps reduce the chance of disease outbreak greatly. It should be noted that in order to use this technique, each major buyer/contractor would have to have large market and own, or have contracts with, several farms so that it would be able to deliver broilers on a continuous basis.
As most of the new technologies are imported, they have replaced most of the domestic or indigenous ones. There are nearly three million farmers who raise chickens in their backyards as a supplement product, mostly for household consumption. As for the commercial broiler farms, concentration has been increasingly immense as the top 14 players now account for about 80% of broiler production.
Unfortunately, the data on farm sizes and their distribution are rather shaky. Table 2.9 shows figures from the 1993 agricultural census and the 1998 intercensus survey. The way the data were reported could not distinguish broiler farms from layers farms or native chicken farms. According to these figures, the total number of farm holdings who raise chickens had increased between 1993-1998. However, the number of farm sizes of 500-999 and 10,000 birds and over had decreased.
Table 2-9 Distribution of Farm Size (from 1993 Agricultural Census and 1998 Intercensal Survey)
|
Chicken farm size distribution in 1993 (data from the 1993 Agricultural Census) |
|||||
|
Number of Chickens in holding |
Number of Chickens |
||||
|
Holdings |
Layers |
Broiler |
Native |
Total |
|
|
Total |
2,617,412 |
23,652,272 |
85,732,946 |
45,536,712 |
154,921,930 |
|
1 - 19 |
1,681,300 |
145,222 |
228,319 |
13,797,401 |
14,170,942 |
|
20 - 99 |
863,809 |
368,816 |
494,451 |
25,338,318 |
26,201,585 |
|
100 - 499 |
53,064 |
860,693 |
937,310 |
5,637,994 |
7,435,997 |
|
500 - 999 |
3,861 |
768,119 |
925,821 |
686,542 |
2,380,482 |
|
1,000 - 9,999 |
13,042 |
7,343,599 |
37,685,107 |
71,381 |
45,100,087 |
|
10,000 and over |
2,336 |
14,165,823 |
45,461,938 |
5,076 |
59,632,837 |
|
Chicken Farm Size Distribution in 1998 (Data from the 1998 Intercensal Survey) |
|||||
|
Number of Chickens in holding |
Number of Chickens |
||||
|
Holdings |
Layers |
Broiler |
Native |
Total |
|
|
Total |
3,174,410 |
33,830,791 |
78,103,454 |
57,168,254 |
169,102,499 |
|
1 - 19 |
1,947,507 |
190,478 |
218,401 |
16,753,480 |
17,162,359 |
|
20 - 99 |
1,145,746 |
604,529 |
632,623 |
32,835,685 |
34,072,837 |
|
100 - 499 |
63,262 |
514,985 |
895,493 |
6,984,260 |
8,394,738 |
|
500 - 999 |
2,562 |
538,982 |
609,656 |
540,112 |
1,688,750 |
|
1,000 - 9,999 |
13,275 |
10,735,346 |
41,909,323 |
47,339 |
52,692,008 |
|
10,000 and over |
2,058 |
21,246,471 |
33,837,958 |
7,378 |
55,091,807 |
Source: MOAC, 1993 Agricultural Census and 1998 Intercensal Survey of Agricultural Change
The other main source of data on farm size is the DLD which gathers information from its provincial offices throughout the country. Table 2.9 shows the distribution of broiler farm size in 1995 and 1999, according to the DLD. Although the figures are from the same source (DLD), the categories are not the same for both years. Furthermore, the farm size intervals are probably too crude for present standards, as there is no classification of farm size over 10,000 birds.
Table 2-10 Broiler Commercial Farm Size by Region, 1995 and 1999
| |
Farm Size Distribution 1995 |
|||||
|
500-2,000 |
2,001-5,000 |
5,001-10,000 |
10,000+ |
Total |
||
|
Central |
358 |
883 |
527 |
300 |
2,068 |
|
|
North |
18 |
48 |
51 |
15 |
132 |
|
|
Northeast |
41 |
239 |
161 |
32 |
473 |
|
|
South |
186 |
83 |
18 |
10 |
297 |
|
|
Whole Country |
603 |
1,253 |
757 |
357 |
2,970 |
|
|
Avg. farm size in group |
1,375 |
3,954 |
7,685 |
43,590 |
|
|
| |
Farm Size Distribution 1999 |
|||||
|
50-1,000 |
1,001-2,000 |
2,001-5,000 |
5000+ |
Total |
||
|
Central |
773 |
652 |
2,438 |
1,792 |
5,655 |
|
|
North |
128 |
80 |
483 |
312 |
1,003 |
|
|
Northeast |
127 |
101 |
970 |
540 |
1,738 |
|
|
South |
162 |
299 |
563 |
251 |
1,275 |
|
|
Whole Country |
1,190 |
1,132 |
4,454 |
2,895 |
9,671 |
|
Source: DLD
Based on Table 2.10, the number of farms of every size has increased substantially between 1995 and 1999. A recent press release by the DLD in February 2002 stated that the number of exportable broiler farms was then 17,037, also a huge increase from the DLD’s 2001 figure (15,036 farms) and almost twice the 1999 figure. My reservation on these figures is that the low-level officials in the DLD might find it compelling to report continual increasing number of farms in every size, since they believe that their performance would be evaluated based on these figures.
Even when the official figures indicate that the number of small broiler farms continue to increase, most experts in the field agree that, as the commercial sector become more and more industrialized, small farms are going out of the business. At present, the farm sizes considered “too small” to compete in this industry are the ones with 50,000 birds or less. In most cases, the owners of these farms are middle class businessmen rather than traditional farmers. Although there has been no systematic survey on how these outgoing firms doing after leaving the business, people in the business I have interviewed informally believe that these businessmen simply switch to other business - mainly agro-business, with various level of successes (and failures) in their new businesses.
The layer industry is much smaller than broilers. During the last 5 years, the stock of hen layers is in the range of 41-42 million (including approximately 10 million chicks), compared to approximately 100 million of broiler stock. Total egg production is approximately 8-9 billion annually. During the last five years, more than 99 percent of hen eggs were consumed domestically. The remaining, which is generally less than or around one percent, is exported (see Table 2.11). Most of exported eggs go to Hong Kong, the Middle East, and to a lesser extent, Japan.[144] The export venue is use to dump surplus eggs abroad to stabilize the domestic price. Usually the export prices of eggs are considerably less than domestic prices.
Table 2-11 Number of Hens, Hen Egg Production, Export, and Per Capita Consumption, 1989-2001.
|
Year |
Number of Layers and Young Hens |
Total Hen Egg
Production |
Total Hen Egg Export |
Per Capita Consumption |
|
1989 |
31.8 |
6,682 |
51.7 |
120 |
|
1990 |
36.5 |
8,165 |
85.3 |
145 |
|
1991 |
41.5 |
8,609 |
102.4 |
150 |
|
1992 |
38.9 |
8,154 |
41.8 |
142 |
|
1993 |
35.2 |
7,336 |
11.6 |
126 |
|
1994 |
37.4 |
7,728 |
17.1 |
131 |
|
1995 |
41.5 |
8,609 |
24.2 |
145 |
|
1996 |
41.0 |
8,619 |
64.6 |
142 |
|
1997 |
42.0 |
9,023 |
49.2 |
142 |
|
1998 |
41.8 |
8,675 |
99.2 |
140 |
|
1999 |
40.8 |
7,943 |
27.8 |
135 |
|
2000 |
41.7(f) |
8,233(f) |
88.6 |
141(e) |
|
2001 |
39.6(f) |
7,923(f) |
80(e) |
139(e) |
Source: Office of Agricultural Economics (OAE), MOAC
Note: f=forecast, e=estimate
In the past, there were numbers of small hen farmers throughout the country. That should not be surprising since almost all the eggs produced are for domestic consumption, which is fairly distributed to various regions, except for big cities like Bangkok where demand for eggs is much larger. However, the yields in those small farms are relatively low (less than 260 eggs/hen-year) compared with those of high-tech farm that use “Evap Houses” to keep the inside-temperature down and could increase the yield per chicken to more than 280 or even more than 300 eggs/hen-year. Consequently, smaller farms with 20,000 layers or less began to disappear and are replaced by farms with high technology, especially in Nakorn Pathom and Nakorn Nayok where almost all new farms has more than 2 million layers per farm. The number of farms has decreased. As of today, according to experts in the field, there are about a dozen of large farms (each of which has more than one million layers) whose market shares combined are about two-thirds of the egg market. Again, the official figures of farm size distribution are shaky. The DLD is the only source that publishes the data occasionally. According to the DLD figures, the number of small commercial farms (100-1,000 hen) decreased substantially in 2001, but numbers of larger farms of all sizes increased.
Table 2-12 Layer Farm Size, 2001
| |
Year |
|||
|
2000 |
2001 |
|||
|
Farm Size (# of hens) |
Number of Farms |
% |
Number of Farms |
% |
|
< 100 |
n.a. |
n.a. |
2,219 |
35 |
|
100-1,000 |
2,779 |
54 |
1,502 |
24 |
|
1,001-10,000 |
2,053 |
40 |
2,170 |
34 |
|
10,001-100,000 |
241 |
5 |
373 |
6 |
|
>100,000 |
29 |
0.6 |
40 |
0.7 |
|
Total |
5,102 |
100 |
6,304 |
100 |
Source: DLD
The fact that some eggs are exported at a price below domestic ones involves some type of export subsidy. In some occasions, part of the subsidy comes from the government in terms of low-interest loans or, to a lesser extent, outright export subsidy. However, in many occasions, it is the large players’ agreement (through professional associations) to take a cut in order to stabilize the domestic price. Furthermore, the fact that less than one percent of eggs was exported each year suggests that these associations have been fairly successful in controlling the supply of eggs controlling the number of breeding stock. This is possible because there are less than a dozen large players whose farm sizes are more than one million layers and who also import, raise, and supply the breeding stock, even though their market shares of eggs combined is about two-thirds of the total egg supply.
Domestic per capita consumption of eggs had increased continuously to 142 eggs per year in 1997. After the crisis hit, per capita consumption of eggs decreased slightly in 1998 and 1999, but appear to rebound back in the year 2000.
Technological changes in the layer subsector resembled the changes in the broiler industry, albeit slower. The “Evap Houses” continue to replace open-house farms to increase productivity. Smaller farms with 20,000 layers or less, as well as the ones in which yields are below 260 eggs/hen-year continue to disappear and are replaced by larger farms with high technology. As with broilers, the owners of those smaller farms who are out of this business often switch to other businesses, especially to another agro-businesses (including many shrimp farms in the eastern region).
In very early days, pig farming in Thailand always meant backyard pig farming where farmers kept a few native pigs for piggery saving and for utilization of household waste. Thai-native pigs were black in color, with an arched back, slow growth, fatty carcass and attained market size at 70kg body weight in approximately 12 months. Although they were high prolificacy, they are inappropriate and uneconomical to employ for commercial pig production.
Development of the pig industry began in 1960 when DLD, introduced modern exotic pig breeds including Large White, Berkshire and Tamworth from England for breeding and improvement of pigs in the country. The animals were multiplied and distributed to pig farmers in the rural via regional livestock breeding and improvement stations of the DLD and via the pig breeding farms co-operated to the DLD. The animals significantly upgraded the Thai-native pigs and the up-graded crossbreds had improved performance, better conformation and better carcass quality. Because of the results farmers have moved towards modern pig production technology and have initiated pig production development of the country. However, only Large White and Tamworth were widely accepted by the farmers since Berkshire are black in color which is not favored by the Thai consumers.
Department of Animal Science, Kasetsart University has introduced American Landrace and Duroc Jersey for the university's pig breeding program. The animals were multiplied and distributed to farmers for further upgrading of native pigs. The animals were very sturdy and had good adaptability for tropical environment and to the farm management practices of the backyard farmers in the country. The animals also had superior performance to those earlier imported by DLD and made US pigs become popular until the end of the 80’s.
The up-graded crossbreds or the improved breed animals had better performance including higher average daily gain, better feed efficiency and carcass quality (higher lean content), and required better nutrition, better farm management practices and more a complicated vaccination program than ever. It took many years for farmers to learn and to understand the logic and the situation has caused some painful experiences to farmers in the country.
Commercial protein concentrate feeds and feed supplements had supplied better nutrition for the improved performance animals and have greatly helped to facilitate the success of pig industry development in those days.
DLD and Co-operatives provided training courses on modern pig production and farm management to farmers and organized certified pig breeding farms to be provincial pig breeding centers for further pig breeding and improvement, and for distribution of the genetic improved pigs to farmers in the area. The practice has significantly improved and helped the development of the national pig industry.
In 1975, DLD and Kasetsart University had a joint cooperation in the National Pig Improvement Project and National Swine Research and Training Center located at Kasetsart University, Kampaengsaen, Nakhon Pathom was setup as the body of the project. The program was aimed at making a sustainable pig industry development in the country and the center’s activities to attain the objectives of the program included:
Pig breeding and improvement and distribution of the improved pig breeds to the farmers.
Research of improvement of pig production under Thai condition including nutrition, feed ingredients utilization, farm management, diseases control programs, etc.
Extension working including farmer training courses consisting of 1) Pig production training courses (21 days); 2) Pig nutrition and feed production training course (7 days); 3) Artificial insemination (5 days); 4) Pig health and farm sanitation training course (7 days); 5) Pig production short course (2 - 3 days) conducted at provinces throughout the country, and together with technical publications i.e. Pig Magazine and text books and general consultation to the farmers.
Promotion of provincial pig co-operatives activities including the co-op member swine production training, and advice on operation of co-op breeder farms, feed mill and pork outlets.
The Center has produced more than 5,000 farmers who passed the training courses; a large number of genetically improved pigs were distributed to farmers for breeding and improvement of the farms; more than 250 topics of research topics dealing with pig production improvement and the knowledge was transferred to farmers via the farmer training courses and publications. Farmers who passed the training course have been served as the leading farmers in the area and have contributed a significant improvement to the national pig industry. Promotion of provincial pig co-operatives activities is aimed at improving pig production practice of small-scale pig holders and to provide survival of the farmers in the pig industry. Although the results of the activities are not fully satisfied at a moment, a few pig co-operatives have gained some successful and have proved the feasibility of pig co-operatives system in Thailand.
During 1975 - 1979, Chareonphokpand Co., Ltd. (CP) have introduced modern pig breeds (Zegher and Hy-Por) and more intensive pig housing and management system from Belgium to farmers in Thailand. Although the pig breeds were not accepted by pig farmers due to more sensitivity to stress conditions in the country, the practices have excited the farmers for high performance and high lean European pigs as well as for the more advanced and more intensive modern pig production. Introductory of European pig breeds and pig farm management systems have influenced the changing of pig production in Thailand and have subsequently caused a number of developments in the pig industry of the country.
Pig production in Thailand is an open competitive business among pig producers which include independent private farmers ranging from small scale to extra - large scale pig holders, feed mill companies’ dependent farmers as well as the feed mill companies pig farms. There are apparently minimum supports or protection from the government for independent farmers especially small-scale holders to be survived in the business. It is necessary for every class of pig producer to be knowledgeable, highly developed and highly efficient in order to minimize the cost of production and to survive in the industry.
There have been tremendous changes in pig production technology in Thailand in the past 15 years, which are influenced by the changing consumer preferences, the degree of competition of the industry and the public concern for environmental pollution by the pig farms. The changes include breeds of animals, nutrition, housing and farm management systems, vaccination program as well as waste treatment and disposal system.
High performance/high lean European pigs dominated by Danish Landrace and Duroc and British Large White have been widely adopted by pig production industry. Animals from other sources i.e. Ireland and Norway have also been introduced but popularity is still limited. European pigs have high growth rate, efficient feed conversion and high lean content in the carcass. Results of performance testing of European pigs conducted by National Swine Research and Training Center, Kasetsart University have indicated that the animals that have been bred and selected in Thailand have production performances and carcass quality close to those reported from the original country (Table 3.1). The data have indicated the ability of the animals to adapt for the tropical region and the suitability for commercial pig production.
Table 3-1 Growth rate (g/d) of purebred pigs, which have been bred and selected in Thailand tested at National Swine Research and Training Center, Kasetsart University, Kampaengsaen, Nakhon Pathom in 1994
|
Body wt. (kg) |
Landrace |
Large White |
Duroc |
Average |
|
50 |
848 |
802 |
844 |
834 |
|
60 |
718 |
775 |
726 |
737 |
|
70 |
879 |
753 |
901 |
854 |
|
90 |
732 |
909 |
756 |
788 |
|
Average |
794 |
809 |
806 |
803 |
Source: Kanto (1994)
The classical three - way crossbreds, Landrace (Large White (Duroc, for market pigs is still popular and widely accepted in the industry. The crossbreds generally produced by the crossing of Duroc boar which is meaty and sturdy with the two - ways crossbred, Large White (Landrace sows which is high prolific and has good carcass quality. The crossbreds, which are quite sturdy under hot climate condition and have quite satisfactory carcass quality, have been proved to be appropriate for the tropical country. The two-ways crossbred gilts normally produced by pig breeding farm or companies and sold to fattening pig farms for production of three - ways crossbred market pigs. Commercial fattening pig farms always have farrow to finish facilities and produce their own three-ways crossbred for the marketing pigs. The practice is not only allowed the steady supply of the feeder pigs for fattening but also facilitate the control of feeder pigs quality of the farms. Purchasing of feeder pigs from outside is very risky for market pig production due to unsteady supply, uncontrollable genetic background, poor quality and poor health status of the animals, which lead to unsuccessful of fattening pigs production.
Artificial insemination by using fresh semen produced in the farm has been widely accepted by commercial pig farms ranging from medium to extra-large scale holders. The practice have been continuously developed and not only provide high conception rate comparable to the natural mating but also require minimum number of boars used and allow better utilization of high quality boars for market pig production in the farms. Artificial insemination can provide farrowing rate ranging from 75-90 % and require a boar for 45 - 60 sows. The practice also allows the uses of external high quality semen or imported semen for breeding and herd improvement of the farms. National Swine Research and Training Center, Kasetsart University, Kampaengsaen, Nakhon Pathom have provided a training course in swine artificial insemination and more than 1,500 farmer have attended and passed the training course since 1987. The activities have stimulated the acceptance of AI in the pig farms and also have provided a continuous development of AI technology to the industry. It is estimated that more than 60 % of commercial pig farms in the country have employed AI. Small scale pig holders which have less than 50 sows in the farms may not feasible to employ AI in the farm due to high cost of the AI equipment, less knowledge and skills of operation and still affordable for a few boars in the farms. However, a number of small-scale pig holders have been using AI with a very considerably success.
There have been attempts to introduce commercial hybrid pig breeds into the country but the success was very limited. Zegher and Hy-Por from Belgium, NeuDalland from the Netherlands, and DeKalb and PIC from the United states have been introduced into Thailand during the 70 's, 80 's and 90 's, respectively and non of them have been widely accepted by the farmers. Although genetics of commercial hybrid pig breeds are well controlled and well combined to produce the high performance and high carcass quality market pigs. The animals are always less sturdy in tropical climate and are more expensive than the purebred pig breeds. Acceptance of the classical three-way crossbreds, LR (LW (D, for market pig production have allowed the farmers to design their own breeding program and more selection of pig breed lines to produce more suitable market pigs under their production condition and market demands. In additional, there are more sources of supply of purebred pig breeds than those of the commercial hybrid pig breeds, which allow more flexibility for farmers to manage the pig breeding program of the farms.
It is common for commercial pig farm to adopt high nutritional specification for animal in the farm. High performance/high lean pigs which require higher amount of nutrient (protein, amino acids vitamins and minerals) in a day together with lower feed intake of the animals in the hot weather have forced the farmers to go with high protein and high amino acids diets for optimum growth and maximum lean content of the pigs. There has been a study indicating that although the low feed intake of animals in the tropical climate, optimal growth and lean content as well as the lowest feed cost per gain were archived when growing and finishing pigs have absolute amount of lysine and other amino acids intake according to the requirement in a day (Tables 3.2, 3.3 and 3.4). There are different feed intakes among the pig farms due to the variation of environmental conditions therefore different nutritional specification are required for the optimum production performances and for the lowest cost of production.
Table 3-2 Performances of growing pigs (15 - 50 kg) fed diets containing varied levels of lysine
|
Pig Performance |
Lysine (g/kg) |
|||
|
9.5 |
10.5 |
11.5 |
12.5 |
|
|
Initial wt. (kg) |
17.41 |
16.98 |
17.42 |
17.32 |
|
Final wt. (kg) |
50.38 |
50.06 |
50.38 |
51.99 |
|
Feed intake (kg-d) |
1.45 |
1.42 |
1.45 |
1.48 |
|
Lysine intake (g-d) |
13.78 |
14.91 |
16.68 |
18.50 |
|
ADG (g) |
598b |
624a |
604a |
736a |
|
FCR |
2.44c |
2.29b |
2.10a |
2.20a |
|
Feed cost (Baht/kg) |
7.04 |
7.21 |
7.36 |
7.53 |
|
Cost of gain(baht/kg) |
17.18c |
16.48bc |
15.47ab |
15.20a |
Source: Panacharoensawat (1995)
Table 3-3 Performance of finishing pigs (50 - 90 kg) fed diets containing varied levels of lysine
|
Pig Performance |
Lysine (g/kg) |
|||
|
7.5 |
8.5 |
9.5 |
10.5 |
|
|
Initial wt. (kg) |
50.38 |
50.06 |
50.38 |
51.99 |
|
Final wt. (kg) |
91.43 |
91.83 |
91.81 |
92.26 |
|
Feed intake (kg-d) |
2.18 |
2.23 |
2.26 |
2.29 |
|
Lysine intake (g-d) |
16.35 |
18.96 |
21.47 |
24.05 |
|
ADG (g) |
715b |
795ab |
823a |
862a |
|
FCR |
3.08b |
2.18a |
2.77a |
2.68a |
|
Feed cost (Baht/kg) |
6.27 |
6.43 |
6.59 |
6.75 |
|
Cost of gain(baht/kg) |
19.33 |
18.01 |
18.30 |
18.09 |
Source: Panacharoensawat (1995)
Table 3-4 Performances of growing -finishing pigs (15-90 kg) fed diets containing varied levels of lysine
|
Pig Performance |
Lysine (g/kg) |
|||
|
9.5/7.5 |
10.5/8.5 |
11.5/9.5 |
12.5/10.5 |
|
|
Initial wt. (kg) |
17.24 |
16.98 |
17.42 |
17.32 |
|
Final wt. (kg) |
91.43 |
91.83 |
91.81 |
92.26 |
|
Lysine intake (15-50 kg) |
13.78 |
14.91 |
16.68 |
18.50 |
|
Lysine intake (50-90 kg) |
16.35 |
18.96 |
21.47 |
24.05 |
|
ADG (g) |
653c |
715bc |
755ab |
2.38a |
|
FCR |
3.08b |
2.81a |
2.77a |
2.68a |
|
Lean(%) |
47.40 |
47.88 |
48.67 |
51.45 |
|
Cost of gain(baht/kg) |
18.21 |
17.23 |
16.42 |
16.74 |
Source: Panacharoensawat (1995)
Recommendations of nutrient specification of high performance pig feeds under Thailand conditions are shown in Table 3.5. The tested levels of dietary lysine and other amino acids employed in commercial pig farms in the country are in good agreement with the above recommendation. It is necessary for the farmers therefore to produce their own feeds at the farm since nutritional specification can be adjusted according to absolute nutrient requirement of the animals in the farm.
Table 3-5 Recommendations of nutrient levels in feeds for high performance and high lean European pigs under Thai conditions
|
|
Weaning -15 kg |
15-25 kg |
25-50 kg |
50-100 kg |
Gestation |
Lactation |
|
Crude Protein (%) |
22.00 |
20.00 |
18.00 |
16.00 |
15.00 |
17.00 |
|
Lysine (%) |
1.40 |
1.20 |
1.00 |
0.90 |
0.70 |
0.85 |
|
Met + Cys (%) |
0.84 |
0.72 |
0.60 |
0.54 |
0.42 |
0.51 |
|
Tryptophan (%) |
0.26 |
0.23 |
0.19 |
0.17 |
0.13 |
0.16 |
|
Threonine (%) |
0.84 |
0.72 |
0.62 |
0.54 |
0.42 |
0.51 |
|
Isoleucine (%) |
0.84 |
0.72 |
0.60 |
0.54 |
0.42 |
0.51 |
|
Leucine (%) |
1.57 |
1.34 |
1.12 |
1.00 |
0.78 |
0.95 |
|
Phe + Tyro (%) |
1.68 |
1.44 |
1.20 |
1.08 |
0.84 |
1.02 |
|
Valine (%) |
1.05 |
0.90 |
0.75 |
0.67 |
0.53 |
0.64 |
|
ME (kcal/kg) |
3,300 |
3,300 |
3,150 |
3,150 |
3,050 |
3,150 |
|
Calcium (%) |
1.10 |
1.10 |
1.00 |
0.80 |
0.80 |
1.00 |
|
Avail. Phos. (%) |
0.80 |
0.80 |
0.75 |
0.60 |
0.60 |
0.80 |
|
Fat (min %) |
3.00 |
3.00 |
- |
- |
- |
- |
|
Salt (%) |
0.35 |
0.35 |
0.35 |
0.35 |
0.35 |
0.35 |
|
Crude fiber (max%) |
3.00 |
4.00 |
5.00 |
7.00 |
10.00 |
7.00 |
Source: Kanto (1994)
Commercial feeds both protein concentrate feeds and complete feed for pigs are produced under feed law regulation controlled by Department of Livestock Development, Ministry of Agriculture and Co-Operatives which have shown in Tables 3.6 and 3.7. The regulated nutrient specifications are generally lower them the requirement of high performance/high lean pigs in the tropical region and regulation of essential amino acid levels are not existed. Production of the commercial feeds may use some alternative low quality feed ingredients, i.e. cottonseed meal, kapok seed meal, rapeseed meal which are cheap but contain toxics substances and affect to animal performances. Feeding of the commercial feeds to high performance/high lean pigs by either small scale or large scale farmers always cause poor growth, poor carcass quality, poor feed conversion ratio, poor animal health status and high medication cost which always leading to high production cost but low selling price of the animals. It is the reason that farmers always producing their own feed at the farms.
Table 3-6 Nutrient specification of commercial pig feeds regulated by Department of Livestock Development, Ministry of Agriculture and Co-operatives
|
Periods /Body weight |
Crude Protein min.% |
Fat |
Crude fiber max. % |
Moisture max. % |
|
Birth - weaning |
20 |
4 |
3 |
13 |
|
Weaning - 15 kg |
18 |
3 |
4 |
13 |
|
15 kg - 30 kg |
16 |
3 |
7 |
13 |
|
30 kg - 60 kg |
14 |
3 |
8 |
13 |
|
60 kg - marketing |
12 |
2 |
8 |
13 |
|
Gestating sows |
14 |
3 |
10 |
13 |
|
Lactating sows |
16 |
3 |
10 |
13 |
Source: Department of Livestock Development, Ministry of Agriculture and Co-operatives
Table 3-7 Growth promoters and maximum usage in pig feeds allowed by Department of Livestock Development, Ministry of Agriculture and Co-operatives
|
Growth promoters |
Max. Usage mg/kg |
Growth promoters |
Max. Usage mg/kg |
|
Chlortetracycline |
50 |
Avilamycin |
- |
|
Enramycin |
20 |
Momensin sodium |
- |
|
Flavophospholipol |
10 |
Thiopeptin |
22 |
|
Lincomycin |
- |
Efrotomycin |
16 |
|
Oxytetracycline |
50/10 |
Nitrovin |
20/10 |
|
Tylosin |
40 |
Lasalocid sodium |
- |
|
Zinc-Bacitracin |
50 |
Virginiamycin |
15 |
|
Spiramycin |
20 |
|
|
Source : Department of Livestock Development, Ministry of Agriculture and Co-operatives
Pig farmers generally buy commercial creep feed and starter feeds, which require complicated formulae, high quality feed ingredients, pelleting process and are unable to be effectively produced by farmers. However, a number of pig farms in Thailand have produced their own mashed pig farms in starter feeds in order to minimize the feed cost and to obtain the optimum performances of the weaned pigs in the farms. More availability of high quality feed ingredients and feed additives i.e. whey protein, skimmed milk, plasma protein, extruded starch, extruded full-fat soybean, feed enzymes, organic acids and effective probiotics in the market together with the effective technical services by drugs and feed additive companies have facilitated the more advanced feed production in the farms. It is logical that different pig farms always have different environmental conditions, different farm management systems and different diseases conditions which required different nutrient specification and different feed additive and medication to be included into the feeds. With on - farm trials, farmers can produce their own starter feed specific for the farm which can provide optimum performance to the animals at more economical cost.
Feed ingredients used in the pigs feed formulae are mainly corn, rice bran, soybean meal and fish meal. Broken rice is always used in diets for starter and breeding pigs due to high quality, highly digestible and contains minimum aflatoxin. However, more use of cassava for replacement of corn and broken rice in growing, finishing, breeding pig diets is widely practiced recently. Advantages of cassava in animal nutrition including higher digestibility, minimum to no aflatoxin problem, health improvement of the animals, less smell of pig manure and reduction of feed cost while maintaining animal performance and carcass quality have stimulated more use of cassava in pig diets (see Annex 1). There is a trend indicating that cassava will be the major basal feed ingredient in pig diets in Thailand in the very near future.
The use of fishmeal in pig diets is declining. Less to no fishmeal is included into pig feeds due to higher prices, high variation in quality and the availability of synthetic amino acids for feed industry. However, good quality fishmeal is still included into creep and starter feeds for nutritional improvement of the diets. Palm kernel meal, which is an alternative feed ingredients, has been used extensively in pig diets for the substitution of rice bran.
A number of feed additives have been in included in the diets. Antibiotics and chemotherapeutics are still very essential for maintaining of animals health in the post - weaning period. Feed enzymes and organic acids are also widely included to starter feed for improvement of feed digestibility and for health improvement of the animals. Supplementation of probiotics, which is mainly Lactobacillus spp. for reduction or substitution of antibiotics used in weaned pig diet, has been tried with promising results (Table 9). However it is the general thoughts of the pig farmers that weaned pigs must has all the best things in the feed in order to provide the highest performance especially to obtain the highest body weight at 8 week of age which is significantly affected to performances and efficiency of the animals in growing and finishing periods. It is not surprising to find a number of feed additives including antibiotics and chemotherapeutics and a number of advanced, high quality feed ingredients that claim to be effective for starter pigs in feed formulae in the farms.
Table 3-8 Effects of dietary supplementation of natural selected lactic acid bacteria (SK- LACTO), feed enzyme and antibiotics on performance of weaning (4-8 weeks) pigs
|
|
SK LACTO + Enzyme + Antibiotics |
SK LACTO + Enzyme |
SK LACTO |
|
Average initial wt. (kg) |
8.47 |
8.44 |
8.47 |
|
Average final wt. (kg) |
22.44 |
21.48 |
21.16 |
|
Mortality (%) |
0 |
0 |
0 |
|
Average daily gained (g) |
499 |
466 |
453 |
|
FCR |
1.31 |
1.35 |
1.37 |
|
Feed cost (Baht/kg) |
17.97 |
16.97 |
13.31 |
|
Feed cost (Bath/kg wt. gained) |
23.61a |
22.92a |
18.18b |
Less feed additives are included in growing - finishing pig diets but antibiotics need to be maintained in diets of growing pigs for the controls of respiratory diseases of the animals. Inclusion of mycotoxins binders which are normally the aluminosilicates products including imported hydrated sodium calciumaluminosilicates (HSCAS) or bentonites, and local available natural zeolites or comparable aluminosilicates products in growing - finishing pig diets is becoming widely practice especially when corn is used as major feed ingredients in the diets. The binder can effectively reduce toxicity of mycotoxins and generally can improved the health status of the animals on aflatoxins contaminated diets. Results of studies have shown that local natural zeolites from Thailand deposits can improve digestion and nutrient utilization of aflatoxins contaminated diets both in growing and finishing pig periods. Feed formulation is normally done by the farmers themselves or by technical personals of premix or feed additive companies. Animal nutrition and feed production training course has been offered by Animal Nutrition Research and Development Center, Kasetsart University, Kampaengsaen, Nakhon Pathom since 1982 and more than 2,000 pig farmers have passed the training course. The course activities have stimulated and continuously made development of on-farm feed production practice in the country. Advances of on-farm feed production is also contributed by premix and feed additives companies who provided technical services in feed formulation and problems solving in animal nutrition to the customers.
On-farm feed production equipments are ranging from a basic small manual feed mill composed of a hammer mill grinder and a vertical feed mixer to produce mashed feed for small and medium scale holder, to modern computerized control feed mill to produce both mashed and pelleted feeds for large and extra large scale holders. Mashed feed is generally employed in pig production while pelleted feed is employed when automatic feeding or bulk handing of the feeds are practiced.
Changes in pig genetics have changed housing and farm management required by the animals. The high productivity European pigs are move sensitive to stress and require more comfortable, more hygienic and less stress environment than those of the lower productivity. Many types of pig housing have been developed in the past 15 years. The total raised - up slatted floor housing which is introduced by a feed mill company have been widely adopted at the early phase of the period. The housing looks very nice, very hygienic, requires less or minimum labor for cleaning or look after the animals but had high cost of construction and always has problems of low feed intake and hyperventilation of the animals during hot summer. Solid concrete floor housing which has lower cost of construction, provide normal feed intake and more conformable environment during the hot climate has been developed and more gradually accepted. Recently, evaporated cooling pig housing which provide a comfortable range of temperature (approximately 25 - 27 °C) has been adopted by commercial farmers for gestation and growing - finishing pig housing. Although the investment cost is rather high, the housing have provided high feed intake, good growth, allowed higher density of animal with less stress and some health improvement of the animals. The high humidity developed in the house had been argued for the risks of diseases outbreak in the housing, however, no clear evidence of the problems have been reported so far.
It could be concluded that, to date, pig housings in Thailand may be divided into 2 types.
a) Open types pig housing
The housing is normally employed by small, medium and some large scale pig holders. Growing - finishing and gestating pig housings are always solid concrete floor or partial slatted floor which can conduct heat from the animal body very well and allow normal feed intake and less stress condition during the not summer. Growing - finishing pigpens may be equipped with water tub to provide voluntary cooling for the animals. Although the housing may need a little more labor but investment cost is low and feed intake of animals is less affected during hot summer season.
The raised slatted floor housing is normally employed for farrowing and weaning pigs, which require dryer and more hygienic environmental condition. Farrowing pens are always metal with concrete slatted floor on sow area and metal or plastic slat on creep area. Nursery or weaver pens are always metal with plastic or metal slatted floor which have been proved to be very hygienic and providing clean and dry environment to the animals. Although the pens are more expensive, it is economical to employ in the pig production practice since animals in the pens are healthier, grow faster and require less medication during the production. Both farrowing and weaner pens are available in complete knockdown kits which is affordable by both small scale and large-scale farmers.
Raised slatted floor housing for growing and finishing pigs has been proved to be ineffective in tropical region. Although the housing is very hygienic and require less labor for looking after the animals, the investment cost is high and feed intake of the pigs may be much affected during the hot summer months. The problems may lead to slow growth and more susceptible to diseases of the animals.
It has been proved that simple and low cost open pig housing employed by small scale farmers but properly built to provide hygienic and comfortable environment especially during hot weather climate to the pigs is also acceptable by high performance European pigs.
b) Closed or environmental controlled pig housing
Large-scale pig farmers have adopted more closed or environmental controlled pig housing. The housing is cooled by evaporative cooling system, which has been proved to be effective in the tropical region. Although the relative humidity in the housing is rather high (+ 90 %), the temperature of the housing can be controlled at 25 - 27 °C which is in the range of thermoneutral zone. The housing system is generally used for growing - finishing pigs, which require the cooled temperature for stimulation of feed intake and minimizing of environmental stress. Although investment cost of the housing is high, animals in the house can grow faster, are healthier and require less medication during the production. The housing also allow higher stocking rate (1.0 m2 pig compared to 1.3 m2/pipig in open housing) of the animals, which can increase productivity of the housing. High relative humidity in the housing is very much concerned since it may be favorable for growth of pathogens and may cause diseases outbreak in the housing. However, the evidence had not been reported so far.
The layout of pig housing has also changed very much in the past 15 years. Separate pig housing i.e. gestation, farrowing, weaner, grower - finisher houses was clearly seen compared to compound pig housing i.e. gestation - farrowing - weaning in one house in the earlier days. Separate pig housing have resulted in better farm management, better diseases control, healthier animals and less use of medication during the production.
Old pig farms which mostly had very limited area of land and have all pig production units from gestation to finishing in the same area, may had poor ventilation due to improper farm lay-out and always have difficulties in term of farm management and diseases control program especially when keeping the high performance European pigs. Old pig housing which is formerly designed to be very wide, low roof clearance and poor ventilation may not be suitable for the high performance animals unless modification is applied to minimized the environmental stress.
Modern pig farms always separate pig production units into breeder unit to produce weaned pigs and growing - finishing units to produce market pigs in different locations. The practice has facilitated better and more efficient farm management and diseases control program to the farms. However, the practice of segregated early weaning (SEW) is not widely practiced in the country since the system requires more division of farm units at certain distances. Pig production is always concentrated in the central part of Thailand where is very populated and land cost is rather high and the limitation have reduced acceptance of SEW in the country.
Acceptance of high performance European pigs have forced farmers to practice all-in, all-out pig production system which is not only effectively control the disease problems in the farm but also minimize the uses of medication and can produce healthier pigs into the market.
It is quite common for pig farm in Thailand to have farrow to finish pig production system. The practice can minimize the risk of pig production due to variation in supply, cost, quality and health status of the feeder pigs, which are very important factors for success of market pig production.
It is generally practice for every scale farmers to keep gestating sows individually in metal gestating pens on solid concrete or partial slatted floor until 5 days before farrowing. The sows will be fed at 1.5 - 2.0 kg per day depending on body score of the animal in the first 80 days of gestation and will increase to 2.0 - 2.5 kg per days during the last 30 days of gestation. The sows will go into farrowing crate approximately 5 days before farrowing. The farrowing crate is always metal and total raised-up floor composed of sows part, which is normally concrete slats, and the creep area, which are metal or plastic slates. The sows are allowed to nurse the piglets for 3-4 weeks depending on sow feed intake, sows condition and body weight of the piglets. However, the common weaning age of 21-23 days or weaning weight of 7.5 - 8 kgs are generally employed by the industry. The sows will be fed 3-4 times a day and the feed intake should be at least 5.5-6.0 kg/day in the third week of farrowing.
Feeding of farrowing sows more in the night time is not only increase feed intake of the animals but also improve litter weight and minimize weight loss of the sows. European gestating and lactating sows required at least 16 and 18% protein diets, respectively. Feeding of commercial feeds by using protein concentrate feed always produced very poor results characterized by poor milk production, poor litter weight at weaning, unhealthy litter and greater loss of sows body weight during lactation due to inadequate protein content in the diets. The sows will be very thin after weaning and require months to be returned into estrous. It is the reason for farmer to produce their own high quality feeds for the sows in the farms.
Nursing piglets may be supplemented with commercial pelleted creep feed, which will provide additional nutrient for optimum growth and weight gain before weaning. Weaning is always done by removal of the sows from the farrowing crate 2-3 days before the transfer of weaned piglets to the nursery pens. The weaned pigs are always kept in battery metal pens and will be fed with commercial pelleted pre-starter (weaning - 15 kg) and starter (15-25 kg) feeds until approximately 25 kg body weight before going to growing - finishing pig housing. The commercial pre-starter and starter feeds are produced to be high quality due to the high competition conditions in the market and contained minimum protein content of 20 and 18 %, respectively. However, a number of pig farms ranging from medium to extra-large scale have successfully produced their own pre-starter and starter feeds at the farms. Although the feeds are mashed, high quality feed ingredients i.e. cooked starch, extruded full-fat soybean, high or quality fishmeal, together with whey or skimmed milk and a number of feed additives for the improvement of growth and health of the animals were used. Nutritional specifications of the feeds are adjusted to be suitable for the farms and may contain a higher nutrient specification than the commercial available pre-starter and starter feeds. Farmers always try to obtain the highest body weight of the pigs before going to growing - finishing pig housing. Growing and finishing pigs which is normally in the body weight range of 25-50 and 50 -700 g, respectively are generally fed with diets containing at least 18 and 16 % protein and at least 1.0 and 0.9 % lysine, respectively. A number of commercial farms had their own on-farm trails and have employed a higher levels of protein and essential amino acids in the diets than those recommended by institutions or breeding companies for the optimum growth, lean content and health status of the animals in the farms. Variation of genetic background of the animals have influenced the absolute nutrient requirement (amount of nutrient required in a day) of the animals. The more important thing, differences in environmental condition of the pig housings have allowed differences feed intake of the animals. It is logical therefore that farmers should have their own on-farm trail to determine and to produce appropriate nutrient levels in the feeds specific to the genetics background of the animals and to the environmental condition in the farms. Nutrient specification in the pig diets of some pig farms in Thailand have shown in Table... It is worth to note that carcass quality or lean content in the carcass is very important parameter to determine the prices and ability to sell the animals to the market. Poor quality carcass pigs (low lean/high backfat) are always sold at lower prices (3-4 baht/kg less than normal) and had difficulties to sell during the low pig prices crisis. High quality carcass pigs are always sold at 3-4 baht/kg lived weight premium to the normal prices and have no problem in marketing during the prices crisis. The farmers have learnt that high protein and high amino acid in the growing and finishing pig feeds although have made the feed cost/kg high, it is not only produced the optimum lean content in the pig carcass but also improved growth rate, feed efficiency, health status of the animals. The practices have also reduced the cost of medication, and ultimately produce the lowest cost of pig production. From the results and experiences found in Thailand, it has been indicated that regardless of pig production scales, supply of adequate nutrient according to absolute requirement is an important factor for the successful or profitable pig farming.
High performance European pigs are more susceptible to stresses as well as to diseases in the environment. More diseases has been found to be problem in modern pig production than those in the past. The animals are therefore required more complicated vaccination program for protection of diseases. Hog cholera, foot and mouth disease and Aujesky disease are the major pig diseases effected to the pig industry of the country. The diseases are generally protected by vaccination program as follows:
Hog Chlorera - 2 vaccinations at 3 and 5 weeks of age.
Foot and mouth disease - 2 vaccinations at 7-8 weeks and 9-10 weeks of age.
Aujesky disease - 2 vaccinations at birth by nose drop and at 6 weeks by injection.
Pig farm wastes has been seriously concerned for environmental pollution and the effects to the public health very recently. It can say that the concerning of pig farm waste handling and treatments has just been started and most of the pig farms in Thailand still have inadequate waste treatment system to provide safety to the public and to the environment.
There are numerous methods of pig waste handling and treatment system employed by the Thai pig farmer. According to the survey study conducted by Pollution Control Department in 1999 have reported 64 % of the fattening pig farms collect solid manure by manually scraping and water washing (scrape and wash), 32% collect the solid manure only by manually scraping (scrape only) and 4% wash the manure by water (wash only). In breeding pigs and piglets, waste handling normally use scrape and wash 78%, scrape only 15% and wash only 7%. The scraped manure may be sun dried and sell as fertilizer. For cleaning frequency, 50% the fattening pig pens were cleaned everyday, 34% were weekly cleaned and 16% were cleaned once longer than a week. In breeding pigs and piglets, 65, 25 and 70 % of the pens were cleaned everyday, every weeks and once longer than a weeks, respectively. For pig farms which animals are totally on slatted floor, removal of pig manure always done by hosing to lagoon directly (82%) or by flushing system (8%) or by other systems (10%).
Pollution Control Department has also conducted a survey study on pig farm waste treatment system employed by pig farmer in Thailand. The results have shown that most of the large commercial pig farm (more than 5,000 pigs) have used either one of the two systems such as ponding system consisting of 2-10 earth ponds) and solid-liquid separator plus holding ponds. For medium size farms (501 - 5,000 pigs), 44% have used a reception pond (one pond only) where wastewater is mostly overflow into public waterway, 38.2% used ponding system, 8.8% were using solid - liquid separator followed by holding pond, and only 2.9% using the biogas digester. For small pig farms (less than 500 pigs) the employment of pig waste treatment system are very much varied. The results have shown at 34.5 % of the small farmer have used one pond only, 36.3% have employ ponding system, 3.6 % using solid-liquid separator followed by holding pond, 9.1% using biogas digester while 12.7% using no waste treatment at all. By average of every farm sizes, 42% of the farm used ponding system 37% used one pond only, 7% have employed solid - liquid separator and holding pond, 6% using biogas system while only 7% of the farms which is mostly small farms do not have any waste treatment system.
Pig farm waste treatment had been ignored and poorly developed for a long period of time. The expansion of the cities have come into area of pig production and pig farm pollution including smell, flies and waste water have been complained and criticized by the publics. The issue have also been interested by the relevant governmental offices and control of the pig farm wastes have been released.
Pig farm waste treatment by biogas digester have been tested and proved to be suitable for pig production in the tropic and could be practicable by farmers. The system has efficiently controlled smell, number of flies and quality of discharged water from the pig farms into the environment. Although the investment cost of the digester is quite high, the digester is not only provide very efficient pig waste treatment but also produced methane gas (biogas) which could be utilized for generating of on-farm electricity, brooding of piglets and cooking in the kitchen which can provide the pay-off the investment. Biogas sludge is an excellent fertilizer for plants and can also make income to the farmer by selling at the average price 1 baht/kg dried sludge. The National Energy Bureau together with Chiangmai University have a project to provide soft-loan for pig farms to build biogas digester system for pig waste treatment and the project have drawn a lot of interest to the farmers.
Pig marketing has not been much developed for a long period of time either. Generally, pig farmers always raise the fattening pigs until market weight which is around 90-110 kg depending on demands of the market. The farmers always sell the market pigs to middle man who collect the animals then slaughtered and sell the pig carcass to the butcher shops normally located in the fresh markets. Prices of lived pigs always controlled or determined by the middle man which are varied depend on demand and supply of animals in the market and on the carcass quality of the animals. There may be butchers that directly buy market pigs from the farmers but the contribution is still very limited.
Since there is a declining margin in pig production business, many pig farms in Thailand ranging from small to extra-large farms tried to have their own outlets to sell pork and pork products directly to the consumers. The farms may have their own butcher shop in the fresh market or have their own pork shops in the town or have their own pork products factory and distributed via the supermarkets. The system has become very popular and has provided more profit margin for the pig farming and have minimized the risks of pig production business. Recently, a number of pig farms have marketed green pork, which is highly demanded by the consumers, and have shown a very promising trend in the future. The changing demands of the consumers trend to fade out the butcher shop system in the fresh markets and will be replaced by the integrated market pigs-pork outlets pig farming system where quality and safety the pork could be guaranteed and strictly controlled.
Modern pig production in Thailand to date which have employed high performance and high lean European pigs have suffered to a higher number of diseases than ever. There are number of diseases including hog cholera, foot and mouth diseases (FMD), Aujesky disease (AD), parvo virus, mycoplasma and porcine reproductive and respiratory syndrome (PRRS) that have greatly impact on commercial pig production. The higher density, the higher growth and productivity of the animals together with environmental stresses to the animals have reduced immunity development of the animals and have promoted more diseases outbreak and uncontrolled widespread of the diseases in the farms. Although hog cholera, FMD and AD are vaccinated for basic disease protection in the pig farms, it has been experienced that more complicated vaccination practices are required for effective disease protection. Additional vaccination i.e. mycoplasma, parvo virus and PRRS are also required in most of the pig farms in the country.
There are very heavily uses of antibiotics and chemotherapeutics in animal feeds for the control and treatment of the diseases. The practices not only increase the cost of pig production but also may impair the immune development of the animals and make the animals more susceptible to the diseases. Highly uses of antibiotics and chemotherapeutics may disturb balance of microorganisms in the animal bodies and allow more growth and proliferation of pathogenic bacteria and virus and cause harmful to the animals.
It is necessary for pig farmers to be back into the basic and to understand the logic of survival of animals in the nature which is believed to be the alternative solution to the problems. It has been proved that every animal have their own immunity to fight for diseases in the surrounding environment of the animals. Good immunity will be developed when the animals are in minimum stresses condition and receiving adequate nutrient according to the absolute requirements. Pig production to date is prone to many sources of stresses including high density, rapid growing, hot weather and toxins i.e. aflatoxins in the animal feeds. There have been plenty of examples that reduction of animal density or growth of animals has dramatically improved health and diseases resistant of the animals. Improving of feed quality by increasing of levels of nutrient i.e. protein, amino acids and vitamin-minerals, and reduction of toxins i.e. aflatoxins or inclusion of the toxins binders i.e. natural zeolites, HSCAS in the feeds have also significantly improved health of the animals and have reduced the uses of medication during the production. The uses of highly digestible and no aflotoxins contaminated i.e. cassava in pig diets have also improved health of the animals and can minimize of the uses of medication during the production.
The uses of beta-agonist for carcass improvement in many pig farms have caused tremendous stresses to the animals and always lead to poor immunity development of the animals and make the pigs more susceptible to diseases.
The uses of natural active ingredients in the plants (herbs) that have ability to control pathogens or diseases have been demonstrated to be very natural and effective. The practice has shown great potential for the practical application into commercial pig production.
Finally, smuggling of animals, especially cattle through the border (Myanmar) have always imported FMD into the country and made the diseases eradication rather impossible.
Although there should be pigs that are specially bred and selected for tropical climate which have not been existed, it is fortunate that the genetic improved pigs imported from temperate countries especially from European countries have good adaptability to climate and environment in Thailand and can provide a satisfactory performance as well as profitability for pig industry. It is necessary for farmers to provide high quality feeds and comfortable or minimum stresses environment to the animals in order to obtain high productivity and high health status of the animals.
The problems of keeping high performance pigs existed to date may be due to misunderstanding of the animal which lead to misfeeding and mismanagement of the animals under tropical conditions. There is plenty of evidence that animals will have produced very good performance and productivity anywhere when they receive appropriate nutrition and live in control environments with minimal environmental stress regardless if they are big or small pig holder farms. It is important to note that there should be not duplicating the feeding and management system of the animals from the temperate countries but to develop our own feeding and management programs to provide all factors essential for living of the animals under our own conditions.
Supply of adequacy nutrition is an important factor for successful of pig production. It had been shown that nutritional requirements in the diets of European pigs in Thailand is totally different from the NRC recommendation or even from the nutrient requirements recommended by the original countries. Though animals raised under hot climates have lower energy and feed intake their need to maintain daily requirements of protein, amino acids, vitamins, and minerals is important. European pigs feed intake is sensitive to environmental conditions. It is advisable to formulate the pig diets based on absolute nutrient requirement in each farm which means different farms may have different levels of nutrient in the diet.
European pigs have less tolerance to toxins presented in the feeds. Alfatoxins contaminated on corn and other feed ingredients usually cause poor growth, poor feed conversion ratios, and poor immunity development of the animals. Utilization of alternative feed ingredients i.e. cotton seed meal, kapok seed meal, rape seed meal, which contain a certain amount of toxins, may cause adverse effects on performances and reproduction of the animals and it is advisable to avoid the use of these feed ingredients in the diets of high performances pigs. European pigs still have high ability to utilize feed ingredients, which are locally available including cassava and other agriculture and industrial by-products which are highly digestible and contain very minimum to no toxins and pathogens as feed ingredients.
Pig farms tend to cause problems to the community and to the environment due to the increase in farm sizes and the expansion of the community towards farm areas. Old pig farms which have no waste treatment system discharge pig waste into natural resources which causes pollution to the environment and complaints by the community. Modern pig farms may be equipped with biogas digesters, which can effectively reduce pig waste problems and improve quality of the environment. Although, incentive has been offered to farmers for investment of pigs wastes treatment system by governmental organizations, regulation and enforcement need to be done in order to obligate pig waste treatment before discharging it into the environment. Research and development is needed on the value-added utilization of gas and sludge produced by the digesters which will stimulate more waste treatment practices by the pigs farms.
Pig production industry may create smell, noise, flies, dust and organic wastes, which may cause some adverse effects to the natural resources and to the public health. The organic waste may pollute the water and cause eutrophication, which led to plankton blooming, high BOD water and reduction or death of aquatic animals in the area. Certain pig diseases i.e. Japanese encephalitis virus may be transmitted to humans and may cause death. Antibiotics used in the pig’s feeds for growth promotion may leave residues in pig products and may result it its resistance for other therapeutic purposes in humans. The use of beta-agonists in the pig feeds for the carcass improvement is not only providing stresses to the animals may leave residues in pig products which may be carcinogenic to the human.
In recent years, numbers of backyard farms and small farms have been declining. Inefficient medium-size and large-scale farms are not immune to changes either. The major cause of their fate is inefficiency. Ironically, most of these farms had abandoned the native pigs and opted for new European pigs - as in large farms at present. However, these farms do not use employ suitable management techniques for the new breeds - which are much more demanding than the native and American breeds. They still rely on commercial feeds, most of which comply the DLD standard for other breeds and are not sufficient for the new European breeds. As a result, their pigs are not very healthy and have to relied on drugs more than they should. They also have poor feed conversion ratios. All in all, these farms have relatively higher costs and are, therefore, more vulnerable to the hog price cycles.
As these farms leave the market, there is room for the more efficient farms to expand and become larger. The longer the cycle, the industrialized process becomes faster, since the more efficient farms could expand their production to fill the void left by the abandoned farmed. In general, the survived farms are the one with the following characteristics:
1) These farms are integrated farms (farrow to finishing). This makes it possible for them to control quality of the feeder pigs and are not forced to sell the feeder pig during the low price season
2) These farms prepare their own feed so that they could control the feed quality
3) These farms have their own market channel or secure forward market via subcontracting
As for the evaporative cooling system, although it helps improve efficiency, it might not be the determining factor for farm survival. Thus far, we have seen expansion of both types of farms. The scale itself has not been the determining factor either, as we have seen expansion of farms of all sizes that have the above characteristics and have seen the fall of inefficient farms of all size as well.
(a) Recovery of the economic recession will stimulate domestic pork consumption and expansion of pig industry in the country.
(b) More competition among pig producers especially the feed mill companies owned pig farms (CP, Betagro, etc.) and large-scale private owned commercial pig farms would be more severe in order to share the expansion of the industry.
(c) Pig farms may have to do more complete cycle business (from farrow to retail store or from farrow to exportation) in order to survive at high competition of the industry.
(d) Pig production has to adapt for requirement of the more educated consumers and have to be adapted to the global preference. Pork produced need to be more natural, more organic and use very minimum to no antibiotics or chemotherapeutics during the production. Pig farming should not cause any pollution to the environment and community. Pig waste treatment needs to be seriously concerned and practiced by the pig farms. Pig farms need to be certified for good agricultural practices (GAP) and pork produced for both domestic consumption and for exporting many need to be certified for HACCP to provide the safety food for the consumers.
(e) The new pig farms will be located in very remote area and will be equip with waste treatment system. Pig farm management will employ all in -all out and segregated early weaning (SEW) programs which help to control diseases outbreak in the farm and reduce the uses of medication for pig production.
(f) Improvement of nutrition and minimum of environmental stress will be incorporated into the diseases protection practices. Animals will have better responses to vaccinations and require less medication during the production
(g) Cassava will become the main feed ingredients for pig production since it has shown potential for health improvement effects to the animals, minimum uses of the antibiotics and a tendency for improvement of pork taste.
(h) Antibiotics will be totally banned for the uses as growth promoter in pig diets. Alternative feed additives including organic acids, feed enzymes, probiotics, prebiotics, symbiotics and natural herbs will be used for growth promotion and animal health improvement products as the substitutions to antibiotics.
(i) Small scale holders need to improve their efficiency of pig production operation by organizing into groups of farms or co-operatives which will have their own feeds production, breeding stocks and slaughterhouse with pork outlets to consumer in the local or provincial area. The farrow to pork outlet business will make provincial pig co-operatives, which are based on small-scale pig holders more competitive to the larger scale commercial pig farms.
(j) Export pork from Thailand to the world market is possible since there is a decline in pig production industry in European countries due to the strict regulation of waste disposal on the land and the soil in EU countries can no longer absorb minerals from waste of the pig farms. Large areas of crops plantation in Thailand including paddy rice, cassava, sugar cane, orchard and vegetable are still unfertile and could be the ideal area for waste disposal from the pig farms. The opportunity will allow more increase of pig production in Thailand with minimum problems of pollution to the environment. However, appropriate and efficient the waste disposal methods need to be developed and tested.
In contrast to the broiler industry which is dominated by the large-scale agrobusiness firms and has almost been free from government intervention, the dairy cattle industry has been extensively promoted and highly protected by government policies. As a result, production of fresh milk has increased by 17 times during the last two decades. The increase was only moderate in the 1980’s, but then jumped by five times in the 1990’s (see Figure 4.1). However, in recent years (1998-2001), the growth rate of production has slowed, growing at a rate of 2.7% compared to more than 7.6% per year during the 1983-98 period. This Chapter will explain the government policies which play a critical role in the rapid expansion of the dairy cattle industry. It will also assess some of the policy weaknesses. Moreover, it will analyse the changes in technology and farm size and the impact of the growth of the dairy cattle industry on environment, food safety and animal welfare. Finally, some major problems and constraints which limit the growth of the industry will be considered.
Figure 4-1 Number of Dairy Cows and Milk Production (tons) 1983-2001
The modern dairy farms were first promoted in 1960 after King Rama IX paid a royal visit to the dairy farms in Denmark. At his majesty’s request, the Danish government sent a consultant team to carry out a feasibility study of growing dairy cattle in Thailand. Following the consultant recommendation, the Dutch and the Thai governments jointly created the first modern “Thai-Denmark Dairy Farm” in Saraburi, a province in the Central Plains. It was like a turn - key project. In 1971, the farm organization was upgraded into a status of state enterprise and named “ODFPT”. Its main function is to promote and develop the whole dairy industry starting from dairy farm, milk marketing to processing and consumption promotion. At the same time, Kasetsart University (or Agricultural University) began to run an experimental modern dairy farm by importing dairy cattle. It also established the first milk factory to produce pasteurized milk.
The first areas of dairy farms are the provinces in the Central Plains around the Thai-Denmark Farm, i.e., Saraburi, Lopburi, Ratchaburi (in the West) and Nakorn Ratchasima which has border with Saraburi but is in the Northeastern Region. After that ODFPT began to promote farmers in other regions to grow dairy cattle by establishing the processing factory as the guarantee market for raw milk from the farmers. Dairy farming, therefore, expanded to the North (in Chiengmai), the West (Prachuab Kirikhan), the lower North (Sukothai), and the Northeast (Khon Kaen). In the mid 1980’s, the Department of Livestock development began to promote dairy farms outside the ODFPT zone. Table 4.1 gives the statistics of number of dairy cattle by region. The Central Region is still the largest growing area, accounting for 66.5% of all cows, followed by the Northeast. It should be noted that the growth rate is highest in the Northeast. Moreover, dairy farms tend to concentrate in only a few provinces in each region.
Table 4-1 Number of Dairy Cows in Thailand 1983-2001
|
Year |
Dairy Cow |
Number of Dairy Cow (Head) |
Total |
Fresh Milk (Tons) |
|||
|
Calf |
Heifer/Pregnant Cow |
Dairy Cow |
Production |
Product to Factory |
|||
|
1983 |
500 |
6,192 |
11,537 |
20,090 |
38,319 |
31,419 |
n.a. |
|
1984 |
- |
9,780 |
10,726 |
24,450 |
44,956 |
36,029 |
n.a. |
|
1985 |
- |
10,985 |
13,816 |
28,168 |
52,969 |
46,867 |
n.a. |
|
1986 |
66 |
12,930 |
16,318 |
33,154 |
62,468 |
58,348 |
n.a. |
|
1987 |
4,268 |
14,875 |
21,024 |
39,892 |
80,059 |
75,348 |
n.a. |
|
1988 |
4,210 |
18,178 |
20,676 |
50,590 |
93,654 |
89,713 |
86,124 |
|
1989 |
4,742 |
20,923 |
25,902 |
64,890 |
116,457 |
106,709 |
102,440 |
|
1990 |
4,373 |
24,082 |
35,267 |
80,184 |
143,906 |
129,148 |
123,982 |
|
1991 |
3,960 |
27,719 |
43,840 |
102,717 |
178,236 |
164,340 |
157,766 |
|
1992 |
140 |
31,988 |
60,426 |
125,903 |
218,457 |
215,457 |
206,839 |
|
1993 |
1,163 |
37,875 |
66,204 |
130,591 |
235,833 |
287,164 |
275,677 |
|
1994 |
5,674 |
38,811 |
70,482 |
144,483 |
259,450 |
320,894 |
308,058 |
|
1995 |
4,747 |
48,190 |
74,570 |
153,916 |
281,423 |
348,212 |
334,284 |
|
1996 |
4,394 |
53,462 |
79,128 |
167,181 |
304,165 |
377,932 |
362,810 |
|
1997 |
2,220 |
46,813 |
101,689 |
170,693 |
321,415 |
410,433 |
394,015 |
|
1998 |
199 |
49,977 |
107,653 |
185,030 |
342,859 |
437,116 |
419,630 |
|
1999 |
- |
53,355 |
112,450 |
194,630 |
360,435 |
464,514 |
445,933 |
|
2000 |
- |
51,305 |
119,735 |
200,890 |
371,930 |
480,000 |
460,800 |
|
2001 |
- |
52,726 |
125,898 |
213,676 |
392,300 |
528,000 |
506,880 |
| |
|
|
|
Growth rate |
13.55 |
16.56 |
|
Source : Office of Agricultural Economic
In promoting the development of the dairy industry, the government wanted to promote the small farmers and the poor veteran coming back from the Korean War. It first launched the Farm Settlement Project in Saraburi by giving a small plot of land to those veterans and landless farmers. Those who were promoted to raise the dairy cows were also given free input subsidies, credit, technical advice and services. Another serious objective is also to encourage Thais to drink milk[145] since the government believed that milk was very important for good health and height development of Thai children. This is why the government began with the establishment of the milk factory and the first consumer target group was the students at Kasetsart University. Since then, the reputation of Kasetsart milk has spread rapidly and Thais in Bangkok began drinking milk. But it was not until the 1990’s that the government first launched the school milk program. In recent years, the budget has increased rapidly as the government wants practically all students at the kindergarten and elementary schools to drink milk[146]. Table 4.2 provides the statistics on budget and number of students who are covered by the program.
Table 4-2 School Milk Program established by Thai Government since 1992
|
Fiscal Year |
Budget (Million Baht) |
Target group |
Number of pupils |
|
1992 |
279.00 |
Pre-elementary |
995,178 |
|
1993 |
424.00 |
Pre-elementary |
1,267,199 |
|
1994 |
1,206.00 |
Pre-elementary |
1,623,683 |
|
1995 |
1,713.00 |
Pre-elementary- elementary grade 1 |
2,802,612 |
|
1996 |
2,211.00 |
Pre-elementary- elementary grade 2 |
3,518,192 |
|
1997 |
4,387.00 |
Pre-elementary- elementary grade 3 |
5,010,776 |
|
1998 |
5,500.00 |
Pre-elementary- elementary grade 4 |
5,389,842 |
|
1999 |
5,356.43 |
Pre-elementary- elementary grade 4 |
5,841,732 |
|
2000 |
5,981.14 |
Pre-elementary- elementary grade 4 |
5,905,000 |
|
2001 |
6,060.83 |
Pre-elementary- elementary grade 4 |
6,223,252 |
|
Growth rate |
35.07 |
|
|
Source : Office of Agricultural Economic
As a result of consumption promotion, per capita consumption increased from 4.99 kg. per year in 1992 to 9.18 kg. in 2000 (see Table 4.3). But note that the amount is much smaller than other countries. In 1994, per capita consumption was 46 kg. per year in Malaysia, 58 kg. in Singapore, 80 kg. in Germany and 134 kg. in USA (FAO 2000).
Table 4-3 Milk Consumption per capita in Thailand 1992-2000
|
Year |
Raw milk to factory |
Flavoured milk |
Flavoured milk Consumption |
Consumption per
capita |
|
1992 |
206,839 |
293,669 |
289,851 |
4.99 |
|
1993 |
275,677 |
352,240 |
347,661 |
5.92 |
|
1994 |
308,058 |
413,848 |
408,468 |
6.88 |
|
1995 |
334,284 |
527,467 |
520,610 |
8.68 |
|
1996 |
362,810 |
635,690 |
627,426 |
10.35 |
|
1997 |
394,015 |
608,883 |
641,010 |
10.46 |
|
1998 |
419,630 |
556,140 |
490,520 |
7.92 |
|
1999 |
445,933 |
557,400 |
550,150 |
8.79 |
|
2000 |
460,800 |
580,000 |
572,460 |
9.18 |
Source : Office of Agricultural Economic
The third and fourth policy objectives, which were initiated in the mid 1980’s, were agricultural restructuring and import substitution. During the period, there was a world wide slump in agricultural prices. At the same time, Thailand began to slowly lose its comparative advantage in crop production as the forest land was rapidly exhausted and water became more scarce. The government saw dairy farming as a good alternative for farmers who grew unprofitable rice and cassava. The restructuring policy was to grant long-term cheap credit for farmers who wanted to restructure their production to switch to dairy farm business. The government also provided a variety of subsidized inputs and services, such as AI and veterinary services. The import substitution policy was also introduced for the first time in the mid 1980’s when urban Thais began to consume more milk and the country was experiencing a serious trade deficit. The government, therefore initiated the local content policy which was described in the earlier chapter on trade policy.
Production and Credit Policies:
As mentioned above, the ODFPT is the first government agency responsible for the promotion of dairy farm activities within its zone. But the promoted farmers also received assistance - both financial and in-kind - from other government agencies. The Department of Public Welfare first gave land to farmers under the resettlement program. The Department of Livestock provided all kinds of subsidized inputs and services, including imported breeds, AI services, research and extension of animal feeds, veterinary services, etc. In recent years, the Bank of Agriculture and Agricultural Cooperative has played an increasingly important role in providing cheap credit which is vital for long-term investment in such activities. Without the long-term subsidized credit, poor farmers may not be able to enter into this occupation because it takes a long time for the farmers to slowly acquire the tacit technology and learn how to run a dairy farm efficiently. But there are also some cases of failure mainly because dairy farm activities are highly care-intensive and require serious full time effort. Many farmers have been attracted to switch to dairy farms by the subsidized credit and the one-sided information providing only the rosy picture of high rate of return of dairy farming.
As mentioned, the production policy to develop the modern dairy farm industry was first based on wholesale imported technology because there was no such activity in Thailand in the early 1960’s. But since then, the government has still depended heavily on imported technology. The breeders have been imported from the European countries, and the breeding improvements have always relied upon imported male and female breeders. The most popular breeds are Holstein Freisian, accounting for 73.9% of all dairy cows, Red Dane (3.9%) and Sahiwa (2.9%). In recent years, most imported breeders have come from New Zealand and Australia. It is estimated that breed imports amounted to 158-180 million baht per year in 1994-96 and 68 million baht in 1997. AI technology and semen have also been imported. Such technology requires Thai farmers to adopt modern farm management which they cannot afford. More importantly, the temperate-zone dairy cows cannot readily adapt to the tropical climate and suffer heat stress unless the farm environment is properly adjusted. Moreover, there must be a long-term breeding improvement program which breeds the imported cows with the heat-tolerant indigenous cows. However, most of the DLD activities tend to be biased in favor of the environmental adjustment approach which will be able to produce short-term results rather than the more difficult task of genetic improvements. Nevertheless, it can be said that most of the dairy cattle raised in Thailand today are not far from the pure-line dairy cattle producecd in Europe.
Realizing that the market for milk was very small, the ODFPT had to establish a milk processing plant and bought all the raw milk from the farmers who were required to be the members of the ODFPT. The organization is of the cooperative type because of the advice and recommendation of a Dutch consultant. Since the promoted farmers lived near the ODFPT’s factory, there was no delivery problem. When the LDD began to promote dairy farms outside the ODFPT’s zone, the cooperative concept was also adopted. The cooperative is the critical organization behind the success of the promotion of dairy farms. Because raw milk is highly perishable, it is important to collect raw milk from a large number of small farmers at a single station in the shortest possible time. Then milk is cooled before being shipped to the factory by tanker truck. The cooperative is the most suitable institution to handle such activities for small farmers. Every number has strong incentive to monitor and supervise the cooperative manger because if he runs the coop poorly, every one will tend to lose money everyday. Moreover, by collecting and transporting milk by tanker, the average cost of transport is lower.
But there are still two problems. First, the new cooperative does not have enough capital to invest in the collection station. Secondly, there must be a secured long-term market for the raw milk. The farmers could not wasted time negotiating with fringe traders as milk will be spoiled. The government, recognized the problem and, therefore, persuaded the large scale firms producing dairy products to participate in the milk procurement scheme. They are both multi-national companies and large Thai companies who were asked to give funds to the cooperative to build the milk collection center in exchange for an exclusive right to buy all the milk. But to prevent the companies from exploiting the captive market, the government set the standard price of raw milk that the company has to pay. The price is adjusted for quality of milk and determined by the distance from the station to the company’s factory.
Cooperative System, Marketing and Protection:
The government policy for dairy cattle is unique in that there is an over-arching policy which covers all the consistent and essential policy components to guarantee success. No matter how much incentives the government gives to the farmers, the production policy will fail if farmers cannot sell their produce at profitable prices. The marketing policy consists of 3 components, an establishment of local producer cooperatives to take charge of the tasks of milk collection and sometimes transportation. As mentioned, perishability forces the farmers to organize as a group and to have strong incentive to closely monitor the cooperative management (TDRI, 1995). The key point is that there is no way that the government itself can successfully perform the collection tasks. The local cooperative was the only effective institution at the time. (Now there is a small number of private milk collectors competing with the cooperatives).
The second component is how to secure the market with stable prices. The answer is private sector participation. A few large companies - most of which are foreign-owned - were persuaded to participate. Although they were asked to help providing the cooperatives with necessary capital fund needed for the construction of milk collection station, and to agree to buy raw milk at the government-imposed standard price, they are also promised some long-term benefits from other related government policies, i.e., the investment promotion and the rights to import skim milk powder in exchange for complying with the government local content policy (or TRIMS). The investment promotion policy exempts them from income tax and imported duties on machinery and raw materials. Since the tariff quota system has been introduced, these companies have been given generous quota allocation in excess of the commitment level. Applied tariff rates (5%) are also much lower than the bound in-quota tariff rate of 20%. These measures are, in fact, one indirect way of granting economic rent to the companies in exchange for their cost of participation in the dairy cattle industry.
The last component of the marketing policy is protection. The LCR policy is a form of non-tariff protection because the dairy products companies are allowed to import some products only if they also procure some goods in the domestic market. It is a different form of tax imposed on the companies. As a result, imports of dairy products are restricted. Such protection and other policy measures explain the domestic resource cost index (DRC) is higher than one[147], indicating that it is cheaper for Thailand to import dairy products rather than to produce by itself. However, it should be cautioned that the world prices of dairy products are highly distorted as a result of heavy domestic and export subsidy in EU. The wholesale prices of raw milk in Thailand, though more expensive than those in Australia and New Zealand, are still cheaper than those in Europe (see Table 4.4).
Table 4-4 Selling Price of Raw Milk at Farm
|
Country |
Selling price at farm (US$/100 kg.) |
||||
|
1993 |
1994 |
1995 |
1996 |
1997 |
|
|
Denmark |
36.70 |
36.81 |
40.56 |
39.88 |
35.05 |
|
France |
34.15 |
34.73 |
37.42 |
36.50 |
31.87 |
|
Italy |
39.15 |
40.16 |
41.55 |
46.28 |
42.22 |
|
Switzerland |
67.74 |
68.00 |
77.12 |
67.15 |
41.40 |
|
USA |
28.22 |
28.75 |
28.17 |
32.47 |
29.60 |
|
Japan |
78.76 |
84.30 |
90.94 |
76.72 |
67.82 |
|
New Zealand |
14.66 |
15.92 |
21.79 |
20.90 |
21.68 |
|
Australia |
19.55 |
21.01 |
22.24 |
22.30 |
20.65 |
|
Thailand |
31.52 |
31.65 |
31.95 |
35.79 |
29.68 |
Source : Dairy Compodium 1998, Calculated by TDRI
Consumption Policy:
Last, but most important, is the consumption policy which has successfully stimulated domestic consumption of milk. The government (first through the Office of the Prime Minister) has continually run a series of campaign to promote milk consumption. Note that such policy has direct benefit on the private companies buying raw milk from the cooperatives. Another important policy is the school milk policy which has also directly benefited the milk products companies because schools are not required to buy fresh milk directly from the local dairy cooperatives.
There are two important characteristics of the dairy cattle industry. Firstly, the Thai dairy farming system is dominated by the integrated agro-dairy farms operated by small farmers. Despite small farm holdings, farmers still engage in other agricultural activities, e.g. fish ponds, small plots of vegetables and perennial trees, and paddy farms. More than 84% of dairy farm holdings have less than 20 cattle per farm (Table 4.5). It is estimated that in 1999 there are about 20,000 dairy cattle farm households with 18 cows per households. There are only 15-20 large scale modern farms with more than 60-150 milk cows, most of which are in the central region.
Table 4-5 Number of dairy farm holdings by farm size 1988-1998
|
Number of cows per farm |
Number of holdings |
Percentage |
||||
|
1988 |
1993 |
1998 |
1988 |
1993 |
1998 |
|
|
1 - 4 |
8,738 |
1,380 |
7,468 |
54.7 |
11.9 |
34.7 |
|
5 - 9 |
6,363 |
4,548 |
10,676 |
39.9 |
39.2 |
49.6 |
|
20 - 49 |
723 |
3,650 |
3,247 |
4.5 |
31.4 |
15.1 |
|
50 and over |
142 |
2,038 |
149 |
0.9 |
17.5 |
0.7 |
|
Total |
15,966 |
11,616 |
21,540 |
100 |
100 |
100 |
Sources:
1). 1988 Intercensal survey of agriculture by the National Statistical Office
2). 1993 Agricultural survey by the National Statistical Office
3). 1998 Intercensal survey of agriculture by the National Statistical Office
There are still large discrepancies in yield and production capability among the small farm operators. While the national average milk yield is 10-11 kg per cow per day, the average yield of the Saraburi farms is 15-18 kg, comparing to 8-9 kg for the Northeastern farms. However, there are also professional farms with the average yield which is closed to that in the USA (40 kg. per head). The difference in their yield is mainly attributed to their experience. Farmers in Muaklek (in Saraburi) have had almost also been trained in agriculture. Most farmers in the Northeast and the North are new comers. It is estimated that about 2% of small farmers are professional farmers with good farm management (Kanchana 2002).
Although dairy farms exist in 43 provinces, most of them concentrate 7 provinces (each of which has more than 10,000 cows) particularly in the Central Region provinces near Bangkok which is the largest consumer market. The GIS data also show that these provinces are the main production areas for upland crops that are used to produce animal feeds.
The second characteristics is that most, if not all, of the dairy farm operators are members of the local dairy cooperatives as already mentioned. In addition to the important function of milk collection and transportation, the cooperatives also provide most of the technical services for the members. The cooperatives also collectively purchase concentrate feeds and other inputs in large bulk which help reduce the production cost for their members. More important, the cooperatives also provide credit for their members because it is very efficient to collect debt simply by deducting the members’ debt from their milk sales to the cooperatives.
Changes in Farm Size and Farmers’ Capability:
Over the last 10 years, the average dairy farm holdings increased quite significantly (Table 4.5), and yet most of them are still small holdings. The farm size which had the highest growth of number of farms is those with 20-49 cows per holding. It reflects the fact that as the small farmers gain more tacit knowledge and experience, the accumulated profits have allowed them to increase their farm size by adding more cows. This explains why field observation shows that most medium-scale farm operators are professional farm mangers. They have gradually carried out on-farm breeder improvements by painstakingly keeping detailed records of each animal. Now many of those medium-scale farmers have not only recognized the economic importance of culling, but they have also acquired the culling capability to distinguish between the good quality breeders and the poor breeders. As a consequence, lactation increased by 6% per year, resulting in higher profit per kilogram of milk produced (Table 4.6). According to Table 4.6, increase lactation is not the only factor contributing to higher profit. The slow growth rate of cost increase (which may be the result of higher farm efficiency) and higher prices of milk also affect profit.
On the other hand, most small farmers, particularly those with 1-4 cows, have difficulty in culling practice not because they do not recognize its implications. Given the small herd size, culling is too expensive, particularly when the milk price remains high.
Table 4-6 Total cost, wholesale price, profit of dairy farms and lactation
|
Year |
Total Cost |
Wholesale Price |
Lactation (kg./head/day) |
Profit |
|
|
whole kingdom |
Farm Sample |
||||
|
1987 |
4.09 |
6.59 |
n.a. |
10.14 |
2.50 |
|
1988 |
4.63 |
6.62 |
n.a. |
9.16 |
1.99 |
|
1989 |
4.74 |
6.65 |
n.a. |
9.75 |
1.91 |
|
1990 |
5.00 |
7.01 |
n.a. |
9.85 |
2.01 |
|
1991 |
5.34 |
7.12 |
n.a. |
9.29 |
1.78 |
|
1992 |
6.20 |
7.51 |
6.47 |
8.93 |
1.31 |
|
1993 |
6.53 |
7.98 |
7.76 |
9.93 |
1.45 |
|
1994 |
6.49 |
7.96 |
8.25 |
10.52 |
1.47 |
|
1995 |
6.55 |
7.96 |
8.33 |
10.94 |
1.41 |
|
1996 |
7.22 |
9.07 |
8.43 |
10.97 |
1.85 |
|
1997 |
7.57 |
9.31 |
8.99 |
10.93 |
1.74 |
|
1998 |
7.72 |
10.66 |
9.03 |
11.20 |
2.94 |
|
1999 |
7.46 |
10.97 |
9.14 |
12.00 |
3.51 |
|
2000 |
7.53 |
11.13 |
9.25 |
13.00 |
3.60 |
|
2001 |
7.99 |
11.30 |
10.00 |
n.a. |
3.31 |
Source : Office of Agricultural Economic
Note : Farm Sample located in Ratcha Buri, Phachub Kirikhan and Sara Buri.
Breeders and Artificial Insemination:
Another difference between the small and the large farmers is that the latter prefer to grow the imported dairy cattle from temperate zones. In the past, many large scale farmers prefer imported cows with pure blood line and large cattle, particularly Holstein Friesian. But they have gradually recognized that the pure blood line cows are more vulnerable to heat stress and that smaller cattle may be more efficient. One the other hand, the small farmers, who cannot afford expensive imported cows, has to grow crossbred cows which are the up-graded native cows. These cows do not have the problem of heat stress but produce low lactation. Thanks to the cross breeder development program of the DLD, the new generation of dairy cattle are now more tolerant with heat stress. But there is still much more room for further breeder development.
Over the last 15 years, the DLD has played key instrumental role in providing the subsidized AI and embryo transfer services which keep contribute the breeder development and higher productivity of the dairy cow industry. However, as will be discussed below the technology is still not very cost effective.
Feeds:
Feeds cost is the most important factor affecting rate of return to investment in dairy farms because it accounts for 70-80% of total cost. Feeding management is thus a critical success factor. High degree of pure blood line cattle must be fed with proper total mixed ration of feeds if they are to yield high lactation efficiency. However, the shortage of roughage in the dry season has forced the Thai farmers to depend on higher ratio of concentrates, which in turn affect the protection cost. Water shortage in the dry season and lack of grass land are the important reasons for the shortage of roughage. Fortunately, over the last ten years, farmers have been able to substitute agricultural waste for roughage, e.g., hay, pineapple peel and baby corn cob. Farmers have also begun to use corn stems, palm oilseed cake, coconut meal, and corn silage. But the agricultural waste contains Alfa Toxin, while the cost of corn silage may be relatively high.
Labor Cost and Mechanization:
Dairy farming is a care-intensive activity requiring full time labor. During the massive real estate boom in the early 1990’s, real wages increased rapidly. As young workers migrated to the city, there was serious farm labor shortage. The use of milking machine is partly to cope with labor shortage. Although the economic crisis in 1997 has mitigated the shortage, the dairy farm jobs are still not attractive to the educated young rural people. Unless mechanization is adopted, the farm size will be affected by the shortage of labor, particularly the family workers.
In effect, the larger farm size over the last 15 years has been made possible by the sustained government support together with the higher technological capability of the medium-scale farmers. The government policy to import pure blood line dairy cattle from the European countries, cross-breed program and AI services have significant impact on productivity of the dairy farm activities. The establishment of dairy cooperatives to handle milk collection, the marketing and pricing policy, the local content policy as the demand policy have not only ensured stable income but also significantly reduced the risk of dairy cattle activities. The market has been created, and both the farmers and the dairy products companies have decided to do business with each other with an expectation that the long term gains will exceed short-term cost. Obviously, without the government coordination effort and strong commitment, the market will not exist.
But that does not imply that the farmers play no role. Nor it means that they play less significant role. Many small farmers, through the long years of hard working and learning process, have mastered the tacit technology. They have begun to make further technological development such as culling, and better farm management. The result is higher profit and larger farm size.
However, there are also many other factors which limit the growth of farm size, and the development of the dairy farm activities. Among them, two factors stand out. The fact that most of the dairy cattle have high degree of temperate pure blood line means that they are vulnerable to heat stress which seriously limit their lactation ability. The average yield in Thai dairy farms is still less than 50 percent of that in the temperate-zone countries. If yield is to be significantly increased, the serious dairy herd improvement program together with appropriate AI planning that use the optimum cross breed between native and imported pure line breeders must be continuously financed. Moreover, since Thailand still heavily depend on imported AT semen. But the effectiveness of the AI service depends critically on the selection of semen based upon the assessment of the cattle population. So far the farmers cannot carry out the assessment because of lack of records of their cattle. The DLD used to have a Master Blue Project to encourage farmers to keep records. But it is now abandoned because it takes at least five years for the project to bear fruit.
The second most important factor is the lack of irrigated land which results in the shortage of roughage in the dry season.
Finally, there are also occasional disease outbreaks which seriously affect return to dairy farming. The most common diseases found in Thailand are Foot and Mouth disease type C, SAT 1,2,3, Three day Sickness, IBR/IPV Virus, etc. Another recurrent problem is mastitis which affect as much as 30% of milk cows. The problem is caused by poor farm management. When the cattle are infected, farmers tend to over use anti-biotic drugs which in turn result in residue in raw milk. Although the dairy product companies always test the milk quality, they do not always reject milk with anti-biotic residue.
In short, despite the rapid growth of the dairy industry and the trend toward larger farm size, most dairy farms will remain small. The market for dairy products is still relatively small. Most of the services are provided by the government. Private companies, including the drug companies do not pay much interest in expanding business into this sector. There has not yet been any specialization activities that have been observed in the broiler industry. Specialization is limited by the extent of the market.
Although these issues are the topics of the next chapter, they will be briefly discussed here with a special attention on the impact on the farm size. In general, the dairy farm activities have not yet created serious environmental problems as those in the swine industry. However, there are some concrete evidence of polluted water in the areas with high density of cattle farms such as in one sub-district of Ratchaburi-one of the largest dairy cattle growing provinces in the Central Plains. With 400 farms, each with an average of 20 milk cows in a year, there will be 2,000 tons of animal waste, and 2,500 tons of waste water and urine. As a result, the quality of water, measured by the quantity of NH 3-N, COD and BOD, are below the accepted minimum standards. The high degree of concentration of farms in the small area is the major explanation of the problem. Whether or not the farm size has negative correlation with the problem is not yet known. But there has not yet been affordable water treatment technology for the small farms. The technology for the large scale farms is available, but it is not clear whether or not the farmers will use the technology if they are not partly subsidized.
The problem of food safety caused by Alfatoxin in the animal feeds tend to affect all farmers equally regardless of their size. Even if the milk consumers are to become more concerned about food safety, the problem is still beyond the control of the dairy farmers because of the over utilization of pesticides by the upland crop farmers.
Significant number of small-scale farmers have to raise dairy cattle in a very small space because they have very small plot of land. Most of them are in the Central Plains and the North. Although the free range system of dairy farming will not only enable the farmers to have plentiful supply of roughage which will help reducing antibiotic residue in milk, but will also bring about better welfare for both animals and the farmers, it is not clear whether or not the farmers will have enough profit incentive to buy more land. In the recent years, land price has come down because of the property crash and interest rate is now very low. Yet, there is not yet hard evidence that the dairy farmers buy more land. Perhaps, the rate of return is still not high enough. Serious research and development need to be carried out if higher farm productivity is to be accomplished.
Among the major livestock industries in Thailand namely swine, poultry and cattle, waste from swine farms has led to environmental problem in Thailand. Wastes from the poultry farming and cattle raising have been reused, recycled or treated and did not result in environmental degradation.
Poultry farms generally create wastes in the form of solid waste, odor, dust or flies. The level of pollution from poultry farm varies depending on farm size. It has been observed that large-scale poultry farms tend to have better waste management than small poultry farms. For instance, solid waste from large-scale poultry farms are properly collected and sold as animal feeds (fish) or fertilizer. However, odor and dust are still observed but these are on-site problems and do not become a public environmental problem.
Cattle raising produces wastes in the form of solid waste, waste water and odor. As cattle raising is land intensive much of wastewater created is reused within the farm for watering the grassland. Solid waste is also used as fertilizer within the farm as well. It has been found that cattle raising in Thailand is the least polluting and has not created environmental problems.
Swine farming has been a cause of water pollution in a major river in central Thailand. The environmental impact from swine farms have been in the form of odor and wastewater. The small-scale swine farms in Thailand constitute about fifty per cent of the industry have been mostly responsible wastewater that is released into the public river. Complaints about odor from swine farms have also been made but this problem has remained a local environmental problem.
In addition to the farm wastes described above, the livestock sector still produces negative impact on the environment through wastes created by slaughterhouses. Wastewater from slaughterhouses is drained into public rivers without being properly treated.
Since complaints have been made regarding the wastewater pollution from swine farms that have caused water pollution in Tha Chin river and Bangpakong River in central Thailand the Pollution Control Department has taken actions in 2001 by listed swine farms as a pollution source that need to be regulated. The swine farms also need to observe wastewater standard of the Pollution Control Department (PCD) and this standard will be enforced beginning February 2002.
Aside from the PCD control wastewater from swine farms the Department of Livestock Development (DLD) has established farm standard in 1999 for the swine, poultry and cattle farms. These farm standards are voluntary and hence they are rarely observed by the farm owners except the poultry farmers because their products are exported. As for swine farms whose products are consumed domestically these farm standards have had no impact on the practices of swine farms.
The following describes the details of the impact of the livestock industries on the environment in Thailand.
Swine farms are scattered throughout most parts of Thailand but most of them are concentrated in the central region along the Tha Chin river. Due to high concentration of swine farms and lack of proper waste treatment the swine farms along the Tha Chin river has become a major water pollution. In 2000, water quality at Tha Chin River became critical as the level of Dissolved Oxygen (DO) has dropped to near zero for most parts of the river. The major pollution sources of Tha Chin River are from the community, industry and animal farms, each producing about a third of BOD loading into the river. Swine farming, in particular, was responsible for about 23% of the BOD loading in Tha Chin River in 1999. The vast amount of wastewater released from swine farm into the river has been a result of inadequate waste treatment system.
Resulting from the water pollution in Tha Chin River the Pollution Control Department (PCD) has listed swine farms as a pollution source that need to be regulated. PCD defines swine farms into 3 categories: group A, group B and group C. Group A refers to swine farms with more than 5,000 pigs, group B are swine farms with 500-5,000 pigs and group C are swine farms with 50-500 pigs.
Table 5-1 Waste standard for swine farms
|
Waste |
Units |
Standard |
|
|
Group A |
Group B & C |
||
|
1. pH Value |
NA |
5.5-9 |
5.5-9 |
|
2. BOD |
Miligram/Litre |
< 60 |
< 100 |
|
3. COD |
Miligram/Litre |
< 300 |
< 400 |
|
4. Suspended Solid (SS) |
Miligram/Litre |
< 150 |
< 200 |
|
5. Total Kjeidahl Nitrogen (TKN) |
Miligram/Litre |
< 120 |
< 200 |
Source: The Pollution Control Department 2001a.
The new regulation was announced in February 2001. A grace period of 1 year was applied and the above standards will be effective from February 2002. As of February 2002 only swine farms group A and group B will be enforced and monitored. As for small-scale swine farms or farms that belong to group C, these regulations will not be enforced. For these small-scale swine farms that are limited in terms of investing capital these wastewater standards will be used only as guideline for promotional incentives. It can be seen from above that as the size of farm increases these farms will face more stringent environmental standards.
In terms of waste treatment technology the methods currently used to for treating wastes created inside the swine farms are the ponding system and solid-liquid separator plus holding ponds. Waste technology used by swine farms in Thailand are the ponding system, solid-liquid separator plus holding ponds, reception pond (one pond only), biogas digester and no system at all. Table 5.2 shows the result of a survey conducted by the Pollution Control Department.
Table 5-2 Cleaning method used in swine farms
|
Techniques \Farm Size |
Average |
1-500 |
501-5,000 |
5,000 up |
|
Ponding system (2-10 ponds) |
42.0% |
36.6% |
38.2% |
100% |
|
Solid-liquid system + holding pond |
7.0% |
3.6% |
8.8% |
|
|
Biogas digester |
6.0% |
9.1% |
2.9% |
0.0% |
|
Reception pond (1 pond only) |
37.0% |
34.5% |
44.0% |
0.0% |
|
No treatment at all |
7.0% |
12.7% |
0.0% |
0.0% |
|
TOTAL |
100.0% |
100.0% |
100.0% |
100.0% |
The survey shows that large-scale farms with 5,000 pigs or more are using the ponding system or solid-liquid system to treat their wastewater. Medium-scale and small-scale farms tend to employ the reception pond system. It is also found that there are some small-scale farms (12.7%) that have no wastewater treatment system at all. This find may suggest that as farms become larger they tend to adopt a more environmental friendly method compare to the smaller farms who tend to be more polluting.
In terms of farm technology it is found that old swine farms tend to lack waste treatment technology. Modern farm on the other hand tend to be equipped with modern waste treatment technology such as biogas digester that can effectively reduce swine waste before being released into public rivers. Although incentives has been offered to swine farmers for investing in waste treatment technology but there has been a lack of enforcement. Furthermore, research need to be carried out to help increase the value added of the gas and sludge produced by the digester, for instance, the use of biogas for cooled air or cooled water to aid animal cooling system, and the use of both solid and liquid biogas sludge for soil and leave fertilizer. This will help raise income to the swine farmers as well as increasing acceptance of waste treatment practices by the farmers as well.
Although there is a tendency that large-scale swine farms tend to be equipped with biogas waste treatment technology but the increase in farm concentration tend to produce two negative environmental impact, they are, disease outbreak and wastewater. The increase of swine farm size in highly dense area is prone to disease outbreak that can be uncontrollable. The new swine farming area therefore expands into a more remote and rural area where large area of land is available. Moving into more remote area helps reduces disease outbreak. It is also easier to install waste treatment system (ponds) in remote areas as land price is relatively cheaper and cause less conflicts with the community.
The environmental concern has not been observed in the case of the poultry industry. However, it has been found that as the size of poultry farm increases together with the increase in the adoption of the closed system there has been an improvement in terms of the impact on the environment. The closed system has helped reduce odor problem from solid waste that may affect the near by community. Furthermore, it also reduces fly problem that may have affect the near by community as well. The negative impact of the closed system is the dust problem within the farm but it is also found many poultry farms have installed filter system to trap dust. In terms of animal disease it was found that the closed system has improved the animal living condition hence led to an improvement in animal health and a reduction in disease problem. Even if animal disease is found it can be easier controlled with the closed system the reduction in the amount of flies also helps reduce the spread of disease from one farm to another.
With the scaling up, it is found that there tends to be an increase in the probability of the animals contracting diseases as the size of farm gets larger. As the size of farm increases there is a tendency that a farm must carry animal with different ages. This may then cause the younger animals to contract disease from the older flock. However, when compared to the advantages the closed system tends to have much more environmental benefit than the costs in terms of improved animal welfare, reduced disease problem, reduced the need for medication and hence improved the quality of the final products when consumed.
As discussed in earlier chapters, industrialization on different livestock varies, This chapter attempts to synthesize the scaling-up process in various livestock subsectors as well as their effects on production, contractual arrangement, environment, health, and on equity.
Among the three livestock sectors in this study, the past two decades witness most drastic changes in terms of scaling up is poultry. The most significant changes appear in the broiler subsector. Layers and swine follow the same trend, albeit at slower pace. While all these three subsectors share a tendency to become even more industrialized in the future, the dairy farms appear to find their optimal limiting size (under the existing constraints). The dairy farm size distribution has changed only slightly, as the number of medium-sized farms (with 5-50 cattle) has increased at the expenses of very small and very large farms.
The major difference between dairy and other livestock lies in their nature of production. While other livestock farms could be practically detached from land, to raise healthy cattle at relatively low cost is rather land intensive. The land requirement has become the limiting factor that has thus far prohibitive for scaling-up in the dairy sector.
Except for the dairy cattle industry, which is very land intensive in its nature, scaling up has improved production yield and reducing unit cost of production substantially.
The effect on environment has been mixed. Modern poultry farms - which use close-system evaporative housing usually create less pollution than conventional farm. Most of the environmental problems created by these large farms are indirect one such as an increase in water requirement in the area, that probably put more pressure on other farmers in nearby areas
As for swine and cattle, the main environmental issue is waste disposal. Thus far, cattle create less problem than swine since most farms are rather small. But in highly-concentrated areas, there appears to be complaints from many nearby residents. Waste disposal for swine farms has been more problematic. However, more and more larger farms seem to have better waste management. Some also alleviate the problem by turning the waste into biogas. Since almost all swine production in Thailand is specifically for the domestic market, scaling up often comes at the same time that some inefficient farms are leaving the market. Therefore the net effect is unclear. It might be the case that, the animal concentration (number of animals per squared kilometer) is more critical to the environment than the size of each farm.
The effect of scaling up on animal (and to some extent, farmers’ or laborer’s) welfare has been positive. As the broiler industry becomes more integrated with the developed country’s markets, it has no choice but follow the externally-driven new farm standard which has improved the living environment for the animals and therefore their yields significantly. Effect of these new requirement on unit cost is still under debate. Some farmers even claim that certain requirements under the new farm standard (such as limiting the total weight of animal per area) has help them reducing their unit cost of production. Other found that the requirements increase their costs, but are nevertheless willing to comply since they would provide them a ticket to higher-value market.
As for dairy farms, scaling up from very-small farm (with 1-5 cattle) to a medium sized farm (11-50) usually come with better housing and tend to make the animals better off because their living conditions are better and they do not have to rely on concentrate feed as much as in most of “very small” farms.
In terms of human health (esp. food safety), it appears that more stringent requirements usually come through external demand. Since, however, scaling up occurs more often in the exporting sector, the food safety standard appears to be improved with scaling up, although scaling up itself might not be the cause of such an improvement.
Since scaling up usually require more capital, it has always been concerned that scaling up would drive small holders out of the business. Thus far, we have not undertaken any systematic study on this issue. We have learned of numerous cases where small livestock farms were out of the business, but in most cases they could not be categorized as “poor farmers”. On the other hand, we have found many successful livestock farmers whose likelihood have been improved substantially after they switched from crops to livestock and continue to expand their businesses via the scaling-up process.
Attanathakul, N. 1995. Utilization of extruded broken rice starch and extruded full-fat soybean in weaned pig diets. MS Thesis, Kasetsart University, Bangkok, Thailand (in Thai)
Australian Dairy Corporation 1999. Australian Dairy Industry in Focus 99
Australian Dairy Corporation 1999. Dairy Compendium 99
Bate, S.A.E. and Pattision, N.1997.UK milk prices and farmers attitudes towards them since market deregulation. British Food Journal, 99 (2): 50-56
Chantsavang, S and S. Choowatanapakorn. 2002. Housing systems and applications for an effective waste management system in a tropical climate. In proceeding of a conference on International Esminger Ag-Tech School 2002 held at Kasetsart University, Kampaengsaen, Nakhon Pathom, Thailand, February 8 - 9 , 2002
Division of Animal feeds quality control; 2000, 20th years Anniversary, Department of Livestock Development Ministry of Agriculture and Cooperative
Falvey, L and Chantalakhana, C 1999. Small holder Dairying in the Tropics. International Livestock Research Institute. Nairobi
Kanto, U. 1994. Feed and feeding of high performance pigs in Thailand. In Commercial Swine Production, volume 1. Edited by N. Siristein and S. Juttupornpong, National Swine Research and Training Center, Kasetsart University, Nakhon Pathom, Thailand, p. 115 - 126
Katanyukul, L. 1995. Effects of sesame meal in growing-finishing pig (30 - 90 kg.) diets. MS Thesis, Kasetsart University, Bangkok, Thailand (in Thai)
Lertsongwuthikul, O. 2001. Uses of natural zeolites from Thailand deposit for aflatoxins absorption in growing-finishing pig diets. MS Thesis, Kasetsart University, Bangkok, Thailand (in Thai)
Ministry of Agriculture & Cooperative: 1999, Livestock farming standard Of Thailand. Bangkok, Division of animal protection, Department of Livestock Development
National genetic engineering and Biotechnology office for Science and Technology Development, Ministry of Science Technology and Environment; 2001 National policy for dairy industry development of Thailand
NCPP. 2001. Nutrition and feeding of Danish pigs. National Committee on Pig Production, Denmark
Niyombandit, T. 1986. Effects of palm kernel meal in growing-finishing pig diets. MS Thesis, Kasetsart University, Bangkok, Thailand (in Thai)
NRC. 1998. Nutrient Requirement of Swine, 9th edition, National Academy of Science, Washington, DC, USA
Panachareonsawat, S. 1995. Amino acid requirements of Danish Landrace, Duroc and Hampshire from 15 to 90 kg live weight under tropical condition. MS Thesis, Kasetsart University, Bangkok, Thailand (in Thai)
Pollution Control Department. 1999. The Development and Waste Treatment Technology of Swine Farms in Thailand
Pollution Control Department. 2001a. Department Announcements on The Listing of Swine Farm on the Pollution Source to be Monitored Dated 23 February 2002
Pollution Control Department. 2001b. Department Announcements on Waste Water Standard for Swine Farms Dated 23 February 2002
Statistics New Zealand 2000 New Zealand in Profile 1999
Supardee, M. 1994. Effects of mungbean protein concentrate in growing - finishing pig (20 - 90 kg.) diets. MS Thesis, Kasetsart University, Bangkok, Thailand (in Thai)
Yukol Liumlammthong ; 2001 , Strategic of Livestock development for food safety and exportation. Vice Director Department of Livestock Development Ministry of Agriculture and Cooperative
|
[139]
Thailand Development Research Institute, Bangkok, Thailand. [140] The “Evap Houses” commonly used in Thai broiler industry are modified from those used in the US. However, while the Thai “Evap Houses” are similar to the close-system houses in the US., the main purpose of keeping the house closed is to keep the inside temperature cooler than the atmosphere. Another difference is that many Evap Houses in Thailand do not use full automation like those housing in the US, where a house would host more chicken and use less labor. This is probably because the labor cost in Thailand is much cheaper than in the US. [141] In 1996, about 50 percent of the Thai population are reportedly farmers. However, many who call themselves farmers earned more non-farm income than their farm income. [142] The EU also banned four antibiotics a few years ago. [143] For examples, many modified evap houses by substituting importable cooling pad by inexpensive nylon net. [144] Hong Kong and Japan together imports about 5 billion eggs each year, which is equal to 60 percent of world egg market. However, the strict health requirements in the Japanese market often bar Thai eggs from getting in. [145] At first, there was no protection policy since it did not make sense to protect something when there was nothing to protect [146] There have been serious corruption problems with the program. [147] A recent study found that DRC is in a range of 1.025 to 1.667, which means that domestic production is 2.5% to 66.7% more expensive than imports. |
![]()
![]()
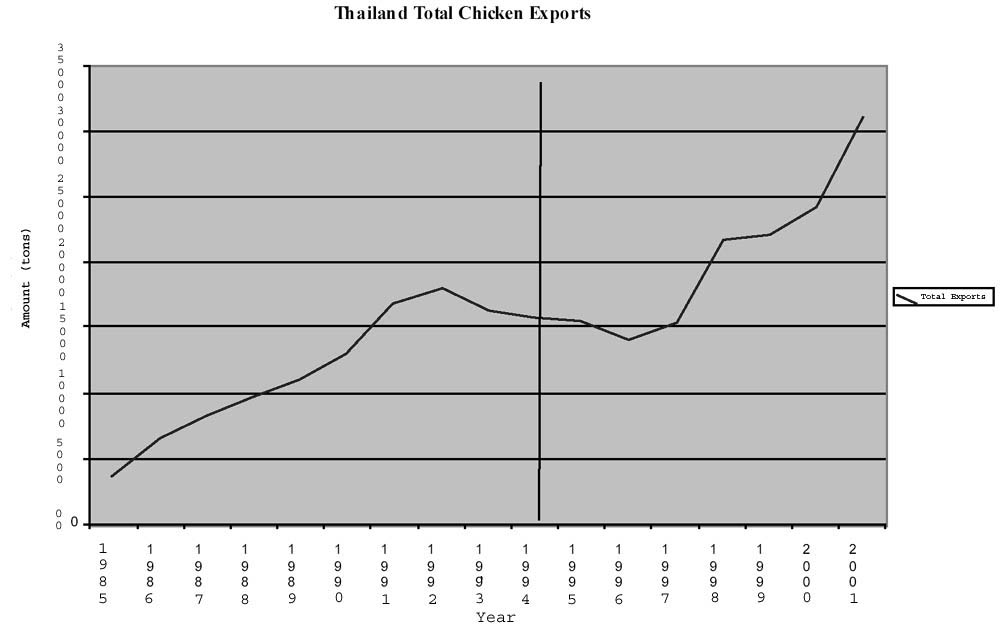
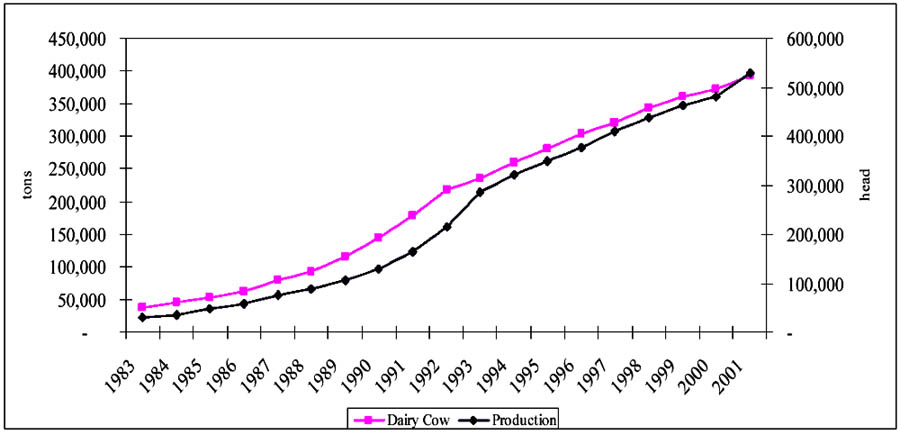