![]()
![]()
![]()
Discussion Draft for Comments:
Please do not cite or distribute
Geraldo Sant’Ana de Camargo Barros[132]
Sergio de Zen[133]
Heloisa Lee Burnquist[134]
Silvia Helena Miranda[135]
Marciá Dias de Moraes[136]
Paulo Faveret Filho[137]
Paulo Martins[138]
May 2002
This paper was produced as part of Phase I of an IFPRI-FAO project entitled "Livestock Industrialization, Trade and Social-Health-Environment Impacts in Developing Countries", funded by the Department for International Development (DFID), U.K., through the Livestock, Environment and Development (LEAD) initiative at FAO. Correspondence may be addressed to the scientific coordinator for the project, Dr. Christopher Delgado, IFPRI, 2033 K St, N.W., Washington D.C. 20006, USA. Email: [email protected]
Brazil’s economic development process is changing dramatically since the 1980’s as a result of internal and external factors which impacted both the public and the private sectors. Internally the industrialization through the import substitution process, based on public and external savings, has exhausted. A chronic fiscal crisis has settled down since then and remains until the present days. On the external front, the rapid growth of globalization led to an extensive commercial and financial integration, which in turn increased the need for competitiveness and affected the ability of governments to act on the economy.
Traditional inflationary financing of the public deficit became politically less and less acceptable as inflation rates reached critically high levels along the eighties (Pastore & Pinotti, 1999). Public administrations applied then several inflation fighting programs, but positive results were obtained only in 1994, when the Real Plan was implemented. Although such results may in a large extent be attributable more to indexation reduction or extinction, severe monetary restraint and changes in the exchange rate regime (with overvaluation of domestic currencies) than to permanent solution to the fiscal crisis, it is a fact that several public expenditure programs have been curtailed, among them those agricultural programs directed to price stability, research and extension, infrastructure could be mentioned.
The private sector was influenced directly by both macroeconomic factors - associated with exchange rate and interest rate changes and also by changes in sectoral policies - and microeconomic factors - related to allocative effects associated with comparative advantage changes. The public sector was affected insofar as those internal and external changes demanded a radical redefinition of the roles of the government and its interactions with the private sector. Public sector’s expenditure adjustment tended to lead to reduction in its entrepreneurial function - with an acceleration of the privatization process - and market intervention functions. More emphasis seemed to be placed on public services, such as health, education, research and technology, etc., and regulation of economic activities. Of course the reallocation of resources took place within the limits dictated by the fiscal crisis. Evidences indicate that the agribusiness sector has been one of the economic sectors mostly affected by the changes.
Three majors factors may be pointed out as shaping the agribusiness sector from the early nineties on. In the first place, Brazil jumped very fast into a more open economy system reducing substantially trade barriers and exposing domestic production to external competition. Since this move was followed by an exchange rate policy directed to an overvalued currency, the result was that prices were held under control as desired by an economy where inflation fighting was the primary priority.
Second, an overvalued currency in a more open economy would naturally demand additional external savings to make up for growing country trade deficit. External capital flowed in at desirable and needed rates both as loans attracted by very high internal interest rates (used to fight inflation) and as direct investments predominantly related to the strong privatisation process carried out by federal and state governments.
Third, as new investment capital entered the country business concentration increased substantially in almost every economic sector, including the agribusiness sector. Both agro industry and supermarket chains had its market power strengthened, with a clear preponderance of the latter.
In the supermarket sector the number of fusions and acquisitions reached a record of 13 in 1998 and 12 in 1999 as opposed to only 2 in 1994. Concentration ratio as measured by the share of the 5 largest supermarket conglomerates increased to 38% in 1999, a number that is larger than the ratio observed in their United States (35%). Small and mid-sized supermarkets had a reduction in gross sales of about 60% in that same period (Silva & Famá, 1999), while hypermarkets had an increase in their gross sales share form 19% to 31%.
Agro industry concentration also increased form the 80’s to the 90’s, as it will be shown in this report. The industrialized meat sector is very concentrated as a matter of fact: the 3 largest industries comprise 55% of total production. The dairy industry is concentrated as well: the 5 largest firms are responsible for 50% of the sector’s production.
It is to be understood, however, that, although supermarkets obtained increased power, the degree of retail level competition turned out to be much more severe than before. This structural change resulted in a very important conduct change in the food chains. Traditionally, industry would lead price changes and supermarkets would transmit them to consumers in a passive way. Now, supermarkets adopted the strategies of price competition among themselves (at the retails level) and of a very active (aggressive) trading with agro industries. The possibility of importing almost any item certainly helps a lot this tough kind of negotiation. It has been observed that consumers’ prices particularly food prices’ variations have been held very much below the general price index. Of course the industry strategy had to be to hold prices down the food chain until the farm level. Substantial relative farm price reductions have been observed as matter of fact.
Significant changes were observed in the allocation of public resources to the agricultural sector. The strategy has been to save resources by reducing the role of the government in commodity programs such as buffer stocks and minimum price for grain products and in such long living specific commodity programs as those directed to coffee, rubber, wheat, and sugar and alcohol. The data available - Table 1.1 - for the period from 1987 to 1996 indicate that the total amount of federal public resources applied in the agricultural sector was drastically reduced - by around 46% - from 1987 to 1989 with the lowest level being reached in 1992 (70% below the 1987 value); since then an increasing trend is observed but by no means expenditure approached the 1987 level again.
Table 1.1 (a) - Federal Public Expenditures in Agriculture (US$ million, 1995=100)
|
PROGRAMS |
1987 |
1988 |
1989 |
1990 |
1991 |
1992 |
1993 |
1994 |
1995 |
1996 |
|
Science and Technology |
197,6 |
212,8 |
467,6 |
387,3 |
279,8 |
225,2 |
272,2 |
300,5 |
423,3 |
473,3 |
|
Promotion and Extension |
323,5 |
657,0 |
369,6 |
460,7 |
752,2 |
104,9 |
47,2 |
90,6 |
52,0 |
34,7 |
|
Animal and Veg Production |
104,3 |
104,2 |
157,3 |
25,7 |
18,8 |
20,2 |
28,3 |
31,0 |
44,7 |
24,9 |
|
Commodity Supply |
8238,9 |
5845,8 |
1792,4 |
2223,1 |
1489,9 |
1276,9 |
2368,2 |
3709,0 |
4326,0 |
2682,2 |
|
Water Resources |
444,0 |
423,0 |
471,1 |
439,8 |
367,7 |
280,2 |
309,0 |
400,3 |
363,4 |
314,2 |
|
Administration |
317,8 |
717,7 |
2258,8 |
1879,9 |
nd |
nd |
679,0 |
1024,3 |
1610,6 |
285,7 |
|
Agrarian Organization |
254,0 |
731,5 |
101,8 |
272,3 |
nd |
nd |
340,2 |
547,6 |
1162,1 |
1162,8 |
|
TOTAL |
10930,9 |
8887,3 |
5870,8 |
6744,9 |
4813,0 |
3238,3 |
4252,5 |
6228,7 |
8281,3 |
5618,2 |
Table 1.1 (b) - Federal Public Expenditures in Agriculture (percentages)
|
PROGRAMS |
1987 |
1988 |
1989 |
1990 |
1991 |
1992 |
1993 |
1994 |
1995 |
1996 |
|
Science and Technology |
1,81 |
2,39 |
7,96 |
5,74 |
5,81 |
6,95 |
6,40 |
4,82 |
5,11 |
8,42 |
|
Promotion and Extension |
2,96 |
7,39 |
6,30 |
6,83 |
15,63 |
3,24 |
1,11 |
1,45 |
0,63 |
0,62 |
|
Animal and Veg Production |
0,95 |
1,17 |
2,68 |
0,38 |
0,39 |
0,62 |
0,67 |
0,50 |
0,54 |
0,44 |
|
Commodity Supply |
75,37 |
65,78 |
30,53 |
32,96 |
30,96 |
39,43 |
55,69 |
59,55 |
52,24 |
47,74 |
|
Water Resources |
4,06 |
4,76 |
8,02 |
6,52 |
7,64 |
8,65 |
7,27 |
6,43 |
4,39 |
5,59 |
|
Administration |
2,91 |
8,08 |
38,48 |
27,87 |
nd |
nd |
15,97 |
16,44 |
19,45 |
5,09 |
|
Agrarian Organization |
2,32 |
8,23 |
1,73 |
4,04 |
nd |
nd |
8,0 |
8,79 |
14,03 |
20,70 |
|
Others |
9,61 |
2,20 |
4,30 |
15,66 |
nd |
nd |
4,9 |
2,01 |
3,61 |
11,40 |
|
TOTAL |
100,00 |
100,00 |
100,00 |
100,00 |
100,00 |
100,00 |
100,00 |
100,00 |
100,00 |
100,00 |
Sources: GASQUES & VILLA VERDE (1991 and 1995), VILLA VERDE (1997) and IPEA
It is clear that considerable savings were obtained by cutting expenditures on commodities programs. Part of these savings was applied to Research and Technology and to Agrarian Organization (land reform basically). Significant reductions were carried out on Rural Extension and on Animal and Vegetal Programs as well. Although the relevance of Extension Programs may be considered questionable, the importance of some activities such as applied research, sanitary defense, improved seed production, product safety inspection, classification etc. - all under the heading of Animal and Vegetal Programs - is out of question in an open economy framework. Research and Technology Programs have been better funded, considering their level of priority. It is apparent the intention to at least keep constant the amount of resources allocated to them until present days.
Besides the commodity programs, the rural credit program has historically played a fundamental role in terms of agricultural policy in Brazil and has been submitted to important changes during the last decade as well (Barros, 1998). Table 1.2 shows that between 1987 and 1996 a reduction of about 70% in the total amount of credit to agriculture has taken place.
Table 1.2 - Rural Credit and its Sources (US$ millions), BRAZIL 1987/99*
|
Ano |
Tesouro |
Exigibil. |
Poup. |
R.Livres |
FAT |
Outros |
Total |
|
1987 |
11.872 |
10.935 |
7.181 |
... |
... |
1852 |
31.840 |
|
1988 |
5.639 |
7.706 |
8.403 |
... |
... |
719 |
22.467 |
|
1989 |
4.917 |
2.966 |
10.591 |
1.601 |
... |
443 |
20.518 |
|
1990 |
3.132 |
3.209 |
2.346 |
2.332 |
... |
703 |
11.722 |
|
1991 |
2.924 |
2.707 |
3.906 |
1.248 |
... |
1.309 |
12.095 |
|
1992 |
3.080 |
2.509 |
6.104 |
906 |
... |
807 |
13.407 |
|
1993 |
3.070 |
1.271 |
4.976 |
1.351 |
... |
845 |
11.514 |
|
1994 |
4.302 |
1.841 |
5.540 |
2.528 |
... |
1.662 |
15.874 |
|
1995 |
1.422 |
949 |
2.640 |
1.176 |
... |
1.068 |
7.218 |
|
1996 |
220 |
1.065 |
576 |
509 |
1.386 |
2.552 |
6.308 |
|
1997 |
137 |
4.088 |
766 |
548 |
1.678 |
1.889 |
9.106 |
|
1998 |
165 |
4.042 |
1.291 |
464 |
1.574 |
2.390 |
9.926 |
|
1999a |
10 |
3.827 |
1.786 |
465 |
1.542 |
1.871 |
9.501 |
* Real values of 07/97.
a- preliminar
Sources: Banco Central and Banco do Brasil
A major source of savings for the public sector was the change in the role of Treasury which currently only transfer funds corresponding interest rate differentials - between market and official rates - to the financial agents. Rural loans have also been reduced because resources originated from demand deposits with mandatory application in the rural sector also have diminished drastically - as the inflation rate increased and financial market developed currency saving instruments. Today the official credit system is directed to serve mainly small family farmers at subsidized interest rates.
Since the rural credit has been an important instrument to stimulate the use of modern technology in agriculture, some negative productivity impacts were expected to have occurred from the 1980s to 1990s. It is true that as the official credit system lost most of its importance, some private sources of credit emerged, including both commodity buyers and input suppliers’ credit funded in a significant degree by external sources. Although specific research is needed to correctly evaluate the role of this type of credit, it is believed that it has been providing funds mainly for working expenses for commercial farming purposes.
It is safe to say that, although the use of fertilizer and other inputs use may have been negatively affected, one of the largest impacts of the changes in the credit system has been the reduction in funds for farm investment. The behavior of the sales and the stock of farm tractors in Brazil, as shown in Table 1.3, give some strong indication of that impact. The degree to which this problem of investment funding is overcome will certainly be one of the most important determinants - along with the behavior of terms of trade - of the growth prospects for the agricultural sector in Brazil. Currently the National Bank for Economic and Social Development - BNDES - is the major official source of investment credit to the agribusiness sector in Brazil.
Some additional evidences regarding the impacts of changes in the Brazilian agricultural policies are presented in Table 1.4. It is possible to verify a diminishing rate of growth in the number of farmers reporting the use of inputs, like fertilizer and pesticides, as well as of tractors, electricity and irrigation between the years of 1980 and 1995. The number of farmers reporting the use of credit reduced at substantial rates in the same time period.
Table 1.3 - Sales and Stock of Farm Tractors in Brazil
|
Year |
Sales |
Sales |
Stock |
Stock |
|
1970 |
14740 |
|
165.3 |
1 |
|
1975 |
57931 |
293.0 |
331.2 |
100.4 |
|
1980 |
50994 |
-12.0 |
555.1 |
66.4 |
|
1985 |
41243 |
-19.1 |
663.5 |
19.5 |
|
1990 |
22012 |
-46.6 |
801.9 |
20.8 |
|
1995 |
17584 |
-20.1 |
788.6 |
-1.7 |
|
1997 |
15731 |
-10.5 |
711.7 |
-9.8 |
Sources: Mendonça de Barros (1999) and ANFAVEA.
Table 1.4 - Users of Tractors, Fertilizer, Pesticides, Irrigation, Electricity and Credit. Brazil 1980/95
|
Items |
Informers (number) |
Yearly Change (%) |
|||
|
1980 |
1985 |
1995 |
1985/1980 |
1995/1985 |
|
|
Tractors |
360289 |
427814 |
512144 |
3.49 |
1.81 |
|
Fertilizers |
1657827 |
1832658 |
1859340 |
2.02 |
0.15 |
|
Pesticides |
3110234 |
3186276 |
3207749 |
0.48 |
0.06 |
|
Irrigation |
186129 |
239067 |
286139 |
5.13 |
1.81 |
|
Energy |
536672 |
980871 |
1895096 |
12.82 |
6.81 |
|
Credit |
1085058 |
734351 |
258165 |
-7.51 |
-9.92 |
Source: IBGE/DPE/DEAGRO - Censo Agropecuário 1985 e 1995/96 e Censo Agropecuário 1980, in Gasques and Conceição (1999).
It is a kind of a puzzle that despite the above-mentioned agricultural policy changes, the Brazilian agribusiness experienced a real technological revolution in the nineties. The 2000/2001 grain harvest reached 98 million tons, a 17.3% increase over the previous year’s estimate. Planted land area was reduced by 1.45% in the same period. A new (fourth in a row) record harvest is expected for the current crop year.
As a matter of fact, productivity has been increasing in the Brazilian agriculture over the last 30 years at an average annual rate of 2.4%. In the more modern and homogeneous Center West regions those rates were between 3% and 4% and in more recent years they have situated above 5% per year. Table 1.5 indicates the evolution of agricultural total productivity for Brazil and some selected states since 1975. On average, Agriculture total productivity grew 79% in the 25 years considered in the table. Traditional agriculture states - like São Paulo (SP) and Rio Grande do Sul (RS) lagged very much behind Paraná (PR), Goiás (GO), Mato Grossso do Sul (MS) and Mato Grosso (MT).
Table 1.5 - Total Productivity Gains in Brazil’s Agriculture, 1970-1995
|
Ano |
Brasil |
SP |
PR |
RS |
GO |
MS |
MT |
|
1970 |
100 |
100 |
100 |
100 |
100 |
100 |
100 |
|
1975 |
114 |
117 |
160 |
98 |
119 |
100 |
85 |
|
1980 |
122 |
121 |
192 |
97 |
127 |
130 |
117 |
|
1985 |
142 |
160 |
234 |
123 |
204 |
180 |
198 |
|
1995 |
179 |
164 |
284 |
149 |
258 |
304 |
341 |
Source: IBGE/Censo Agropec. e FGV - Gasques & Conceição (IPEA)
Some possible explanations to the productivity puzzle of the nineties have been suggested: (a) part of the productivity increase is a clear effect of the maintenance of the level of the public research and technology funds, particularly to EMBRAPA; (b) other part is due to opening the sector to foreign competition, which forced economic agents to move to more efficient management and technical practices; (c) other part is due to the selective migration process with less efficient farmers and agribusiness agents in general quitting business and the more efficient moving to more modern large scale activities, in a significant degree in the new frontier lands.
Figure 1.1 shows the behavior of prices received by farmers as opposed to prices paid by farmers and the general price level. The year of 1994 - when the inflation stopping Real Plan was implemented - is taken as reference. It is clear that farmers have been facing a rather unfavorable trend by any angle their terms of trade are constructed.
Source: Fundação Getúlio Vargas (FGV)
The performance of the agribusiness sector can be best evaluated considering the evolution of the prices paid by consumers for agribusiness goods as shown in Figure 1.2. Contrary to historical trends, agribusiness prices cannot be said to have been an important factor to increase the cost of living in Brazil after the Real Plan. It is also relevant to indicate that not only efficiency has grown at the farm level as indicated by growing production at decreasing prices but at whole food supply chain as demonstrated by consumer prices.
Figure 1.2 - Overall (IPC Total) and Food (IPC -Alim.) Consumer Price Indexes, Brazil: 1994-2001.
Source: IBGE
Another way to evaluate the performance of the Brazilian agribusiness sector is to examine its behavior in external markets. Figure 1.3 shows that the agribusiness sector has produced important trade surplus, while, as is well known, the Brazilian economy as a whole has produced systematically trade deficits in most of the last decade.
Figure 1.3 - Trade Balance, Brazil: 1992-2000
Source: Ministério da Agricultura
It is worth emphasizing that trade surplus were produced by the Brazilian agribusiness sector even though international market prices were quite depressed during the past decade. Real exchange rate was also very much overvalued for several years in this decade. The strong devaluations that occurred in 1999 and 2001 will certainly provide a more favorable external scenario for the Brazilian agribusiness sector. See Table 1.6.
Table 1.6 - Food and Raw Material International Prices
|
Year |
Food Price |
Raw Material |
Real Exchange |
|
1990 |
87,99 |
76,18 |
0,91 |
|
1991 |
87,17 |
73,40 |
1,11 |
|
1992 |
89,14 |
75,41 |
1,19 |
|
1993 |
87,98 |
87,60 |
1,10 |
|
1994 |
92,48 |
95,89 |
0,87 |
|
1995 |
100,00 |
100,00 |
0,83 |
|
1996 |
112,21 |
97,30 |
0,88 |
|
1997 |
100,26 |
90,64 |
0,87 |
|
1998 |
87,69 |
75,83 |
0,90 |
|
1999 |
74,01 |
77,52 |
1,11 |
|
2000 (April) |
74,31 |
79,51 |
0,98 |
Sources: IMF Financial Statistics and Fundação Getúlio Vargas
This section summarizes background information on the Brazilian poultry, pork and milk sectors.
The modern poultry industry was installed in Brazil in the 70’s and has been a market led by a few large industries. There are also small and medium-sized slaughterhouses, most of which operating not on entirely legal patterns. Large slaughterhouses, in turn, are mainly located in the South, spreading to the Southeast with the acquisition of traditional slaughterhouses.
In the 80’s, the supply structure was rearranged with the aid of abundant public credit and the 5 largest companies doubled their share in the national production, influenced by the strong incentive to exports as well. In 1985 the five largest companies had a 35% share of production, and along the 90’s they reached about 50%. Currently Brazil presents one of most dynamic production system, either in production, consumption or export terms (Table 2.1)
Table 2.1 - Poultry Meat Production, Consumption and Exports - Rate of change per year (%) for selected countries; 1997-2001
|
|
Brazil |
US |
EU |
China |
|
Production |
12.6 |
3,7 |
0.5 |
4.9 |
|
Consumption |
12.1 |
4.2 |
0.3 |
5.5 |
|
Exports |
10.5 |
1.5 |
3.9 |
11.8 |
Source: Elaborated based on World Markets and Trade, USDA
Poultry production and slaughterhouses are mainly concentrated in the South, more precisely in Santa Catarina, where the traditional leading industries can be found: SADIA, PERDIGÃO, CHAPECO, and CEVAL. In Rio Grande do Sul, we have FRANGOSUL, AVIPAL, and MINUANO. Figure 2.1 shows the shares of these companies in the Brazilian market
Figure 2.1 - Average Participation in the Poultry Market - 1990/1998
Source: ANAB
Traditionally, the commercial poultry production in Brazil has been based on the "integration" system in which small and medium-sized farmers grow chickens for the large processing industries. In the state of Santa Catarina, for example, a typical farmer would have a building to house 6 to 15 thousand chickens (Helfand and Rezende, 1998). The relative size of each system in the chain will depend on the region considered, but it is estimated that 90% of the market is integrated at a wider or lesser extent.
Poultry production development depends on two basic factors: technology and logistics. Technology is used in the production and in the elaboration of new products and has to be acquired from specialized companies.
Processing technology permitted that only a group of large companies succeeded in concentrating on product differentiation and creation of new products. They were able to reduce whole poultry commercialization in favor of new products.
The physical distribution segment has been a real barrier to the establishment of new companies in the market. Leading companies are examples of efficiency in distribution logistics with the operations being carried out by contracted firms.
Chicken has become a fundamental element in the human consumption worldwide. Brazilian companies have shown to be prepared to meet the specific market needs. See Table 2.2.
Table 2.2 - Main Products In Large Companies - 1990/1997
|
COMPANIES |
WHOLE CHICKEN |
CUTS OF CHICKEN |
TOTAL |
|
Sadia Concórdia |
28.3 |
13.4 |
22.1 |
|
Perdigão agroindustrial-SC |
16.7 |
18.9 |
17.7 |
|
Ceval alimentos |
9.9 |
24.3 |
15.9 |
|
Frangosul |
11.1 |
5.7 |
8.8 |
|
Chapecó |
10.2 |
6.4 |
8.7 |
|
Frigobras |
8.5 |
5.1 |
7.1 |
|
Perdigão agroindustrial-RS |
3.6 |
9.2 |
6 |
|
Cia. minuano de alimentos |
1.5 |
5.7 |
3.3 |
|
Diplomata ltd. |
4.5 |
0.1 |
2.7 |
Source: ABEF
Exports of poultry meat have also presented an impressive increase from 1997 to 2001 period, evolving from 649 million tons by 1997 to an estimated value of 1,215 million tons in 2001 (Figure 2.2).
Source: USDA, World Markets and Trade; Foreign Agricultural Service; Dairy, Livestock and Poultry Division.
This good export performance has occurred in spite of the decline in the Brazilian export unit price since 1995. A combination of domestic currency overvaluation (up to January 1999) and the devaluation of Asian currencies contributed for the fall in prices.
The main objective of swine sector in Brazil is pork production for the domestic market, although pork exports have grown in recent years (Table 2.3). Swine population in Brazil is practically stagnated. However, productivity is increasing.
Table 2.3 - Performance of swine population, slaughter, production, exports and imports in Brazil
|
Discrimination |
1980 |
1985 |
1990 |
1995 |
1996 |
1997 |
1998 |
1999 |
2000 |
|
Swine population (million heads) |
32.5 |
32.2 |
33.6 |
36 |
29.2 |
29.6 |
30 |
30.8 |
29.6 |
|
Slaughter (million heads) |
17.5 |
14 |
16 |
19.2 |
20.4 |
20 |
22.4 |
23.5 |
24.9 |
|
Per Capita consumption (kg) |
9.67 |
7 |
7.05 |
8.78 |
9.11 |
9.31 |
10.09 |
10.41 |
10.9 |
|
Pork production (thousand tons) |
1.150 |
966 |
1.040 |
1.387 |
1.490 |
1.540 |
1.699 |
1.834 |
1.967 |
|
Imports (thousand tons) |
1 |
2 |
1.4 |
8.5 |
1.2 |
5 |
1.2 |
0.71 |
0.66 |
|
Exports (thousand tons) |
0.2 |
5.2 |
13.1 |
37.5 |
73 |
76 |
95.8 |
87 |
128 |
|
Brazilian population (million inhabitants) |
- |
- |
144.7 |
155.8 |
157 |
162.2 |
166 |
168 |
170 |
Source: MARA/ABIPECS/FAO/IBGE
The Brazilian swine sector is concentrated basically in the South that is responsible for 60% of the national pork production. From 1997 to 2001, the Brazilian pork production and consumption presented growing trends (8.9% and 8.4% respectively). During this same period pork meat exports increased by 17.7%. See Figure 2.3.
Source: USDA, World Markets and Trade; Foreign Agricultural Service; Dairy, Livestock and Poultry Division.
There is a major difference between the integrated and the independent systems. In the integrated system, producers have no feed and breeding expenses while in the independent system all costs are paid by producers. The main item in swine production is feeding expenses, which correspond to 65 to 70% of the total cost. This cost can be divided into three groups: corn (energy/carbohydrates), soy meal (protein) and the "mineral nucleus".
The number of producers with over 200 heads increased in practically all main regions of the country between 1985 and 1995. In Santa Catarina, the growth was faster than in other areas of Brazil. This shows the growth in scale of Brazilian producers (Figure 2.4).
Figure 2.4 - Brazilian Swine Herd Distribution (number of animals)
Source: IBGE Census - 85/87 and 95/96
The Brazilian milk production in 2001 was approximately 20 billion liters. About 25% were sourced by the 5 major national companies. If only the formal inspected volume is considered, this value goes up to 43%.
Brazil stands out as the country with the highest number of milk producers and with the lowest average productivity, when compared to other important countries (UE, New Zealand, Australia, United States etc).
The market structure of the primary milk supply is extremely pulverized. Producers whose daily production is lower than 50 liters represent the great majority in Brazil (87.7%), with a relatively low participation in the total production (Table 2.4).
Table 2.4 - Percent distribution of the amount of producers and milk supply in Brazil: 1995/1996
|
Region |
Up 50 |
> 50 < 100 |
> 100 < 200 |
> 200 |
||||
|
Producers |
Yield |
Producers |
Yield |
Producers |
Yield |
Producers |
Yield |
|
|
N |
90.9 |
54.3 |
6.4 |
22.7 |
2.1 |
14.3 |
0.6 |
8.7 |
|
NE |
95.9 |
53.8 |
2.5 |
15.0 |
1.1 |
17.7 |
0.5 |
13.5 |
|
SE |
73.1 |
21.1 |
13.3 |
17.0 |
8.2 |
20.6 |
5.4 |
41.3 |
|
S |
92.9 |
57.1 |
4.8 |
17.7 |
1.6 |
11.8 |
0.7 |
13.4 |
|
MW |
72.6 |
28.2 |
15.8 |
23.6 |
8.2 |
23.7 |
3.4 |
24.5 |
|
Brazil |
87.7 |
36.1 |
7.0 |
18.2 |
3.5 |
17.8 |
1.8 |
27.9 |
Source: IBGE - Agriculture Census
Two forces shaped the sector in the nineties: informal milk production rose considerably (52%) and so did the imports of dairy products (146%). The growth of formal production was lower. Informal production is estimated to represent half the total national production.
The main milk production areas in the country are in the states of Minas Gerais (30% of the national production), São Paulo (10.5% of the national production, especially in the areas of the Vale do Paraíba Valley and São José do Rio Preto), Rio Grande do Sul (10%), Paraná (10%), and, more recently, southern and southeastern Goiás (9%). The production in Goiás’ savannah started after the deregulation of the sector, and most of it is shipped to the largest consumer centers of Brazil. Basic parameters for milk production in Brazil are shown in Table 2.5.
Table 2.5 - Parameters for milk production in Brazil (1985 and 1996)
|
DESCRIPTION |
1985 |
1996 |
% |
|
Annual production (billion liters) |
12.85 |
17.93 |
39.6 |
|
% of dairy cattle production |
65.3 |
75.1 |
15.0 |
|
% of beef and dairy cattle production |
11.5 |
7.3 |
-36.9 |
|
% of production of beef cattle and others |
23.2 |
17.6 |
-23.8 |
|
No. of milked cows. |
13.4 |
13.7 |
2.5 |
|
Liters/milked cow/day |
2.6 |
3.6 |
36.1 |
|
No. of milk producers (million) |
1.87 |
1.81 |
-3.1 |
|
Liters/producer/day |
18.8 |
27.1 |
44.0 |
Source: Barros et al (2000)
From the technological point of view, there are two types of milk producers in Brazil: the specialized and the non-specialized farmers, the latter being the great majority. According to Farina & Jank (1998), for the specialized producers milk production is the main activity. The non-specialized producers are those for whom milk is a by-product of beef cattle production (or the contrary, depending of the season), This flexibility makes them capable of operating under wide price oscillations. The use of rudimentary technology is the main cause of low quality (Farina & Jank, 1998). Outdated sanitation plus inefficiency of the control systems also explain the poor quality of milk in Brazil.
The market structure of the dairy industry is an oligopoly made up of a small group of leading companies, surrounded by medium and small companies with local presence. They compete both for raw material at the farm level and for the distribution of finished products at the consumer level. Each dairy company has their own rewards and discount system so the average price paid to farmers is the result of their own milk policy designed to avoid seasonal shortages of milk.
Characteristics of the market structure at the farm level are presented in Tables 2.6 and 2.7. The number of milk suppliers decreased enormously in the 3-year period considered. Taking the 12 largest milk processors it is observed a decrease of 28% or 56 thousand suppliers. At the same time, an increase of 37% in the milk volume per supplier occurred.
Table 2.7 - Number of suppliers to the main dairy companies in Brazil
|
|
|
1996 |
1997 |
1998 |
Variation 98/96 |
|
1st |
Nestle |
39,200 |
35,089 |
28,920 |
-26% |
|
2nd |
Parmalat |
35,846 |
21,040 |
16,052 |
-55% |
|
3rd |
Itambé |
19,927 |
18,250 |
15,369 |
-23% |
|
4th |
Paulista |
25,404 |
24,481 |
22,162 |
-13% |
|
5th |
Elege |
44,000 |
38,537 |
34,402 |
-22 |
|
6th |
Grupo Vigor |
8,368 |
8,142 |
6,442 |
-23% |
|
7th |
Batavia/Agromilk |
11,820 |
11,125 |
10,393 |
-12% |
|
8th |
Fleischmann Royal |
6,000 |
4,000 |
3,000 |
-50% |
|
9th |
Danone |
2,106 |
1,426 |
651 |
-69% |
|
10th |
Laticínio Morrinhos |
4,333 |
4,300 |
4,250 |
-2% |
|
11th |
SUDCOOP |
4,108 |
3777 |
3,734 |
-9% |
|
12th |
CCPL-RJ |
2,654 |
1,985 |
499 |
-81% |
|
|
Sub-Total (12) |
203,766 |
172,152 |
145,874 |
-28% |
Source: Jank & Galan (2000)
Table 2.8 - Daily volume per supplier of the main dairy companies in Brazil.
|
|
|
1996 |
1997 |
1998 |
Variation 98/96 |
|
1st |
Nestlé |
100 |
110 |
129 |
29% |
|
2nd |
Parmalat |
61 |
112 |
139 |
129% |
|
3rd |
Itambé |
98 |
110 |
134 |
37% |
|
4th |
Paulista |
72 |
75 |
77 |
7% |
|
5th |
Elege |
35 |
43 |
48 |
38% |
|
6th |
Grupo Vigor |
99 |
99 |
122 |
24% |
|
7th |
Batavia/Agromilk |
62 |
67 |
72 |
16% |
|
8th |
Fleischmann Royal |
80 |
114 |
168 |
109% |
|
9th |
Danone |
225 |
321 |
608 |
171% |
|
10th |
Laticínio Morrinhos |
55 |
67 |
78 |
42% |
|
11th |
SUDCOOP |
75 |
78 |
85 |
14% |
|
12th |
CCPL-RJ |
233 |
274 |
564 |
143% |
|
Average |
74 |
89 |
101 |
37% |
|
Source: Jank & Galan (2000)
Another important trend observed in the dairy sector is the large-scale substitution of pasteurized milk (whose production fell 27% in the period) by sterilized milk (Long Life or UHT), which had an 895% increase from 1990 to 1998. (Table 2.9).
Table 2.9 - Brazilian Market of Milk and Dairy Products - 1990-1998 (in millions of liter equivalent to fluid milk)
|
|
1990 |
1998 |
Variation (1996/98 |
||
|
CONSUMPTION |
15,393 |
22,307 |
36% |
||
|
|
Per capita (l/inhabit/year) |
106 |
136 |
28% |
|
|
PRODUCTION |
14,484 |
20,087 |
29% |
||
|
|
Formal |
9,609 |
11,345 |
16% |
|
|
|
|
Pasteurized |
4,030 |
2,745 |
-27% |
|
|
|
Long Life |
184 |
3,100 |
895% |
|
|
|
Dairy |
5,395 |
5,500 |
9% |
|
|
Informal |
4,875 |
8,742 |
52% |
|
|
IMPORTS |
909 |
2.220 |
146% |
||
|
|
Long Life/Fluid |
4% |
53% |
|
|
|
|
Imports/Formal Market |
9% |
16% |
|
|
|
Size Informal Market |
34% |
44% |
|
||
Source: Jank & Galan (2000)
The declining evolution of long-life milk prices - among other advantages to consumers - explain the fast growth of its market share along with the decrease in the consumption of Grade C pasteurized milk. Barros et al (2000) detected a downward trend in real prices of milk (deflated by the IGP-DI index), especially after the stabilization of Brazilian economy in mid 1994. According to Jank & Galan (2000), the imports of dairy products in Mercosur's countries at highly competitive prices impose a ceiling on prices in the domestic market.
The market for Grade A and B milk has changed little. Grade C milk (whose prices have not changed since mid-1994) is the one that has effectively lost its share to UHT milk. The market share of the latter, which used to be of about 5% in the early 90’s, went up to over 50% in 1998.
Macroeconomic policies are known to influence trade performance. For instance, a study of the poultry export supply function for the Brazilian economy, applied to the 1990s, indicated that variables such as the real exchange rates, domestic and international prices, and national income, had an expressive impact upon poultry meat exports (Barros, Bacchi and Burnquist, 2001). The increase in international prices was interpreted as an indication of an excess demand in the international market, such that Brazilian export share growth would be stimulated whenever prices increased. By the other side, an increase in domestic prices and income presented a negative effect upon poultry meat exports, given the relative importance of domestic absorption for this product.
The economic stability was identified as a very positive aspect for the poultry complex. It was also considered to be responsible for the industry integration and consolidation that allowed the Brazilian poultry industry to produce at declining real prices, including a wide range of new products that started to be produced to meet changing consumer habits (FAS; USDA, Report nº BR7626; 1997).
Besides factors related to macro policies, commercial policies, particularly those related to tariffs, have played an important role in determining the performance of the meat and milk international markets. As trade is progressively adjusted to WTO/GATT rules, the importance of non-tariff barriers (quality, sanitary aspects, ecology, and technical rules) has also increased. Dairy products lead the ranking of the most protected agricultural products by the OECD countries.
A US policy that has presented important negative effects for Brazilian poultry export has been its strong export subsidy system, given that the countries compete in the international market. An import tariff system also exists, but the United States imports only very small quantities of poultry from any source. Disease restrictions and meat inspection standards limit potential suppliers to only a few countries (WAOB, 1998). The EU also provides high subsidies to poultry meat producers, which has negative effects for Brazilian exports' access to several markets.
During the nineties, import licenses restricting trade were abolished and with Mercosur’s implementation tariffs are practically non existent for Mercosur partners’ agricultural exports, A relatively low Mercosur Common External Tariff (CET) is applied to imports from outside the region (WAOB, 1998).
Another relevant factor is that Brazil eliminated, by 1996, the incidence of the Imposto sobre Circulação de Mercadorias (ICMS), an excise state tax upon exports of primary and semi-manufactured goods, including agricultural products.
Disputes with other commercial partners, like Canada and Argentina, can be considered restrictions to Brazilian poultry sector exports as well.
Hong Kong has a free market for pork and re-exports a large quantity, mainly to China. Brazil has exported to this market. Currently, official imports by China are restricted by an import tariff of 20%, a value-added tax of 17% and subject to rigid licensing procedures. Imports are limited to hotels, restaurants and other institutions. Other Southeast Asia countries also have high tariffs and other trade barriers to limit pork imports.
Besides the subsidy scheme, including exports subsidies, EU has recently signed a zero-to-zero agreement with some Central and East European countries that is expected to limit even more the Brazilian participation in these markets.
For years, several major developed countries have subsidized domestic milk production, building up large surpluses as stocks. These stocks have been dumped into the international market at prices significantly below production costs, creating a serious policy dilemma for countries like Brazil, which have natural resources and labor to produce milk at low cost. Lopes (1995) surveyed the literature and identified that price distortions of dairy products are around 55 per cent. The same type of distortions for beef was close to 10 per cent.
Brazilian producers would certainly appreciate measures designed to restrict imports. The imposition of higher import tariffs and minimum import price (case of Uruguay) applied to dairy products were a result of the final report of the official dumping investigation against Argentina, Australia, New Zealand, and the European Union (USDA; Oct 2001), the majors suppliers of these products to Brazil (Table 3.1).
Table 3.1 - Results of dumping investigation of powdered milk exported to Brazil
|
Country |
Companies |
Applied Rates (%) |
|
New Zealand |
New Zealand Dairy Board |
3.9 |
|
All other companies |
3.9 |
|
|
Uruguay |
All companies (see note below) |
16.9 |
|
European Union |
All Companies, except Arla Foods Ingredients Amba |
14.8 |
|
Cerealin S.A. |
16.9 |
Note: Argentina, and later Uruguay, negotiated with Brazilian officials a minimum export price for powdered milk exported to Brazil. Arla Foods Ingredients Amba from Denmark also negotiated a minimum export price. The minimum price was established at US$1,900 per metric ton, FOB, and was calculated using USDA's price list.
The poultry agreement between the Brazilian Ministry of Agriculture and Food Supply (MAA) and the Canadian Government had not been implemented by August 2001, as was expected. Brazil lost a WTO dispute with Canada on airplane sales over the respective export financing programs of each country. The two countries are still negotiating the concession terms that Brazil will have to make to Canada. Trade sources indicate that Canada will hold the implementation of the poultry agreement until the other case is settled.
As of August 2000, Brazilian poultry exporters had not reached an agreement with Argentine poultry producers regarding the minimum price system for imported Brazilian broilers, established on July 2000, as part of Resolution Number 574/2000 issued by the Argentine Ministry of the Economy. Brazilian exporters are seeking an option outside of the WTO to resolve the issue. According to trade sources, there is a possibility that the two countries will agree on a negotiated minimum price to avoid a WTO dispute.
In addition to this private negotiation, the Brazilian government decided to investigate the case filed by the Argentine producers, which resulted in the current minimum price applied to Brazilian broilers. According to trade sources, if no mutual agreement is reached between Brazilian exporters and Argentine producers, the Brazilian government may file a complaint to the WTO, and could call for revisions of the Mercosur agricultural agreement.
Swine production is an activity that is protected by trade policies in most of the countries (Fabiosa; 2001). The various policy regimes are affected by each country’s commitment with the WTO and by the context of regional trade agreements (RTA).
Japan shows up as one of the most protected markets in the world. In that country, domestic prices of swine meat are maintained within a band. According to the price mechanism, if imported meat CIF price is lower than the border price, a tax is added to the CIF price until this level is reached. If the domestic swine meat price is below the price of imports, the meat bought abroad is subject only to ordinary custom taxes, of about 4.3%. In addition, under a simple provision negotiated by Japan at the Uruguay Round Agricultural Agreement (URAA), whenever imports volume exceeds in 119% the average volume imported in the last three years (calculated according to a cumulative quarterly basis), import prices can be upgraded to a 24% higher value until the end of the year. As mentioned before, Brazilian exports are not allowed in this market due to sanitary restrictions.
Under the URAA Article 5 about agriculture, Japan can impose a special safeguard measure in the form of a higher tariff when certain prices or volumes are reached. This safeguard measure for pork meat was activated by Japan in August 2001, and had been already used in 1997, increasing the price of imports entering the country from 532 yens per kg to 653 yens.
Under this same agreement - URAA - Korea established an import quota for frozen pork meat, which has been gradually increasing since 1995. The tariff for frozen meat reached 29.8% in 2000 and will be reduced to 25% in 2004.
The import tax levels have limited the access of pork imports to the highly populated regions of Southeastern Asia. Although Philippines has liberated its imports of pork through a tariff quota system of minimum initial access of 32300 tons per year, starting at 1995 and reaching 54000 tons per year in 2004, a tariff of about 49% for the volume allowed under the quota is still holding force, while the tariff for volumes that exceed the quota are of 60%.
For Thailand, the import tariff prevailing by 2000 was of 49%, although the country has committed to reduce it to a 40% level by 2004 for carcass, half carcass and ham (with bones), and to 30% for other products. An additional tax of 5 bath per kg plus 7% is added to processed meat.
In Indonesia, the population is predominantly muslin (87%) such that pork meat consumption is low in that country. A special import license is required to import swine, and all its products must be tagged indicating its content. The import tax registered in the country was of 59% by 2000, and should fall to 50% by 2004.
According to Fabiosa (2001), pork trade is not subject to any tax between Mercosur member countries. Imports from non-member countries are subject to a 35% tax by Argentina and a 55% tax imposed by Brazil.
European Union administers a price support mechanism that is implemented through subsidies. The current basic price is of 150 euros per kg of equivalent carcass. Since domestic prices have been higher than world prices through this subsidy scheme, EU has been effectively subsidizing exports of pork. Under the URAA, the maximum quantity that can be subsidized by the countries in that bloc is 444 million tons. There is also a TRQ for 76 million tones of imports, with a specific tax of 536 euros per ton. The EU has recently signed a zero-to-zero agreement with some Central and East European countries that is expected to limit even more the Brazilian participation in these markets, since these countries have a well developed agriculture.
Russia Federation taxes pork meat imports by 15%, with the additional restriction that this value cannot be lower than a 0.20 to 0.25 euros per kg. A similar tax structure has been used by Ukraine with a 30% tariff, which must never assume values lower than 0.50 euro per kg.
Brazilian raw poultry meat and products cannot be exported to the United States. This country has restricted the entry of poultry products, not only from Brazil, but also from most Western Hemisphere countries, based on the argument of the incidence of Newcastle disease in all countries expect Canada, Costa Rica, and Chile. Imports from Costa Rica and Chile were prohibited because their meat inspection systems have not been considered "equivalent" to the U.S. System (WAOB, 1998). The equivalence requirement has been restrictive for the exports because other systems are hardly recognized as equivalent in terms of their results. Besides that, the argument of differences in procedures can be used as a trade barrier. SPS Agreement has pointed some rules about this issue, but in fact equivalence is a complex question.
Brazilian exports of non-processed poultry meat have also been prohibited at the EU and Russia, for sanitary reasons (Newcastle). The EU also provides high subsidies to poultry meat producers, which has negative effects for Brazilian exports' access to several markets.
Various important markets have presented strict restrictions for pork imports. In the EU, for example, pork exports are prohibited when the product is non-processed, non-cooked or non-cured, and valid for no more than six months. Japan applies these same rules based on the argument that these are necessary to prevent contamination by nicarbazine (Pinazza, 1997). The United States have not allowed Brazilian pork imports under the alleged sanitary reasons, similarly to Japan. Various South American countries have prohibited imports from sources that have not eradicated diseases such as the "Síndrome Respiratória e Reprodutiva Suína" (PRRS), "Gastroenterite Transmissível" (TGE) e "Vírus da Pseudo-raiva" (PRV). Australia’s pork imports from various countries, including US, are prohibited, due to the risk of transmission of PRG, PRRS, TEG and "triquinas".
In the poultry case, in the 70’s, industry grew on average 12% p.a. The main investments took place in the South, a great corn and soy producer area. With the recession of the Brazilian market in the early 80’s, companies tried to gain market share abroad. It was a period in which the national product gained importance in the international scenario, even if national production remained the same. The expansion of exports can be identified as an important factor driving the Brazilian poultry meat production during the 90’s.
Brazil became an important competitor with the United States in the European and the Asian markets. When the domestic currency was devalued in January 1999, Brazilian exports to Asia and Europe increased. Argentina imposed obstacles (non-tariff barriers) to Brazilian broiler exports. The reduction in broiler exports to Russia in the same year was related to the lack of export credit and an increasing competition with the United States.
The decreasing prices during 90’s reflected an oversupply of poultry in the international market, in part due also to the new Brazilian exporters entering the international market.
Recently, the Brazilian poultry production expanded in the Center-West region. Among the reasons, the indirect tax exemption support and good local infrastructure can be pointed out.
Newer constructions have been characterized by larger scale of operation. Today, the standard building houses can take 24 thousand chickens, with automatic feeder and controls for temperature, humidity and light. It seems that this sector shows significant economies of scale/size.
The expansion and consolidation of the poultry complex can be mainly explained by the diffusion of advanced technology in genetics, nutrition, handling, sanitation, and equipment, which transformed poultry production into a very developed industrial activity. The good development of chicken production comes from constant falls in input prices and/or gains in efficiency in the productive chain.
Extraordinary results were obtained in feed conversion, which has been one of the main indicators of efficiency in the poultry productive chain. The traditional areas of production should resent the effects of the expansion in the Midwest of the country in the next few years. This means that the expansion in poultry production follows its main nutrition inputs: soybean and corn.
Industrial equipments for better use of carcasses have had great development in the analyzed period. In the past, the price of poultry cuts was a lot higher. However, changes in the boning technology for the back and other parts that do not have market value facilitated the use of the meat of these other cuts, which are used in the manufacture of frankfurters, ham and other high value-added products. The consumer could have access to this better use of the carcass through new products and price reduction and the response was an expansion in the consumption of chicken cuts.
A considerable part of the revenues of the companies depends on the variety of products and by-products of the internal market. The technological evolution process in industry gave the sector the opportunity to improve the production of by-products. The best example is the use of ribs, neck and other small cuts in the manufacturing of cold cuts and sausages. This happened mainly in the second half of the 90’s.
Chicken consumption is a consolidated habit in Brazil. With significant price falls compared to beef and pork, the Brazilian consumer has slowly been changing his/her source of animal proteins and forming a new consumption habit pattern.
Another change that has been observed concerns the form of consumption. In the 1960s, whole chicken consumption represented 80% of the total consumption. After 20 years, this share fell to 20%, whereas cuts consumption rose to 57% and industrialized chicken, to 24%.
Supermarkets have the highest share in the final supply of poultry in Brazil, with an increasing share over the last two years. This affects the commercial relations between the industry and producers, since the companies are subject to more difficult negotiations with retailers. Competition became fiercer in the last years due to economic stabilization.
The increasing productivity in pork sector can be attributed to the adoption of new technologies by producers, mainly in mid-western and southeastern areas of the country. These producers adopt the independent production systems with modern technology.
The mortality rate at all levels of pork sector dropped about 6 percentile points. The breeding activities have developed very satisfactorily. The incorporation of nutrition and handling techniques were fundamental to obtain those results.
However, between 1990 and 2000, the per capita consumption increased slower than that of other meats. In that period, pork consumption went up by 42%, while the consumption of beef increased about 50%, and of chicken, about 65%. Empirical estimates indicate that beef and poultry consumptions have higher income elasticities of demand than pork. Despite the strong currency devaluation in 1999, pork exports did not grow significantly because they were highly concentrated in two markets - Hong Kong and Argentina, this one already struggling with an evolving economic recession.
The factors that have been shaping the Brazilian economy have impacted the dairy market in a mixed form. On the one hand, production has increased, mostly as a result of gains in productivity, and, on the other hand, imports have behaved quite closely to the exchange rate evolution. It should be mentioned that the energy crisis reduced demand for many frozen dairy products during 2001.
In the mid-1990s, a drastic change took place in the dairy industry and brought on a dramatic impact on the milk system. At this time, the leading companies forced the adoption of a new system for the collection and transportation of raw milk, including milk refrigeration at farm level (Jank, 2000).
The adoption of the bulk collection system helped the reduction of milk transport and cooling costs as well as contributed to the improvement in the quality of raw material. The great cost reduction promoted by bulk collection forced producers to adopt this new system and stimulated them to purchase milk coolers. Table 4.1 shows some data in the impacts of the bulk collection system in a producers' cooperative (SUDCOOP).
Table 4.1 - Impact of bulk milk collection at SUDCOOP.
|
DESCRIPTION |
BEFORE (DEC/92) |
AFTER (JUN/97) |
DIFFERENCE |
|
Monthly milk delivery (1000 l) |
8,691 |
9,362 |
8% |
|
Number of producers |
7,396 |
3,941 |
- 47% |
|
Average production (l/day) |
38 |
79 |
109% |
|
Milk lines |
135 |
71 |
-47% |
|
Cooling stations |
9 |
5 |
-44% |
|
Trucks |
142 |
50 |
-65% |
|
People for transportation |
203 |
78 |
-62% |
|
Volume per truck (l) |
1,974 |
6,241 |
216% |
|
Annual freight expenses (R$ thousand) |
1,645 |
910 |
-45% |
Source: Barros et al (2000)
Although fluid milk consumption declined in 2001 because of a faltering economy, the Brazilian government has assured that measures would be taken to increase the quality of fluid milk. These included the provision of domestic production incentives, and enhancing export market opportunities especially for powdered milk. The dairy fund ("Pro-Leite") is valued at R$200 million and has been more intensively used by producers in the Center-West to raise productivity. In addition, large Brazilian dairy industries also finance their suppliers under contract. This has been evolving recently with the process of bulk distribution of milk. The state government in Sao Paulo, for example, created programs and established cheaper financing lines to help farmer migrate to distribution systems in bulk, improving milk quality and reducing costs due to adoption of more suitable logistic systems.
Another technological change - the appearance of the UHT milk - has also brought important impacts on the sector. According to Barros et al (2000), the organization and relative importance of the production areas were affected by the increase of UHT milk consumption. Goiás and São José do Rio Preto (SP) appeared to be efficient enough to grow under decreasing prices as their production was directed to UHT production.
On the other hand, more traditional areas, represented mainly by the Paraiba Valley (SP) and the southern area of Minas Gerais, tended to go through restructuring. These areas are sources of raw material for Grade C pasteurized milk, which had its market restricted by the industrial strategy of supply control and margin maintenance. The evolution of these traditional high prices areas will depend on the behavior of pasteurized milk consumption.
In the last few years, Brazil’s market attentions have been concentrated also in the import trends of powdered milk that resulted from market liberalization and the Mercosur’s formation. Since the mid 90’s until 1999, dairy imports were seem as a means to assure domestic supply at its required level, even though the subject was strongly controversial. Once dairy imports got to be more controlled by the recent measures implemented after dumping investigation, sector representatives start to search possibilities to turn Brazil into a net exporter.
In the 90’s, another change in dairy sector refers to some national companies participation in merging processes as a way of increasing production scale, and some have been purchased by multinationals. It caused a significant change in the industrial concentration of the sector and the internationalization of the milk industry.
Policy changes have had substantial social effects. The rural financial changes of the 80’s and 90’s, for instance, had significant social impacts in Brazil as official credit reduction affected mainly the smaller farmers because the larger ones were able to obtain funds from other sources like product buyers and input suppliers’ credit. Technological changes appeared to have had similar effects. In the milk sector, for example, new technology of milk collection plus the quality payment system clearly led to enhanced competitivity, but it also implied in drastic reduction in the number of producers, particularly the small ones, for whom the adoption of new technology became unfeasible.
It is understood that the agricultural sector had its profitability forced down because of Real Plan effects, as prices decreased in real terms during the second half of 90´s. It is a clear that farmers have been facing a rather unfavorable trend by any angle their terms of trade are constructed.
On the consumer side, the agribusiness sector has importantly contributed to a better income distribution in the 90’s. Contrary to historical trends, agribusiness prices cannot be said to have been an important factor to increase the cost of living in Brazil after the Real Plan. It is well known that food prices increased much less than the general consumer prices after the Real Plan. The Brazilian consumption of meat and eggs increased over the decade.
On the health side, it is worth mentioning the role played by the move in direction of a more open economy. It is accepted that this move led to more efficient sanitary control and inspection. In the case of Foot and Mouth Disease, for instance, the regional controlling process was very important. Brazil also obtained the status of country free from swine fever. One cannot forget, however, that, in many cases, sanitary conditions have been used as nontariff barriers.
Health concerns has been one of the stimulus to change dairy sector quality requirements. The National Program for the Improvement in Milk Quality (PNQL) reviewed the procedures adopted from the farm level to retailing. After a complete public survey coordinated by the Ministry of Agriculture, the new legislation will come to force in July, 2002, instituting sanitary procedures for milk production and cooling in the farms, bulk transportation to the mills, sanitary procedures in processing and distribution. It also institutes the creation of the Milk Network - a network of laboratories aiming at the support and control of quality maintenance at all stages of the production chain. The legislation is detailed in its demands as to installations and equipment and in procedures used in processing and bottling plants, including environmental control regulations.
The Brazilian sanitary control system is structured to meet the needs of market segments. The product to be directed to the local city is inspected by municipal authorities. The product that is directed to the state market goes under state inspection, and the product that is aimed at the national and international markets is controlled by the federal government.
That division is to adapt the industry to well defined sanitary standards, as producers know that clear differences exist among the different inspection levels.
The municipal inspection tries to meet local specifications, considering the local standards of consumption and the trade-specific terms, that is, the product follows the minimum standards required by the country’s health system, which is adapted to the area. The poultry and swine inspected and authorized by the municipal system cannot be sent to other cities without going through state inspection first. The work is performed by the municipal department of health.
The state system registers a product for commercialization within the state. The inspection is done by the state department of agriculture. The regulations of that level of inspection offer the producer the chance of commercialization of the product within standards that accepted by all the municipal districts of the state, but do not necessarily follow the standards of another states or even that of exportation.
The federal inspection, by the ministry of the agriculture through the Service of Federal Inspection, is the highest sanitary control department in Brazil. A product, after receiving the control of the federal inspection service, can be marketed in the whole national territory or, yet, be exported.
The inspection of the product is made in slaughterhouses, where technicians from the in-charge department follow the slaughtering process. If any sanitary problem is found, the carcasses are interdicted and taken to analysis in institutes registered by the ministry. When the problems are confirmed, the products are incinerated if they have a contagious disease, or taken to factories that use them in the production of animal food, fertilizers or other products.
Producers, regardless the production scale, are subject to the same sanitary inspection regulations and are penalized with the loss of the products. For this reason, within any production area, there is a concern regarding the quality of the product. The market concern of producers is very intense as products approved by Federal Inspection Service are better marketed in the internal and foreign markets.
Over the last years, with the growth of large companies, such as Sadia, Perdigão and Ceval, among others, the inspection process of the products became very respected, because the brand name of these companies’ products became a strong patrimony.
Regarding the environmental aspects, it is important to stress the role of using the chicken bedding as a source of income, either as manure or animal feed.
There is also an alternative of using swine waste to other economic activities what is getting more important as environmental concerns about dropping these effluents on the rivers increase. Although the daily volume of dejection (Table 5.1) produced annually has not evolved significantly, the concern of the researchers, producers and local community regarding in the destination of the dejection has been increasing.
Table 5.1 - Estimates of swine dejections in ton/day for category in Brazil.
| |
1992 |
1995 |
2000 |
||||||
|
Manure |
Manure |
Liquid |
Manure |
Manure |
Liquid |
Manure |
Manure |
Liquid |
|
|
Female |
19,42 |
56,30 |
83,48 |
19,55 |
56,70 |
84,07 |
14,59 |
42,31 |
62,74 |
|
Little pig |
35,02 |
77,31 |
111,01 |
37,48 |
82,75 |
118,81 |
37,29 |
82,32 |
118,21 |
|
Male |
1,05 |
2,09 |
3,14 |
1,04 |
2,08 |
3,11 |
0,74 |
1,49 |
2,23 |
|
Total |
55,48 |
135,71 |
197,64 |
58,07 |
141,52 |
205,99 |
52,63 |
126,12 |
183,18 |
Source: CEPEA
Anyway, the swine production is an activity that generates great amounts of manure, what can constitute a serious environmental problem if it is get to rivers without treatment. The undesirable consequences can also be extended to reduction of productivity and to workers’ health. Perdomo et al. (2001) show in its study that 50% of swine created in confined systems present health problems due to high concentration of gases. The 1997 Brazilian Environment Legislation demands environment licensing for installation of new production units.
Estimates of the amount of liquid dejections of the Brazilian chicken industries, between 1997 and 2001, are presented in the Figure 5.1.
Source: IBGE (2002) - Quarterly research of slaughter of Animals
Likewise, the milk sector is a potential effluent producer, which should be duly treated. This treatment must be inserted in the procedure of hygienic cleaning of the company, following the legal requirements.
It is by now that, after the Real Plan, the supermarkets’ strategy was to keep consumer prices down. Cost changes in the food chain had to be absorbed within the factors and raw material markets. That helped in controlling inflation; but at the same time created a lot of conflicts between farmers and industry and within the industry sector itself.
It is well known that these conflicts were harmful particularly to small milk producers both because of falling prices (related to subsidized imports) and the massive adoption for new technologies, some of which out of the reach of small farmers. The same comments apply, perhaps to a lesser degree, to poultry growers.
Marketing practices changed a lot in the nineties with reduction of spot market operations in favor of forward contracting as a means to reduce price (and market) uncertainty. Contracting became important particularly in the case involving the formal or informal CPR (Rural Product Certificate), which implies in advancing part of the sale proceeds related to future commodity delivery.
Other initiatives are directed to enhance exports. ABEF (Brazilian Poultry Exports Association) and APEX are investing in promoting Brazilian broiler sales abroad. The pork sector is also investing in the promotion of fresh meat consumption domestically. In conjunction with APEX, pork producers are also promoting consumption in Russia, Asia and Latin America. Classification of carcass is expected to become widespread at least in the Southern producing regions. The great challenge, however, is how to deal with the huge informal production.
The swine production system has been through a series of changes over the last 20 years. The farms in the South became more connected to integrating companies. The new production areas of the Midwest tended to be more independent. The integrating companies from the south of Brazil have practically taken over all responsibility in the basic input supply. Large integrating companies share the market with some genetics companies, the development of breeds (Agroceres), importing pure animals from Canada, Denmark and France. The integrating companies provide the animals to their integrates. Independent producers buy animals from these producers in the market.
In the feed sector, great changes have happened in the commercialization of the mineral matrix. In the early 80’s, producers purchased the mineral nucleus and the protein base (soy meal). The main companies of the sector were Purina, Socil, Guabi and Anhanguera. That system changed considerably from the late 80’s on, when new companies started trading the nucleus and protein base independently. The companies that became market leaders were: Mkassab, Premix, Tortuga and Nutron.
The independent producers acquire the nucleus to mix with the protein source (soy meal) and the carbohydrate source (corn) in the farm. This happened with the objective of lowering the feed costs, since the ration represents about 65% of the costs of the finished swine.
Swine slaughter both in southern states and midwestern areas are done in specialized units. In the southeast and in the northeast of Brazil, it is common for cattle slaughterhouses to slaughter swine as well. The process takes place in specific units, especially in the south, where the finished products are sausages. The southern market in Brazil can, in certain moments, supply the southeastern area, São Paulo and Rio de Janeiro, when the differences of the prices of the carcass in those markets cover transportation costs or when animal supply is low.
The industries of the South in general possess registration in the Service of Federal Inspection, that is to say, they are authorized to export. Exporting companies have separated feed supply units for exporting farms since 1999. These units do not use input that can have any type of restriction in the external market. In the case, the highest restrictions are for animal by-products.
In 80’s, the poultry supply structure was reorganized with the help of abundant public credits. The 5 largest companies duplicated, then, their share in the national production (17% in 1980, 35% in 1985), also due to the strong incentive to export. In 1994, the 5 largest companies had their share slightly reduced (34%, against the 35% that they kept in 1993) and along the 90’s such share has been around 50%. The sector went through a restructuring, with the merging of some companies and even the sales of others.
The poultry producers control the productive system in a more intense way. The most typical farms have between 2000 and 150000 birds per cycle. The acquisition of input and technical support are controlled by the integrating companies.
Small companies, having only one slaughterhouse and aiming at regional markets, have the same integration system with the rural producer as a large company. The difference is in the fact that the small companies are purchasers of genetic technology from national companies, which reproduce the role of international companies (ROSS, Arboacres, etc). Large companies import directly and keep their own system.
In the general context, large companies do not concentrate a considerable share of the national production, accounting for about 25% of the total. Those companies have gone through merging process with large groups.
Large companies go through this concentration process seeking scale economies, especially concerning the external market and the production process of genetic material. Some examples of this kind of event are the sale of the Resende group, in Uberlândia/MG, to the Sadia group. The Resende held about 52% of the slaughter chicks market in Brazil, and at the same time, had small share in the internal market of poultry and, practically, no exports.
The Perdigão group went through a restructuring process in the 90’s. It was a family business in the west of Santa Catarina and the stock control was changed to securities funds, which through financial operation in the internal and foreign markets recovered the group’s investment capacity.
Ceval has also suffered changes in the stock control, going from family group to a group of managerial characteristics after being sold to Grupo Bunge. Avipal, in Rio Grande do Sul was also sol to a Chinese group.
These companies have aimed at poultry production, but they also work with swine culture, mainly in the sector of industrialized meats. Another common ground among those companies is the fact that they abandoned the soy and corn sectors, except for Ceval, whose group controller, Bunge, has still kept the grain sector. In the past, those companies maintained an active grains sector, with units in the south and in the Midwest. These units bought the grains and had soy-processing plants. The units were sold to traditional grains producers. Soy meal producers are relatively concentrated in the industrial segment. Six companies are the most important: Bunge, Cargill, ADM, ROB, Braswey and Caramuru. The five largest companies have over 50% of the processing capacity in the country and more than 70% of the capacity installed in operation (units are being disabled, leaving those with larger capacity).
The group of the small slaughterhouses is formed by private small firms and cooperatives. Their performance is regional, the producers and the companies maintain a commercial relationship that is very similar to the system adopted by the large companies. The largest growing company was Aurora, in Santa Catarina, with units in the Midwest.
Today the standard building houses 24 thousand chickens, with automatic feeder and controls for temperature, humidity and light. In this sense, it seems that this sector shows significant economies of scale/size. The trend in the future should be a processing industry integrated with a smaller number of larger farmers. Figure 8.1 presents the evolution of the estimated quantity of chicken in Brazil per stratum of flock size between 1985 and 1995/96. It is quite clear that most of the growth is observed in the larger farms. Indeed, the size of the chicken flock did not grow much in the strata of flocks of less than 10 thousand chickens. And, the flock even declined in the strata of flock size smaller than 5 thousand chickens. This is yet another indication that there is a significant economy of scale in this sector.
Figure 8.1 - Brazil: distribution of chicken flock by stratum of flock size, 1985 and 1995-1996.
Source: Censo Agropecuário 1985 and 1995 - 1996, Instituto Brasileiro de Geografia e Estatística (IBGE)
Source: Censo Agropecuário 1985, Instituto Brasileiro de Geografia e Estatística (IBGE)
Source: Censo Agropecuário 1995-1996, Instituto Brasileiro de Geografia e Estatística (IBGE)
The number of producers with over 200 heads increased in practically all main areas of the country between 1985 and 1995. In the states of Santa Catarina, the growth is higher than in other areas of Brazil. This shows the growth in scale of Brazilian producers. See figure 8.4.
Figure 8.4 - Herd Groups - Number of Animal per State
Source: Censo IBGE - 85/87 a 95/96
The first point worth noticing is the production growth in all the states. Indeed, the expansion of this activity seems to be spread in all the country and not only in certain region. The second point is that, in most states, most of the expansion observed in the stratum of the largest flock size. In special, this is quite clear in the states of São Paulo, Minas Gerais and in the 'other states'. On the other hand, it is interesting to notice that the stratum of flock size between 5 and 10 thousand chicken has grown significantly in the states of Paraná, Santa Catarina and Rio Grande do Sul.
The swine farm has little scale economy advantage. A study on farmers from São Paulo has demonstrated that farm with more than 1200 females could have advantage in terms of feed production and money cost. But they spend more with taxes, labor taxes and administrative costs. The farmers with 200 females spend less with tax because they supply the local market and spend less with employees because they use more the family job.
The growth in the number of large producers in the state of Santa Catarina is associated to the fact that in these areas large companies (SADIA, PERDIGÃO, etc.) created some agricultural units and the strategy of these companies were also to find larger integrates. All this was associated to the fact that in these areas many small producers preferred to leave the area.
There is not in Brazil a standardization of production systems, not even at regional level. In addition, commercial and traditional subsistence producers coexist, producing in areas that vary between 10 and 2,000 hectares, with widely ranging opportunities. Rio Grande do Sul is the state where productive systems vary the least, but different forms of feed, handling and breed are still found. That hinders the establishment of production scales and the comparison of competitiveness among the properties, because in general the properties are in phase of great transformations, with producers leaving the activity, while others increase the production, changing its productive systems.
The basic characteristics of most of the production systems are: the) producers’ low level of information; b) non-specialized production; and, c) low production and productivity. About 80% of the producers are responsible for 20% of the production (Gomes, 2001). In a comparison with different countries, we can notice the technological difference found by the average of the national producers, although this scenery is modifying quickly (Table 8.1).
Table 8.1 - Indices of dairy cattle in selected countries. 1997
|
Indices |
New Zealand |
USA |
EC |
Argentina |
Brazil |
|
Production (billion liters) |
11.0 |
70.3 |
120.5 |
8.8 |
18.7 |
|
Number of cows (million) |
3.3 |
9.3 |
21.6 |
2.4 |
17.0 |
|
Liters/cow/year (thousand) |
3.3 |
7.6 |
5.6 |
3.7 |
1.1 |
|
Liters/farm/day |
2,078 |
1,834 |
400 |
1,091 |
47 |
|
Producer Price (US$/liter) |
0.16 |
0.30 |
0.39 |
0.20 |
0.20 |
|
Income (US$/farm/month) |
10,115 |
16,738 |
4,747 |
6,546 |
282 |
Source: Jank & Galan (1998)
Table 8.2 portrays the transformations in course, with the increase of the importance of the great producers, although small production per farm is still prevailing. Data from Itambé Dairy Company reflect the Brazilian scenario, as this dairy producer collects milk in the states of Minas Gerais and Goiás accounting for 38.1% of the national production. It is the second largest milk collector and is structured in the cooperative form.
Less than 10% of the cooperated farmers produced over 500 liters/day in 1999, although they have been responsible for 47.1% of the captured volume; whereas 40.4% of the producers were responsible for less than 6% of the volume and they produced up to 50 liters/day. An analysis in the historical series, however, shows that the increase in the produced volume has been happening continually, mainly starting from 1995.
Table 8.2 - Share of the number of producers and of the daily produced amount per extracts of selected volumes. Itambé. 1991-1999.
|
Years |
Up to 50l/day |
Acima de 200 l/day |
Acima de 500 l/day |
|||
|
Number |
Production |
Number |
Production |
Number |
Production |
|
|
1991 |
60.2 |
19.6 |
7.0 |
34.9 |
1.1 |
10.8 |
|
1993 |
61.2 |
20.8 |
6.5 |
33.5 |
0.9 |
9.9 |
|
1995 |
55.5 |
15.4 |
9.8 |
44.3 |
2.0 |
17.6 |
|
1997 |
51.8 |
11.6 |
12.9 |
55.7 |
3.6 |
25.7 |
|
1999 |
40.4 |
5.7 |
22.5 |
71.6 |
9.1 |
36.6 |
Source: Rufino (2000)
Jank et al (1999) foresee some probable scenarios for the next 10 years concerning primary supply, the industry and the distribution for dairy sector. They are shown in table below.
|
|
Situation in 1998 |
10-year scenario |
|
Dairy cattle raising |
· Raw material: low quality,
high seasonality and no standardization (conniving of
legislation/control) |
· Strong severity towards
quality, sanitation and standardization |
|
Dairy Industry |
· Consolidation of acquisitions
and strategic alliances |
· High degree of
concentration |
|
Distribution |
· Increase in dairy consumption
after the Real plan |
· Increase in per capita
consumption |
For poultry sector, it can be stressed that although poultry consumption is a consolidated habit in Brazil, it is certainly not a saturated market. A third of the Brazilian population is estimated to be away from the meat market. This means that a substantial number of consumers can be incorporated to the poultry market due to an upturn of economic growth or to an improvement in the distribution of the domestic income. The industry is highly competitive, but the expanding market shows possibilities for the entrance and/or permanence of smaller competitors through product differentiation of specific niches or by geographical questions.
In addition, with the introduction of new technologies, these companies can increase their production, cut costs and improve productivity, what, along with freight costs, will allow them to meet local market preferences of regional consumers in a personalized manner. Another important matter is the "graduation effect" (an ascension movement from a lower class to a higher one, resulting in the adoption of more sophisticated consumption standards besides the effect coming from a higher disposable income), which can be more important than the income effect on poultry consumption in Brazil, coming from the income and labor increase and foreseen for the Brazilian economy in the next years.
In the future, the expansion of the poultry production will be mostly based on larger farms located closer to the regions that produce soybean and maize. The evolution of the estimated quantity of chicken in Brazil per stratum of flock size between 1985 and 1995/96 shows that most of the growth is observed in the larger farms and the size of the chicken flock did not grow much in the strata of flocks smaller than 10 thousand chickens.
Progress of technology and productivity gains in the pork sector had as one of the most evident consequences, a reduction in the number of farms, an increase in the average number of sows and reproducers, and a reduction in the overall flock size. It is expected that Brazil keep on the trend of improving its productivity levels.
BARROS, G.S.A.C. "A Transição na Política Agrícola Brasileira".In: AGUIAR, D.R.D. e PINHO, J.B. (ed.), O Agronegócio Brasileiro: Desafios e Perspectivas. Sociedade Brasileira de Economia e Sociologia Rural, Vol I, pp.:1-19,1998.
BARROS, G.S.C.; GALAN, V.B.; GUIMARÃES, V.A.; BACCHI, M.R.P. Estrutura e Organização do Sistema Agroindustrial do Leite no Brasil. Piracicaba, 2000.
BARROS, G.S.C.; BACCHI, M. R. P. & BURNQUIST, H.L.; Estimação de Equações de Oferta de Exportação de Produtos Agropecuários para o Brasil (1992/2000); IPEA; Janeiro; 2002.
FABIOSA, J. F. Liberalização do comércio e o mercado internacional de suínos. II Conferência Internacional Virtual sobre Qualidade de Carne Suína, 05 de novembro a 06 de dezembro de 2001. Via Internet. 19p.
FARINA, E.M.M.Q.; JANK, M.S. The impact of the deregulation on the milk agribusiness system in Brazil. São Paulo: Programa de Estudos dos Negócios do Sistema Agroindustrial. Fundação Instituto de Administração. Faculdade de Economia, Administração e Contabilidade. 1998
GASQUES, J.G., J.C.P.R. CONCEIÇÃO.1999. "Financiamento da Agricultura: Dificuldades para Mobilizar Recursos". IPEA. Brasília -DF.(monografia).
GASQUES, J.G., VILLA VERDE, C.M. 1991. Recursos para a Agricultura e a Orientação dos
Gastos Públicos. Texto para Discussão no.229. IPEA, Brasília.
GASQUES, J.G., VILLA VERDE, C.M. 1995. Prioridades e Orientação dos Gastos Públicos em Agricultura no Brasil. Texto para Discussão no. 365. IPEA, Brasília.
HELFAND, S.M.; REZENDE, G.C.. Mudanças na distribuição espacial da produção de grãos,aves e suínos no Brasil: o papel do Centro-Oeste. Planejamento e Políticas Públicas, n.19, Junho/1999. p. 219-273.
JANK, M.S.; FARINA, E.M.M.Q; GALAN, V.B. O agribusiness do leite no Brasil. Milkbizz: São Paulo, 1999. 108p.
JANK, M.S.; GALAN, V.B. Desafios do Sistema Agroindustrial do Leite no Brasil. Preços Agrícolas. Ano XIV, no 160, fev. 2000
MINISTÉRIO DA CIÊNCIA E TECNOLOGIA (MCT)/FINEP, PADCT (Programa de Apoio ao Desenvolvimento Científico e Tecnológico). Estudo da competitividade da indústria brasileira. Competitividade do Complexo Agroindustrial. Campinas, 1993. 63p.
NASCIMENTO, V. P.; SALLE, C.T.P.;MORAES, H.L.S; FALLAVENA, C. B.; CANAL, C. W.; SANTOS, L.R.; RODRIGUES, L.B; LEÃO, J.A.; PILLOTTO, F.; NEVES, N.; NASCIMENTO, L.P., Qualidade microbiológica e prevalência de Samonella no processo de tratamento de efluentes de abatedouro avícolas, In: Simpósio sobre resíduos da produção avícola, Concórdia-SC, p. 52 - 62, 2000:
PASTORE, A., M.C. PINOTTI. 1999. "Inflação e Estabilização: Algumas Lições da Experiência Brasileira". Revista Brasileira de Economia, 53 (jan/mar):3-40.
PERDOMO, C.C.; LIMA, G.J.M.M. de; NONES, K., Produção de suínos e Meio ambiente, In: 9o Seminário Nacional de desenvolvimento da suinocultura, Gramado-RS, p. 8 - 24, 2001
PINAZZA, L. A. O Brasil ante o agribusiness internacional. Agroanalysis, v. 17, n. 2, Maio/1997. p. 13-16
USDA, Economic Research Service. " The Future of Brazil’s Agricultural Sector". Agricultural Outlook, May 1998.
USDA, Foreign Agricultural Service. GAIN Reports. Poultry and Products; various issues.
USDA, Foreign Agricultural Service. GAIN Reports. Dairy and Products; various issues.
USDA, Foreign Agricultural Service. GAIN Reports. Livestock and Products; various issues.
USDA, WAOB. Free Trades in the Americas: INTERNATIONAL AGRICULTURE AND TRADE. November 10,1998. November 1998, WRS-98-1. Summary. released November 6, 1998. Summary and report text may be accessed electronically. For details call (202) 694-5050.
USDA, World Market & Trade - Dairy, Livestock and Poultry Division; 2001.
VILLA VERDE, C.M. 1997. Gastos Governamentais Voltados para a Melhoria da Produtividade e Competitividade da Agricultura. Texto para Discussão no. 531. IPEA, Brasília.
|
[132] CEPEA-Universidade de
São Paulo, Brazil [133] CEPEA-Universidade de São Paulo, Brazil [134] CEPEA-Universidade de São Paulo, Brazil [135] CEPEA-Universidade de São Paulo, Brazil [136] CEPEA-Universidade de São Paulo, Brazil [137] Banco Nacional de Desenvolvimento Economico e Social [138] EMBRAPA- Empresa Brasileira de Pesquisa Agropecuária |
![]()
![]()
![]()
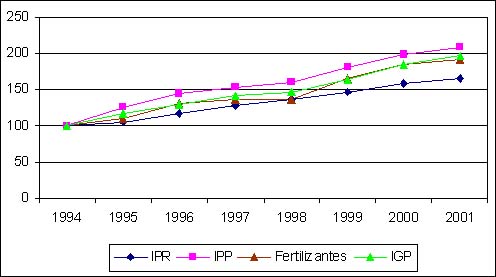
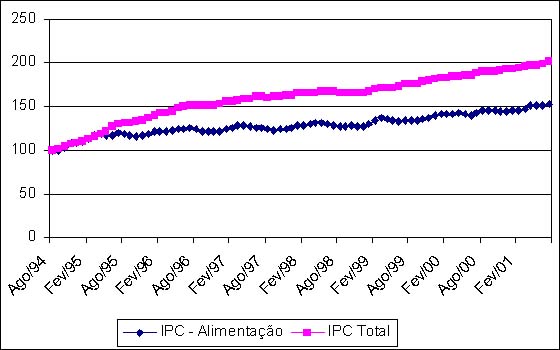
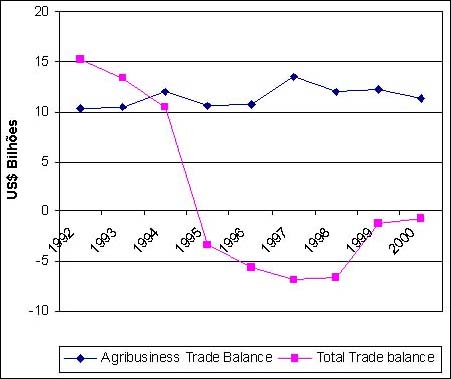
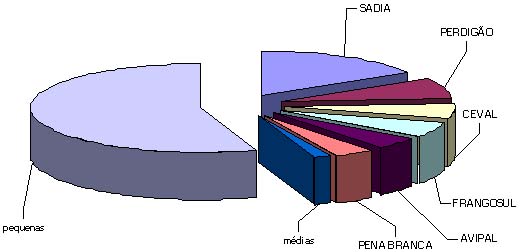
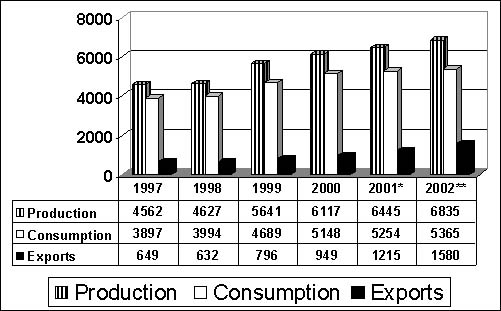
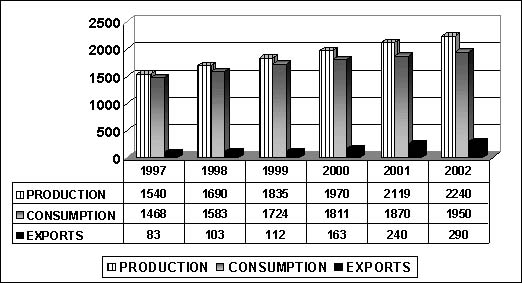
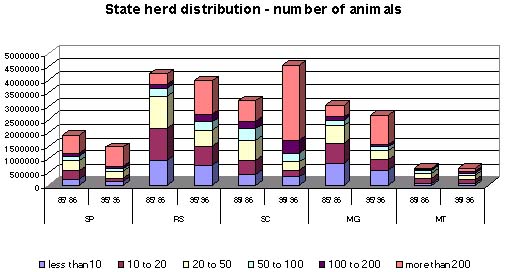
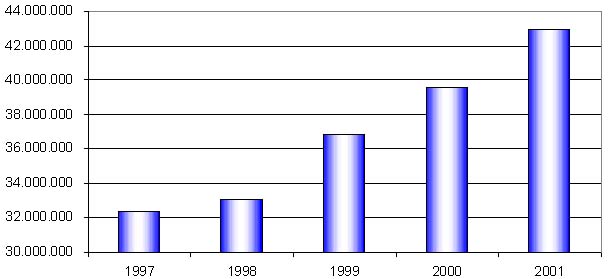
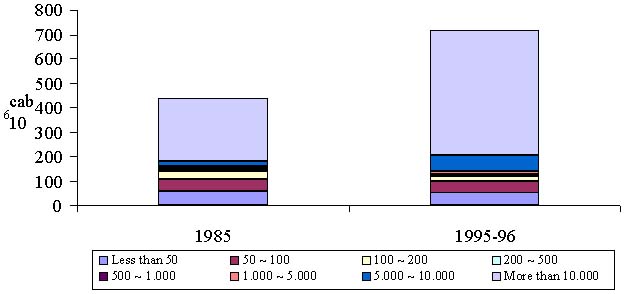
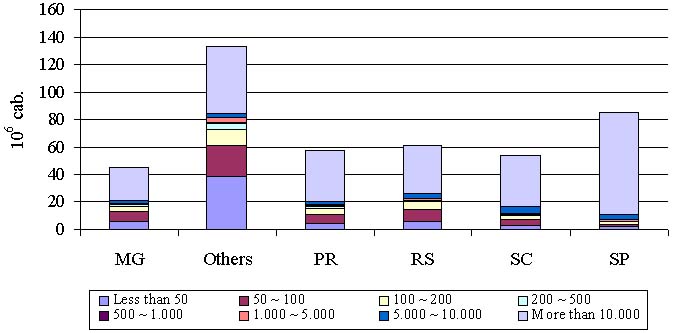
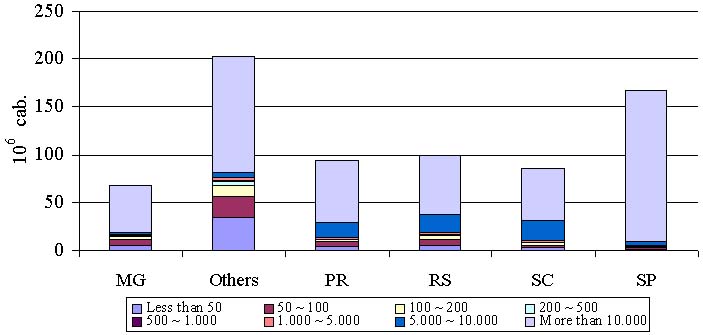
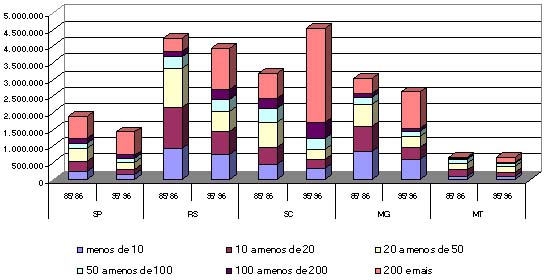