![]()
![]()
![]()
Christie P. Peacock
A three year study of sheep and goats production has been conducted on the Maasai group ranch at Elangata Wuas in Kenya, and at present 3 adjacent newly-formed ranches are being studied.
The number of breeding females per breeding male varies between 10 and 36. This ratio is lower for sheep than goats, and the highest ratios are found for the wealthiest animal owners, i. e. those who have the greatest numbers of animals. Most flock owners practice breeding control over their flock. If there is enough family labour males may be herded separately from the main flock. Alternatively an apron made of leather is attached to the males. This prevents mating with very young females or those suckling young. The annual distribution of rainfall is bimodal with the main rains from March to June, and the short rains in November and December. Flock owners try to arrange that the majority of births occur after the short rains, and so remove the aprons at the beginning of the dry season in June when the body condition of the females is at its best. When the animal owner observes a ewe standing to be mated he holds her, slips the ram's apron round and holds the female's fat tail to the side while mating takes place. Once copulation has finished, the owner holds the female's hind legs in the air to shake down the semen. There are some births of small ruminants all year round, but on one ranch as many as 64% of kid births occur in November indicating successful control over breeding. This appears to be a sensible system as there should be adequate fodder for the lactating dams and young lambs. However, if the short rains fail then the births take place in the middle of a very long dry season.
Reproductive performance. The mean parturition intervals observed were 306 days for goats and 312 days for sheep (Table 36). The season of parturition significantly affected subsequent the parturition interval, those dams which gave birth in the short dry season had the shortest intervals, and there were large differences between flocks.
Mortality. The causes of pre-weaning mortality and the factors affecting mortality are shown in Table 37. The major identified causes of death are disease for goats and predators for sheep. Animals born as twins have much higher death rates than those born as singles, and there is a seasonal effect on mortality with the highest death rates found for kids born in the long dry season. There is a very large difference between the mortality rates observed between the best and the worst flocks, and this shows the potential for improvement in productivity by management.
Growth. Mean weaning weights at 150 days were 10. 6 kg for goats and 1-4.1 kg for sheep. Season had a significant effect on weaning weight. Animals born in the short dry season (and thus reared in the long rains) had the best growth rates and were about 1. 2 kg heavier at weaning than kids and lambs born in the other seasons.
Productivity. The production index calculated as the weight of young at 5 months (in grams) per kilogram of breeding female per year depends on parturition interval, pre-weaning mortality, weaning weight and post-partum dam weight. Table 38 shows the effect of litter size, season of birth and flock on the productivity index. For goats, twin births give an advantage over singles, but the reverse is true for sheep. Season of birth has a large effect (with the lowest indices resulting from births in the long dry season) and there are large differences between flocks.
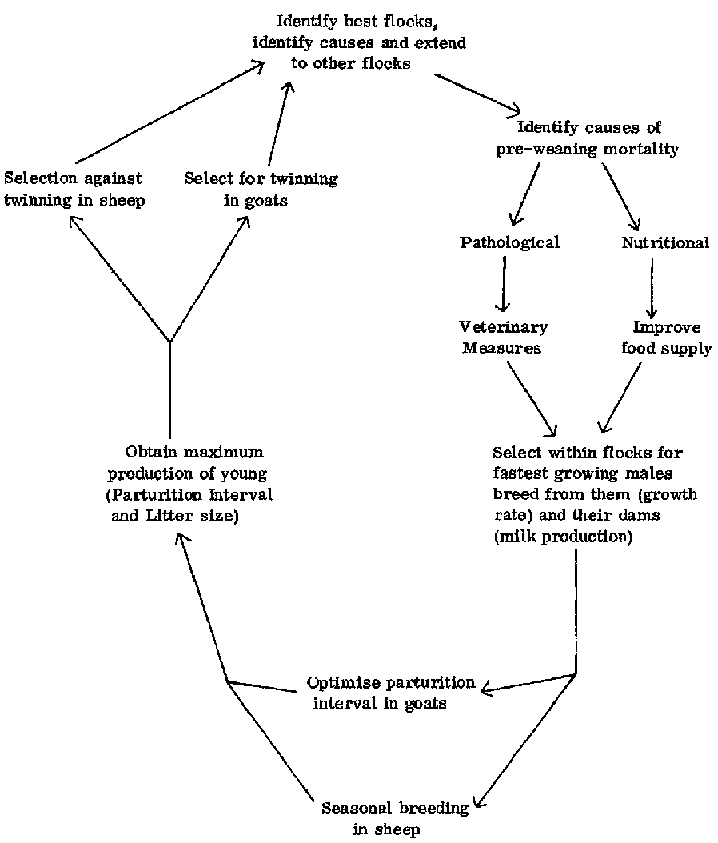
The approach to improvement in productivity is shown in Figure 3. The main steps are identification of the best flocks and finding out why they are the best, identifying what disease control measures could and should he taken, seeing if any nutritional improvements can be made, and by selecting for twinning in goats and against twinning in sheep.
Table 36. Mean parturition intervals (days) of goats and sheep in the Maasai pastoral system in Kenya, and the effect of season of parturition on parturition interval. Means with different postscripts differ significantly (p < 0. 05).
|
Goats |
Sheep | ||
|
Overall mean |
306 |
312 | |
|
Season of parturition |
|
| |
|
|
Short dry |
281 a |
286 c |
|
|
Long rains |
326 b |
304 cd |
|
|
Long dry |
291 a |
336 e |
|
|
Short rains |
326 b |
322 de |
Table 37. Causes of pre-weaning mortality (% deaths) and factors affecting pre-weaning death rates (%) of small ruminants in the Maasai pastoral system in Kenya.
|
|
Goats |
Sheep | |
|
Cause of death |
|
| |
|
|
Lost |
9.0 |
15.0 |
|
|
Disease |
31.0 |
17.0 |
|
|
Predator |
8.3 |
25.0 |
|
|
Drought / malnutrition |
6.9 |
2.0 |
|
|
Other |
44.8 |
41.0 |
|
Birth type |
|
| |
|
|
Single |
18.8 |
7.7 |
|
|
Twin |
25.8 |
31.4 |
|
Season of birth |
|
| |
|
|
Short dry |
23.8 |
17.2 |
|
|
Long rains |
14.6 |
13.9 |
|
|
Long dry |
31.4 |
22.4 |
|
|
Short rains |
19.3 |
22.6 |
|
Flock |
|
| |
|
|
Best |
12.4 |
12.2 |
|
|
Worst |
40.0 |
25.8 |
Table 38. Production indices of small ruminants in the Maasai pastoral system in Kenya (weight of young at 5 months (g)/unit weight of dam (kg)/year).
|
|
Goats |
Sheep | |
|
Birth type |
|
| |
|
|
Single |
397 |
489 |
|
|
Twin |
463 |
313 |
|
Season of birth |
|
| |
|
|
Short dry |
477 |
460 |
|
|
Long rains |
447 |
403 |
|
|
Long dry |
383 |
242 |
|
|
Short rains |
412 |
500 |
|
Flock |
|
| |
|
|
Best |
541 |
610 |
|
|
Worst |
345 |
270 |
Figure 3. Potential improvement pathways for sheep and goat flocks in Maasai group ranches.
![]()
![]()
![]()