Pierre Kleiber
Southwest Fisheries Science Center
National Marine Fisheries Service
P.O. Box 271
La Jolla, California 92038-0271 USA
ABSTRACT
The proposed development of an assessment model for yellowfin is described. It is anticipated that in addition to size (or age) structure the model will incorporate spatial structure. It will therefore deal with fish movement. The model should prove to be useful in addressing various questions of interaction between yellowfin fisheries in the western Pacific.
1. INTRODUCTION
Following a suggestion from the second meeting of the Western Pacific Yellowfin Tuna Research Group (WPYRG) in July, 1992, a small group of scientists has been working to develop an integrated yellowfin assessment model. A workshop was held in November, 1993 to formulate a design for such a model (Kleiber, 1994), and a proposal has subsequently been prepared seeking funds to implement the model (Anonymous, 1994). The objective of the proposed model is to address several questions posed by WPYRG and related to the status of the yellowfin population in the central and western Pacific and to the impact of the various fisheries engaged in harvesting yellowfin in that region. Some of those questions have to do with the degree to which yellowfin fisheries in the region affect each other by possible local or widespread depletion of yellowfin abundance -- in other words, fishery interaction. Two interactions of particular interest are the possible effect of the developing surface fisheries on the established longline fishery and the possibility that high seas commercial fisheries could cause local depletion that would affect small-scale coastal fisheries.
Given that the proposed model is still in early stages of development, this presentation is perforce speculative. The aim is simply to give a brief outline of the structure of the proposed model and then to point out how the model could be used to investigate fishery interaction.
2. THE MODEL
In conducting a stock assessment or a fishery interaction assessment, a significant aspect of yellowfin populations and their fisheries is that yellowfin grow during the part of their lifetime when they are exposed to fishing. As the fish grow, their vulnerability to different fishing fleets changes in different ways. It is necessary to take this variability into account by including size (or age) structure in the assessment model.
Another feature of yellowfin is that they move, sometimes over long distances. The pattern of their movement is not well understood, and its significance with respect to fishery interaction is unknown, but the potential exists for fisheries to interact when they are separated in space as well as when they are located in the same region. To evaluate that significance, the model needs to incorporate movement within and among the WPYRG statistical areas (Figure 1).
Figure 1. WPYRG study area and statistical subdivisions.
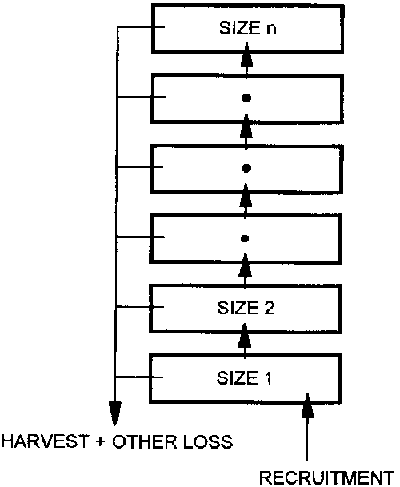
To deal with size (or age) structure, a state-of-the-art model has been developed and applied to south Pacific albacore tuna (Fournier and Sibert, 1993). That model, South Pacific Albacore Research Catch-at-Length Estimator, or SPARCLE, predicts catch by size class and time interval for a number of different fisheries. A simplified schematic picture of the model is given in Figure 2. Recruitment, which varies over time, feeds the smallest size class, and subsequent graduation to larger size classes is governed by von Bertalanffy growth parameters. Harvest is driven by a time series of effort for each of a number of fleets, each with a set of size-specific catchability parameters. Catchabilities are allowed to vary with time but with a smoothness constraint, that is, catchability is not allowed to change too abruptly from one time interval to the next. Natural death is determined by a mortality parameter.
Figure 2. SPARCLE model with arrows showing recruitment to the smallest size class, growth from one size class to the next, and harvest plus other losses, such as natural mortality and emigration.

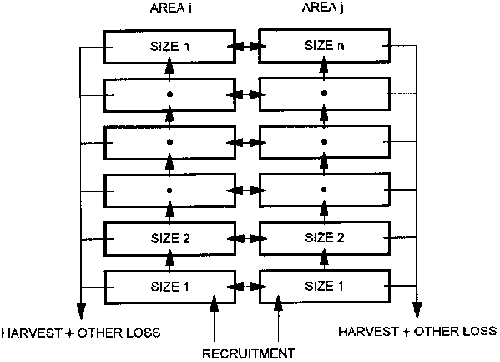
A missing feature of SPARCLE is that it does not have spatial structure and therefore does not deal with fish movement. Spatial structure can be incorporated implicitly by assigning vessels operating in different areas to different fleets. To handle fish movement explicitly, a new model, RASCLE (Regionalised, Age Structured, Catch-at-Length Estimator), is envisioned consisting of a system of multiple SPARCLEs, running in parallel (Figure 3) with one SPARCLE in each portion of some configuration of geographic subdivisions. Fish would then be moved from one area to another according to size-specific, area-specific, and possibly season-specific transfer coefficients. In the first instance, the geographic configuration might be the WPYRG statistical areas, but other configurations and spatial resolutions might used.
3. ESTIMATING PARAMETER VALUES
SPARCLE can estimate parameters for some or all of its processes of recruitment, growth, harvest and death, depending on the availability of catch and effort data to which it can be fitted. Fitting the model to data involves iterative adjustment of the model parameters to optimize the match between model predictions and observed data. The data must have sufficient detail and contrast that the individual effects of the various parameters are manifest in the fitting procedure. If the data are not able to support the estimates, that fact will be evidenced by lack of convergence in the fitting procedure or by wide confidence regions for parameter estimates.
Figure 3. RASCLE model composed of multiple SPARCLEs connected by arrows depicting movement.

To estimate its parameter values, RASCLE will be fit to data in similar fashion to SPARCLE. The data will include catch and effort statistics as collected by WPYRG, that is, catch-at-size and effort by gear, time and WPYRG area. Other data at different degrees of resolution in time and space may be used where available.
A difficulty anticipated in fitting RASCLE to data is the multiplicity of parameters, with transfer coefficients added to the already parameter-rich SPARCLE. A tactic for addressing this difficulty is to experiment with various constraints on the parameters which could reduce the dimensions of the parameter space. For example, smoothness constraints could be put on the relationship of movement parameters with size or with season. Another tactic is to include other types of data. Tag displacement data from the tagging program recently conducted by the South Pacific Commission probably constitute the most powerful source of information for estimating values for the transfer coefficients. RASCLE may be adapted to utilize these data as well as catch data, or a separate movement model may be utilized to estimate transfer coefficients from tag data.
The variety of interaction questions introduces a complication in that the questions deal with various geographic scales. The surface versus longline question is on a large scale for which the broad WPYRG areas might be appropriate. However, the local depletion question will probably involve movement on a finer geographic scale. Therefore, it may be necessary to implement RASCLE or something like RASCLE, at finer degrees of spatial resolution than the WPYRG areas. In doing so, attention must be paid to the fact that movement parameters, such as transfer coefficients, cannot simply be scaled down from one spatial scale to another and also the fact that at smaller scales, local effects, such as the influence of islands and FADs may come into play.
4. FISHERY INTERACTION
After the difficult task of obtaining a reasonable set of parameter estimates either from exogenous sources or from fitting the model to data, the relatively easy task of investigating fishery interaction can begin. At this point the model will be run in a simulation mode rather than a data fitting mode. It will simply make predictions of catch by gear, time and area from a given set of parameter values and a given pattern of effort deployment by gear, time and area. For the interaction investigation, it is not necessary for the model to duplicate a precise history of catch in the yellowfin fisheries. It is sufficient for the model to make plausible predictions of catch based on a nominal (or base case) pattern of effort by gear, season and area. The nominal effort pattern should be a typical, or average, deployment of fleets, not necessarily an actual, historical pattern.
The strengths of various interactions can be judged by re-running the model with the effort of one of the fleets altered from the nominal pattern. The predicted catch for each fleet under the altered effort pattern is then compared with the nominal results. Thus if one fleet increases its catch, the cost to other fleets in terms of diminished catch is predicted. Alternatively, if one fleet diminishes its catch, the benefit to the other fleets can be weighed against the sacrifice of the one fleet.
5. CONCLUSION
The model development described here is aimed at a variety of fishery assessment questions among which are questions of fishery interaction. The difficult part of the exercise is in implementing the model, not in assessing interaction once the model is in hand. Several obstacles lie ahead of which dealing with age-specific movement behaviour at various spatial scales probably constitutes the biggest challenge.
6. REFERENCES CITED
Anonymous. 1994. Project proposal. Stock and fishery dynamics of yellowfin tuna, Thunnus albacares, in the western and central Pacific Ocean: Development of an integrated model incorporating size and spatial structure. Fourth meeting of the Western Pacific Yellowfin Tuna Research Group, 9-11 August 1994, Palau. Working Paper 14.
Fournier, D.A., and J.R. Sibert. 1993. SPARCLE: South Pacific albacore research catch-at-length estimator. Fifth South Pacific Albacore Research Workshop, 29 March - 1 April 1993, Papeete, French Polynesia. Working Paper 12.
Kleiber, P. 1994. Report of WPYRG yellowfin assessment model development workshop, 8-12 November 1993, Honolulu, Hawaii. Fourth meeting of the Western Pacific Yellowfin Tuna Research Group, 9-11 August 1994, Palau. Working Paper 3.