June 2008 June 2008 | ||
 |
Food Outlook | |
| Global Market Analysis | ||


|
FISH AND FISHERY PRODUCTS
Prices of fishery products followed the general upward trend that has affected major food commodities in the course of 2007 and early 2008. This is the first time in decades that real prices of fish are going up. Prices of "wild" species from capture fisheries are increasing faster than prices of farmed species, because of the stronger impact of higher fuel prices on fishing vessel operations than on farmed species. However, aquaculture is also facing higher costs, in particular of feed.
World shrimp trade declined somewhat in 2007, reflecting smaller imports by Japan and the United States, which were partly compensated by increased purchases by the European Union. As a result, the European Union consolidated its position as the leading shrimp market, with a new record figure. Apart from the United Kingdom, all major European countries experienced a stable or increasing trend for shrimp imports. By contrast, for the first time in ten years, the United States cut shrimp imports, both in volume and value. Japan also imported less, confirming the prevailing downward trend. As a result of decreasing volumes and unfavourable conditions in these latter two markets, suppliers had to find new markets and mainly turned to Europe. Weak import demand depressed cultured shrimp prices, while in the case of wild shrimp, prices went up in early 2008. 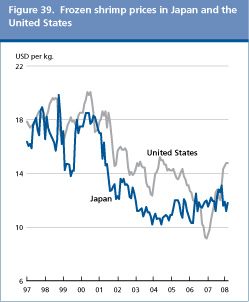
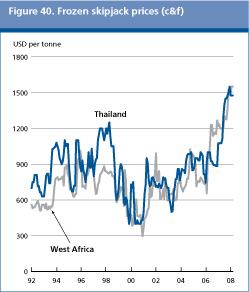
The world tuna market was characterized by declining catches during 2007. The main reason for this decline was the increased fuel price, which made long fishing trips for the world tuna fleet uneconomical. Tuna prices increased in all main markets, resulting in soaring canned tuna prices for the first time in twenty years. Although import demand prospects remain favourable in all major markets, further price hikes might scare away consumers in coming years.
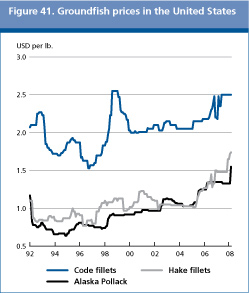
The dollar weakness contributed to stable prices of frozen fillet, in local currencies, in key European markets during 2007. Steady Alaska pollock supplies also contributed to stabilizing prices. However, hake supplies from some origins, notably Argentina, were smaller than in 2006, influenced by buoyant regional demand in South America itself. Globalization of the groundfish sector is becoming evident with China consolidating its role as a major supplier of cod and pollock fillets. Imports of groundfish by the United States declined, reflecting the weakness of the US Dollar. The outlook for 2008 points to weaker supplies for several species and a strengthening of dollar prices for hake and pollock fillets.
Squid production is estimated to have expanded in 2007, with substantially higher catches in the Southwest Atlantic. As supplies outstripped demand, squid prices have plummeted and Argentine traders were selling at much discounted prices. On the other hand, octopus production and trade declined in 2007, as a result of limited catches by a Mauritanian fleet. The lower octopus catches, combined with a recovery of import demand by Japan, resulted in an important price hike of USD 2.00/kg. 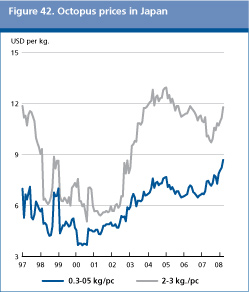
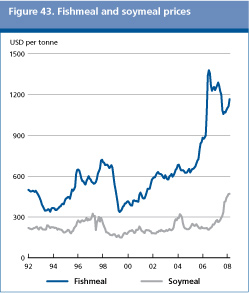
Total world fishmeal production is estimated at 6.0 million tonnes in 2007, up from 5.6 million tonnes in 2006. Production in the main fishmeal exporting countries reached 2.7 million tonnes, slightly less than in 2006. Surprisingly, fishmeal prices were rather stable in the course of 2007, despite increasing vegetable meal prices, probably because they had recorded huge gains in 2006. In early 2008, fishmeal prices moved upwards, a tendency likely to continue over the rest of the year.
Contrary to fishmeal, production of fish oil was relatively high in 2007. This resulted from high fat content of the fish processed. Total fish oil production in the six major producing countries reached 627 000 tonnes, up from the 594 000 tonnes of 2006. Fish oil prices skyrocketed in early 2008, when they reached USD 1 700 per tonne, an all time record. Further price hikes are expected over the coming months. Dynamic fish oil demand for the pharmaceutical industry, for direct human consumption, together with rising vegetable oil prices are behind the current fish oil price strength. Table 11. World fish market at a glance
Total world fish production (capture and aquaculture) continues to increase but only thanks to aquaculture. FAO figures for 2006 show a new record of 144 million tonnes (excluding aquatic plants), up from 143 million tonnes in 2005. Production in 2007 is estimated at 145 million tonnes, which would confirm the long-term tendency of modest increases. China confirms its role as the principal producer, reporting 52 million tonnes in 2006, of which 34 million tonnes from aquaculture1/. Overall, 80 percent of the world's production of fish and fishery products takes place in developing countries. Compared with production figures of a decade ago, the current estimate in 2007 represents an increase of more than 20 million tonnes. This additional supply is entirely due to the expansion in aquaculture, which, in 2006, reached 52 million tonnes (excluding aquatic plants), or 36 percent of total fish output. Estimates for 2007 show new growth in farmed production to 53 million tonnes. However, there is concern that the rate of expansion in aquaculture production is slowing down, whereas supplies from capture fisheries seem to have reached a long-term state of stability, despite some year-to-year variability, mostly linked to South American catches. Preliminary catch statistics for 2007 indicate slightly weaker catch levels. This confirms, in essence, the general state of stability of aggregate supplies from capture fisheries over the last 12 years with total annual catches oscillating within a band of 88 and 96 million tonnes. As noted above, despite the continued progress in aquaculture output, the overall growth of total world fish production has slowed down from the high rates observed during the previous decades, with implications for utilization and average consumption.
Downbeat outlook for fish trade and prices in 2008 International trade in fish and fishery products continued to grow in 2007, reflecting strong demand in the European Union and the United States, but also in the rest of the world, with the notable exception of Japan. The proportion of world fishery production traded internationally (live-weight equivalent) was 37 percent in 2006. Some weakening in import demand was registered in late 2007 and early 2008, as turmoil from the financial sector started affecting consumer confidence, which is expected to impact discretionary spending and sales of higher-value items in the short term. However, the long-term outlook for fish trade is positive, with a rising number of developed and developing countries entering international markets. World exports of fish and fishery products, which are monitored on value terms, grew by 9.5 percent in 2005 to USD 78 billion and by a further 9.4 percent in 2006 to USD 86 billion. Developing countries confirmed their importance as suppliers, accounting for close to 50 percent of world exports. Imports are mostly dominated by developed countries, now responsible for 80 percent of the total import value of USD 90 billion2/ (2006). In volume (live weight), developed countries' share is significantly lower, at 62 percent, reflecting the higher unit value of the products they import Net export revenues from fish exports earned by developing countries reached USD 24.9 billion in 2006. For many developing nations, fish trade represents a significant source of foreign currency earnings, in addition to the sector's important role in income generation, employment and food security. For Low-Income Food-Deficit Countries (LIFDCs), net export revenues rose to USD 12 billion in 2006, representing 22 percent of world exports in value terms. In general, the rising trade values and volumes for all fish commodities (except for fish meal volumes) reflect the process of globalization of the fisheries value chain, in which production and processing are being outsourced to Asia (e.g. China, Thailand and Viet Nam) and, to a lesser degree, Central and Eastern Europe (e.g. Poland and Baltic countries) and North Africa (Morocco). Outsourcing of processing takes place both on regional and global levels, depending on the product form, labour and transportation costs. It is noteworthy that many species, such as salmon, tuna, catfish and tilapia, are increasingly traded in the processed form (fillets or loins). At the same time, the growth of international or global distribution channels through large retailers has furthered this development. Over the decade 1997-2006, the share of developed countries in total production fell from 28 percent in 1997 to just above 20 percent in 2006. The corresponding increase in participation of developing countries is a result of the outsourcing of production, at least for the part destined to enter international markets, but also of development in their aquaculture sector, which through economies of scale and improved technology, has reduced costs and prices and thereby expanded the market overall. China has become the largest fish exporter at USD 9.7 billion (2007) but its imports are also growing, reaching USD 4.7 billion (2007). The increase in China's imports is partly a result of outsourcing, as Chinese processors import raw material from all major regions, including South and North America and Europe for re-processing and export. It also reflects China's growing domestic consumption of species not available locally. China is likely to eventually overtake Spain as the world's third largest importing country after Japan and the United States. The European Union is by far the largest single market for imported fish and fishery products. In 2006, imports by the 27 Member States reached USD 38 billion, up 14 percent from 2005, or 42 percent of world imports. However, official statistics also include trade among European Union partners. If intraregional trade is excluded, the European Union imported USD 20.7 billion worth of fish and fishery products from non-European Union suppliers, an increase of 16 percent from 2005. This makes the European Union the largest market in the world, absorbing about 23 percent of world imports. The year 2007 confirm the present upward trend of European Union imports, with an 11 percent increase in value to USD 42 billion. Japan is the largest single import market for fish, but import volumes have been declining in recent years due to weaker domestic demand associated with a long-term shift towards reduced fish consumption. In 2006, imports, which are dominated by shrimp, tuna and salmon, showed a 3.2 percent decline from 2005 to below USD 14 billion, and a 5.6 percent reduction in volume to 3.2 million tonnes (product weight). Import volumes in 2007 confirmed the downward trend, falling 8.5 percent to below 3 million tonnes for the first time, with a further drop in import value. In fact, the value of Japan's fish imports in 2007 was only slightly larger than that of the United States. The United States is the second largest single import market after Japan. With a growing population and a long-term positive trend in seafood consumption, imports were valued at USD 13.3 billion in 2006 and USD 13.6 billion in 2007. Imported quantities of edible fish products reached 2.50 million tonnes (product weight) in 2006, but fell slightly in 2007 to 2.46 million tonnes due to market weakness in the final months of the year. The largest United States' import item, in value, is shrimp, followed by salmon, crab and tuna. Of note is the strong increase in tilapia imports in 2007 (volume +10 percent, value +16 percent) and crab (volume +8 percent, value +18 percent). However, shrimp imports fell back somewhat in 2007, by 5.6 percent, in volume, to 557 000 tonnes and by -5.1 percent, in value, to USD 3.9 billion.
Rising world consumption of fish and fish products but wide regional differences in per caput levels World per capita consumption of fish and fishery products has risen steadily over the past decades from an average of 11.5 kg during the 1970s, 12.8 kg in the 1980s to 14.8 kg in the 1990s. Consumption in the 21st century has continued to grow to an average of 16.4 kg per capita for the 2001-2003 period. Preliminary figures for 2006 and 2007 show new increases in per caput fish availability to 16.7 kg In 2007, 49 percent of fish and fishery products (excluding fish meal) consumed as food are farmed, a share expected to reach 50 percent this year or next. This will be a milestone in the history of aquaculture and in world fisheries supply. Much of the expansion in fish consumption reflects developments in China, where domestic consumption of fish and fishery products per capita has risen from less than 5 kg in the 1970s to the present 26 kg. Excluding China, average world consumption per capita was 13.5 kg in the 1970s, rising to 14.3 kg in the 1980s, then falling to 13.5 kg in the 1990s. There are large regional differences in fish consumption per capita. As noted above, China's consumption has risen to 26 kg per capita, Asia excluding China, consumes at present 14.3 kg per capita (positive trend), Europe 19.9 kg (positive), and North and Central America 18.6 (positive). The regions of South America 8.7 (stable) and Africa 8 kg (stable) have, however, a below average but stable consumption per capita. In many ways it is the region of Africa which gives major causes for concern, given the low levels of consumption and the strong growth in projected population. On the other hand, Africa has a significant potential in aquaculture. At present, this is hardly exploited at all, with the exception of the very encouraging development in Egypt and also in several Sub-Saharan African countries. Trade in farmed species from Africa is still limited.
1. However, there is a possibility that the absolute level of China's capture fishery and aquaculture production, particularly its growth since the early 1990s, has been overestimated in the statistics. 2. Import figures differ from export figures because the former include freight costs, whereas exports are reported at FOB values. |
||||||||||||||||||||||||||||||||||||||||||||||||||||||||||||||||||||||||||||||||||||||||||||||||||||||||||||||||||||||||||||||||||||||||||||||||||||||||||||||||||||||||||||||||||||
| GIEWS | global information and early warning system on food and agriculture |