![]()
![]()
![]()
Abstract
Introduction
Experimentation in general
Controls
Animals as Their Own Controls
Adaptation of Animals - Training and Fitness
Transfer of inappropriate methodology
Complex data collecting systems
Pitfalls to watch for in field experiments
Conclusions
Acknowledgements
Résumé
References
Peter R. Lawrence* R. Anne Pearson**
(* Draught Animal Research Network, ILCA/ICRISAT BP 12404 Niamey, Niger
** Centre for Tropical Veterinary Medicine, University of Edinburgh, Easter Bush, Roslin, Midlothian EH25 9RG, Scotland)
Experimentation and the importance of controls is discussed. Methods of calculating minimum numbers of animals for any particular experiment are given and it is noted that these numbers are often inconveniently large for experiments using draught animals.
In certain circumstances animals can be used as their own controls and this can reduce considerably the number required. Examples of this approach are given.
Difficulties peculiar to draught animal experiments are cited and examples given. These include - adaptation of animals to work regimes during the course of a long experiment, the use of inappropriate measuring techniques borrowed from other branches of science, the use of over- sophisticated data collection techniques, selecting animals for experiments which are not typical of those used by farmers.
The paper ends with examples of practical problems which beset draught animal experiments in the field, e.g. choosing and sampling large amounts of high-roughage diets, the influence of the drover on the work output of the animal and making experimental plans sufficiently flexible so that if days are lost viable information can skill be obtained.
As recently as 1981 draught animal research was considered a neglected and almost non-existent branch of science (Smith 1981) with no serious work having been done since 1945 (Brody 1945). The last decade has seen a flowering of interest in the subject and draught animals are once more being mentioned in learned journals. The renewed interest has meant that a whole range of experimental methods, techniques and apparatus has been adapted or invented for use with draught animals. It is the purpose of this paper to look at some of these techniques and highlight some of the problems that have arisen as people have tried to apply them.
Experimentation is a major tool of science. It involves comparing characteristics of individual objects or more often groups of objects, living or non-living, and trying to ascertain how and to what extent the characteristics vary. In its simplest form the experiment is a demonstration. A trivial example might be to show that a particular chemical kills cockroaches. A careful scientist would perform this demonstration by taking two cockroaches as similar as possible and kept under the same conditions, dosing one with the chemical and the other not and noting that the dosed cockroach duly expired.
But even this simple demonstration illustrates two essential points about the experimental method. Firstly that every experiment involves comparison, in this case, between a dosed and an unclosed cockroach, and secondly, that both cockroaches should be as similar as possible and kept under conditions as similar as possible.
In the previous paragraph the unclosed cockroach acted as a control. Controls form a corner-stone of the classic experimental method which relies on finding animals or groups of animals which are as similar as possible so that, on the application of a treatment or stimulus, any differences observed in the reactions of the treated and control animals are likely to be due to the treatment and not merely to random variations in the response of individual animals. But this is often difficult even in inbred populations. In feeding trials, for example, the coefficient variation (CV) defined as:

SD =Standard deviation,  =the mean
is quite large. For sheep fattened on pasture the CV of weight gain is 20-30% and for cattle 15-25%. Similarly milk production of dairy cows varies by 10-20% and egg production by modern hybrid poultry by about 14%. Experiments then consist of taking groups of animals, treating them in different ways and comparing the responses of the different groups. One or more groups are not treated and these serve as the controls. When the responses of the animals to the treatment or lack of it are measured it is clear that there will be a variation of response within each group as well as differences between groups. The analysis of these within and between group variations, collectively known as analysis of variance forms a large part of the statistics with which experimental scientists deal.
This kind of analysis can also be used to produce estimates of the maximum number of animals (n) which are likely to be needed in an experiment if the differences between the means of groups are to prove significantly different; in other words, whether the experiment is worth doing at all from a statistical point of view.

The value LSD 0.05 or Least Significant Difference is a function of the Student's t value at the 0.05 level for the two groups of data under consideration and the variance. This latter quantity is also related to CV so the formula is really only useful if the scientist has a fairly shrewd idea of how variable the data are going to be before (s)he starts the experiment.
If for example CV is estimated at 20% and LSD at 10% then 32 animals will be needed in each group. In a feeding trial for example 32 is not an unreasonable number even with large animals, but for draught animals, each requiring individual attention and supervision, this is already an inconveniently large number.
Even animals of similar weight can differ by more than 20% in such fundamental parameters as draught force and power output (Table 1). As can be seen from the CV values, individual measurements within each pair of animal can also vary tremendously even though this particular experiment was carefully controlled with respect to soil type, setting and type of plough and the same ploughmen controlled the oxen throughout.
In experiments with large numbers of oxen, the range of live- weights, age and other characteristics will also be larger. It also becomes increasingly impossible for every ox to use the same plough, to plough exactly the same type of soil or to be driven by the same ploughmen. Under these conditions CVs of much more than 20% can be expected and experimentation along the outlines given above would be a futile exercise for draught animal research.
One way round this dilemma is to use each animal as its own control. This technique is particularly useful for studies on energy metabolism where the object is to measure the change in energy expenditure, usually calculated from gaseous exchange, associated with a particular activity of the animal.
The prime objection to this method is that it can be argued that the change in energy expenditure might have occurred anyway, because if, for example, the energy expenditure of an animal is measured- while it is working, there is no non-working animal present with which to compare it at the same time, as there would be in the kind of experiments considered in the last section.
Table 1. Draught force and power output of two teams of oxen ploughing uphill or downhill (derived from Lawrence and Pearson 1985).
Each value is shown +/- CV with n =10.
|
|
|
Team 1 |
Team 2 |
Difference % |
|
|
Liveweights (kg) |
450 +430 |
440 +430 |
|
|
Uphill |
Draught force (N) |
1037 +/- 25% |
927 +/- 42% |
0.6 |
|
Power output (W) |
829 +/- 24% |
858 +/- 43% |
-3.0 |
|
|
Downhill |
Draught force(N) |
1181 +/- 24% |
833 +/- 23% |
29.5 |
|
Power output (W) |
957 +/- 23% |
718 +/- 32% |
25.0 |
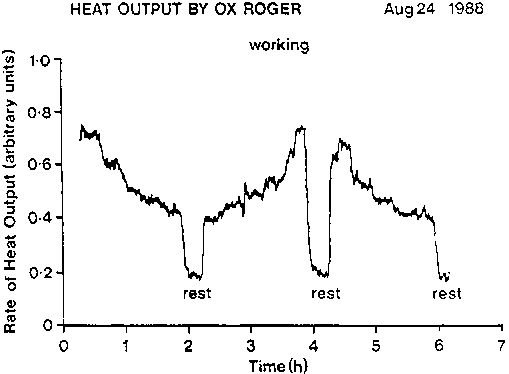
Figure 1. Heat output of an ox working at various levels during 6 h.
To be as sure as possible that the effect observed is due to the stimulus applied and nothing else, it is essential that energy expenditure is measured both before and after the stimulus.
This technique was first used by Blaxter (1962) to measure accurately the extra energy used by sheep to metabolize their food. Figure 1 shows the energy expenditure of an ox during a 6 h day. Each time the animal rests, its energy consumption returns to the same low level. In this case it can be safely assumed that any energy used above this level is due only to the work done.
Using an animal as its own control (Table 2) can considerably reduce the coefficient of variation associated with a particular measurement (in this case the energy cost of doing work at a rate of 400 W). In case A, animal 1 walked at 1 m/s while animal 2 walked at the same speed and pulled the load. The energy cost of doing the work was considered to be the difference in energy expenditure of the two animals. In case B the energy cost of doing work was taken to be the difference between the energy expenditure of the animal and the average energy expenditure of the same animal walking at the same speed before and after pulling the load. The latter method has a much smaller coefficient of variation and thus any differences in the energy cost of pulling loads using for example different harnesses could be investigated using far smaller numbers of animals.
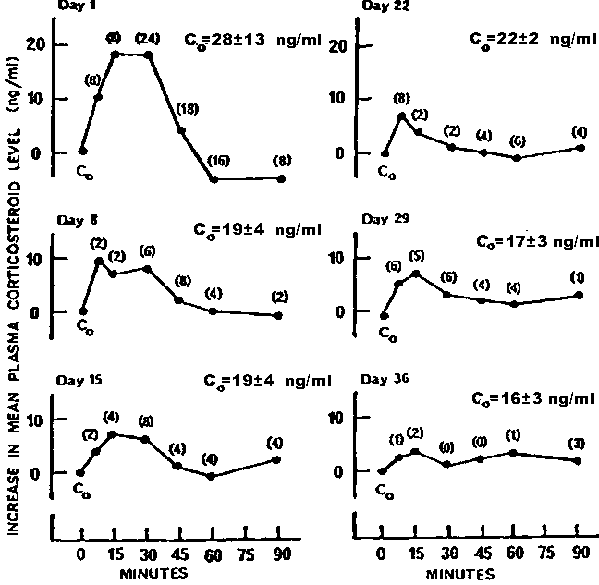
Animals, unlike machines, do not give consistent responses to a particular stimulus. During any study which involves experimental procedures or measurements of any kind, animals can be seen to adapt to the conditions or procedures as they become more accustomed to them, particularly if they may not have experienced them before the start of the study. Time should be allowed at the beginning of any study for draught animals to become used to any procedure, particularly if the procedures themselves might affect the observations. New diets, different harnessing systems, strange monitoring equipment, measurements and blood sampling can all influence observations of 'normal' animals. For example, Figure 2, shows the effect of repeated venipuncture on plasma corticosteroid concentrations in previously unhandled sheep. Three to six weeks of daily handling were required before these animals remained unstressed by this repeated sampling procedure (Pearson and Mellor 1976).
Table 2. Energy cost of pulling a load of 400N at 1m/s 2 Brahman cattle of similar weight. The energy cost is the difference between rate of energy expenditure pulling the load and the rate when walking at the same speed but unloaded. In case A, one animal acted as the other's control. In Case B each animal acted as its own control. Energy was calculated from gaseous exchange and is expressed in Watts.
|
|
Case A |
Case B |
|
|
706 |
1103 |
|
|
1527 |
1245 |
|
|
846 |
1249 |
|
|
649 |
1229 |
|
|
1582 |
1185 |
|
|
1011 |
1298 |
|
|
1526 |
1123 |
|
|
1823 |
1245 |
|
Coefficient of variation (%) |
35.0 |
5.2 |
Data adapted from Lawrence and Stibbards (1990)
Figure 2. Mean (+/- S.E.) changes in plasma corticosteroid concentrations in 4 sheep during repeated venipuncture carried out at 7 day intervals for 6 weeks (derived from Pearson and Mellor 1976).
Animals that have apparently adapted fully to experimental conditions and procedures still remain sensitive to small changes in their conditions. Small rises in basal heart rate occurred when 'tame' sheep were moved to an almost identical laboratory in the study described above (Pearson and Mellor 1976).
Similarly, Lawrence, Buck and Campbell (1989) investigated the effect of work on the resting metabolism of draught oxen. Figure 3 shows the rate of heat output during the day and during the night over five days. On the third day the animal worked all day to see whether its resting energy expenditure was higher than normal after work. On this particular diet very little effect was observed, but what is clear is that average energy expenditure on the morning of the first day was noticeably higher than on the other non-working days of the week. The most likely explanation for this is that on the first day of the week the respiration chamber in which the animal lived was closed and the circulating pumps switched on. All the animals used were very familiar with all the experimental procedures, but even so, this small change in routine was enough to produce a significant increase in energy expenditure.
One of the other problems encountered in studying draught animals which are working regularly is that they are likely to change in fitness and show a long-term adaptation to the work they are doing, particularly if they are relatively inexperienced at the start. For example, an experiment to investigate the extra energy draught animals use when they have to work under muddy conditions (Lawrence 1987) involved taking measurements from animals walking through mud 300 mm deep in a circular track. As a control, all animals performed the same tasks on the same track when it was not covered in mud.
In an ideal experiment, these two treatments should have been applied at random to all the animals, but since the track held about 80 tonnes of mud, this was clearly impossible, so it was decided that all the animals should walk first all on concrete, then through mud and finally on the concrete again after the mud had been cleared away.
Because of the amount of time the measurements took, the first and final control periods were separated by a matter of eight weeks.
Table 3 shows the energy cost of walking measured in J/m/kg liveweight. Clearly the animals used much more energy walking through mud than during either of the control periods; but they also used more energy walking during the first control period than during the second. This makes the establishment of a suitable control value very difficult. The most likely explanation for this discrepancy is that during the time separating the first and last control periods the animals had become fitter and/or more used to the experimental procedure.
Table 3. Energy cost of walking on concrete and mud 300 mm deep. Energy is expressed as J/m/kg liveweight. The 2 periods when the animals walked on concrete were separated by 2 months. Each value is an average of 4 determinations.
|
Animal |
First dtm. walking on concrete |
Walking in mud |
Second dtm. walking on concrete |
|
1 |
1.27 |
2.85 |
1.32 |
|
2 |
2.48 |
4.27 |
1.80 |
|
3 |
1.42 |
3.19 |
1.32 |
|
4 |
1.72 |
2.60 |
1.22 |
|
5 |
1.69 |
3.15 |
1.08 |
|
6 |
2.91 |
4.00 |
2.57 |
|
Average |
1.91 |
3.34 |
1.55 |
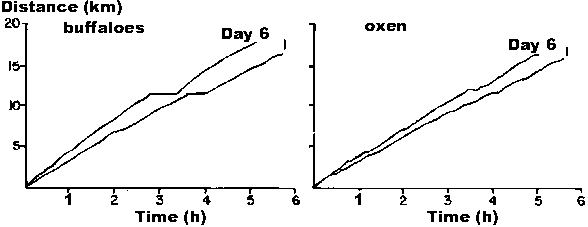
Similarly, in a comparison of cattle and buffalo pulling carts in Nepal (Pearson 1989), animals were compared when travelling over the same route regularly. All 4 teams showed an increase in speed when working during the course of the experiment, travelling further and doing more work within a 5 h period (Figure 4), presumably as they became fitter, and/or more accustomed to the work This was particularly noticeable in the leas/experienced team of oxen. At first these oxen were the slowest to complete the day's work and were the most erratic workers. However, within a short time (eight weeks) and only a few trips (six) the animals had improved and were working almost as well as the other teams of more experienced oxen. This change was less critical than in the previous example as no "controls" were required. Rotation of teams used for work meant that each team experienced similar patterns of work and rest days and, as far as possible, similar conditions during the course of the comparative study. Hence, depending on the type of study, careful planning can help accommodate any changes in fitness or experience which may influence the interpretation of observations in some long-term studies of working animals.
Figure 4. Distance travelled (km) over the day by a team of buffaloes and by a team of oxen pulling carts on their first (1) and last (6) day of work over an 8 week period (derived from Pearson 1989).
Methods used in other branches of science and engineering have often been adapted for draught animal research but may not always be appropriate. One such is the dynamometer used for measuring the work output and draught force of tractors.
This instrument registers the force exerted and averages it over a short time either electronically or by mechanical or hydraulic 'damping' of the signals. For tractors, where the force exerted and speed of travel are relatively constant the dynamometer is quite adequate. However, dynamometers have been (and still are) frequently used with animals whose draught force and speed vary continuously as they put one foot in front of the other. Lawrence and Pearson (1985) showed that draught force measurements have to be taken at small and equal distances as the animal moves along and not averaged with respect to time. The distance increment needs to be sufficiently small so that at least 10-20 measurements are taken during every change of draught force. Since the latter can occur at the rate of 2-3 times a second (in time with animal's footfall) this implies that draught force should be recorded every 5 mm or 50-100 times per second at normal walking speeds.
These factors were all taken into account in the design of an ergometer which measures work output over a given distance from which draught forces can be calculated. Table 4 shows the results of using an ergometer and a dynamometer to process the same signal from a load cell connecting oxen to a plough. Discrepancies of up to 15% were recorded, the largest values usually being associated with young, less well-trained oxen attempting to pull heavy, erratic loads. This observation illustrates nicely that the indiscriminate application of methods from other disciplines to draught animal research may not always be appropriate.
Instrumentation that works on one species may not necessarily be suitable for others. Although portable heart rate meters have been successfully used to accurately measure heart rate in exercising horses (e.g. Sloet van Oldruitenborgh-Oosterbaan, Wensing and Breuknik 1987), they have proved less successful when applied to working ruminants. Heart rate, determined using a 'horse meter' regularly underestimated actual heart rate of a resting ox but overestimated that of a working ox, although differences between oxen were also observed (Bwala 1984).
Any new instrumentation or technique, particularly for continuous physiological monitoring, before being adopted, should be tested against simple manual methods or other methods known to be accurate, and in animals and environments in which it will be used.
Table 4. Average draught forces exerted by three teams of oxen ploughing up or down a slight slope. Force was registered with a load cell and the signal processed simultaneously by a dynamometer and an ergometer. Each measurement is the average of 10 × 5 s readings.
|
Team of oxen/direction of ploughing |
Draught force dynamometer (kg/s) |
Draught force ergometer |
Difference (%) |
|
|
Team 1 |
up |
1426 |
1418 |
0.7 |
|
down |
1482 |
1442 |
2.8 |
|
|
Team 2 |
up |
1117 |
1037 |
7.8 |
|
down |
1246 |
1181 |
4.7 |
|
|
Team 3 |
up |
985 |
927 |
5.8 |
|
down |
963 |
833 |
15.7 |
|
Team 3 were the youngest and weakest oxen.
Data derived from Lawrence and Pearson (1985).
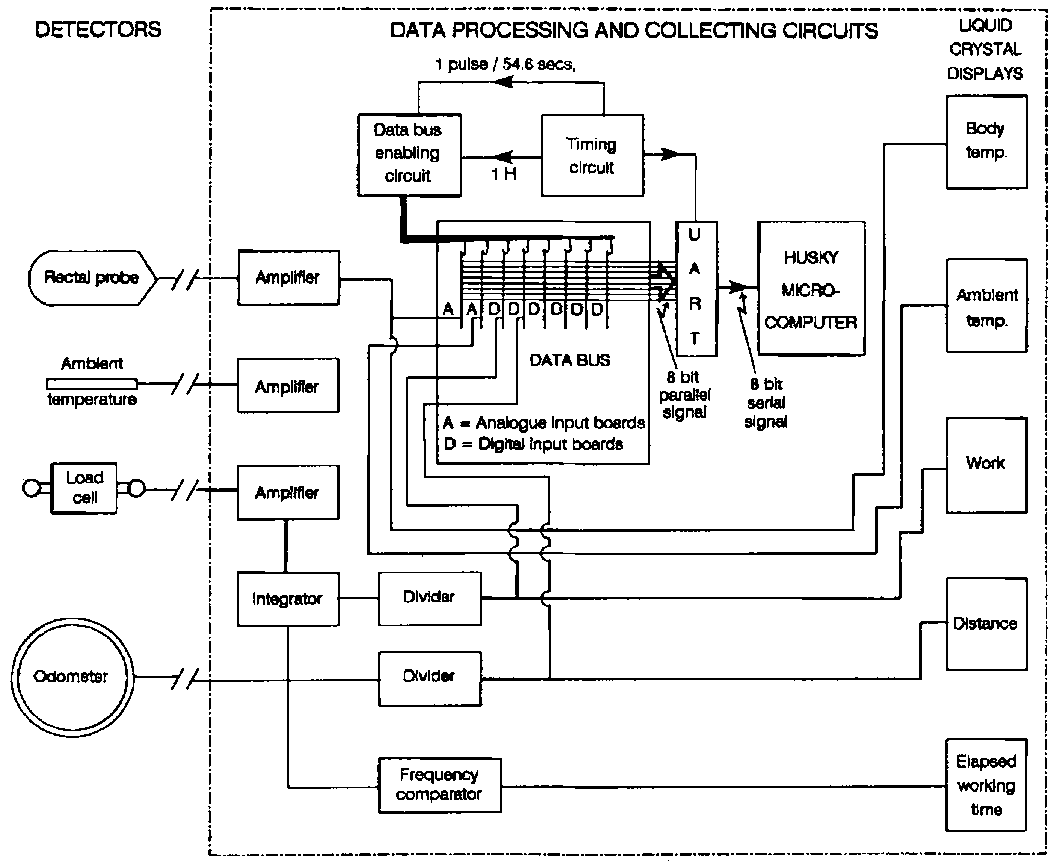
In recent years several workers have developed complex systems which enable several parameters of draught animals to be measured simultaneously including, draught force, distance travelled, work output, stepping rate, breathing rate, heart rate, oxygen consumption, ventilation rate and body temperature. The general layout of one such system is shown in Figure 5. This system can record data from up to eight sensors producing either analogue or digital signals. Every half, one or two minutes, the current analogue value or the accumulated digital counts from each sensor are transferred to a portable computer for storage.
Systems such as this have their own inherent problems. On a practical level the main problems are the initial cost of building or buying the system and maintaining it. The main problem is the business of attaching all the sensors to the animal and/or the implement it pulls. Unless great care is taken, connecting cables can easily become entangled or damaged. The sensors themselves may irritate or cause discomfort to the animal and once installed there is always the possibility of one or more of them developing faults. In some cases simply the amount of time needed to place and set up the sensors and logging equipment can cause severe dislocation to any proposed experimental program.
One final problem is the sheer amount of data generated. Unless a scientist has a very good idea of precisely what he wants from the data collected it is all too easy to end up swamped in a morass of figures. The gas analysis system at CTVM in Edinburgh records nearly 500,000 separate readings in 24 h but in most experiments the information required is simply 3 or 4 average values per day.
Statistically there is the problem of how legitimately each of these separate points may be regarded as a distinct observation. It is possible to obtain impressively low coefficients of variation from data recorded very frequently in short periods of time during which very little change in the actual values occurs.
Figure 5. General layout of an eight channel data collecting system for draught oxen.
Many factors need to be considered when thinking about the day-to-day organisation and planning of draught animal experiments in the field. The following points are based on the experiences of the authors and may help others in planning and organising their field studies. They are not meant to be a complete list and are not in any order of priority.
a) Selection of animals
Regardless of the number of animals required, it is important that the animals that are chosen are representative of those being used in the area under study. It is tempting to pick large strong animals or those maintained on research stations which are usually larger, or in better condition and may even be different breeds to those used by local farmers. When comparing breeds or crosses it is necessary to ensure that all the types and sizes that are used are represented in a trial. Conversely, in trials where different feeds, implements or harnesses are being compared it is often better to have a uniform group of animals of similar sex, size, weight and age, provided again that they are similar to those used locally. Decisions on number of animals used in practice are often constrained by availability of animals, finance and facilities available for keeping and maintaining experimental stock during a study. Often compromises have to be made between what is best in theory and what is possible in practice.
b) Nutritional studies with draught animals
In any feeding trial, decisions have to be made regarding the length of time required for animals to adapt to any changes in diet or new supplement, since it is usually more feasible to use each animal as its own control (see earlier). With ruminants at least 14 days should be allowed for gut micro-organisms to adapt to dietary changes, although this does depend on the extent of the change in diet. If it is drastic, for example, a change from fresh grass to dry roughage or harvest by- products, then more time may be needed.
The next problems come in experimental design. A Latin square or similar design can be used if it is possible to obtain sufficient of each diet or feedstuff for long enough for it to be uniform throughout the experiment. All diets can then be fed to the animals at all stages and checks can be made for period effects and carry over effects from one diet to another. If fluctuations in feedstuff availability or quality are likely to occur in the experimental period, or feed storage space is short, then alternative experimental designs may have to be considered, similar to those used for the energy studies described above, when controls are done before and after experimental periods. When work also forms part of a nutritional study then this latter design usually has to be adopted, due to practical considerations such as availability of labour and ease of management of measurements and recording methods.
In nutrition studies it is often easier to simulate the daily energy expended in work by walking animals uphill rather than working them as separate individuals or teams. This means a larger number of animals can be worked at once, and each animal does a similar amount of work in relation to its liveweight which is more nearly the same than if it was doing a fixed amount of work e.g. pulling a cart over a set distance. This can offer a good practical solution to running nutritional studies of working animals, particularly when labour and implements are in short supply and/or faecal and urine collections are part of the experiment. However it should be borne in mind when interpreting results that, although walking or climbing uphill without the constraint of a load, cart or implement, can be arranged to increase daily energy expenditure to levels similar to those seen when working, it may be less stressful to the draught animal than when it is actually pulling or carrying a load.
It is important to keep record sheets simple, making sure they can be easily read and that they are in the language the recorder can understand. Make the sheets bilingual if necessary.
c) Work studies with draught animals
Many factors influence the amount of work an animal or team does in a day. These include ground conditions, climate and, sometimes overlooked, the man or woman who is handling the animals (Table 5). When planning studies involving work, whether testing animals, implements or harnesses, it is important to identify what is to be studied or what the problem is, and then to make sure that other variables, such as ox driver, land type and terrain are standardised.
Table 5. Effects of a different ploughman during the day on mean draught force, MDF (N), speed (m/s) and work output (kJ).
|
|
Plough-man |
Team of oxen |
Significance |
|||||||
|
19/18 |
20/21 |
23/22 |
24/25 |
26/27 |
s.e.d |
Man |
Team |
MxT |
||
|
MDF (1 h) |
Khorga |
616 |
690 |
489 |
478 |
442 |
97 |
|
|
|
|
Ram |
641 |
464 |
459 |
483 |
468 |
|
|
|
|
|
|
Speed (1 h) |
Khorga |
0.31 |
0.34 |
0.29 |
0.28 |
0.29 |
0.02 |
*** |
** |
* |
|
Ram |
0.37 |
0.53 |
0.38 |
0.33 |
0.34 |
|
|
|
|
|
|
Work (1 h) |
Khorga |
595 |
674 |
439 |
440 |
339 |
101 |
|
|
|
|
Ram 2 |
716 |
781 |
544 |
512 |
487 |
|
|
|
|
|
(Pearson, Lawrence and Ghimire 1989)
Make sure what is measured is appropriate. Can it be done simply? Don't make things complicated. The animals and implements and man are complicated enough without complicated equipment. Think about how accurate measurements need to be. It is pointless measuring the height or leg length of a draught ox to the nearest mm; however, inaccuracies in measuring draught force, respiration or heart rate for example may give very misleading results. Think how often observations need to be taken. Body temperature changes relatively slowly, heart rate very rapidly. This, as well as the type of instrumentation or recording equipment available influences decisions made in recording results. Again compromises often have to be made between what is ideal and what is practical, depending on what is available.
When planning work experiments, think about the length of time a study will take, particularly when availability of recording equipment, implements, land and labour usually mean that only one or perhaps two teams can be studied simultaneously. In this case, public holidays, and days lost due to faulty equipment, atypical weather conditions and lame and uncooperative animals all have to be allowed for in planning time schedules.
d) A plan or checklist
Before considering any draught animal experiment it is important to plan it and discuss it with others, including farmers. Much can be gained by talking over proposed work, making sure the study is appropriate. Think about how the results will be analysed before the experiment is started. A check list in the form of questions can often be useful as a reminder at the planning stages to prevent mistakes being made that might be regretted later on. Finally, anticipate; animals are unpredictable, so try and plan ahead. Think about what will go wrong before it does.
This paper has attempted to highlight some of the many problems both practical and conceptual which beset the scientist involved in experimental draught animal research. There is a need for scientists to standardize methodology thus making comparisons between the results from different groups of workers easier. Where no absolute standard of measurement exists, for example, in the case of testing the fitness or working ability of an animal, a consensus should be reached on testing procedures. However arbitrary these procedures may be, they could at least form a basis for comparison if everyone sticks to the same protocols.
There is a need for standardized, easy to use, rugged and affordable instrumentation so that more groups of workers in more locations can obtain comparable results. Every group should at least be able to measure distance travelled and work output. Of the physiological parameters, body temperature is probably the easiest and most reliable one to measure and in the tropical environment can give valuable informal on as to the degree of work induced heat stress. Other physiological parameters or biochemical parameters relying blood analysis, while of great interest and potentially of great value, are often too difficult, unreliable or costly to measure on a routine basis.
Finally, there is a need for the more statistically minded scientists to consider how best to analyse data which often has to come from small numbers of disparate animals which very often cannot work under exactly the same conditions nor at the same time. We feel it is essential for the future scientific credibility of draught animal research that data should not appear so arbitrary and chaotic that they are apparently unworthy of consideration nor, on the other hand, should they be used to draw conclusions that they are incapable of supporting.
We are grateful to Dr. A.J. Smith for his comments in the preparation of this paper.
Cette étude traite de l'expérimentation animale de l'importance des vérifications. Diverses méthodes de calcul du nombre minimum d'animaux nécessaires pour effectuer un essai particulier sont exposées et les inconvénients que présente le recours à des effectifs importante clans les expériences en traction animale sont signalés Dans certains cas, les animaux peuvent constituer leur propre témoin. Cette approche, que viennent illustrer des exemples, permet une réduction considérable du nombre des animaux requis.
Les difficultés inhérentes à l'expérimentation avec des animaux de trait sont présentées et illustrées par des exemples. Parmi les problèmes évoqués figurent l'adaptation des animaux au rythme de travail au cours d'essais de longue durée, le recours à des techniques de mesure peu appropriées empruntées à d'autres disciplines scientifiques, l'utilisation de techniques trop perfectionnées de collecte des données et le choix d'animaux d'expérimentation peu apparentés à ceux qu'utilisent les paysans.
La communication se termine par des exemples pratiques des difficultés qui s'attachent à la réalisation d'expérimentations sur le terrain, à savoir la sélection et l'échantillonnage de grandes quantités de fourrages grossiers, l'influence du conducteur sur le rendement des animaux au travail et l'élaboration de plans expérimentaux suffisamment souples pour permettre de continuer à recueillir des informations essentielles même en cas de perte d'un certain nombre de journées de travail.
Blaxter, K.L. 1962. The Energy Metabolism of Ruminants. Hutchinson, London.
Brody, S. 1945. Bioenergetics and Growth With Special Reference to the Efficiency Complex in Domestic Animals. Reingold Publishing Corporation. Reprinted 1974 by Hafner Press New York and Collier Macmillan, London.
Bwala, M.S. 1984. Factors influencing the measurement of heart rate in draught cattle. Unpublished MSc thesis, University of Edinburgh.
Lawrence, P.R. 1987. Mud, mud, glorious mud. Draught Animal News, 7, 1-2.
Lawrence, P.R., Buck, S.F. and Campbell, I. 1989. The metabolic rate of oxen after work Proceedings of the Nutrition Society, 48. 153A.
Lawrence, P.R. and Pearson, R.A. 1985. Factors affecting the measurement of draught force, work output and power of oxen. Journal of Agricultural Science, Cambridge, 105, 703-714.
Lawrence, P.R. and Stibbards, R.J. 1990. The energy costs of walking, carrying and pulling loads on flat surfaces by Brahman cattle and swamp buffalo. Animal Production, 50, 29-39.
Pearson, R.A. 1989. A comparison of draught cattle (Bos indicus) and buffaloes (Bubalus bubalis) carting loads in hot conditions. Animal Production, 49, 355-363.
Pearson, R.A., Lawrence, P.R. and Ghimire, C. 1989. Factors influencing the work done by draught oxen: a study in the eastern hills of Nepal. Animal Production, 49, 345-353.
Pearson, R.A. and Mellor, D.J. 1976. Some behavioural and physio-logical changes in pregnant goats and sheep during adaptation to laboratory conditions. Research in Veterinary Science, 20, 215-217.
Sloet van Oldruitenborgh-Oosterbaan, M.M, Wensing, T. and Breuknik, H.J. 1987. Standardized exercise test on a track to evaluate fitness and training of saddle horses. In Equine Exercise Physiology 2 (Gillespie, J.R. and Robinson, N.E. ed.), pp. 68-76. ICEEP Publications, Davis, California, U.S.A.
Smith, A.J. 1981. Draught animal research, a neglected subject. World Animal Review, 40, 1-2.
![]()
![]()
![]()