![]()
![]()
![]()
A . N . SuliemanEl Huda National Sheep Research Station
El Managil
Gezira
Sudanand
R. T. Wilson
Small Ruminant Research Network
International Livestock Centre for Africa
P.O. Box 5689
Addis Ababa
Ethiopia
Summary
Resume
Introduction
Materials and methods
Results
Discussion
References
Shugor, Dubasi and Watish sub-types of Sudan Desert sheep were evaluated on the basis of 3 productivity indices (weight of lamb weaned/ ewe/yr, weight weaned/kg ewe/yr and weight weaned/kg 0.75/ewe/yr). Components used to construct the indices were litter weight at 120 d, parturition interval, survival to 120 d and ewe postpartum weight. There were differences among sub-types in all components but, because of interactions among them, there were no differences in the indices. The indices were 16.8 kg, 419 g and 1.14 kg and were lower than those found in other studies. Suggestions for improving productivity are made.
Les sous-types Shugor, Dubasi et Watish du mouton du désert soudanais sont évalués par la comparaison de 3 indices de productivité (poids de jeune sevré par brebis et par an, par kg p.v. brebis par an et par kg 0,75 brebis par an). Les composantes utilisées dans les indices sont le poids de la portée à 120 j. l'intervalle de naissance, le taux de survie à 120 j et le poids postpartum des brebis. Les composantes montraient des différences significatives entre les groupes mais, à cause des interactions, les indices ne differaient pas. Les indices étaient de 16,8 kg, 419 g et 1,14 kg et sont inférieurs à ceux trouvés dans d'autres études. Des propositions sont faites pour augmenter la productivité.
The Sudan covers an area of more than 2.5 million km², is the largest country in Africa and has one of the continent's largest livestock populations. Sheep comprised about 36% of the total livestock population of 45 million animals in 1977 (Watson et al, 1979).
Four main Sudanese groups of sheep have been identified (Tothill, 1948; McLeroy, 1961a; 1961b; Wilson and Clarke, 1975) in relation to physical features and to ecological distribution. These groups are: Sudan Desert; Sudan Nilotic; Sudan Arid Upland; and Sudan Equatorial Upland. In addition, fused ecotype groups have been recognised, resulting from non-systematic crossbreeding of the pure types. The Sudan Desert comprises more than 65% of Sudanese sheep. It is more productive than the other local sheep groups which gives it priority in research and development programmes.
Performance characterization and evaluation of Sudanese sheep is a prerequisite to further progress in improving their productivity. The National Sheep Research Station at El Huda has been involved with performance evaluation of 3 sub-types of the Sudan Desert sheep. Some results of this work are provided in this paper.
El Huda lies at 14°15'N longitude and 32°50'E latitude, at an altitude of about 400 m, about 90 km north-west of Wad Medani, the regional centre, and about 150 km south of Khartoum. The station has an area of about 200 feddans (1 feddan = 1.038 acres = 0.5 ha) of which 200 feddans are available for forage cultivation.
Meteorological data can be inferred for El Huda from data collected at Wad Medani for the period 1951-1980. Annual rainfall was 428.4 mm, mean maximum temperature was 36.7°C (highest maximum 46.2°C), mean minimum temperature was 18.2°C (lowest minimum 3.3°C), and average relative humidity was 40%. The year can be divided into three seasons: winter (Nov-Feb); hot summer (Mar-Jun) and wet summer (Jul-Oct).
Feed resources comprise forages including phillipesava (Phaseolus trilobus), lucerne (Medicago sativa), dolichos bean (Dolichos lablab) and several varieties of Sudan grass (Sorghum sudanense). In addition, stover of grain sorghum, groundnut hay, agricultural by-products (cotton seed cake, wheat bran, molasses), grain sorghum, and natural grasses growing on fallow land and canal banks are available.
The research flocks comprise Shugor, Dubasi and Watish tribal sub-types of Sudan Desert sheep. The first 2 types were collected about 1971 from private breeding flocks and livestock markets. The Watish was introduced in April 1977 from El Neisheiba livestock station at Wad Medani. Additional sheep have been bought over the years to increase the flock size for research purposes.
The 3 types were kept separate. Males and females were separated except at breeding time. In each breeding season ewes were grouped by age and randomly allocated to breeding rams, so that each ram was mated to 20-25 ewes. Breeding groups were maintained for 6 wk. Flock nutrition was based on forage and agricultural by-products. Supplementation was provided only to lactating ewes, breeding ewes and ewes close to lambing. Breeding ewes were allowed a rising level of concentrate (1 kg of a mixture of wheat bran, cotton seed cake and crushed sorghum grain in the ratio 40:30:30) 2 wk prior to the introduction of rams. Stored forage and straw were provided to animals that were confined for breeding and suckling. On occasions when there was a shortage of forage and straw, all animals received 0.45 kg of wheat bran. During the recent drought years, which resulted in a shortage of cereal grains for human nutrition, sheep were fed molasses and urea combined with wheat bran. A mineral lick and water were always available.
Vaccination against endemic diseases and drenching against internal and external parasites were carried out on a routine basis. Newly purchased sheep were medically treated and quarantined before joining the flock.
Performance data extracted from the station records were transferred to computer coding sheets preparatory to statistical analysis. Data were initially tested for completeness and conformity using commercial software (BMDP, 1983; SPSS Inc. 1983). Productivity analyses were carried out using least-squares fixed model procedures (Harvey, 1977). Unequal and disproportionate subclass numbers gave unbalanced factorial designs for which conventional analysis of variance techniques would not have been applicable. The model included the fixed effects of origin (foundation or born on station); parturition number; year of parturition; season of parturition and type of parturition (single or twin). Parturition number was equivalent to true parity for station-born ewes with fourth and subsequent parities grouped as one effect ³ 4): for foundation ewes, "parity" was equivalent to the number of parturitions on the station with fourth and subsequent parturitions being treated as a single effect (³ 4). The residual mean square was used as the error term to test the significance of all differences evaluated among groups.
The characters of litter weight at 120 d, reproductive performance (expressed as the parturition interval), lamb survival (the death of a litter resulting in a zero index for a particular female), and ewe postpartum weight were used to construct productivity indices for individual ewes. The three indices used were calculated as:
Components of productivity
Analysis of variance using the least-squares method was carried out on litter size, parturition interval, individual lamb weight at weaning, mortality to weaning and ewe postpartum weight. There were differences among the 3 sub-types in all these traits (Table 1).
The Shugor sub-type had superior performance in terms of litter size but had the longest interval between parturitions. Lambs of Shugor and Dubasi did not differ in weight at weaning and both of these types produced heavier lambs than the Watish. Heavier weights at weaning are most probably related to mature body weight, as Watish ewes were lighter than the other two sub-types following all parturitions. Watish ewes had lower mortality rates to weaning than either of the other types.
These components were used to construct productivity indices as described in the section on materials and methods.
Productivity indices
Unadjusted indices at 120 d were 16.9 ± 9.50 kg of live weight weaned per ewe per year, 425 ± 247.3 g weight weaned per kg ewe per year and 1.15 ± 0.656 kg weaned per metabolic kg ewe per year.
Table 1. Components used in calculating productivity indices for Sudan Desert sheep at El Huda, Sudan.
|
Component and unit |
Sheep sub-type |
||
|
Shugor |
Dubasi |
Watish |
|
|
Litter size (n) |
1.30a |
1.18a |
1.17b |
|
Parturition interval (d) |
449a |
425a |
403b |
|
Lamb weight at 120 d (kg) |
16.9a |
16.3a |
15.2b |
|
Mortality at 120 d (%) |
40.5a |
42.6a |
29.7b |
|
Ewe post-partum weight (kg) |
42.3a |
42.2a |
37.0b |
Along rows, values without a suffix letter in common differ (P < 0.05).
The analysis of variance showed that only season and year of parturition influenced the indices (Table 2). There were no differences in the indices attributable to breed, dam origin, parturition type, parity of station ewes or number of lambings on the station of foundation ewes. The parturition type almost exerted an influence, having slightly more effect on Index I (P - 0.055) and Index III (P - 0.059) than Index II (P 0.063).
Adjusted values for Indices I, II and III (Table 3) were 16.8 ± 1.81 kg (coefficient of variation 53.5%), 419 ± 47.4 g (c.v. 55.6%) and 1.14 ± 0.126 kg (c.v. 54.5%). There were no differences among breeds in any of the indices.
Table 2. Mean squares from the analysis of variance for productivity indices of Sudan Desert sheep at El Huda, Sudan.
|
Source of variation |
d.f. |
Mean square |
||
|
Index I |
Index II |
Index III |
||
|
Breed |
2 |
46.2 |
0.231 |
11.36 |
|
Dam origin |
1 |
454.5 |
0.152 |
13 15 |
|
Parturition type |
1 |
3061.1 |
1.970 |
142 98 |
|
Season of parturition |
2 |
2626.7* |
1.946* |
138.12* |
|
Year of parturition |
5 |
2312.6* |
1.670* |
115.93* |
|
Parity/Station ewes |
3 |
364.4 |
0.075 |
7.09 |
|
Parity/Foundation ewes |
3 |
895.1 |
0.379 |
31.28 |
|
Error |
128 |
815.3 |
0.559 |
39.98 |
Table 3. Least-squares means of productivity indices for Sudan Desert sheep at El Huda, Sudan.
|
Variable |
|
n |
Index I |
Index II |
Index III |
|
|
(kg) |
(g) |
(kg) |
||||
|
Overall least-squares mean |
|
146 |
16.8 |
419 |
1.14 |
|
|
s.e. |
|
|
1.81 |
47.4 |
0.126 |
|
|
Breed: |
Shugor |
35 |
17.1 |
421 |
1.15 |
|
|
|
Dubasi |
58 |
16.4 |
395 |
1.08 |
|
|
|
Watish |
53 |
16.9 |
443 |
1.19 |
|
|
|
Average s.e. |
|
|
2.19 |
57.5 |
0.121 |
|
Dam origin: |
station |
64 |
17.7 |
436 |
1.19 |
|
|
|
foundation |
82 |
15.9 |
403 |
1.09 |
|
|
|
Average s.e. |
|
|
2.18 |
57.1 |
0.151 |
|
Parturition type: |
single |
123 |
14.7 |
366 |
0.99 |
|
|
|
twin |
23 |
18,9 |
473 |
1.28 |
|
|
|
Average s.e. |
|
|
2.09 |
54.7 |
0.145 |
|
Season of parturition: |
winter |
37 |
17.6ab |
454 |
1.22ab |
|
|
|
hot summer |
7 |
12.1b |
280b |
0.77b |
|
|
|
wet summer |
102 |
20.8a |
525a |
1.42a |
|
|
|
Average s.e. |
|
|
2.55 |
66.8 |
0.177 |
|
Year of parturition: |
1978 |
23 |
17.7ab |
384ab |
1.07ab |
|
|
|
1979 |
35 |
15.6a |
372ab |
1.02ab |
|
|
|
1980 |
25 |
12.2a |
299a |
0.81a |
|
|
|
1981 |
16 |
11.8a |
297ab |
0.80ab |
|
|
|
1982 |
42 |
17.0a |
431b |
1.16b |
|
|
|
1983 |
5 |
27.3b |
734c |
1.95c |
|
|
|
Average s.e. |
|
2.89 |
75.8 |
0.202 |
|
|
Parity/station ewes: |
1 |
30 |
15.2 |
405 |
1.08 |
|
|
|
2 |
16 |
16.8 |
407 |
1.11 |
|
|
|
3 |
8 |
18.2 |
449 |
1.22 |
|
|
|
4 |
2 |
20.8 |
485 |
1.34 |
|
|
|
Average s.e. |
|
3.78 |
99.2 |
0.263 |
|
|
Parity/foundation ewes: |
1 |
5 |
10.1 |
285 |
0.75 |
|
|
|
2 |
27 |
17,2 |
430 |
1.17 |
|
|
|
3 |
26 |
18.2 |
459 |
1.24 |
|
|
|
4 |
24 |
18.1 |
436 |
1.20 |
|
|
|
Average s.e. |
|
|
2.90 |
75.8 |
0.201 |
Within variable groups, and in the same column, values without a suffix letter in common differ (P < 0.05).
There were no differences in indices between dams of different origin. Ewes giving birth to singles did not have indices that were significantly different from those giving birth to twins.
Indices of ewes that gave birth in the wet summer were superior to those that gave birth in the hot summer. Ewes that lambed in the winter were intermediate between ewes lambing in either of the other seasons. These differences were mainly due to better growth and lower mortality rates of wet summer born lambs as reproductive performance was similar for ewes lambing in all seasons. Effects of year on indices show the expected results (based on reproductive performance, lamb growth and mortality) with 1980 and 1981 providing indices well below the mean and 1982 and 1983 indices being greater than the mean.
There were no differences in indices in relation to parity of station born ewes or of number of lambings on station of foundation ewes although the expected trend of a rising index with ewe age was noted.
This analysis of the productivity of 3 subtypes of Sudan Desert sheep used discrete components of production to calculate overall annual output expressed as indices. Differences were evident among the sub-types in all of the components used to construct the indices (Table 1). There were, however, no differences among the types in overall productivity (Tables 2 and 3). The lack of difference in Index I, which does not include ewe postpartum weight as a component, can mainly be attributed to the shorter parturition interval and higher survival rates of the Watish in comparison to the other 2 types. Both Shugor and Dubasi were heavier at weaning than the Watish. Litter size was larger in the Shugor than in the Dubasi or the Watish. The lack of differences in Index II and Index III can also be attributed to some extent, to the varying levels of the different components just discussed. It is also due in part to the inclusion of dam weight and it can indeed be seen from Table 3 that the Watish did appear to outperform the other 2 types because of its lighter weight. The use of an index to evaluate the productivity of different types or classes of animal, by taking into account several aspects of performance, thus produces a clear indication of overall capability of animals in any given environment.
A number of lessons can be learned from these analyses, not only in respect of actual performance but also in relation to management. For all 3 sub-types performance is similar but it is grossly inferior to comparable types of sheep in a western Sudan traditional system where the 3 indices were 20.1 kg, 547 g and 1.34 kg (Wilson, 1983). In a Mali traditional system, ewes of slightly lighter weight than the Sudan Desert also had higher indices, these being 28.4 kg, 867 g and 2.22 kg (Wilson and Light, 1986). In Mozambique, on station and again with lighter ewes, output was assessed at 19.7 kg, 488 g and 1.36 kg (Rocha et al, in press).
The low productivity of the Sudan Desert sheep in this study was partly due to long intervals between parturitions, poor preweaning growth rates, and an extremely high mortality rate. The generation interval would also be rather long, as first lambing did not take place until ewes were about 22.5 mo old. Management should pay attention to all these factors in attempting to improve performance. Long term improvements might also be achieved by selecting for superior stock based on the heritability and repeatability estimates of the discrete components used in the indices.
BMDP 1983. BMDP Statistical software. University of California Press, Berkeley, USA.
Harvey W R. 1977. User's guide for LSML 76 least-squares and maximum likelihood computer program. Ohio State University, Columbus, USA.
McLeroy G B. 1961a. The sheep of the Sudan. 1. An extensive survey and system of classification. Sudan Journal of Veterinary Science and Animal Husbandry 2: 19-35.
McLeroy G B. 1961b. The sheep of the Sudan. 2. Ecotypes and tribal breeds. Sudan Journal of Veterinary Science and Animal Husbandry 2: 101151.
Rocha A, McKinnon D and Wilson R T. in press. Comparative performance of Landim and Blackhead Persian sheep in Mozambique. Small Ruminant Research.
SPSS Inc 1983. SPSS user's guide. McGraw Hill Book Company, New York, USA.
Tothill J D. 1948. Agriculture in the Sudan. Oxford University Press, London, UK.
Watson R M, Tippett C I, Rizk F. Jolly F. Beckett J J. Scholes V A O and Casbon F. 1979. Sudan national livestock census. Veterinary Research Administration, Khartoum, Sudan.
Wilson R T. 1983. Studies on the livestock of Southern Darfur, Sudan. VIII. A comparison of productivity indices for goats and sheep. Tropical Animal Health and Production 15: 6368.
Wilson R T and Clarke S E. 1975. Studies on the livestock of Southern Darfur, Sudan. I. The livestock resources and ecology of the area. Tropical Animal Health and Production 7: 167185.
Wilson R T and Light D. 1986. Livestock production in central Mali: Economic characters and productivity indices for traditionally managed goats and sheep. Journal of Animal Science 62: 567-575.
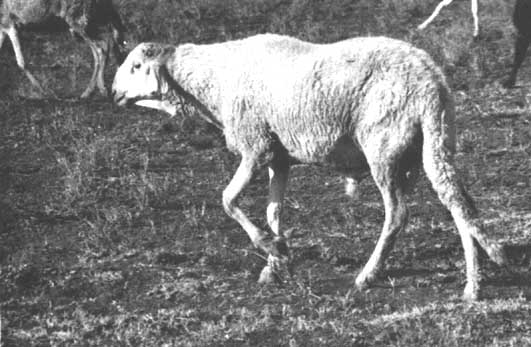
Sudan Desert ram of the Shugor sub-type at El Huda, Sudan
![]()
![]()
![]()


