4. Growing stock, biomass and carbon

Information on forest growing stock, biomass and carbon is essential for understanding the dynamics and productive capacity of forests and quantifying their contributions to ecosystem services and climate-change adaptation and mitigation. Growing stock – the volume of living trees in a forest – and its trends are key indicators for understanding a forest’s capacity to support woody vegetation and the extent to which that capacity is in use. Typically, estimates of forest growing stock are obtained using data from direct measurements of tree diameter, height and other characteristics complemented by species identification. Models that integrate remote sensing and ground-based data have also increasingly been applied to provide spatially explicit maps of forest growing stock.
Global forest growing stock has been assessed in all previous FRAs. For FRA 2025, countries and areas provided data on total growing stock and growing stock per ha, disaggregated by the following categories: naturally regenerating forest; primary forest (a subcategory of naturally regenerating forest); and planted forest and its subcategories – plantation forest, plantation forest composed of introduced species (a subset of plantation forest), and other planted forest.
FRA 2025 also collected information on the species composition of growing stock: countries were invited to report on the growing stock of the ten most common native and five most common introduced tree species, as well as the share of total growing stock held by native and introduced species. Information on species composition and the diversity of tree species is essential for sustainable forest management (SFM), the development of new tree-based products, biodiversity conservation and use, and the mitigation of, and adaption to, climate change.
Biomass and carbon stock are indicators of a forest’s capacity to sequester and store carbon. Collectively, forests constitute the largest terrestrial carbon sink, and they play a central role in the global carbon cycle. Accurate information on the status of, and trends in, the five forest carbon pools – that is, aboveground biomass, belowground biomass, deadwood, litter and soil – is essential for understanding the role of forests in the global carbon cycle and for the implementation of effective climate-change mitigation and adaptation strategies.
FRA 2025 adheres to the Intergovernmental Panel on Climate Change (IPCC)’s guidelines for national greenhouse-gas inventories, using its definitions for each of the carbon pools (IPCC, 2006, 2019). Countries and areas are also encouraged to follow these guidelines. Discrepancies exist, however, between the data reported to the FRA and those submitted to the UNFCCC, largely because of differences in forest definitions; the forests included in reporting (the UNFCCC requests countries to report on “managed forests” only, which may not comprise the entire forest resource); and differences in the methods used for calibration, reclassification, estimation and forecasting.
Compared with FRA 2020 (FAO, 2020), there is a notable increase in FRA 2025 in reporting coverage for growing stock, biomass and carbon through national forest inventories, both in the number of reporting countries and areas and the forest area covered. Enhanced metadata provision on the FRA Platform also facilitated more in-depth analysis of underlying data sources. Historical data are sparse, however, because few countries and areas have multiple comparable national forest inventory datasets spanning the FRA reporting years. Therefore, for some countries and areas, changes in average growing stock per ha have been inferred from changes in the relative area of different forest types (as described above) rather than from direct forest remeasurement. Although overall data coverage has improved, information on growing-stock composition – especially the proportion of native and introduced tree species – is still limited at the global level (only 95 countries and areas fully reported). Moreover, default IPCC conversion factors rather than country-specific models were applied in many cases to derive biomass and carbon estimates from growing stock. Estimates of carbon in deadwood, litter and soil are particularly weak in Africa and Asia, with many countries and areas unable to report on these carbon pools. Given the importance of growing-stock composition and soil organic carbon, support for countries to improve those estimates is a pressing need for future assessments.
Several countries with large forest areas revised their estimates of growing stock, biomass and forest area, particularly by incorporating new national forest inventory data (as described above). These revisions have had significant impacts on global estimates, resulting in higher values for growing stock, biomass and carbon compared with FRA 2020. Notably, the Russian Federation substantially updated its values for growing stock and forest area; the United States of America revised its estimates of biomass and carbon; and Canada updated its forest-area estimates – all three countries drew on new national forest inventory data for their revisions. In addition, some African countries, including the Democratic Republic of the Congo and the Central African Republic, revised their forest-area estimates to include open forests, leading to higher estimates of growing stock and biomass in those countries.
FRA 2025 received information on growing stock in 2025 from 216 countries and areas representing 97 percent of the global forest area. For countries and areas that did not provide information on growing stock, estimates were made by either applying subregional averages of growing stock per ha to total forest area or using data from neighbouring countries and areas with similar ecological conditions.
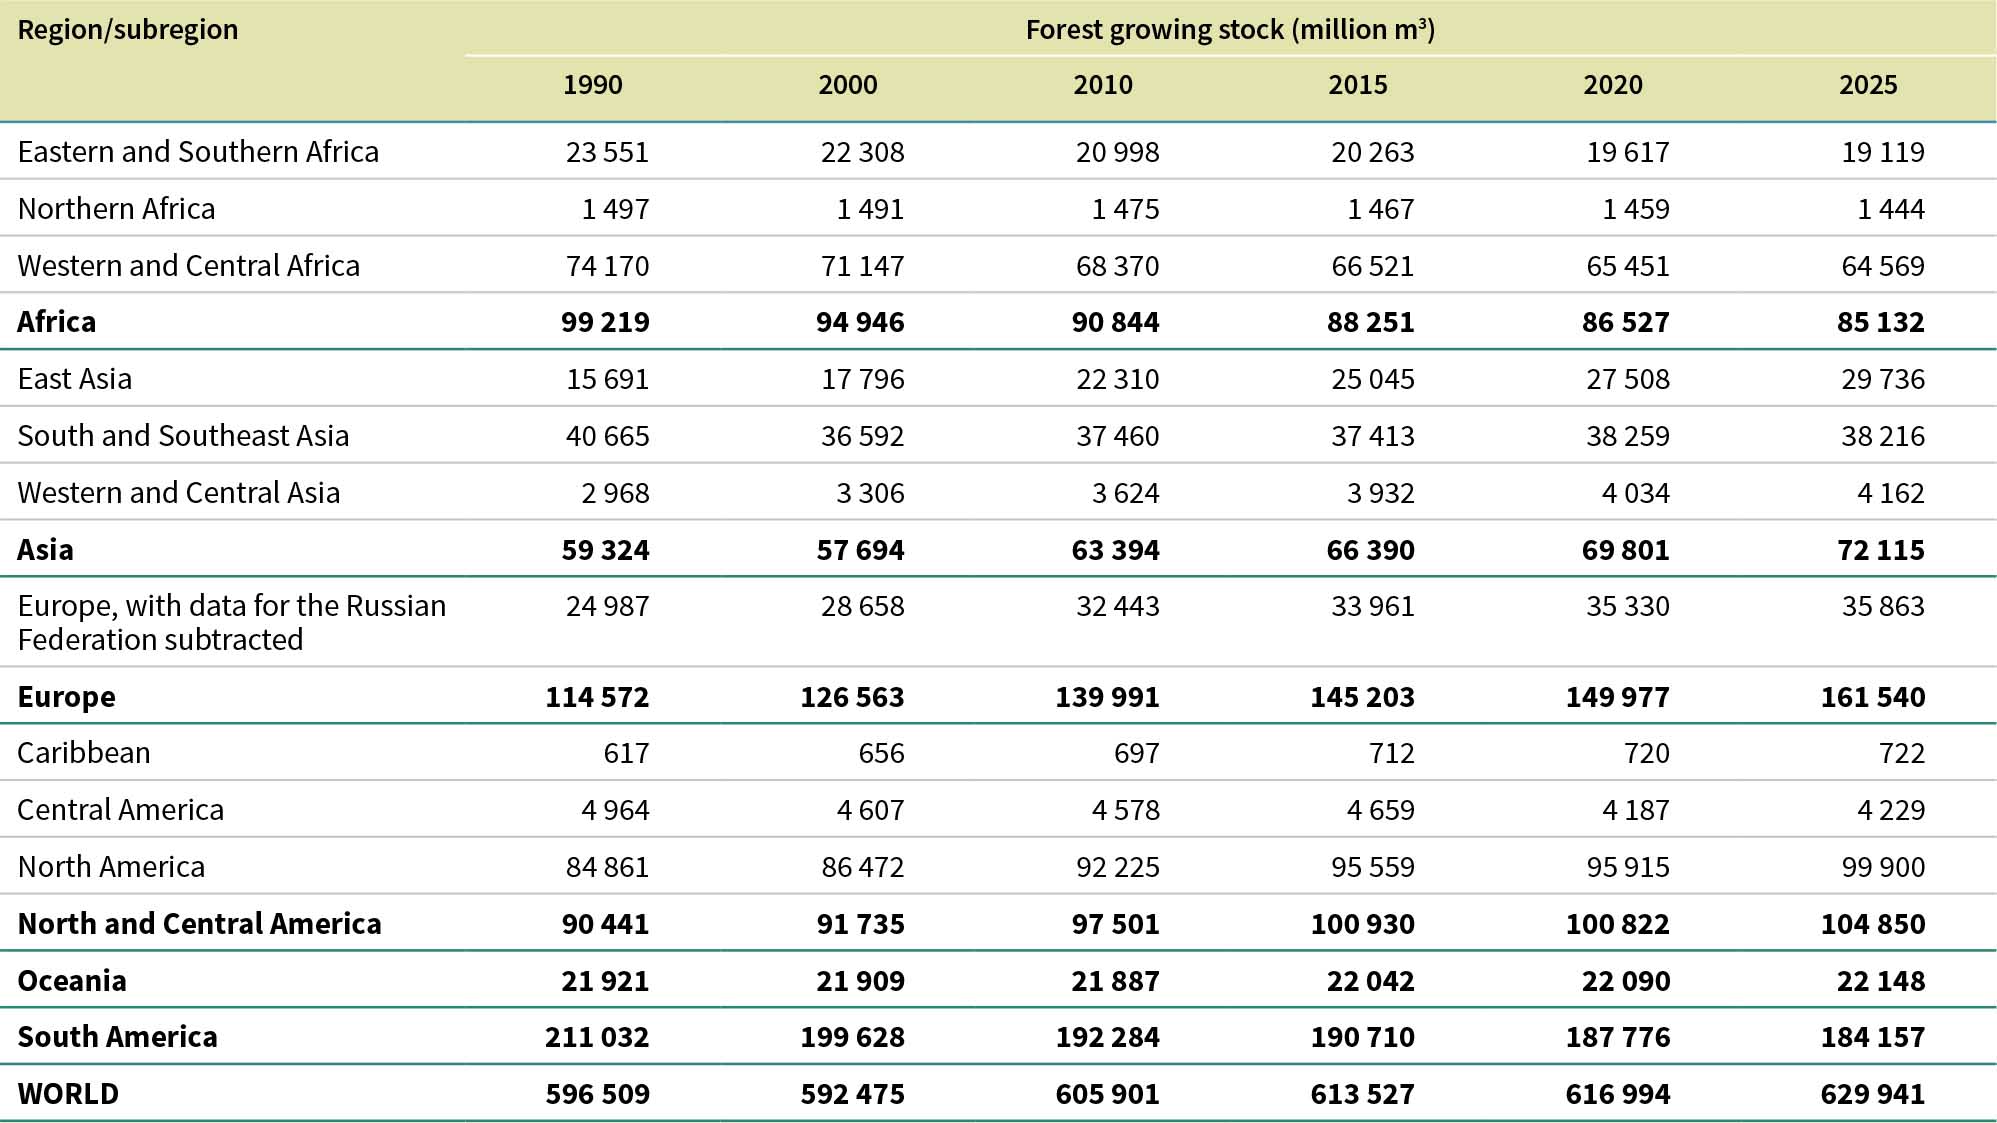
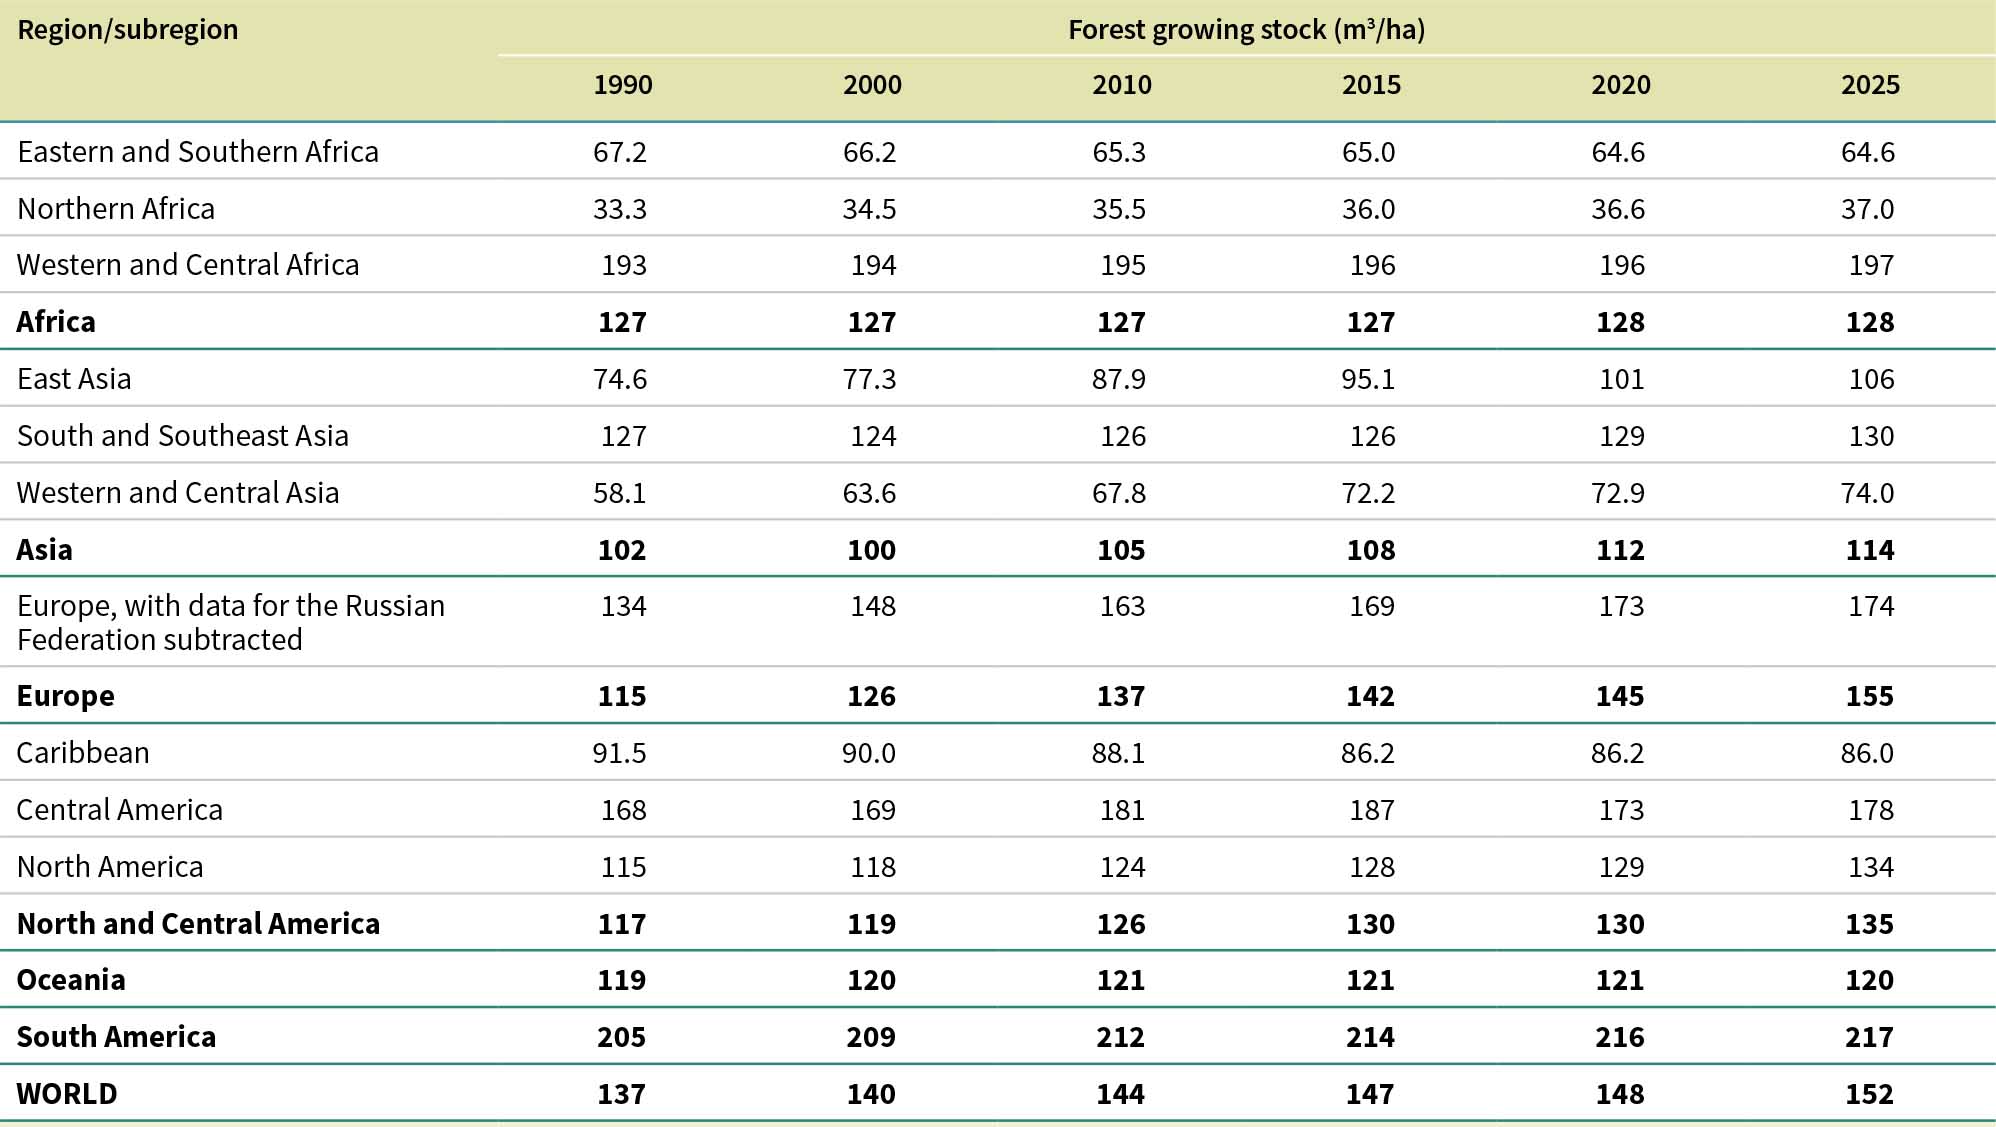
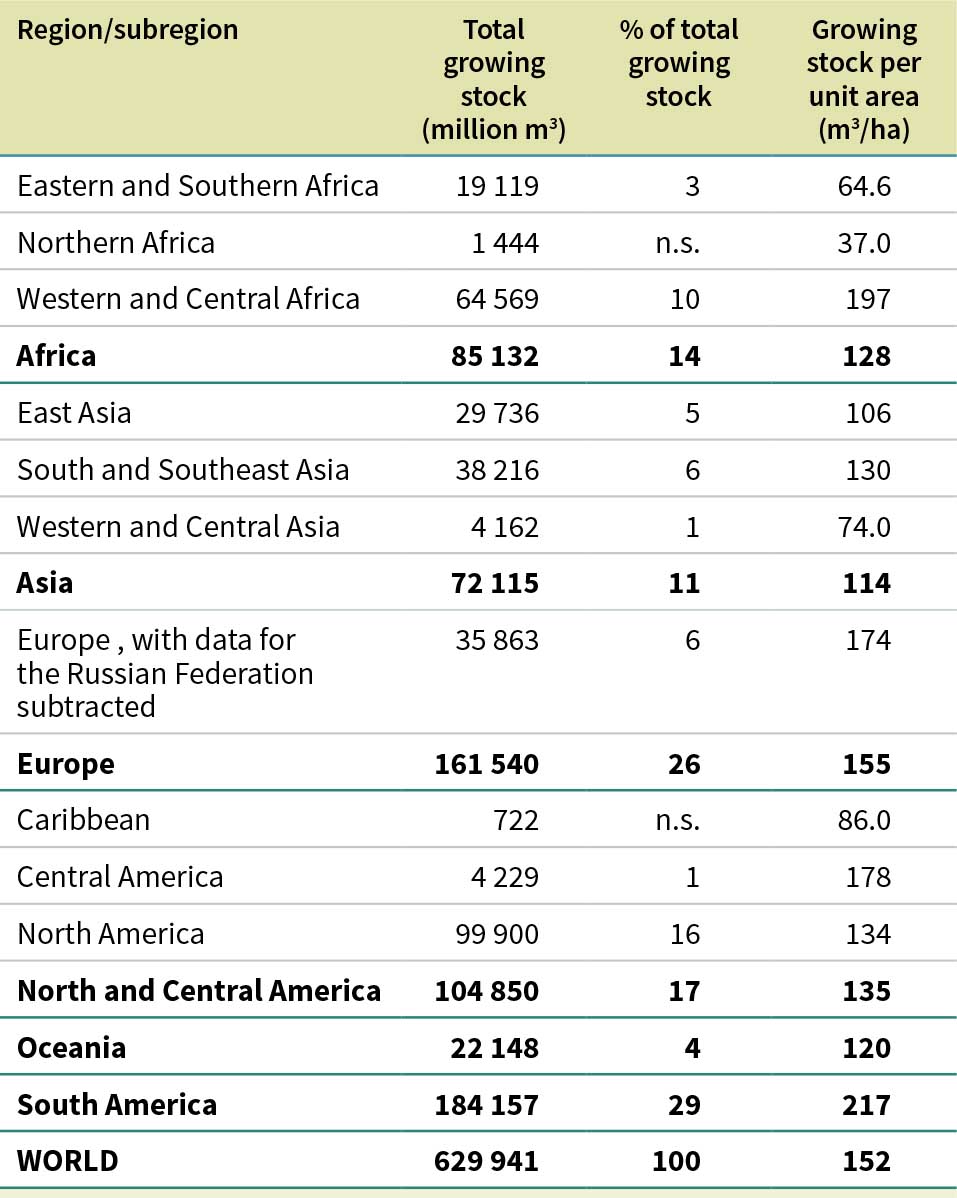
The global forest growing stock is estimated at 630 billion m3, with the largest share in South America (29 percent), followed by Europe (26 percent) (Table 36; Figure 17). Globally, the average growing stock per unit area is estimated at 152 m3 per ha, with the highest values in tropical regions, led by South America (217 m3 per ha), Western and Central Africa (197 m3 per ha) and Central America (178 m3 per ha). Of the regions in which temperate and boreal forests predominate, the highest growing stock per unit area is in Europe (data for the Russian Federation subtracted), at 174 m3 per ha.
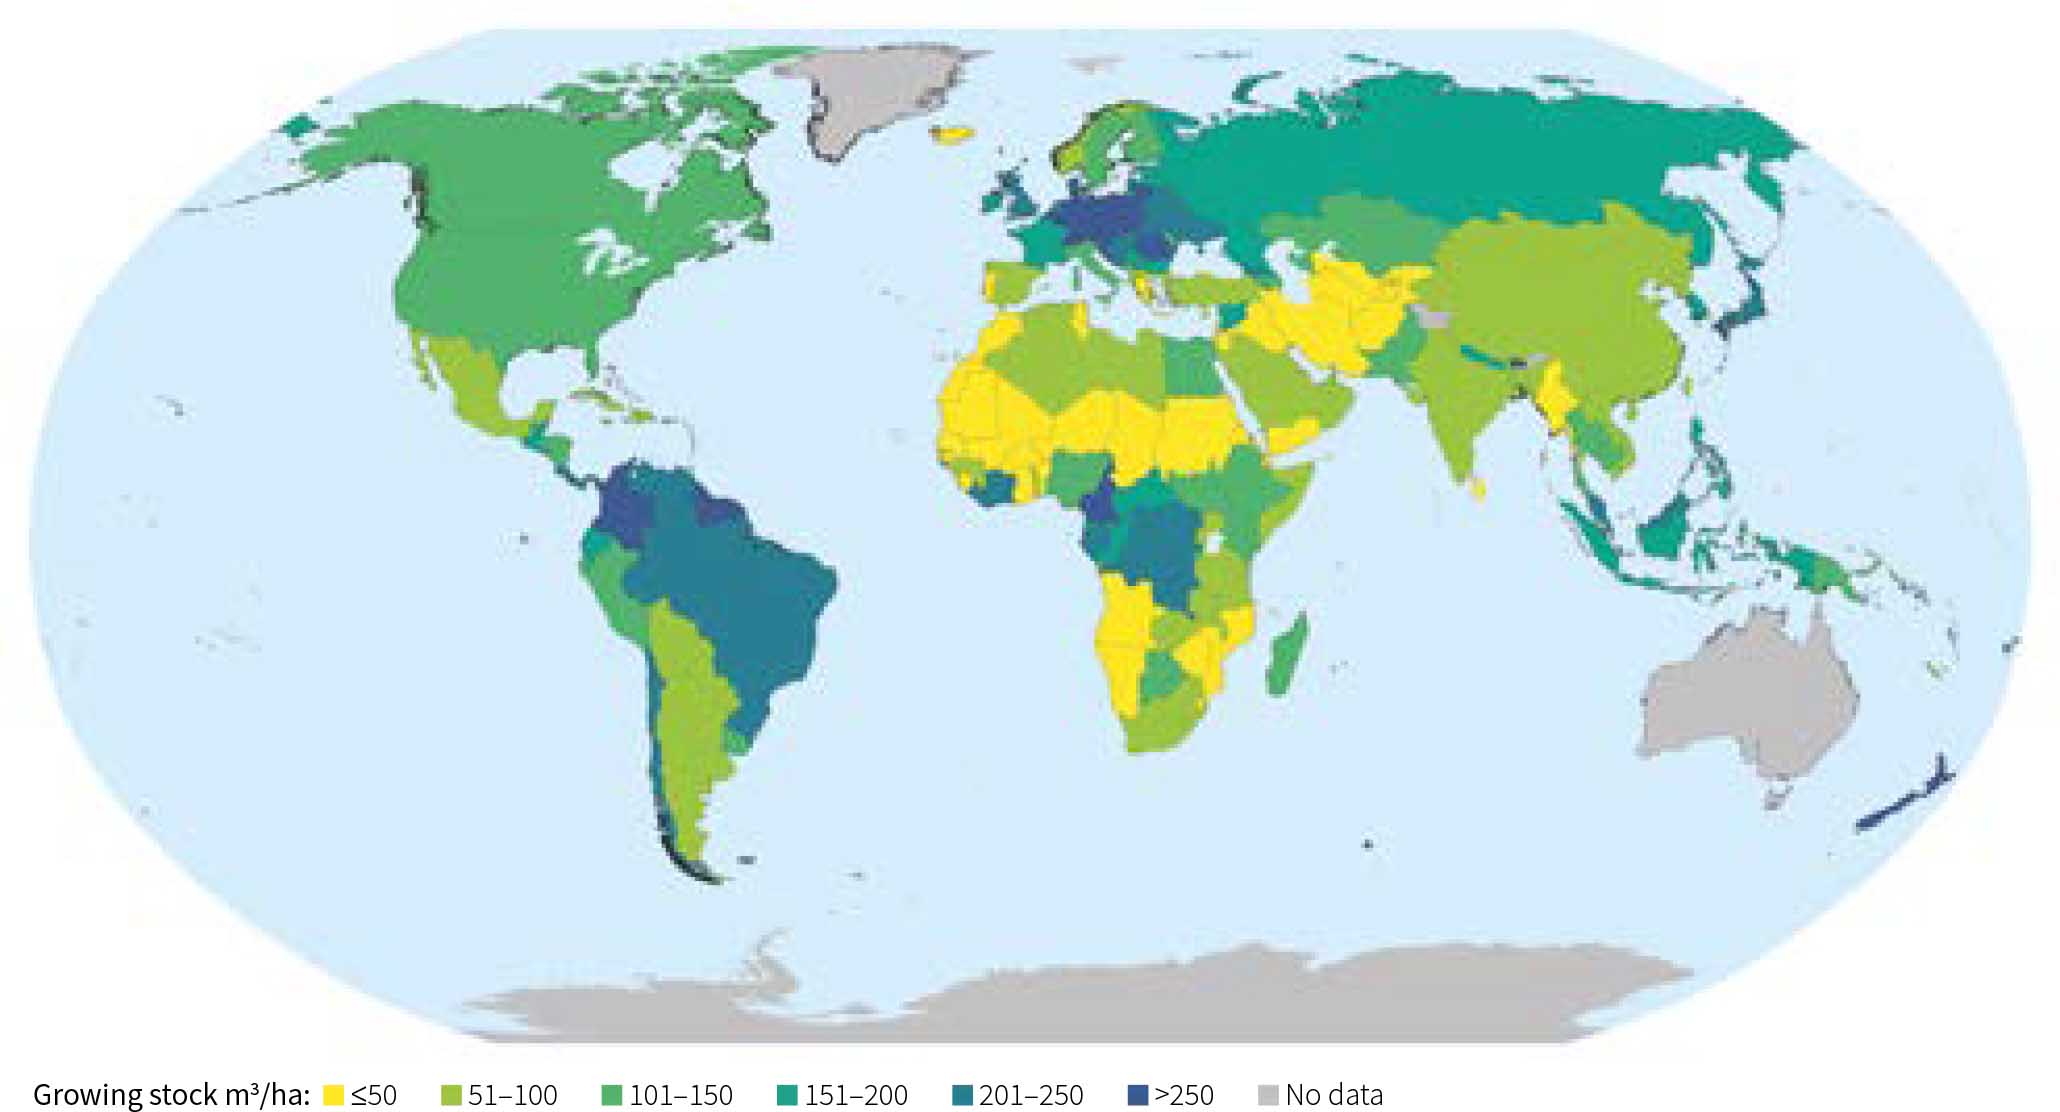
Note: Refer to the disclaimer on page ii for the names and boundaries used in this map. Dotted line represents approximately the Line of Control in Jammu and Kashmir agreed upon by India and Pakistan. The final status of Jammu and Kashmir has not yet been agreed upon by the parties. Final boundary between the Republic of Sudan and the Republic of South Sudan has not yet been determined. Final status of the Abyei area is not yet determined.
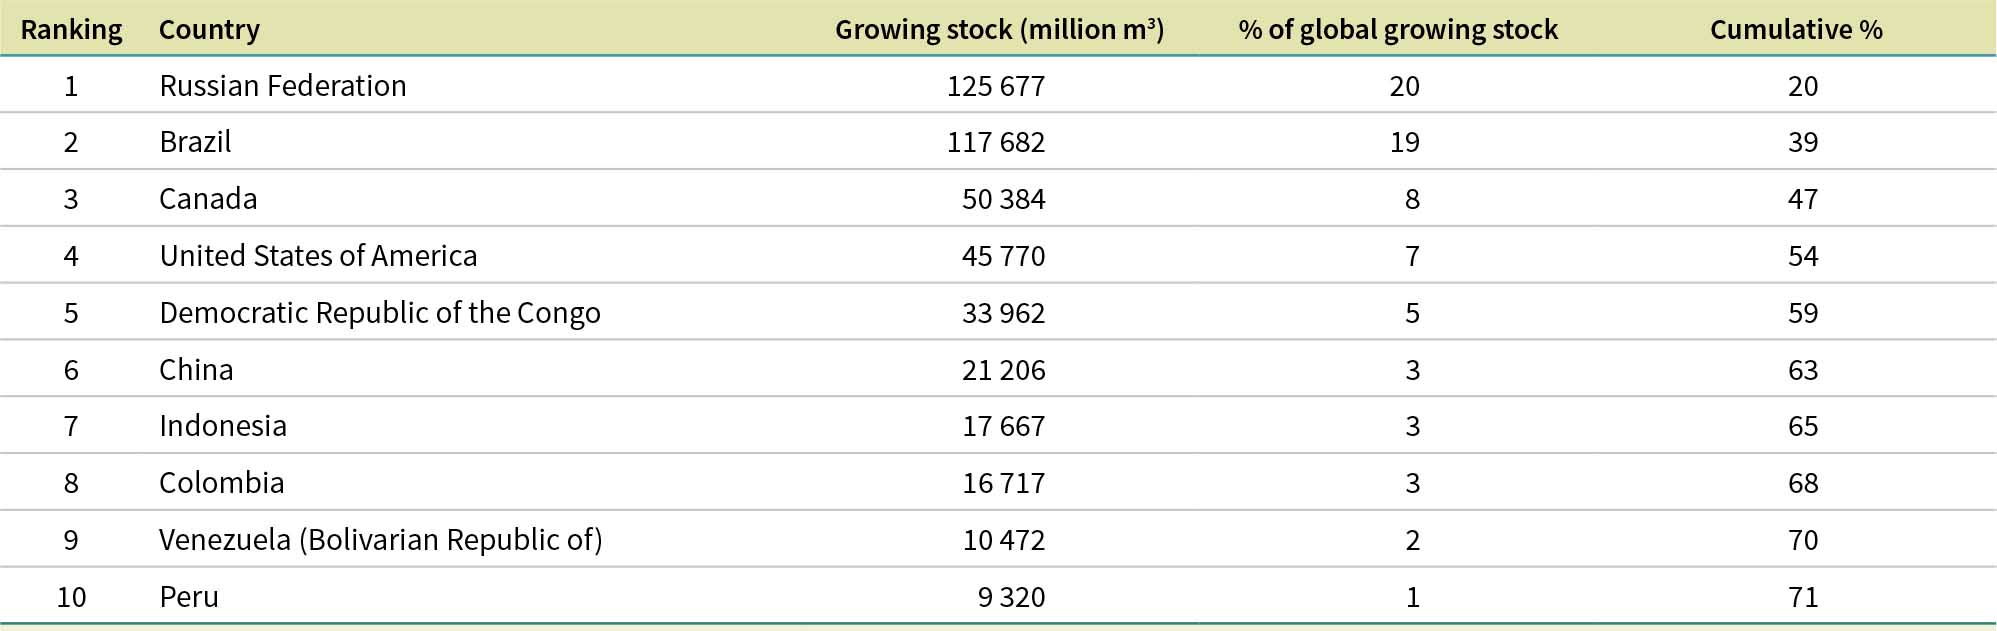
Almost 40 percent of the global growing stock is in two countries – the Russian Federation (126 billion m3, or nearly 20 percent of the global total) and Brazil (118 billion m3). Other countries with 5 percent or more of the global growing stock are (in descending order, by volume) Canada, the United States of America and the Democratic Republic of the Congo (Table 37).
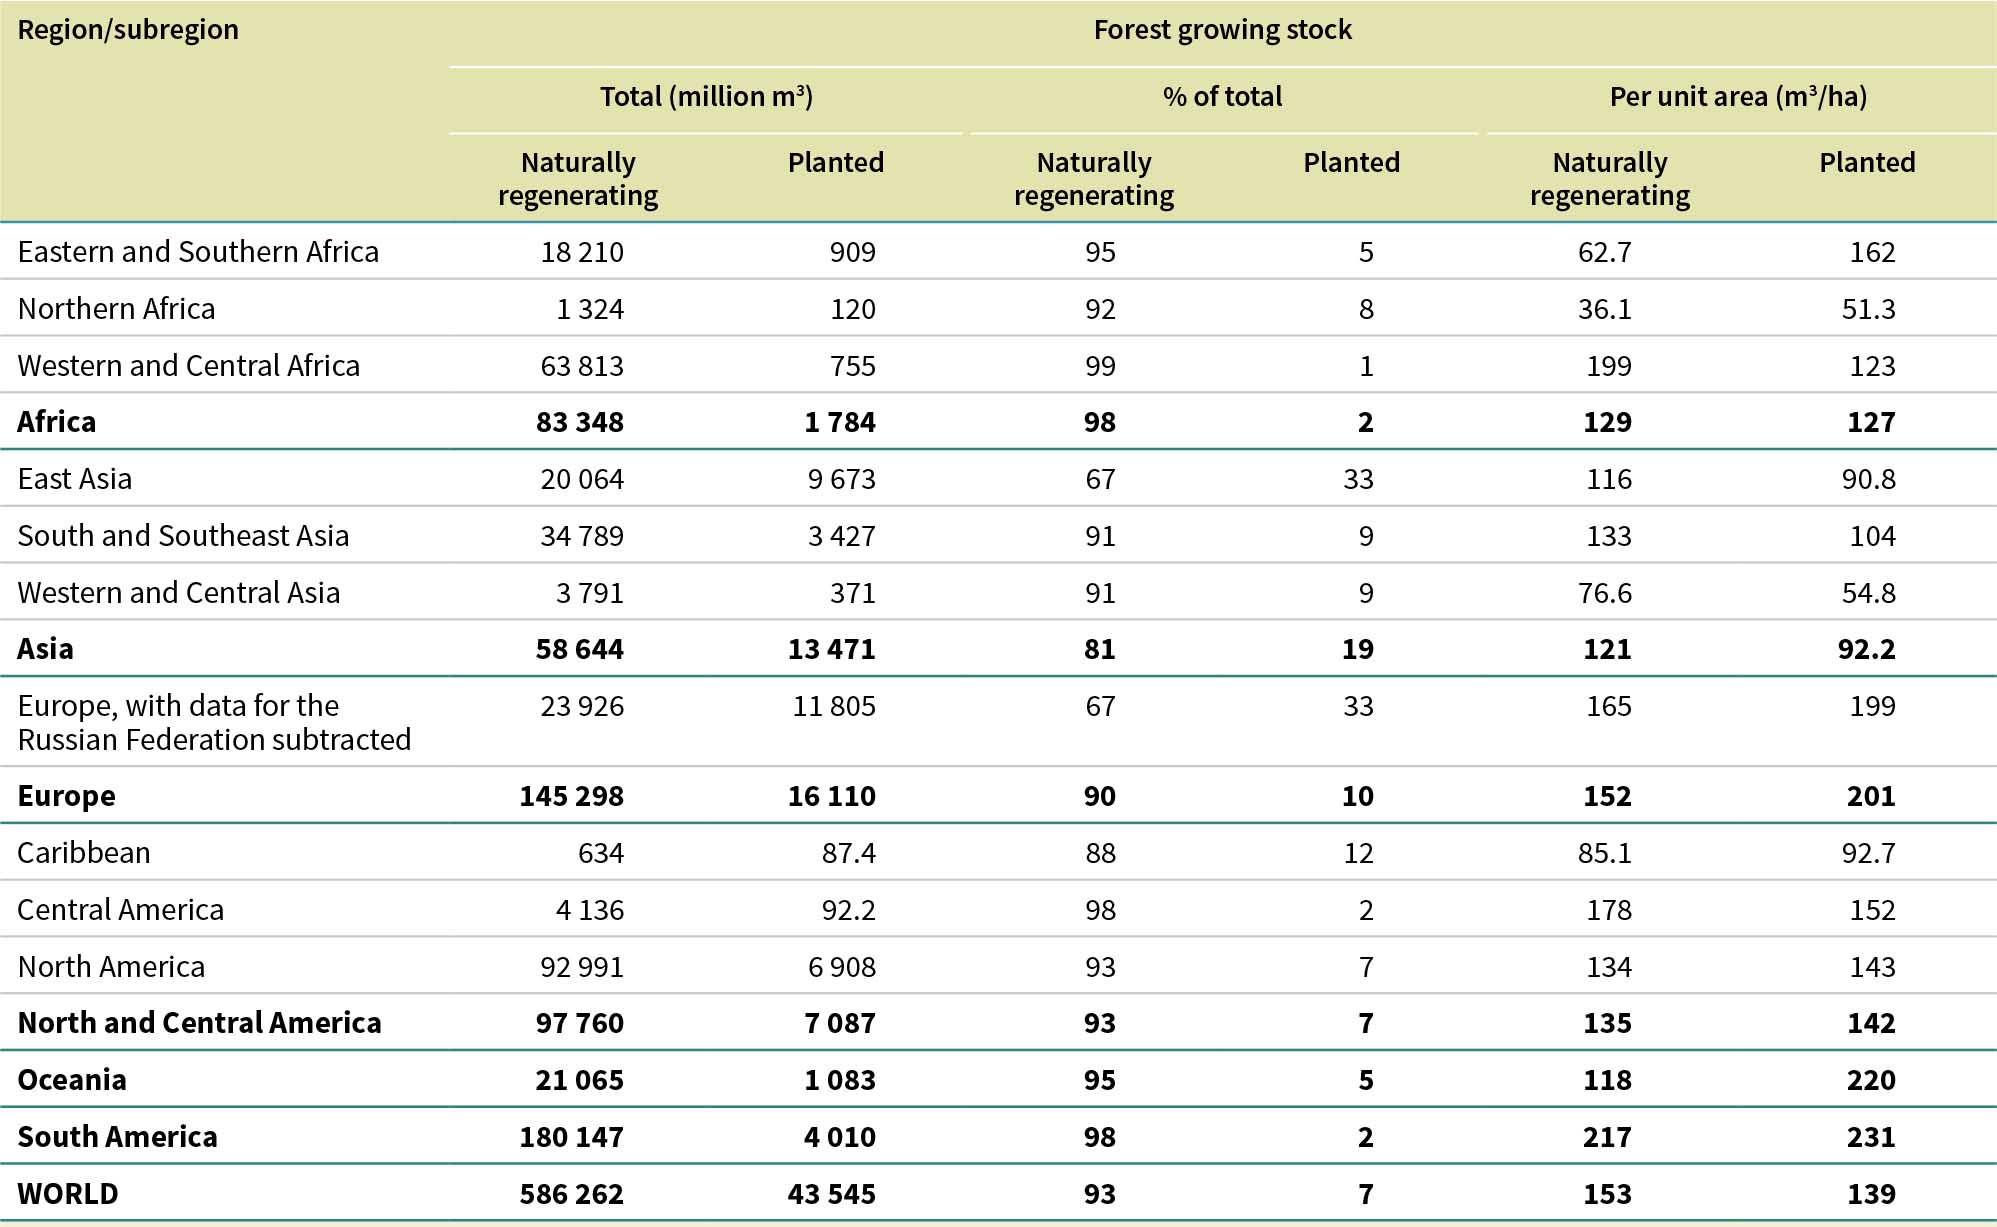
FRA 2025 received data on the distribution of growing stock in the two main forest categories (naturally regenerating forest and planted forest) from 177 countries and areas representing 83 percent of the world’s forest area and 91 percent of the total forest growing stock. For countries and areas that did not provide this information, estimates were made by applying forest growing stock per unit area to the total area of naturally regenerating forest and total area of planted forest. In combination, these methods enabled the inclusion in the analysis of 229 countries and areas representing nearly 100 percent of the total forest area and growing stock.
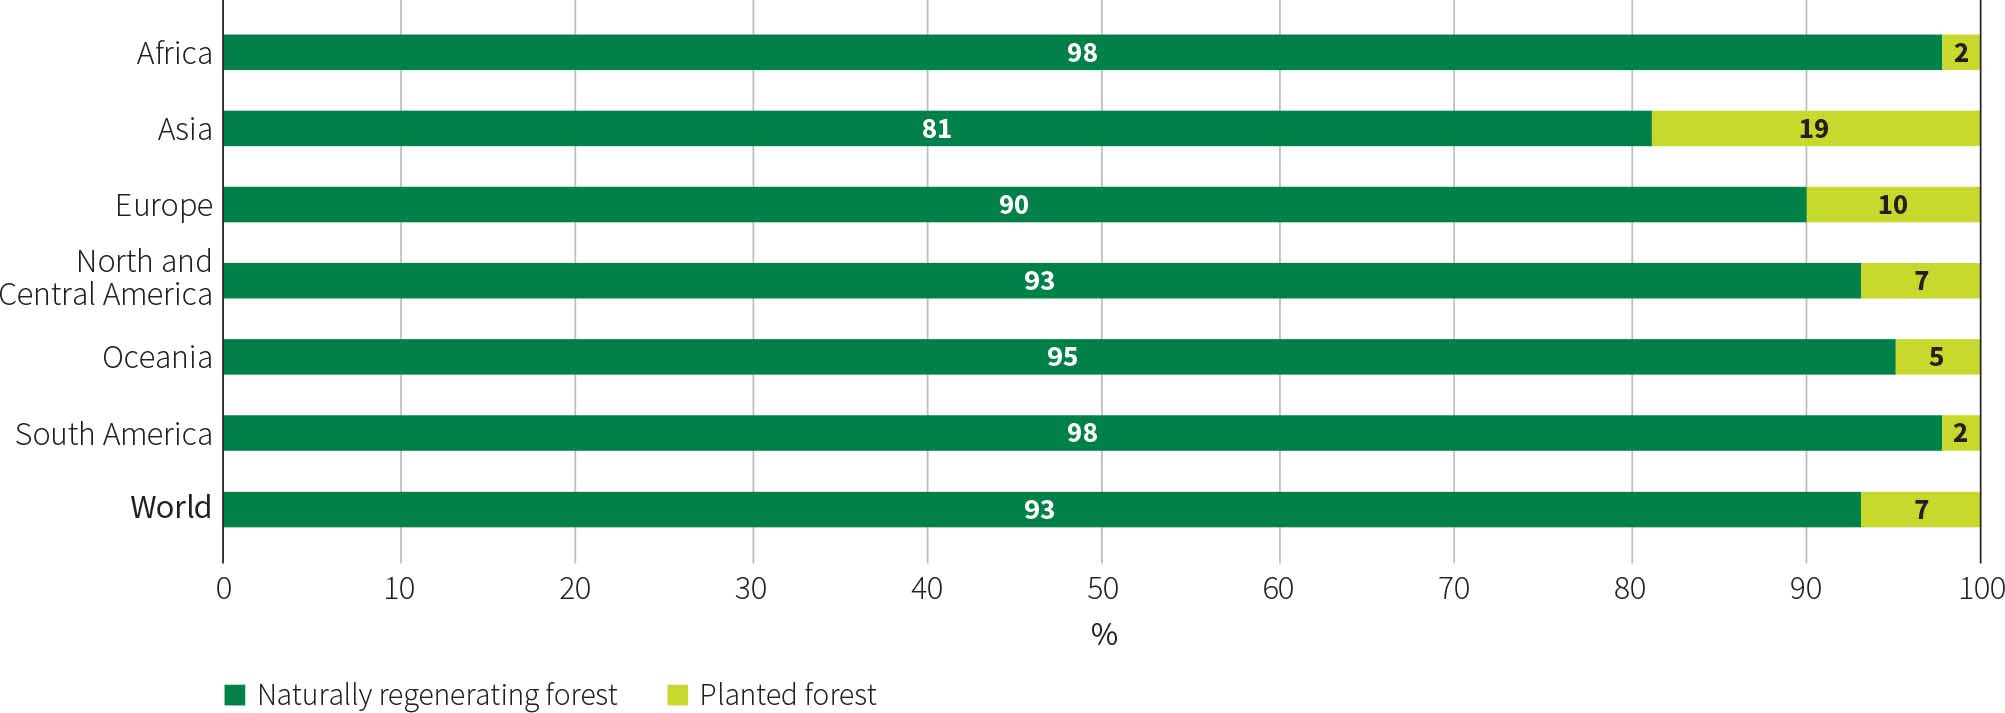
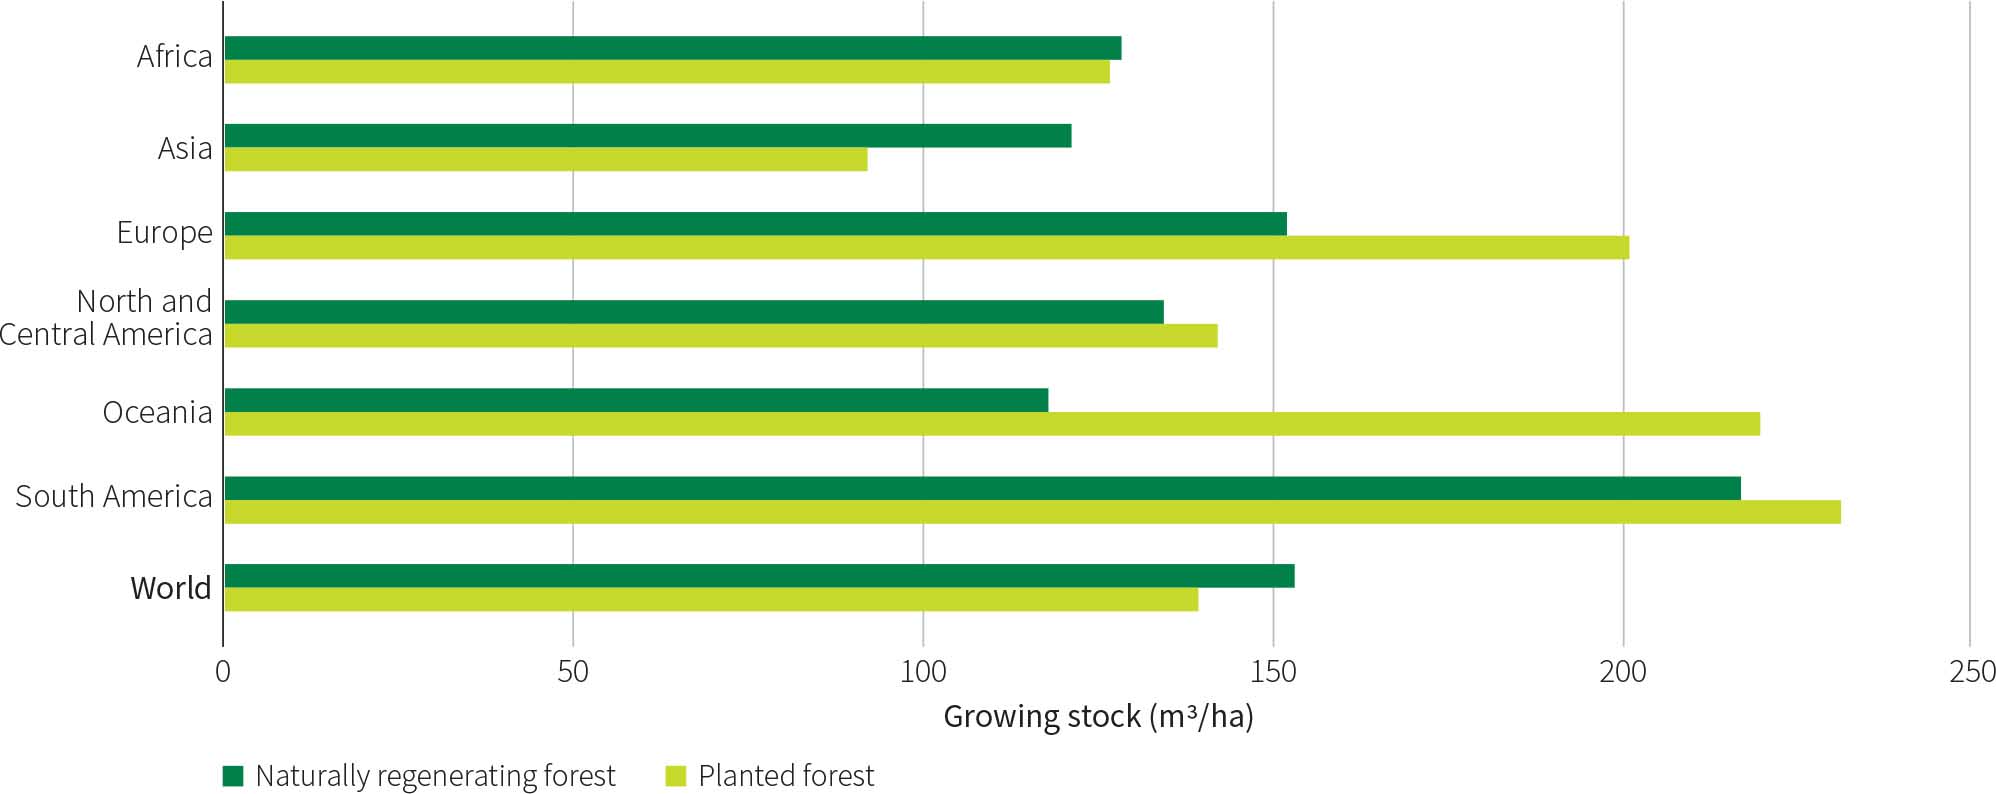
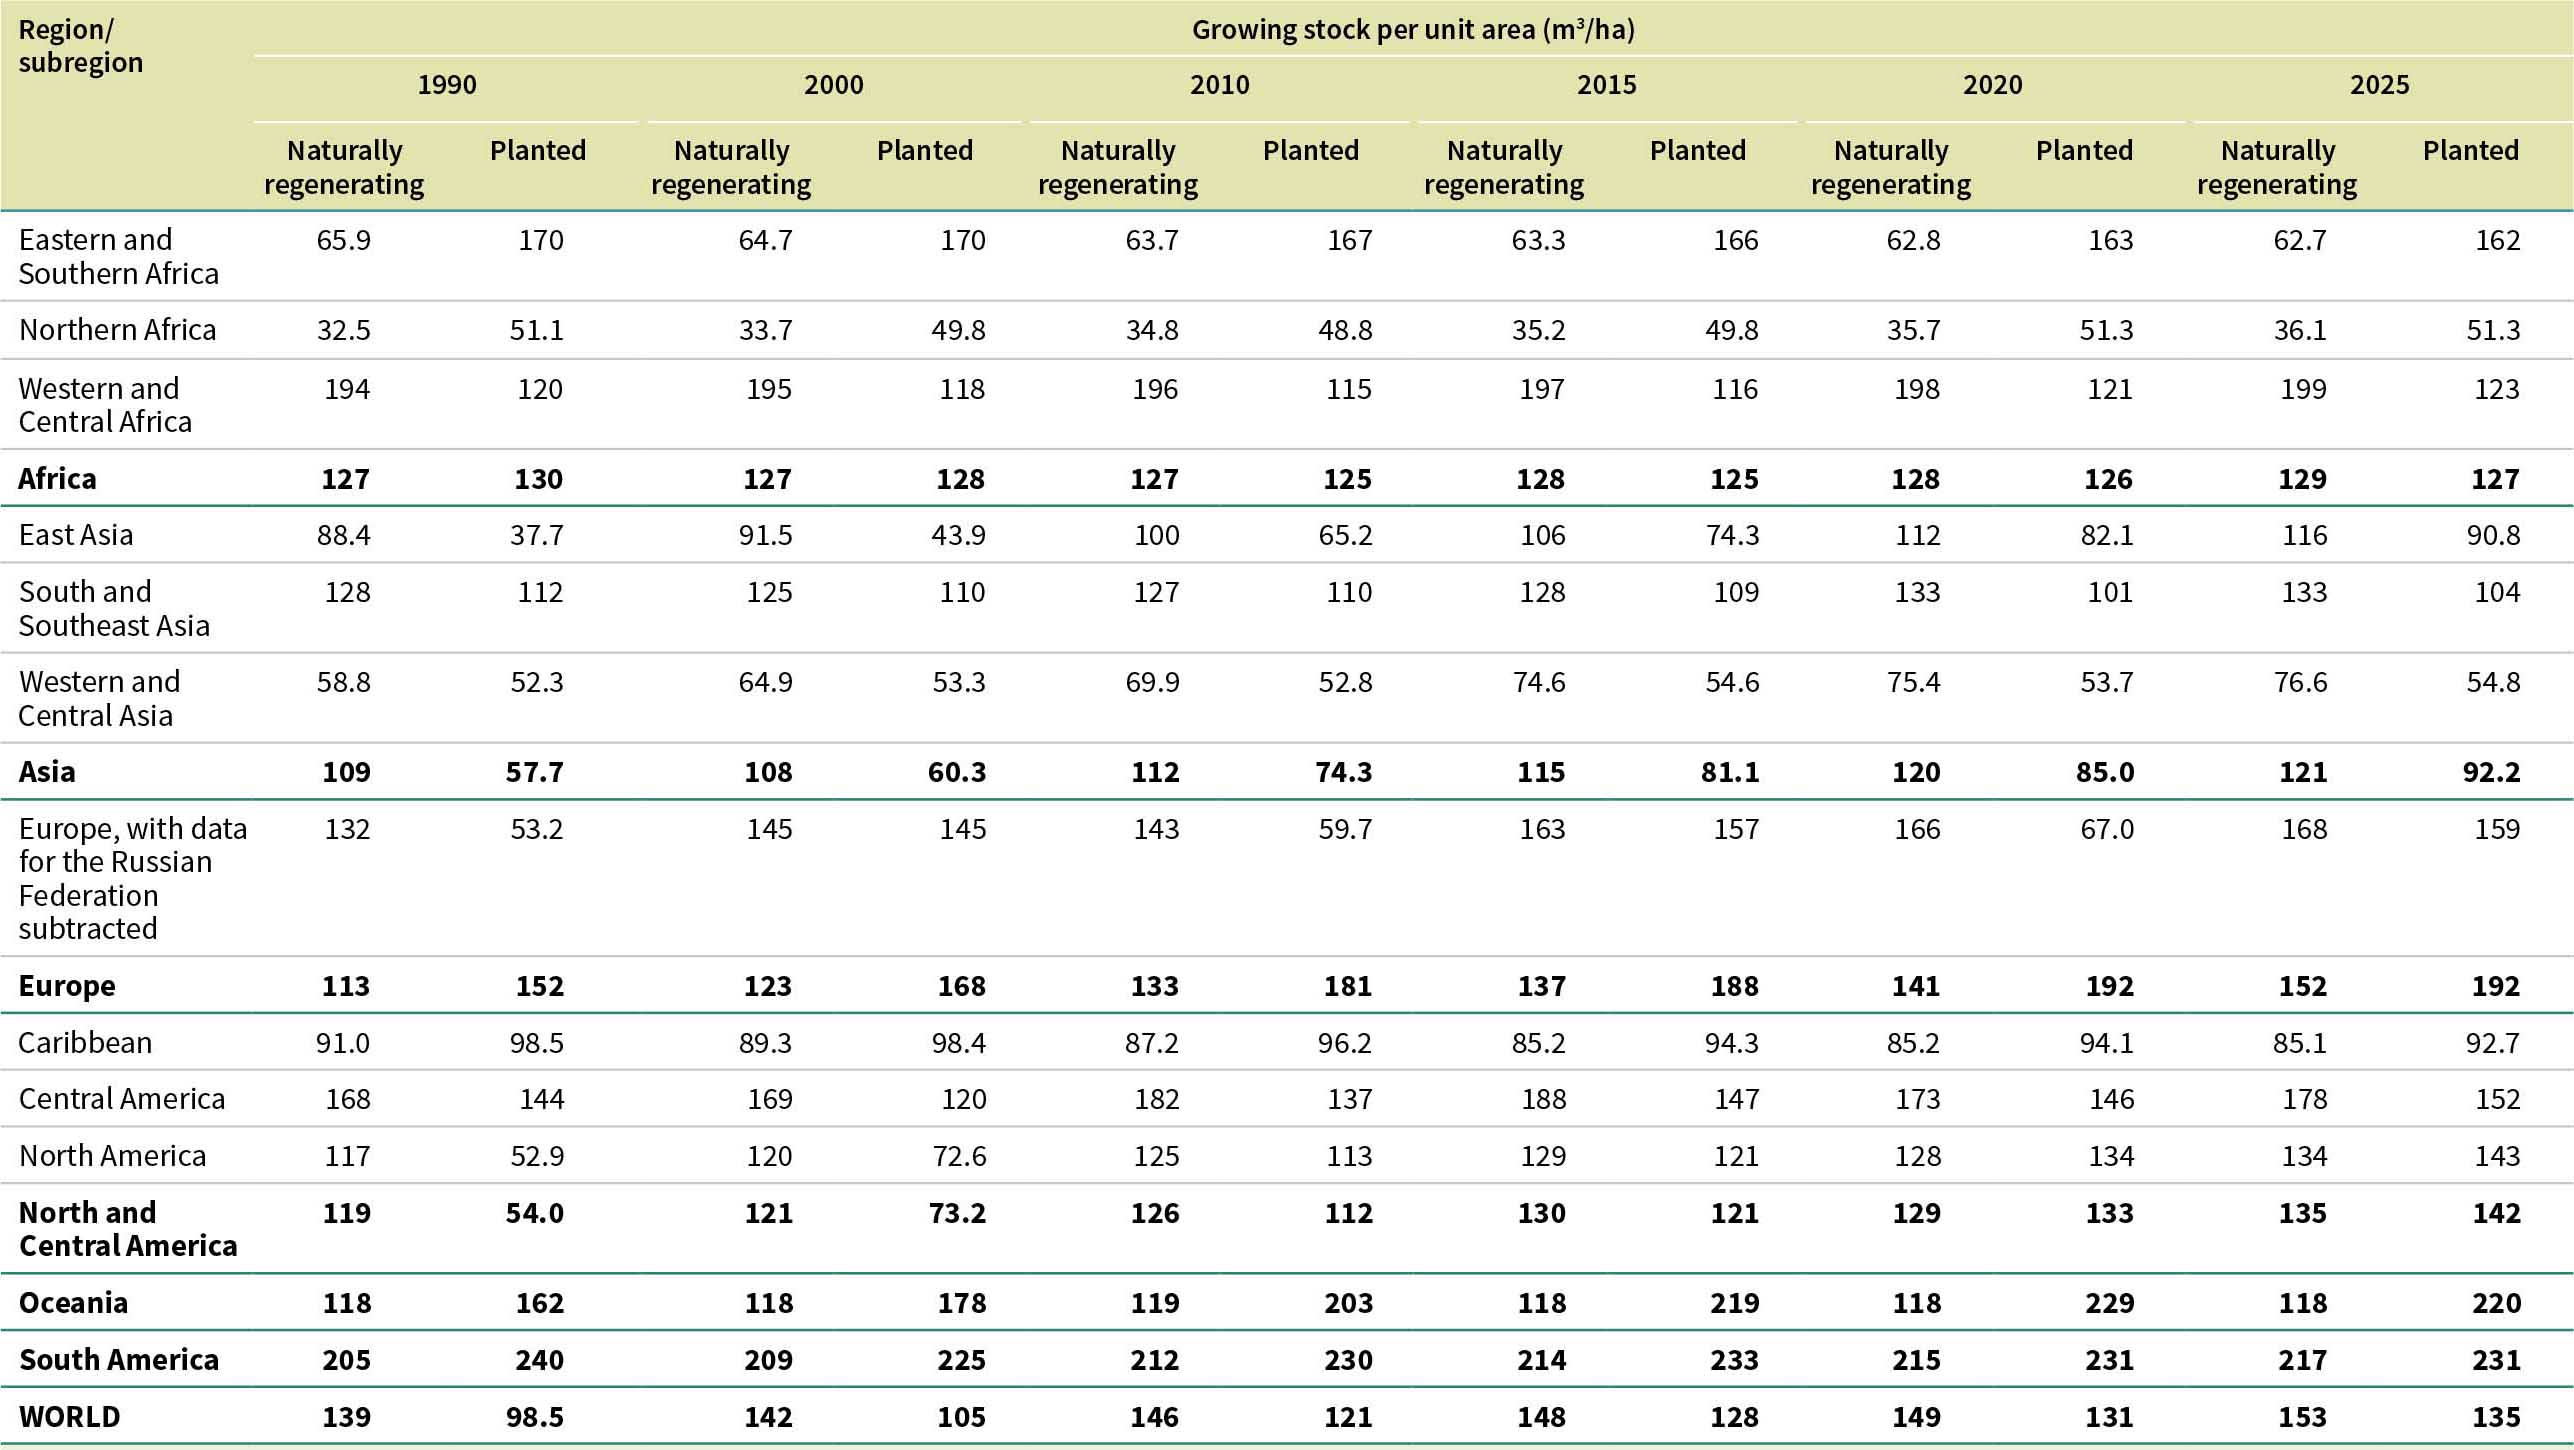
Globally, 93 percent of the total growing stock in 2025 is in naturally regenerating forest, and planted forests account for 7 percent. At the global level, the average growing stock per unit area is higher in naturally regenerating forest (153 m3 per ha) than in planted forest (139 m3 per ha) (Table 38). This is due partly to the global increase in planted forests in the last few decades, with younger planted forests not yet reaching peak growing-stock volume, and partly to the higher frequency of harvesting in planted forests. Of the regions, Asia reported the highest proportion of growing stock in planted forests (19 percent), driven by East Asia. Africa and South America reported the lowest proportions (Figure 18 and Figure 19).
Primary forests support an estimated one-third (33 percent) of the total forest growing stock, at 206 billion m3 (Table 39). Of the regions, South America has the largest proportion of the world’s primary-forest growing stock (11 percent), followed by Europe (7 percent). The volume of primary-forest growing stock as a percentage of total growing stock is highest in South America (39 percent), followed by Africa (37 percent) and North and Central America (35 percent).
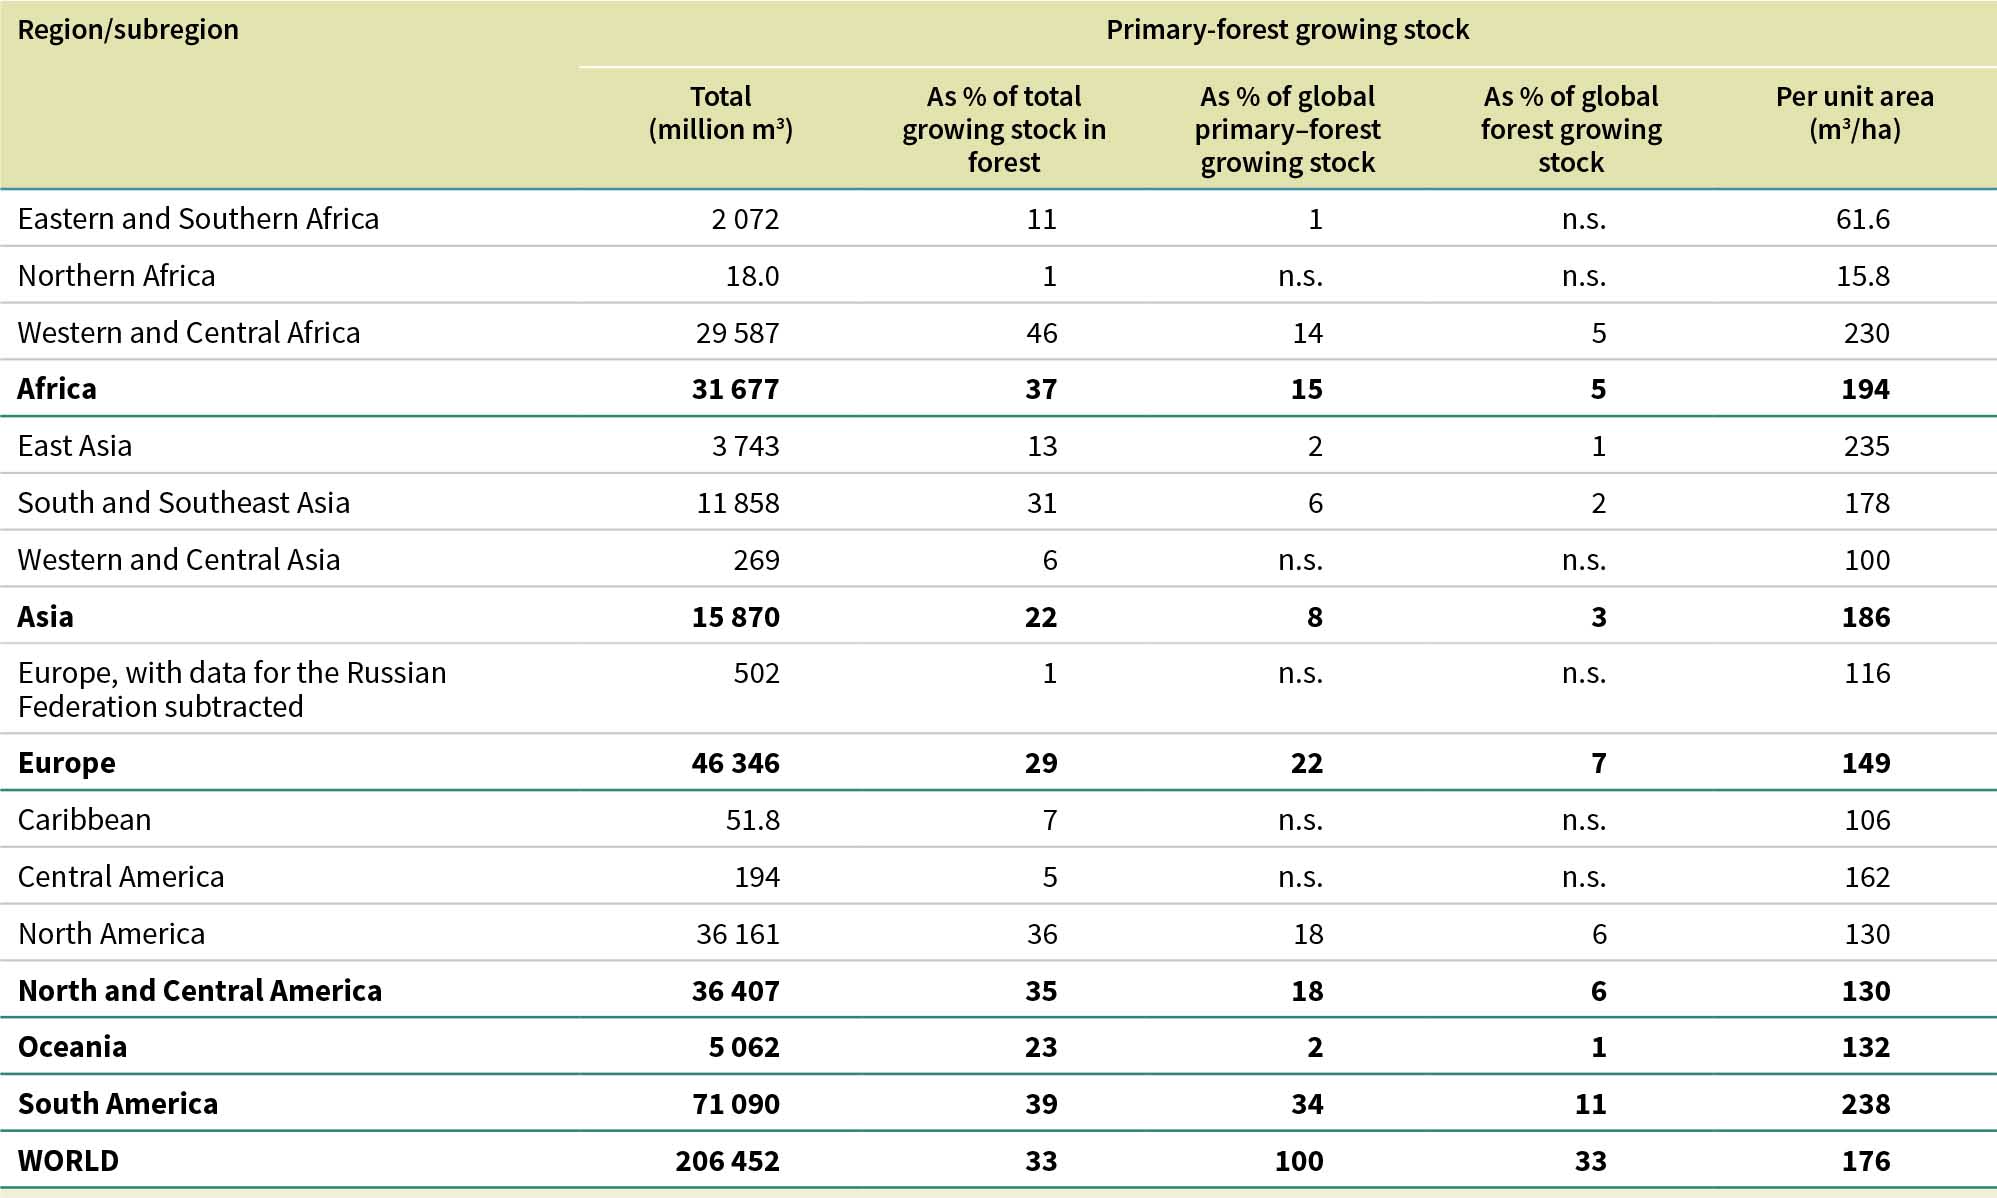
Of the subregions, Western and Central Africa stands out for its high proportion of total growing stock in primary forests (46 percent). Globally, the average growing stock in primary forests is estimated at 176 m3 per ha, with a notably high density in South America (238 m3 per ha).
Although only 85 countries and areas provided specific data on growing stock in primary forests, the analysis here covers all 167 countries and areas that reported having primary-forest area. For the 82 countries and areas that reported having primary forests but did not report on primary-forest growing stock, estimates were derived by applying the average growing stock per ha in naturally regenerating forests to primary forests. This approach likely underestimates the global primary-forest stock because growing-stock densities are typically higher in primary forests than in naturally regenerating forest (as indicated for most countries and areas reporting on this variable).
FRA 2025 received data on growing stock in plantation forests in 2025 from 183 countries and areas representing 93 percent of the global area of this subcategory of planted forests; on growing stock in plantation forests composed of introduced species from 155 countries and areas representing 68 percent of the global area of this subcategory; and on growing stock in other planted forests from 180 countries and areas representing 82 percent of the global area of this subcategory.
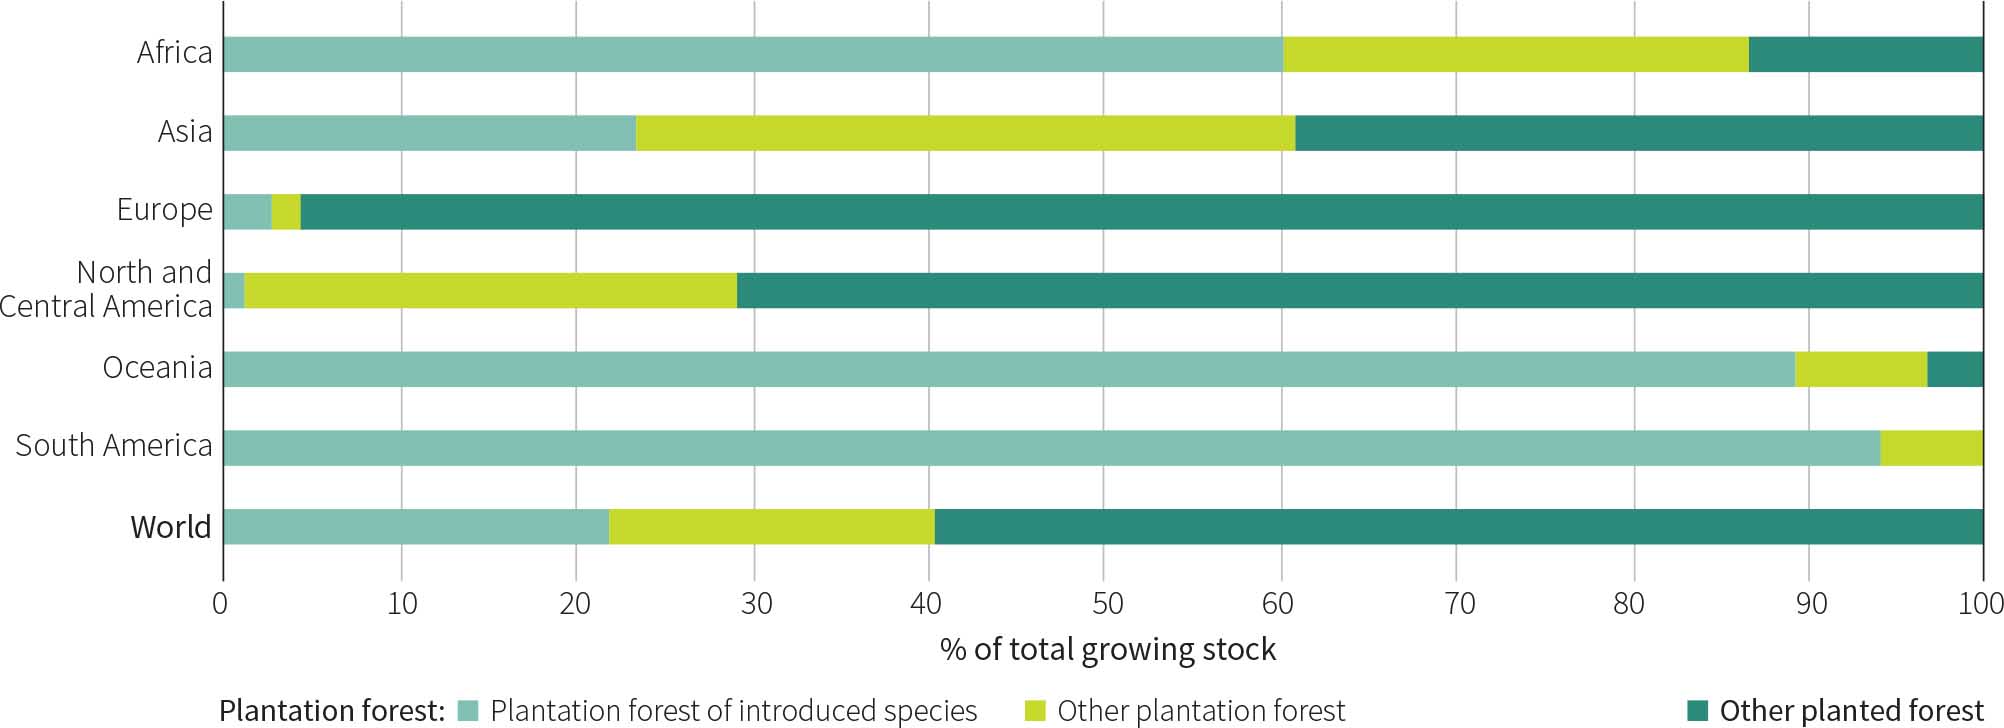
Plantation forests account for 3 percent of the total forest growing stock in 2025 and for 40 percent of the total planted-forest growing stock (Table 40). Other planted forests contribute 4 percent of the total forest growing stock and 60 percent of the total planted-forest growing stock.
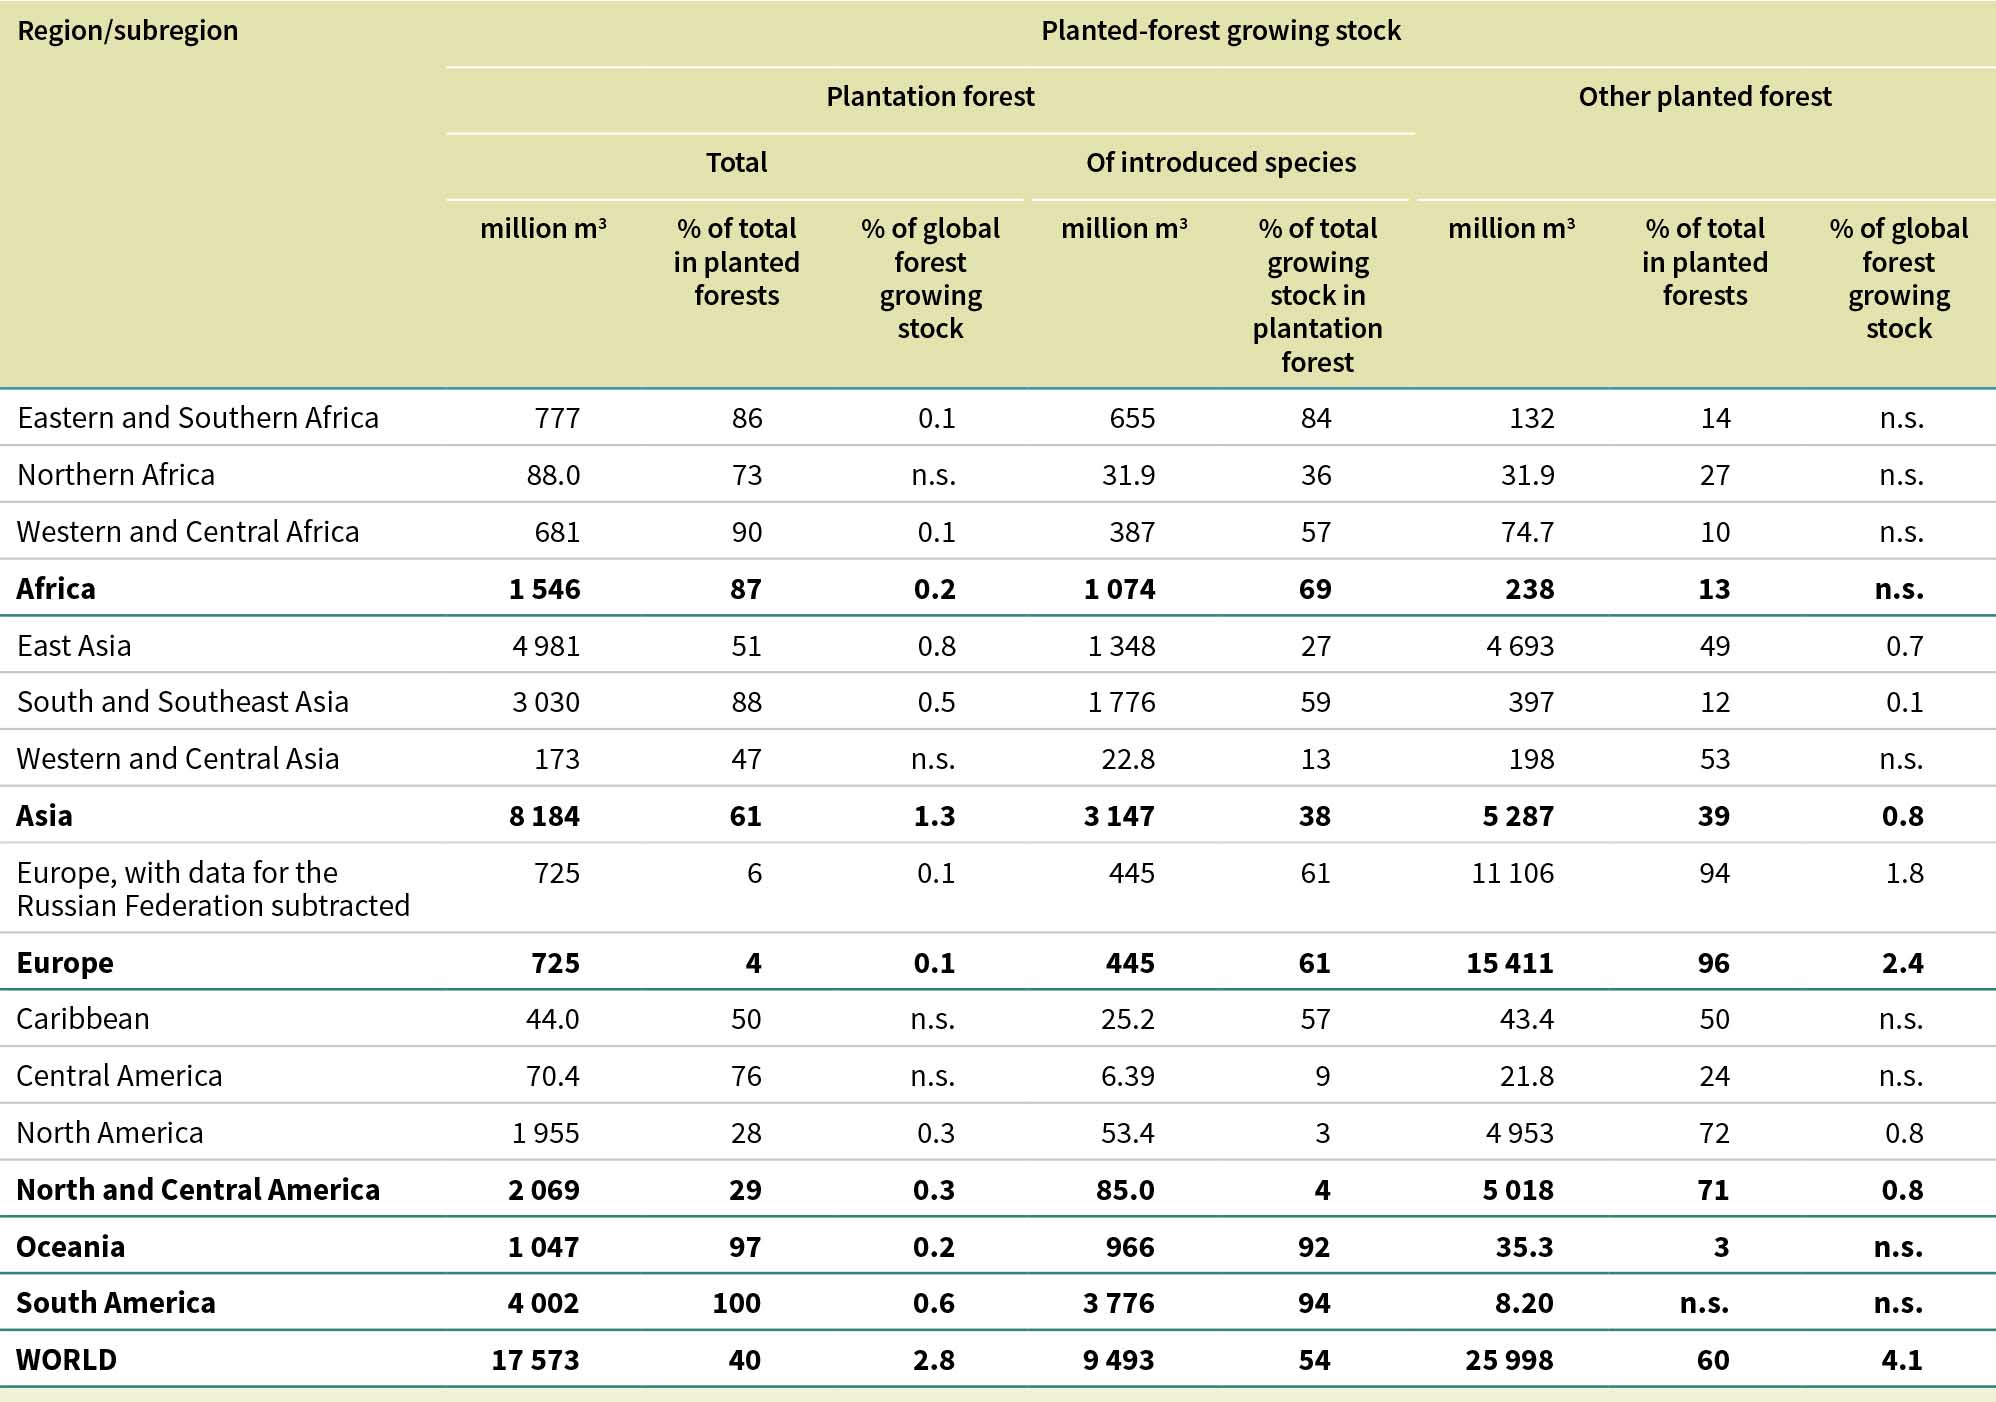
Of the regions, Asia has the largest volume of growing stock in plantation forests, at 8.18 billion m3, which is 47 percent of the global plantation-forest growing stock, followed by South America (4.0 billion m3, 23 percent). Nearly all (99.8 percent) of the planted-forest growing stock in South America is in plantation forests; the proportions are also high in Oceania (97 percent) and Africa (87 percent) (Figure 20). Conversely, plantation forests constitute only a small share (4 percent) of the planted-forest growing stock in Europe.
Globally, 54 percent of the plantation-forest growing stock is composed of introduced species. Of the regions, South America has the highest total volume (3.78 billion m3) of plantation forests of introduced species in 2025; its planted-forest area is composed mostly (94 percent) of this subcategory.
At the global level, average growing-stock density is higher in other planted forests (168 m3 per ha) than in plantation forests (112 m3 per ha), although this varies by region. Plantation forests composed of introduced species – which are often fast-growing – exhibit higher growing-stock densities (146 m3 per ha) than the overall average for plantation forests.
One hundred and thirty-two countries and areas representing 65 percent of the global area of OWL reported data on growing stock for this category. Where data were unavailable, subregional averages of growing stock per unit area were applied to estimates of OWL area to estimate growing stock. Given the relatively low coverage of data for OWL area and growing stock, the results presented here should be viewed with caution.
The total volume of growing stock in OWL in 2025 is estimated at 20.2 billion m3 (3 percent of the world’s forest growing stock) (Table 41). Of this, 44 percent is in Europe, primarily the Russian Federation.
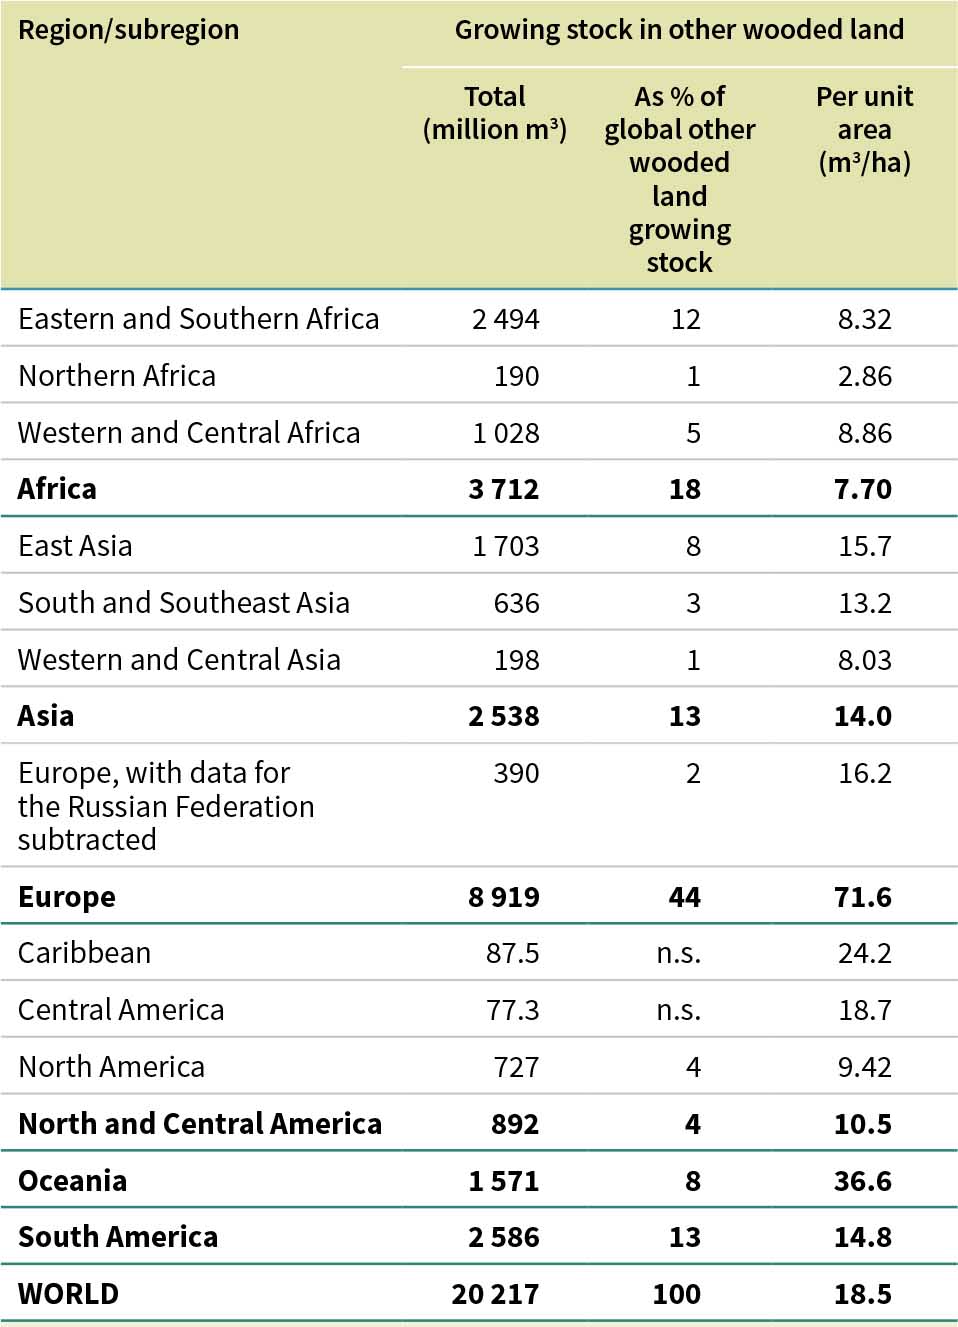
The average growing stock per unit area in OWL is estimated at 19 m3 per ha globally, with averages ranging from 3 m3 per ha (Northern Africa) to 72 m3 per ha (Europe).
FRA 2025 received complete time-series data on forest growing stock for the period 1990–2025 from 214 countries and areas representing 97 percent of the global forest area. For countries and areas that did not provide data, growing stock was estimated using subregional averages of growing stock per ha and forest area at each point in the time series. To ensure a complete and consistent dataset without gaps, missing values were interpolated for countries and areas with incomplete time series using the closest year for which data were available on growing stock per unit area.
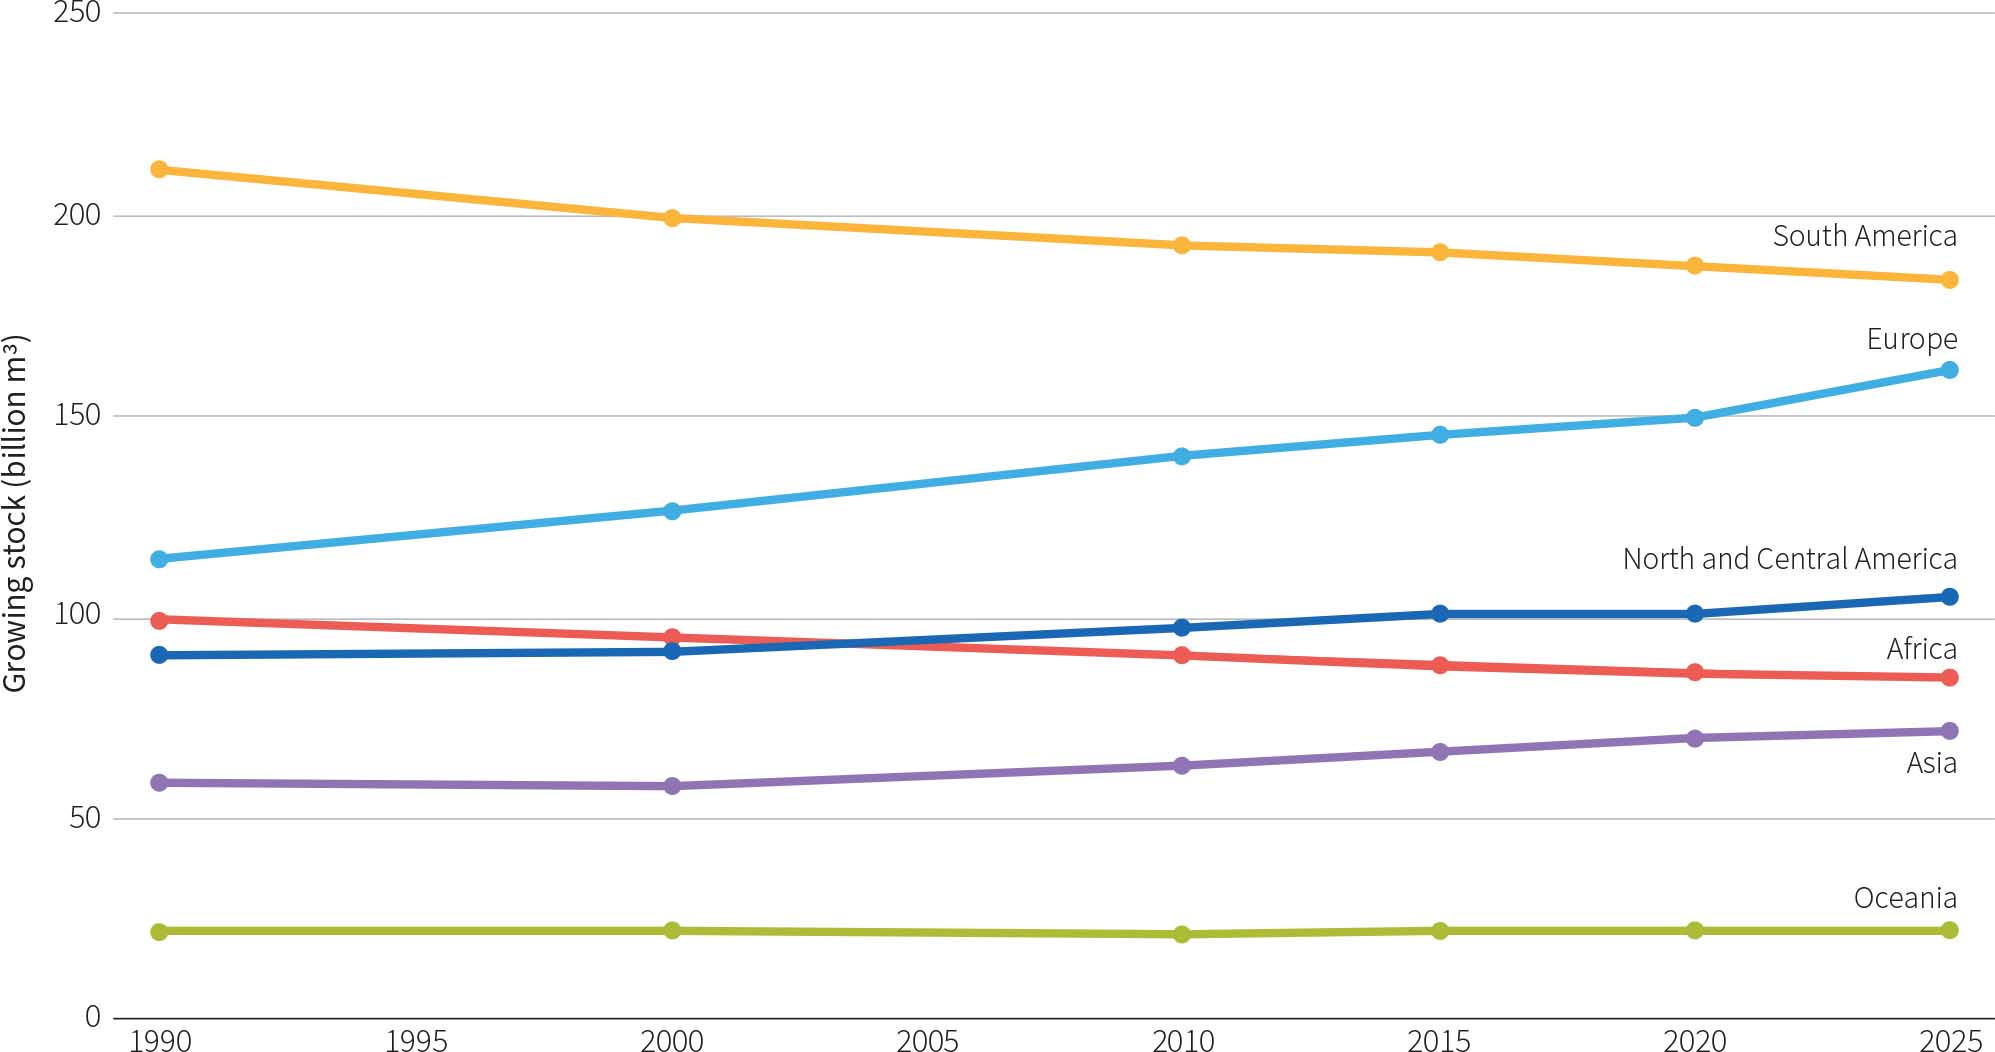
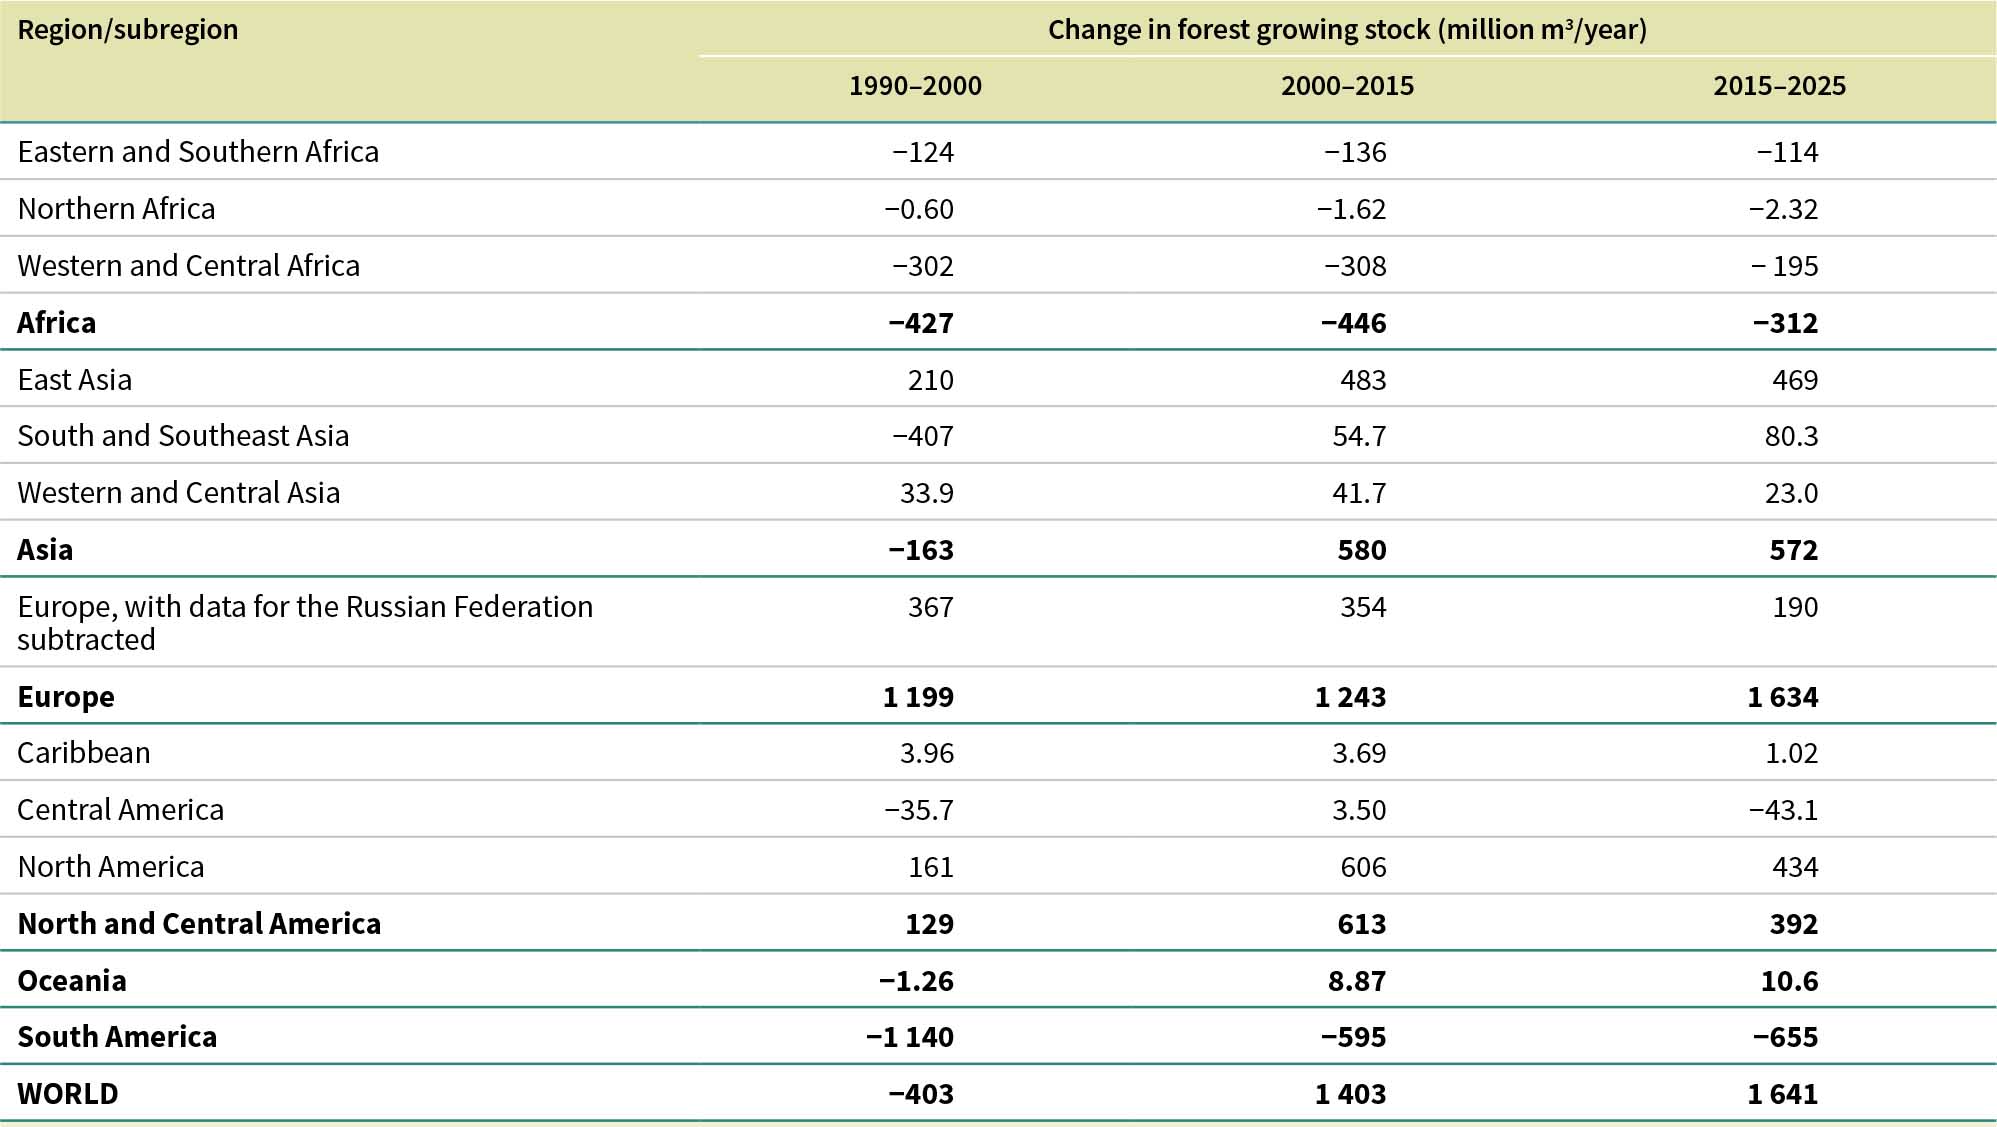
After a decline in the 1990s, the volume of forest growing stock globally rose significantly between 2000 and 2025, from 592 billion m3 to 630 billion m3. There were contrasting regional patterns, however, with substantial increases in Europe (notably the Russian Federation), North America and Asia over the period and marked decreases in South America and Africa (Table 42, Table 43 and Figure 21). Some tropical subregions, such as Western and Central Africa, experienced a slowdown in the average annual decline of growing stock in 2015–2025 compared with 2000–2015. In contrast, the rate of decline in forest growing stock accelerated in South America between the two periods. In Central America, change in forest growing stock was positive in 2000–2015 (at 3.5 million m3 per year) and negative in 2015–2025 (at 43.1 million m3 per year).
The global forest growing stock per unit area increased by 11 percent between 1990 and 2025, with growth in all regions and nearly all subregions (Table 44). The increase was particularly marked in Europe and East Asia, likely driven by factors such as improved forest management and (especially in China – Lu et al., 2018; Yue, Zhang and Shao, 2021) large-scale reforestation programmes. Growing stock per ha also increased significantly in the Russian Federation and the United States of America in the decade to 2025.
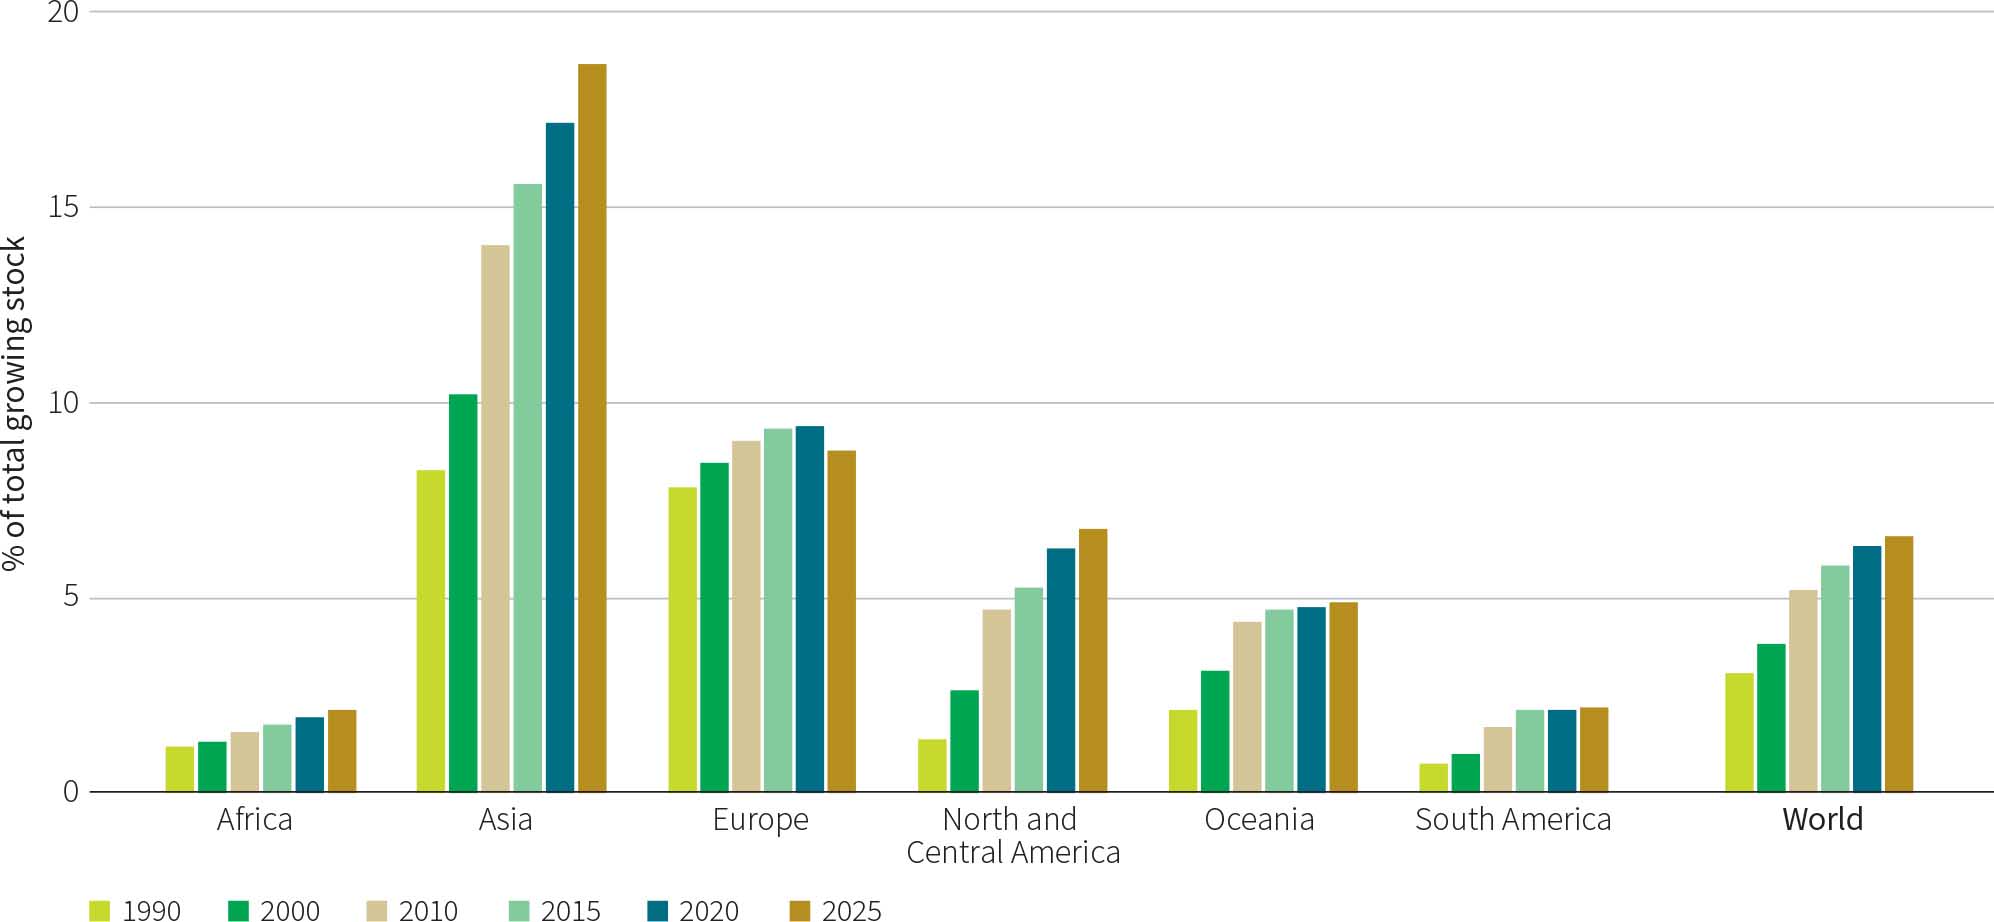
Trend by main forest category. The proportion of total forest growing stock held by planted forests increased steadily, from 3 percent in 1990 to 7 percent in 2025 (Figure 22); the volume of growing stock in planted forests more than doubled over the period. This upward trend is consistent across all regions, with the most significant increases in East Asia (a 19 percent increase between 1990 and 2025) and North and Central America (a 5 percent increase over the period). The share of the total planted-forest growing stock held by plantation forests increased from 38 percent in 1990 to 42 percent in 2025.
Growing stock per unit area increased in both naturally regenerating and planted forests (Table 45). The rise was particularly pronounced in planted forests, likely due to the use of fast-growing tree species in plantation forests and improved forest management.
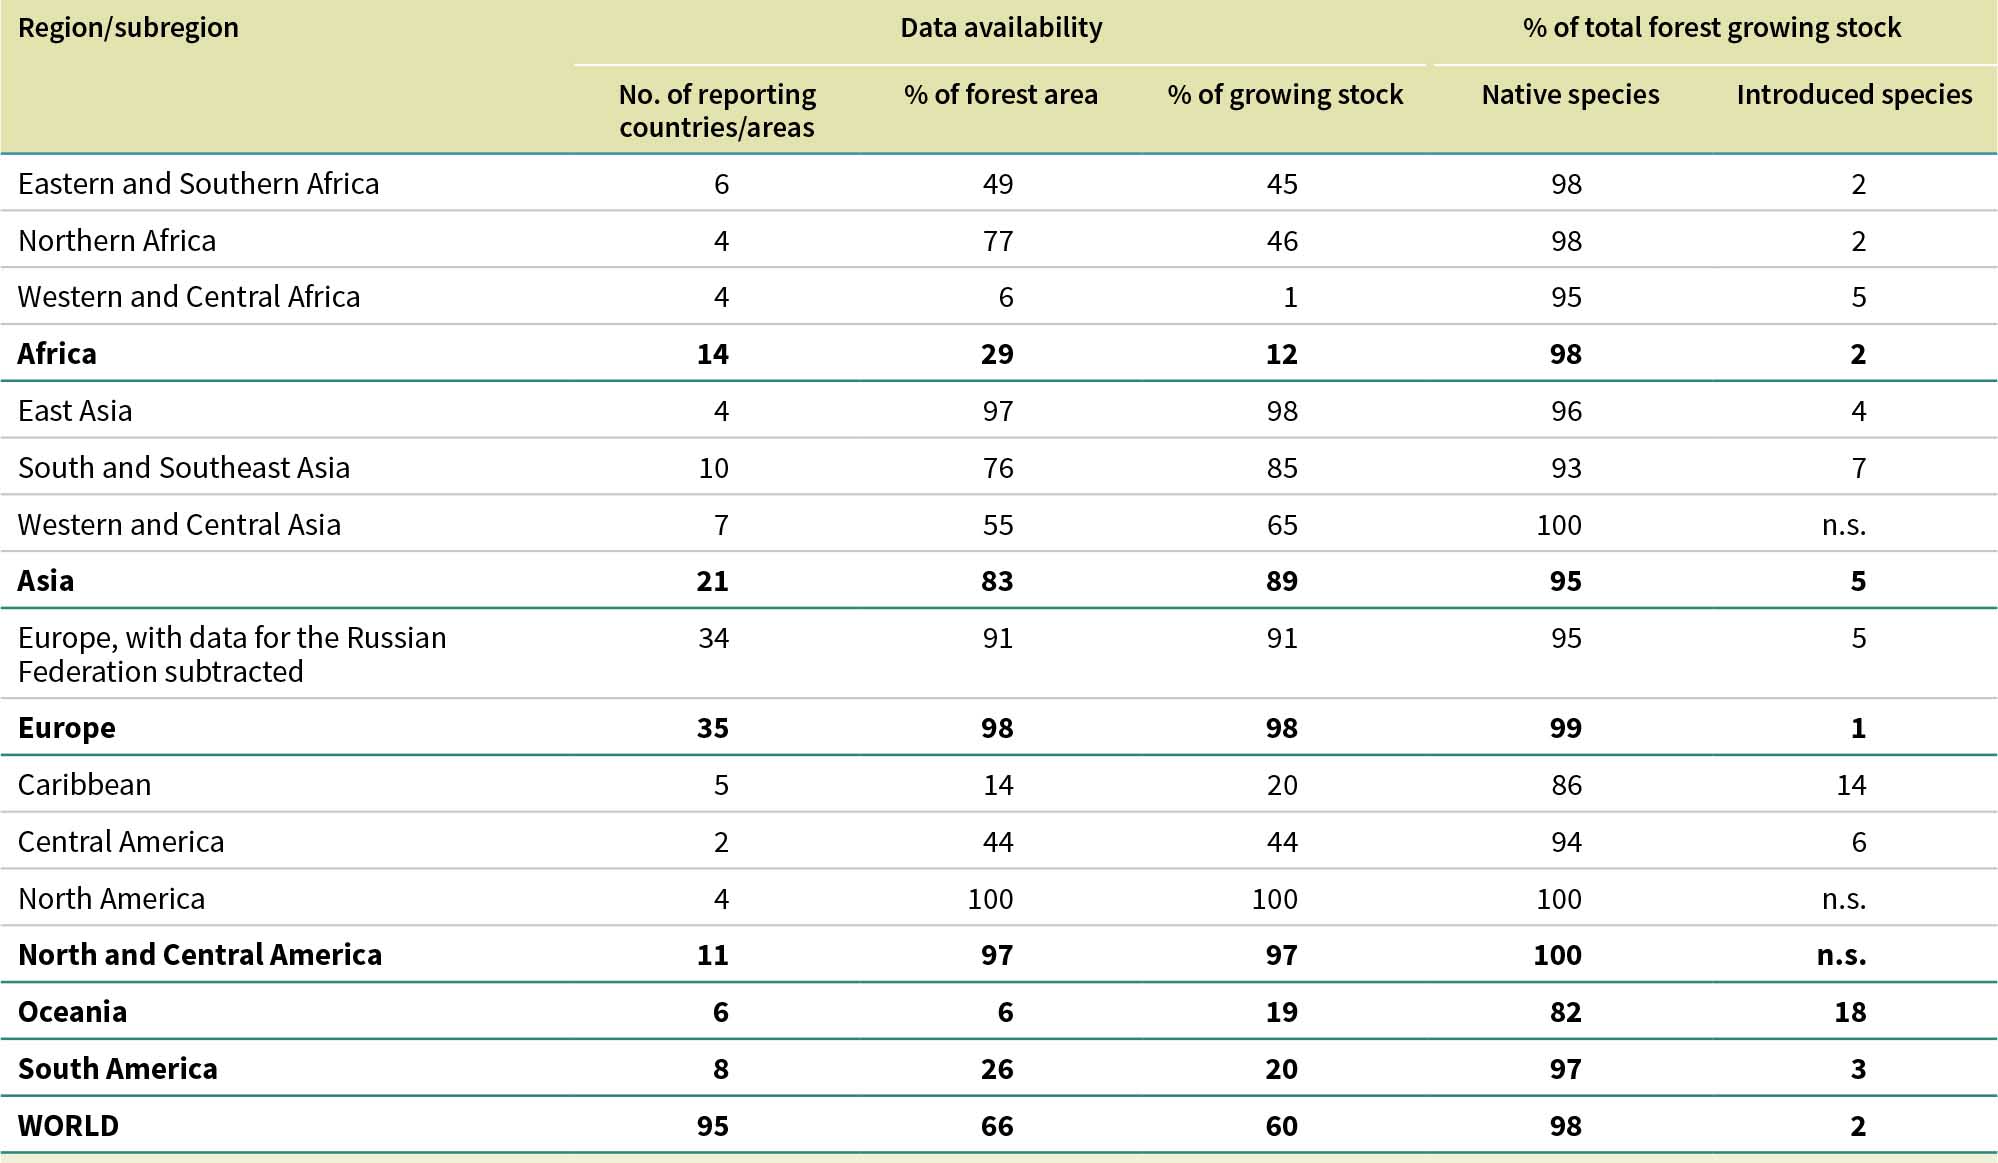
FRA 2025 received information on the composition of forest growing stock from 105 countries and areas representing 68 percent of the world’s forest area and 63 percent of its growing stock. Countries reported for the latest year for which data were available. Given that some data received were only partial, the analysis was made based on 95 countries and areas representing 66 percent of the forest area and 60 percent of the total growing stock. Data coverage is particularly low for Africa (particularly Western and Central Africa), Oceania and South America; therefore, the results presented here for those regions should be viewed with caution.
For FRA 2025, submitting countries and areas were able to select species from a drop-down menu in the FRA reporting platform, which considerably reduced inconsistencies in the taxonomic nomenclature. Increasing the availability and quality of data on growing-stock composition is a formidable task for many countries and areas, especially in the tropics, where the diversity of tree species is very high. Assisting in this, improved information is now available on the world’s tree species (e.g. BGCI, 2021), including tools such as national tree checklists and field identification guides. Global checklists of tree species are also available, for example the GlobalTreeSearch database (Hill, Beech and Rivers, 2024) and Plants of the World Online (Royal Botanic Gardens Kew, 2025). Globally, there are nearly 58 000 named tree species classified into 266 taxonomic families and nearly 4 200 genera (BGCI, 2024).
It is estimated that the global forest growing stock comprises 98 percent native tree species and 2 percent introduced tree species (Table 46). The reported composition of growing stock is dominated by native tree species in all regions, with the share highest in North and Central America (100 percent) and Europe (99 percent) and lowest in Oceania (82 percent).
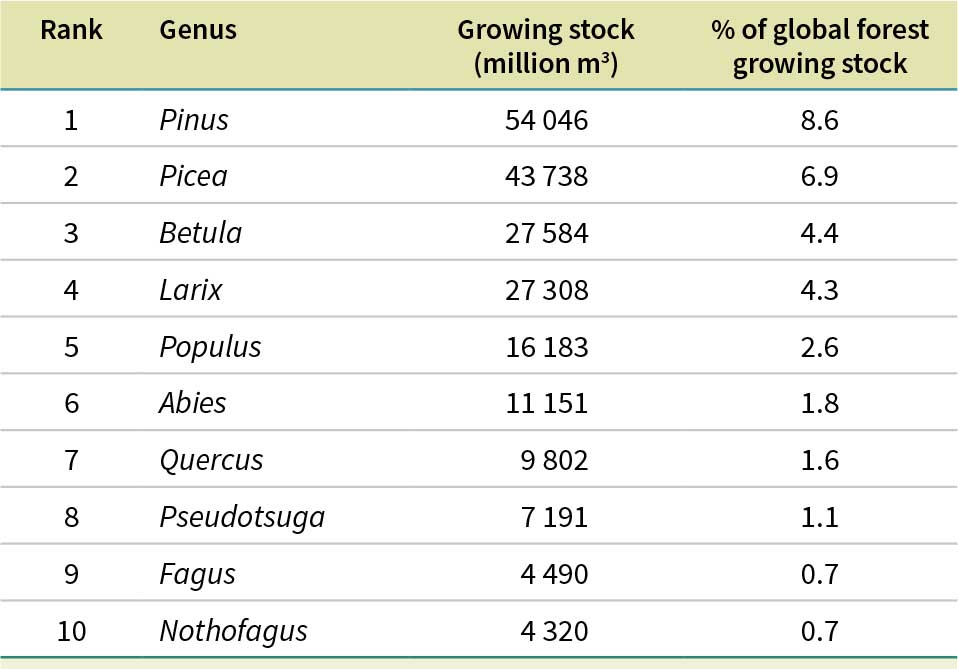
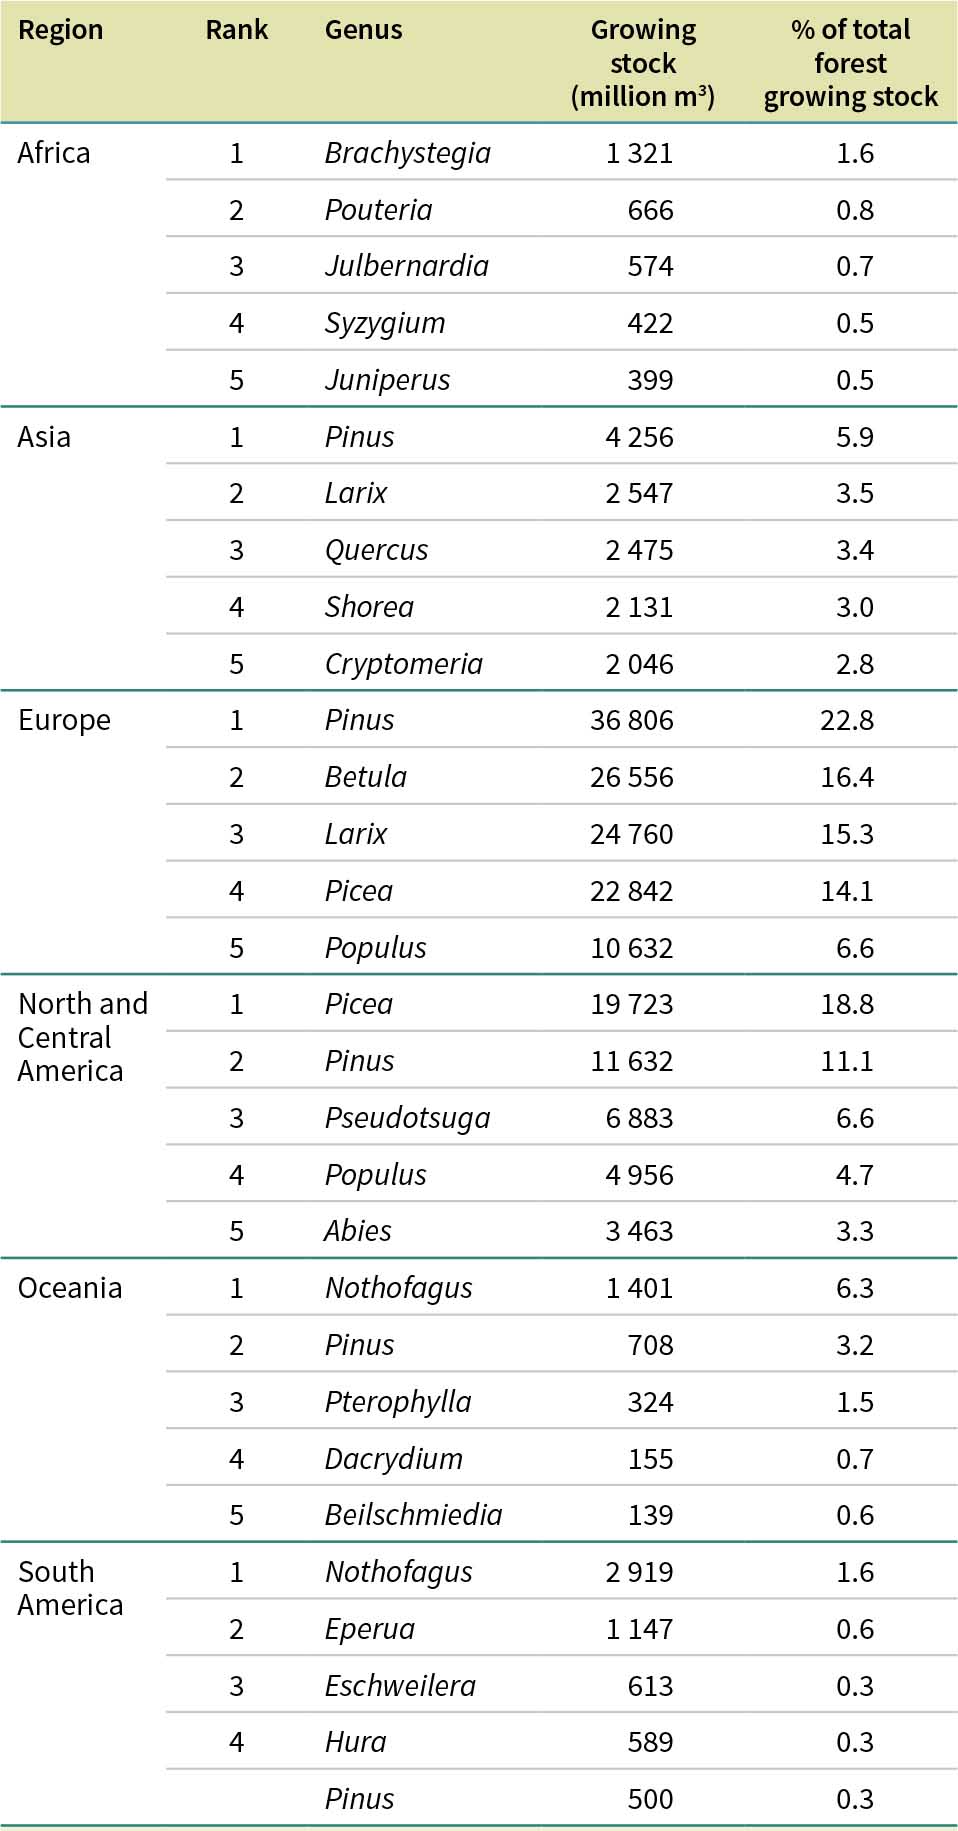
The species reported as the most common native and introduced tree species in the growing stock belong to 385 genera. The number of reported genera is highest in Africa (158) and Asia (127), followed by North and Central America (88) and Oceania (74). Many of the submitted reports were incomplete in the information provided on this attribute, however, and several countries and areas provided composition at only the genus level. Table 47 shows the reported top ten (by volume) genera globally, and Table 48 shows the top five genera by region.
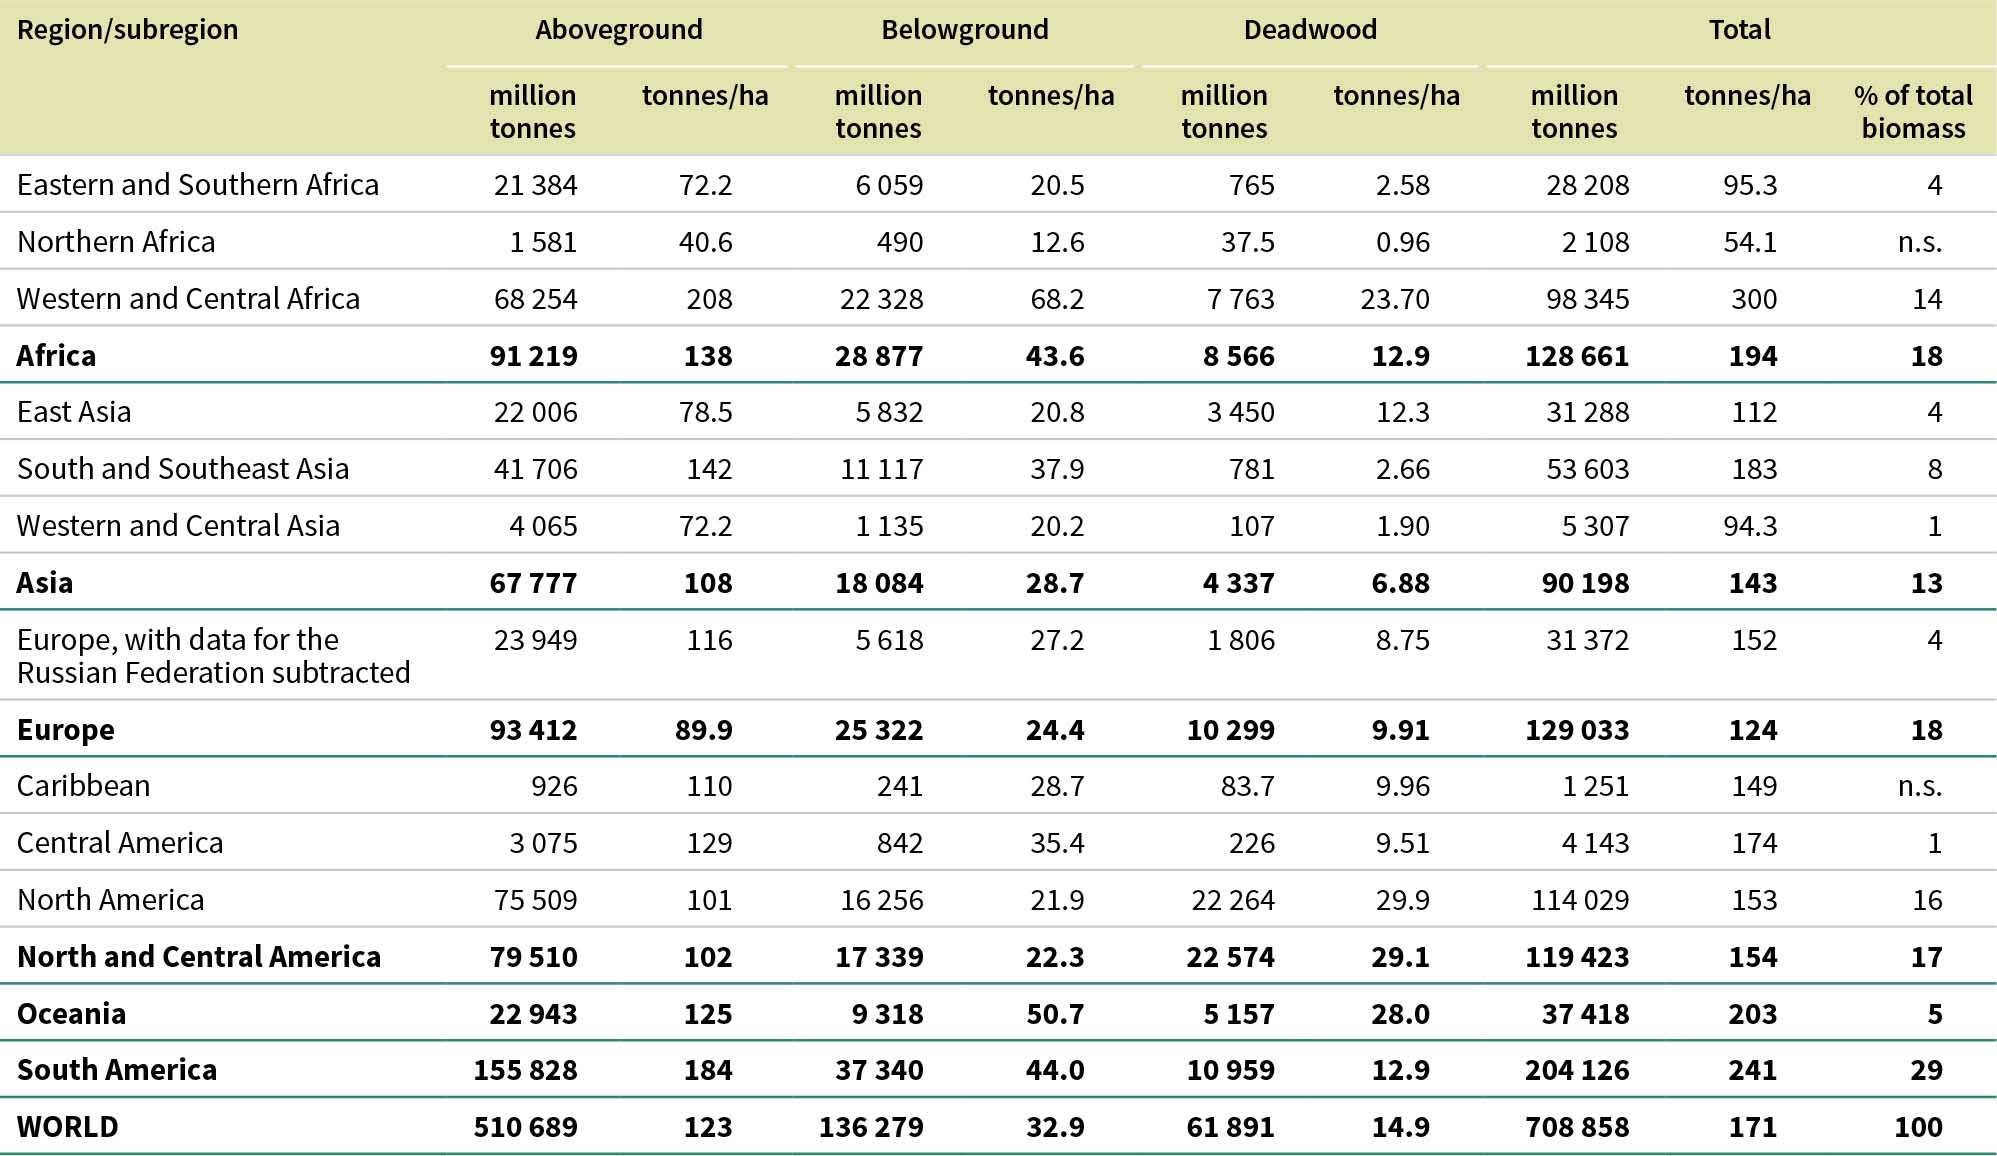
FRA 2025 received data on aboveground and belowground forest biomass for 2025 from 215 countries and areas representing nearly 100 percent of the world’s forests. Information on deadwood biomass was reported by 101 countries and areas accounting for 78 percent of the global forest area. For those countries and areas that did not provide data, estimates of aboveground, belowground and deadwood biomass were derived primarily by applying subregional averages per ha to the respective forest areas.
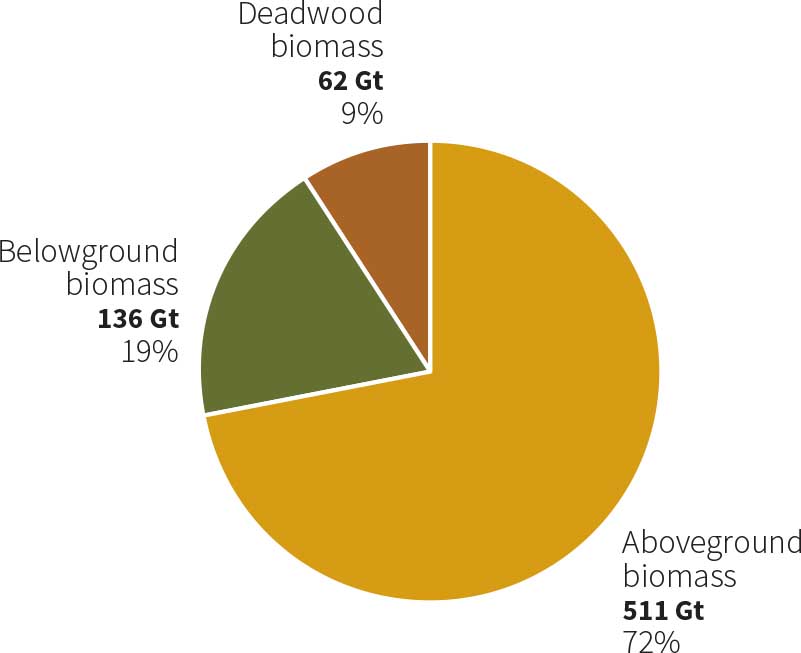
The total biomass in the world’s forests is estimated at 709 gigatonnes (Gt), equivalent to 171 tonnes per ha. Living biomass, encompassing aboveground and belowground biomass, amounts to nearly 647 Gt, or approximately 156 tonnes per ha (Table 49). Of this total, 79 percent is aboveground biomass and 21 percent is belowground biomass. Deadwood biomass in the world’s forests is estimated at 61.9 Gt of dry matter, equivalent to 14.9 tonnes per ha and representing 9 percent of the global forest biomass (Figure 23).
FRA 2025 received complete time-series data on aboveground and belowground forest biomass from 210 countries and areas representing more than 99 percent of the global forest area. Ninety countries and areas representing 77 percent of the global forest area provided complete time series for deadwood biomass. For countries and areas that did not report data for any years, biomass estimates were derived by applying subregional averages of biomass per ha to estimates of forest area for each time point. Where the time series for aboveground, belowground or deadwood biomass was incomplete for a specific country or area, change rate in aboveground biomass (if available) or growing stock was used to interpolate missing data.
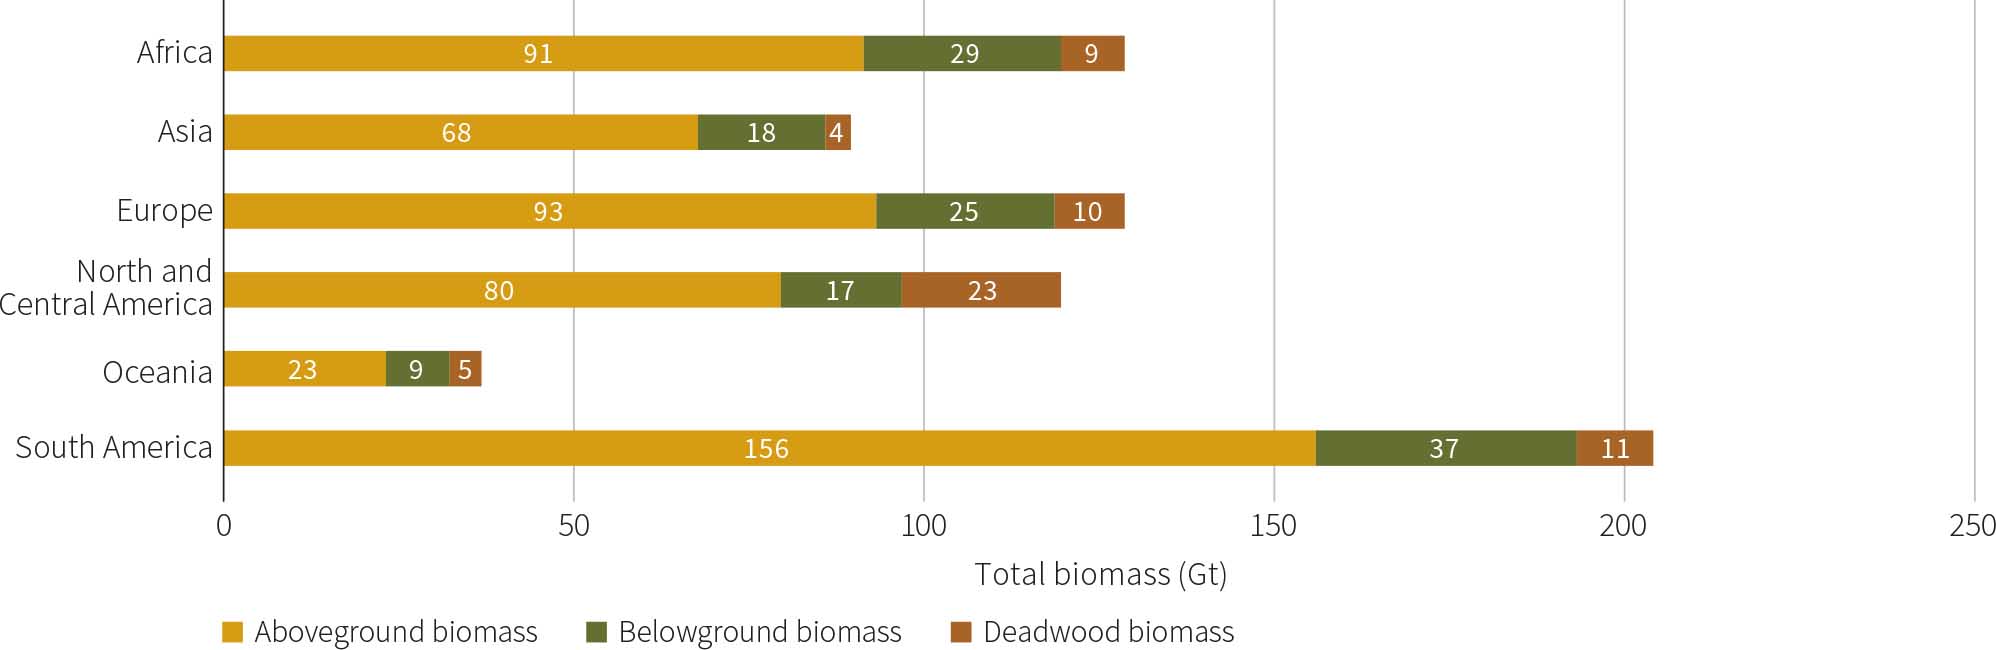
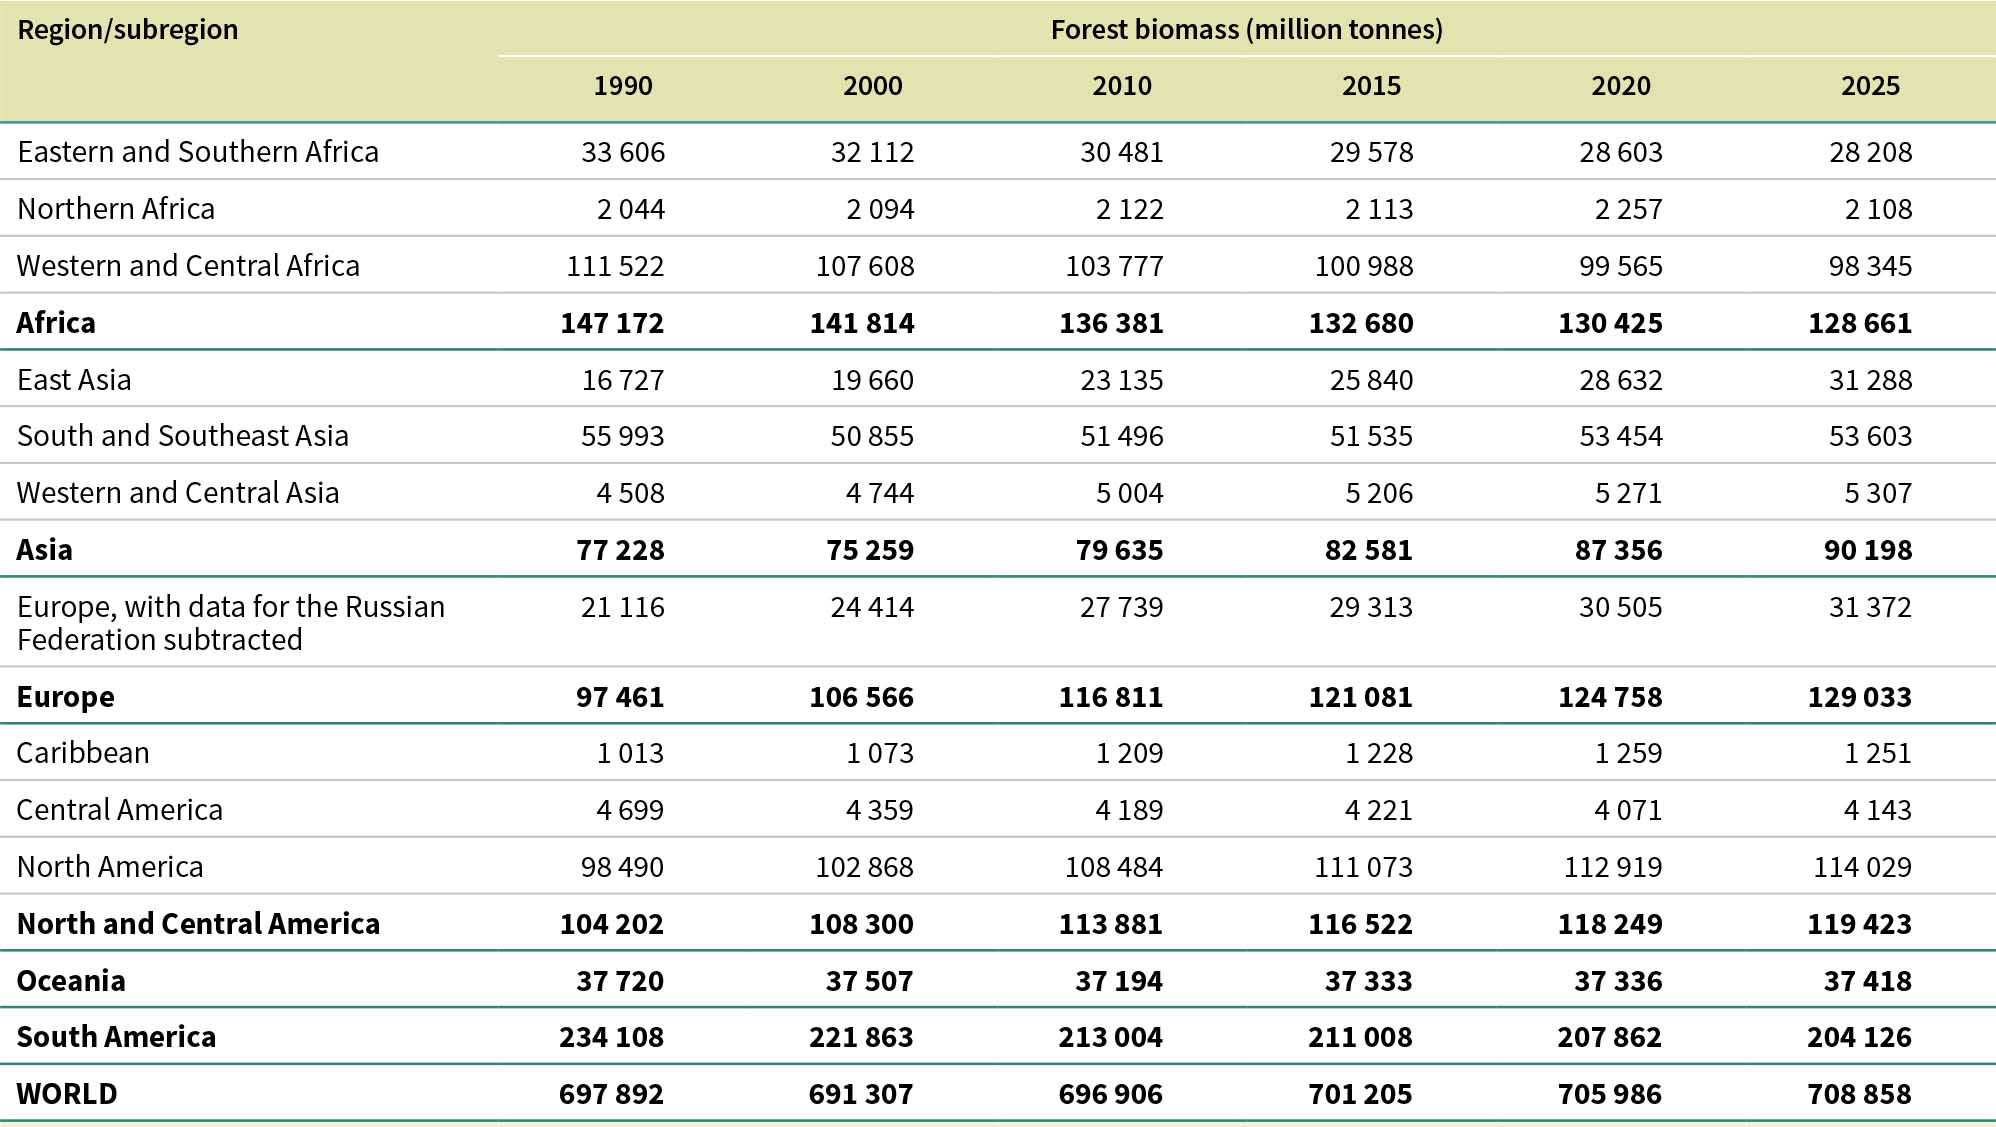
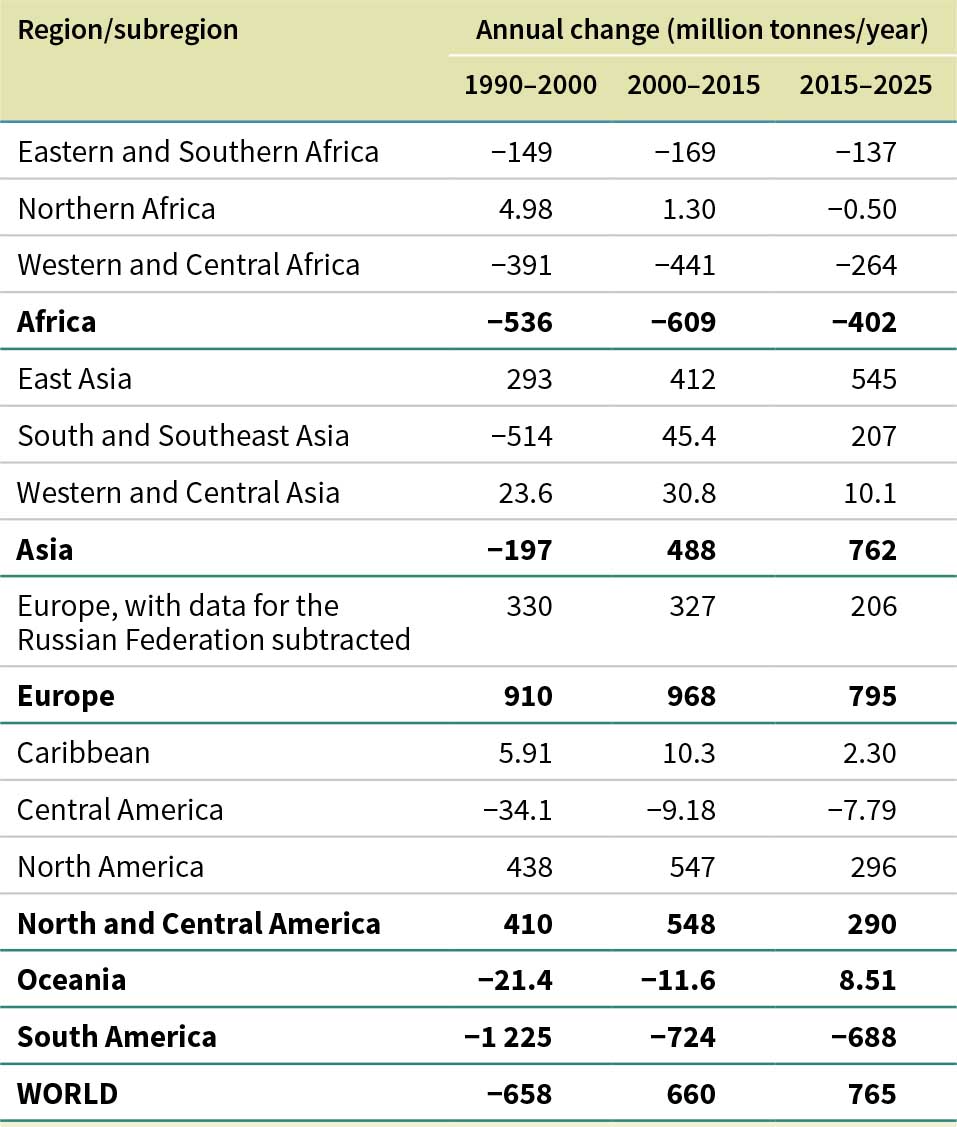
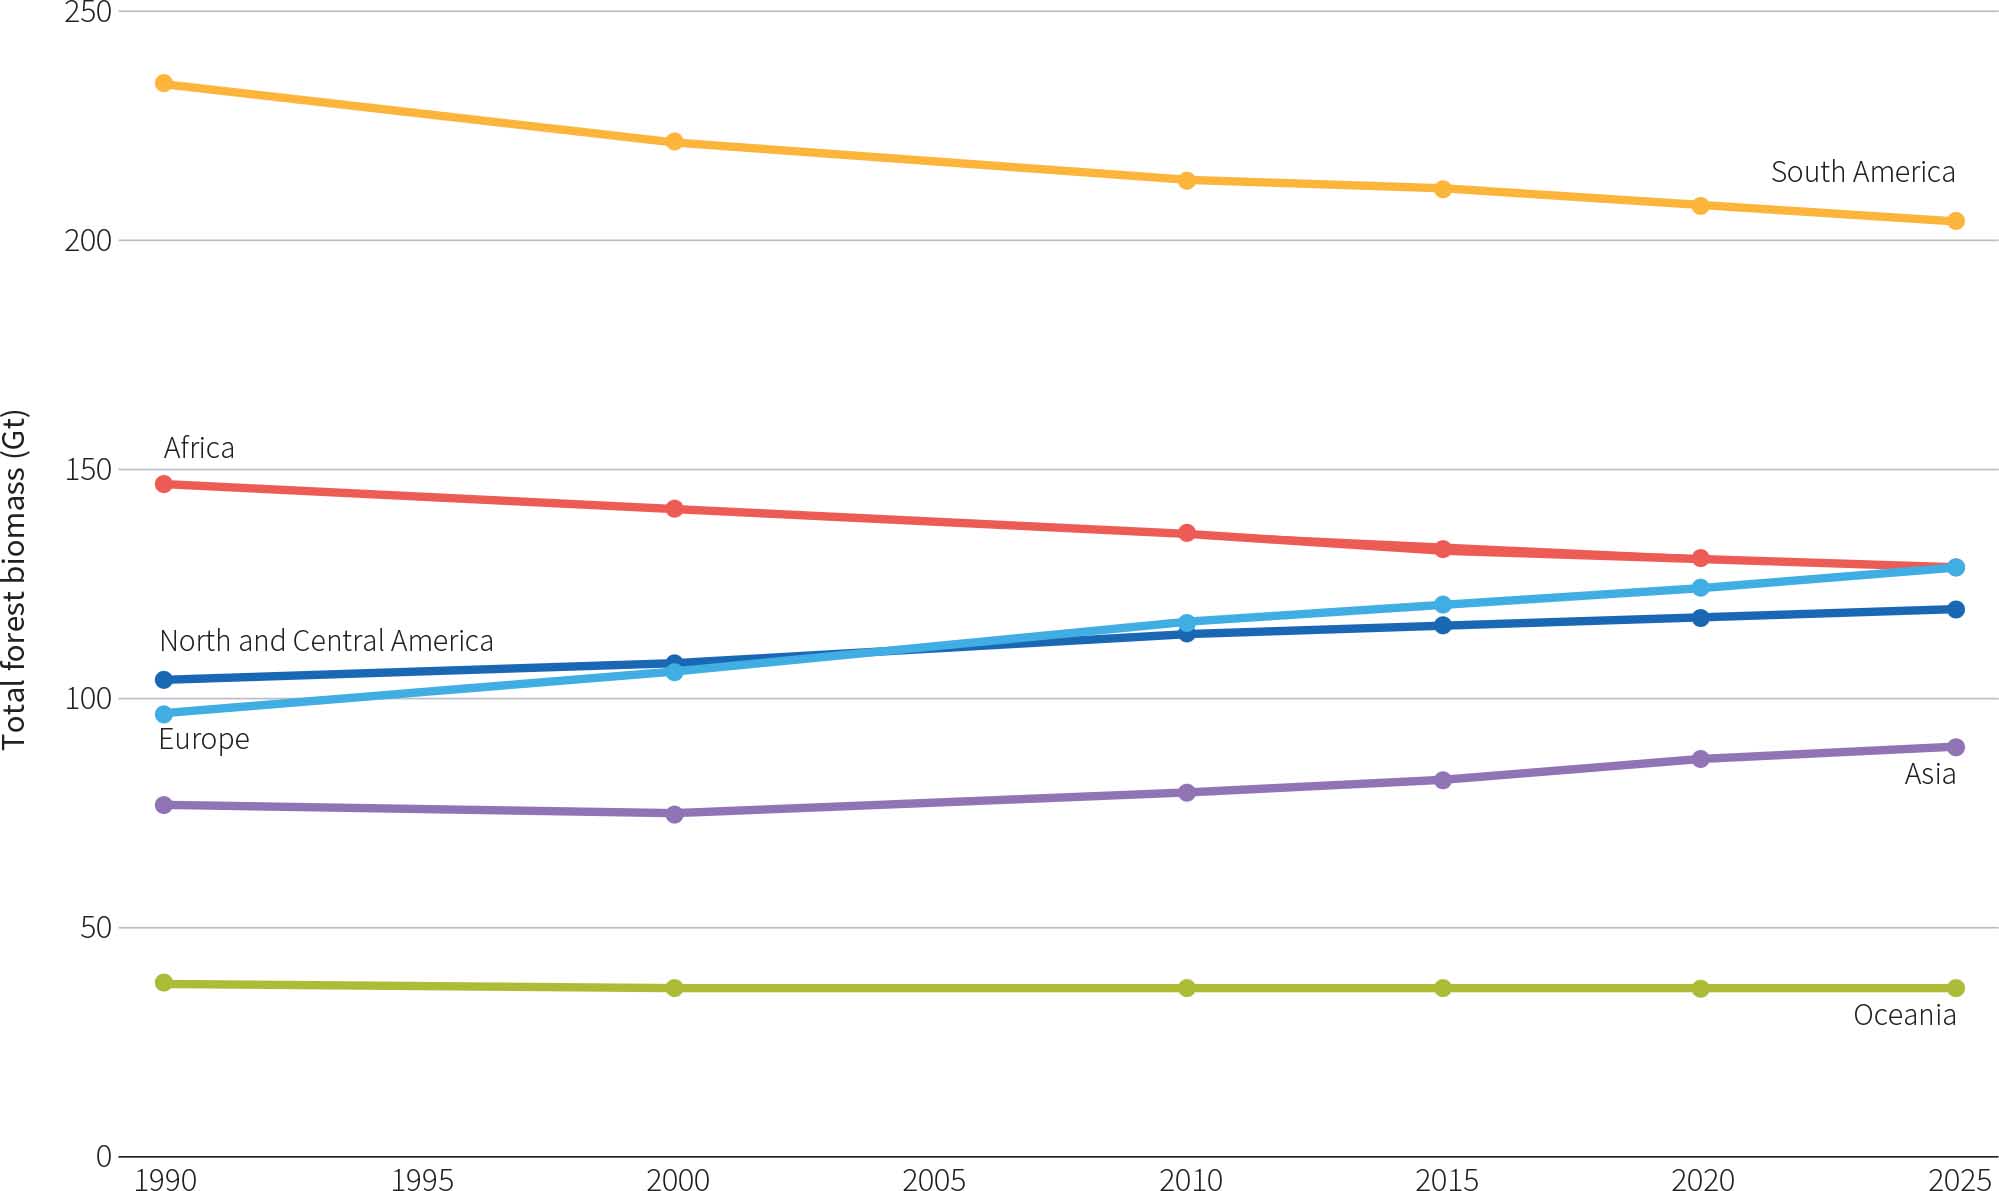
The global trend in biomass reversed from a decline in the 1990s to steady gains between 2000 and 2025 (Table 50). The biomass stock grew by approximately 11.0 Gt between 1990 and 2025 (Table 51), an increase of 1.6 percent. Regional trends showed contrasting patterns, however. South America and Africa experienced significant losses in biomass stock over the period – 857 million tonnes per year and 529 million tonnes per year, respectively (Table 52) – due primarily to the loss of forest area. In contrast, there were substantial increases in biomass in East Asia, Europe and North America, driven by expansions in forest area and increases in biomass per unit area (Figure 25). The trend in biomass stock in Asia, particularly South and Southeast Asia, reversed from significant declines in the 1990s to increases over the period 2000–2025.
Forest biomass per unit area increased by 10.5 tonnes per ha globally between 1990 and 2025, a rise of 7 percent. Increases were observed in all regions and subregions except the Caribbean, Eastern and Southern Africa, and Oceania, where it was stable. East Asia and Europe (data for the Russian Federation subtracted) exhibited the largest gains in biomass per unit area between 1990 and 2025. Globally, the rate of increase accelerated from 0.25 tonnes per ha per year in 1990–2000 to 0.35 tonnes per ha per year in 2015–2025.
Although many countries and areas used IPCC default conversion factors to estimate biomass from growing stock, it is becoming more common to use national data to refine these estimates.
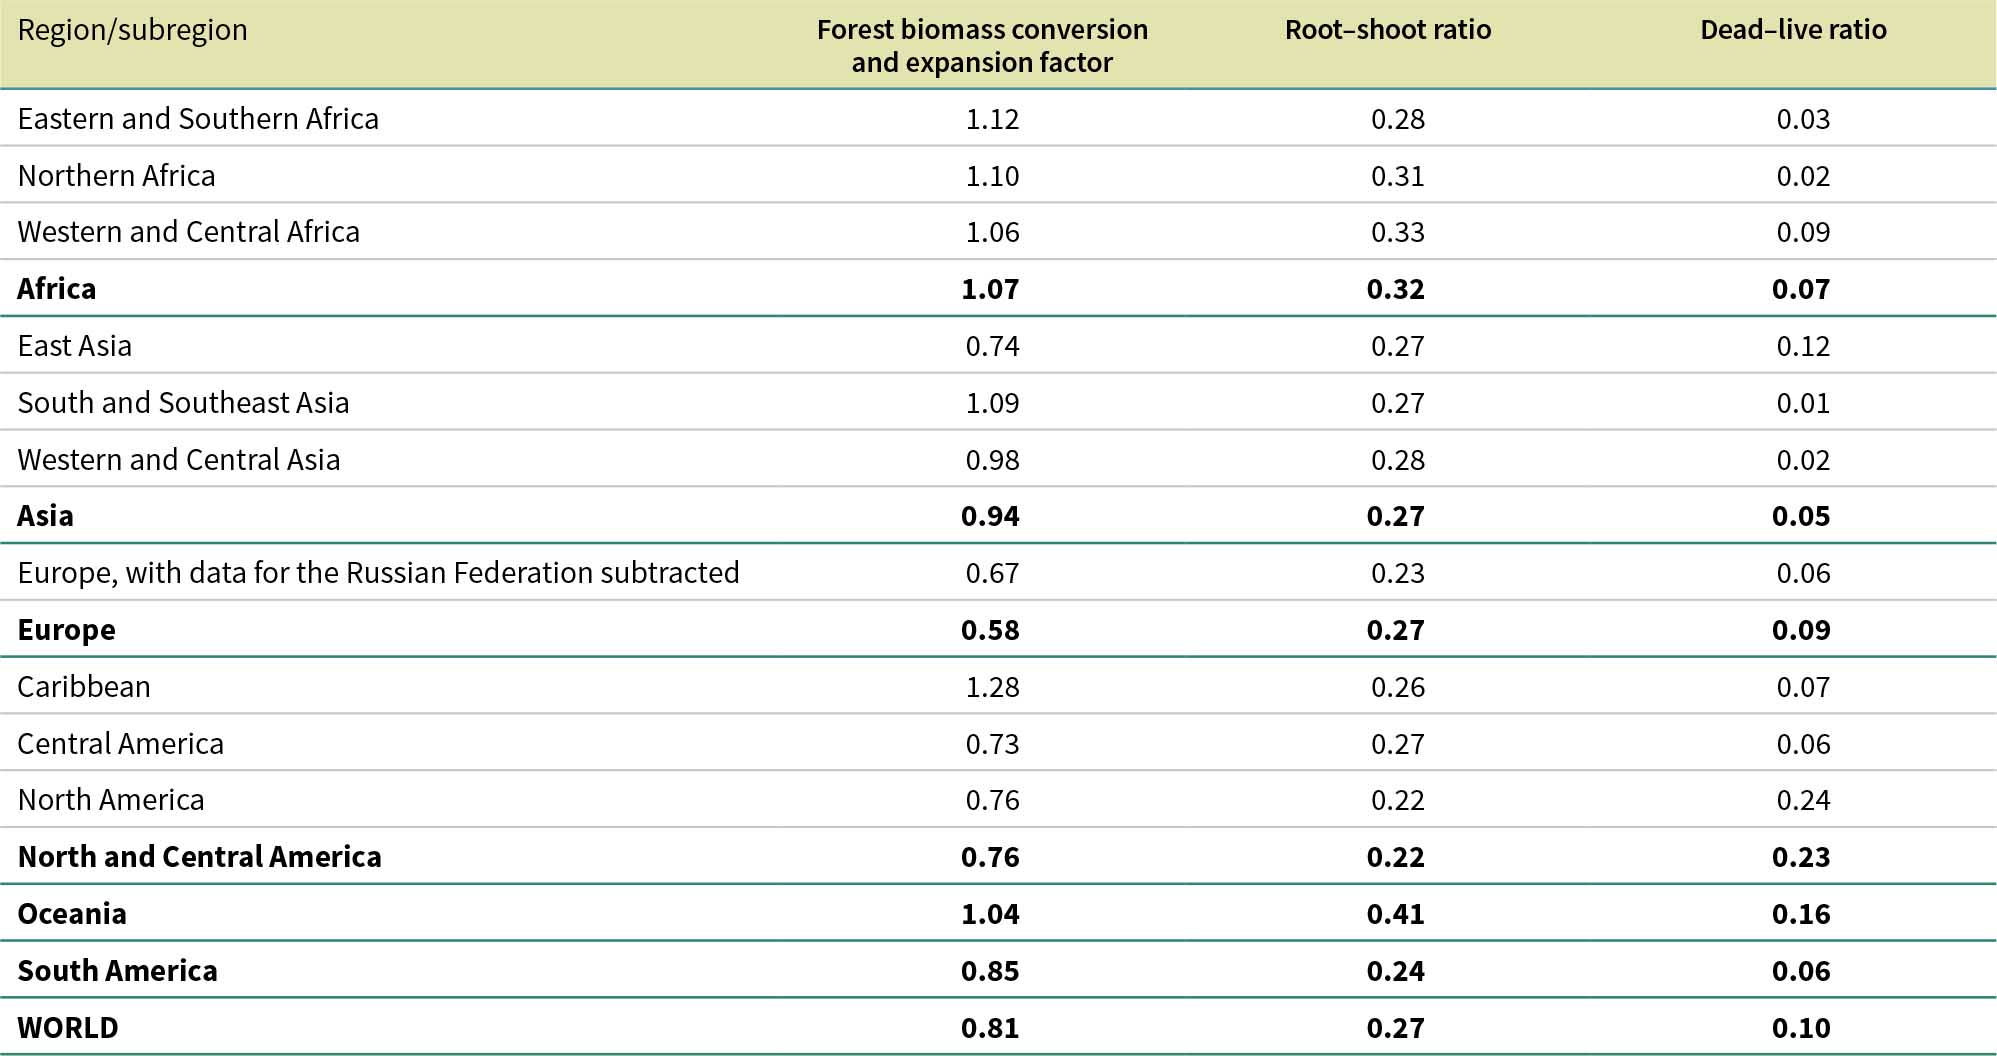
Table 53 shows the average biomass conversion and expansion factor (BCEF),11 root–shoot ratio12 and dead–live ratio,13 by subregion and region, based on estimates of growing stock and biomass for 2025. The calculated factors align with the default ranges outlined by the IPCC.
FRA 2025 received information on forest carbon stock in 2025 from 215 countries and areas representing nearly 100 percent of the world’s forests. Data were provided for the following carbon pools: carbon in aboveground and belowground biomass, reported by 215 countries and areas (nearly 100 percent of the global forest area); deadwood carbon (carbon in all non-living woody biomass not contained in the litter, either standing, lying on the ground, or in the soil), reported by 101 countries and areas (78 percent of the global forest area); litter carbon (carbon in all non-living biomass with a diameter less than the minimum diameter for deadwood), reported by 75 countries and areas (66 percent of the global forest area); and soil organic carbon (carbon in mineral and organic soils, including peat, to a specified depth chosen by the country), reported by 77 countries and areas (70 percent of the global forest area).
For non-reporting countries and areas, carbon-stock estimates were calculated by multiplying subregional averages for each carbon pool by forest area, with the exception of soil organic carbon, for which estimates were derived from the Global Soil Organic Carbon map. This map, which provides a 1-km soil-carbon grid for a depth of 0–30 cm, was overlayed with available global forest/tree-cover layers that aligned best with reported forest areas to derive country-specific estimates (in preference to using regional averages) (FAO and ITPS, 2020).
Note that soil depth, used by countries and areas to report soil organic carbon estimates, varies geographically. The average forest-area weighted soil depth used for soil organic carbon value globally is 41 cm, with the following regional variations: 30 cm in Asia and Oceania; 32 cm in Europe; 34 cm in South America; 41 cm in Africa; and 70 cm in North and Central America.
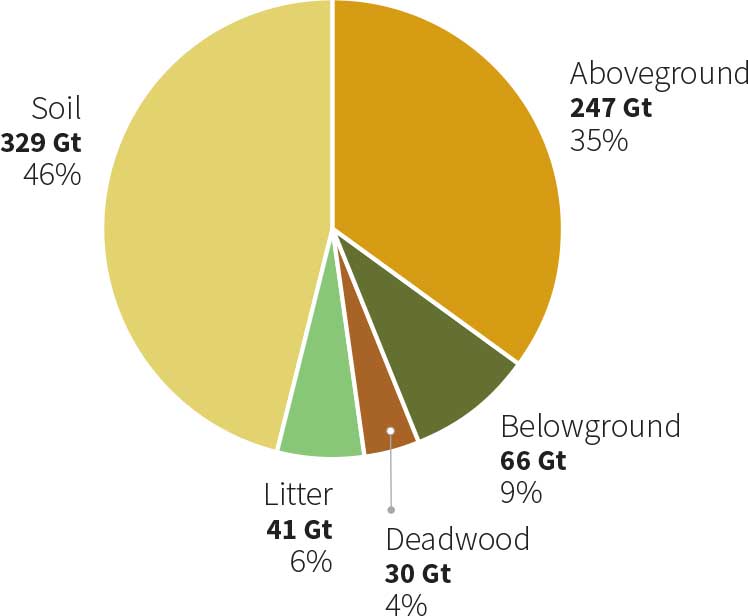
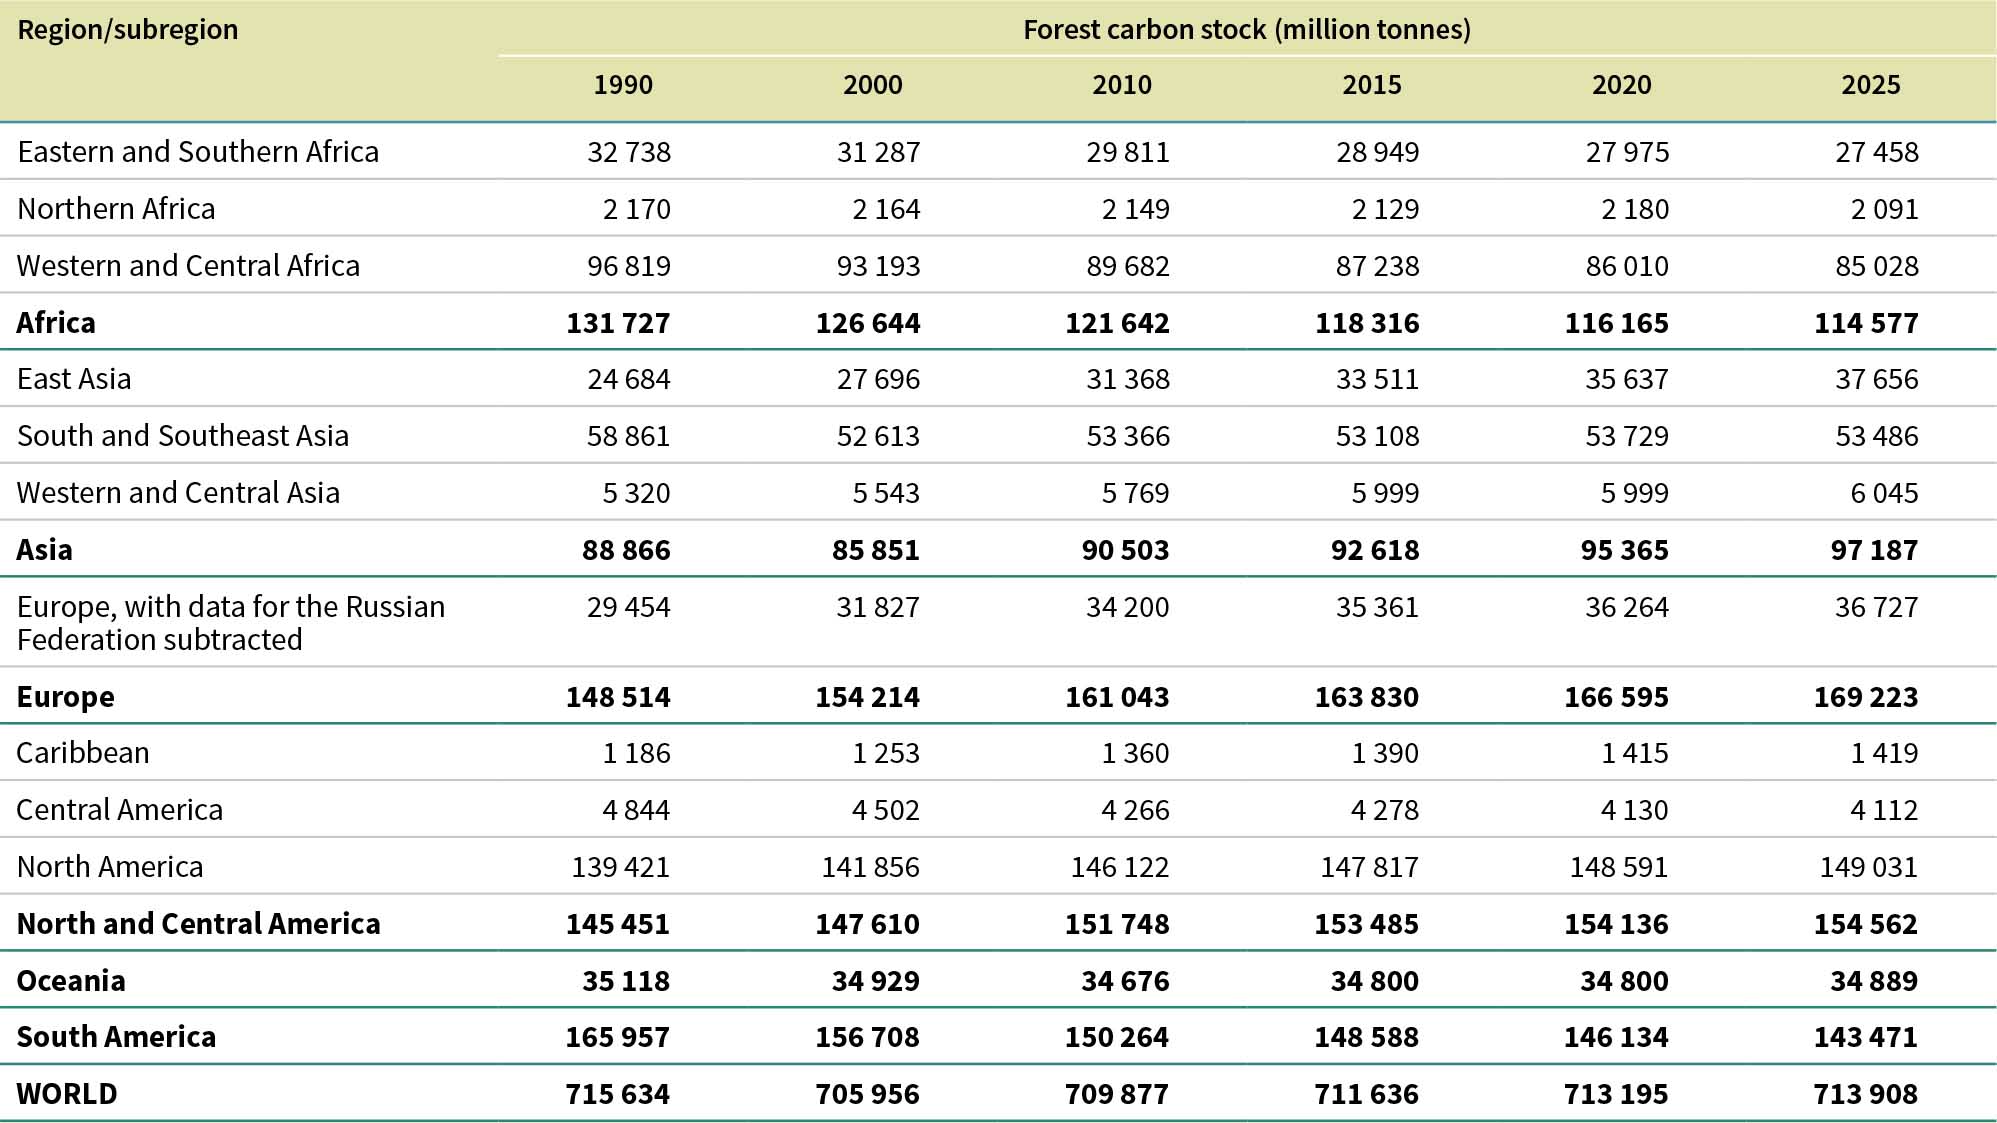
The total forest carbon stock in 2025, including all carbon pools, is estimated at 714 Gt, which is equivalent to 172 tonnes per ha (Table 54). This stock is distributed as follows: soil organic carbon, 329 Gt (46 percent of the total), or 79.6 tonnes per ha; aboveground biomass, 247 Gt (35 percent), or 59.7 tonnes per ha; belowground biomass, 65.9 Gt (9 percent), or 15.9 tonnes per ha; litter, 41.1 Gt (6 percent), or 9.93 tonnes per ha; and deadwood, 30.3 Gt (4 percent), or 7.32 tonnes per ha (Figure 26).
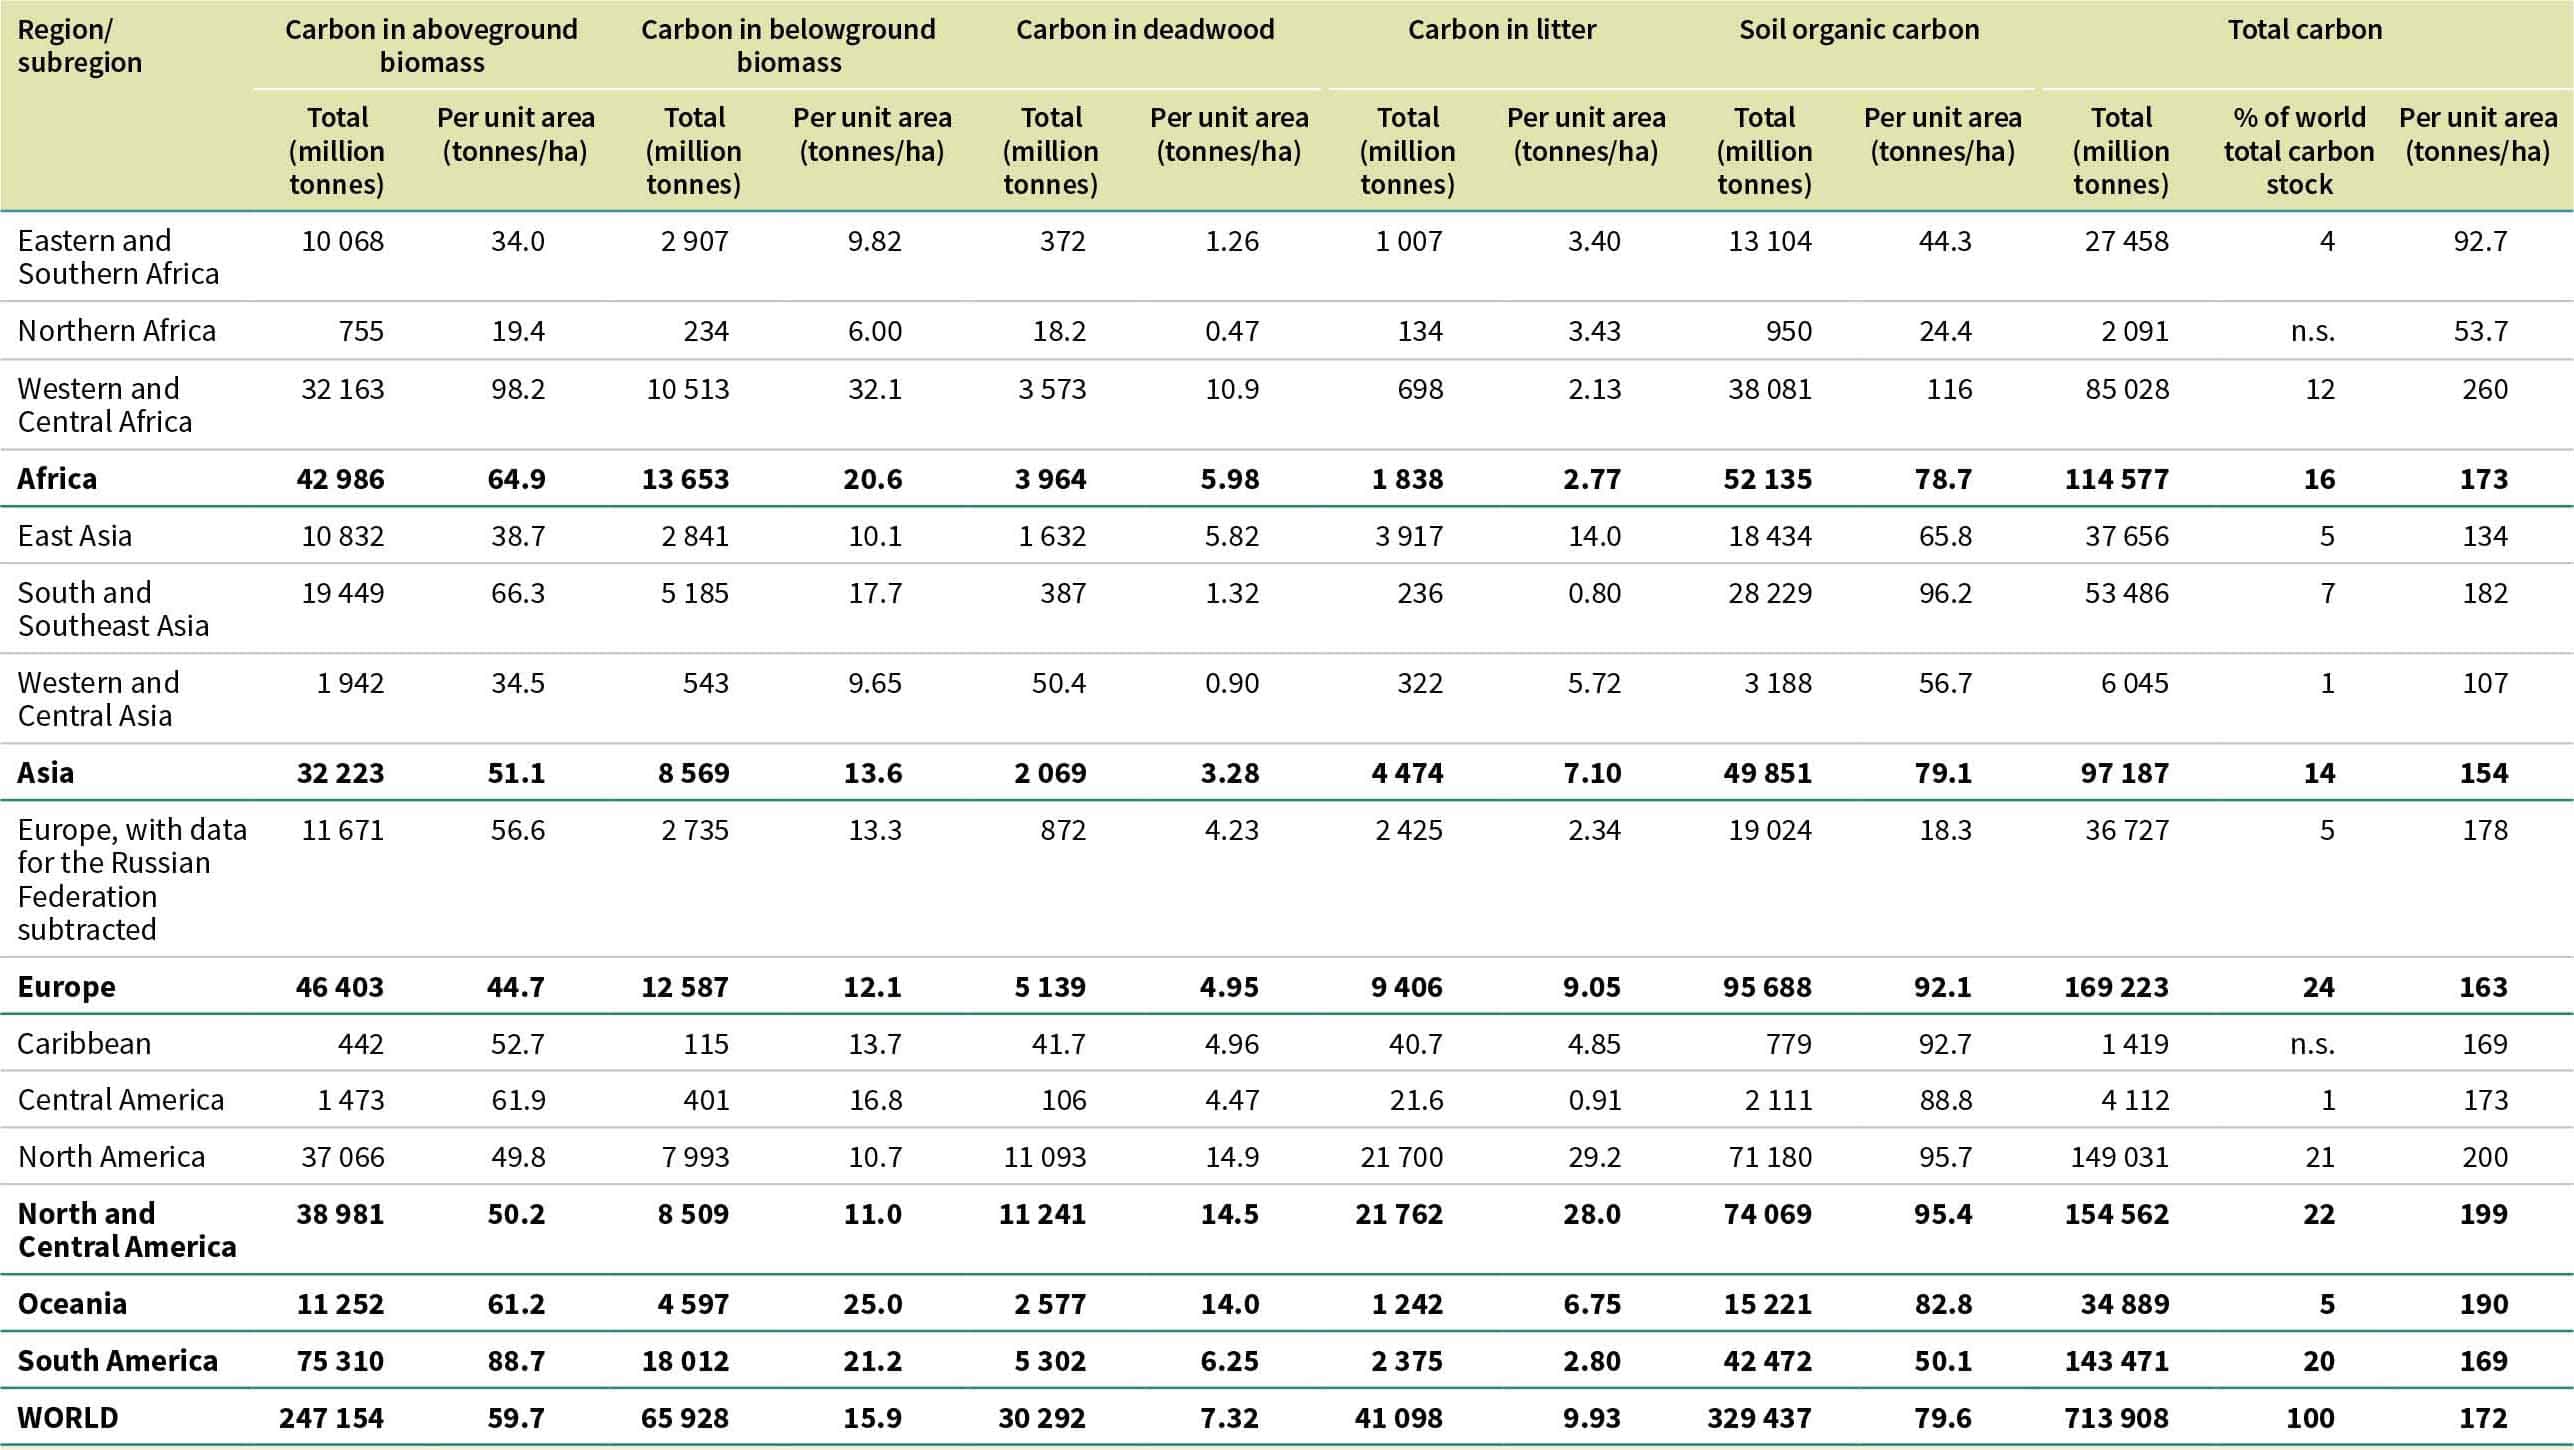
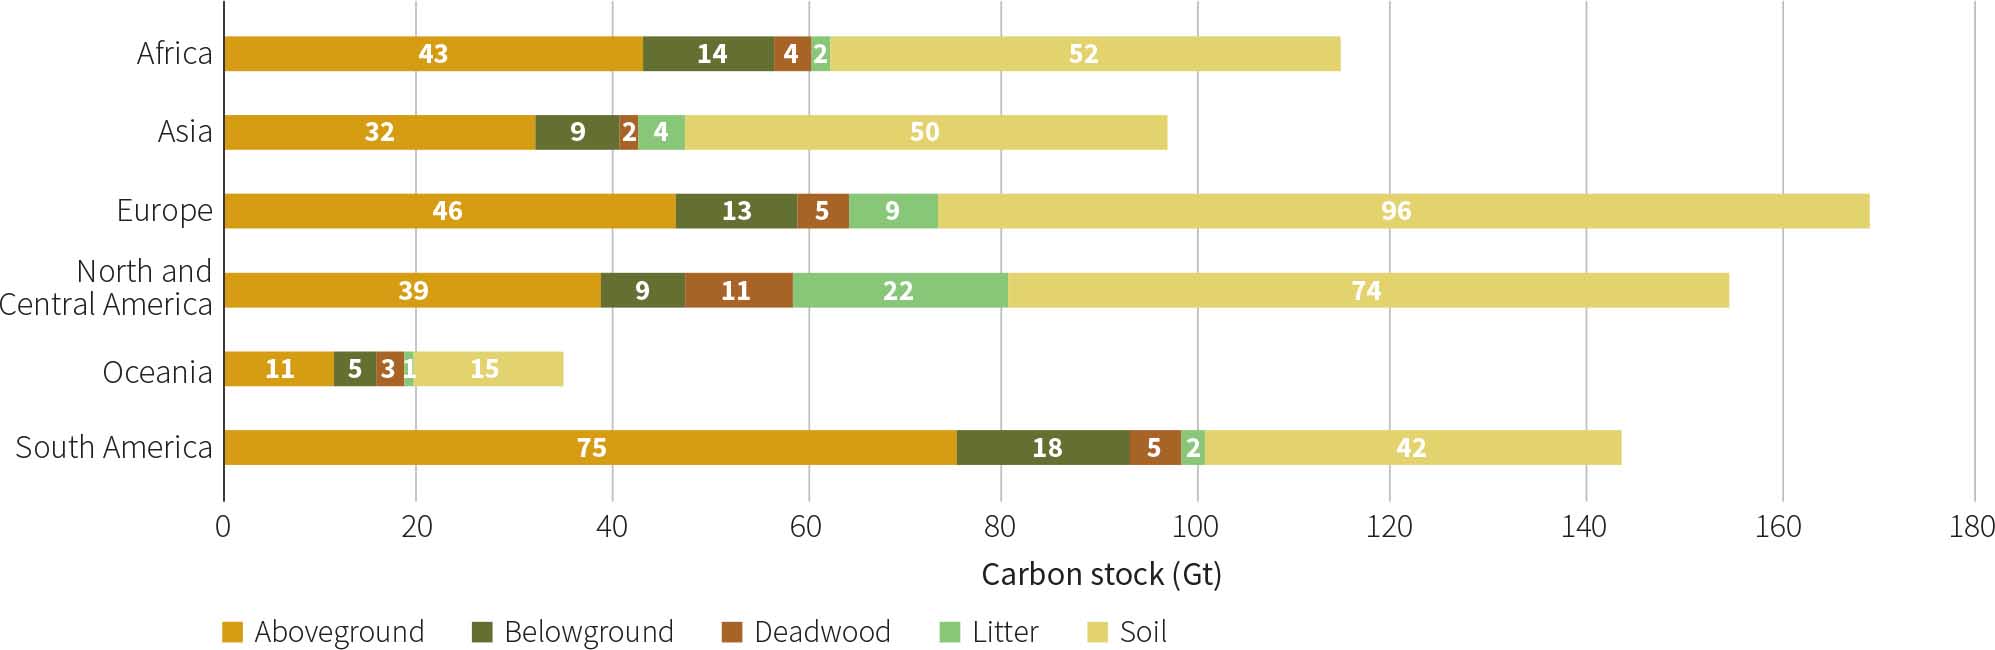
The regions with the largest forest carbon stocks are Europe (24 percent of the global total), North and Central America (22 percent) and South America (20 percent) (Figure 27). The carbon stock per unit area is particularly high in Western and Central Africa, at 260 tonnes per ha, and North America, at about 200 tonnes per ha.
Trends in forest carbon stock were assessed using complete time-series data on carbon in forest aboveground and belowground biomass from 210 countries and areas representing 99 percent of the global forest area. Ninety-one countries and areas (77 percent of the global forest area) provided full time-series data on deadwood carbon. Carbon in litter was reported by 73 countries and areas (65 percent), and soil organic carbon data were available for 74 countries and areas (69 percent).
For incomplete time series, trends in growing stock or carbon in aboveground biomass were used to interpolate missing data for belowground, deadwood and litter carbon. For soil carbon, incomplete time series were extrapolated by repeating the nearest available data point in time. For countries and areas that did not report, carbon stock was estimated by applying the subregional average stock per ha to the forest area at each point in the time series, except for soil organic carbon, for which estimates derived from the Global Soil Organic Carbon Map were applied for all reference years.
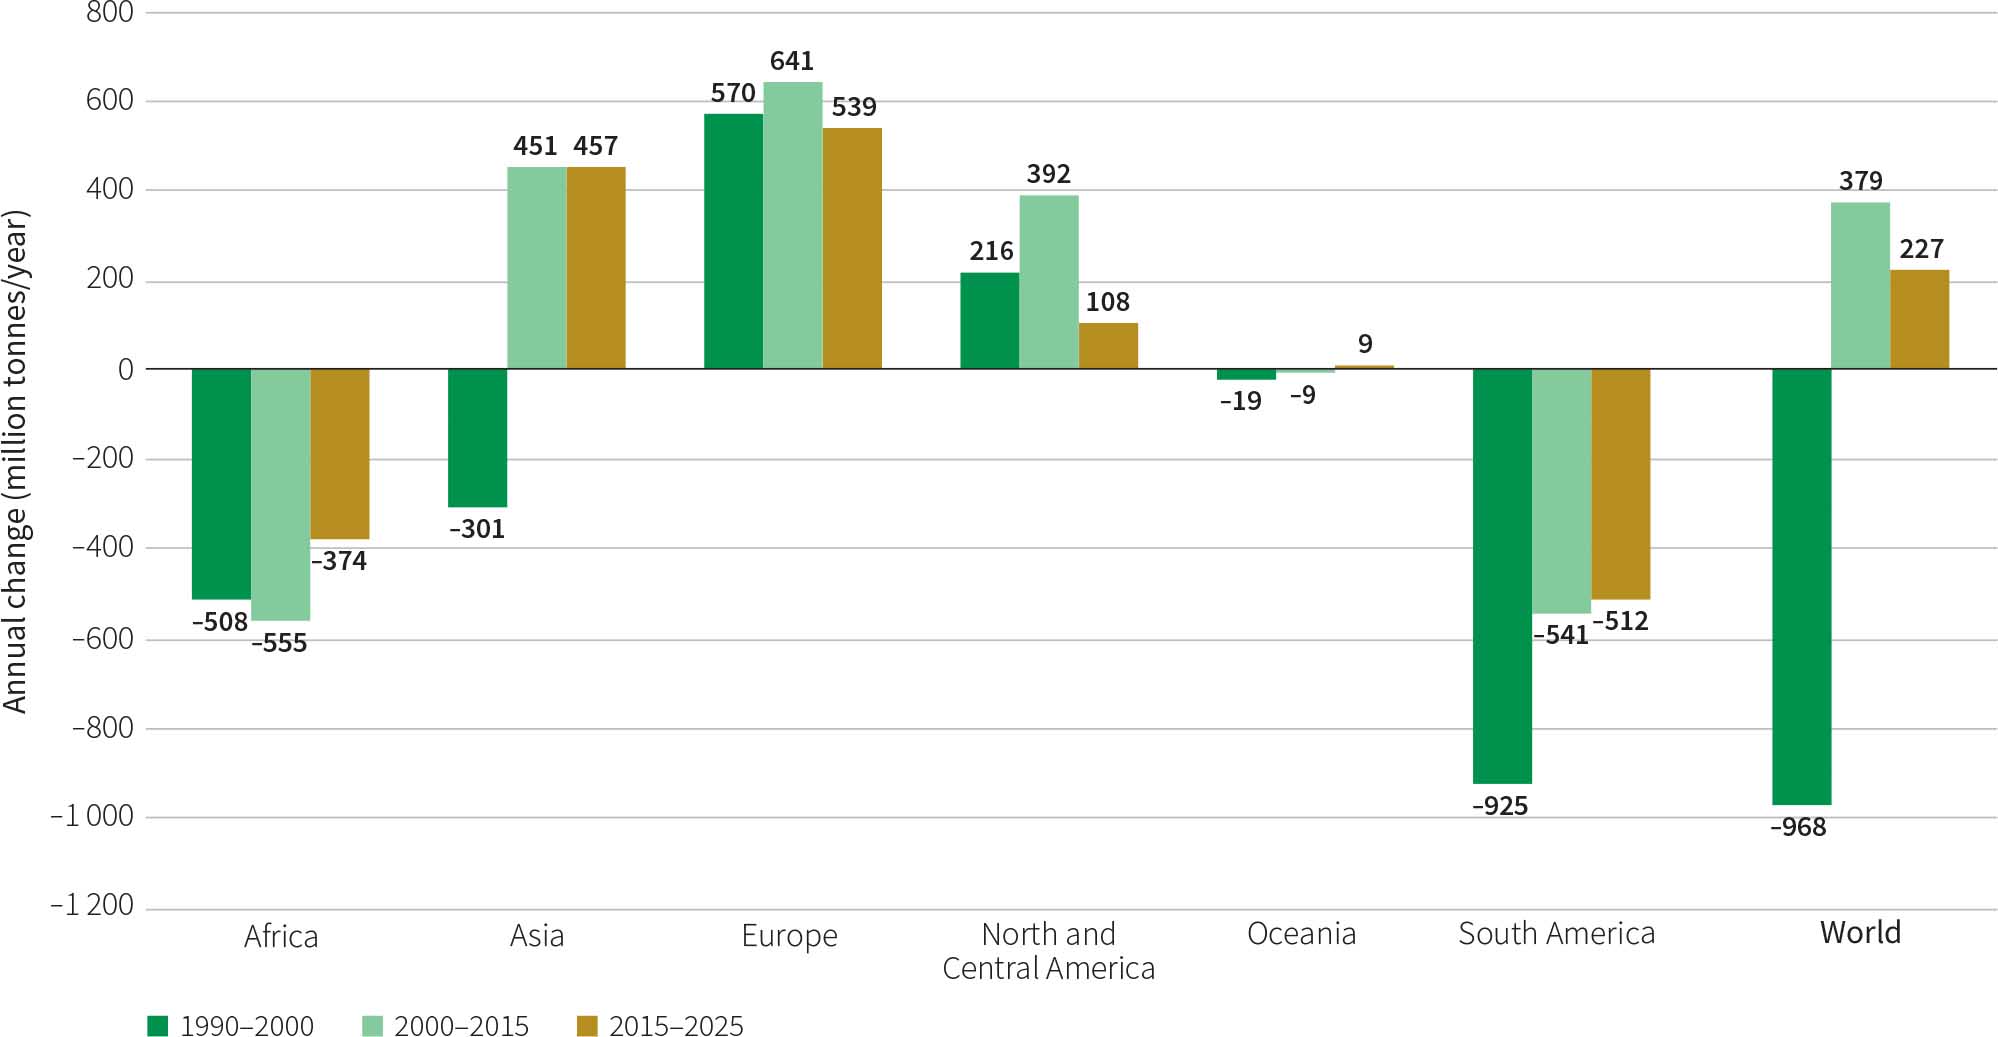
The global forest carbon stock decreased between 1990 and 2000, from 716 Gt to 706 Gt, and then increased to 714 Gt in 2025 (Table 55). The increase after 2000 can largely be attributed to an increase in forest area in certain regions, particularly Asia and Europe. The global carbon stock in 2025 is similar to that in 1990, but there are regional and subregional differences. For example, forest carbon stock is significantly higher in 2025 than in 1990 in East Asia, Europe and North America, driven by forest-area expansion, and considerably lower in South America, Africa and Central America (in descending order by rate of change) (Figure 28).
The carbon stock per ha increased across all pools between 1990 and 2025, with the overall forest carbon per unit area growing from 165 tonnes per ha in 1990 to 172 tonnes per ha in 2025, a 5 percent increase.