10. Discussion

FAO has been coordinating global forest resource assessments since 1946. In the present report, information was collected from 236 countries and areas for about 50 variables related to the extent, condition, uses and values of forests, for six points in time – 1990, 2000, 2010, 2015, 2020 and 2025.
Building on nearly 80 years of experience (FAO, 2018a), FRA 2025 has (compared with FRA 2020) increased the participation of countries in the report, strengthened and extended the network of national correspondents, reduced the reporting burden on Members, increased capacity-development activities, and improved data availability, transparency and quality. Through FRA 2025, FAO has also initiated a transition towards a more flexible FRA reporting modality, setting the stage for further advances in global forest reporting.
Since 2005, FRAs have been based on country reports prepared by a global network of officially nominated national correspondents, who are responsible for compiling national data for FRA reports and submitting these to the FRA team. For FRA 2025, 197 countries and areas had national correspondents, an increase of ten compared with FRA 2020 and the highest number of national correspondents for any FRA. In addition, 178 alternate correspondents were nominated. Forty-two desk studies, representing 1.6 percent of the total forest area in 2025, were prepared for countries and areas that did not submit reports.
The national correspondents and their alternates coordinated and gathered the inputs of other collaborators for the compilation of their country reports. Almost 600 contributors were registered on the FRA Platform by the end of the data-collection process and contributed directly to the preparation of the country reports.
To further contribute to the streamlining of forest-related data-collection and reporting processes and to increase awareness of FAO’s mandate to support and coordinate them, FAO convened six webinars targeting countries in Southeast Asia, West and Central Africa and Mesoamerica with the aim of increasing awareness of the FRA reporting process and its links to other reporting processes, including in the context of the Enhanced Transparency Framework and the SDGs. The webinars facilitated the exchange of information and knowledge among national focal points for the UNFCCC and the SDGs, among others. In total, 232 participants attended these webinars from 44 institutions in 24 countries (FAO, 2021).
Capacity development and open dialogue among the FRA national correspondents and FAO are key factors in delivering successful FRAs and ensuring consistency and continuity. At its twenty-third and twenty-fourth sessions in 2016 and 2018, the FAO Committee on Forestry recommended that FAO “supports the countries in strengthening collection, analysis and dissemination of forest data with a view to support the national SDG indicator framework and country reports”, “continues to explore new and innovative tools and techniques to further improve support to Members in collecting, analysing and reporting data on forest and related aspects” and “supports countries with tools, methodologies and capacity-building for generating better information and data on forests’ contribution to the SDGs” (FAO, 2016, 2018b).
In response to these recommendations, greater emphasis was placed on capacity development for FRA 2025. Most regions benefited from two regional workshops (double the number convened for FRA 2020), one on building capacity to interpret FRA terms and definitions and to access and use the FRA reporting platform for data entry and documentation and the other on reviewing, finalizing and submitting the country reports. Annex 1 provides a list of the workshops convened.
Doubling the number of regional workshops increased the efficiency of the reporting process by enabling the national correspondents to focus on the reporting task. Simultaneously, the national correspondents benefited from the assistance of a dedicated team of FAO reviewers, which was available to address any issues encountered. In total, 299 experts among national correspondents and their alternates and collaborators from 157 countries participated in the workshops. Twenty-seven percent of attendees were female, up from 17 percent for FRA 2020.
In addition to the workshops convened as part of the country reporting process, FAO initiated a cycle of capacity development and data collection for the participatory FRA Remote Sensing Survey (RSS) in 2023. The objective of the FRA RSS is to assist countries in using the latest remote-sensing data and tools for their analyses and to collect data to generate up-to-date independent estimates of forest area and forest-area change and its drivers at the regional and global levels and for global ecological zones (Box 9; Box 10).
Since 1990, Global Forest Resources Assessments (FRAs) have analysed global and regional status and trends for key forest attributes – such as forest area and changes in forest area – with data collected by remote sensing to complement information obtained through the country reporting process.
In FRA 2020, FAO introduced its novel participatory Remote Sensing Survey (RSS), which focused on enhancing the capacity of countries to produce high-quality data by combining local expertise with easy-to-use image interpretation tools to enable simultaneous access to the latest freely available remote-sensing data sources. More than 800 experts from 126 countries were trained at 34 national and regional workshops in the use of the RSS methodology to collect data from 400 000 samples. The results were published in 2022 and presented at the XV World Forestry Congress,i and the data were used in two complementary publications, The World’s Mangroves 2000–2020ii and How Much do Large-scale and Small-scale Farming Contribute to Global Deforestation?.iii
The FRA 2025 RSS builds on the experience gained in the FRA 2020 RSS and updates the results. Data-collection workshops in participating countries began in May 2024 and continued in 2025. In addition to the variables collected in the FRA 2020 RSS, in the present cycle FAO is piloting the gathering of additional information – on agroforestry systems, pastoral systems, crop types, burned forest, mangroves, and trees outside forests. The efficiency of the methodology has been increased by reducing the number of samples to about 300 000.
The RSS process strengthens the FRA in many ways. It assists countries in accessing and using the latest remote-sensing data and tools for national assessments. It provides representative data on crucial attributes such as deforestation, which may not always be available consistently through country reports. And it generates independent reference data based on a harmonized methodology and the most up-to-date data sources, facilitating both regional and global comparisons. Examples of added value produced by the FRA RSS 2020 include information on deforestation drivers, the effect of the scale of agricultural activities on their impacts on land-use change, and an early indication of a change in the trend in forest loss in Africa, which has now been confirmed by the country reporting process, as reported in the present publication.
The results of the FRA 2025 RSS will be published in 2026.
Sources: i FAO. 2022. FRA 2020 Remote Sensing Survey. FAO Forestry Paper 186. Rome. https://doi.org/10.4060/cb9970en. ii FAO. 2023. The world’s mangroves 2000–2020. Rome. https://doi.org/10.4060/cc7044en.iii Branthomme, A., Merle, C., Kindgard, A., Lourenço, A., Ng, W.-T., D’Annunzio, R. & Shapiro, A. 2023. How much do large-scale and small-scale farming contribute to global deforestation? Results from a remote sensing pilot approach. Rome, FAO. https://doi.org/10.4060/cc5723en
The use of remote sensing in forestry dates back a century, when foresters first recognized the potential of aerial photographs for field work and timber surveys. The first forestry applications emerged in Europe in the 1920s and later gained momentum in Canada and the United States of America.i
By the late 1960s, the concept of remote sensing in forestry had expanded to the use of satellite data. This was catalysed by the launch of the National Aeronautics and Space Administration’s Earth Resources Technology Satellite (later renamed Landsat-1) in 1972. Although the first forest-related applications used satellite images primarily to map forest types,ii the idea emerged of using the image’s optical density, or tone, measured by microdensiometer, to forecast other forest characteristics.iii It took almost another 20 years, however, before the first applications integrating national forest inventory data and satellite remote sensing became operational.iv
Remote sensing was first introduced to the FAO Global Forest Resources Assessment (FRA) in the context of FRA 1990 as a response to the emerging need to provide reliable estimates of tropical deforestation. A remote-sensing survey was carried out using two-stage stratified random sampling and 117 sampling units distributed throughout the pan-tropical zone. Each sampling unit was covered by Landsat images from the target years of 1980 and 1990 and an analysis of forest and land-cover change was conducted using transparent dot grid overlays.v
This survey was replicated ten years later as part of FRA 2000 to obtain estimates of forest and land-cover changes for 1980–1990 and 1990–2000. Additionally, with the support of partners, FAO developed the first global map of forests and other FRA land-cover classes.vi
Accessing and using satellite images for these early remote-sensing surveys was a complex and costly process requiring the screening, selection, purchase and processing of imagery. The generation of the first global multi-epoch orthorectified Landsat satellite dataset and its free availability online was a substantial change that led to an unprecedented increase in downloads and use of these data.vii It also enabled FAO to expand its remote-sensing surveys beyond the pan-tropical region to a comprehensive global assessment covering all biomes.
The FRA 2010 Remote Sensing Survey built on this Landsat dataset, systematically selecting almost 13 500 sample tiles, one on each 1-degree intersection of latitude and longitude. The survey combined automated classification and the visual validation of results by more than 200 national experts to derive estimates of forest area and changes in tree cover and forest land use between 1990 and 2005.viii The survey was later updated in the context of the subsequent assessment to include estimates for 2010.ix
The accessibility and usability of satellite images was greatly enhanced by the adoption of open-access data policies for the complete datasets acquired by the Landsat programme, the China–Brazil Earth Resources Satellite and the European Union’s Copernicus programme. Simultaneous advances in cloud-based satellite data storage and computing facilities, such as Google Earth Engine, have made these vast archives of satellite data readily available and allowed their processing into geospatial products in a fraction of the time previously required for local downloading and processing.
The open-access data pioneers have since been followed by others that have made various remote-sensing datasets available free of charge globally or for limited geographical regions. An example of this is the Satellite Data Program of Norway’s International Climate and Forest Initiative, launched in 2020–2024.
These advances have enabled FAO to enhance the timeliness and efficiency of its remote-sensing surveys, which no longer depend on pre-selected images for chosen epochs but can be based on data tailored for the specific needs of the survey, supported by simultaneous access to a wide range of auxiliary information. Additionally, user-friendly interpretation tools are enabling local experts with field knowledge but no background in remote sensing to participate in image interpretation work. This, in turn, has allowed the development of a new participatory survey methodology that integrates available local land-use knowledge into the visual interpretation of hundreds of thousands of remote-sensing samples. Box 9 contains more details of the methods used for the FRA 2020 and FRA 2025 remote-sensing surveys.
The combination of freely accessible and easy-to-use remote-sensing data, tools and guidance has increased the use of remote sensing in the country reporting process described in this report. Globally, the number of countries and areas using remote sensing to assess their forest areas almost doubled between 2005 and 2020.x In FRA 2025, remote-sensing-based assessments were specified as the sources of 42 percent of the data entries used in reporting on the area of forest and other wooded land.
Sources: i E.g. Spurr, S.H. 1948. Aerial photography. In Forest resources of the world. Unasylva, 2(4); Nyyssönen, A. 1955. On the estimation of the growing stock from aerial photographs. Communicationes Instituti Forestalis Fenniae, 46.1: (1–57). ii Iverson, L.R., Graham, R.L. & Cook, E.A. 1989. Application of satellite remote sensing to forested ecosystems. Landscape Ecology, 3(2): 131–143. iii Kuusela, K. & Poso, S. 1975. Demonstration of the applicability of satellite data to forestry. Communicationes Instituti Forestalis Fenniae, 83:4, 1–31. iv Barrett, F., McRoberts, R.E., Tomppo, E., Cienciala, E. & Waser, L.T. 2016. A questionnaire-based review of the operational use of remotely sensed data by national forest inventories. Remote Sensing of Environment, 174: 279–289. https://doi.org/10.1016/j.rse.2015.08.029. v FAO. 1996. Forest resources assessment 1990: Survey of tropical forest cover and study of change processes. FAO Forestry Paper No. 130. Reprinted 1996. Rome. vi FAO. 2001. Global Forest Resources Assessment 2000. FAO Forestry Paper No. 140. Rome. vii Gutman, G., Byrnes, R.A., Masek, J., Covington, S., Justice, C., Franks, S. & Headley, R. 2008. Towards monitoring land-cover and land-use changes at a global scale: the global land survey 2005. Photogrammetric Engineering and Remote Sensing, 74(1): 6–10. viii FAO & Joint Research Centre of the European Commission (JRC). 2012. Global forest land-use change 1990–2005, by E.J. Lindquist, R. D’Annunzio, A. Gerrand, K. MacDicken, F. Achard, R. Beuchle, A. Brink, H.D. Eva, P. Mayaux, J. San-Miguel-Ayanz & H-J. Stibig. FAO Forestry Paper No. 169. Rome, FAO and JRC. Rome, FAO. ix D’Annunzio, R., Lindquist, E. & MacDicken, K. 2017. Global forest land-use change from 1990 to 2010: An update to a global remote sensing survey of forests. Forest Resources Assessment Working Paper No. 187. Rome, FAO. x Nesha, K., Herold, M., De Sy, V., Duchelle, A.E., Martius, C., Branthomme, A., Garzuglia, M., Jonsson, O. & Pekkarinen, A. 2021. An assessment of data sources, data quality and changes in national forest monitoring capacities in the Global Forest Resources Assessment 2005–2020. Environmental Research Letters, 16(5): 054029. https://doi.org/10.1088/1748-9326/abd81b
As FRAs have become more comprehensive, the amount of information requested from FAO Members has increased substantially. The number of variables collected increased from 45 for FRA 2005, to about 90 for FRA 2010, to about 120 for FRA 2015. The reporting burden on countries has also been exacerbated by requests for the same or similar data in other forest-related reporting processes.
A recurring recommendation for FRAs and similar processes has been to reduce the reporting burden on countries and increase the quality and transparency of the reported data. This was done for the first time for FRA 2020, with the number of variables collected cut to about 60. FRA 2025 has continued in this vein, with about 50 broad variables, thereby further reducing the reporting burden while also making FRA data more consistent, transparent and relevant. The reporting burden has been further reduced by the pre-filling of reporting tables with the data reported for FRA 2020.
FAO has continued to improve the FRA reporting platform, which now provides easy access to the reporting tables; facilitates data and metadata entry; allows the uploading of documents for public sharing and/or internal documentation; performs additional on-the-fly validation checks; provides functionalities for data visualization and downloads; and enables direct messaging between collaborators and reviewers. FAO’s collaboration with Google LLC/Google has led to the development of geospatial modules that give registered platform users access to the latest remote-sensing products and facilitates the use of these to generate estimates on, for example, tree cover, burned area, protected-forest area and mangrove area.
FRA 2025 estimates are based on official national statistics derived from field inventories, remote sensing, expert estimates and a combination of these. Many governments in developing countries have invested in the last decade in the development of national forest monitoring systems, often supported by donors and international organizations. FAO has assisted more than 50 national governments since 2009 to develop robust national forest inventories and satellite-based land-monitoring systems. In addition, FAO’s work in Open Foris on free and open-source tools has reached more than 250 000 users in 196 countries and areas. By building on the functionalities of FAO’s System for Earth Observation Data Access, Processing and Analysis for Land Monitoring system, SEPAL,17 FAO has provided all FRA Platform users with access to customizable Landsat and Sentinel image mosaics for their visualization. Combined with FRA-specific capacity building, these efforts have had a clear positive impact on the availability and quality of information on forest resources (Nesha et al., 2021).
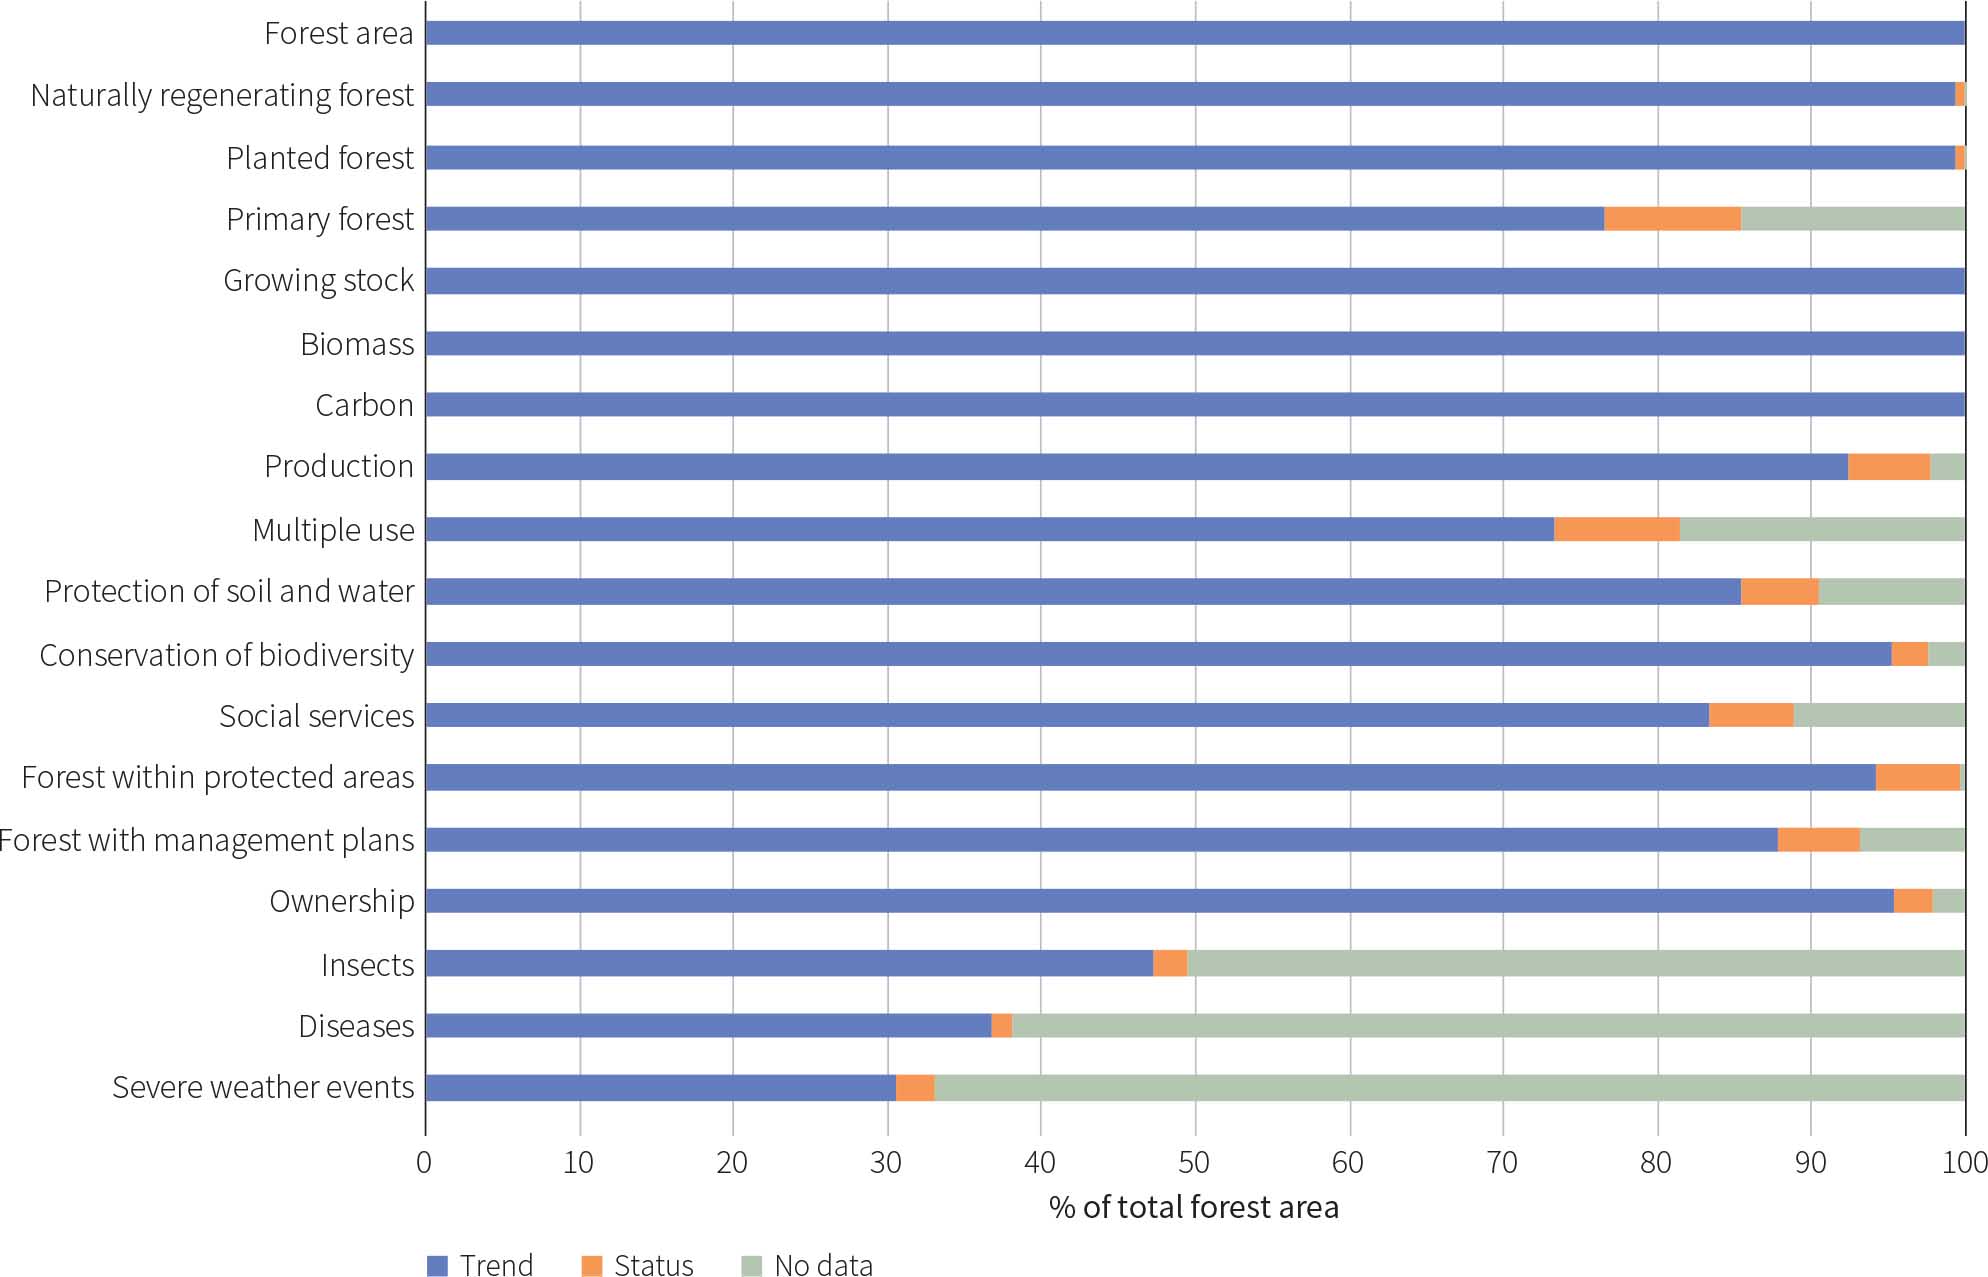
The response frequency of countries and areas for FRA 2025 was generally very good, and data availability for key variables is high. The number of reporting countries and areas increased for all variables compared with FRA 2020. Of the 18 variables shown in Figure 62,18 the global forest area represented by reporting countries and areas exceeded 90 percent for 11 variables reporting on status. The reporting on trends in forest area exceeded 90 percent for ten of the 18 variables. The lowest data availability was for insects, diseases and severe weather events, with the countries and areas reporting on these factors representing less than half the global forest area.
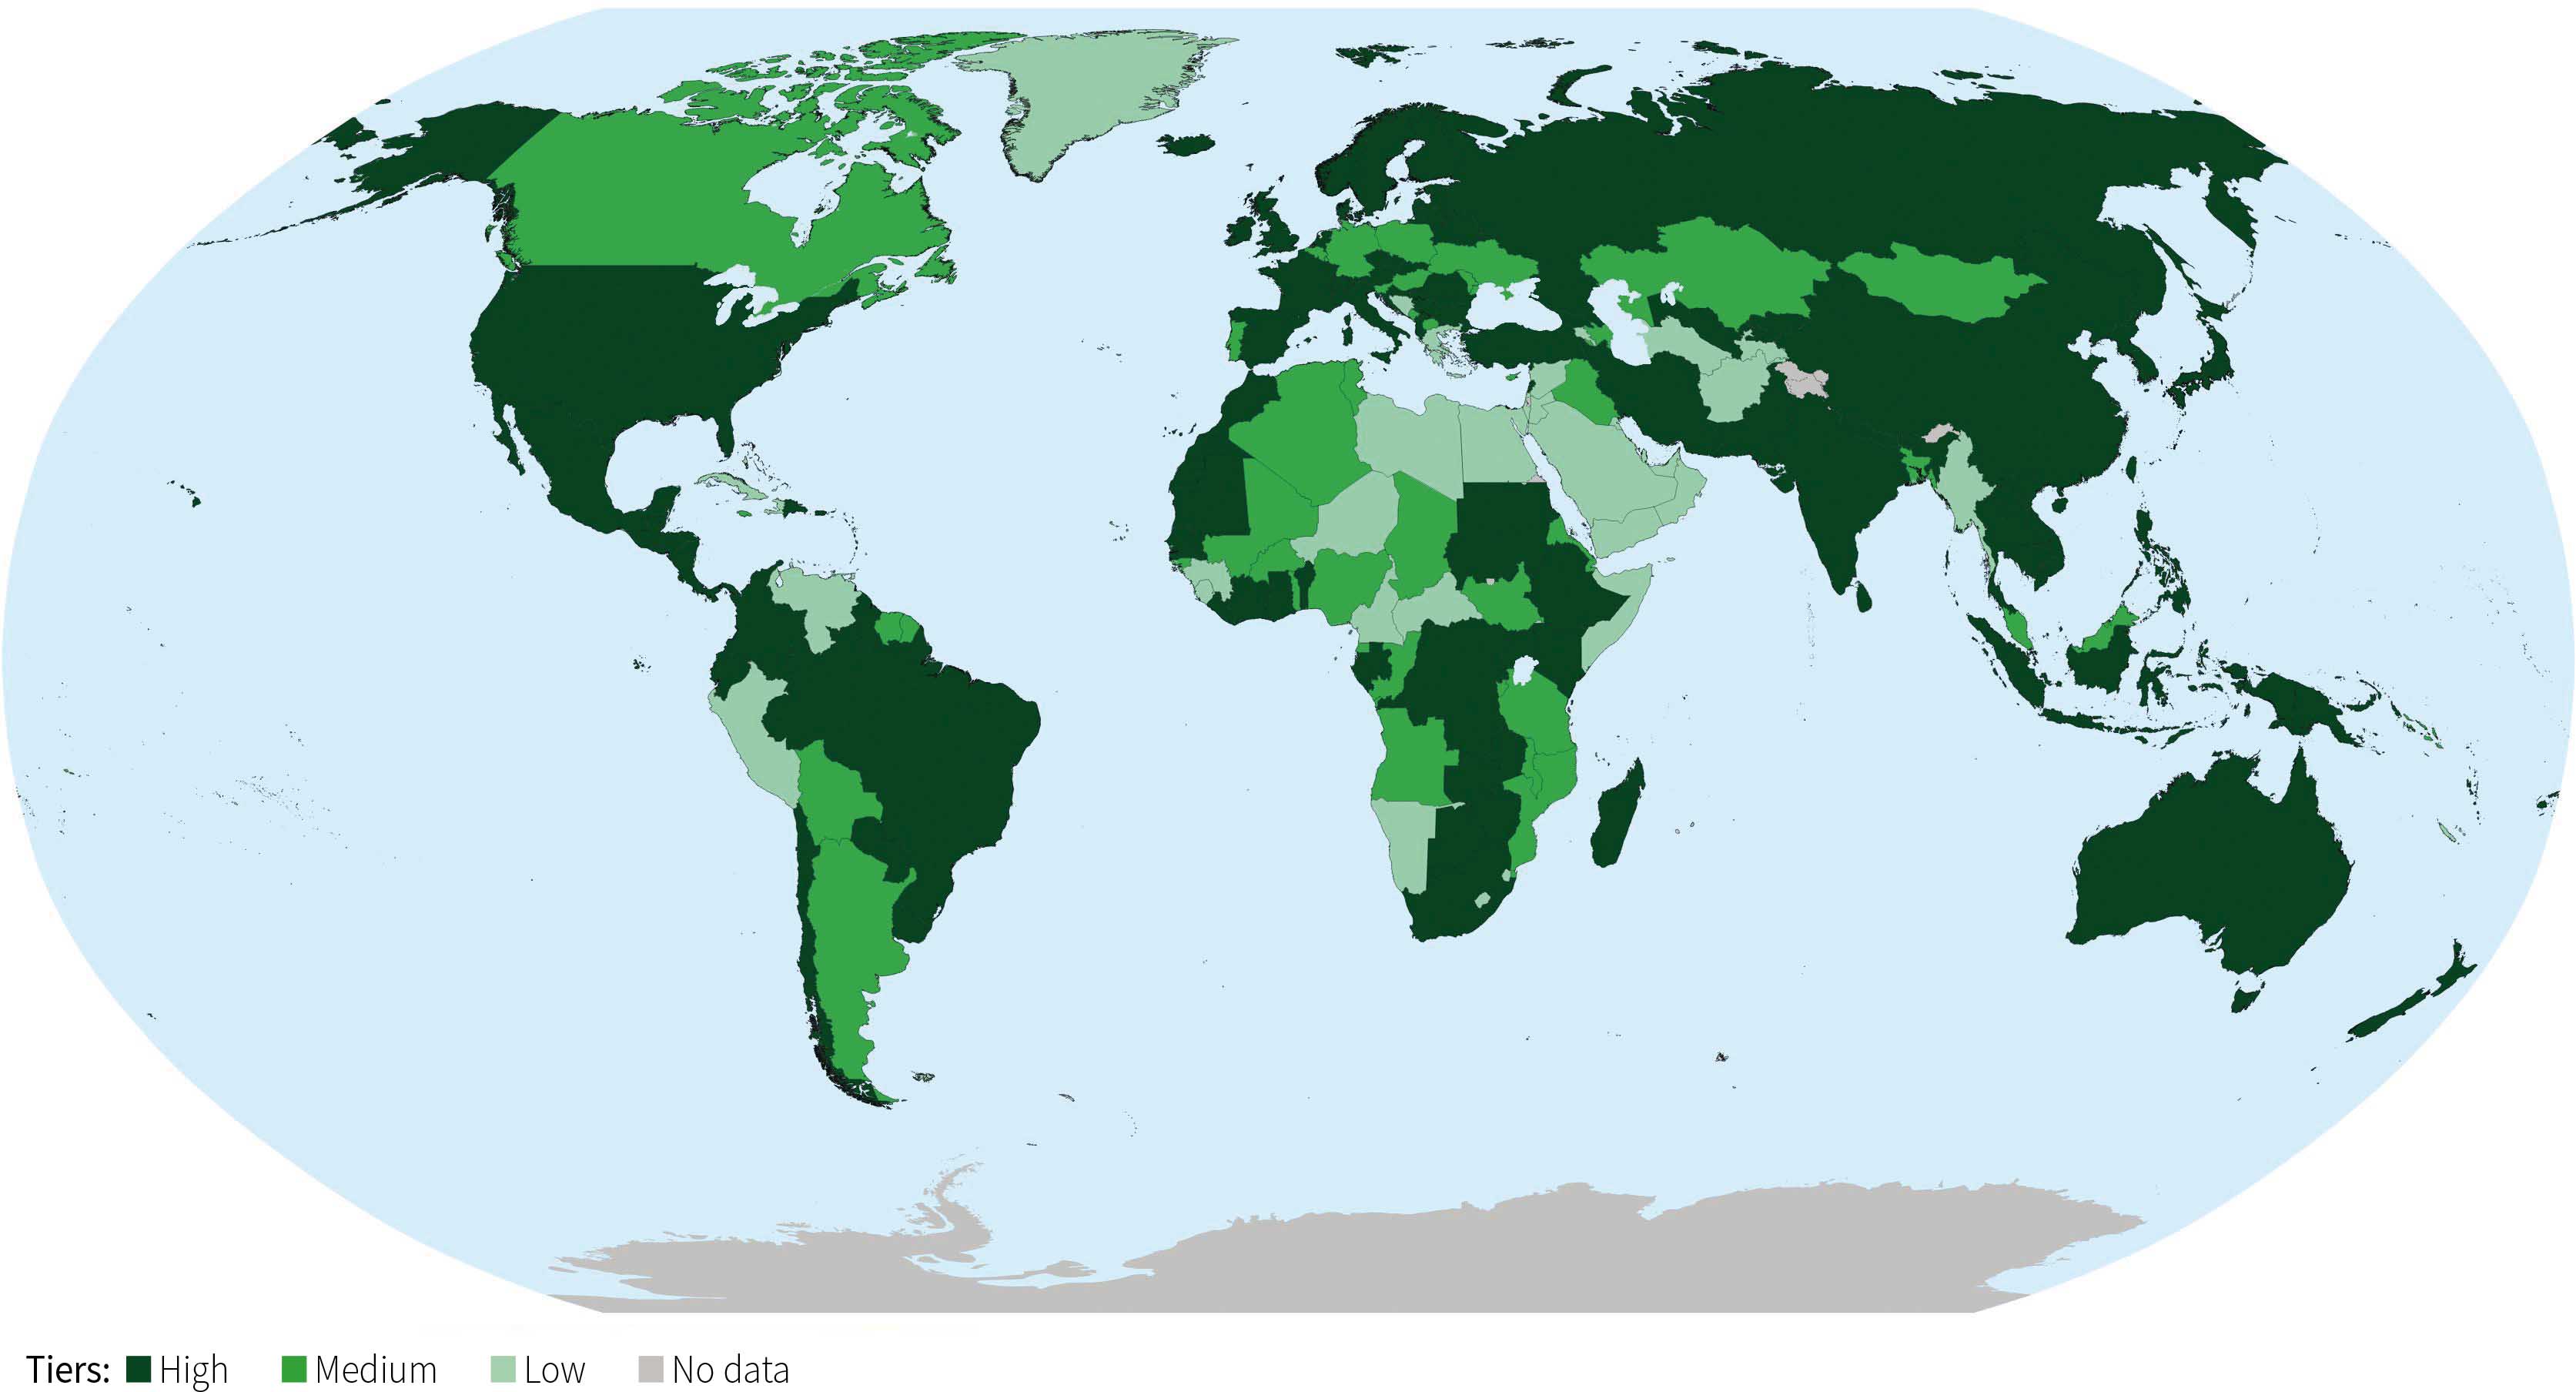
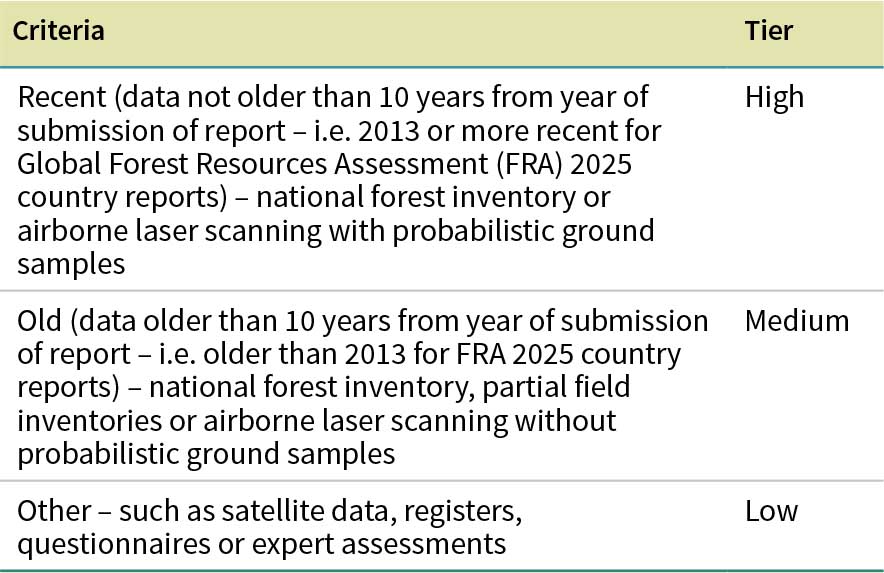
To increase understanding of data quality for forest-area estimates, countries were asked to document their data sources and rank them in reliability tiers for status and trends (Table 89). For forest area status, 104 countries reported that their data were consistent with the high tier, meaning that 75 percent of their forest-area estimates for 2025 was based on recent data from a national forest inventory or remote sensing, with accuracy assessment or field-data calibration. Another 62 countries, representing 19 percent of the forest area, based their forest-area estimates on data that were more than five years old at the time of submission (i.e. 2023), thus assigning them to the medium tier. The remaining 70 countries, representing 6 percent of the global forest area, were assigned to the low tier (Figure 63).

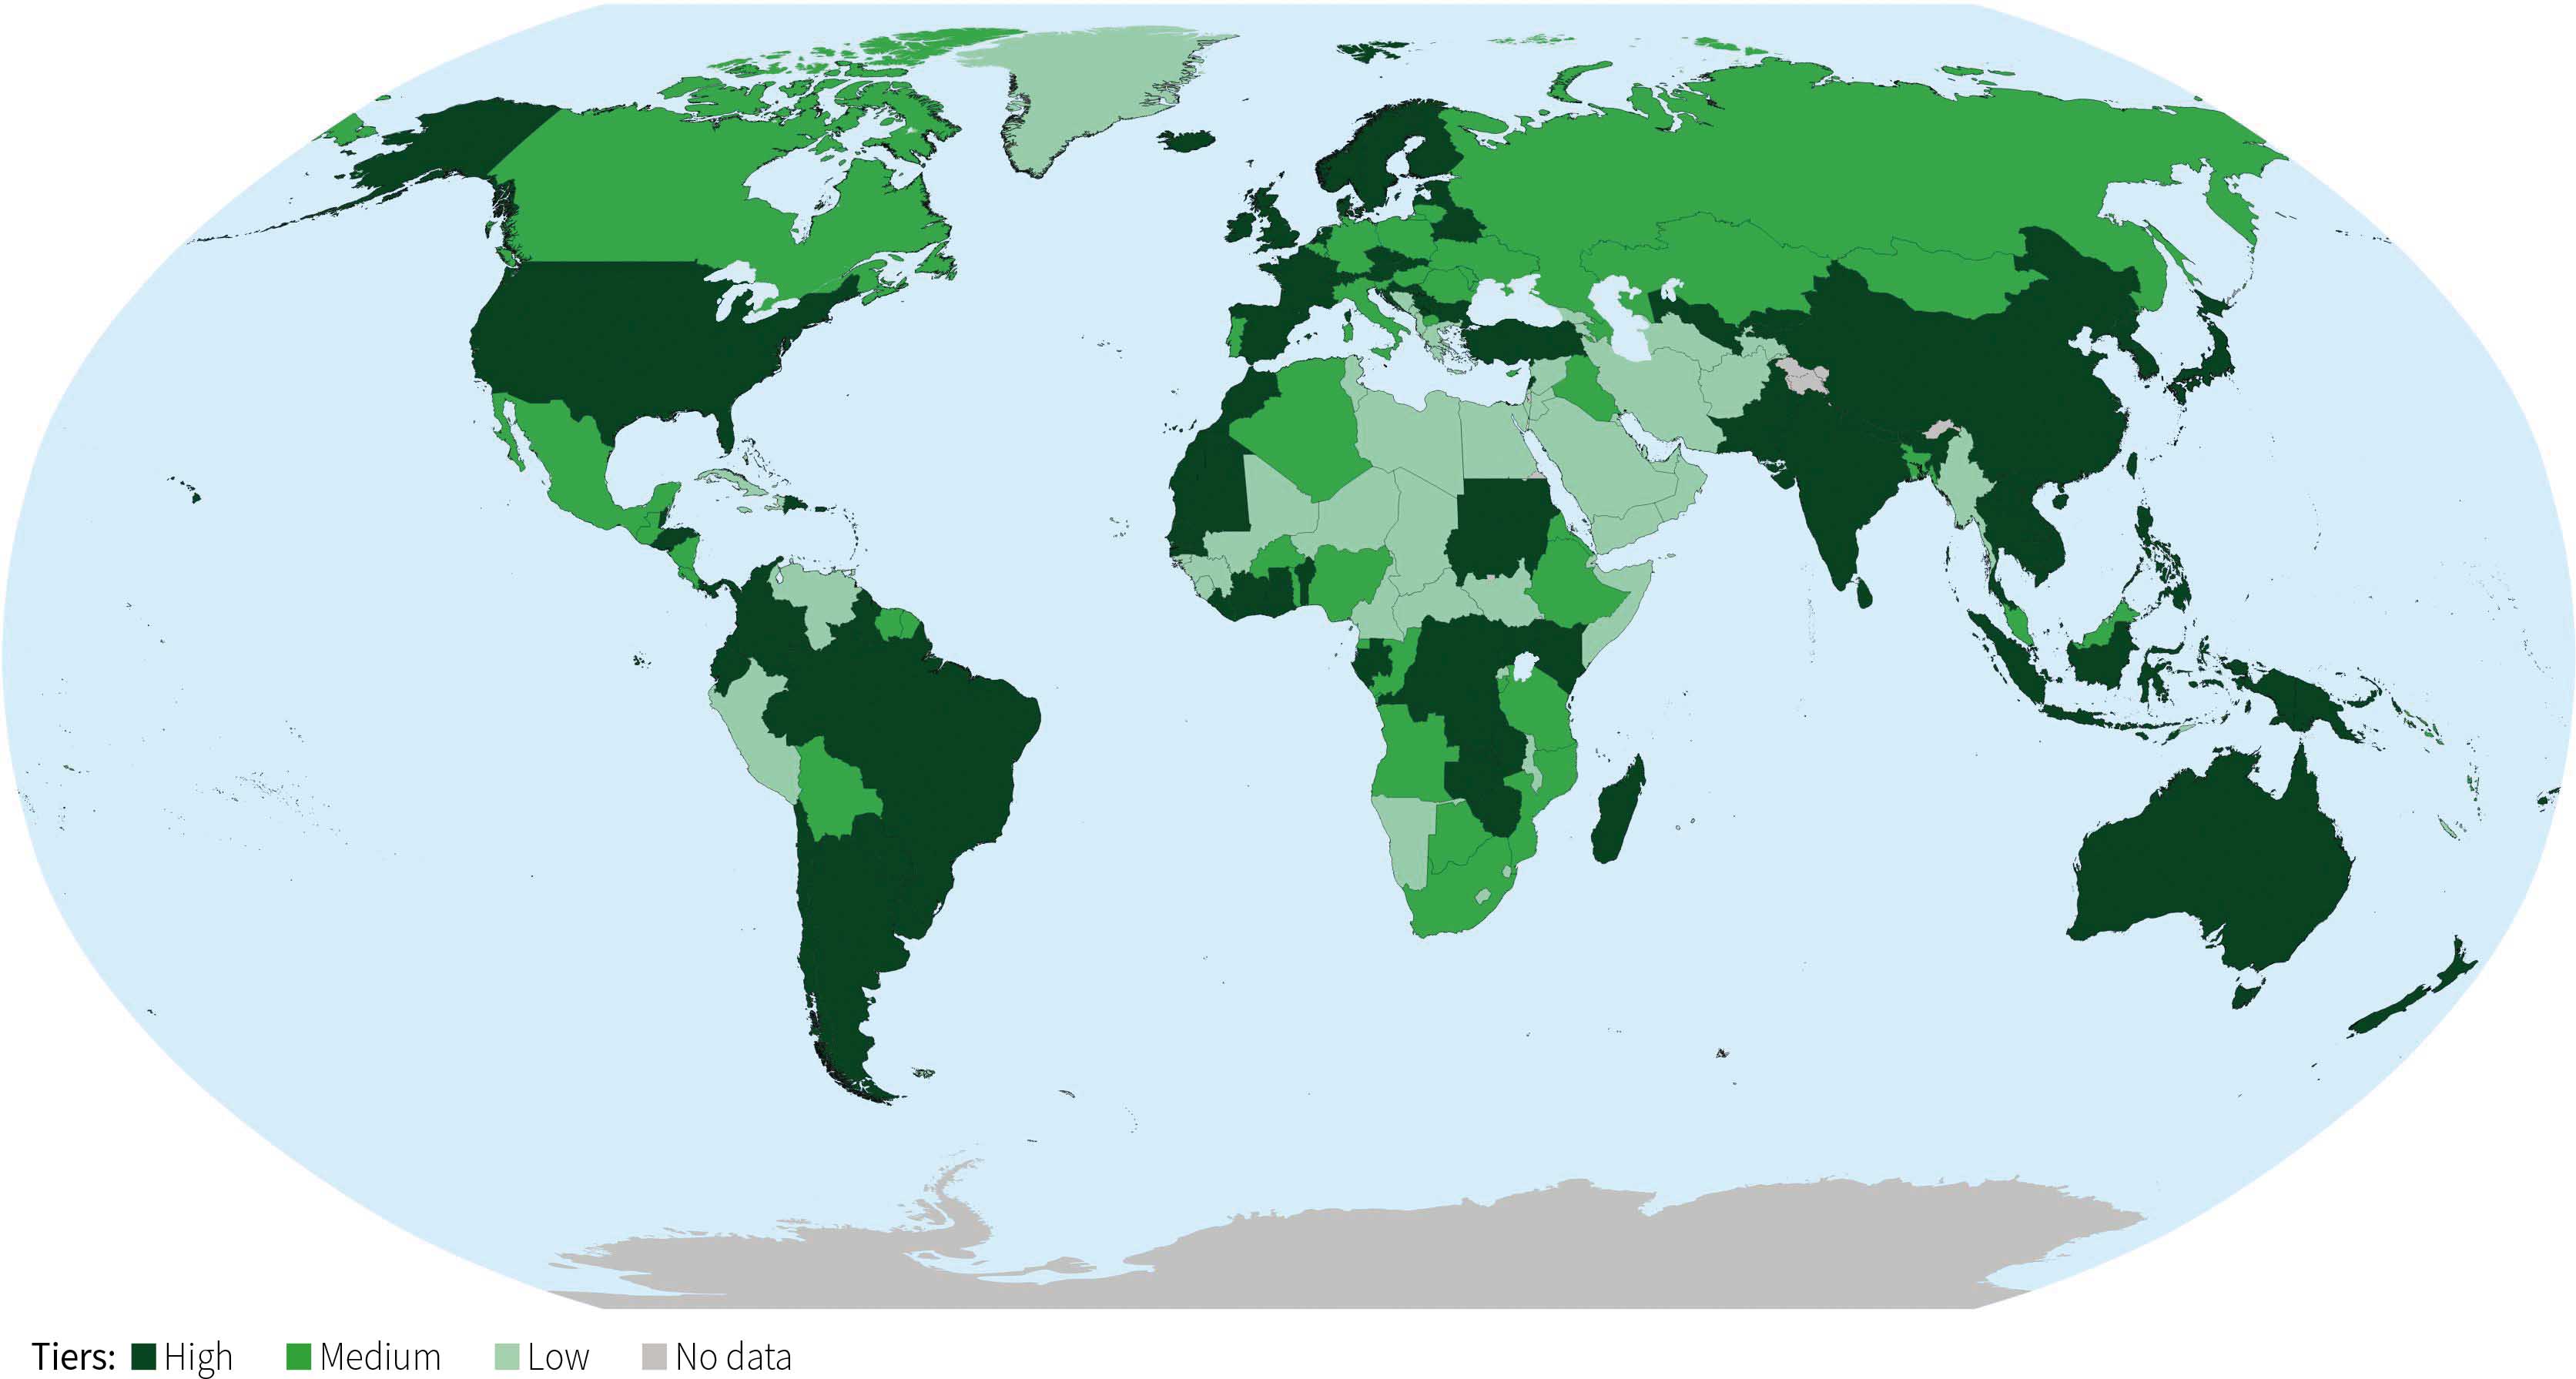
Eighty-eight countries representing more than half (52 percent) of the world’s forest area based their trend estimates on repeated compatible national forest inventories, of which the most recent was not older than five years, and/or remote-sensing change assessments using multitemporal analysis for a period ending not more than five years before the date of submission (high tier). Fifty-six countries representing 41 percent of the global forest area reported that their trend estimates were in the medium tier of accuracy, and the remaining 92 countries (representing 7 percent of the total forest area) estimated forest-area trends based on expert opinion or incompatible datasets (i.e. the low tier) (Figure 64).
A three-class tier system was applied by countries and areas to indicate differences in data used for reporting on growing-stock status (Table 90). In 2025, data on growing stock for 33 percent of the countries and areas representing two-thirds of the world’s forest area were assessed as high-tier. The proportion of countries and areas – and of forest area – with high-tier data is relatively high in East Asia and Europe and comparatively low in Africa and Oceania (Figure 65).

A comparison with FRA 2020 indicates a significant improvement in reporting coverage for FRA 2025, with an increase in both the number of countries and areas reporting on growing stock (from 183 in FRA 2020 to 216 in FRA 2025) and in the forest area represented across all growing-stock variables. Nevertheless, the tier analysis also shows that both the number of reporting countries and areas and the proportion of forest area assessed as high-tier declined in FRA 2025 compared with FRA 2020. Unlike in FRA 2020, the tier assessment for FRA 2025 was carried out directly by the reporting countries and areas. Further analysis is required to determine whether the apparent decline reflects this change (or other changes) in the tier assessment methodology or an actual negative trend in the quality of data sources for growing-stock assessment, such as a lack of updates of national forest inventories.
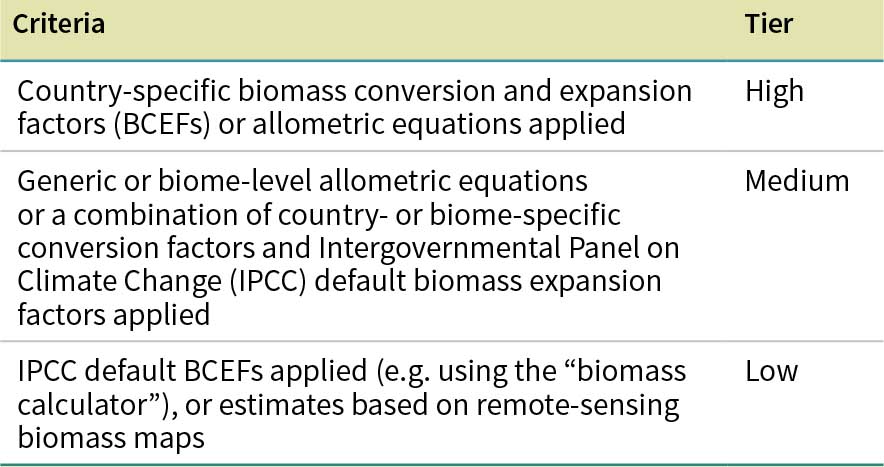
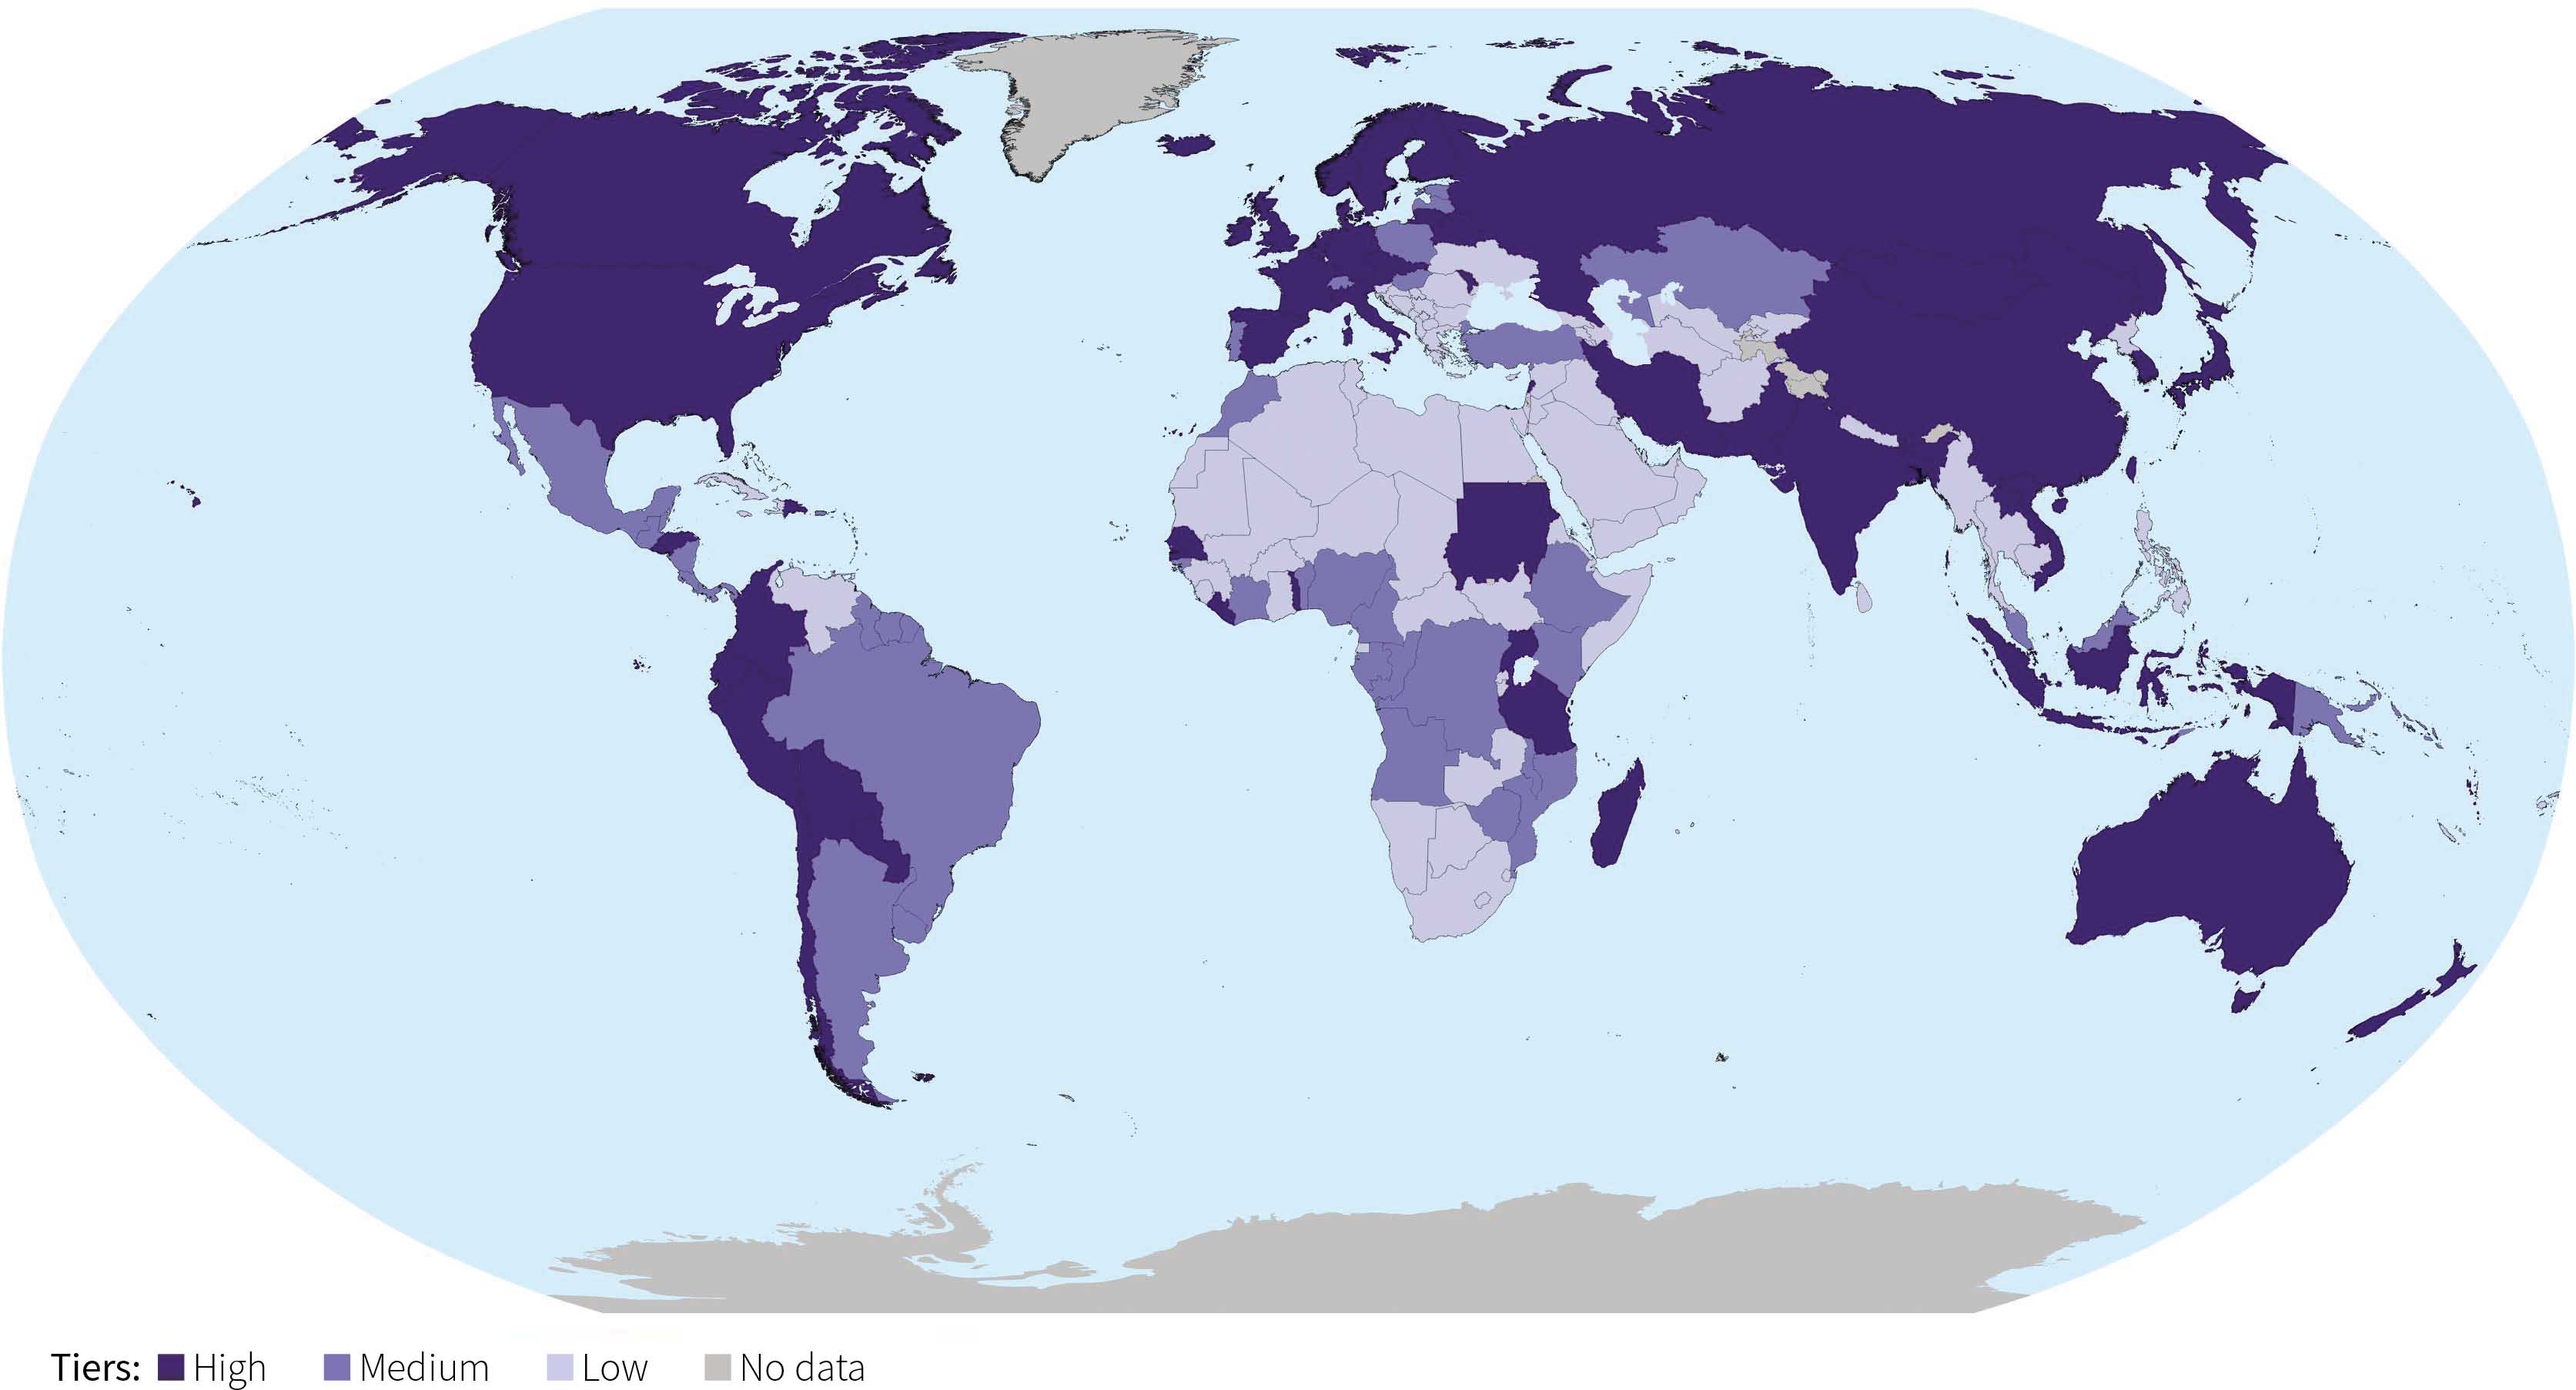
A three-class tier system was applied by countries and areas to evaluate the quality of data used for reporting on biomass (Table 91). In 2025, 28 percent of countries and areas representing nearly two-thirds of the forest area used high-tier data for biomass reporting. High-tier coverage was most prevalent in Europe and least prevalent in Africa (Figure 66).
The number of countries and areas reporting on biomass increased from 193 in FRA 2020 to 216 in FRA 2025. There was, however, a decline in the proportion of forest area covered by high-tier data, despite an increase in the number of countries and areas using high-tier methods. Further investigation is needed to determine whether the observed trends reflect an actual decline in data quality or methodological changes in tier assessment.
The recently introduced possibility for countries and areas to make voluntary FRA report updates within the regular five-year FRA reporting cycles is significant for data availability. Allowing voluntary data updates is a direct response to a request made at the twenty-fifth session of the Committee on Forestry to develop a flexible FRA reporting process that allows voluntary updates of key indicators related to SDG 15 and other indicators, at the discretion of Members.
Implementation of the voluntary update process and the preparation of related guidance has included a revision of the terms of reference of national correspondents, an updated process for the review of the reports, and a streamlined validation process. The FRA Platform has also been adjusted to facilitate voluntary updates, thus helping build a more dynamic and responsive global forest information system that can better serve the needs of countries, researchers and the international community.
The transition to a more flexible reporting process has several benefits. It allows the reports to be updated and shared with a global audience as new information becomes available; supports the timely monitoring of progress towards the SDGs and other jointly agreed global goals and targets; and allows the more rapid communication of important changes and trends. This flexibility in FRA reporting is likely to be increasingly important, given emerging needs for frequent reporting on key variables and indicators such as the two forest-related SDG indicators, which also have strong linkages with other global initiatives and commitments. In collaboration with FAO Members, the FRA Advisory Group, Collaborative Forest Resources Questionnaire partners, and others, FRA will continue to evolve as a dynamic and transparent reporting process that provides easy access to high-quality, up-to-date data.
The aims behind the changes introduced to FRA 2025 are to reduce the reporting burden on countries and areas and improve data availability and consistency. Future FRAs will continue working with partners to achieve these objectives and increase synergies with other forest-related processes and thus assist national and international policy formulation and decision-making processes. The focus will also be maintained on the transparency and traceability of estimates and the quality and usability of the data published.
As requested by FAO governing bodies, FAO will continue to produce comprehensive FRAs every five years. Joint planning for the next global assessment cycle (FRA 2030) will begin in 2026 after an in-depth evaluation of FRA 2025. As per well-established practice, the scope and other technical aspects will be finalized via an expert consultation in 2026 or 2027.
FAO will continue to invite countries and areas to update their reports on a voluntary basis as new information becomes available. The plan is to publish the first updates in early 2026 through the FRA Platform and, for specific indicators, as part of SDG reporting.