


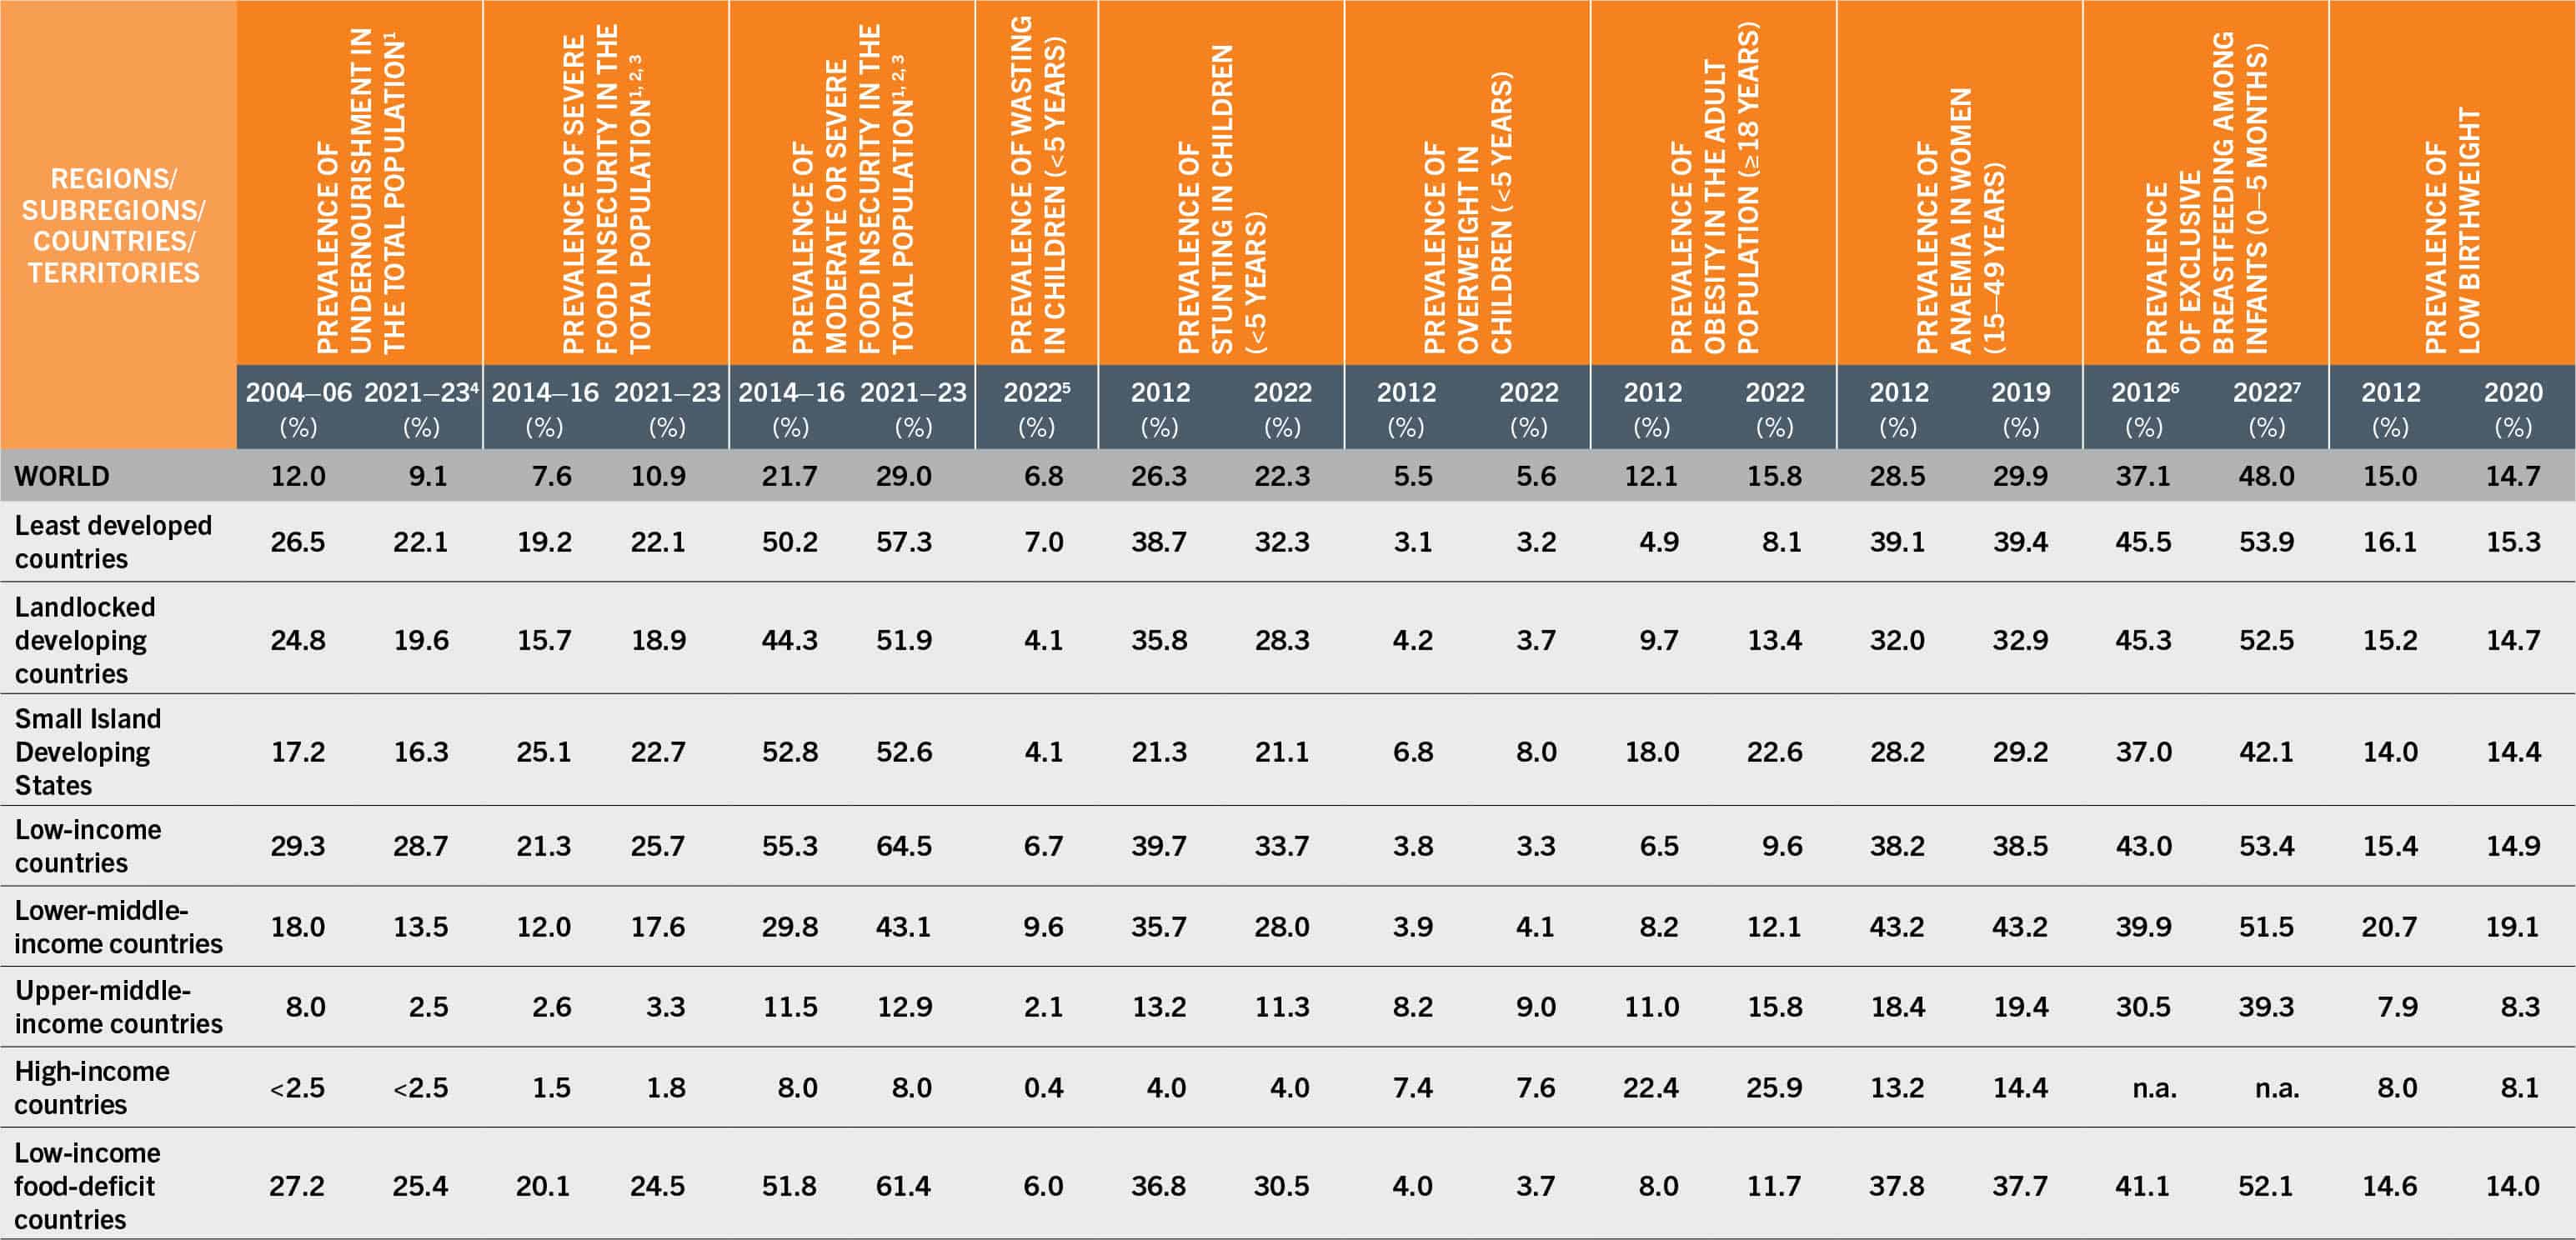
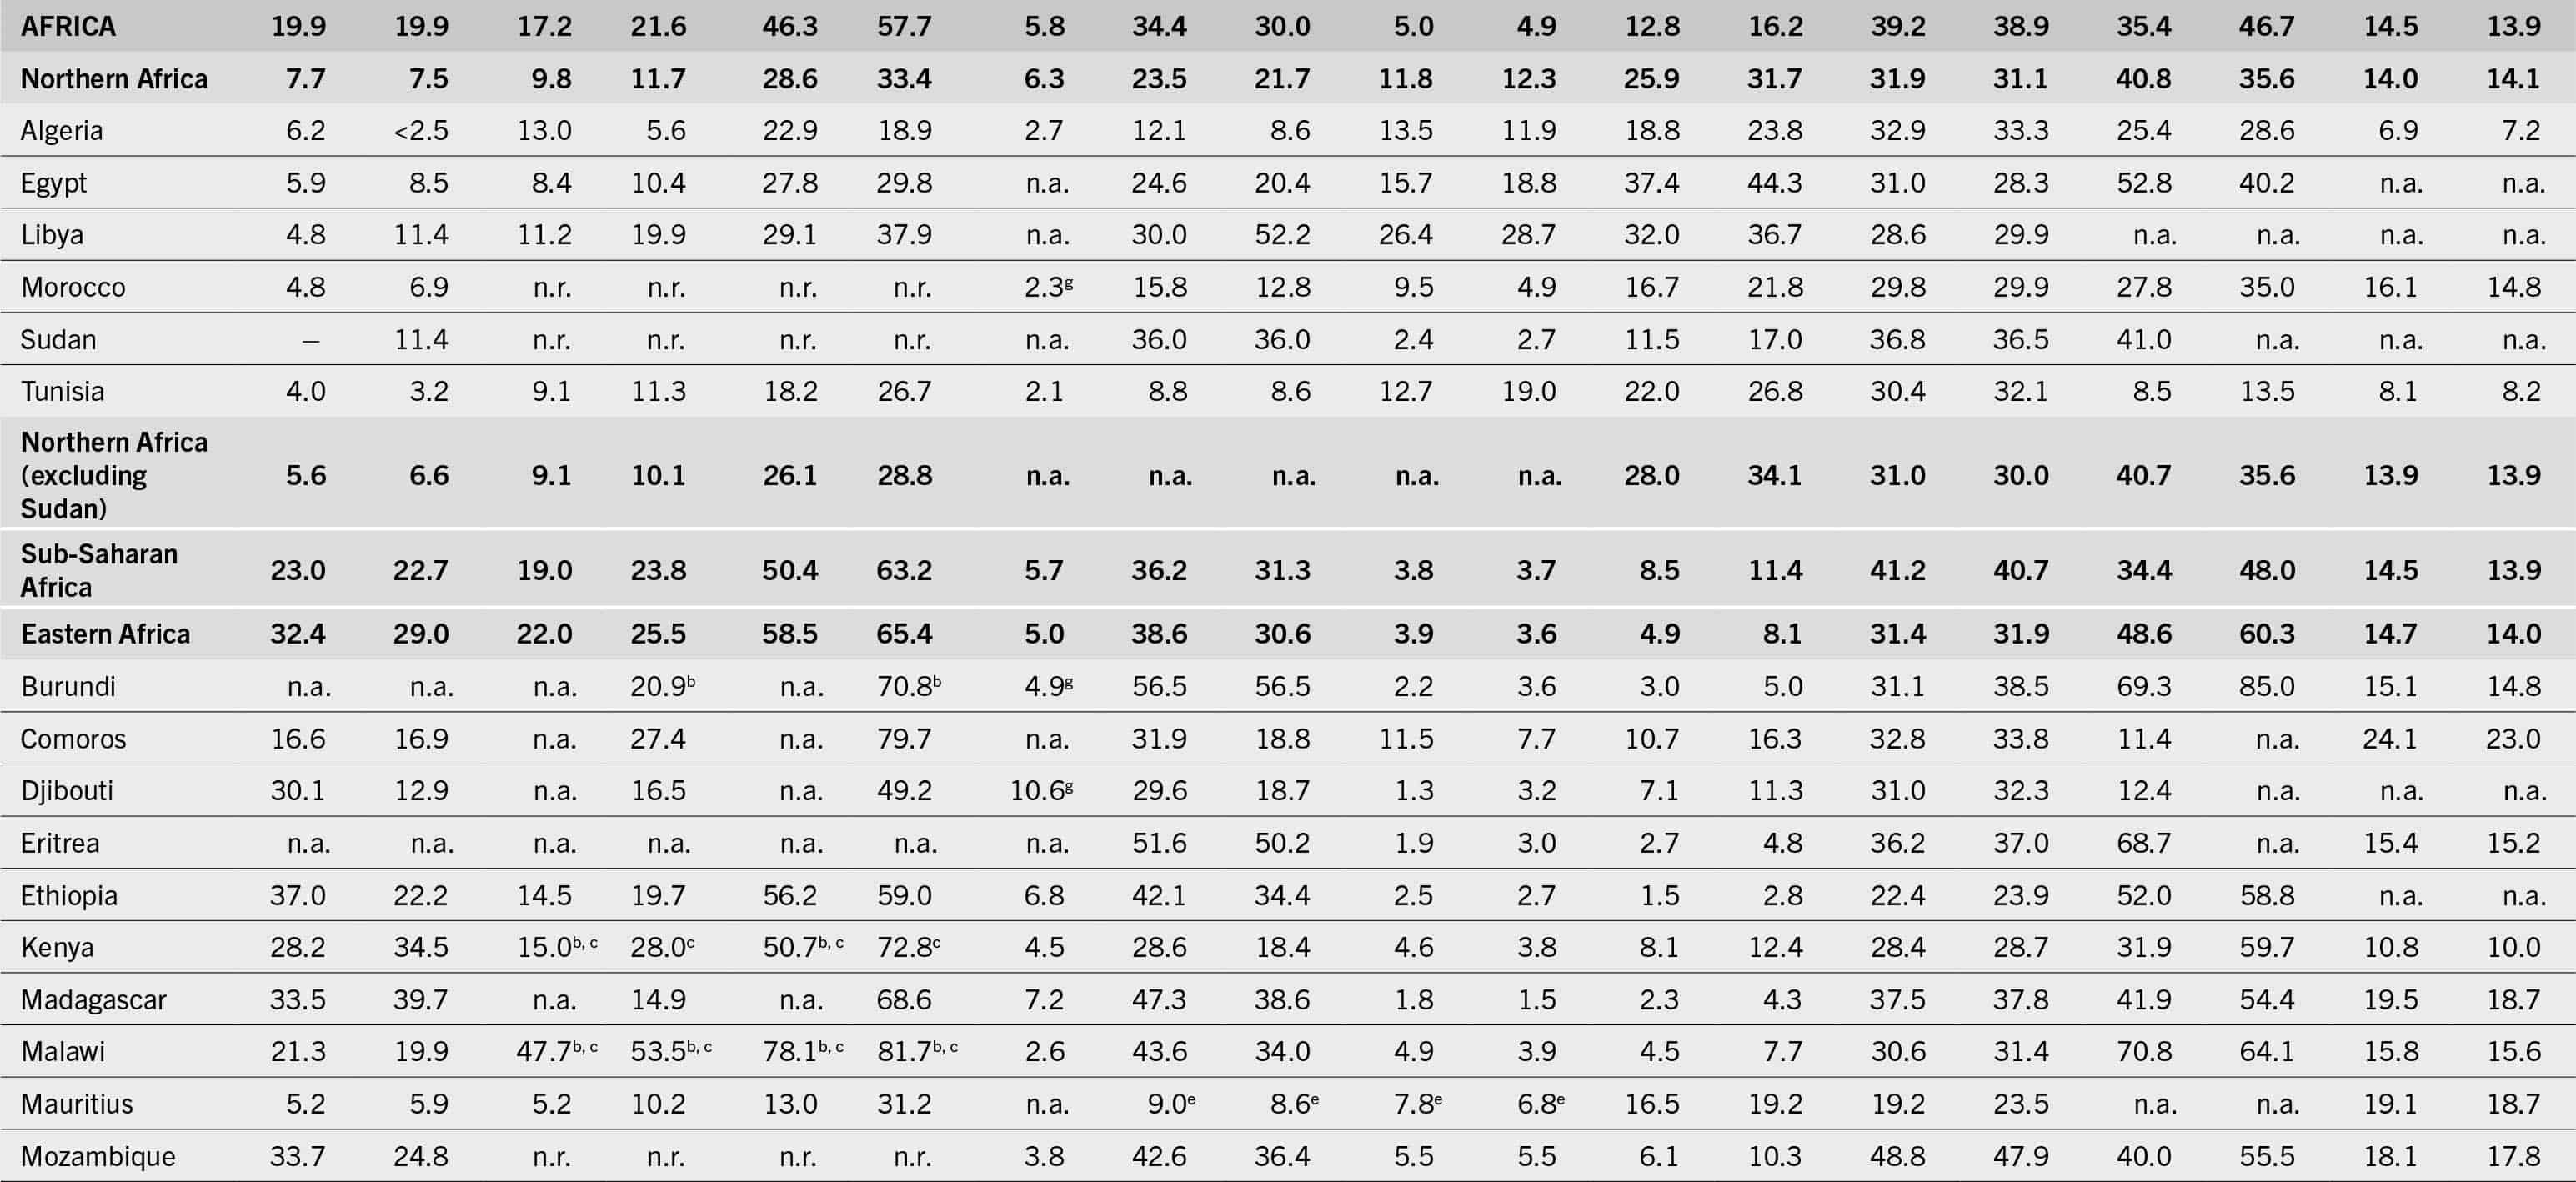
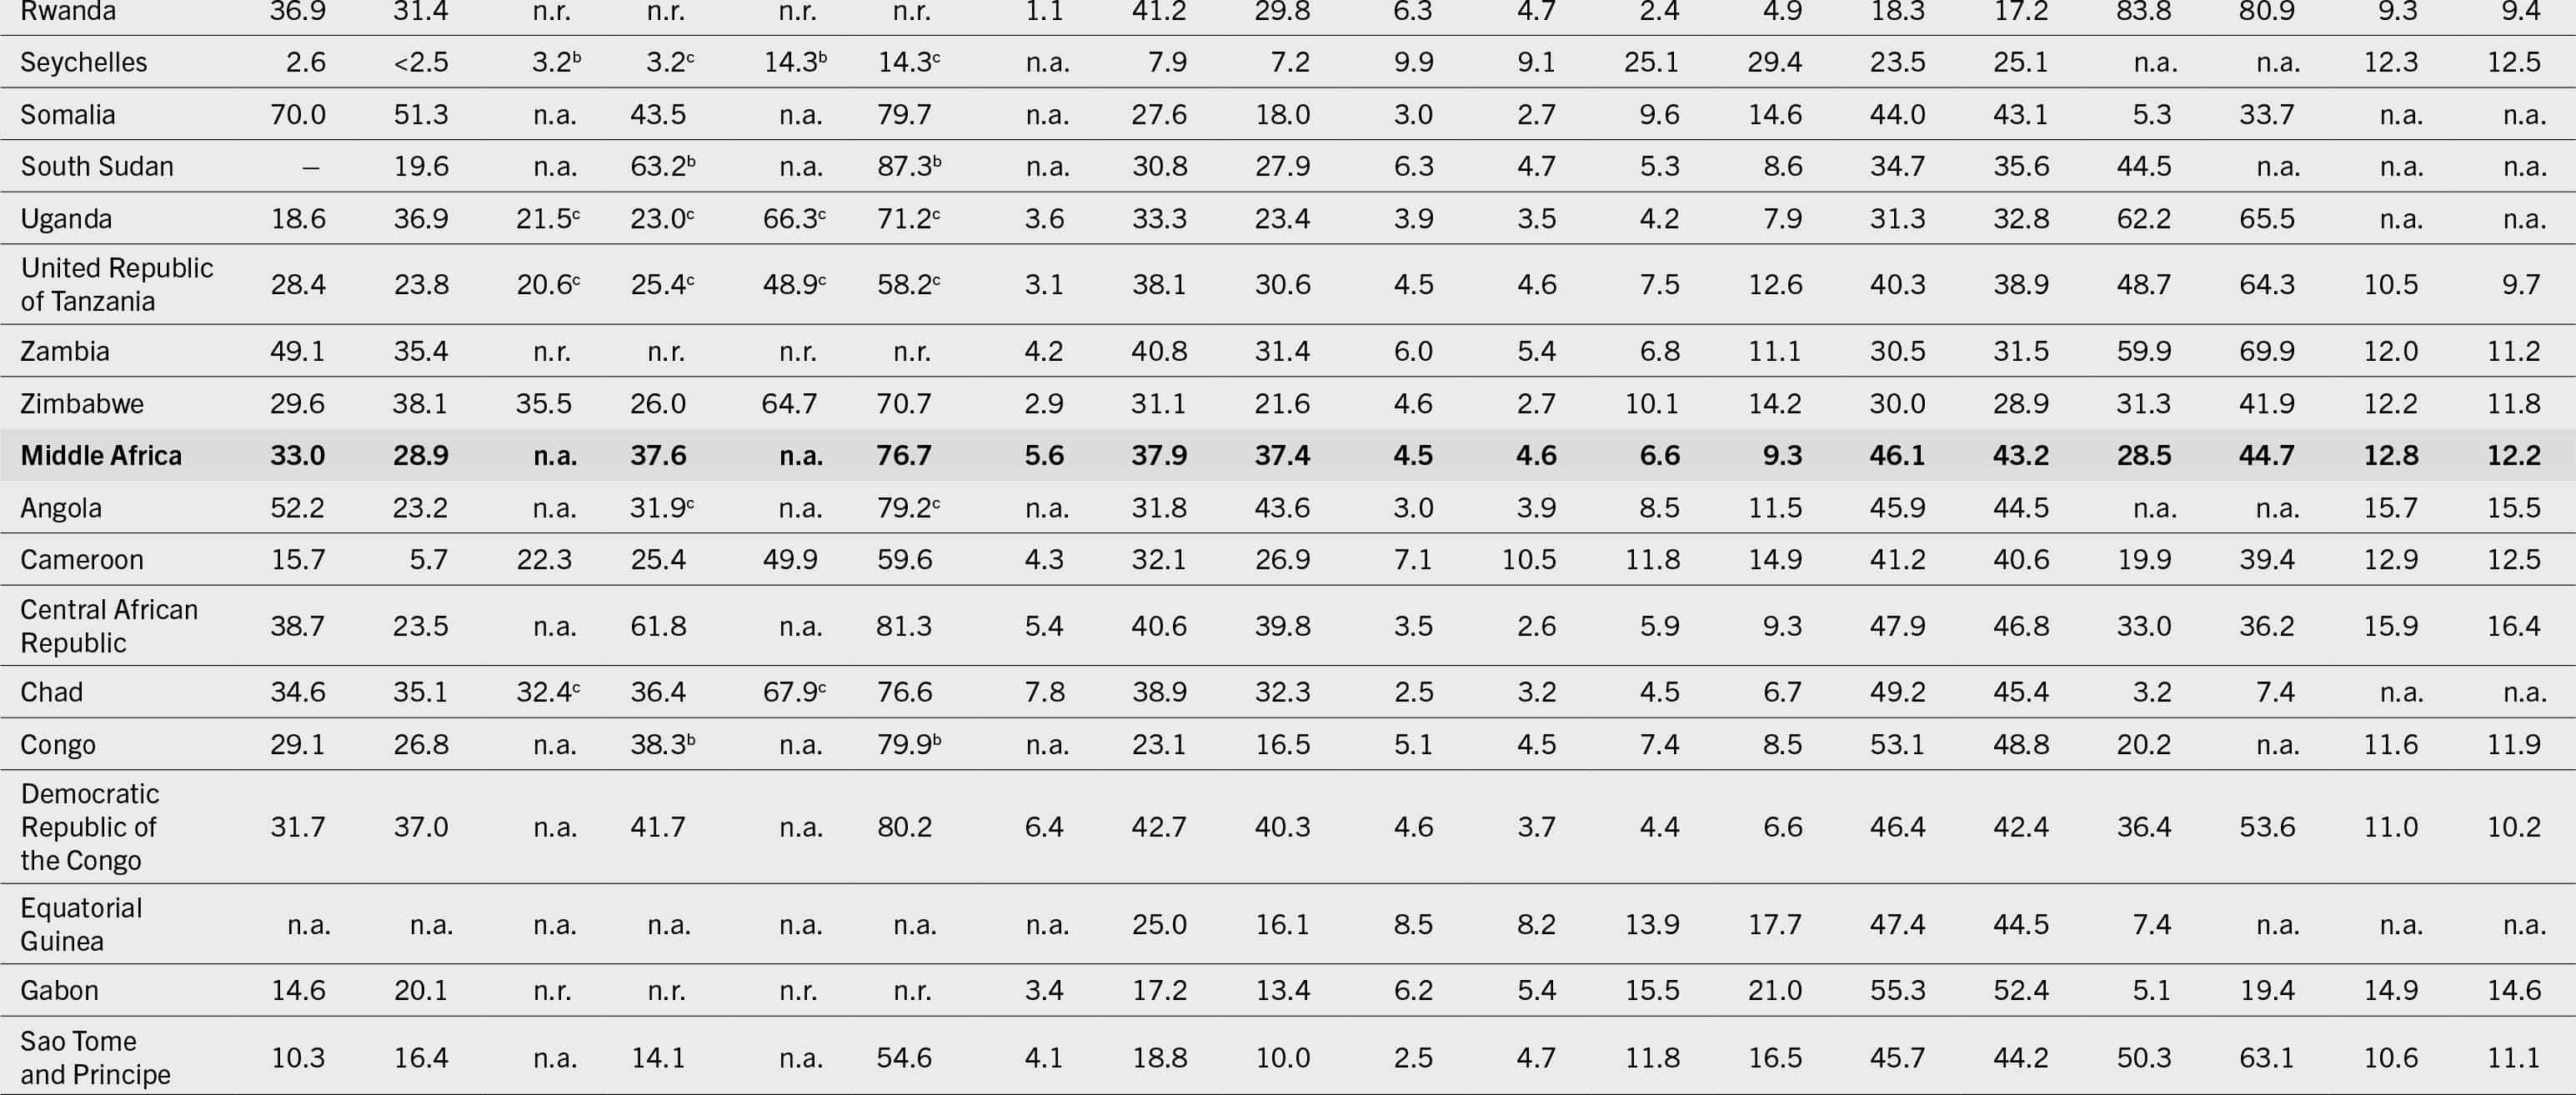
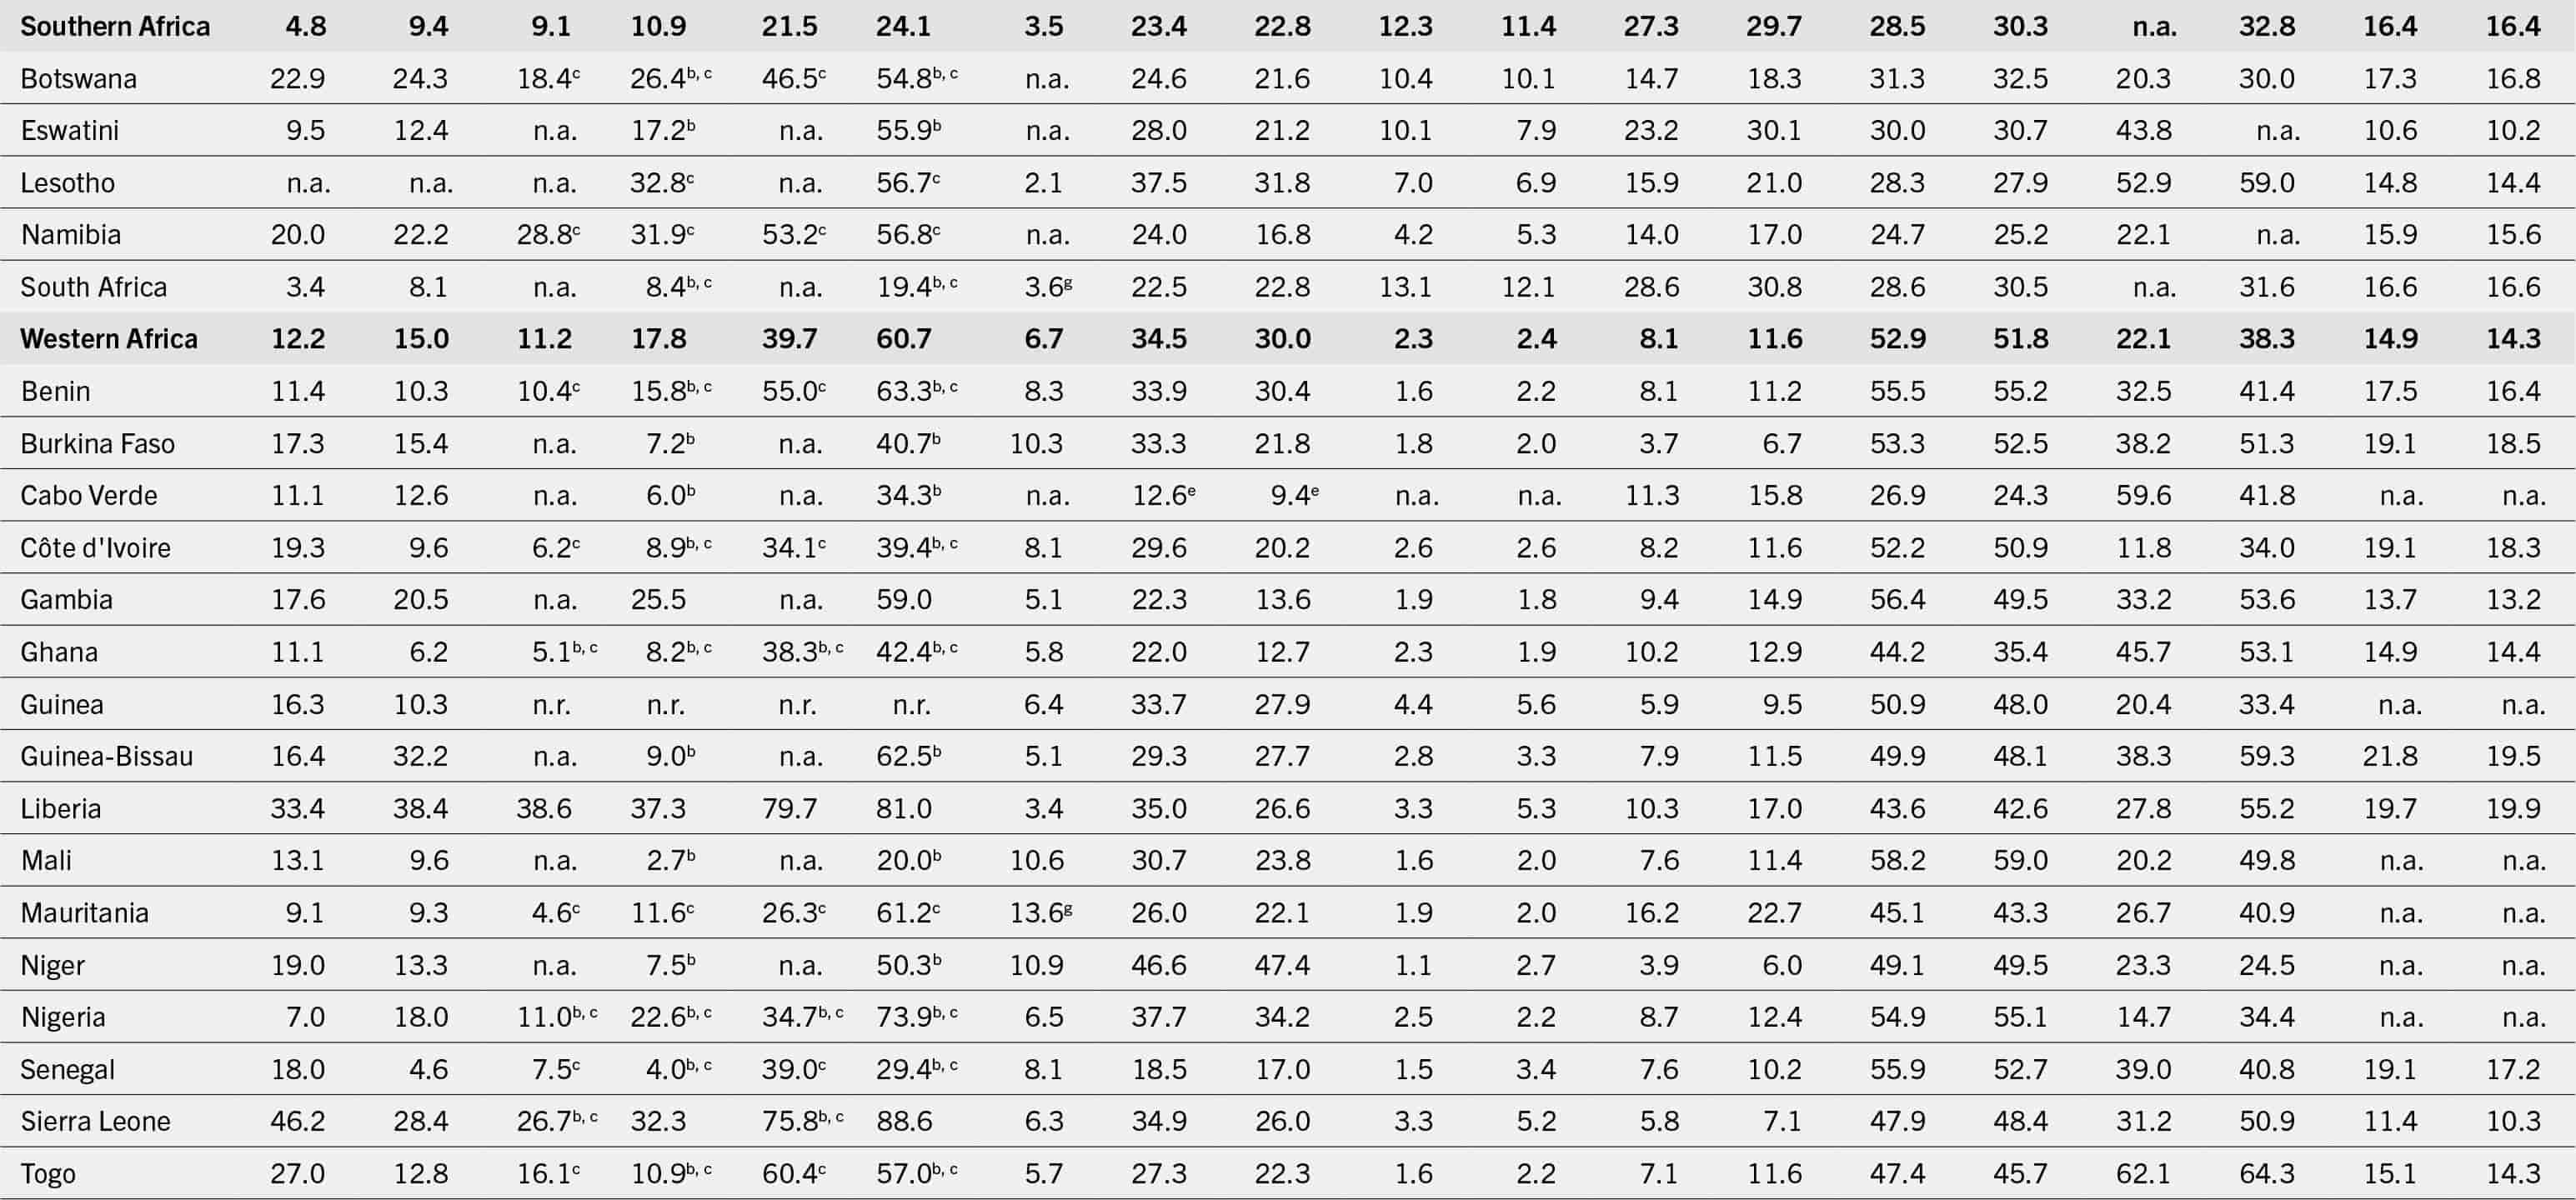
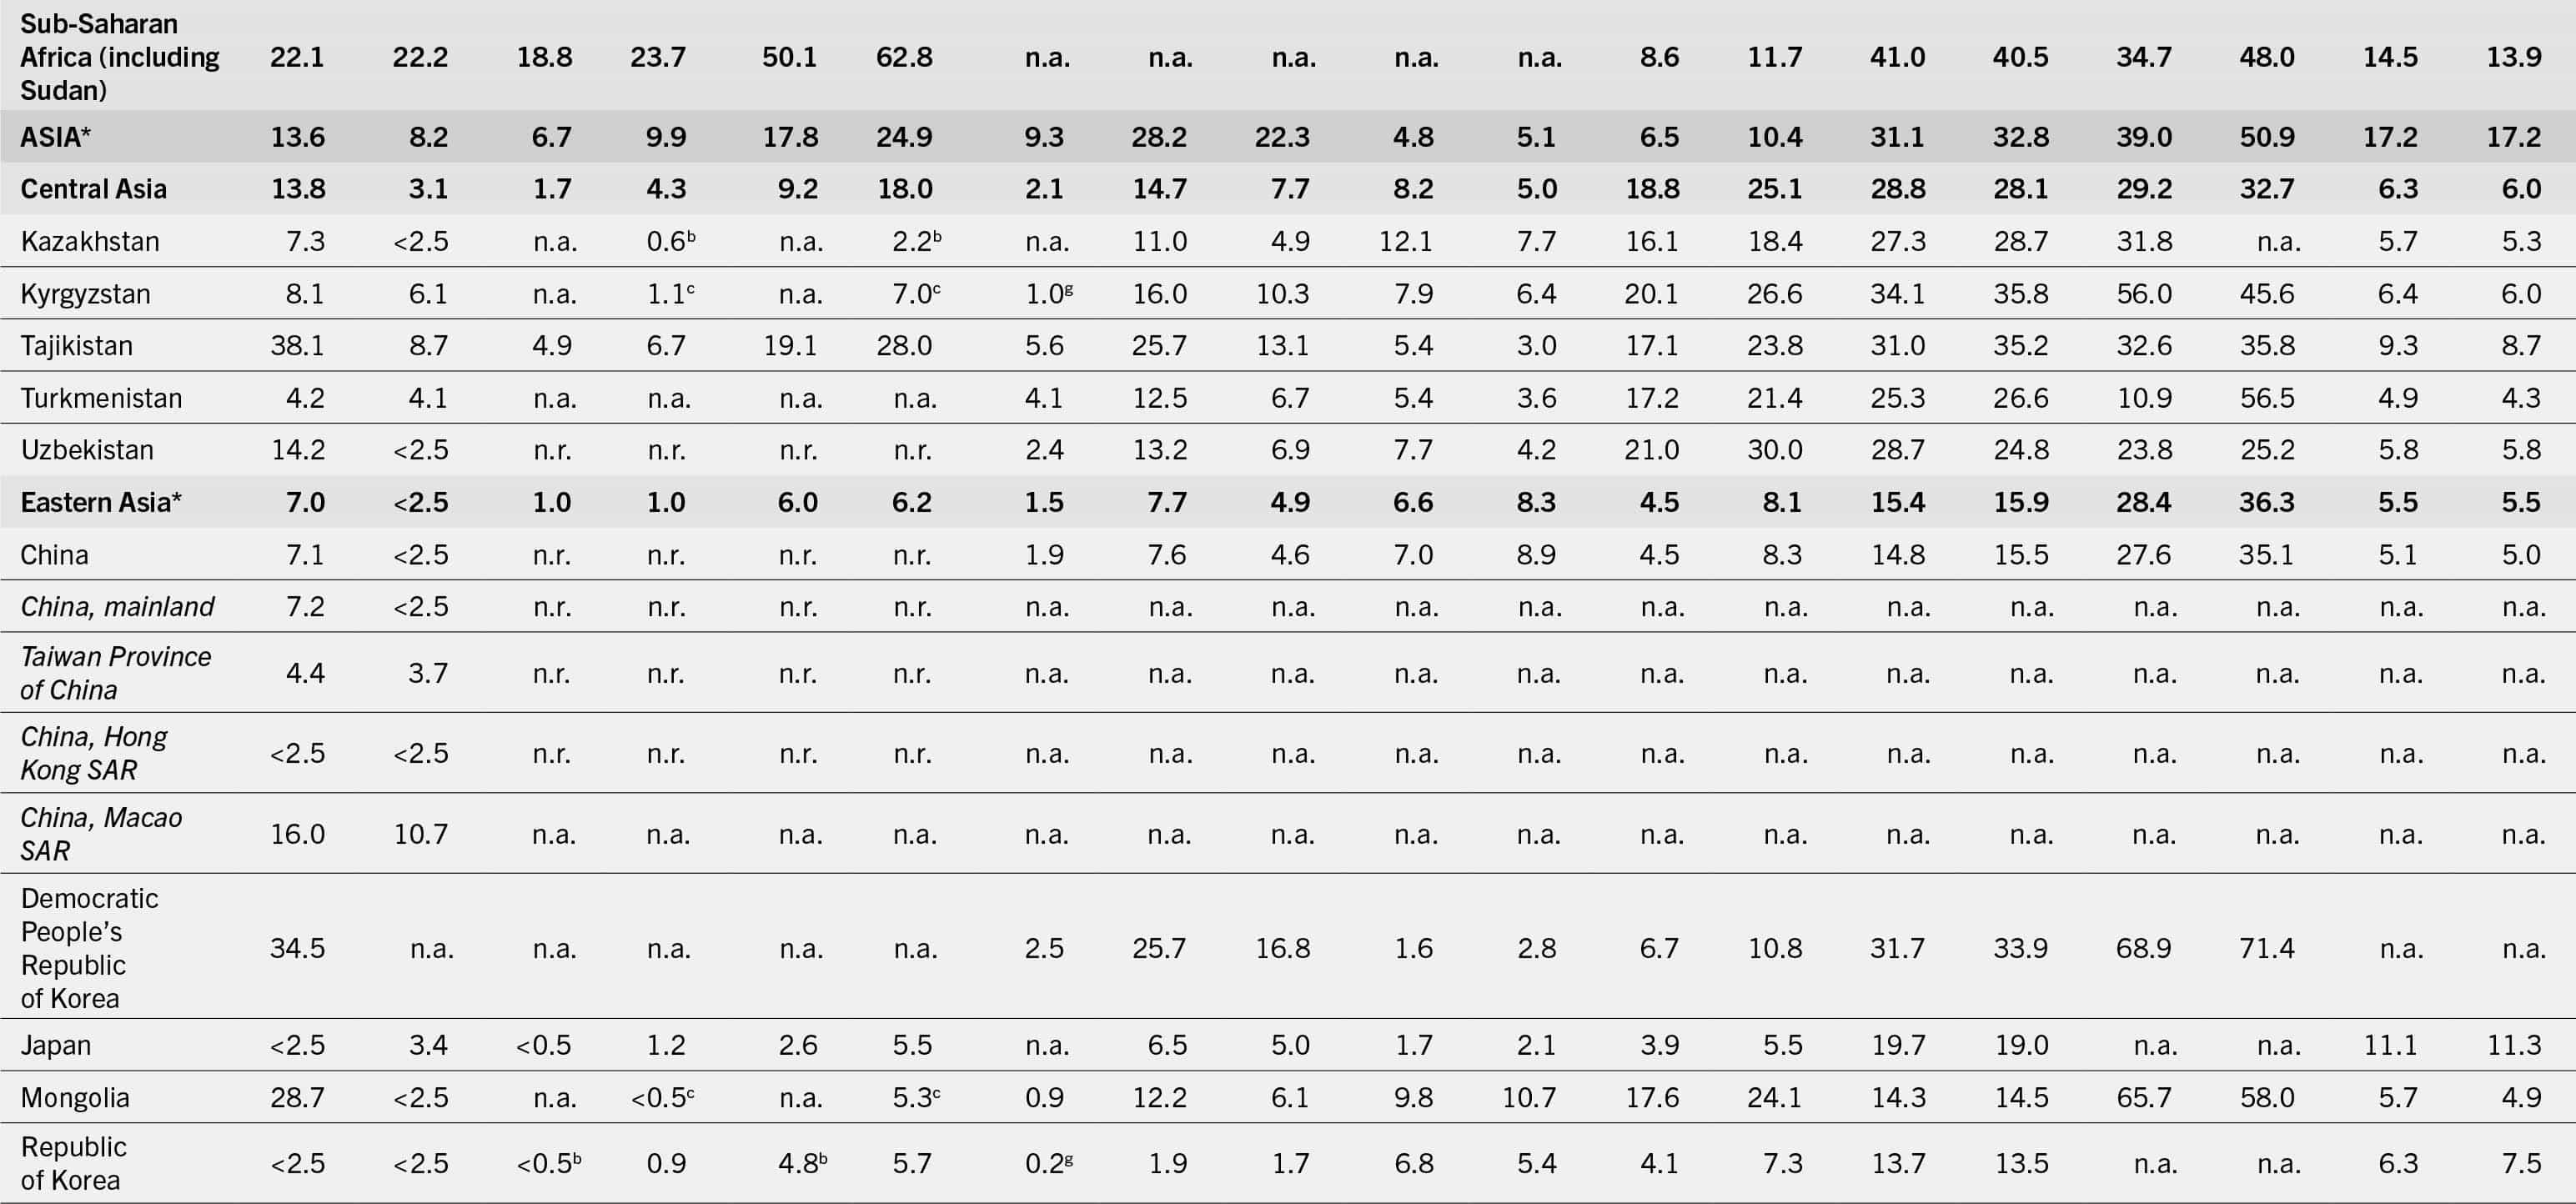
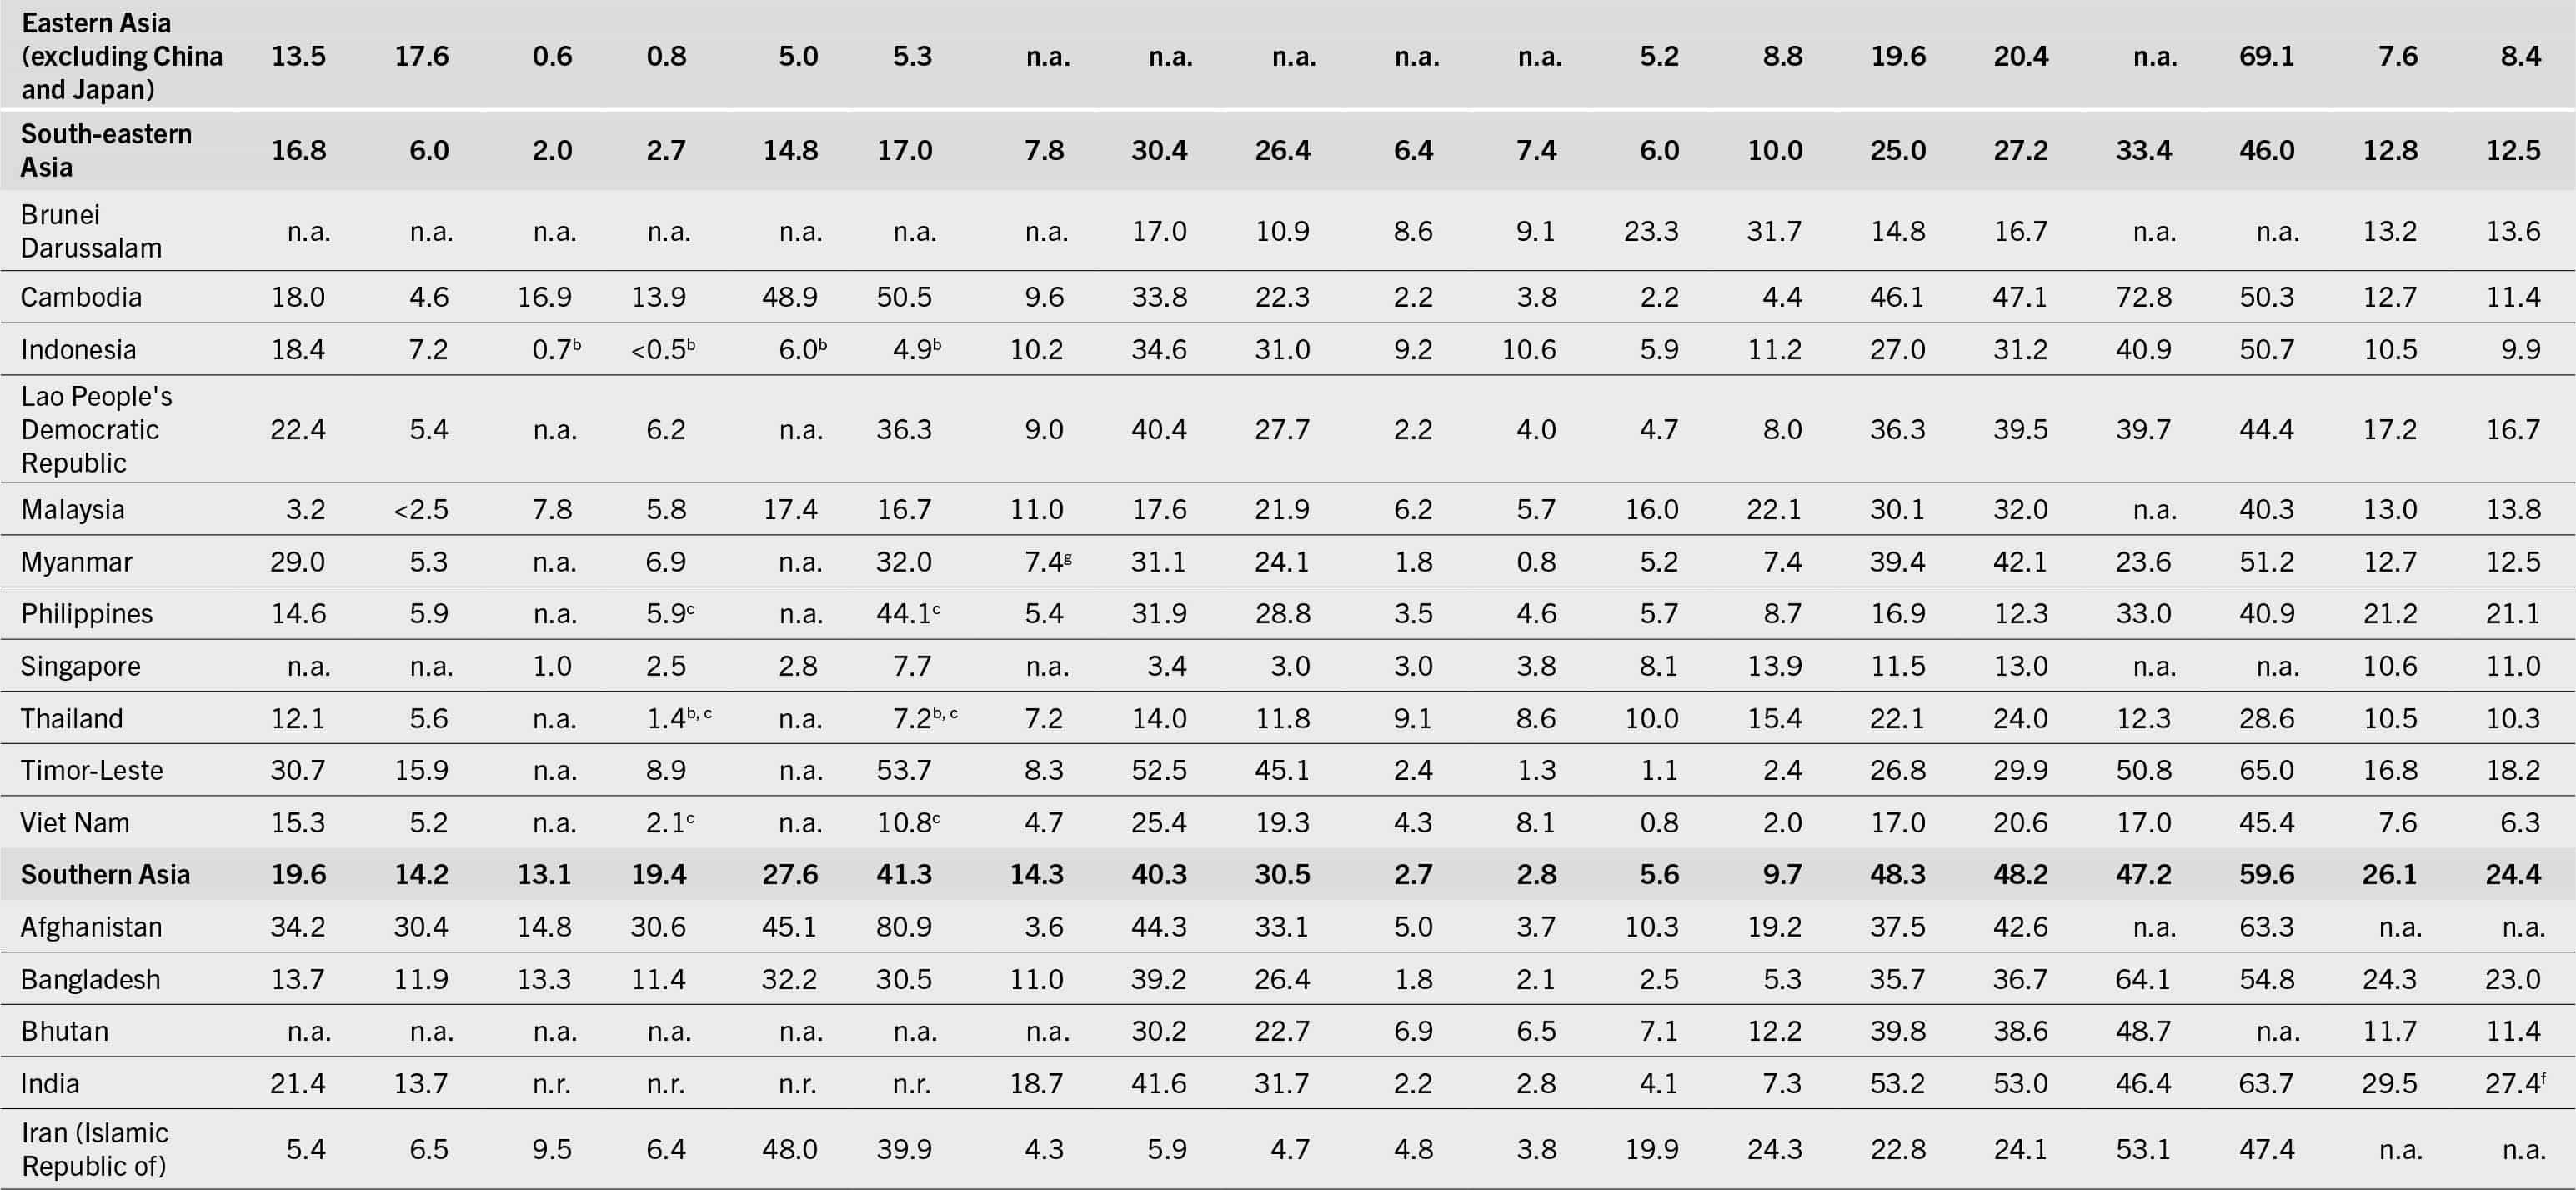
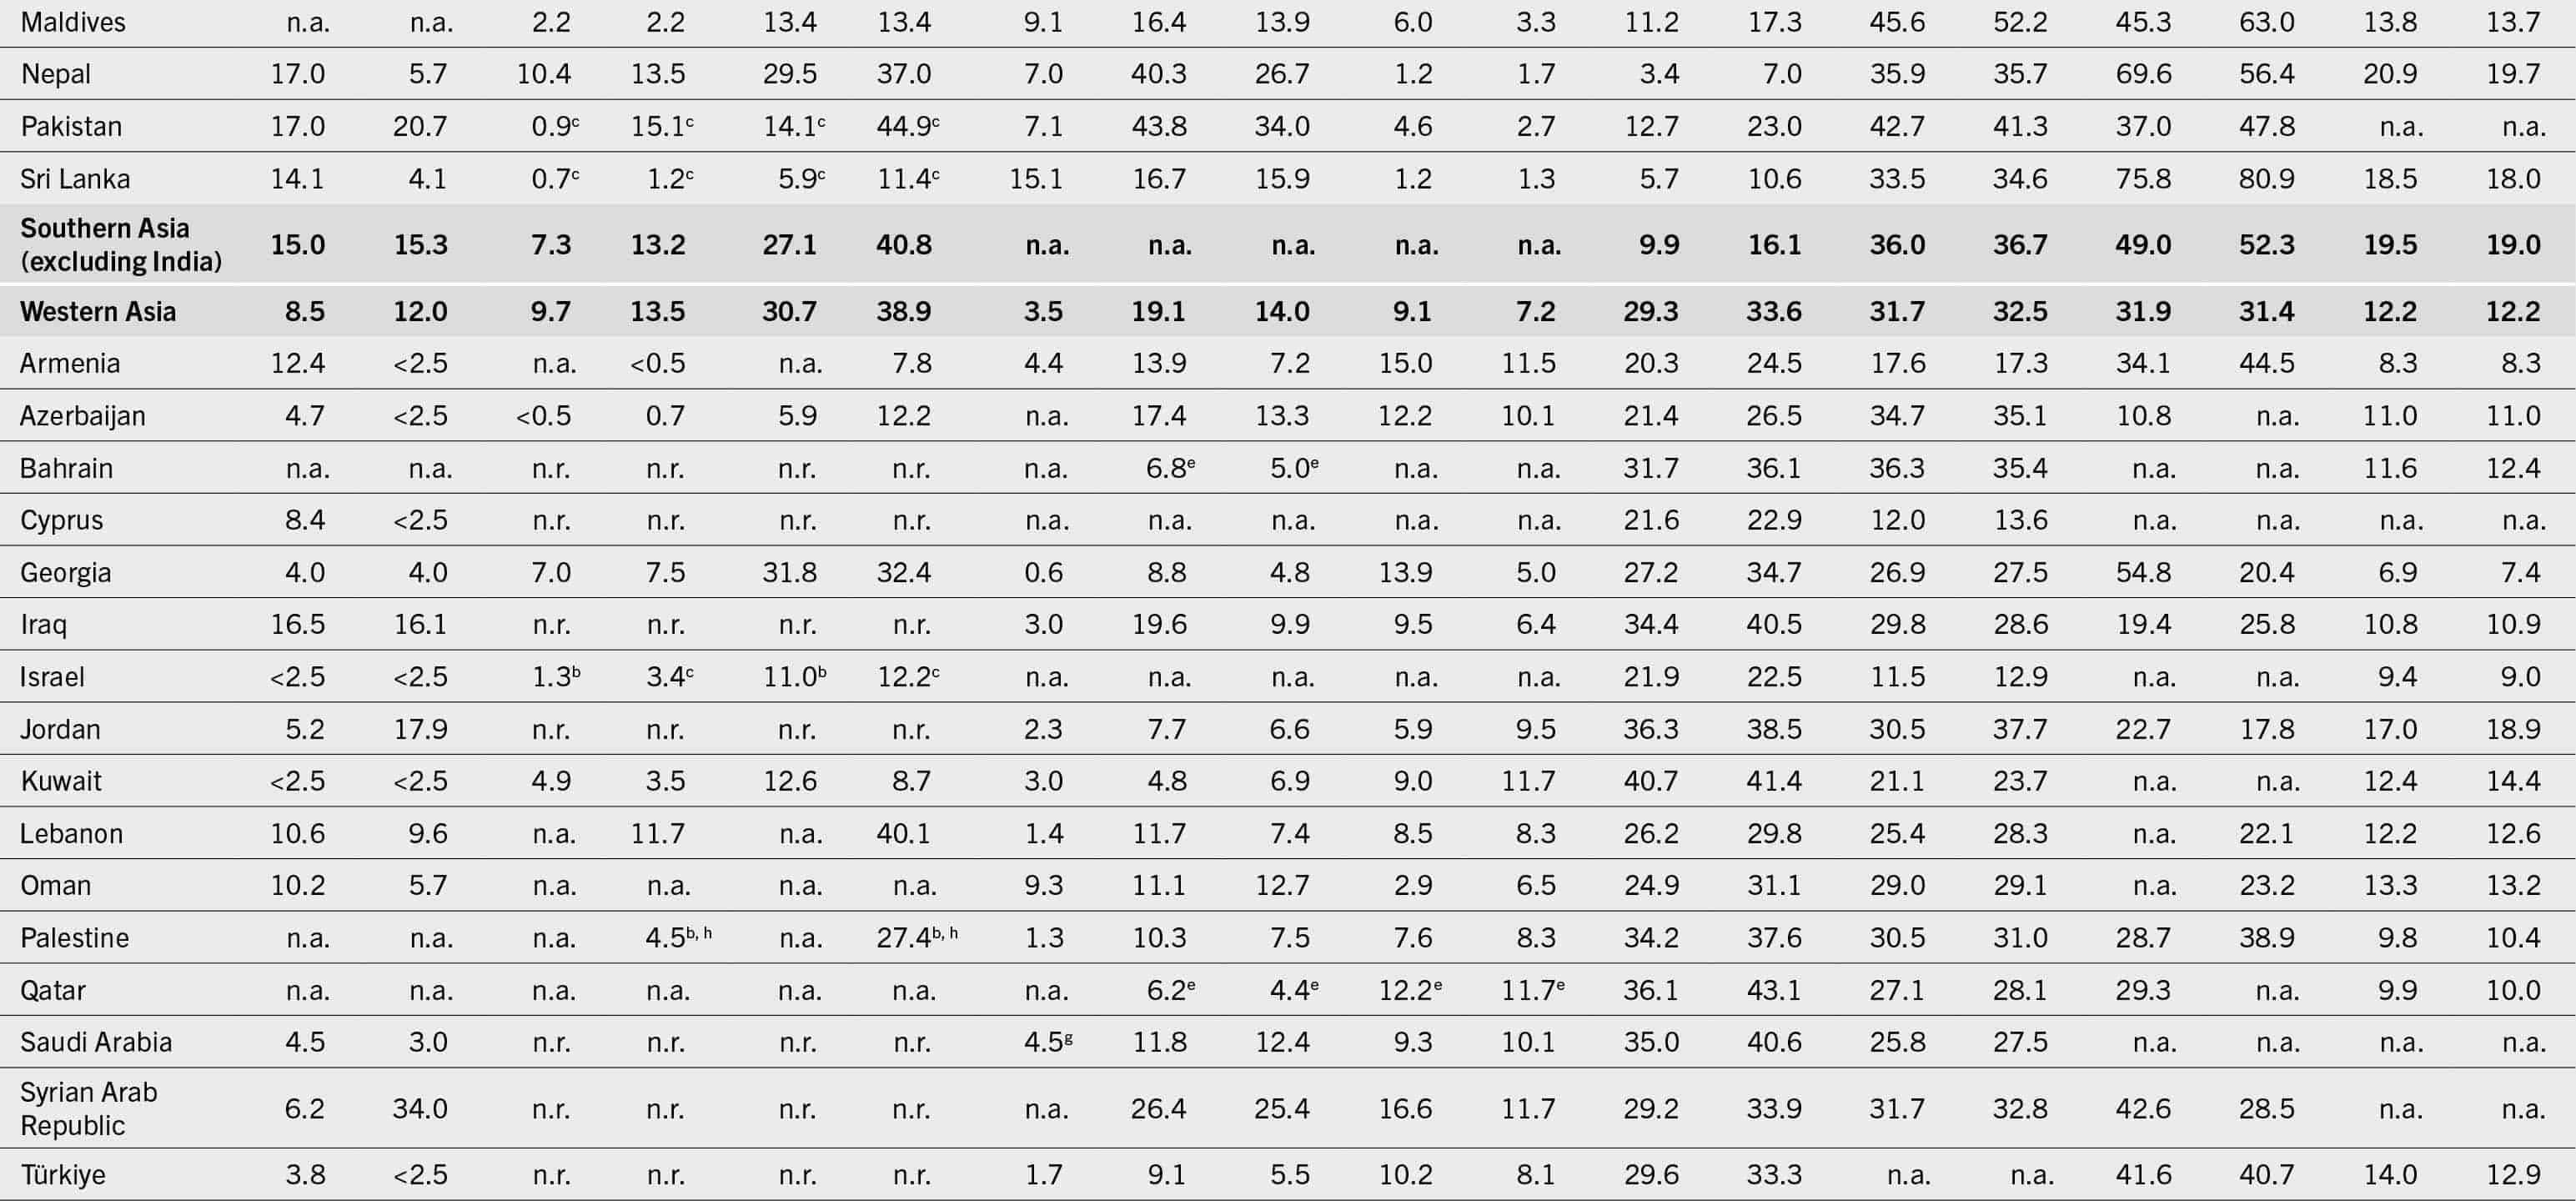
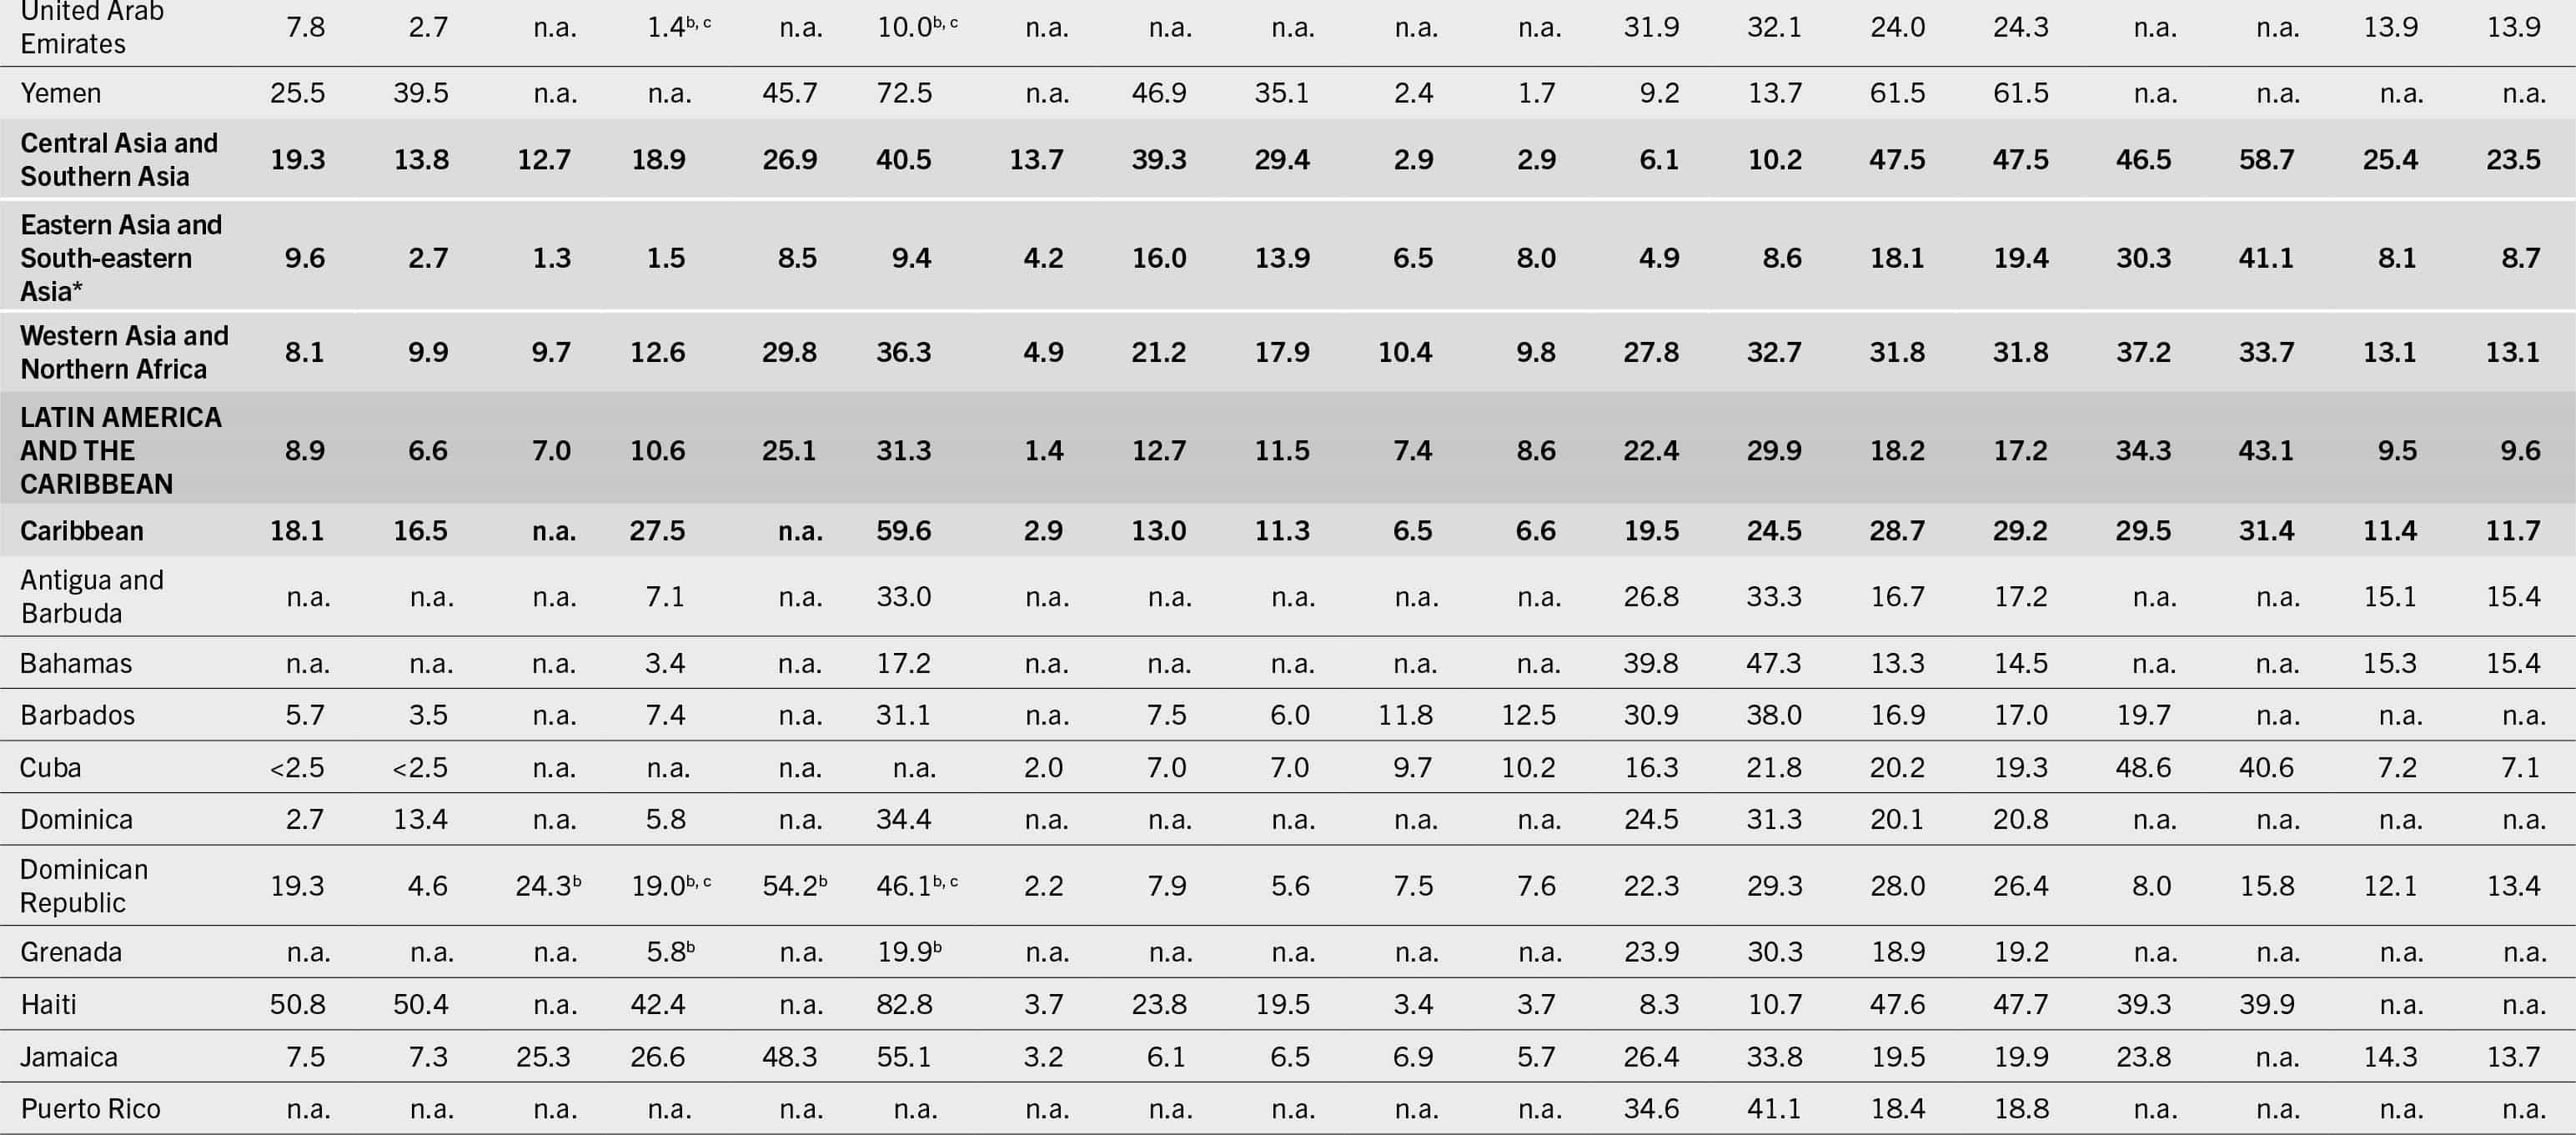
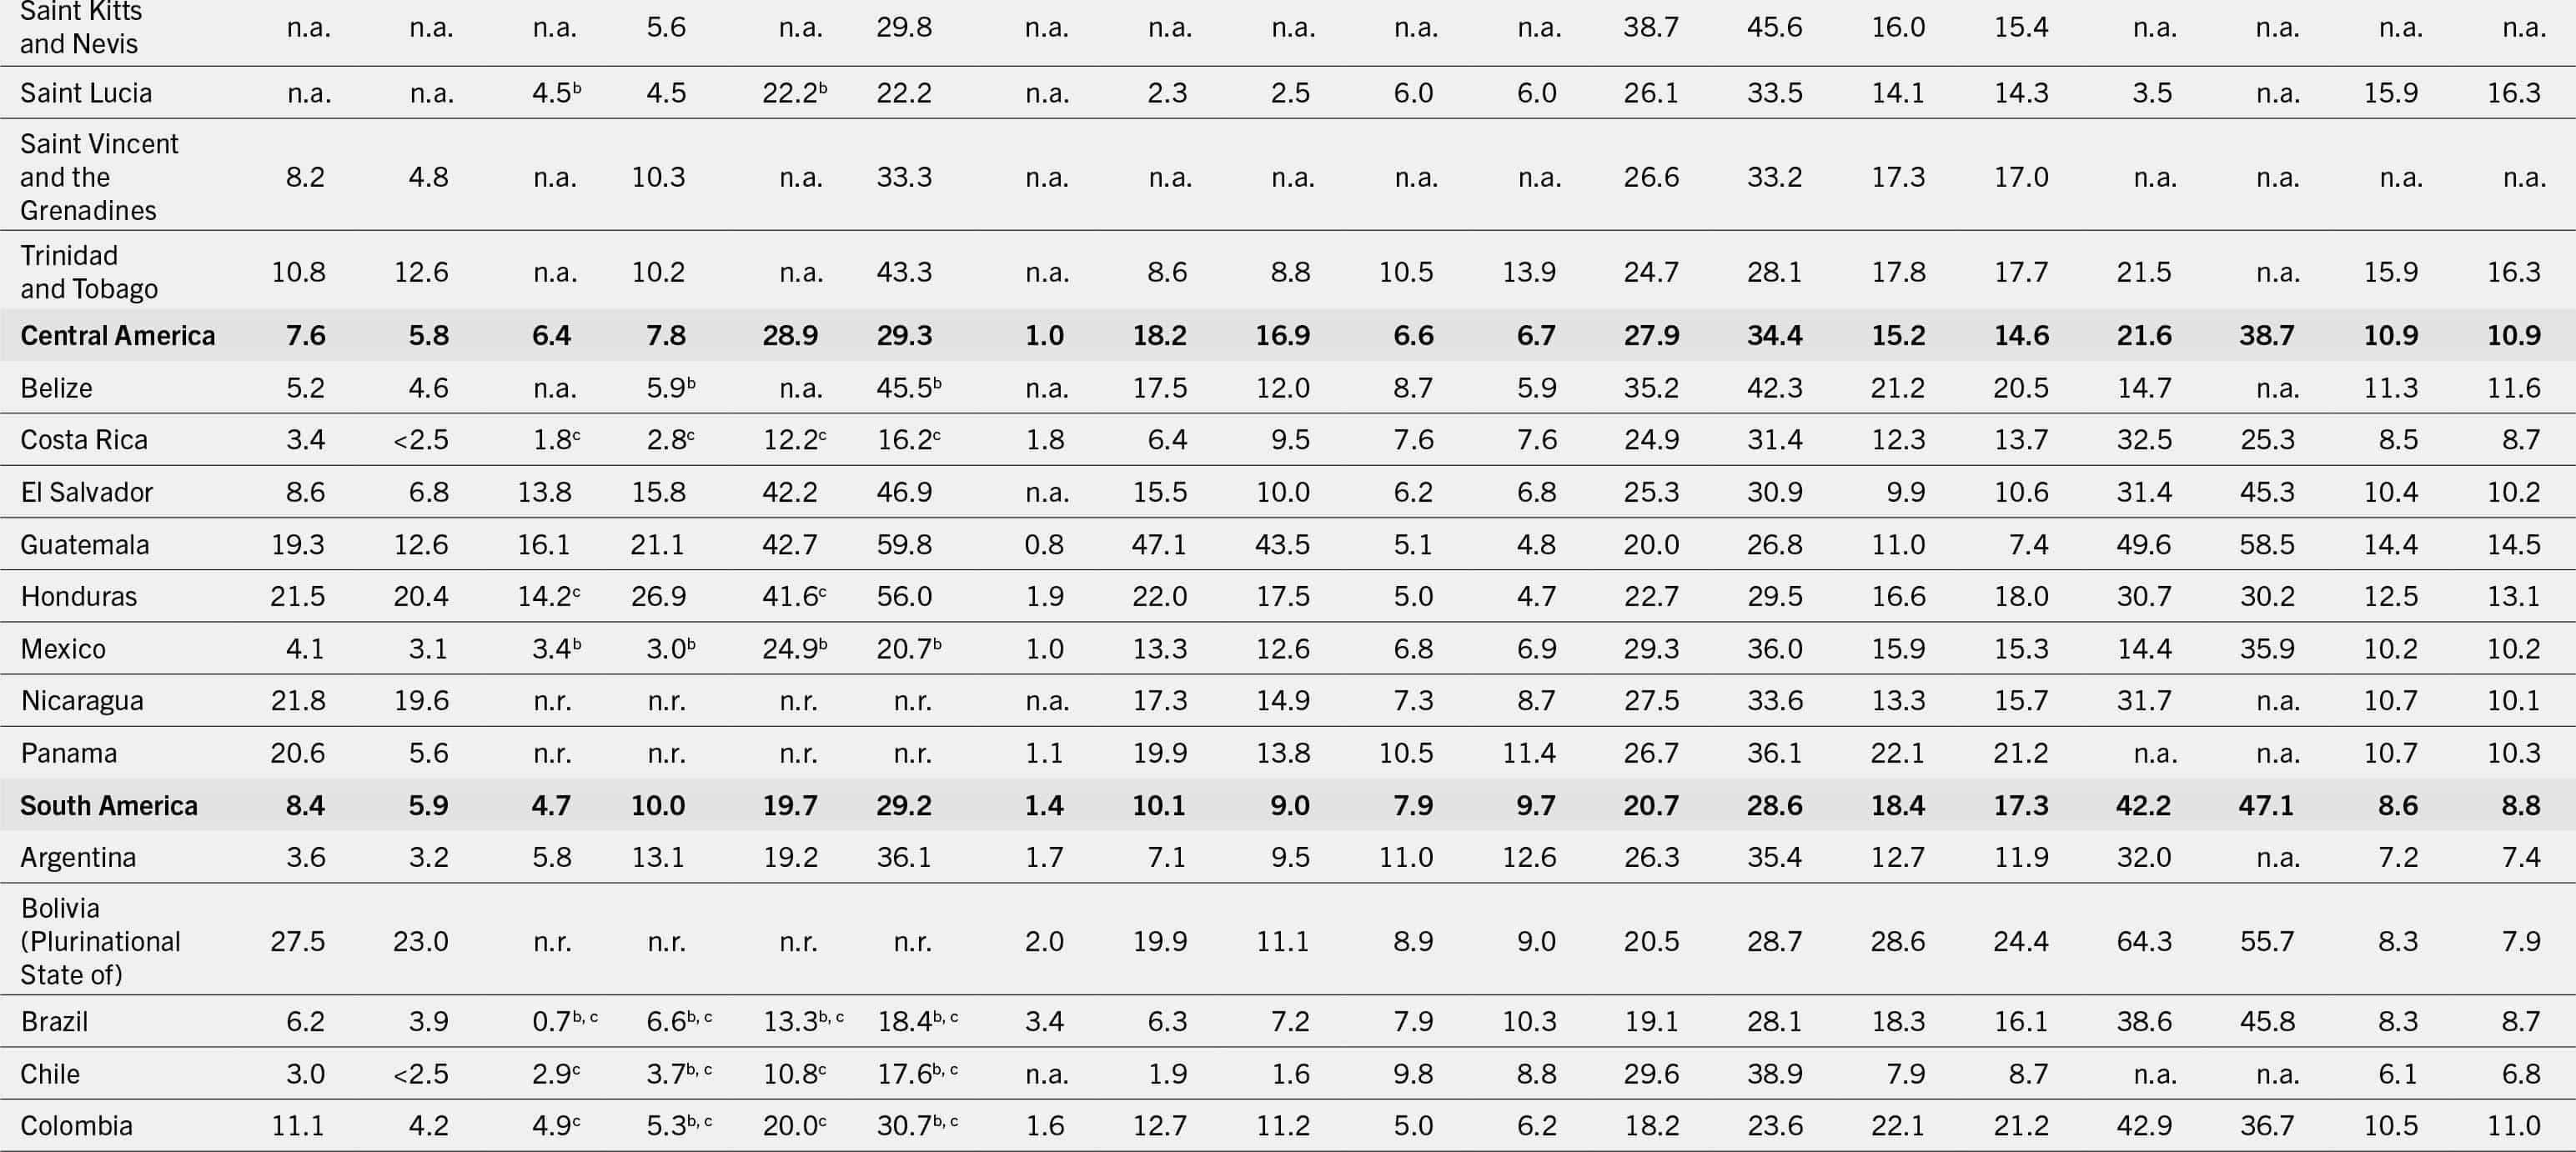
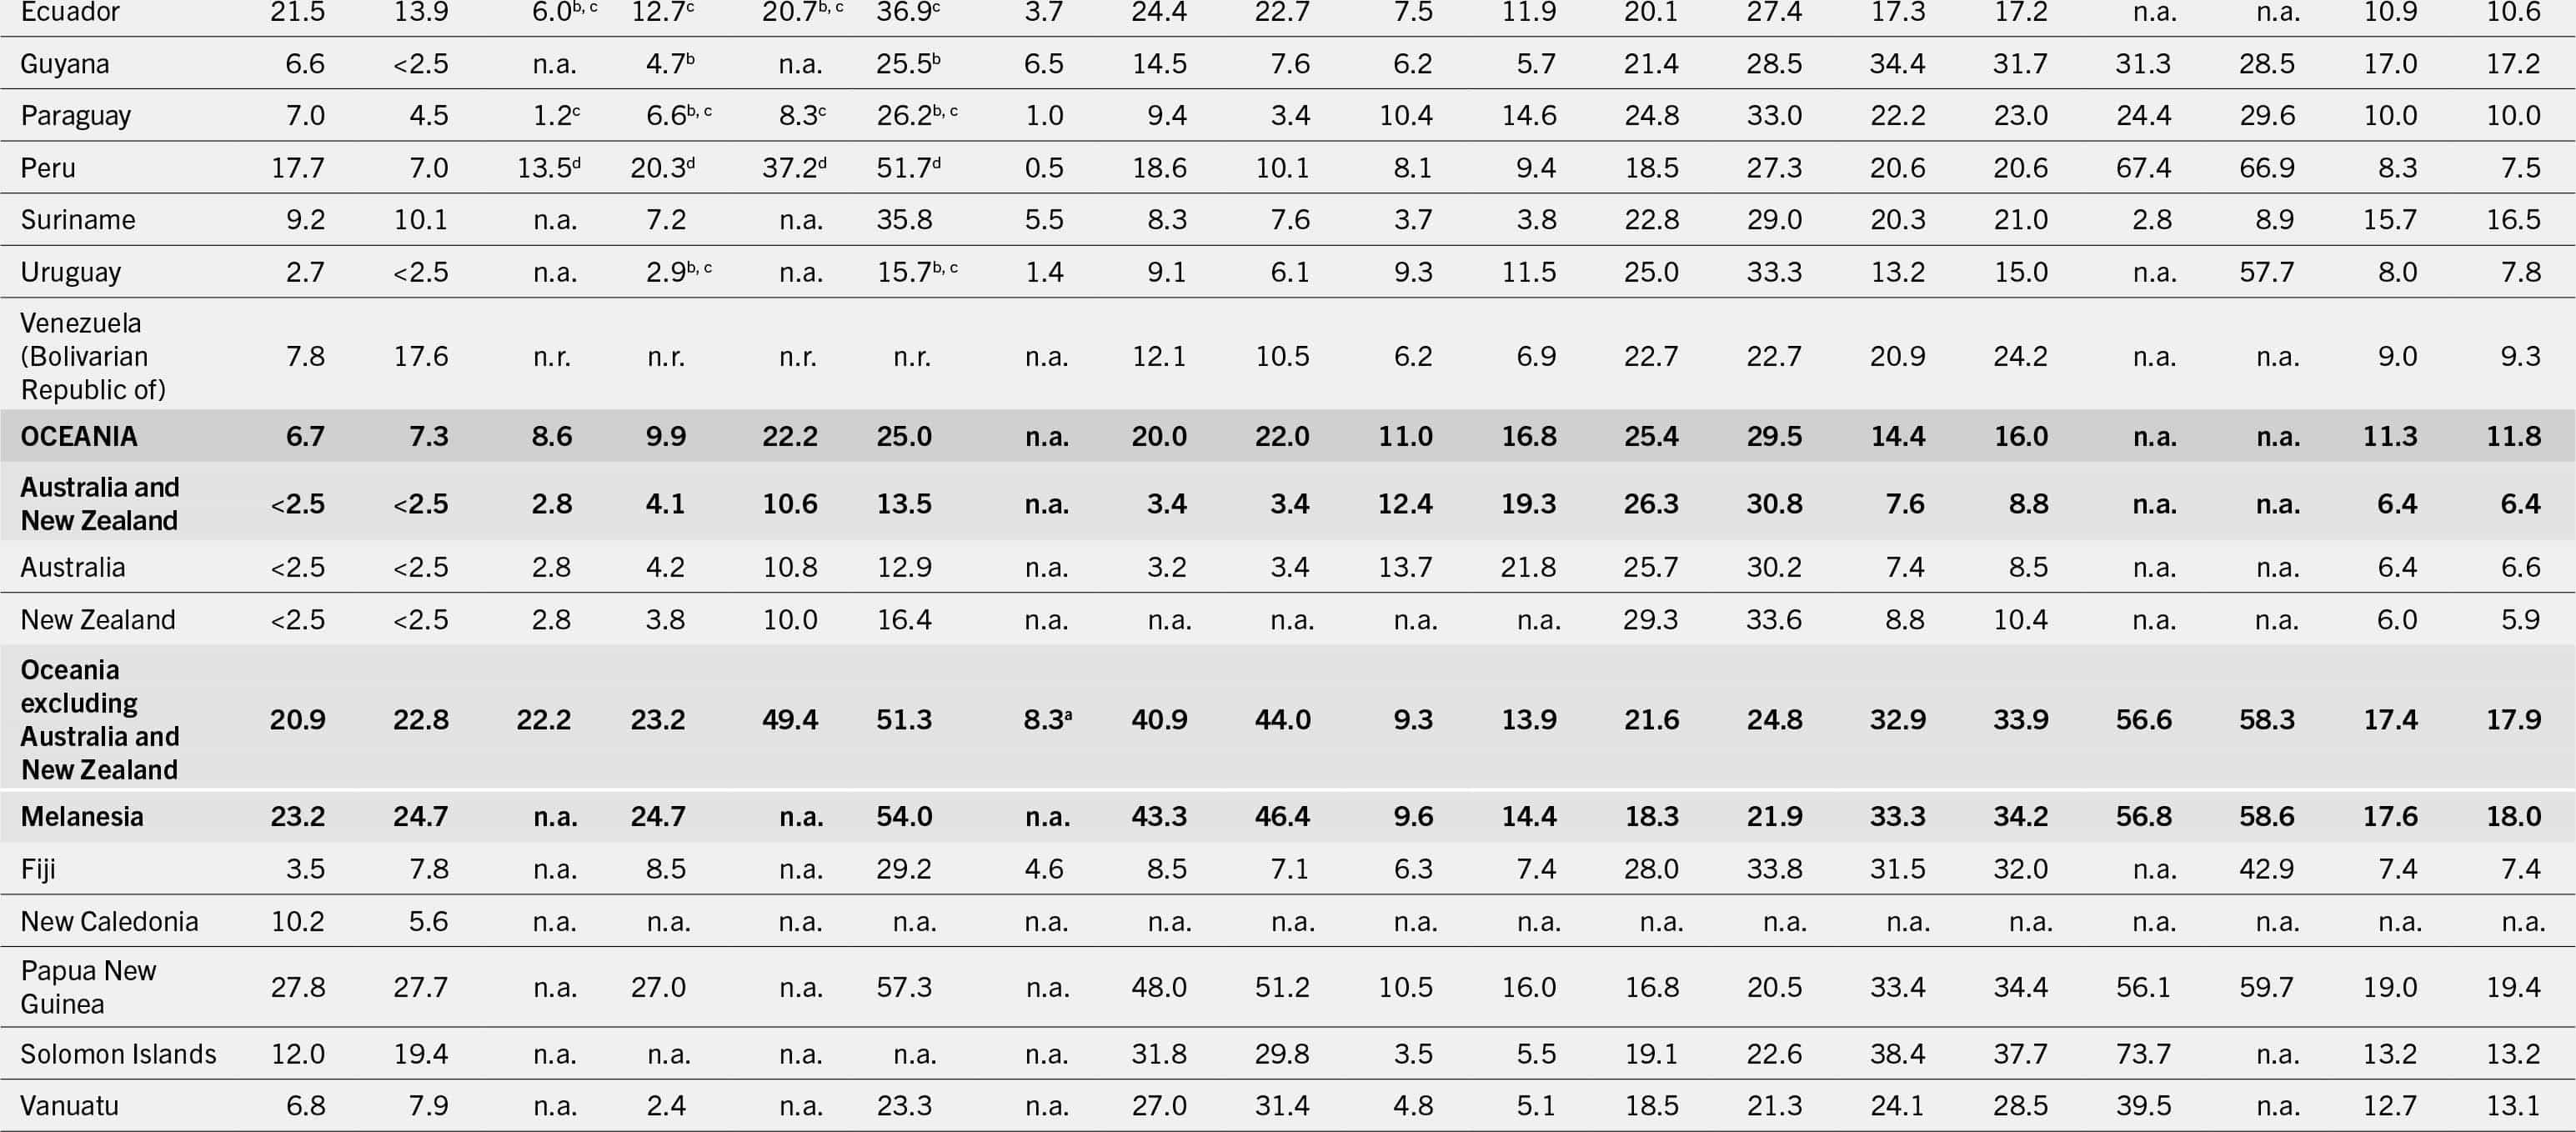
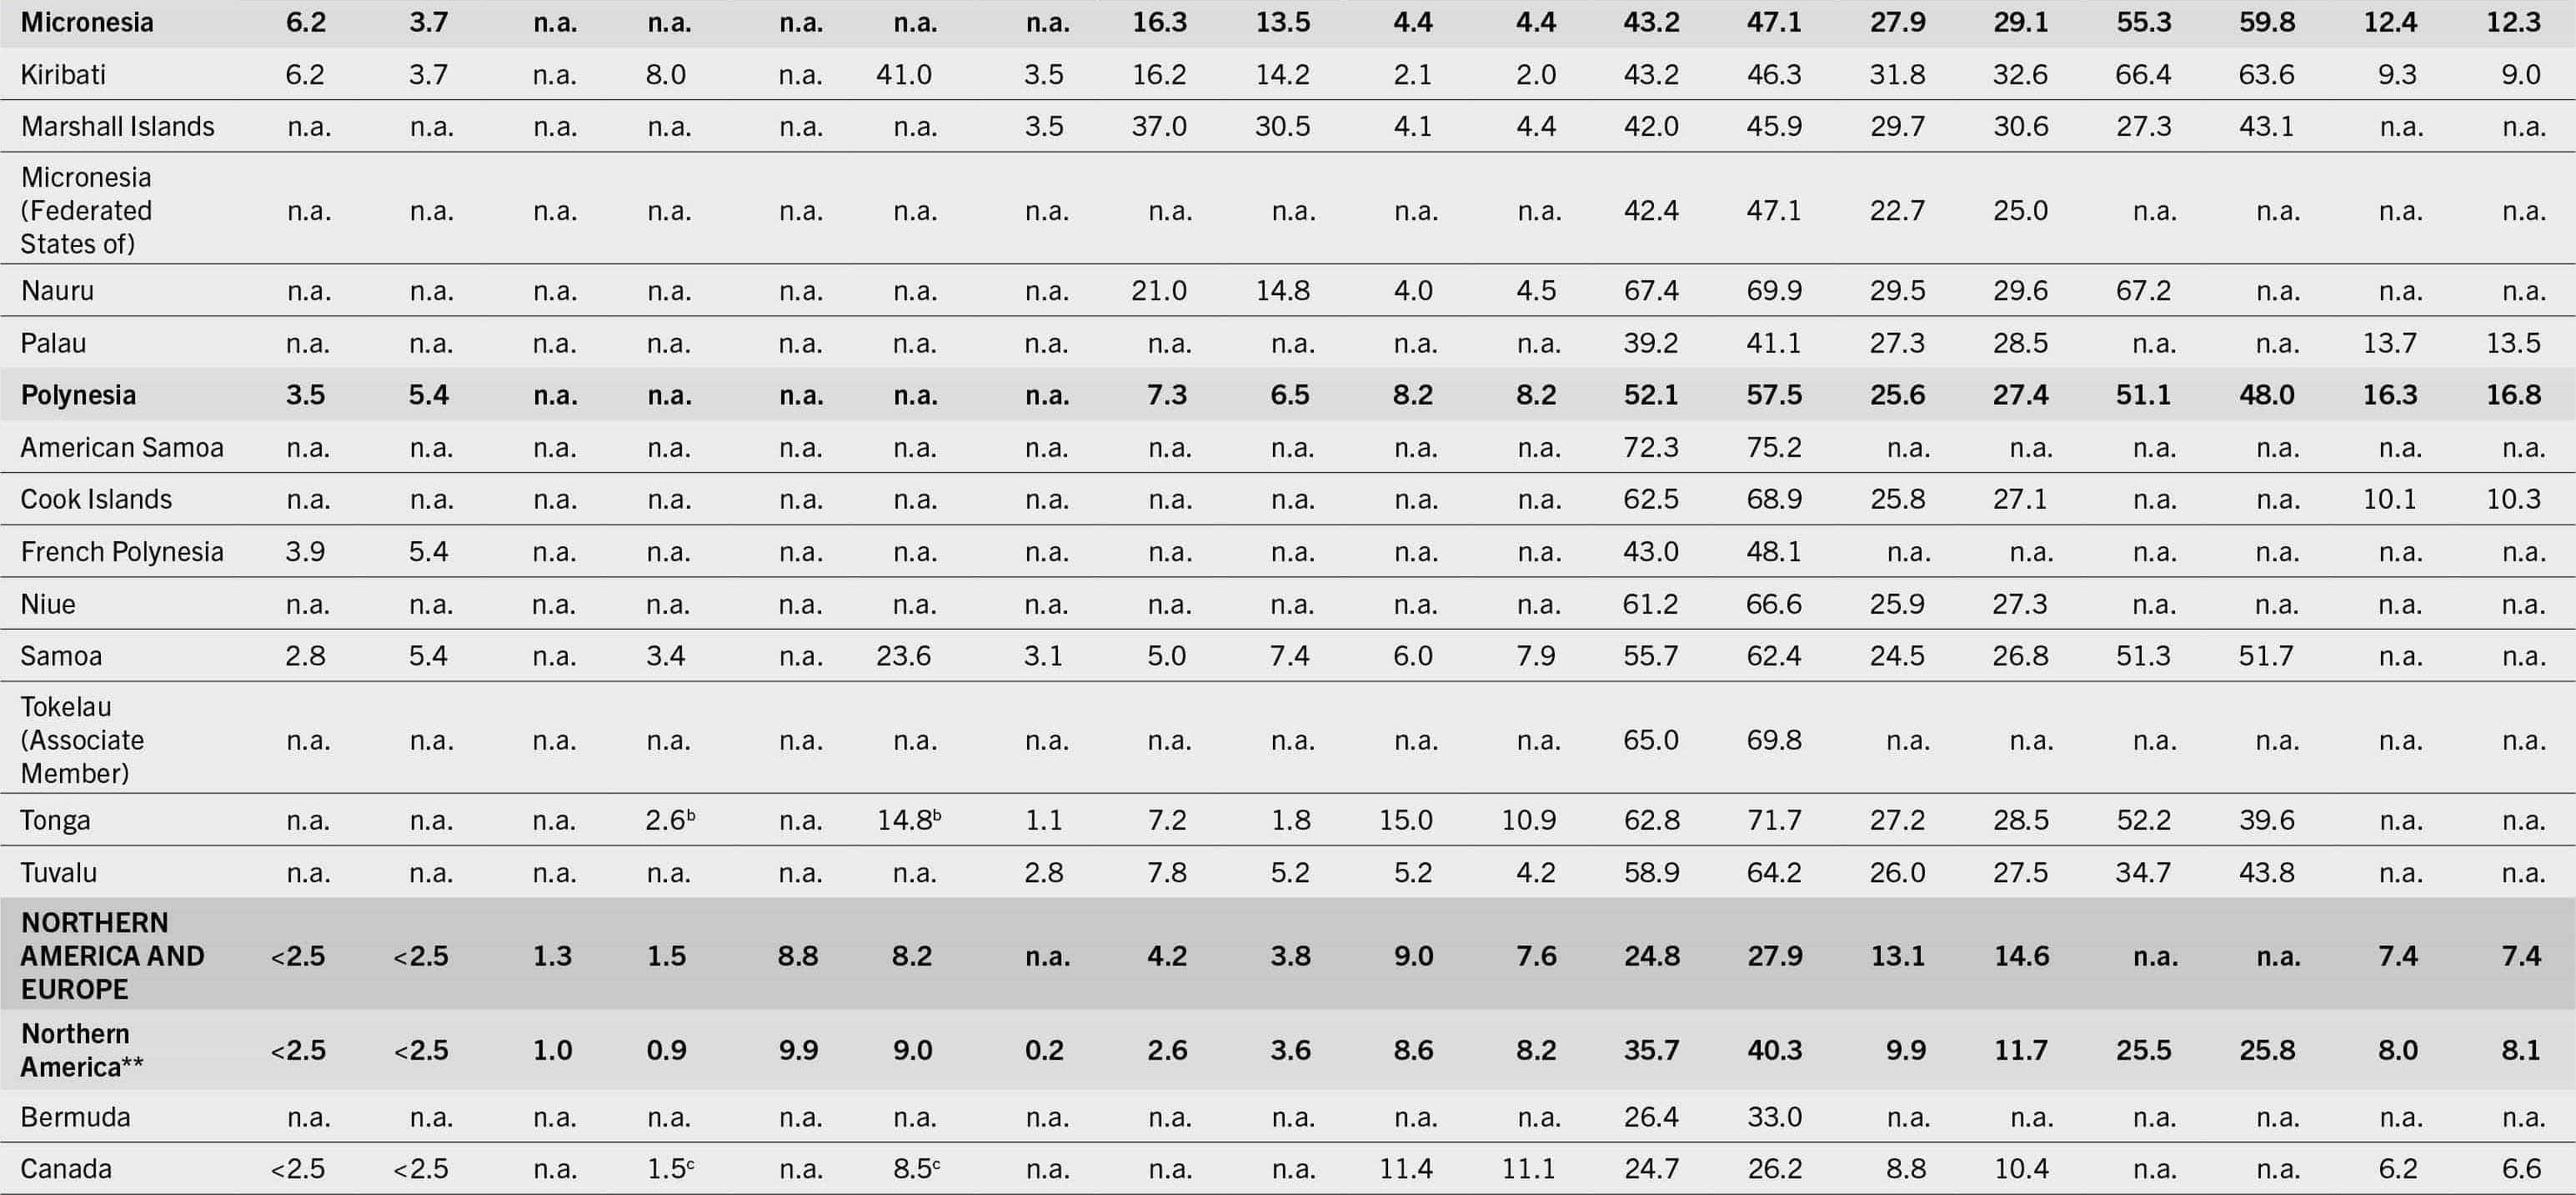
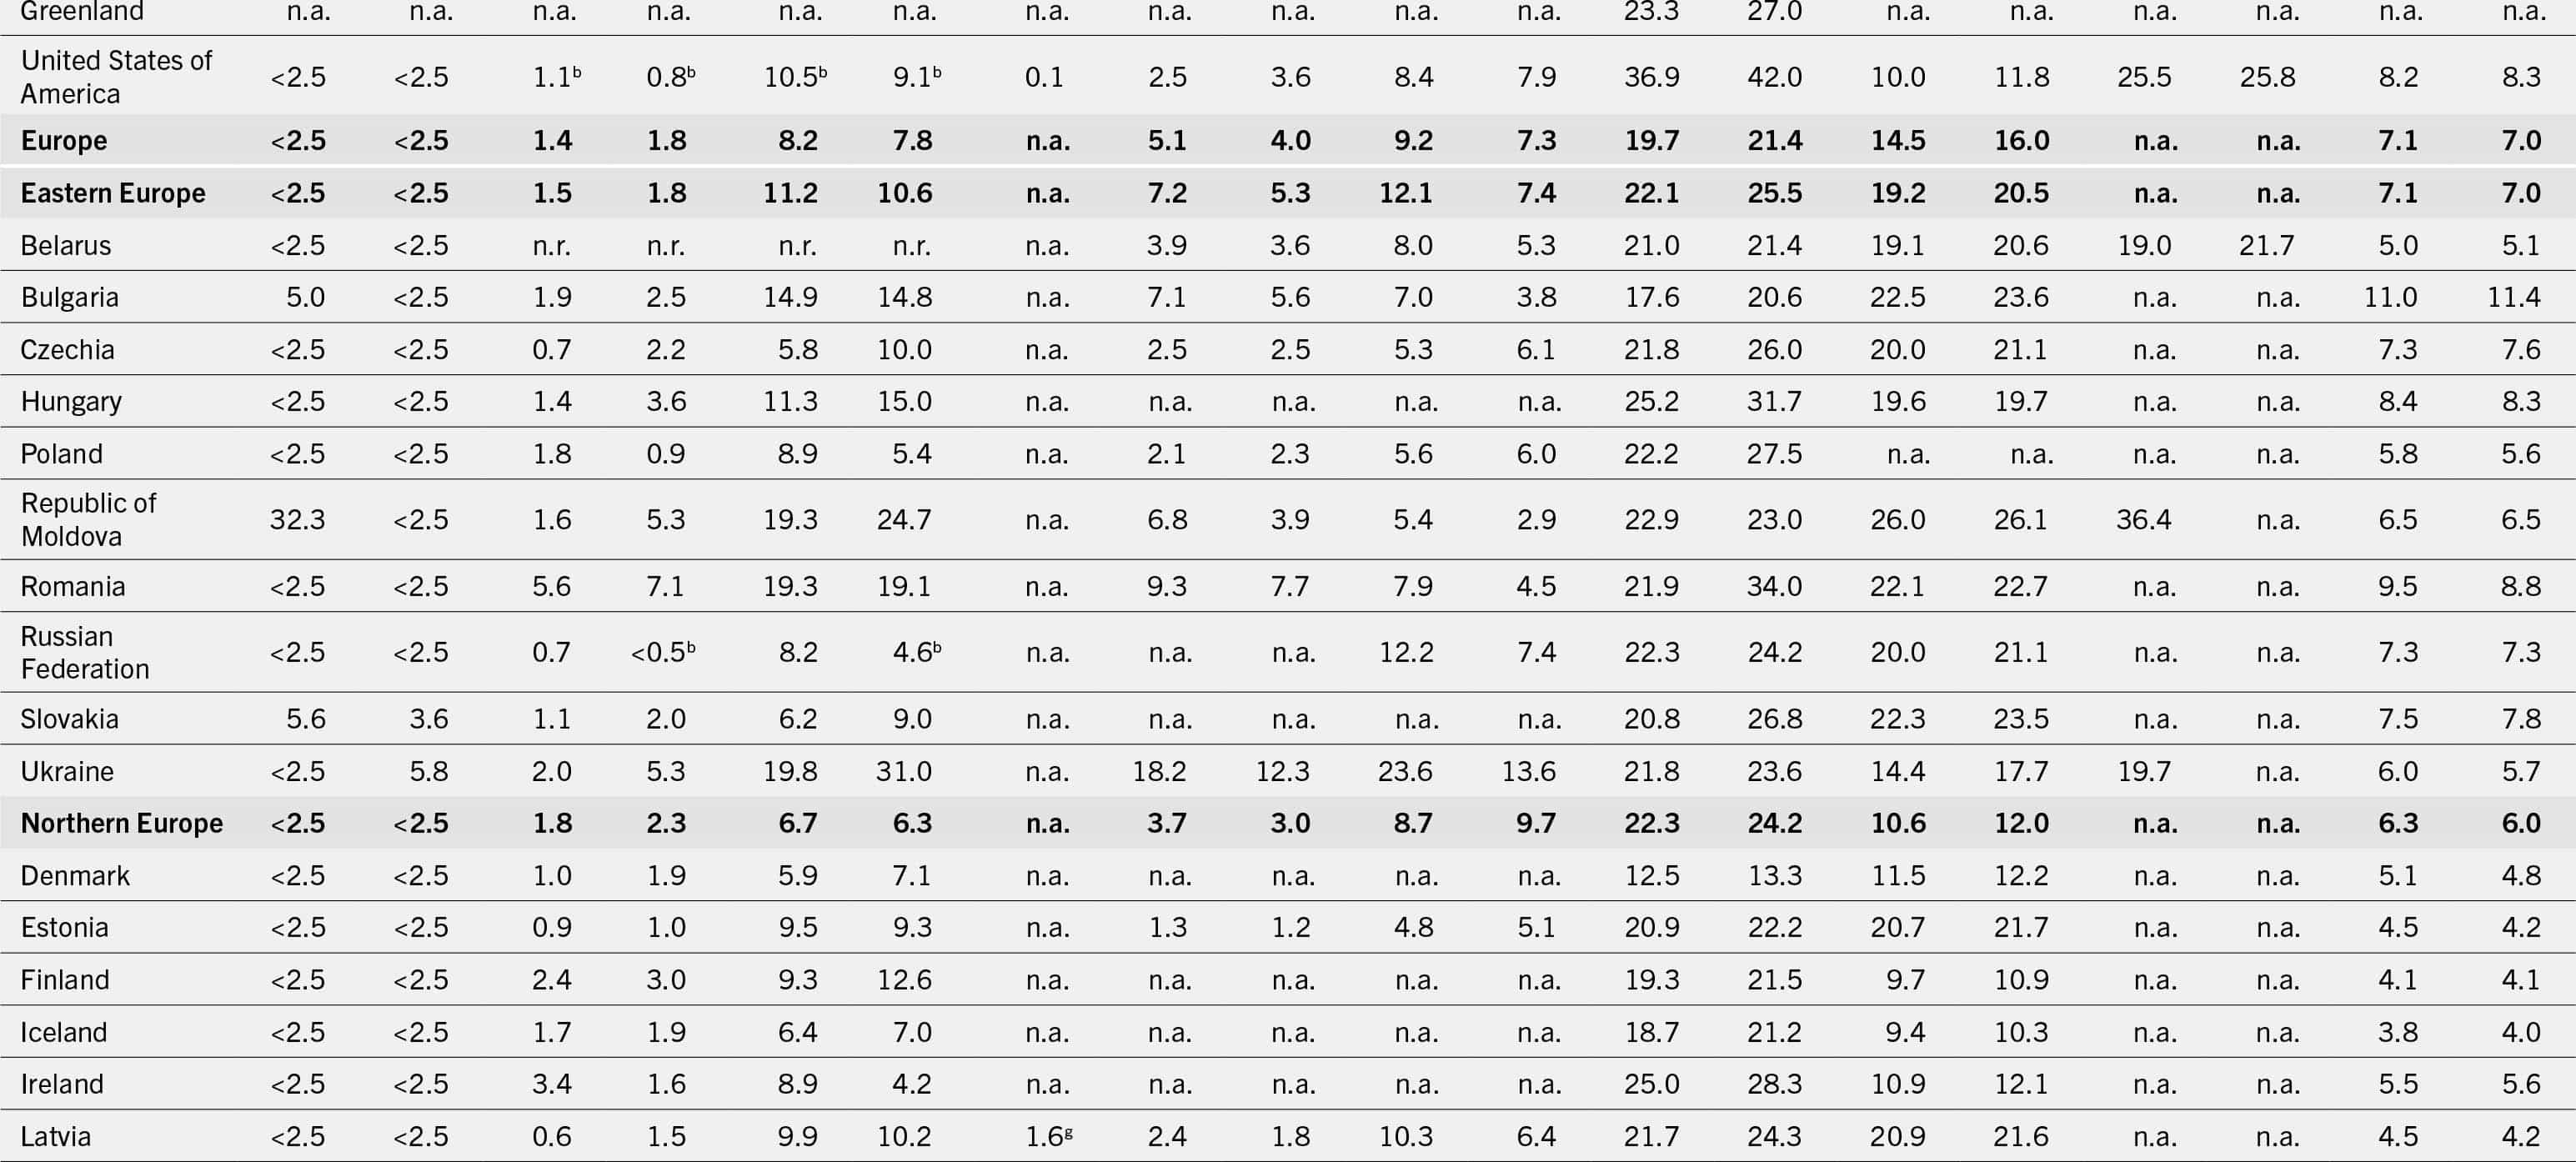
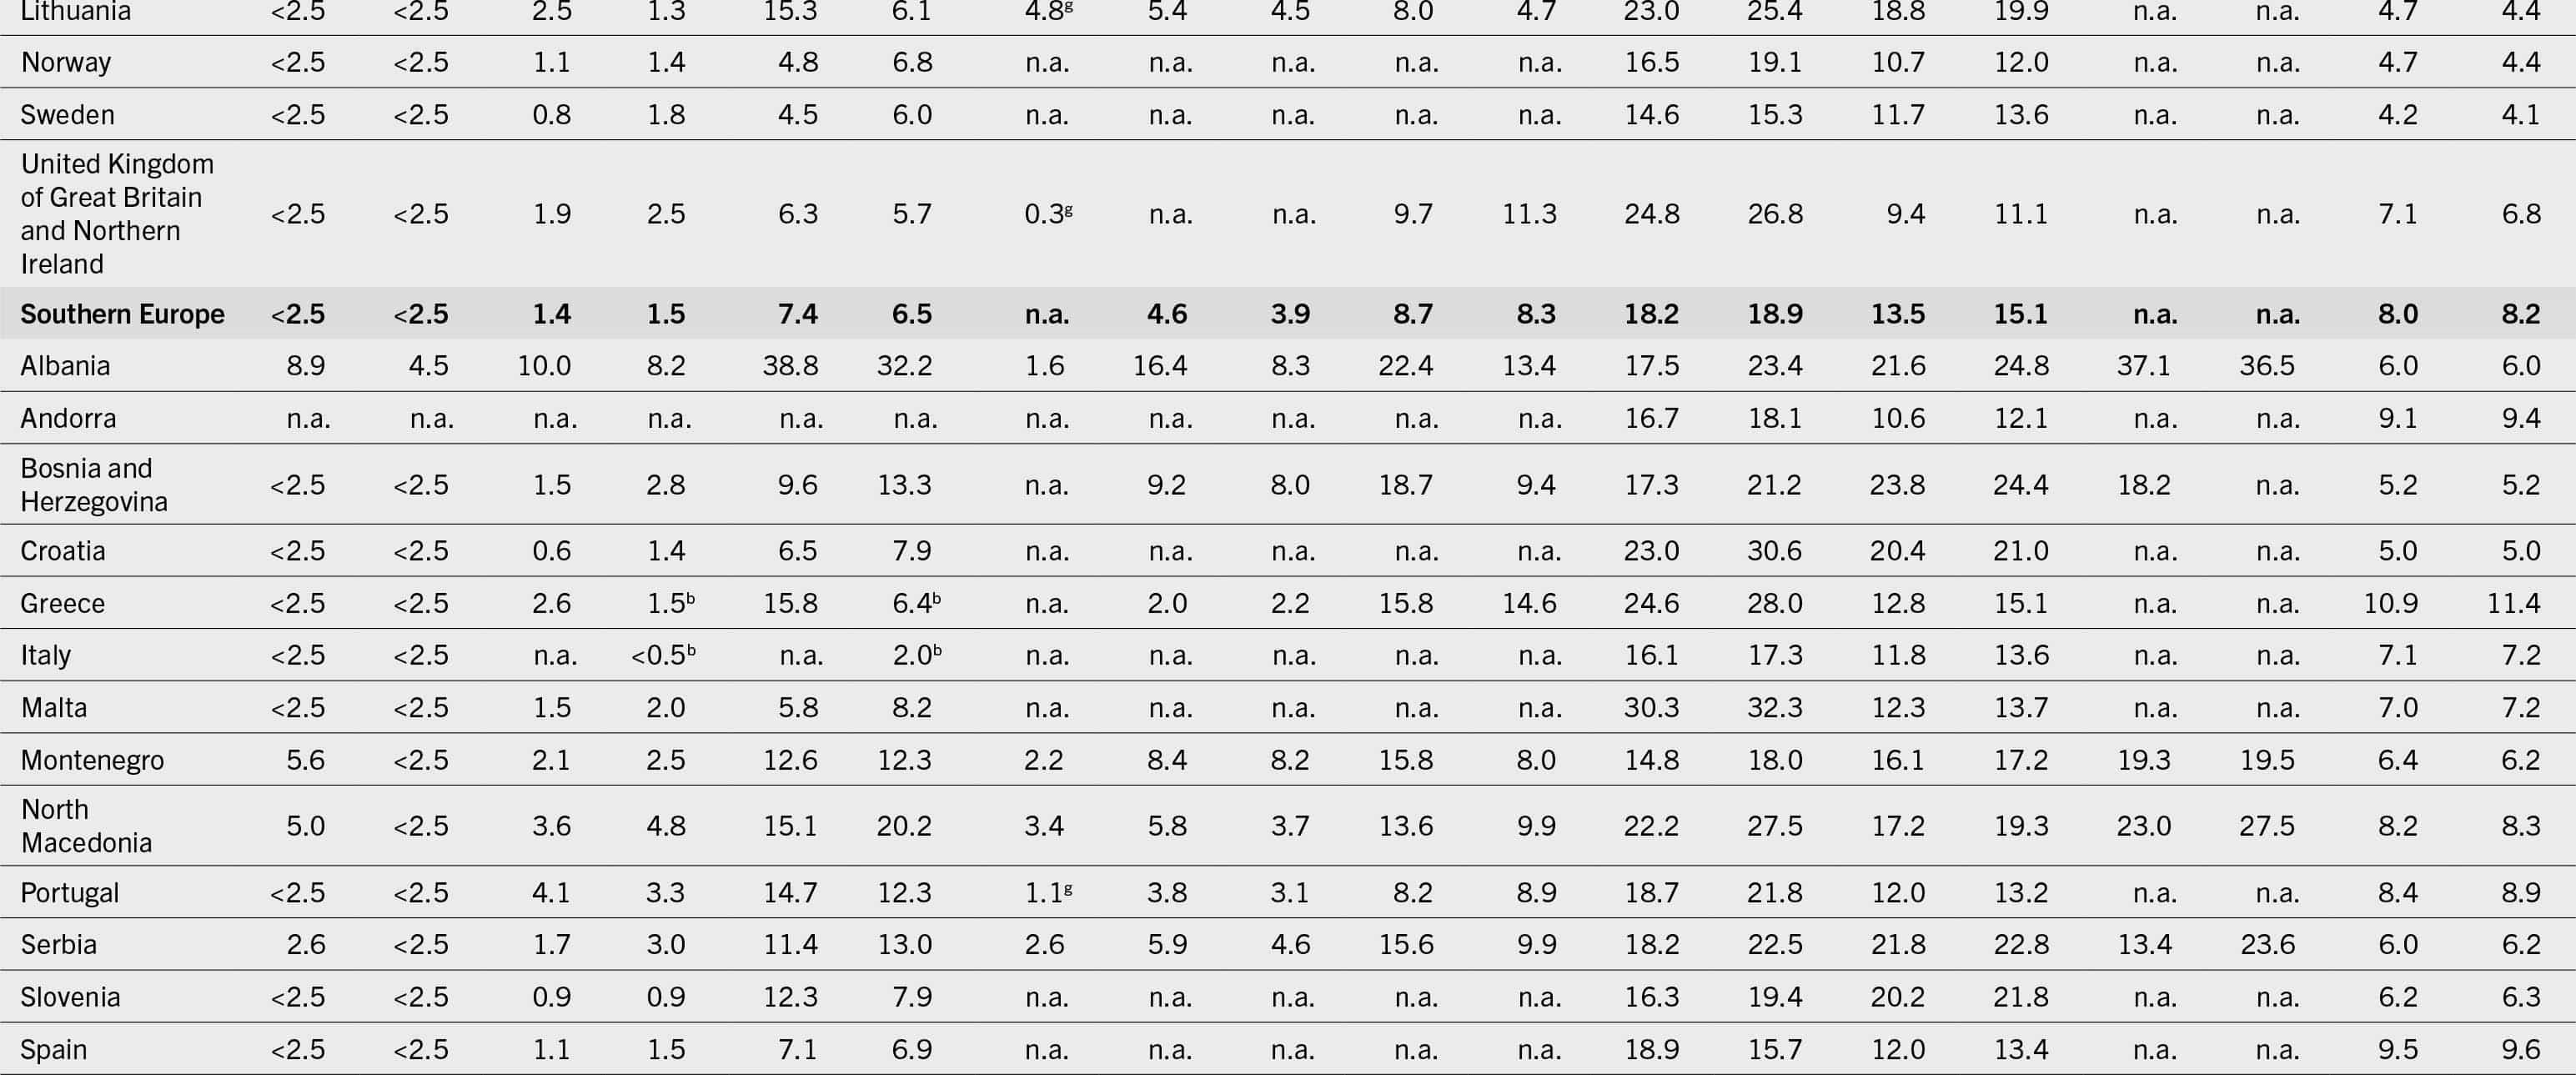
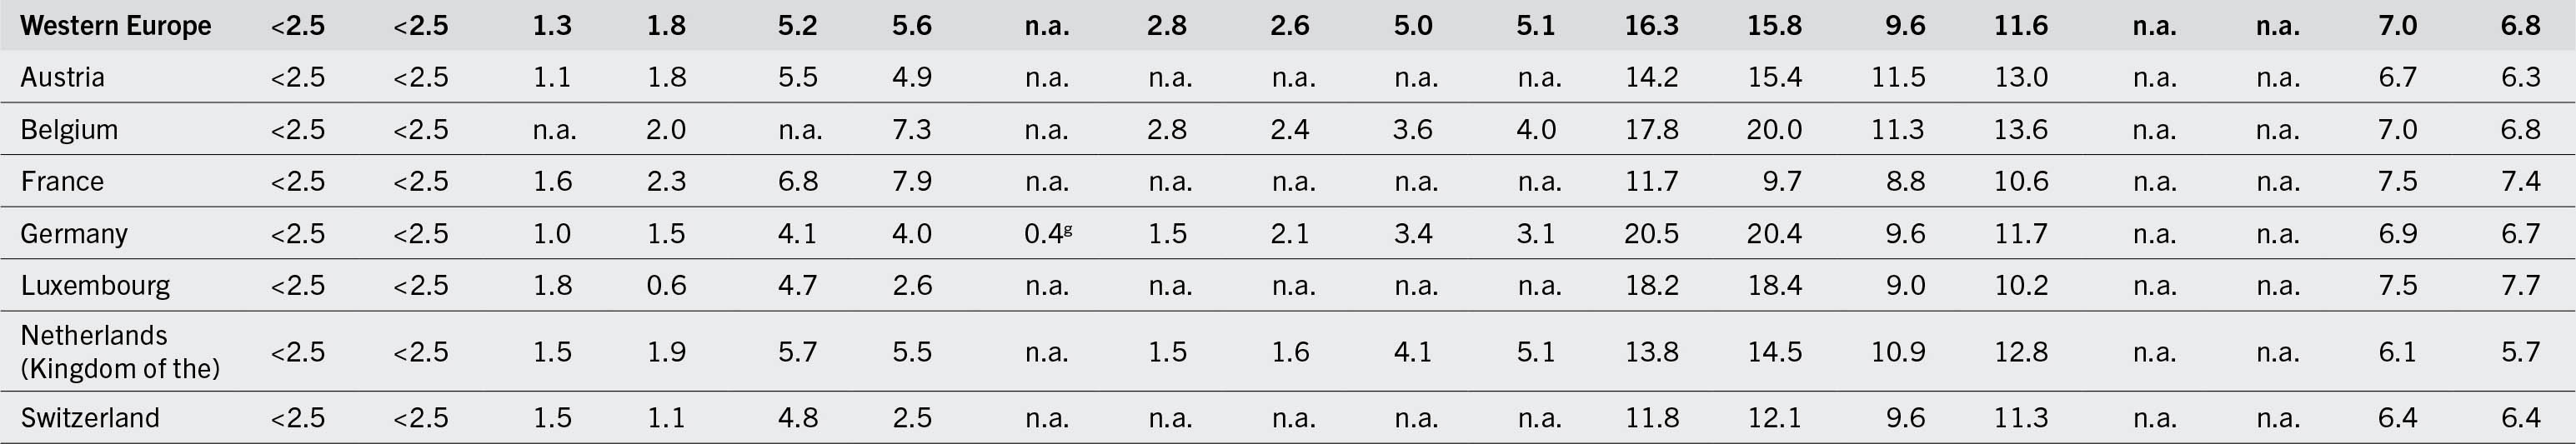
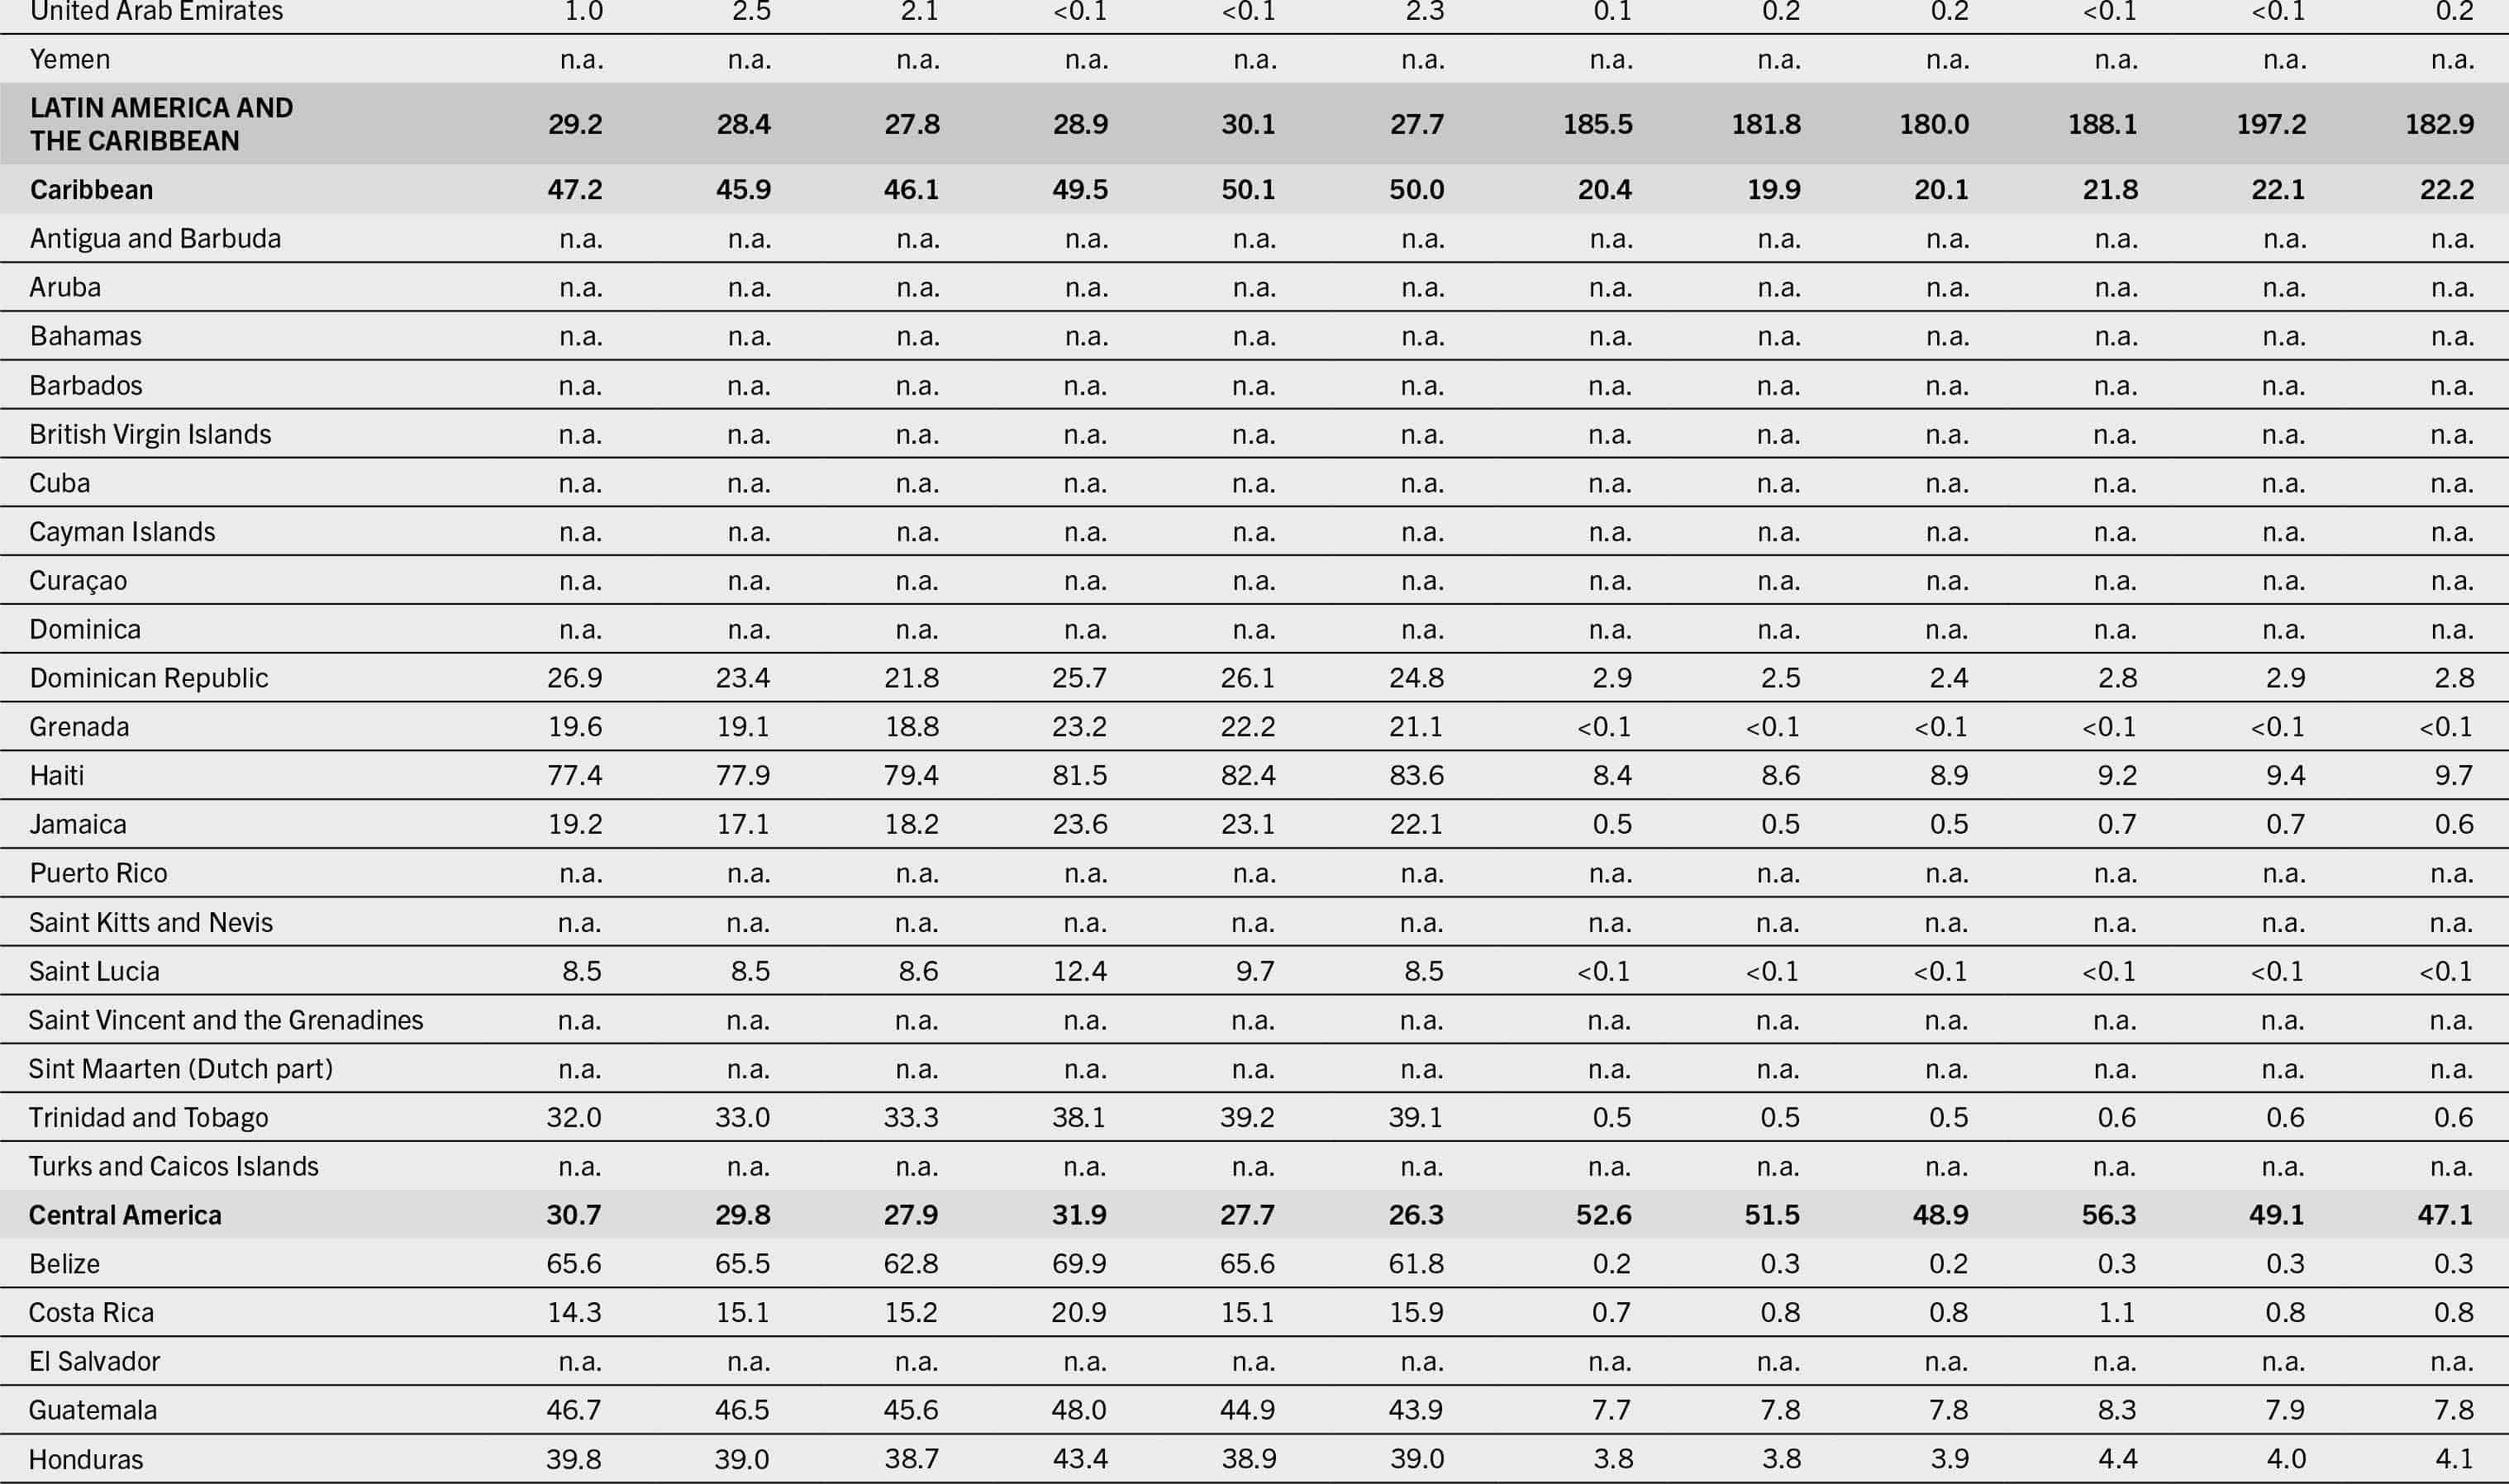
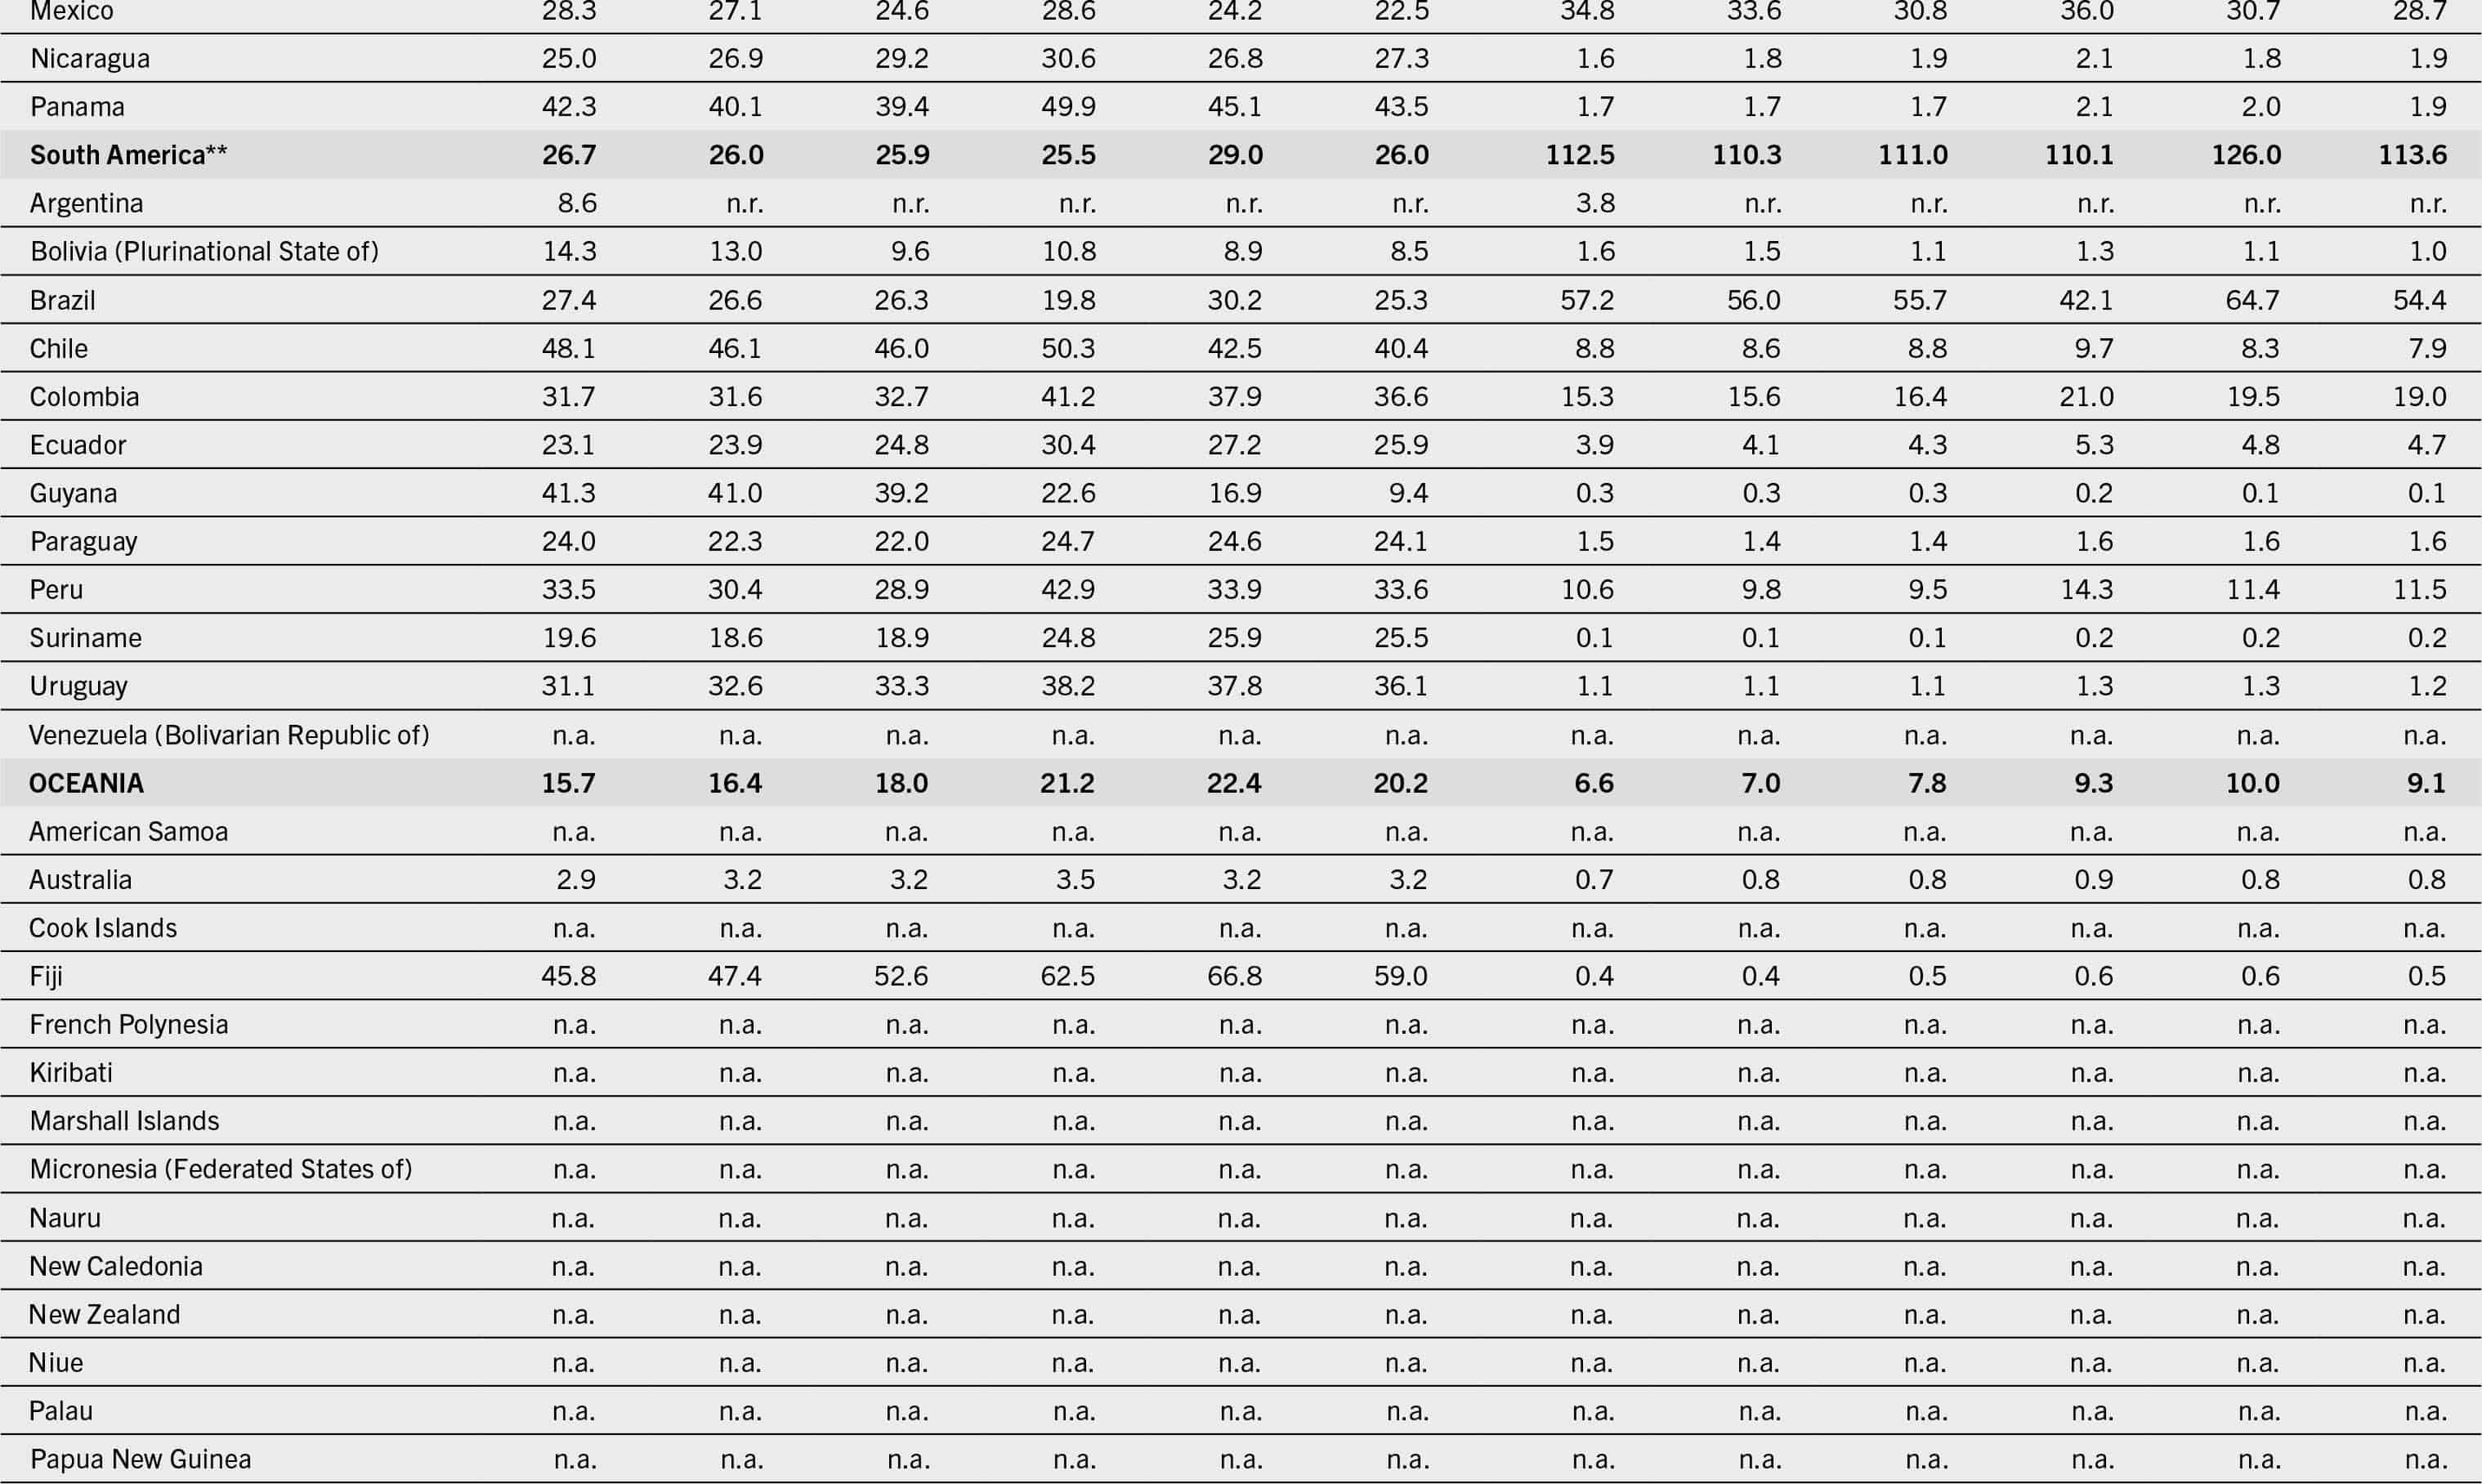
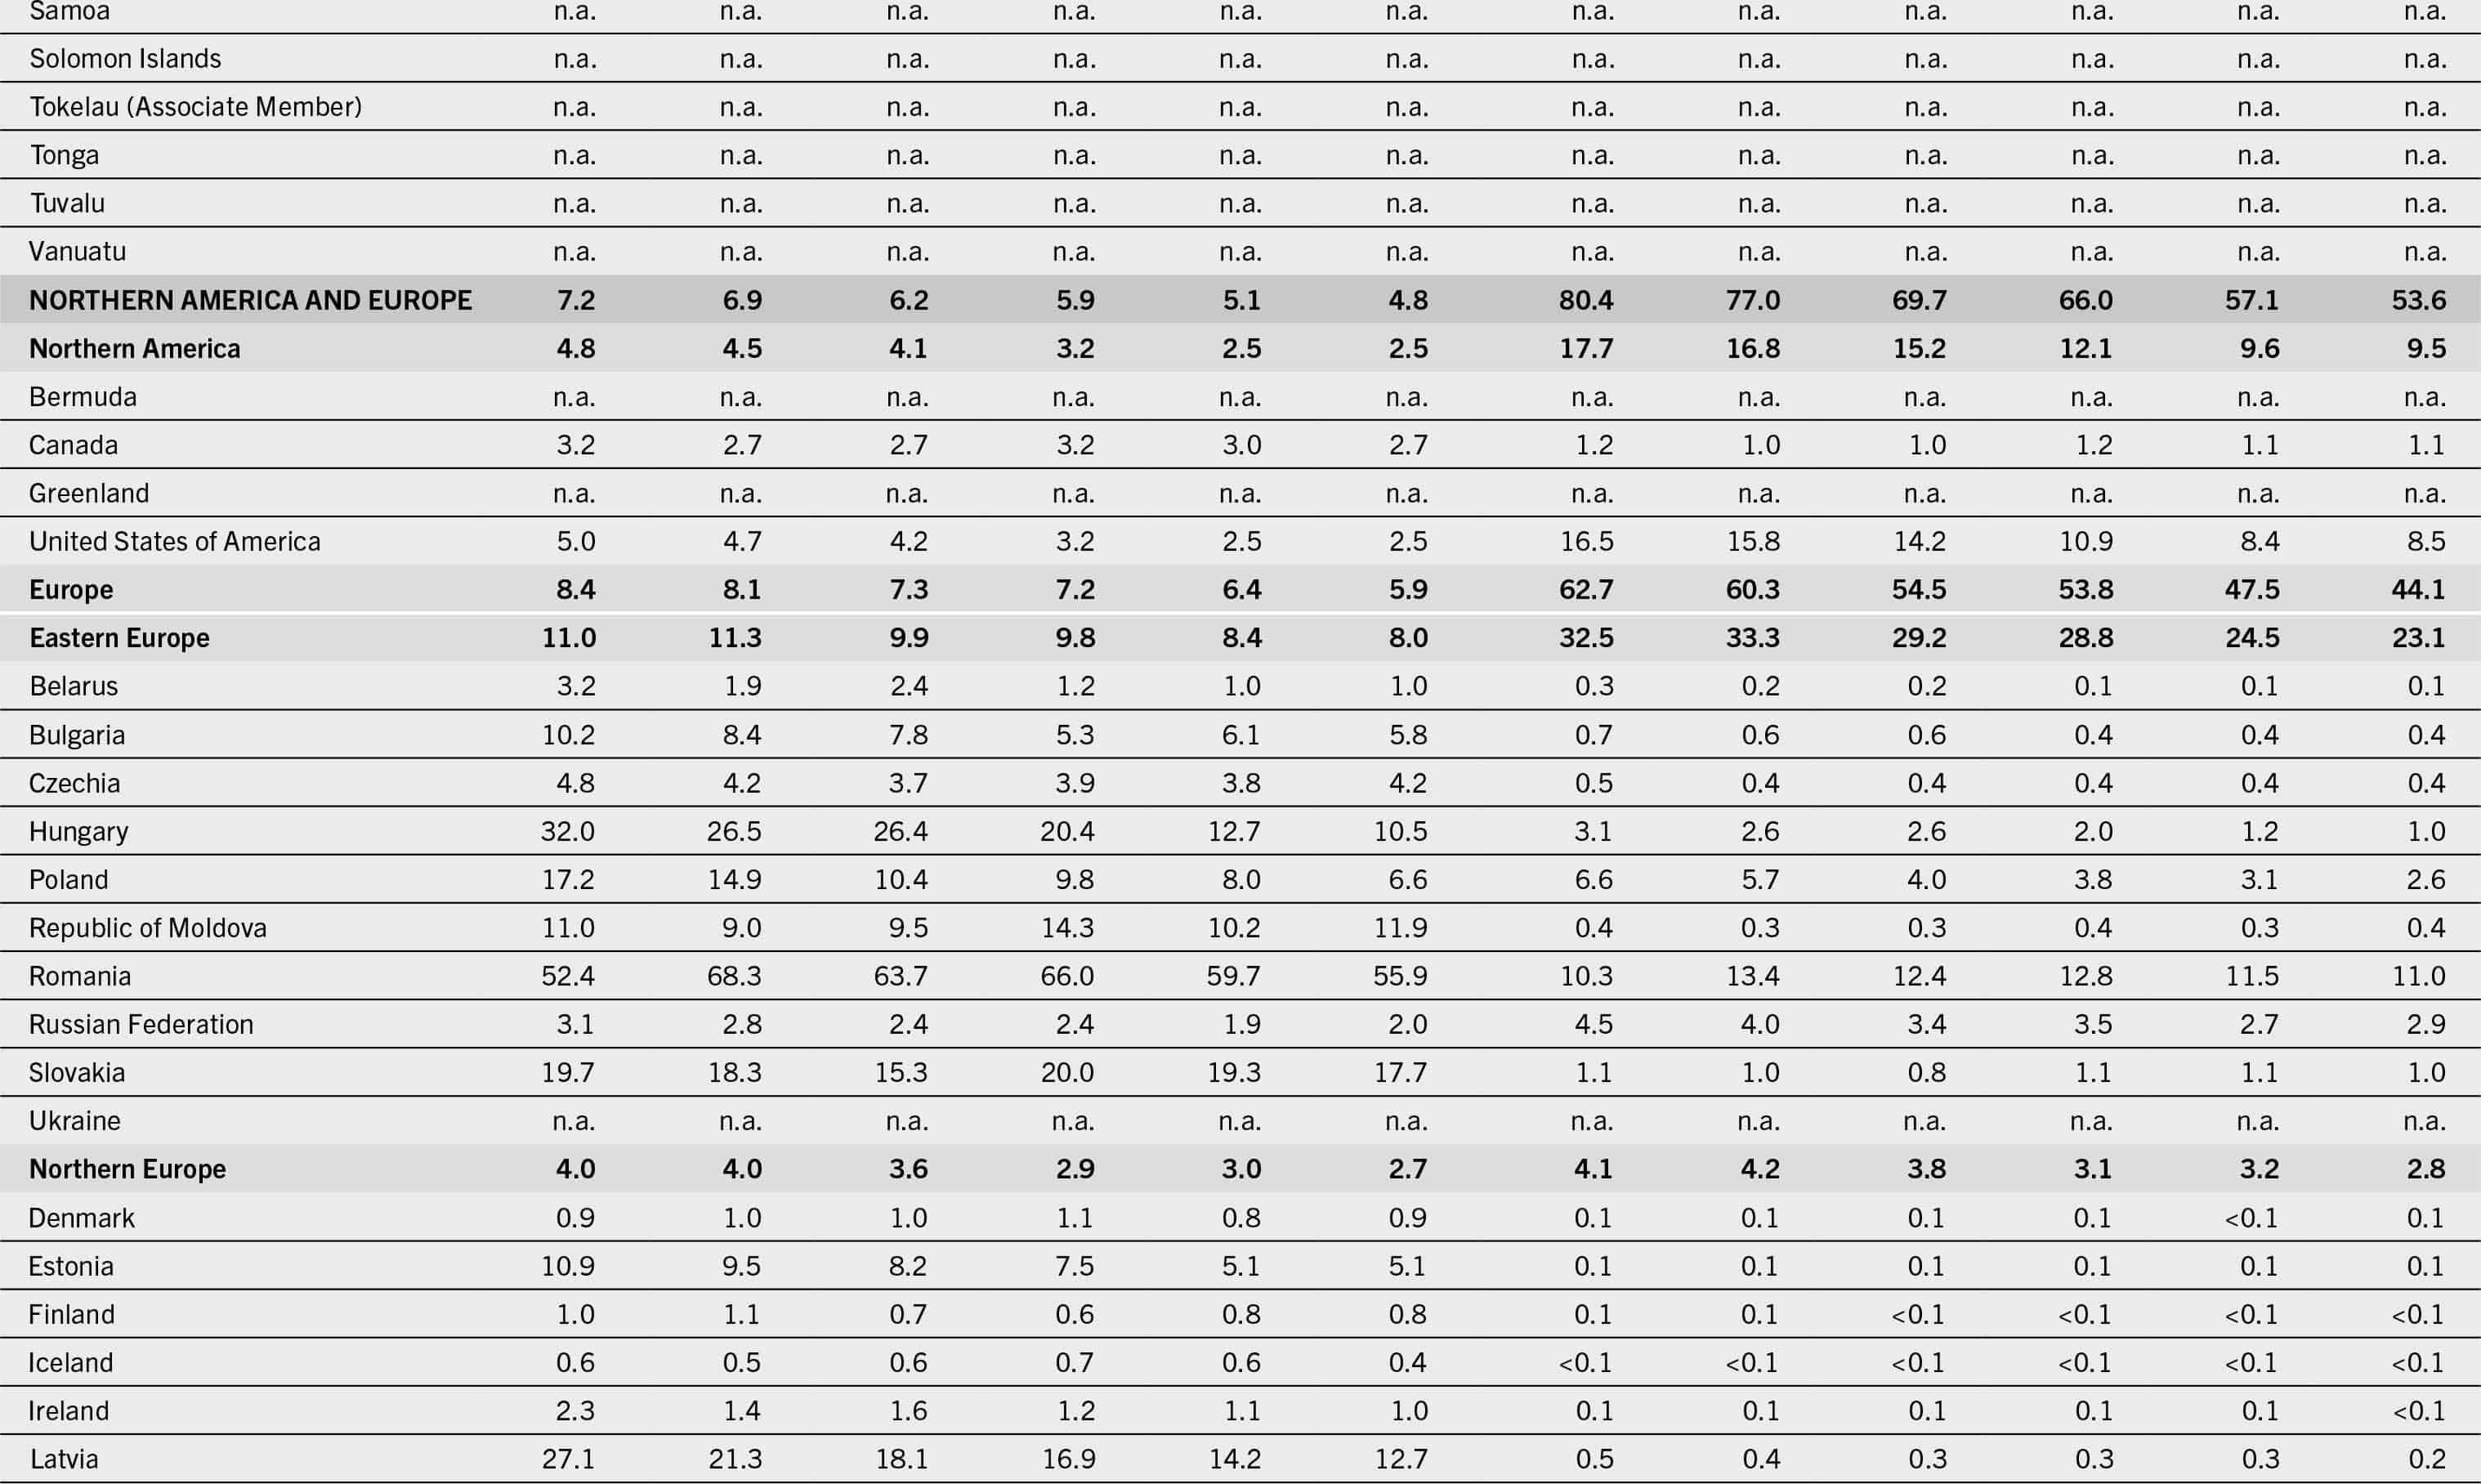
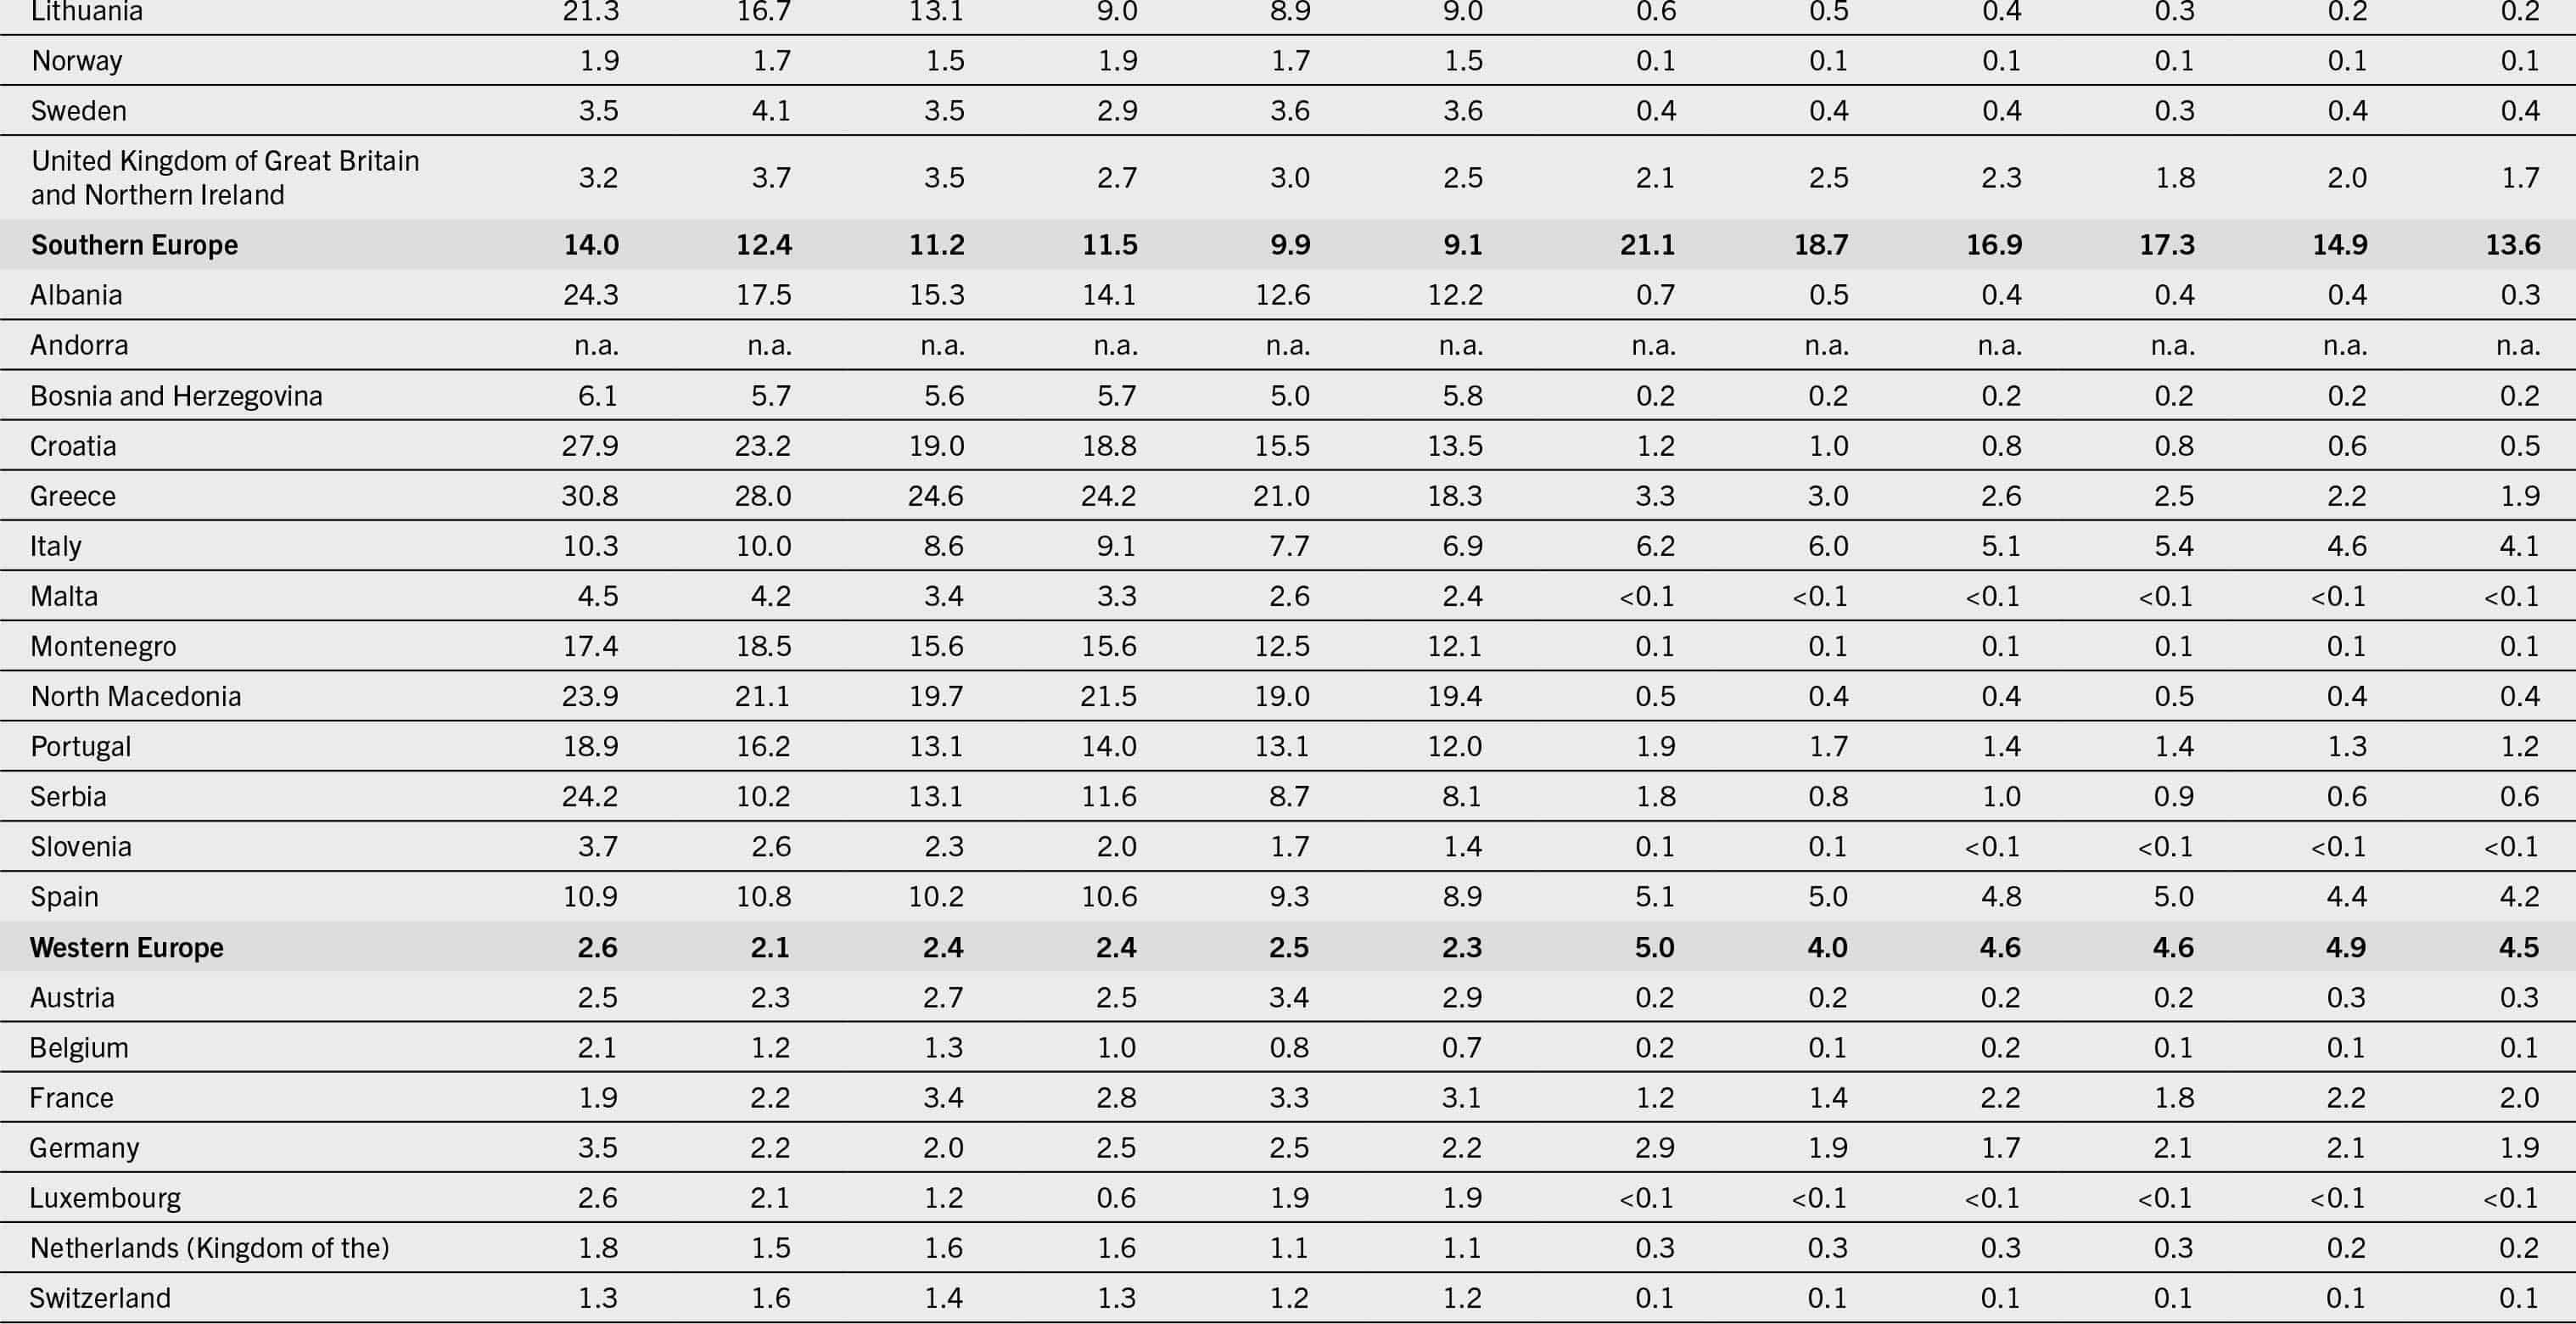
TABLE A1.1 Progress towards the Sustainable Development Goals and global nutrition targets: prevalence of undernourishment, moderate or severe food insecurity, selected forms of malnutrition, exclusive breastfeeding and low birthweight
NOTES:
n.a. = data not available; n.r. = not reported; – = not applicable.
<2.5 = prevalence of undernourishment less than 2.5 percent; <0.5 = prevalence of severe food insecurity less than 0.5 percent.
1. Regional estimates are included when more than 50 percent of population is covered. To reduce the margin of error, estimates are presented as three-year averages.
2. FAO estimates of the number of people living in households where at least one adult has been found to be food insecure.
3. Country-level results are presented only for those countries for which estimates are based on official national data (see note b) or as provisional estimates, based on FAO data collected through the Gallup© World Poll for countries whose national relevant authorities expressed no objection to their publication. Note that consent to publication does not necessarily imply validation of the estimate by the national authorities involved and that the estimate is subject to revision as soon as suitable data from official national sources are available. Global, regional and subregional aggregates are based on data collected in approximately 150 countries.
4. The estimates referring to the middle of the projected ranges for the years 2020 to 2022 were used to calculate the three-year averages.
5. For regional estimates, values correspond to the model predicted estimates for 2022. For countries, the latest data available from 2016 to 2023 are used.
6. Regional estimates are included when more than 50 percent of population is covered. For countries, the latest data available from 2005 to 2012 are used.
7. Regional estimates are included when more than 50 percent of population is covered. For countries, the latest data available from 2016 to 2022 are used.
* Wasting under five years of age; regional aggregates exclude Japan.
** The Northern America wasting estimates are derived applying mixed-effect models with subregions as fixed effects; data were available only for the United States of America, preventing the estimation of standard errors (and confidence intervals). Further details on the methodology are described in De Onis, M., Blössner, M., Borghi, E., Frongillo, E.A. & Morris, R. 2004. Estimates of global prevalence of childhood underweight in 1990 and 2015. Journal of the American Medical Association, 291(21): 2600–2606. https://doi.org/10.1001/jama.291.21.2600. Model selection is based on best fit.
a. Consecutive low population coverage; interpret with caution.
b. Based on official national data.
c. For years when official national data are not available, the estimates are integrated with FAO data. See Annex 1B for further details.
d. Results based on data collected by FAO through the Gallup© World Poll (see Annex 1B for methodology) are provisional and will be revised soon, as the National Institute of Statistics and Informatics (INEI) has made great progress in adapting and incorporating the Food Insecurity Experience Scale module in the National Household Survey (Encuesta Nacional de Hogares – ENAHO).
e. Most recent input data are from before 2000; interpret with caution.
f. The UNICEF–WHO low birthweight estimates are derived through standard methodology applied to all countries to ensure comparability and are not the official statistics of the Government of India. India’s most recent national official low birthweight prevalence is 18.2 percent from the 2019–2021 National Family Health Survey–5 (NFHS-5), which is used as the basis of the UNICEF–WHO global estimation model to support cross-country comparability.
g. This estimate has been adjusted because the original estimate did not cover the full age range or the data source was only representative of rural areas.
h. The estimate for Palestine reflects the situation before the conflict erupted at the end of 2023.
SOURCES: Data for undernourishment and food insecurity are from FAO. 2024. FAOSTAT: Suite of Food Security Indicators. [Accessed on 24 July 2024]. https://www.fao.org/faostat/en/#data/FS. Licence: CC-BY-4.0; data for stunting, wasting and overweight are based on UNICEF, WHO & World Bank. 2023. Levels and trends in child malnutrition. UNICEF / WHO / World Bank Group Joint Child Malnutrition Estimates – Key findings of the 2023 edition. New York, USA, UNICEF, Geneva, Switzerland, WHO and Washington, DC, World Bank. https://data.unicef.org/resources/jme-report-2023, http://www.who.int/teams/nutrition-and-food-safety/monitoring-nutritional-status-and-food-safety-and-events/joint-child-malnutrition-estimates, https://datatopics.worldbank.org/child-malnutrition; data for adult obesity are based on WHO. 2024. Global Health Observatory (GHO) data repository: Prevalence of obesity among adults, BMI ≥ 30, age-standardized. Estimates by country. [Accessed on 24 July 2024]. https://www.who.int/data/gho/data/indicators/indicator-details/GHO/prevalence-of-obesity-among-adults-bmi-=-30-(age-standardized-estimate)-(-). Licence: CC-BY-4.0; data for anaemia are based on WHO. 2021. WHO global anaemia estimates, 2021 edition. In: WHO. [Cited 24 July 2024]. https://www.who.int/data/gho/data/themes/topics/anaemia_in_women_and_children; data for exclusive breastfeeding are based on UNICEF. 2024. Infant and young child feeding. In: UNICEF. [Cited 24 July 2024]. https://data.unicef.org/topic/nutrition/infant-and-young-child-feeding; data for low birthweight are from UNICEF & WHO. 2023. Low birthweight. In: UNICEF. [Cited 24 July 2024]. https://data.unicef.org/topic/nutrition/low-birthweight; UNICEF & WHO. 2023. Joint low birthweight estimates. In: WHO. [Cited 24 July 2024]. https://www.who.int/teams/nutrition-and-food-safety/monitoring-nutritional-status-and-food-safety-and-events/joint-low-birthweight-estimates
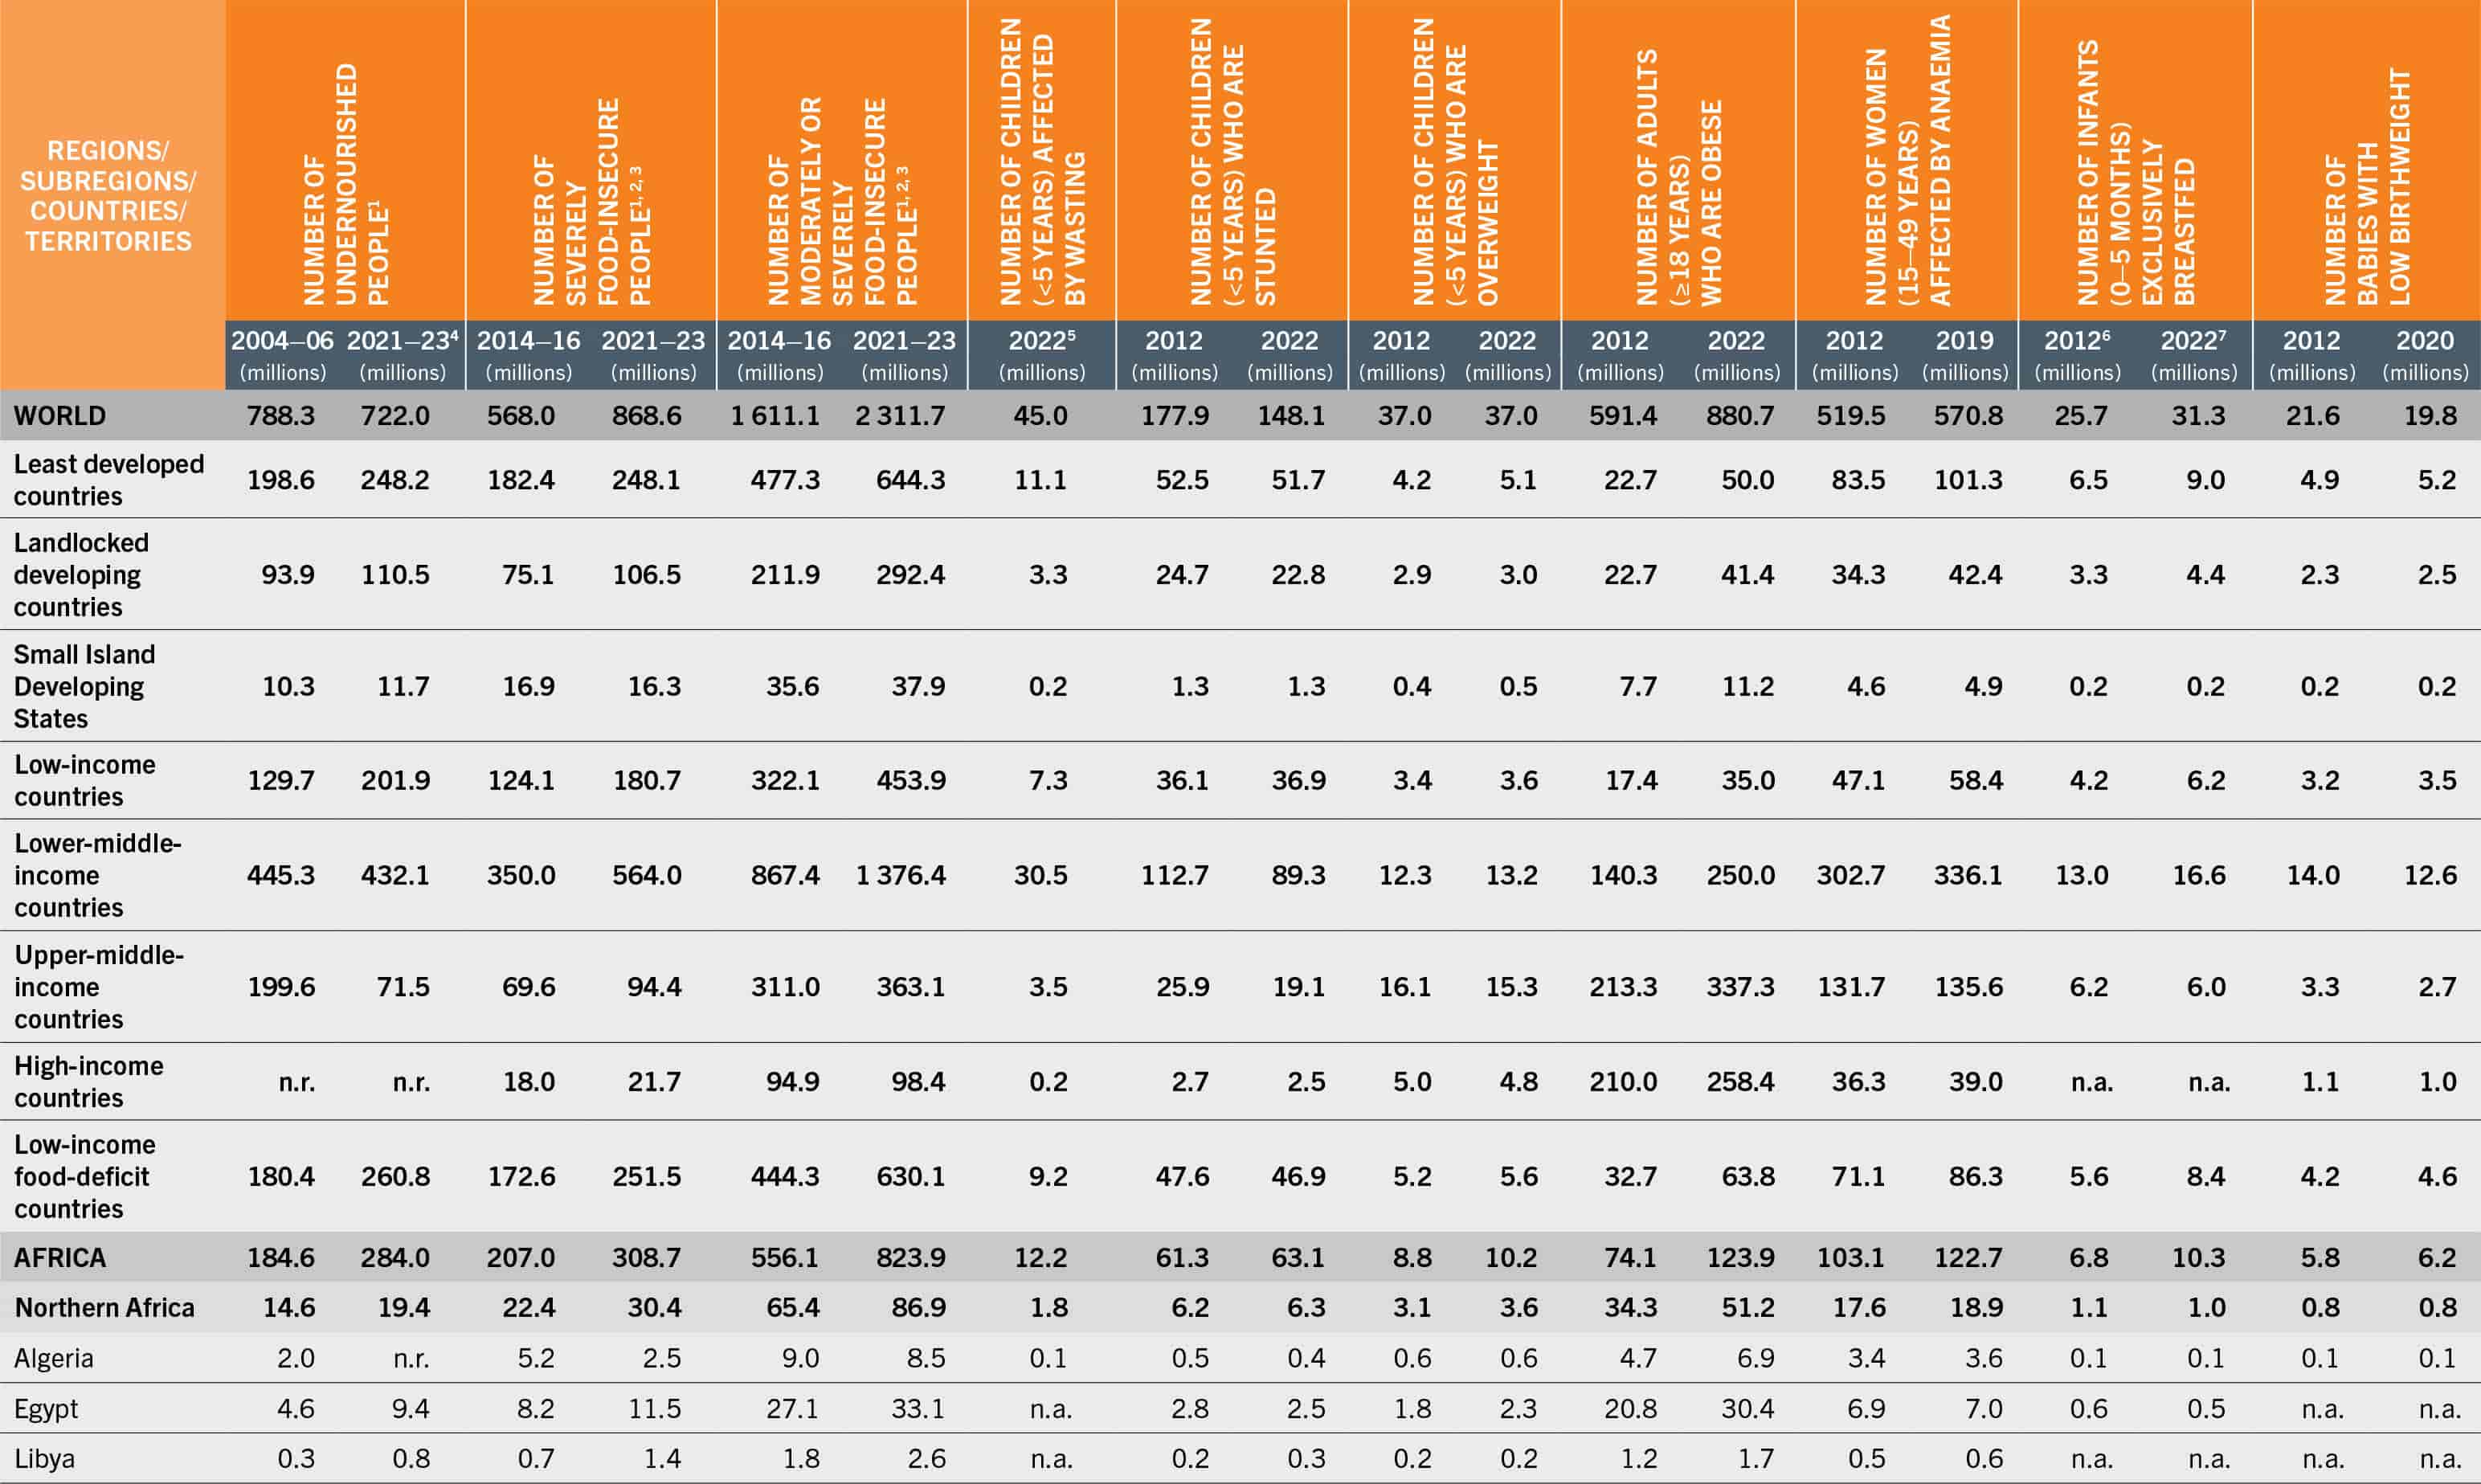
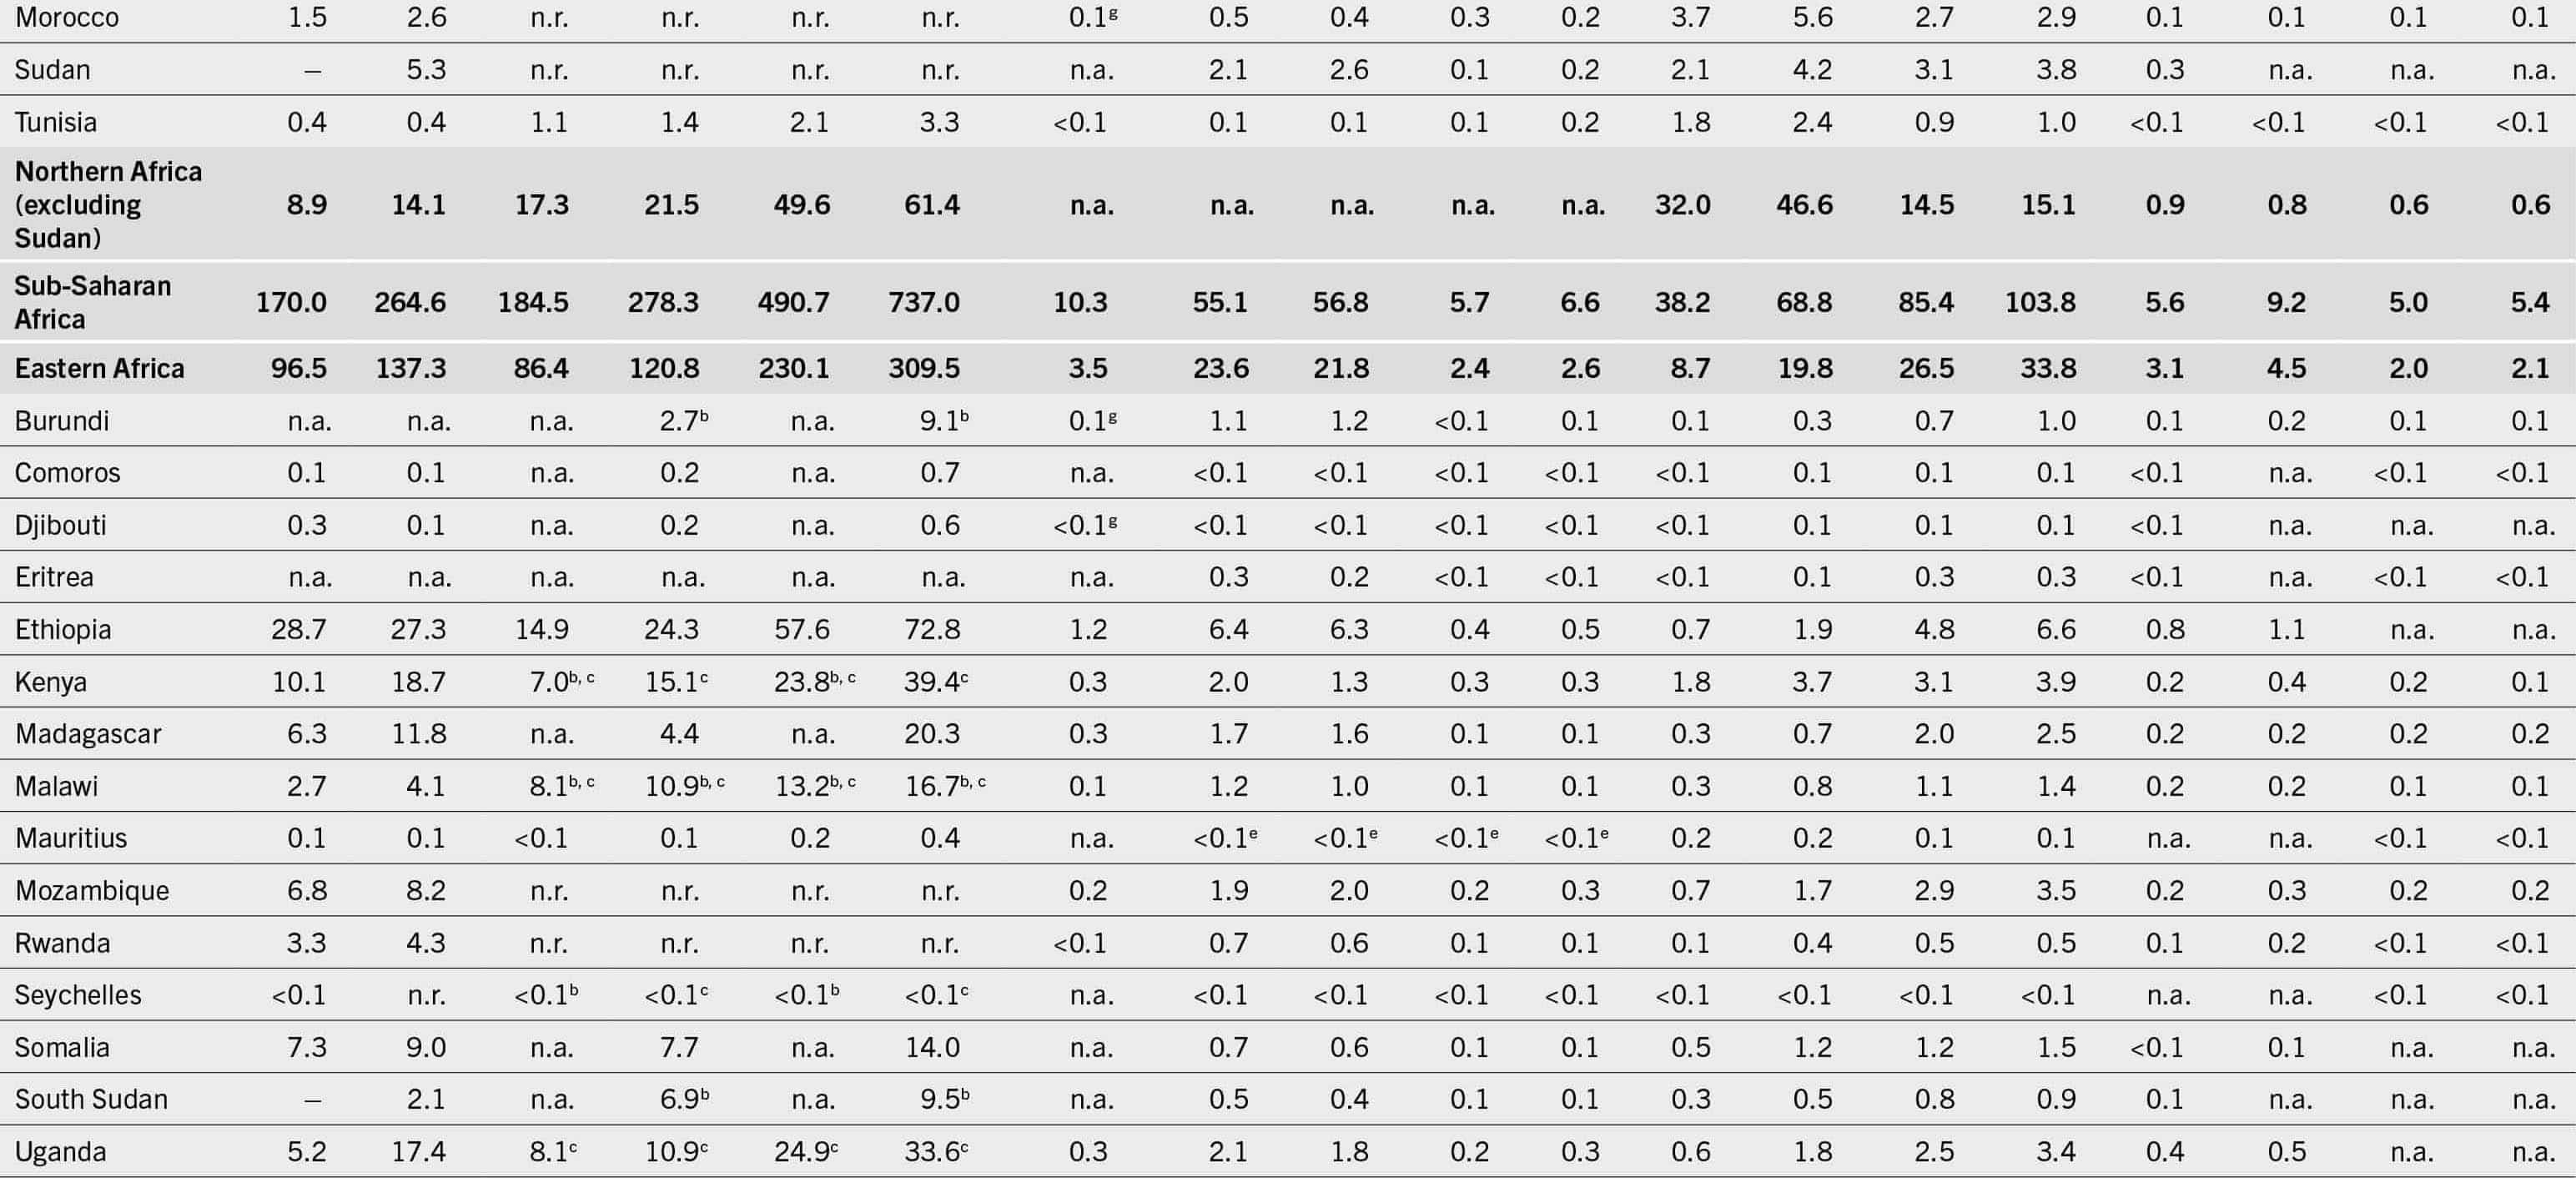
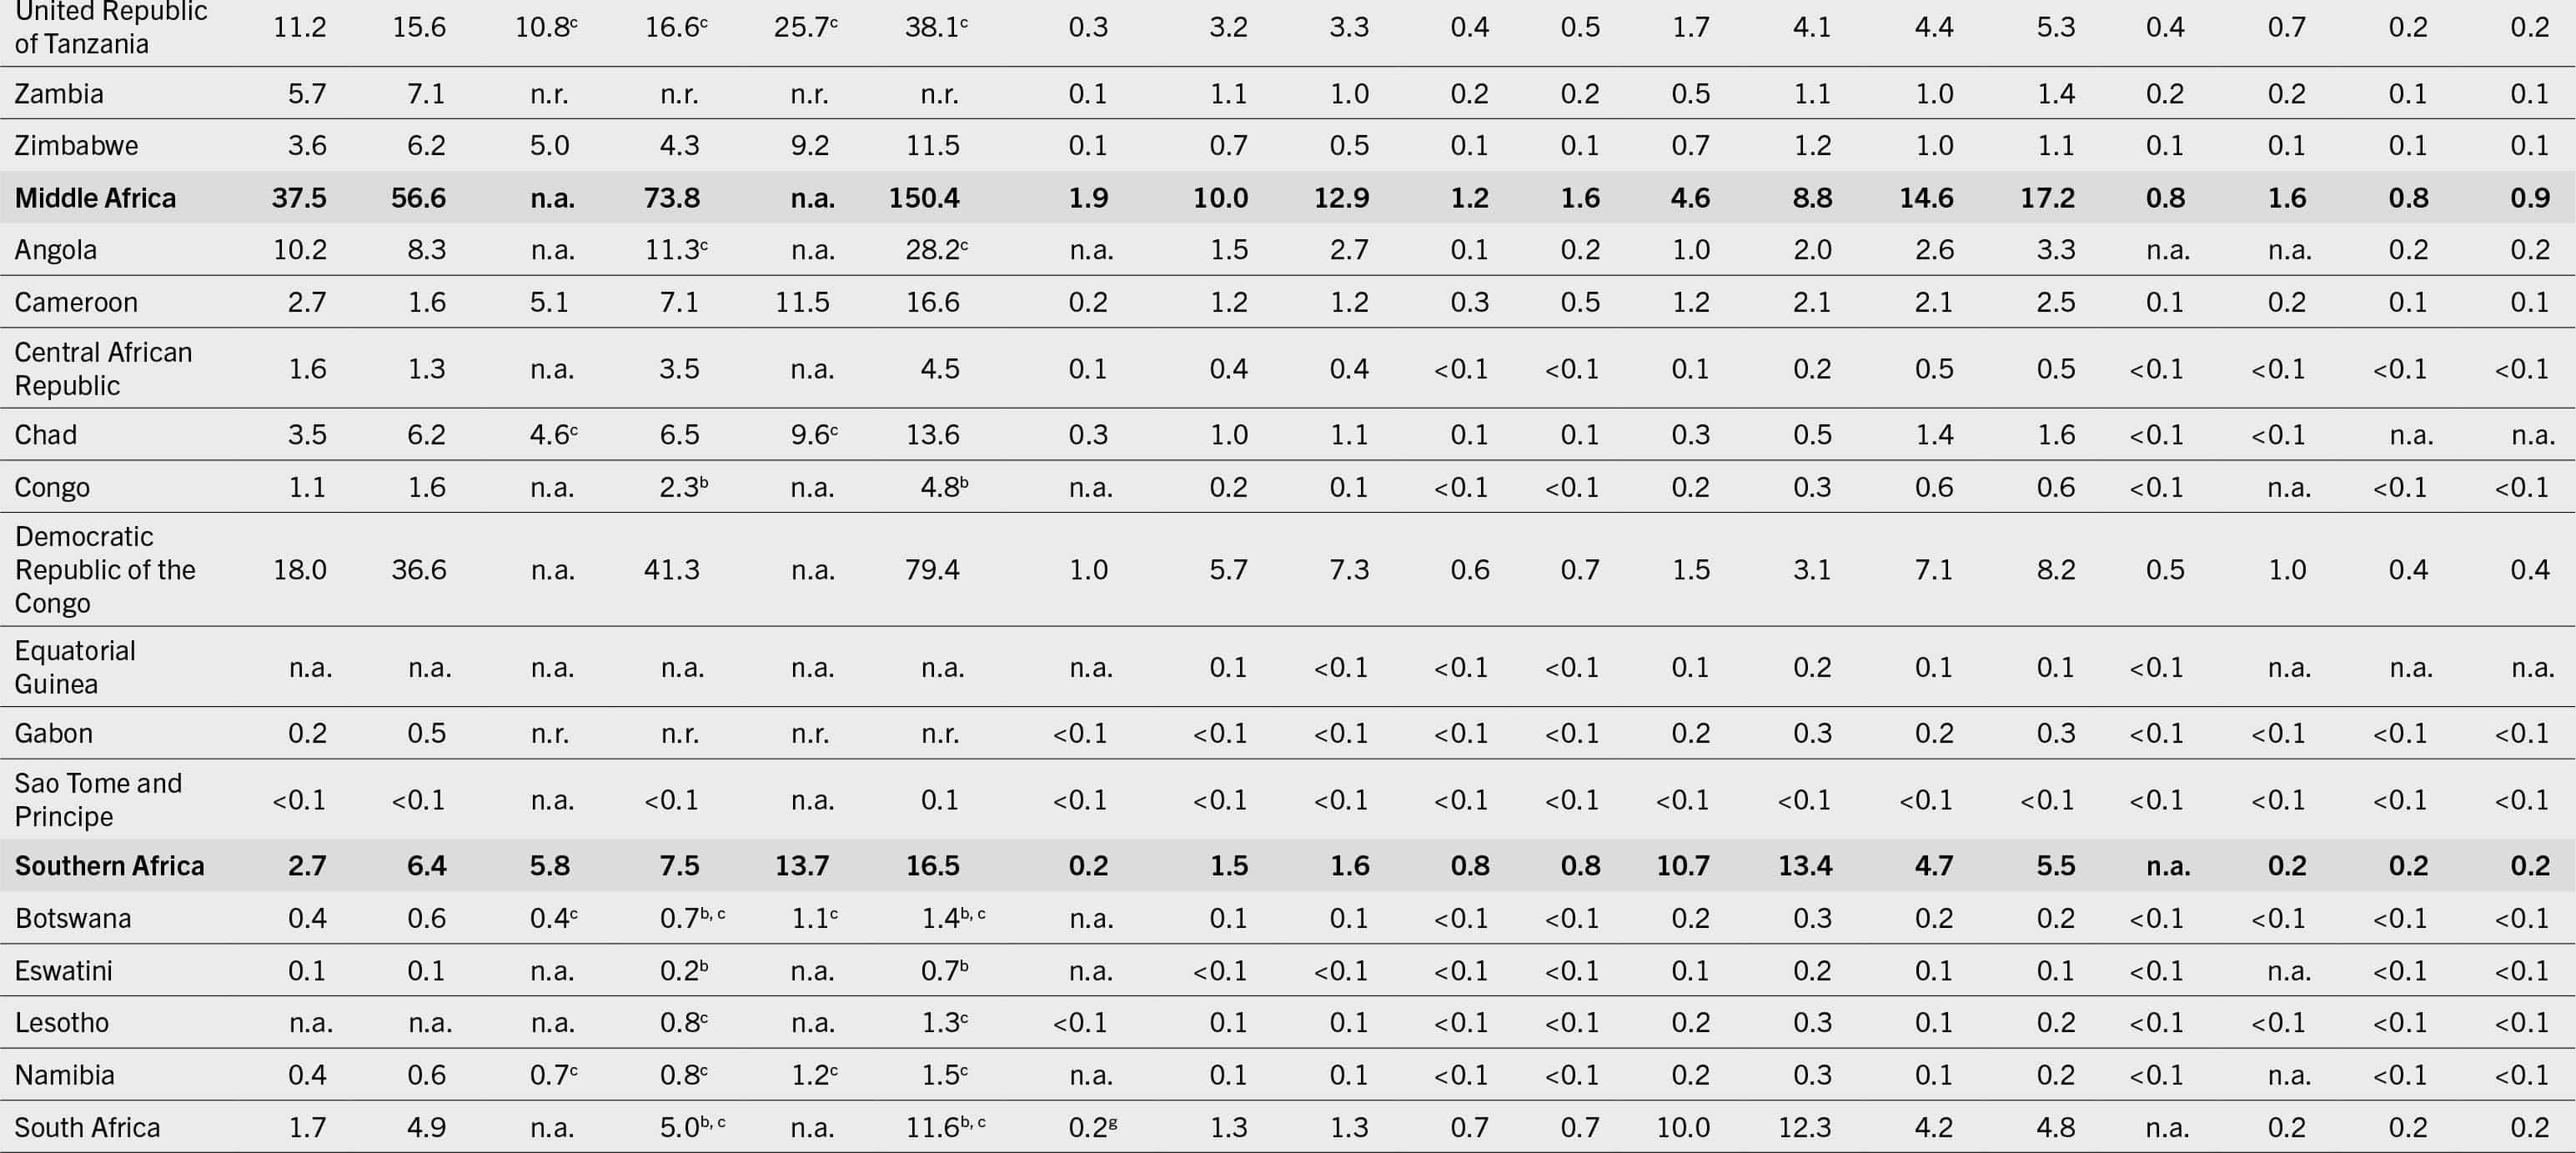
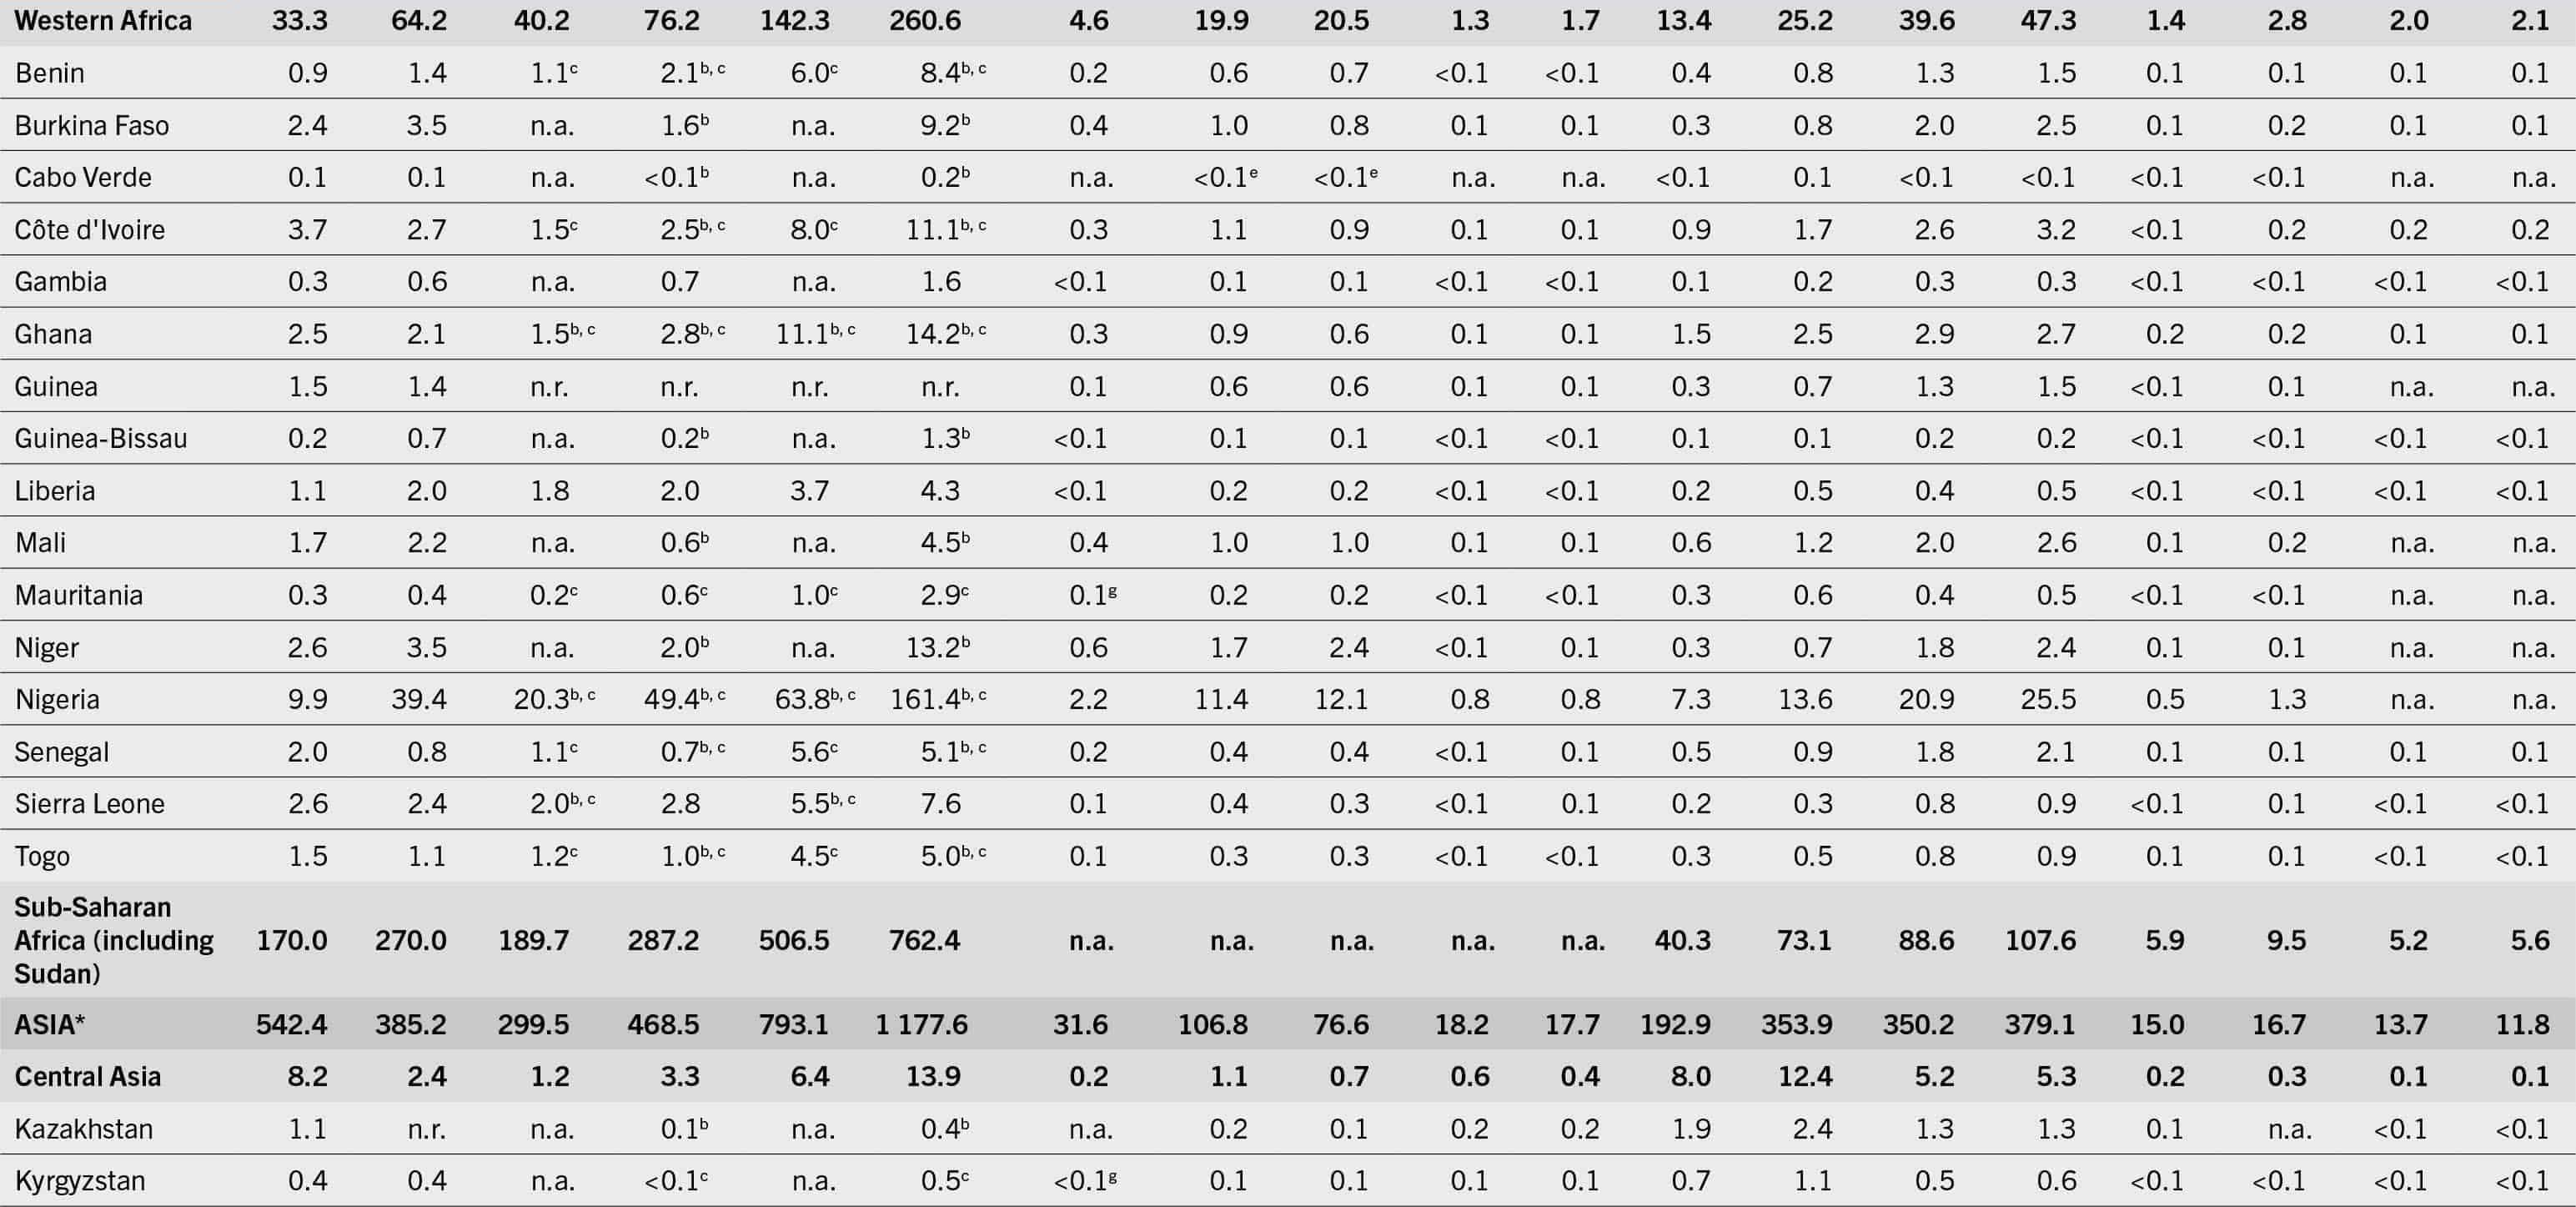
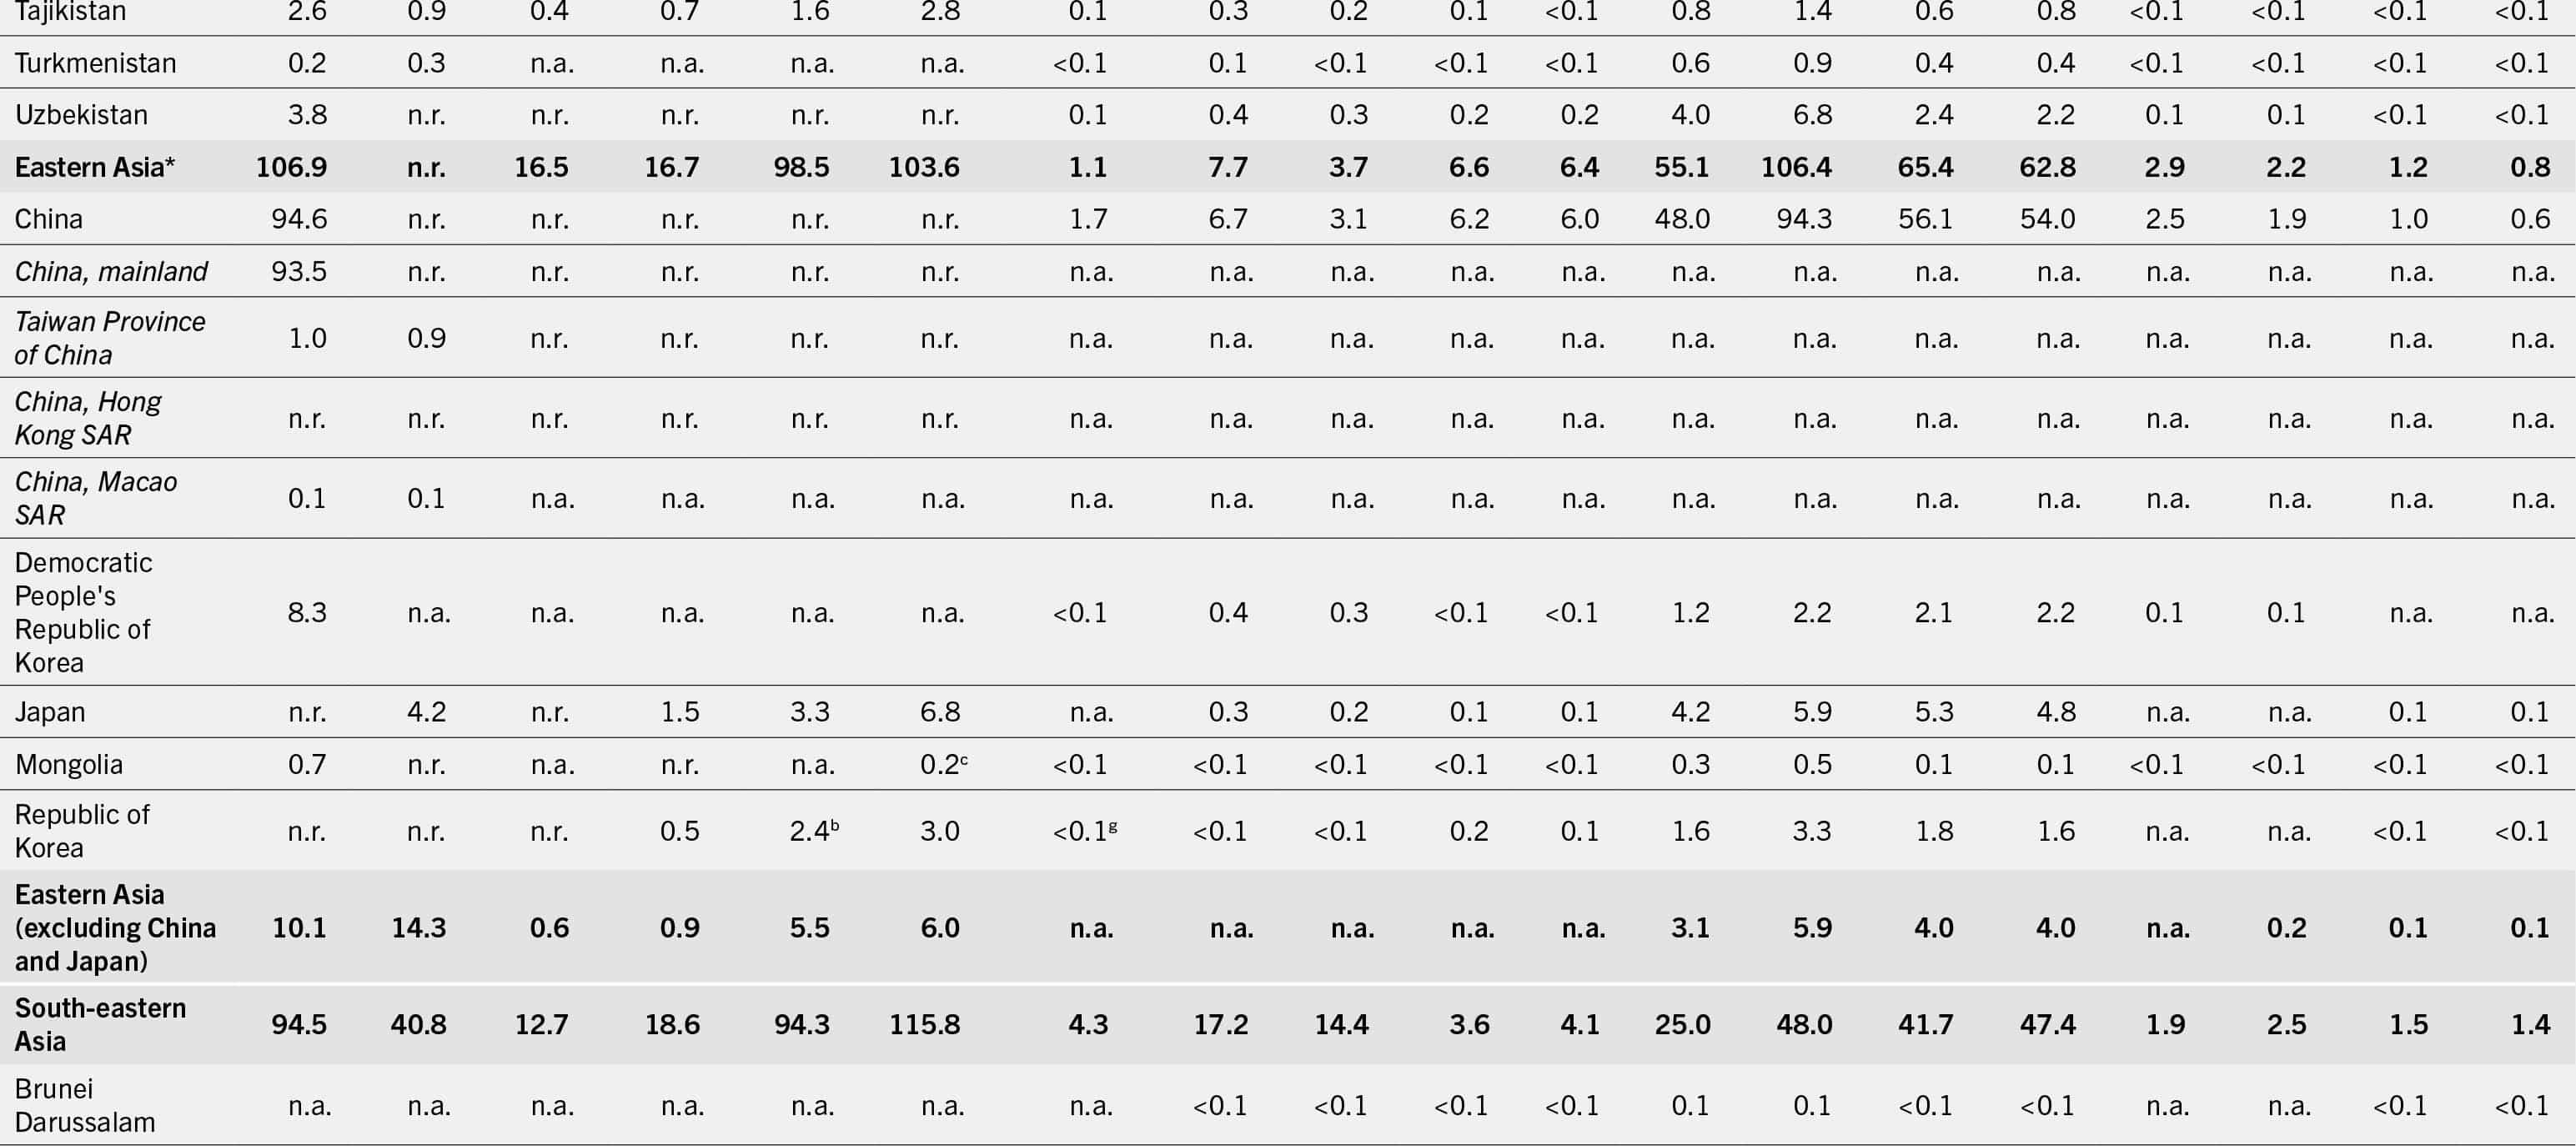
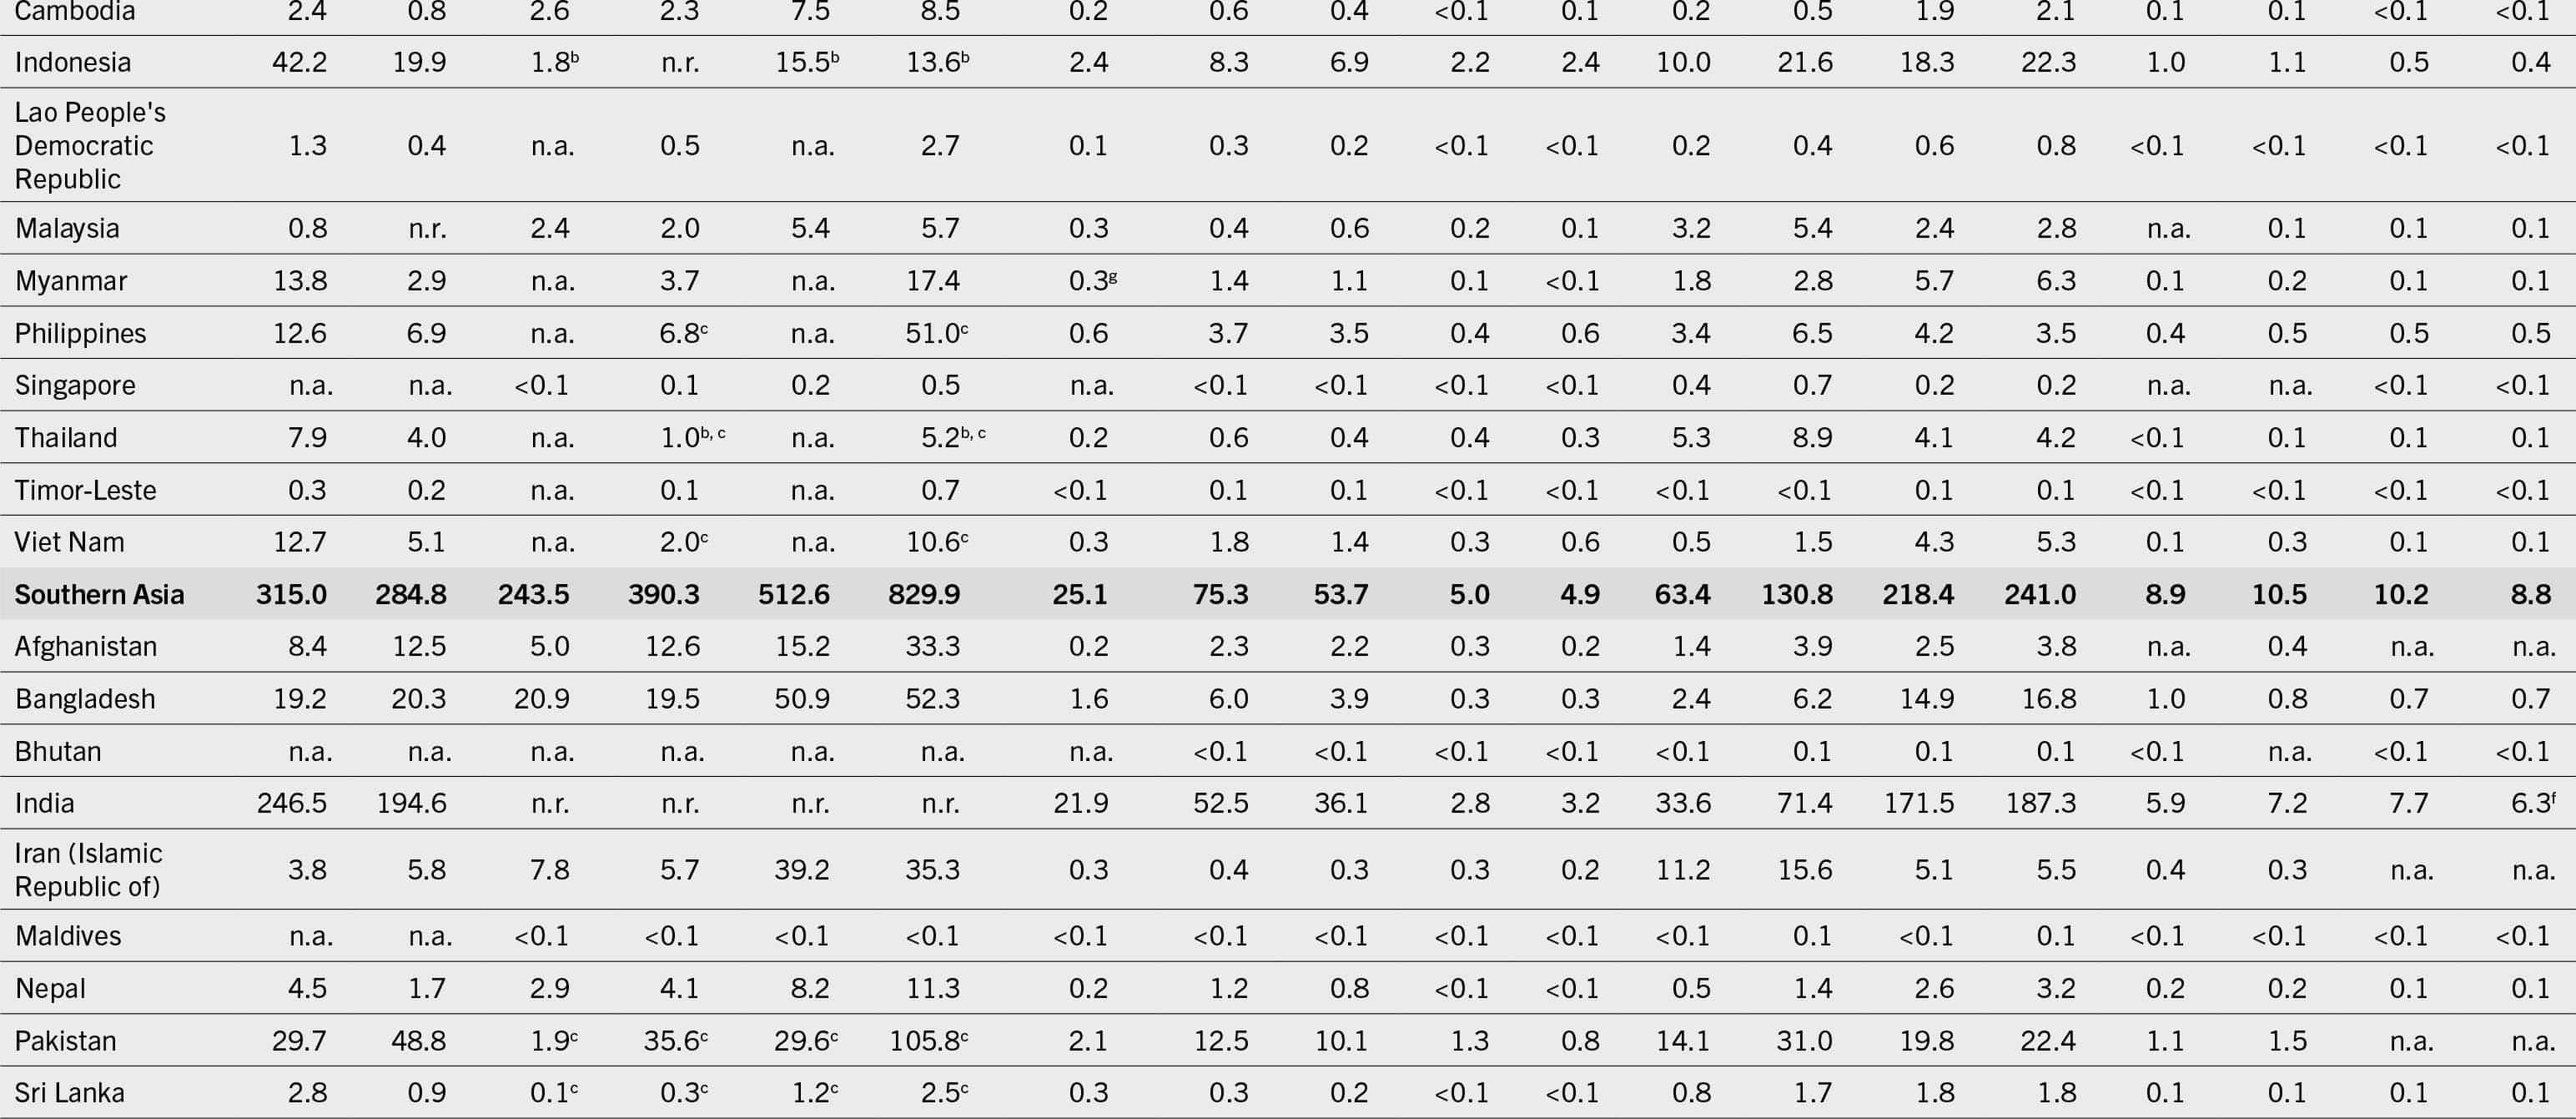
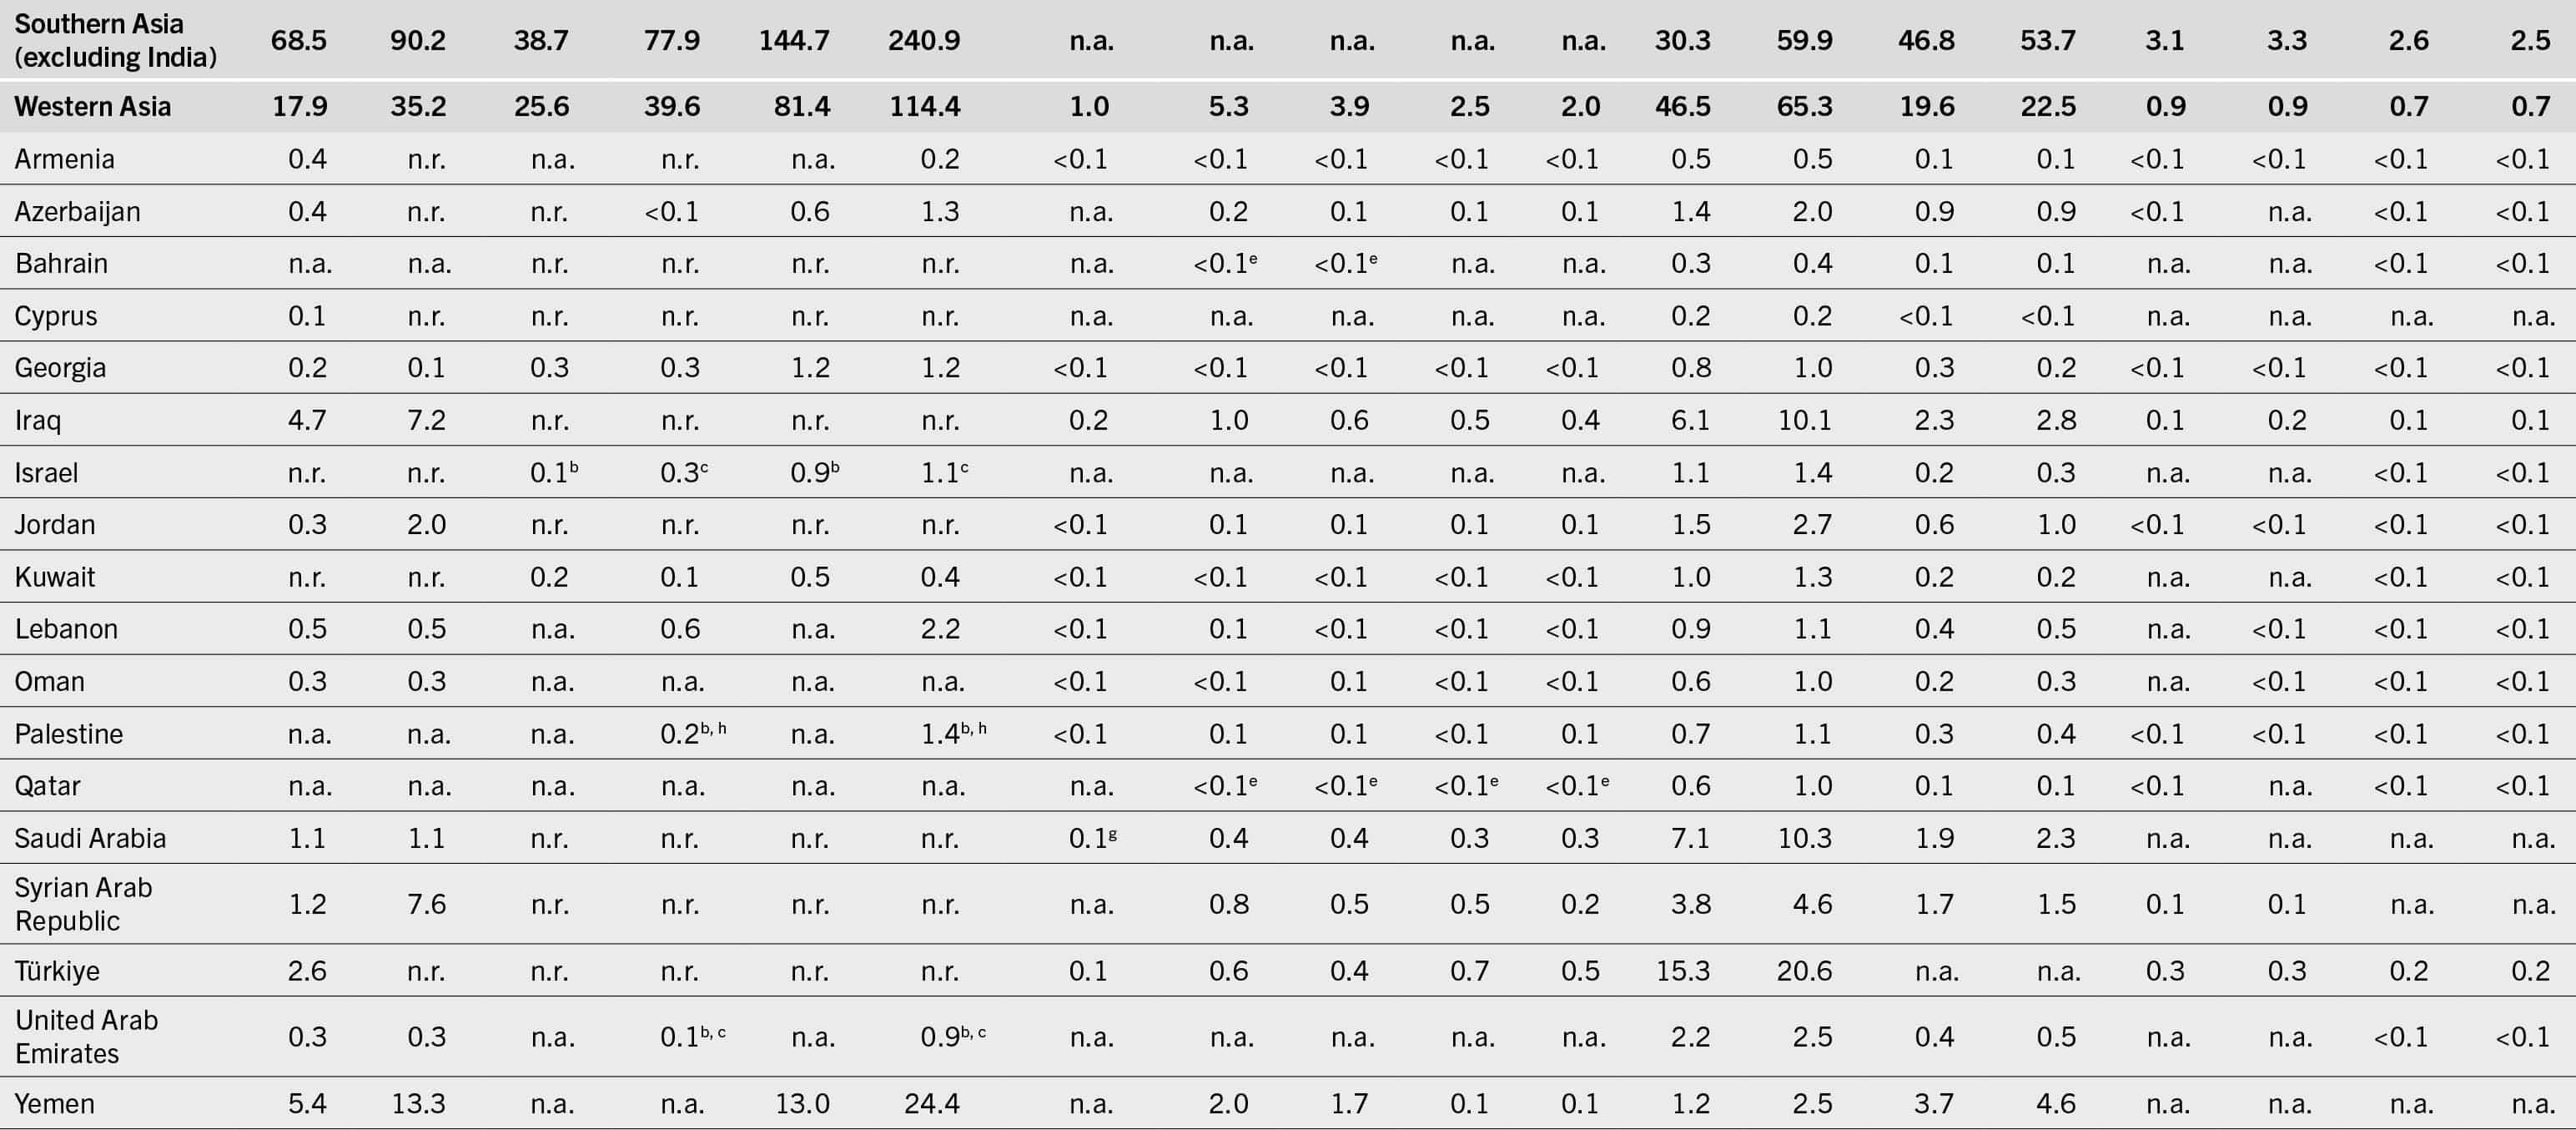
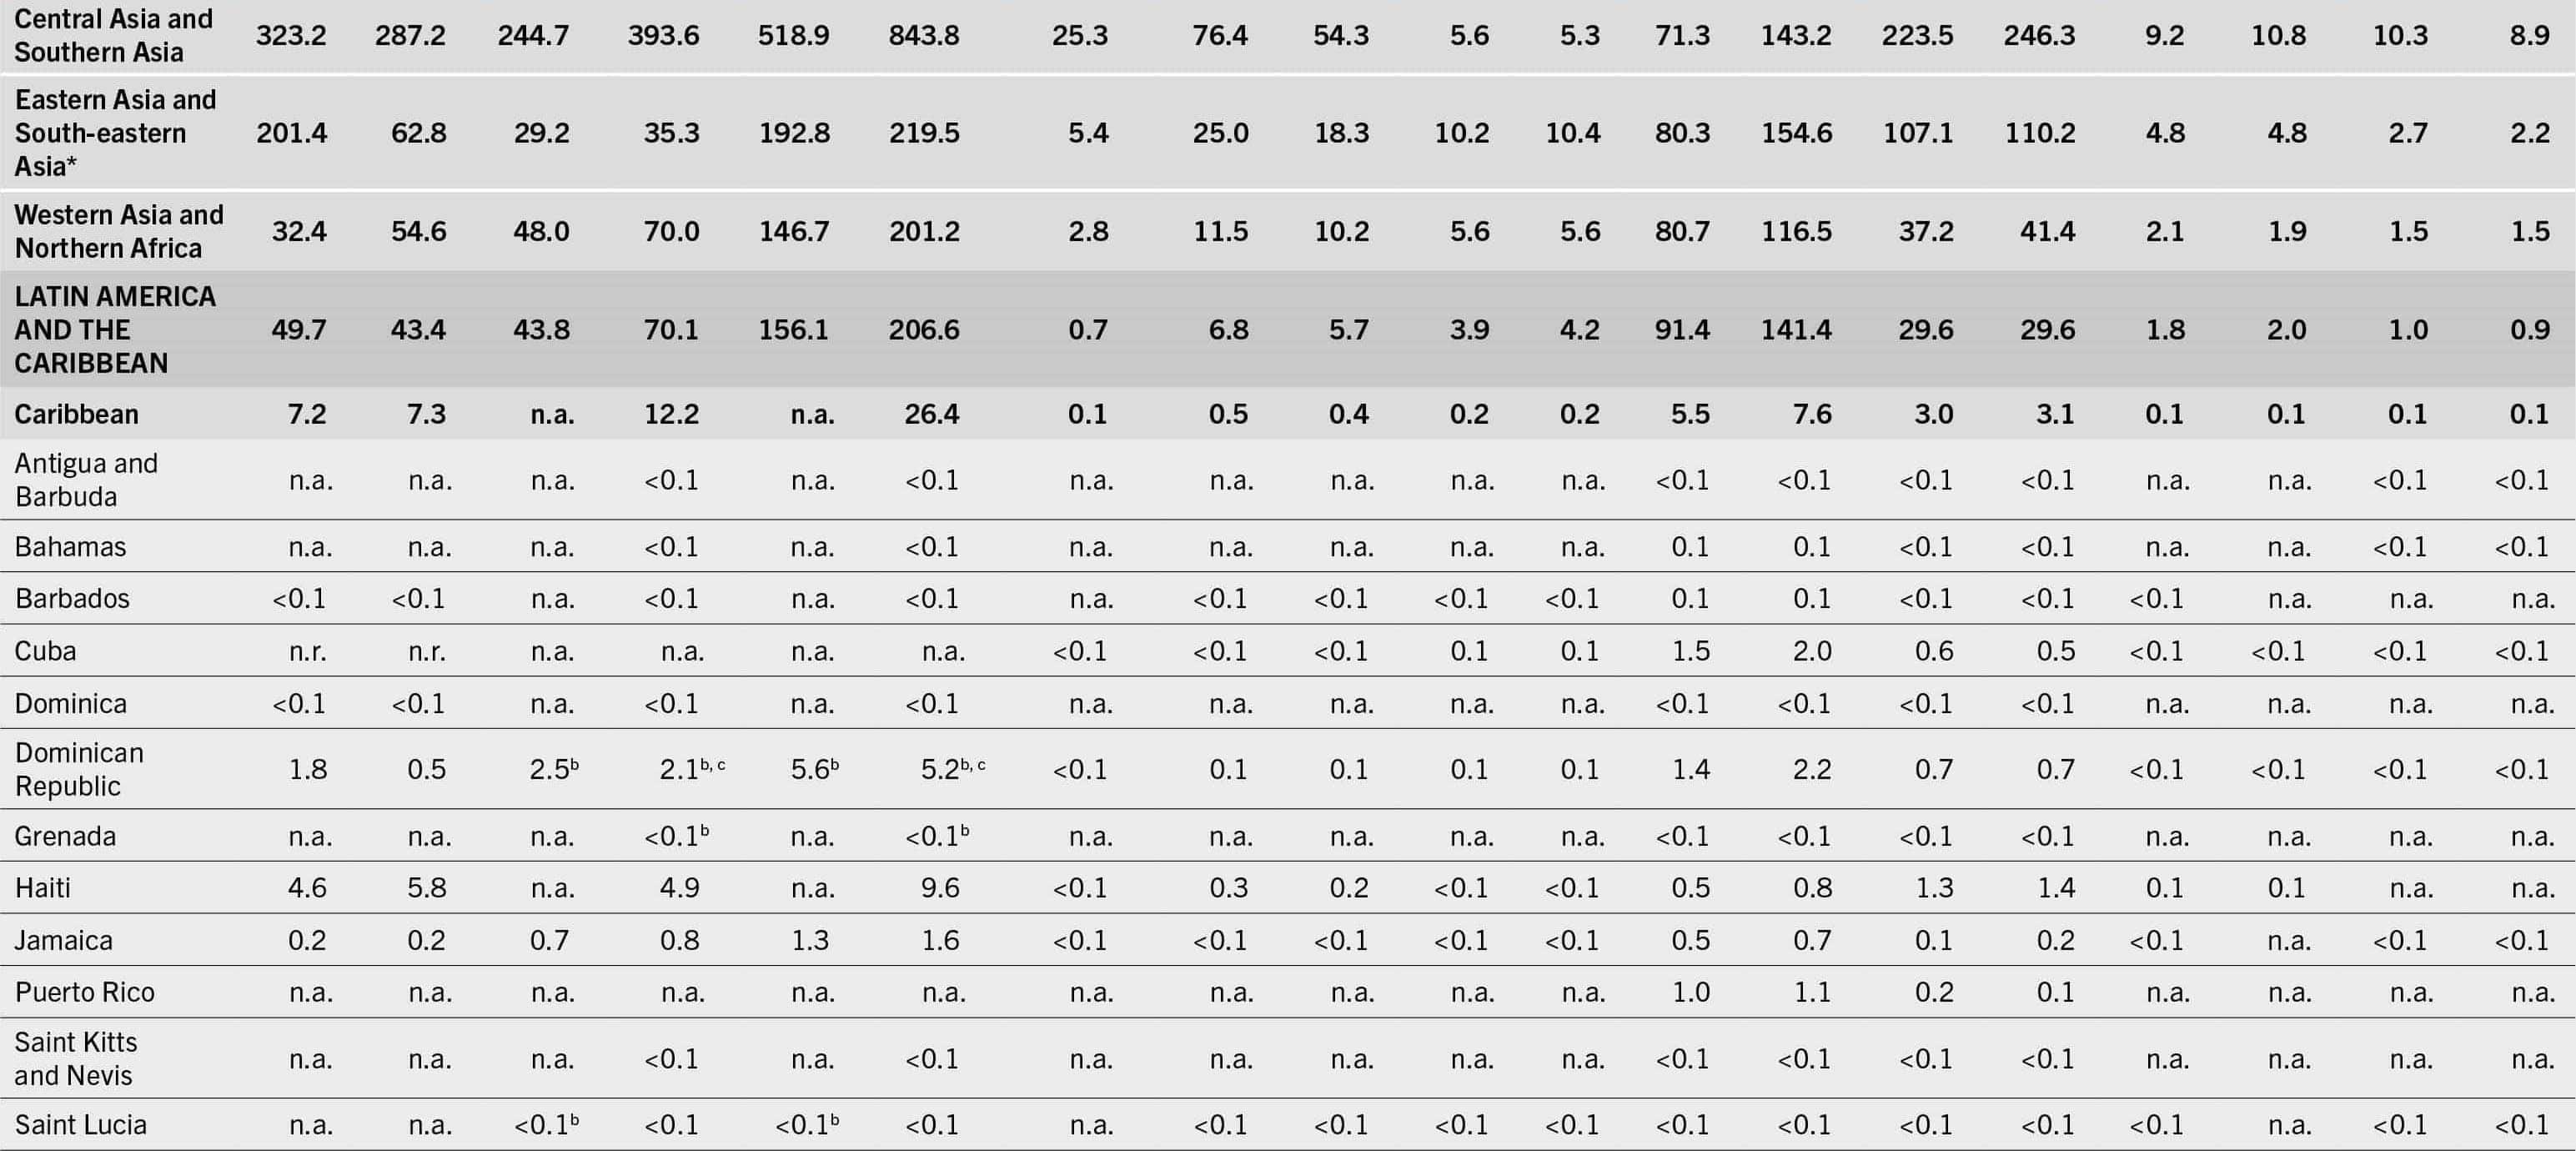
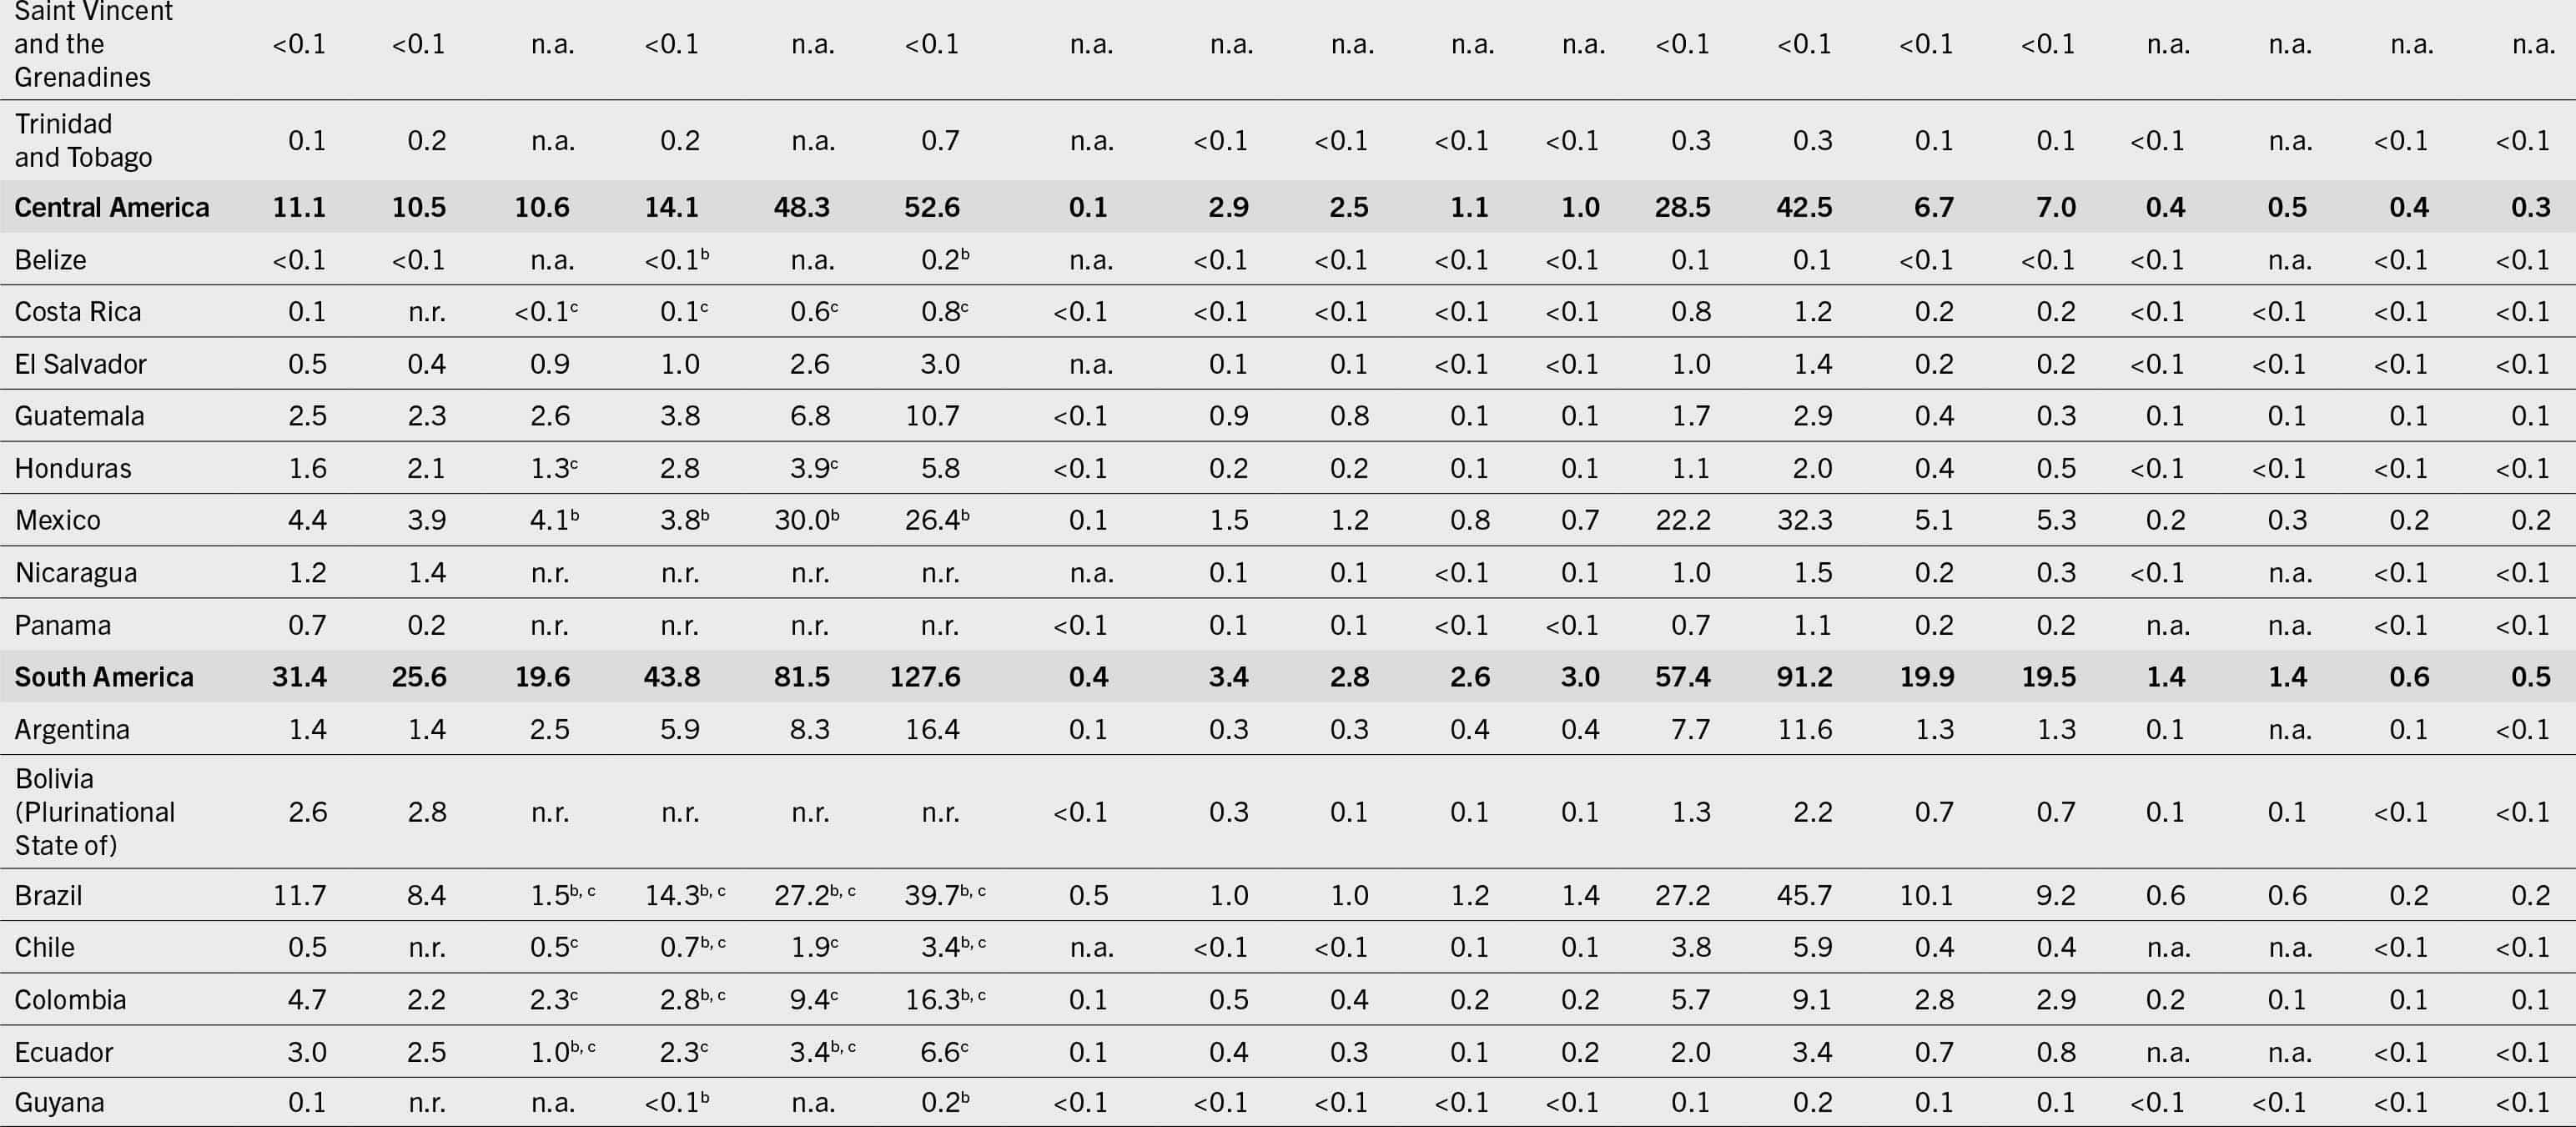
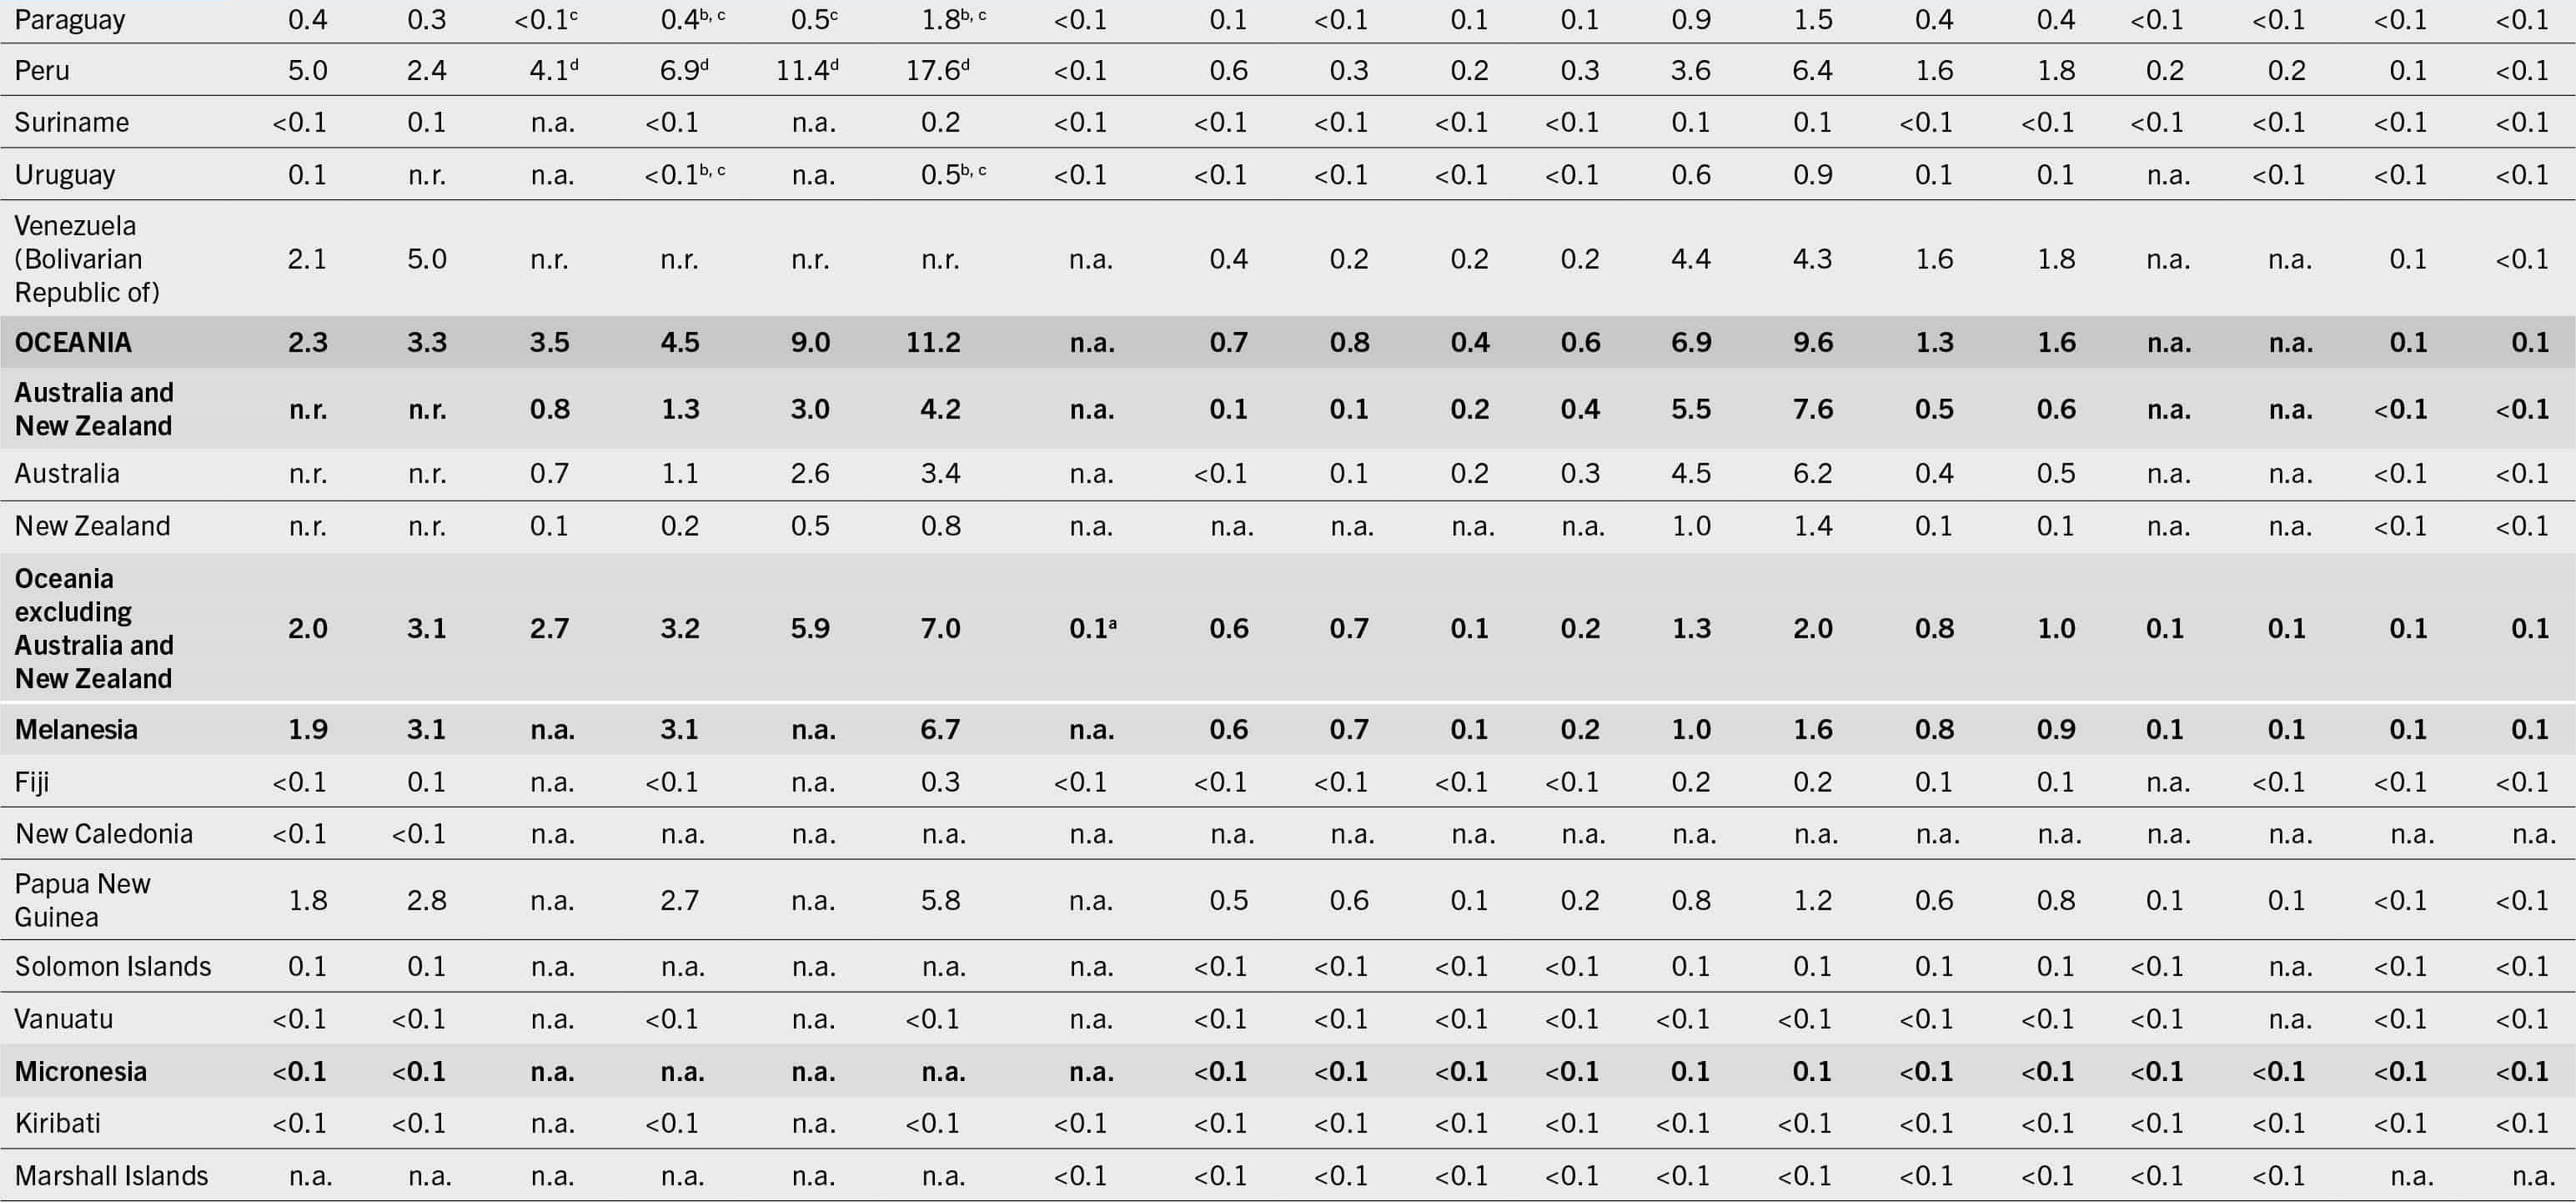
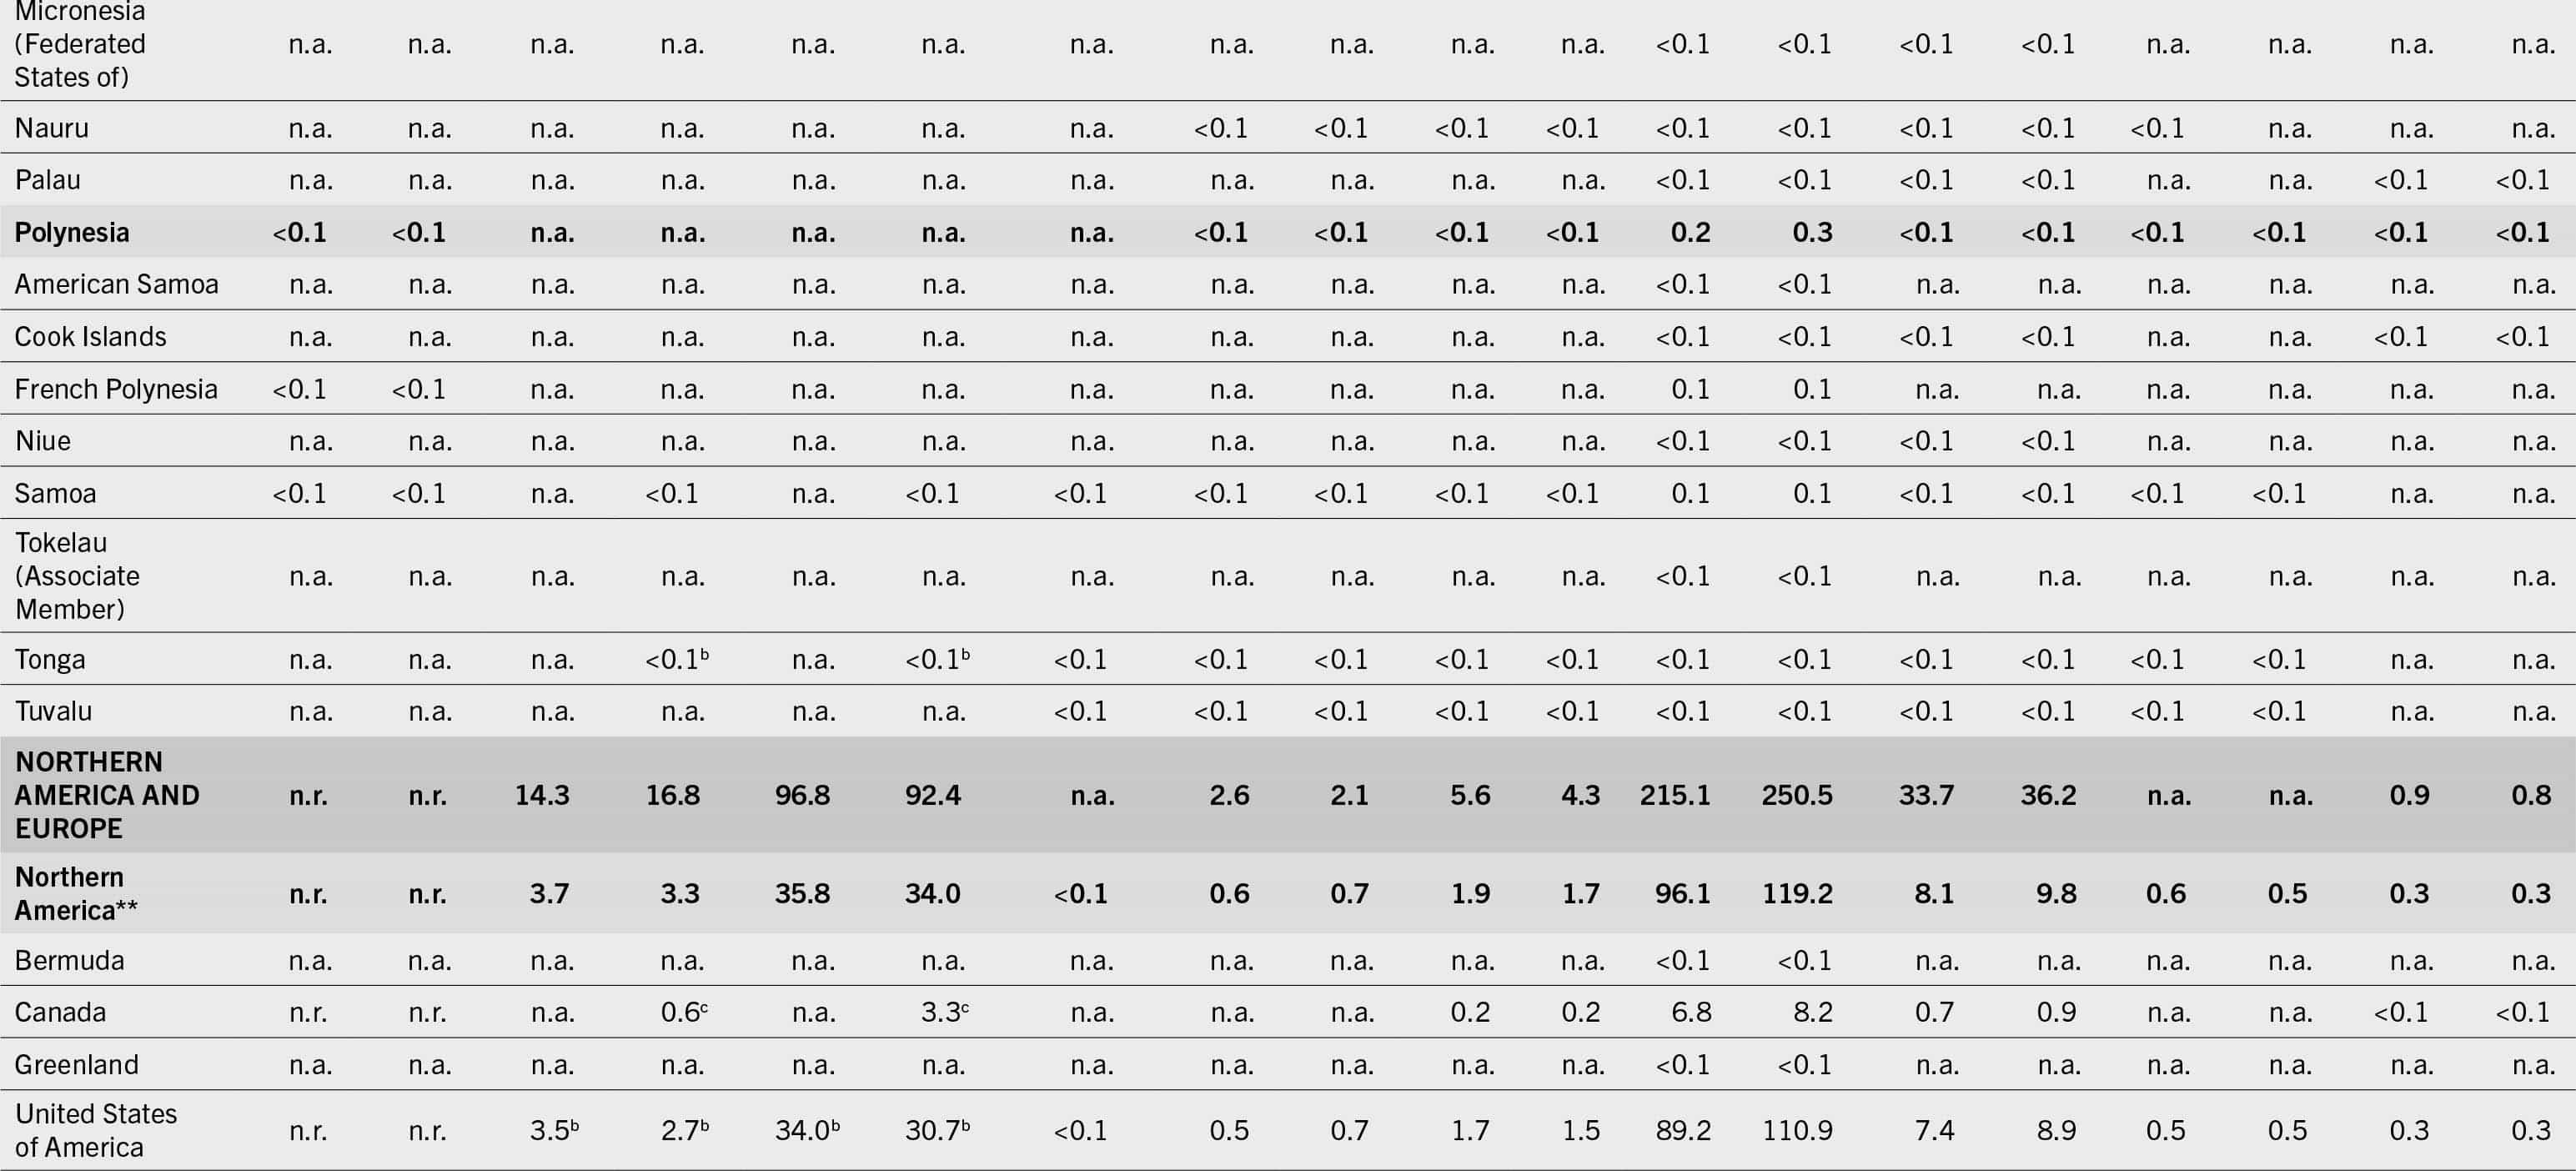
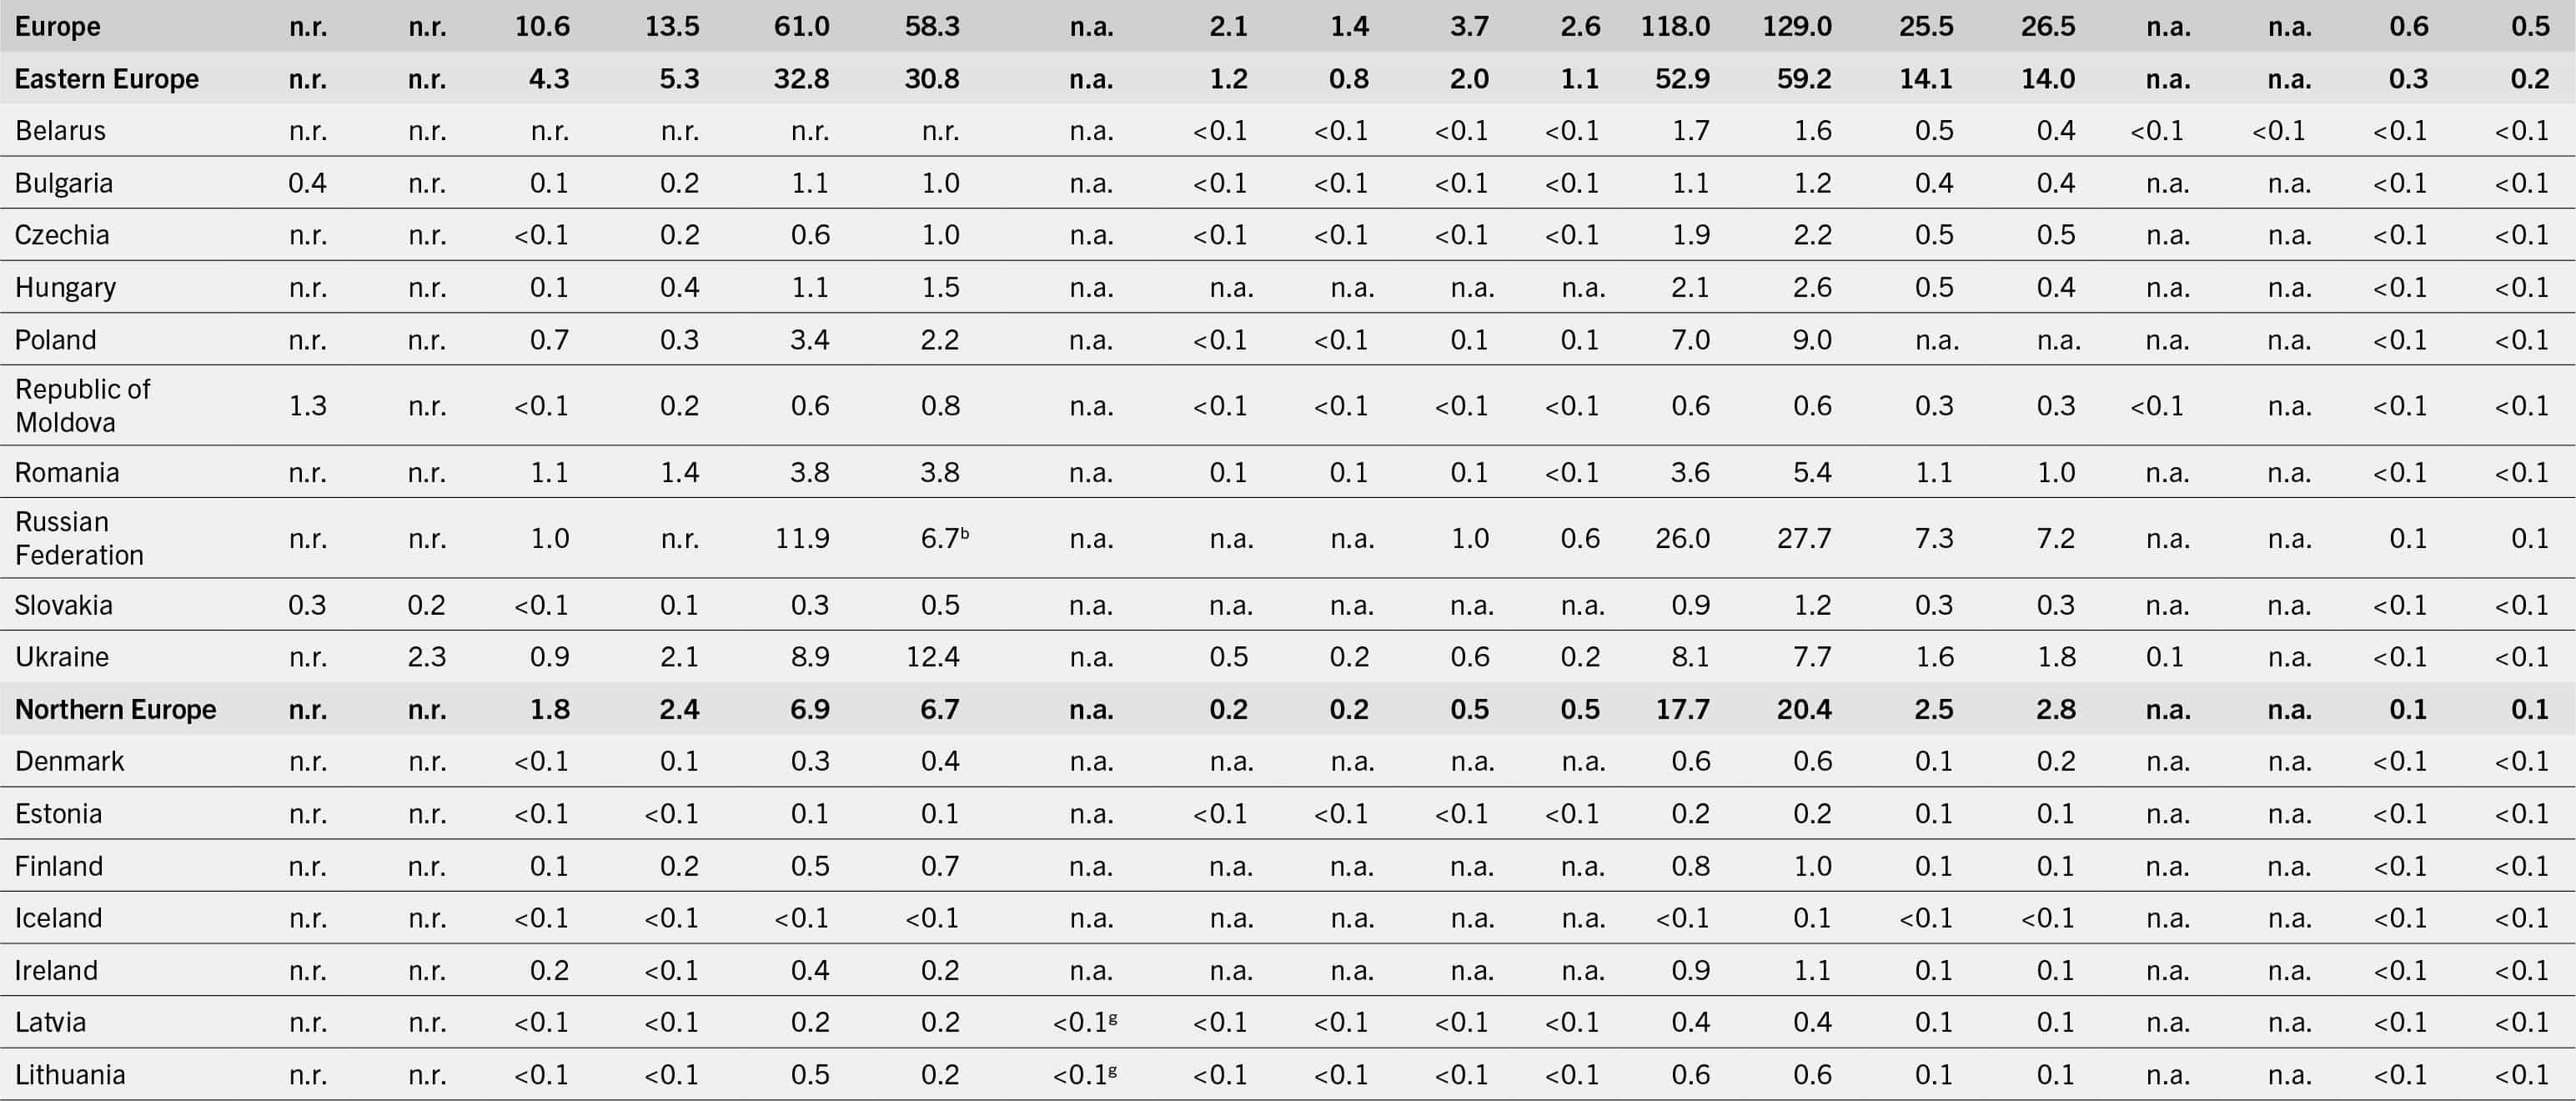
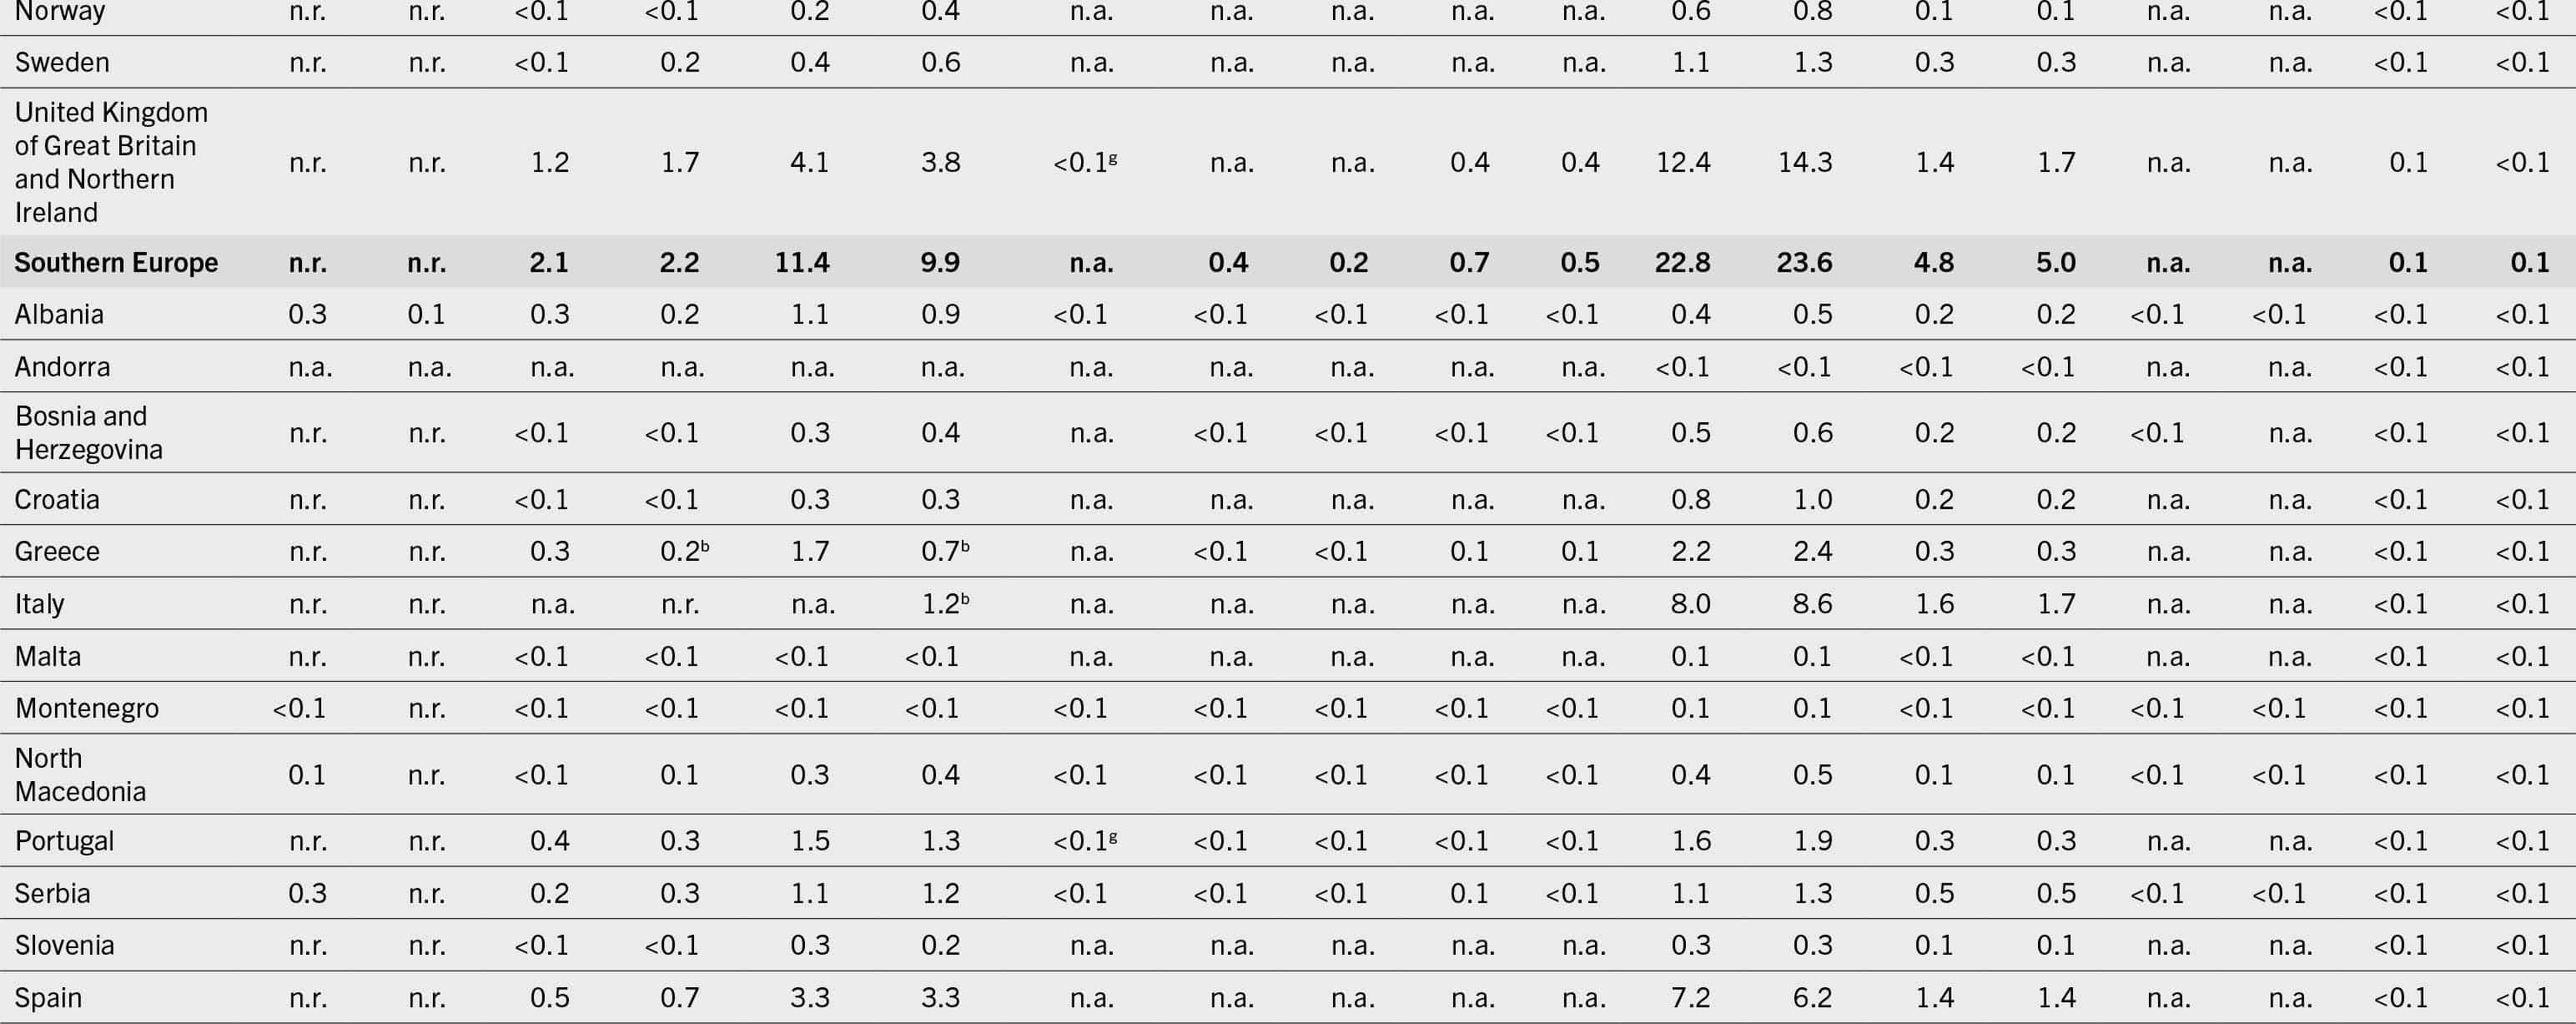
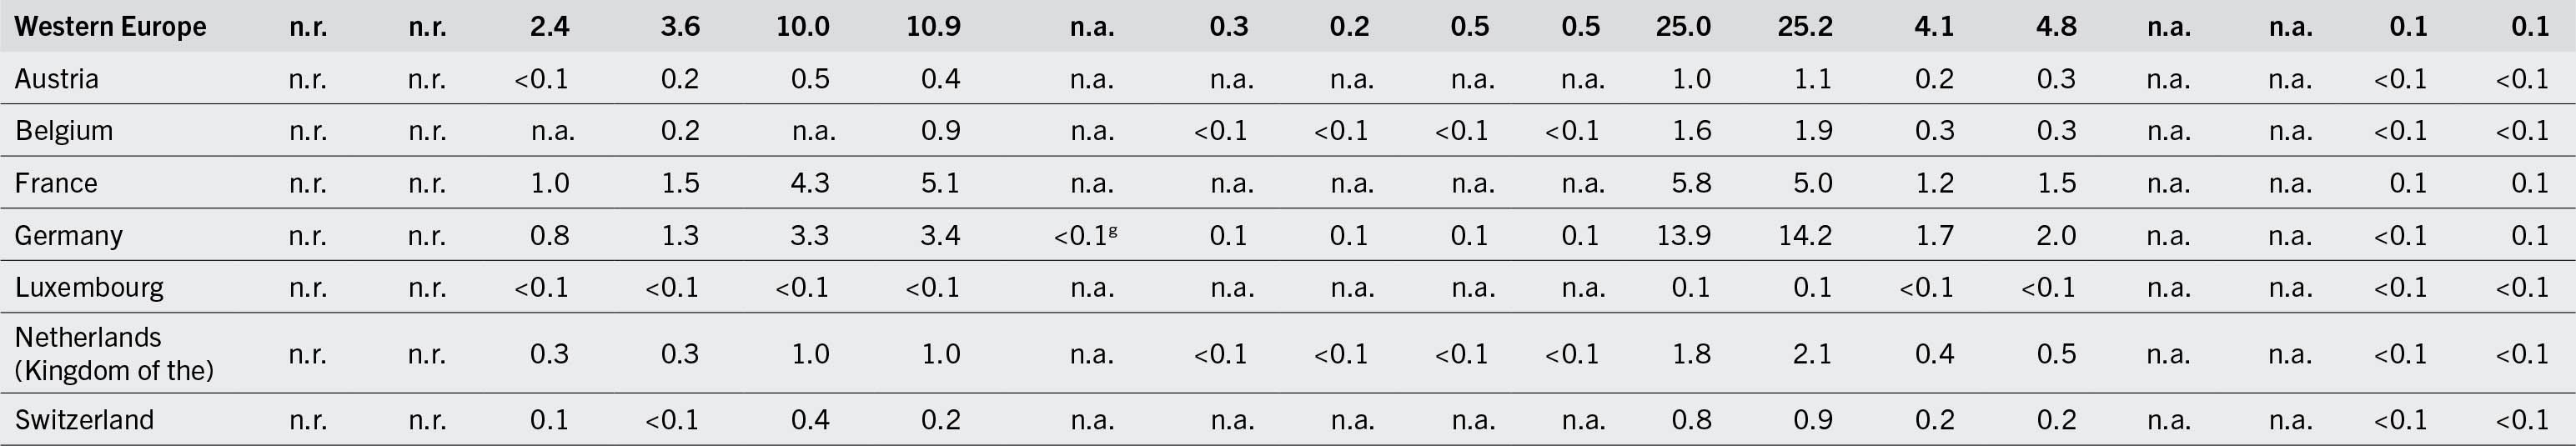
TABLE A1.2 Progress towards the Sustainable Development Goals and global nutrition targets: number of people who are affected by undernourishment, moderate or severe food insecurity and selected forms of malnutrition; number of infants exclusively breastfed and number of babies born with low birthweight
NOTES:
n.a. = data not available; n.r. = data not reported. In the case of the number of undernourished, this is because the prevalence is less than 2.5 percent; – = not applicable. <0.1 = less than 100 000 people.
1. Regional estimates are included when more than 50 percent of population is covered. To reduce the margin of error, estimates are presented as three-year averages.
2. FAO estimates of the number of people living in households where at least one adult has been found to be food insecure.
3. Country-level results are presented only for those countries for which estimates are based on official national data (see note b) or as provisional estimates, based on FAO data collected through the Gallup© World Poll for countries whose national relevant authorities expressed no objection to their publication. Note that consent to publication does not necessarily imply validation of the estimate by the national authorities involved and that the estimate is subject to revision as soon as suitable data from official national sources are available. Global, regional and subregional aggregates are based on data collected in approximately 150 countries.
4. The estimates referring to the middle of the projected ranges for the years 2020 to 2022 were used to calculate the three-year averages.
5. For regional estimates, values correspond to the model predicted estimates for 2022. For countries, the latest data available from 2016 to 2023 are used.
6. Regional estimates are included when more than 50 percent of population is covered. For countries, the latest data available from 2005 to 2012 are used.
7. Regional estimates are included when more than 50 percent of population is covered. For countries, the latest data available from 2016 to 2022 are used.
* Wasting under five years of age; regional aggregates exclude Japan.
** The Northern America wasting estimates are derived applying mixed-effect models with subregions as fixed effects; data were available only for the United States of America, preventing the estimation of standard errors (and confidence intervals). Further details on the methodology are described in De Onis, M., Blössner, M., Borghi, E., Frongillo, E.A. & Morris, R. 2004. Estimates of global prevalence of childhood underweight in 1990 and 2015. Journal of the American Medical Association, 291(21): 2600–2606. https://doi.org/10.1001/jama.291.21.2600. Model selection is based on best fit.
a. Consecutive low population coverage; interpret with caution.
b. Based on official national data.
c. For years when official national data are not available, the estimates are integrated with FAO data. See Annex 1B for further details.
d. Results based on data collected by FAO through the Gallup© World Poll (see Annex 1B for methodology) are provisional and will be revised soon, as the National Institute of Statistics and Informatics (INEI) has made great progress in adapting and incorporating the Food Insecurity Experience Scale module in the National Household Survey (Encuesta Nacional de Hogares – ENAHO).
e. Most recent input data are from before 2000, interpret with caution.
f. The UNICEF–WHO low birthweight estimates are derived through standard methodology applied to all countries to ensure comparability and are not the official statistics of the Government of India. India’s most recent national official low birthweight prevalence is 18.2 percent from the 2019–2021 National Family Health Survey–5 (NFHS-5), which is used as the basis of the UNICEF–WHO global estimation model to support cross-country comparability.
g. This estimate has been adjusted because the original estimate did not cover the full age range or the data source was only representative of rural areas.
h. The estimate for Palestine reflects the situation before the conflict erupted at the end of 2023.
SOURCES: Data for undernourishment and food insecurity are from FAO. 2024. FAOSTAT: Suite of Food Security Indicators. [Accessed on 24 July 2024]. https://www.fao.org/faostat/en/#data/FS. Licence: CC-BY-4.0; data for stunting, wasting and overweight are based on UNICEF, WHO & World Bank. 2023. Levels and trends in child malnutrition. UNICEF / WHO / World Bank Group Joint Child Malnutrition Estimates – Key findings of the 2023 edition. New York, USA, UNICEF, Geneva, Switzerland, WHO and Washington, DC, World Bank. https://data.unicef.org/resources/jme-report-2023, http://www.who.int/teams/nutrition-and-food-safety/monitoring-nutritional-status-and-food-safety-and-events/joint-child-malnutrition-estimates, https://datatopics.worldbank.org/child-malnutrition; data for adult obesity are based on WHO. 2024. Global Health Observatory (GHO) data repository: Prevalence of obesity among adults, BMI ≥ 30, age-standardized. Estimates by country. [Accessed on 24 July 2024]. https://www.who.int/data/gho/data/indicators/indicator-details/GHO/prevalence-of-obesity-among-adults-bmi-=-30-(age-standardized-estimate)-(-). Licence: CC-BY-4.0; data for anaemia are based on WHO. 2021. WHO global anaemia estimates, 2021 edition. In: WHO. [Cited 24 July 2024]. https://www.who.int/data/gho/data/themes/topics/anaemia_in_women_and_children; data for exclusive breastfeeding are based on UNICEF. 2024. Infant and young child feeding. In: UNICEF. [Cited 24 July 2024]. https://data.unicef.org/topic/nutrition/infant-and-young-child-feeding; data for low birthweight are from UNICEF & WHO. 2023. Low birthweight. In: UNICEF. [Cited 24 July 2024]. https://data.unicef.org/topic/nutrition/low-birthweight; UNICEF & WHO. 2023. Joint low birthweight estimates. In: WHO. [Cited 24 July 2024]. https://www.who.int/teams/nutrition-and-food-safety/monitoring-nutritional-status-and-food-safety-and-events/joint-low-birthweight-estimates
TABLE A1.3 Prevalence of moderate or severe food insecurity, and severe food insecurity only, by degree of urbanization in 2023
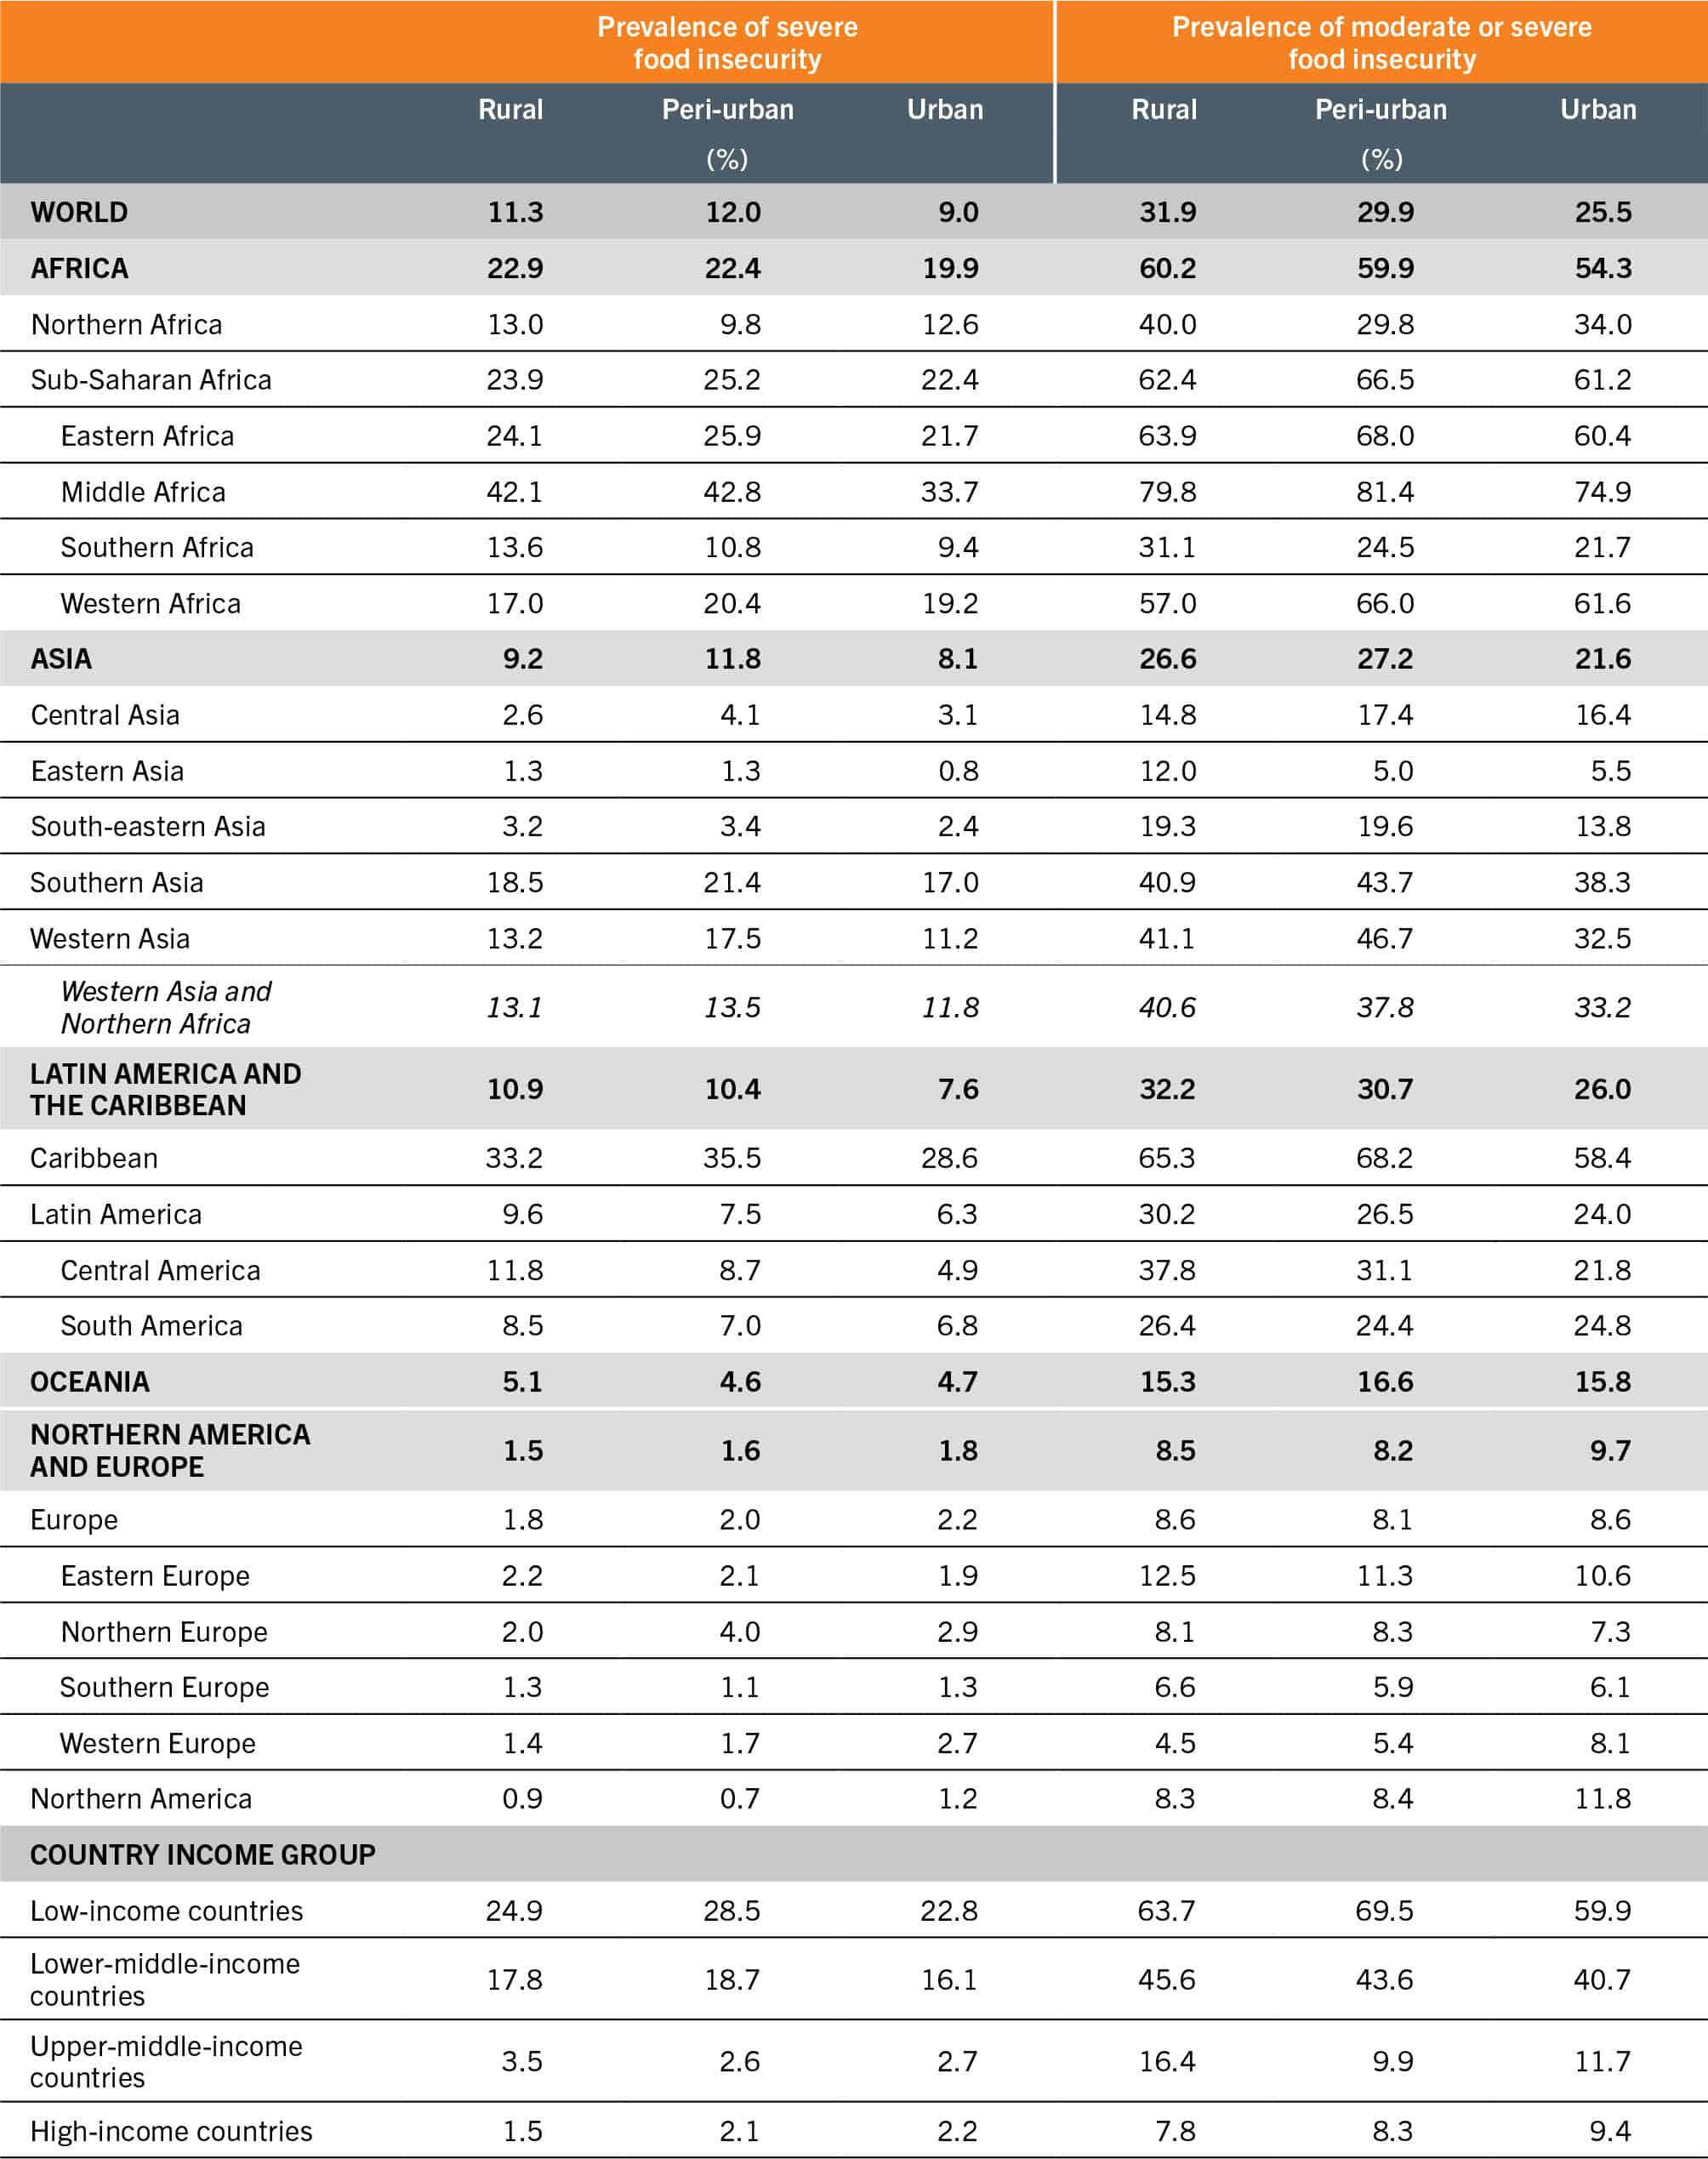
SOURCE: FAO. 2024. FAOSTAT: Suite of Food Security Indicators. [Accessed on 24 July 2024]. www.fao.org/faostat/en/#data/FS. Licence: CC-BY-4.0.
TABLE A1.4 Prevalence of moderate or severe food insecurity, and severe food insecurity only, among adult men and women in 2023
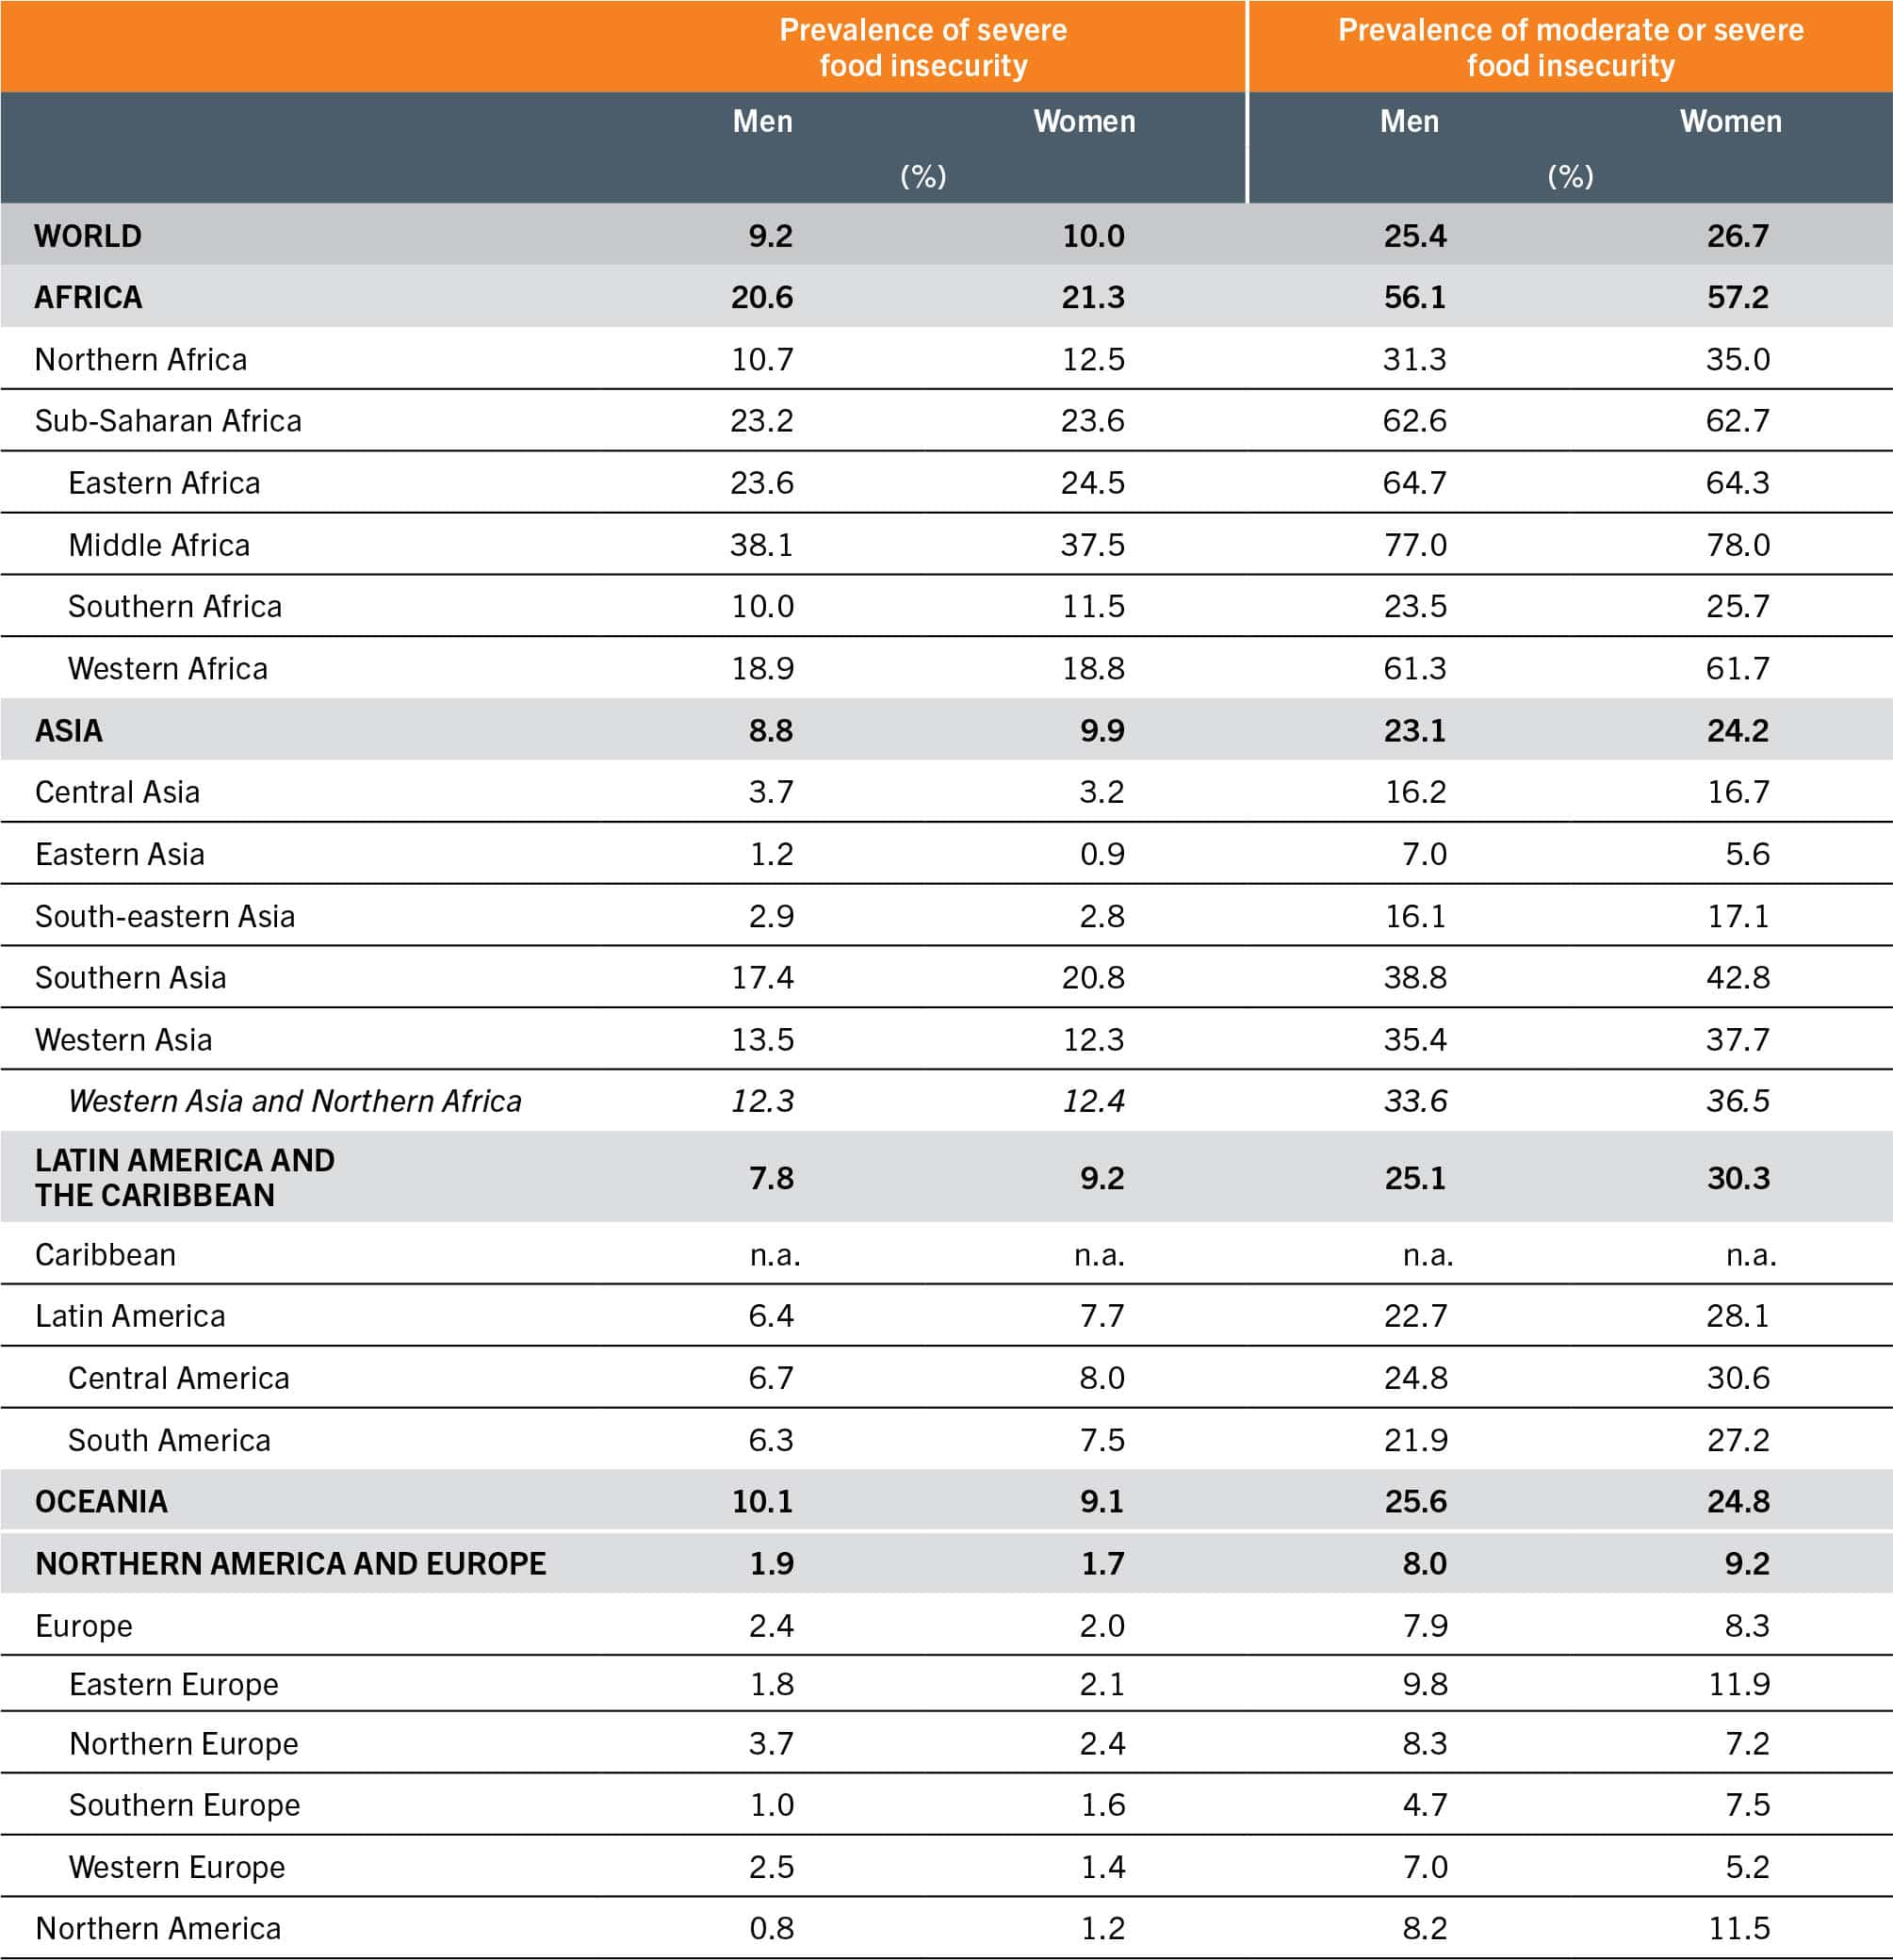
SOURCE: FAO. 2024. FAOSTAT: Suite of Food Security Indicators. [Accessed on 24 July 2024]. www.fao.org/faostat/en/#data/FS. Licence: CC-BY-4.0.
TABLE A1.5 The cost of a healthy diet by region, subregion, country and country income group, 2017–2022
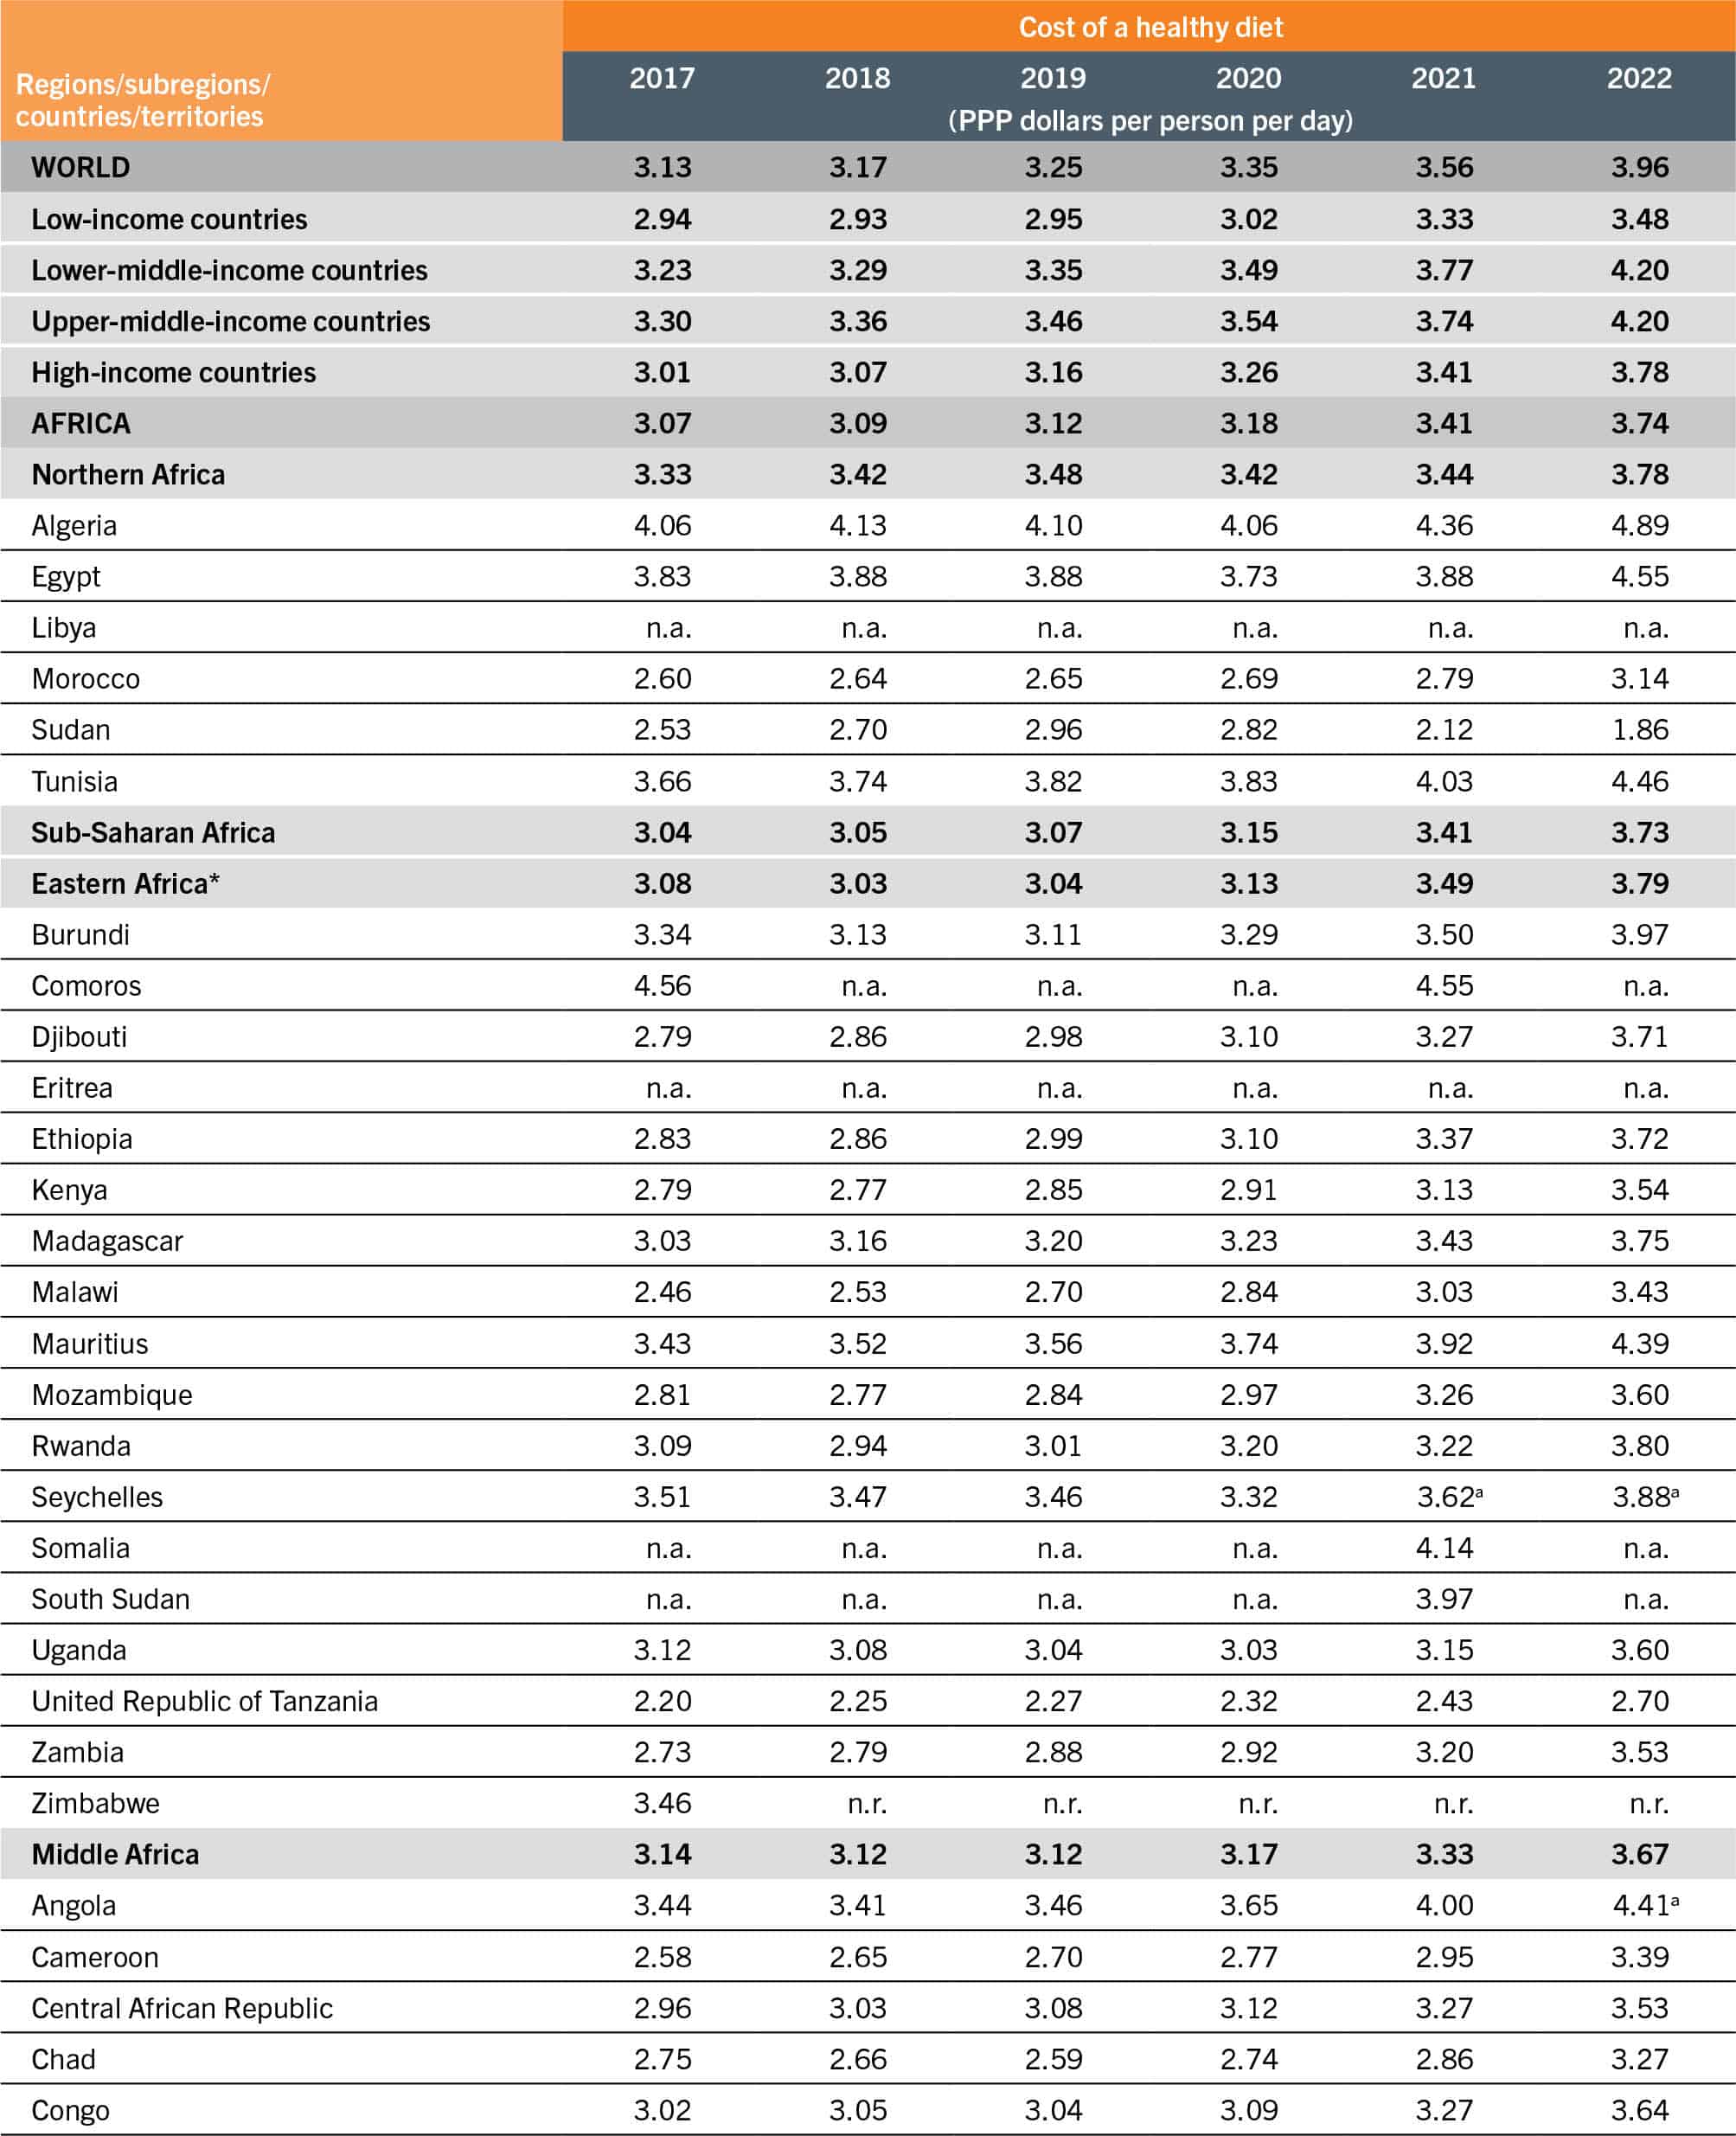
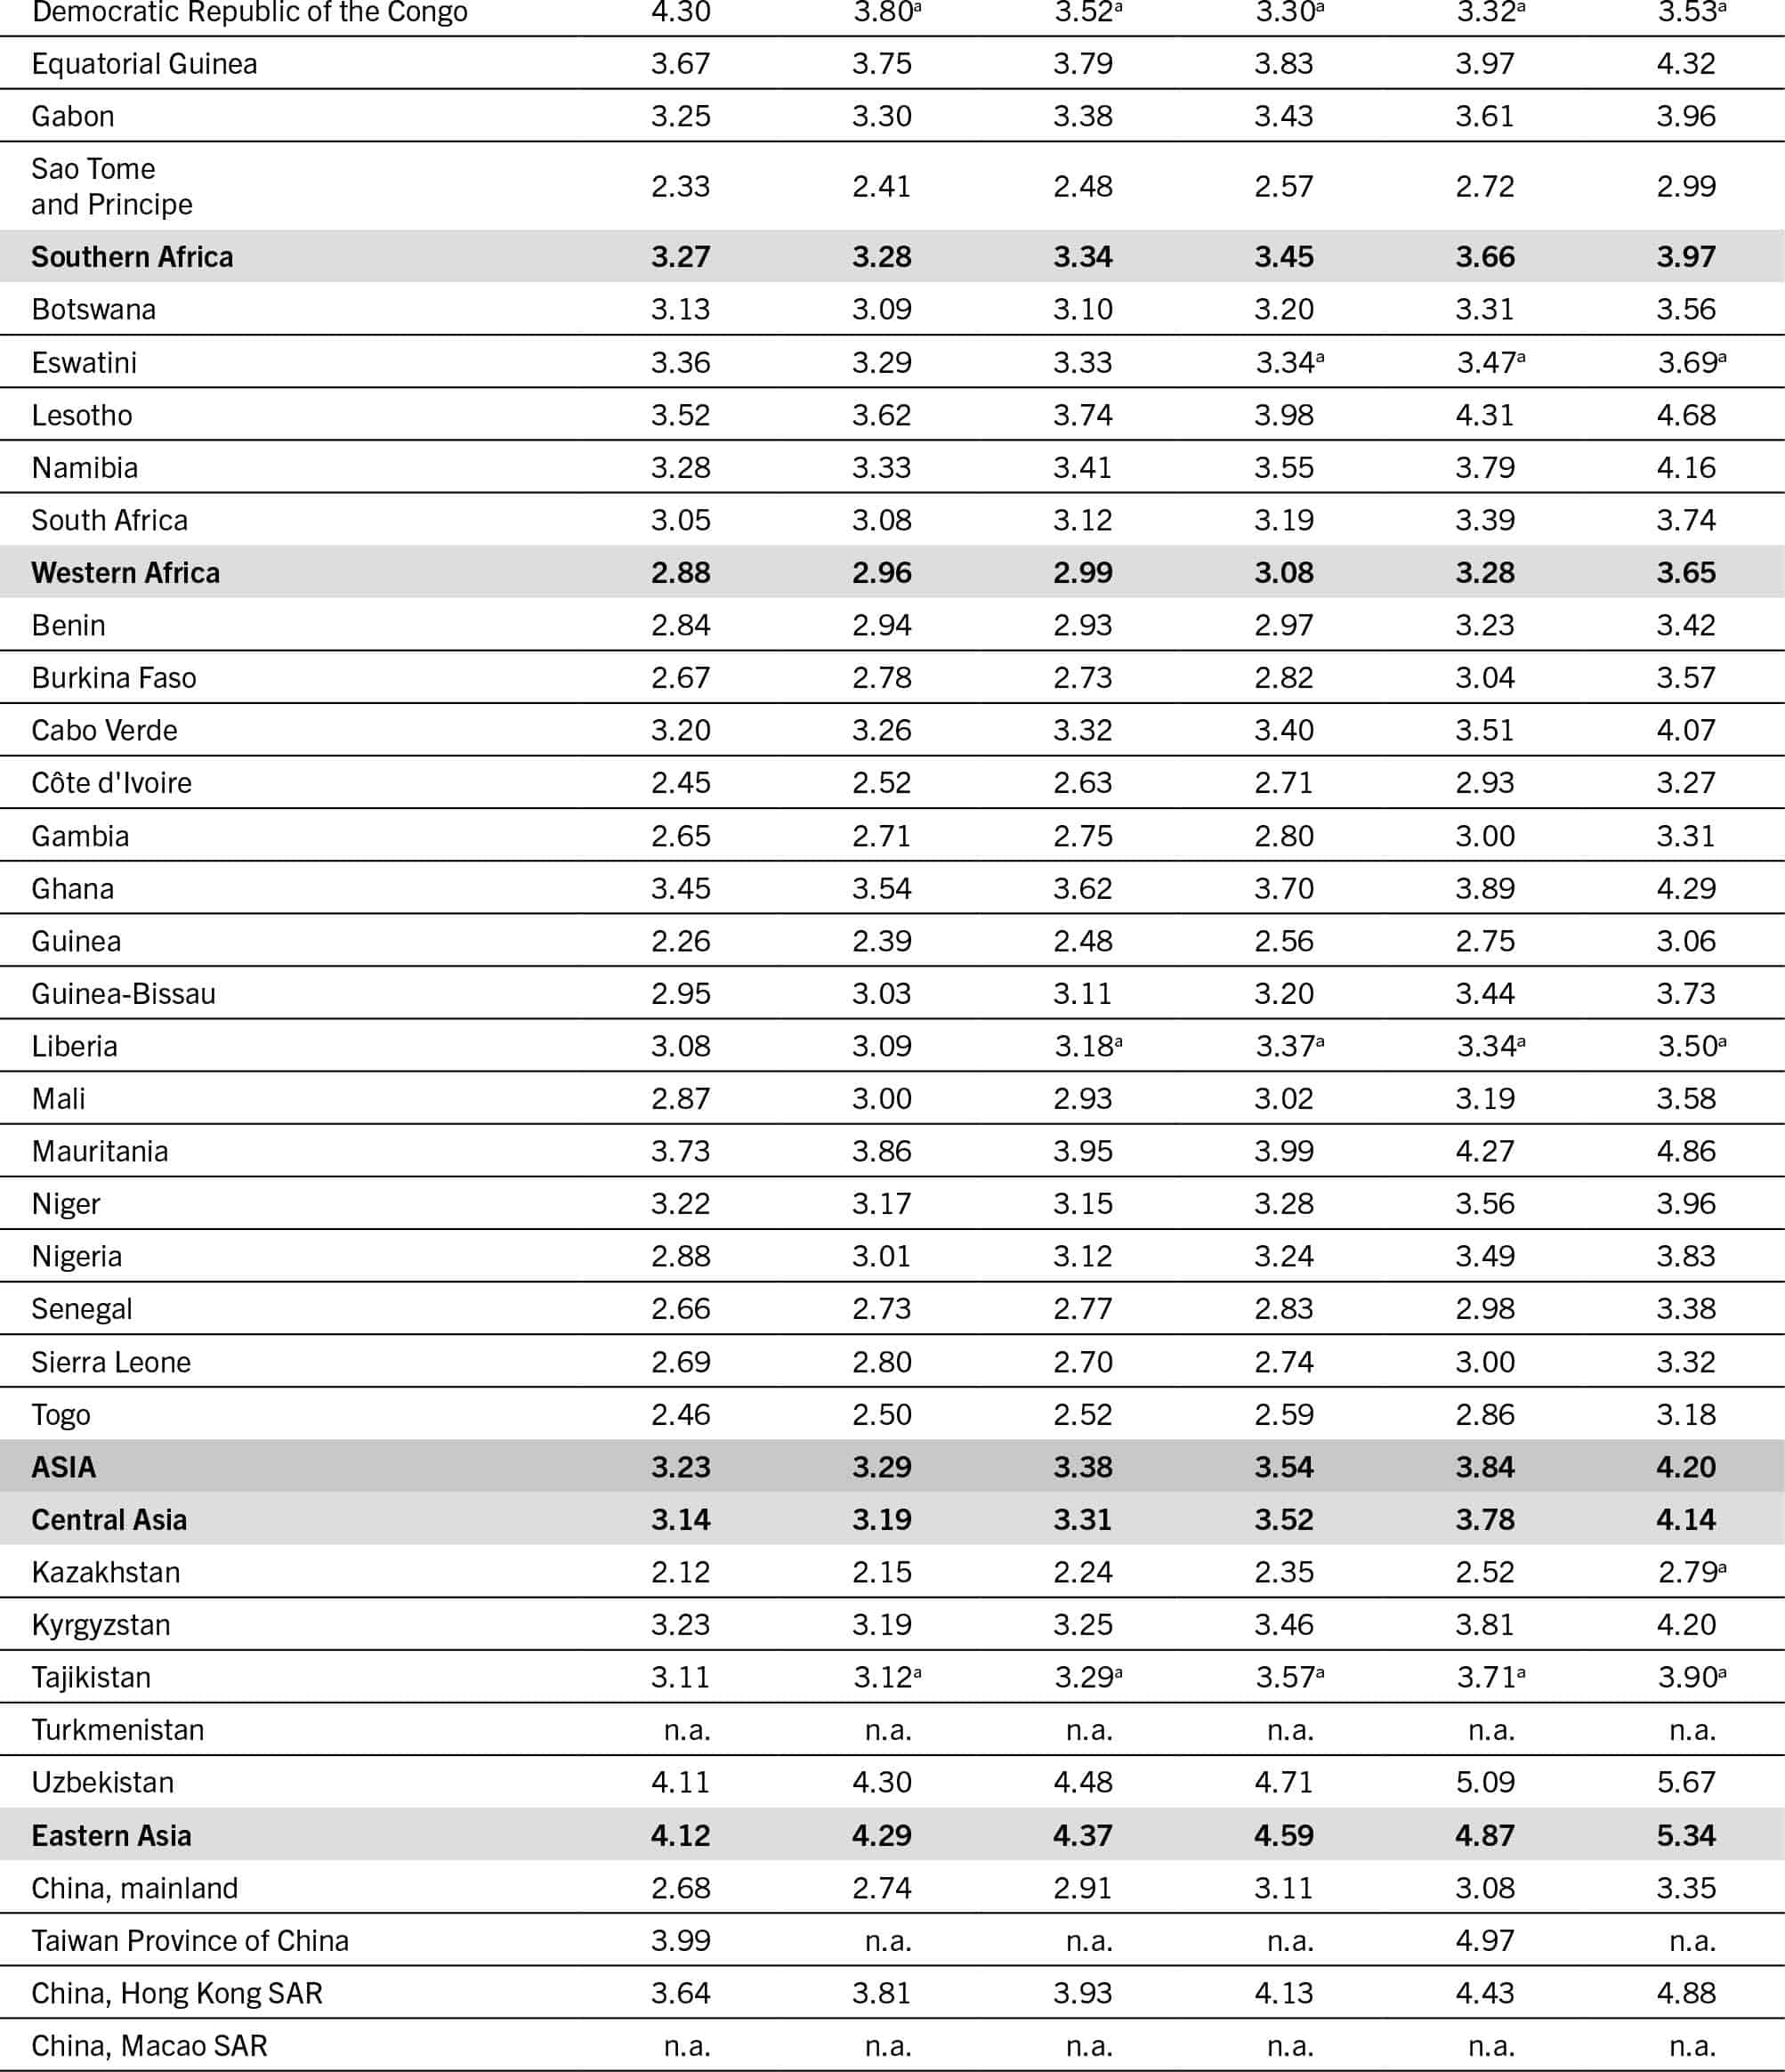
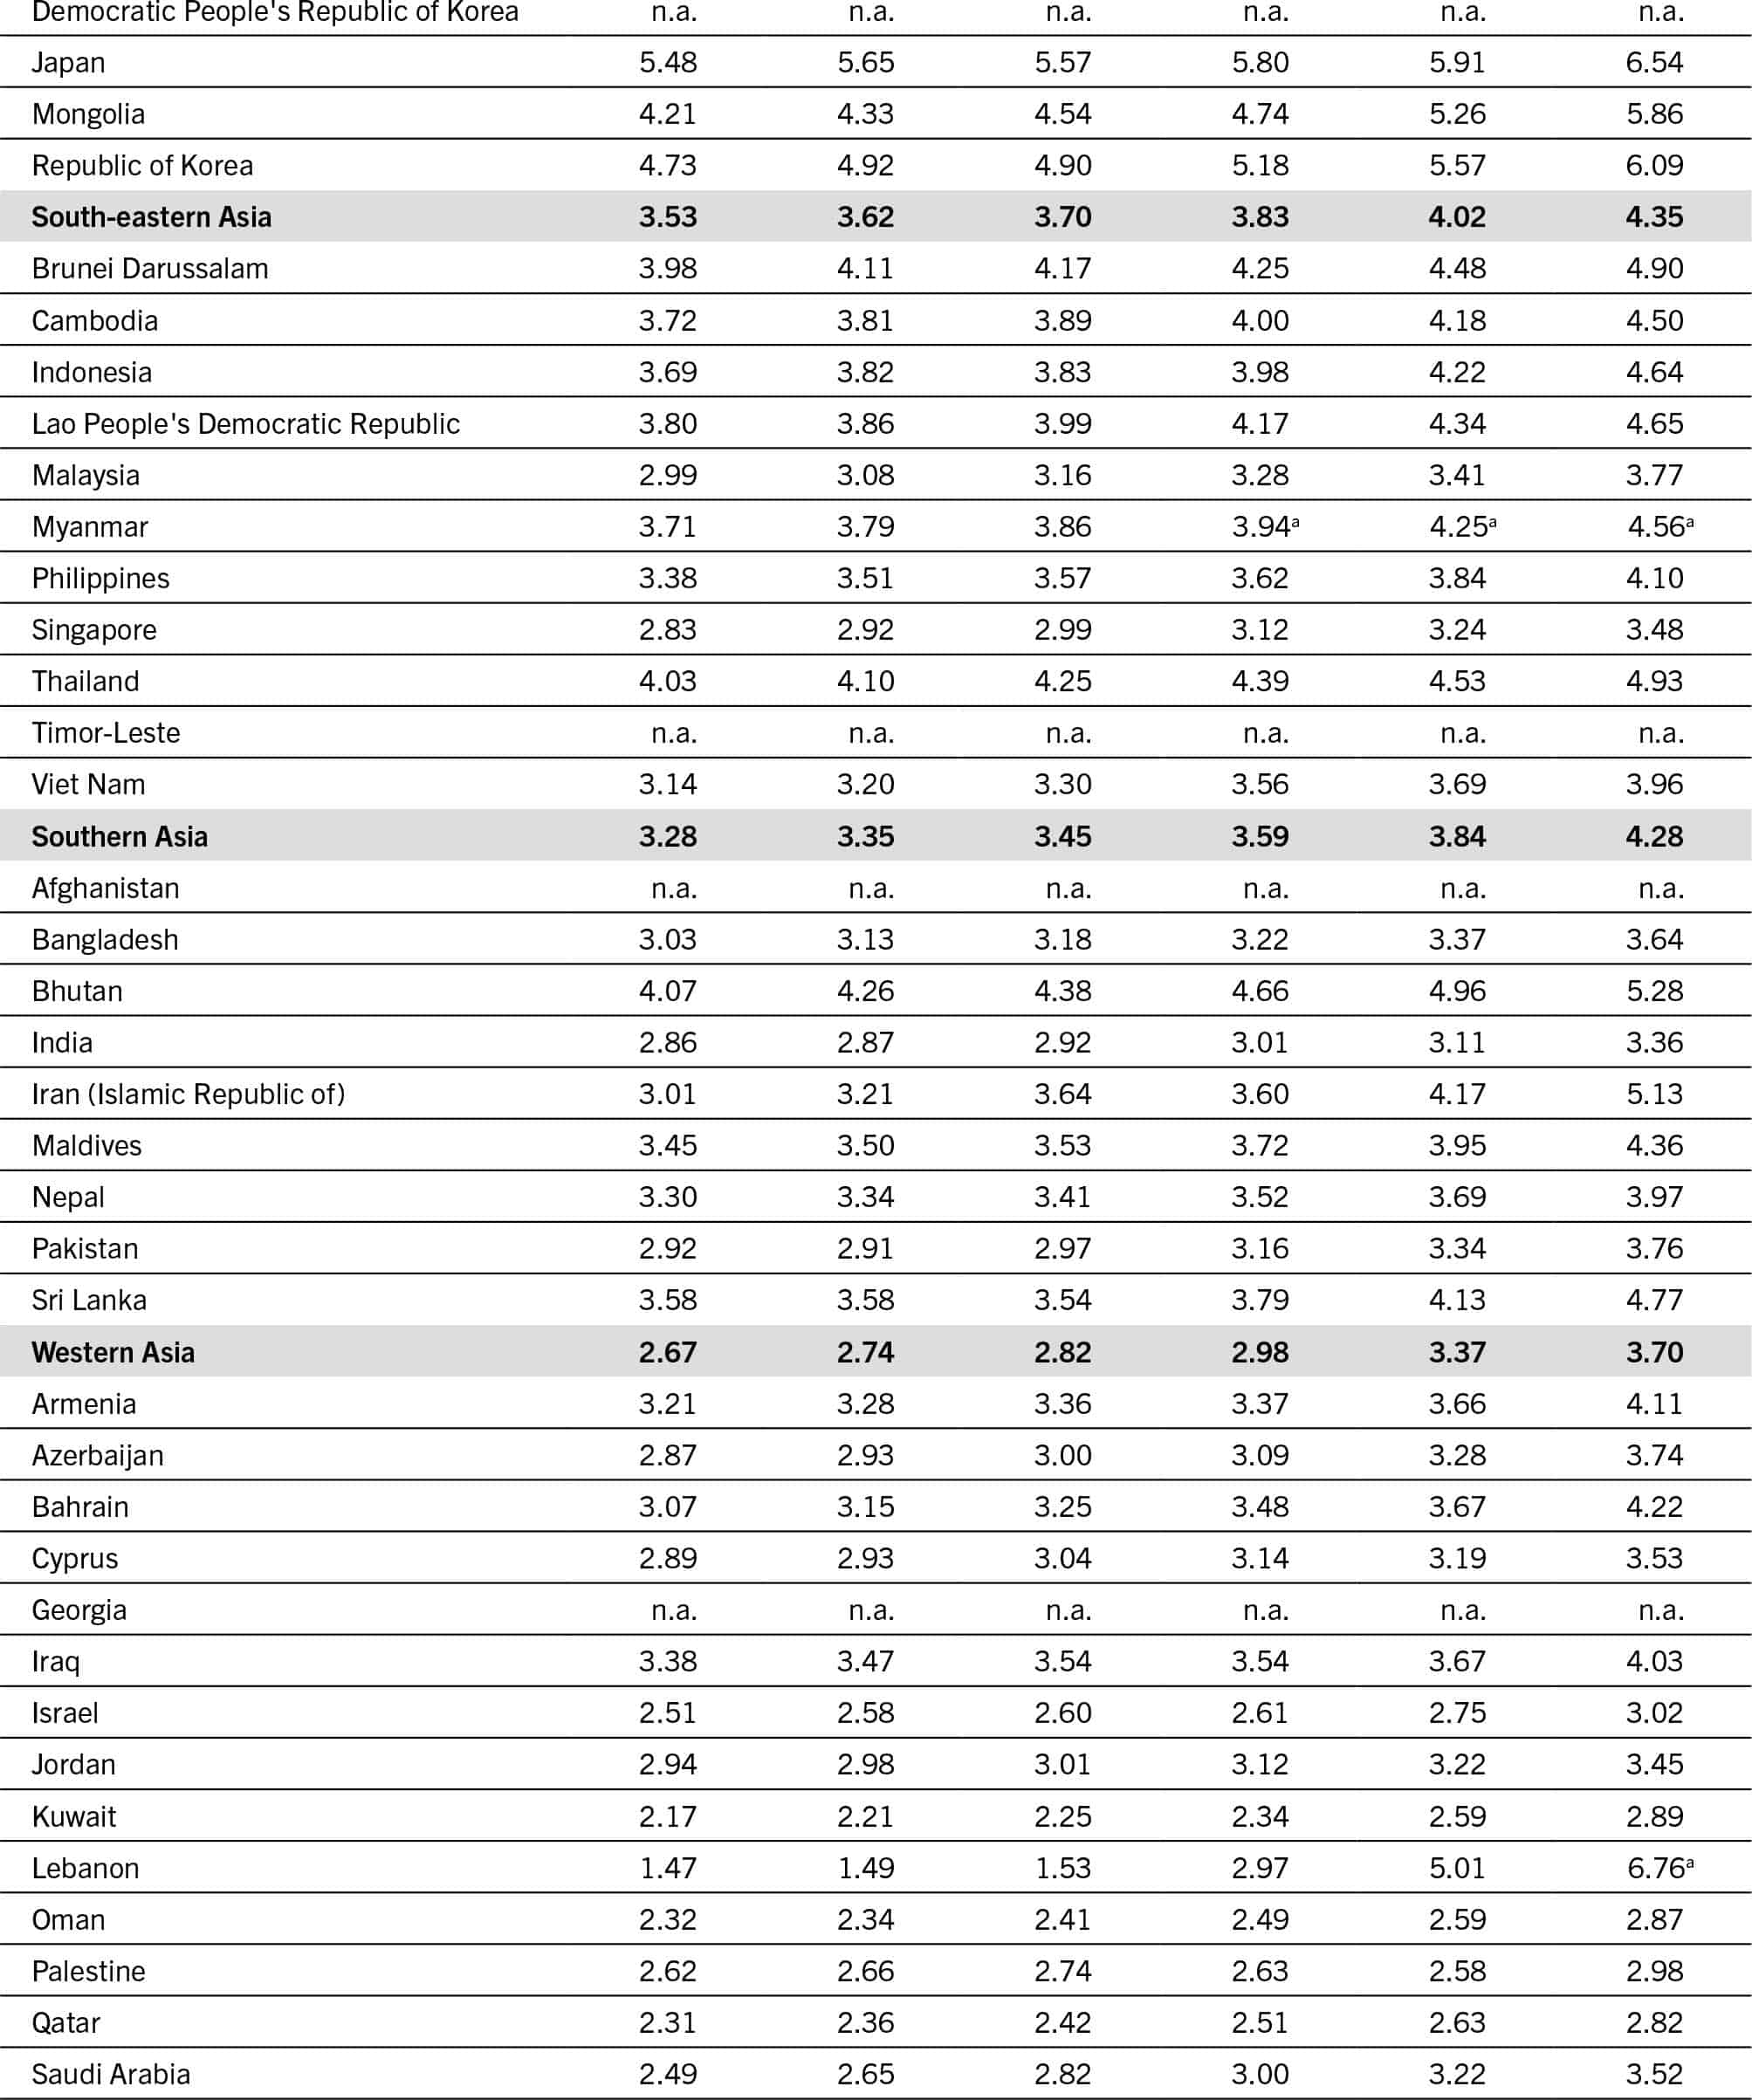
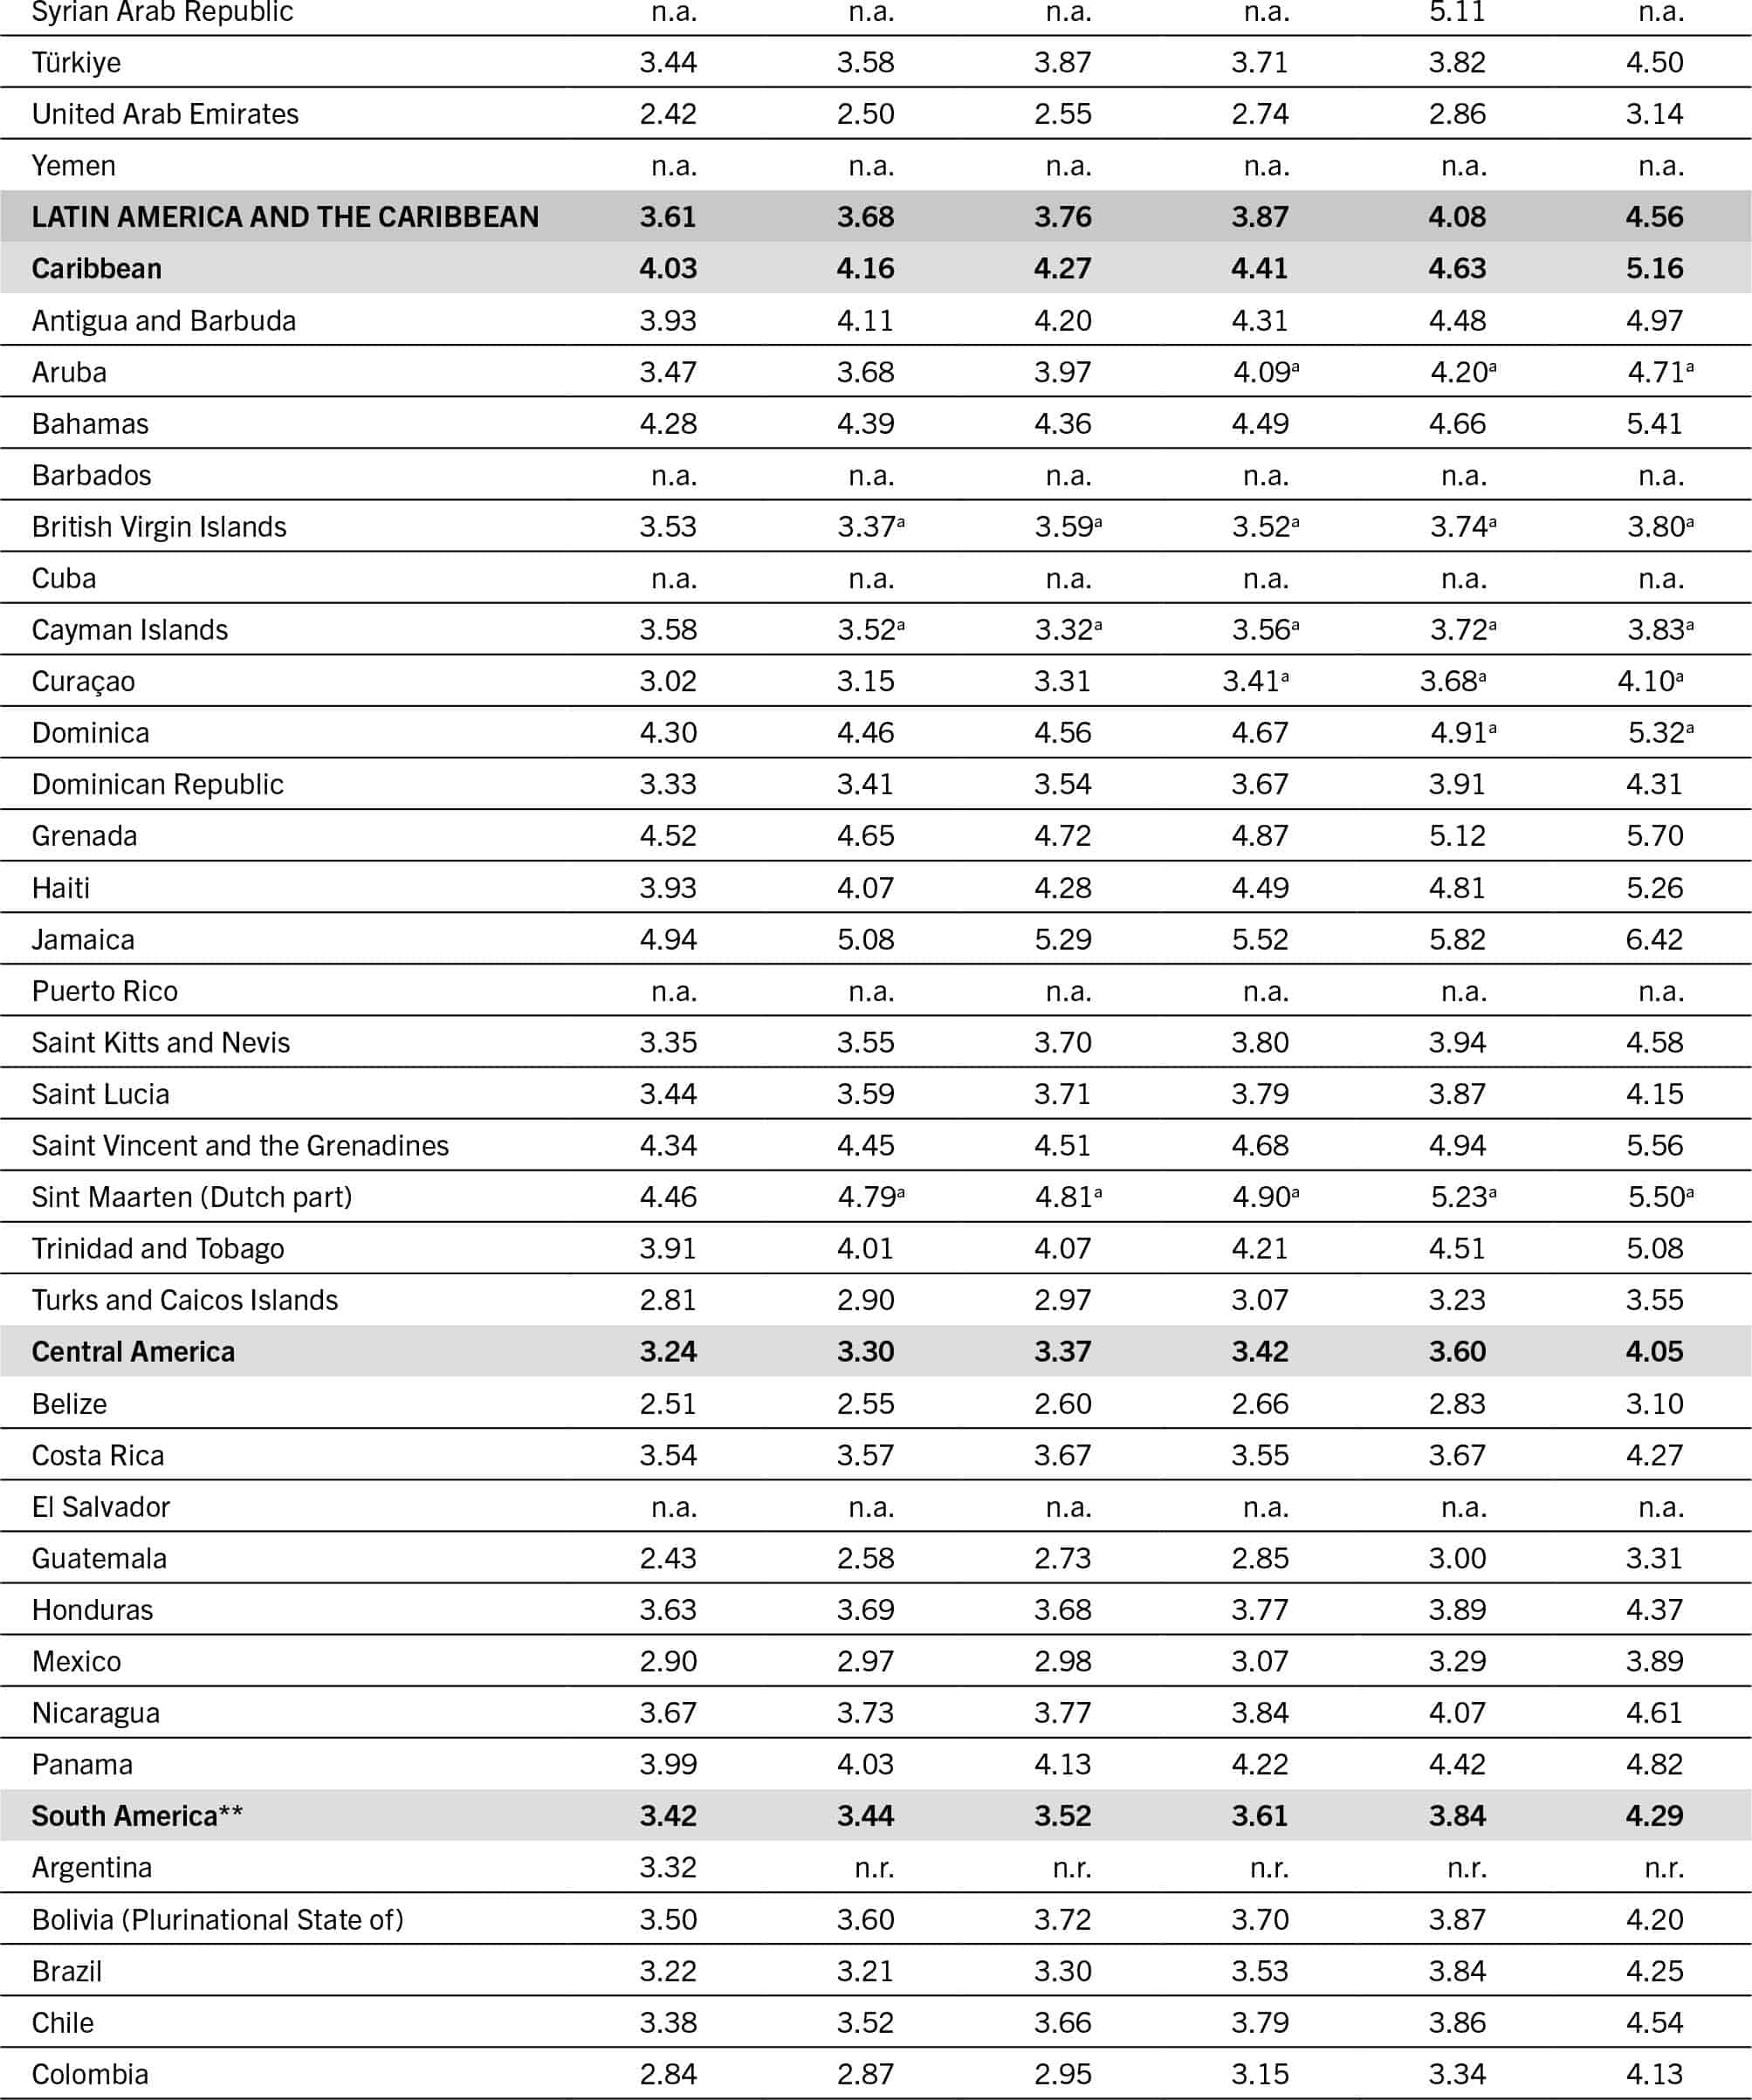
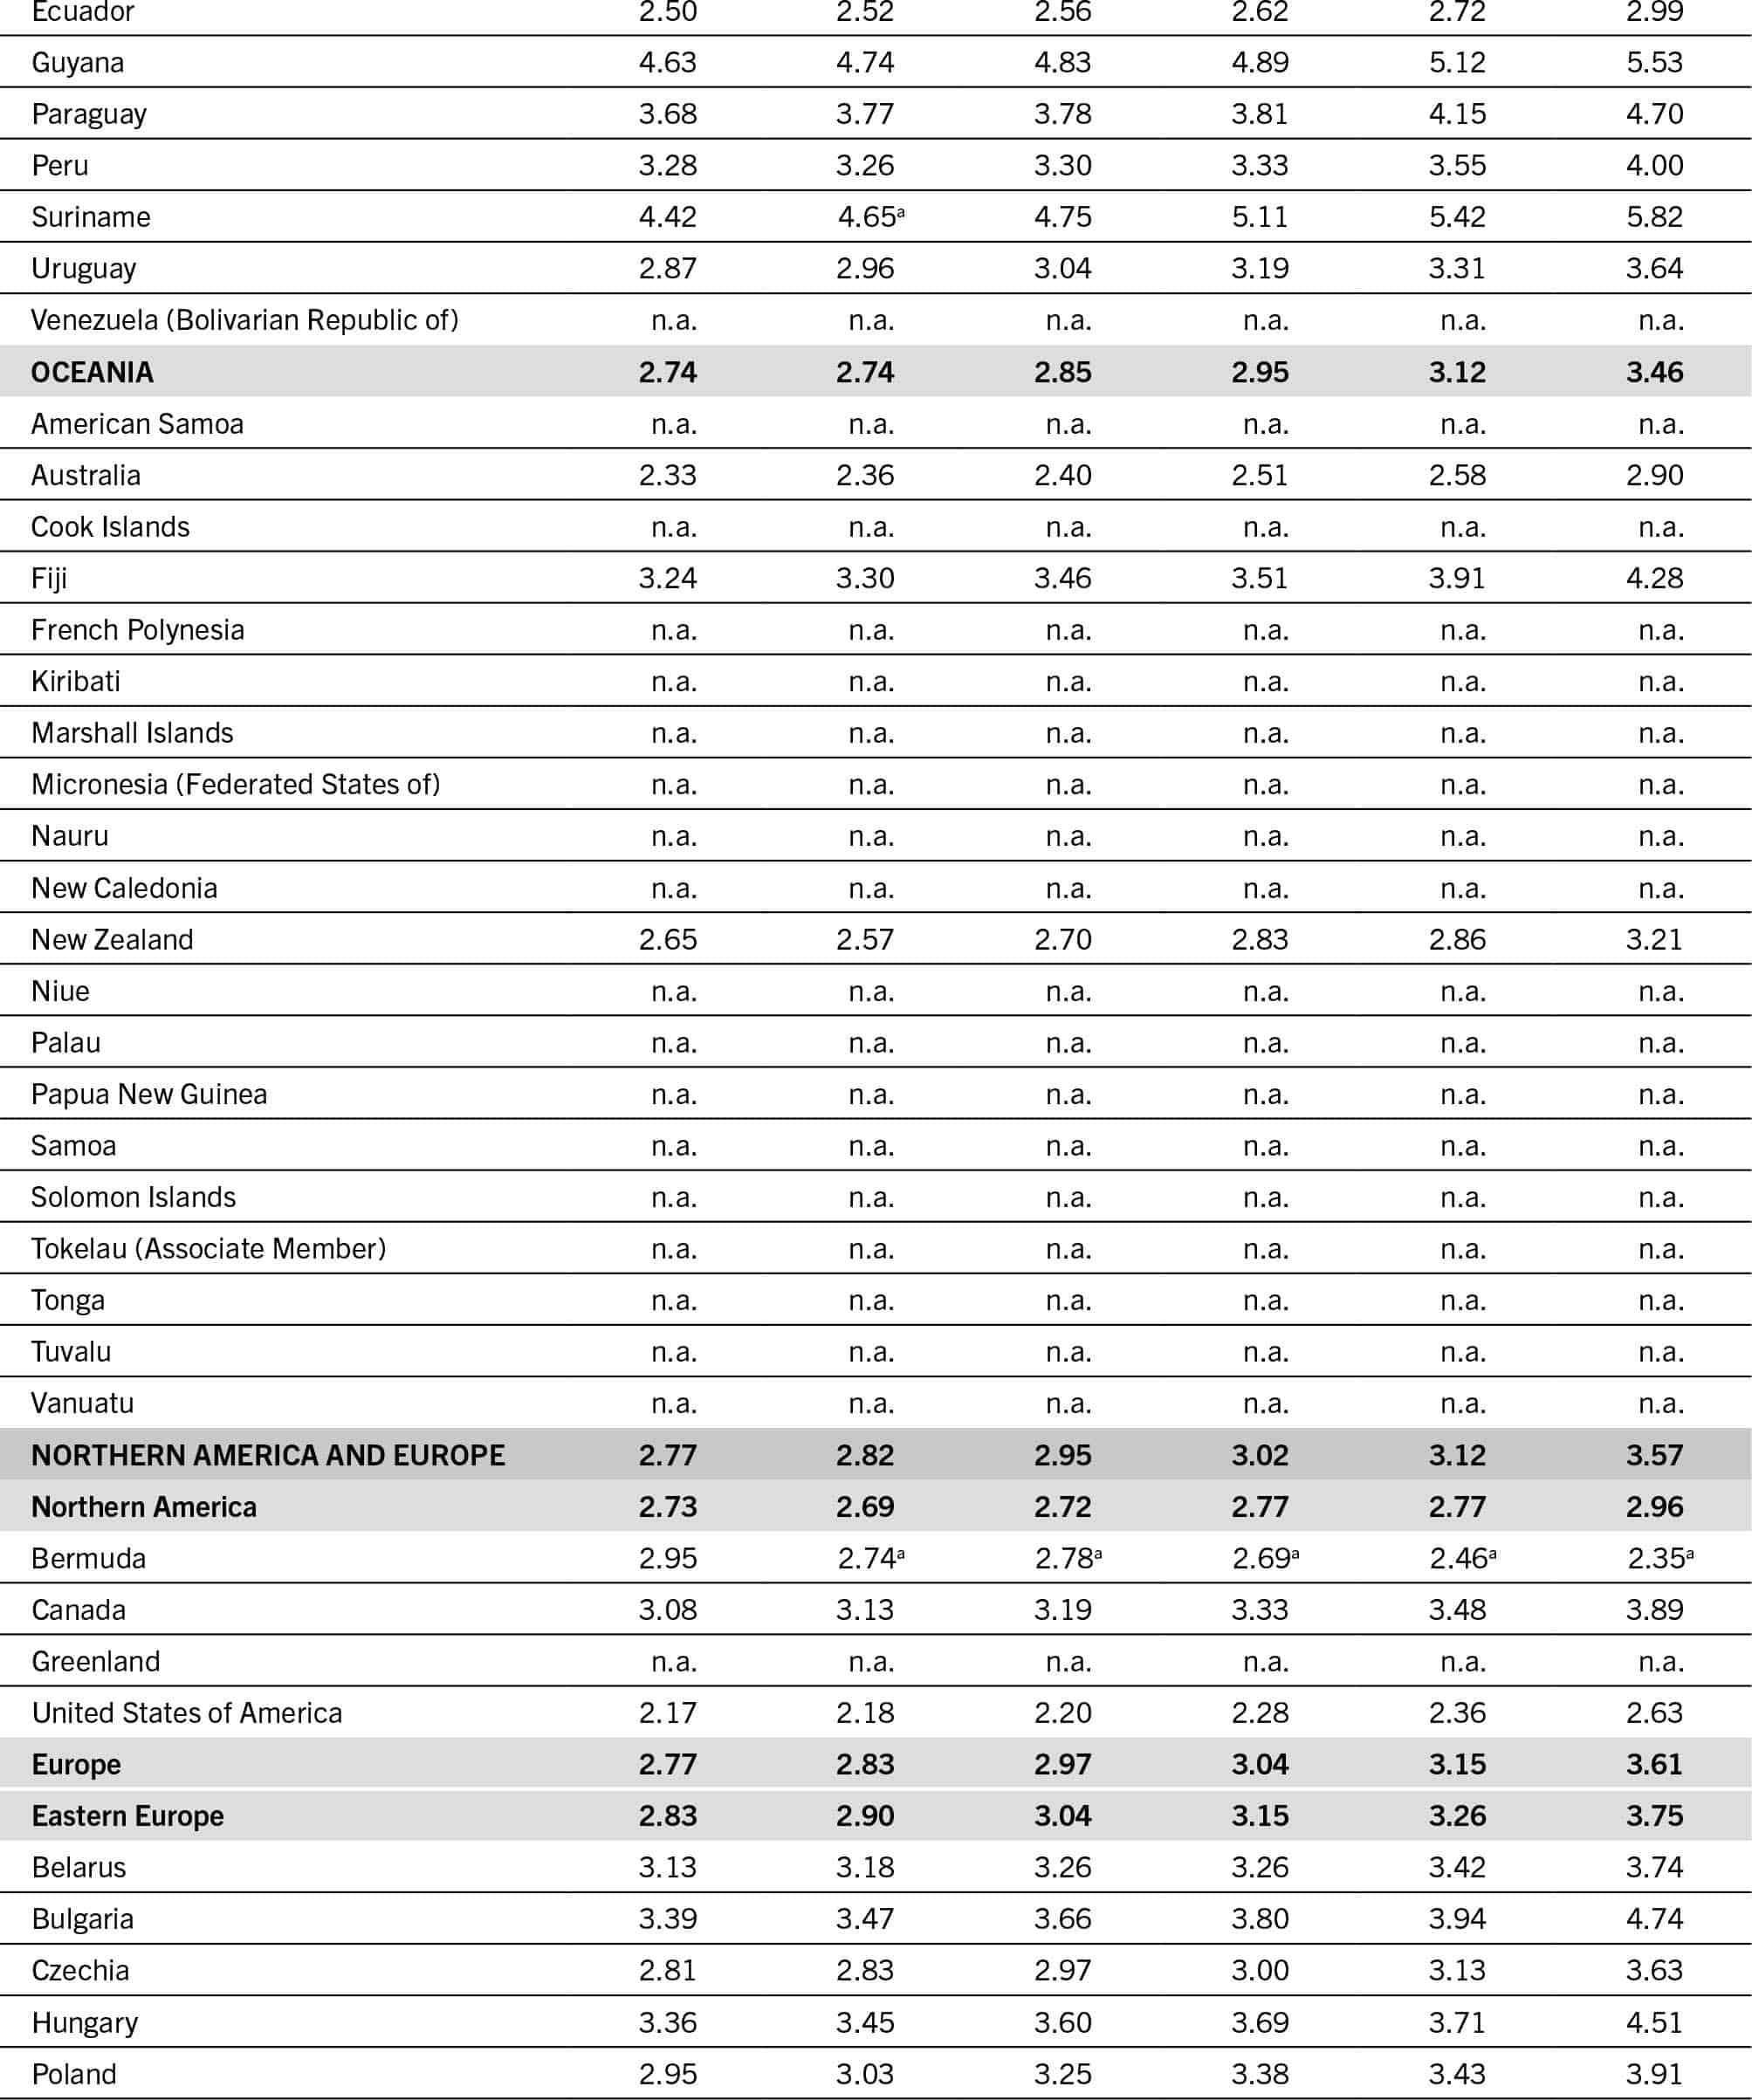
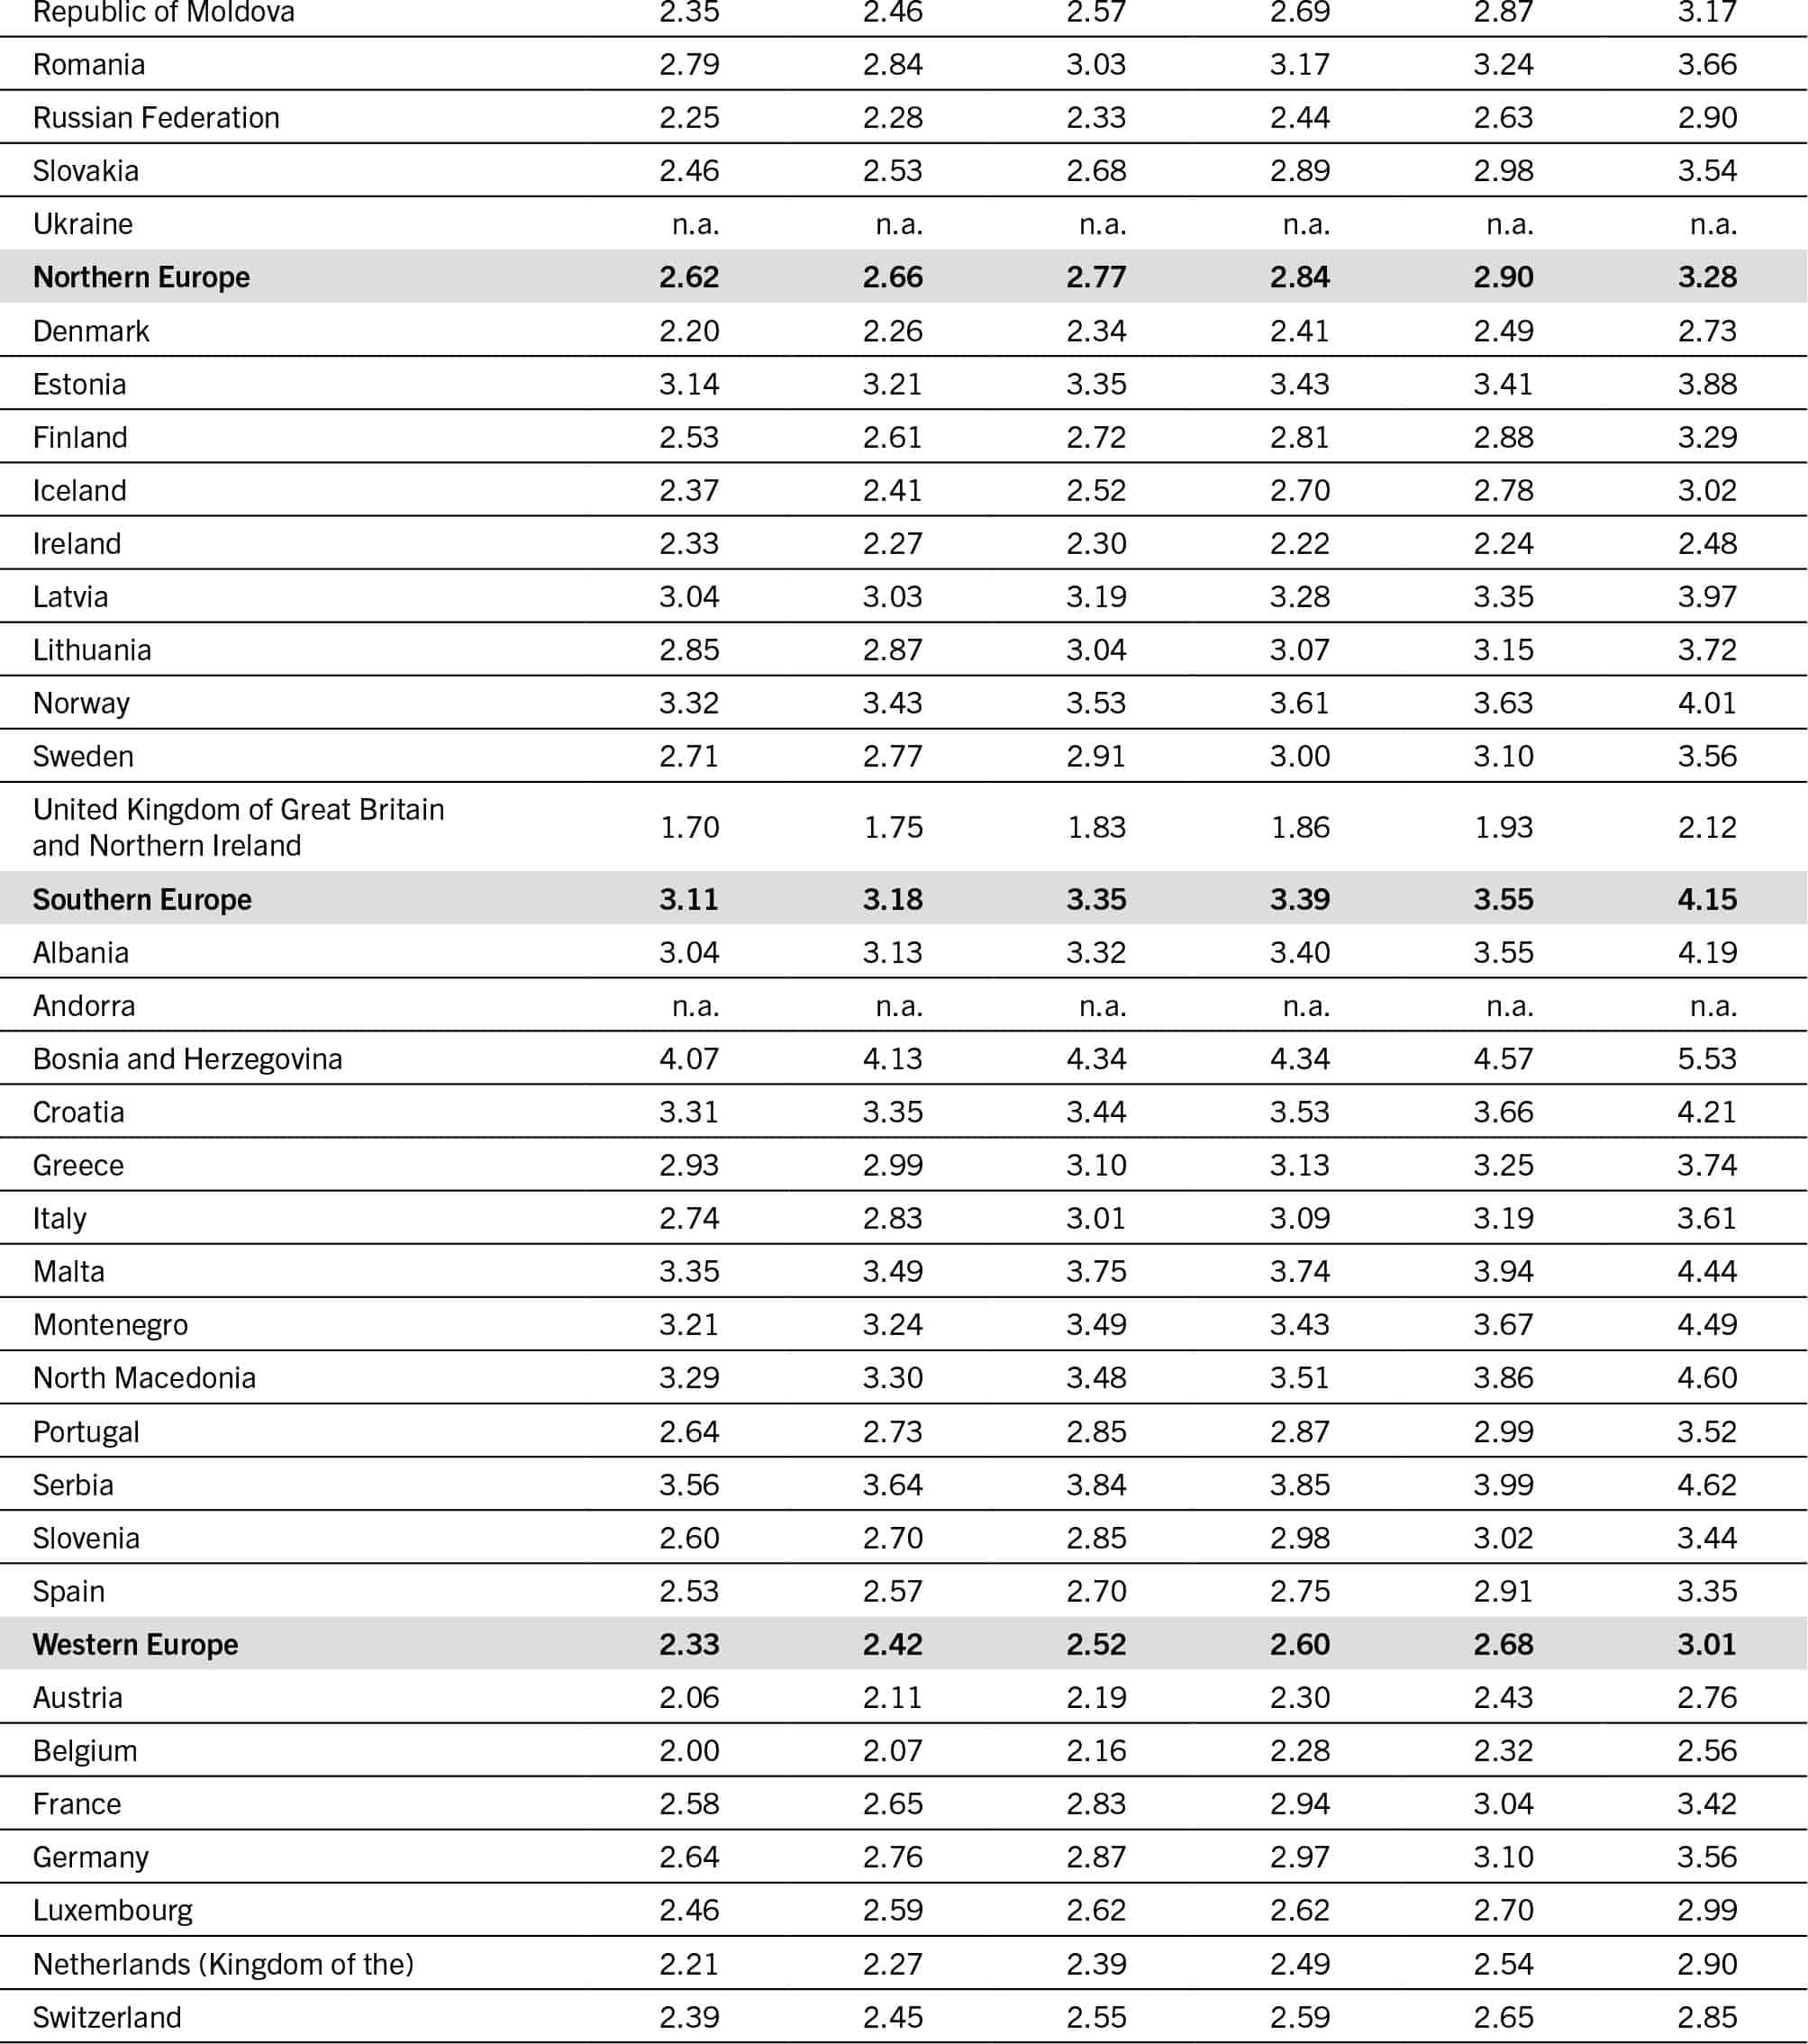
NOTES: PPP = purchasing power parity. n.a. = data not available. n.r. = data not reported.* Includes Zimbabwe. ** Includes Argentina. a PPP was imputed.
SOURCE: FAO. 2024. FAOSTAT: Cost and Affordability of a Healthy Diet (CoAHD). [Accessed on 24 July 2024]. www.fao.org/faostat/en/#data/CAHD. Licence: CC-BY-4.0.
SOURCE: FAO. 2024. FAOSTAT: Cost and Affordability of a Healthy Diet (CoAHD). [Accessed on 24 July 2024]. www.fao.org/faostat/en/#data/CAHD. Licence: CC-BY-4.0.
TABLE A1.6 Unaffordability of a healthy diet by region, subregion, country and country income group, 2017–2022
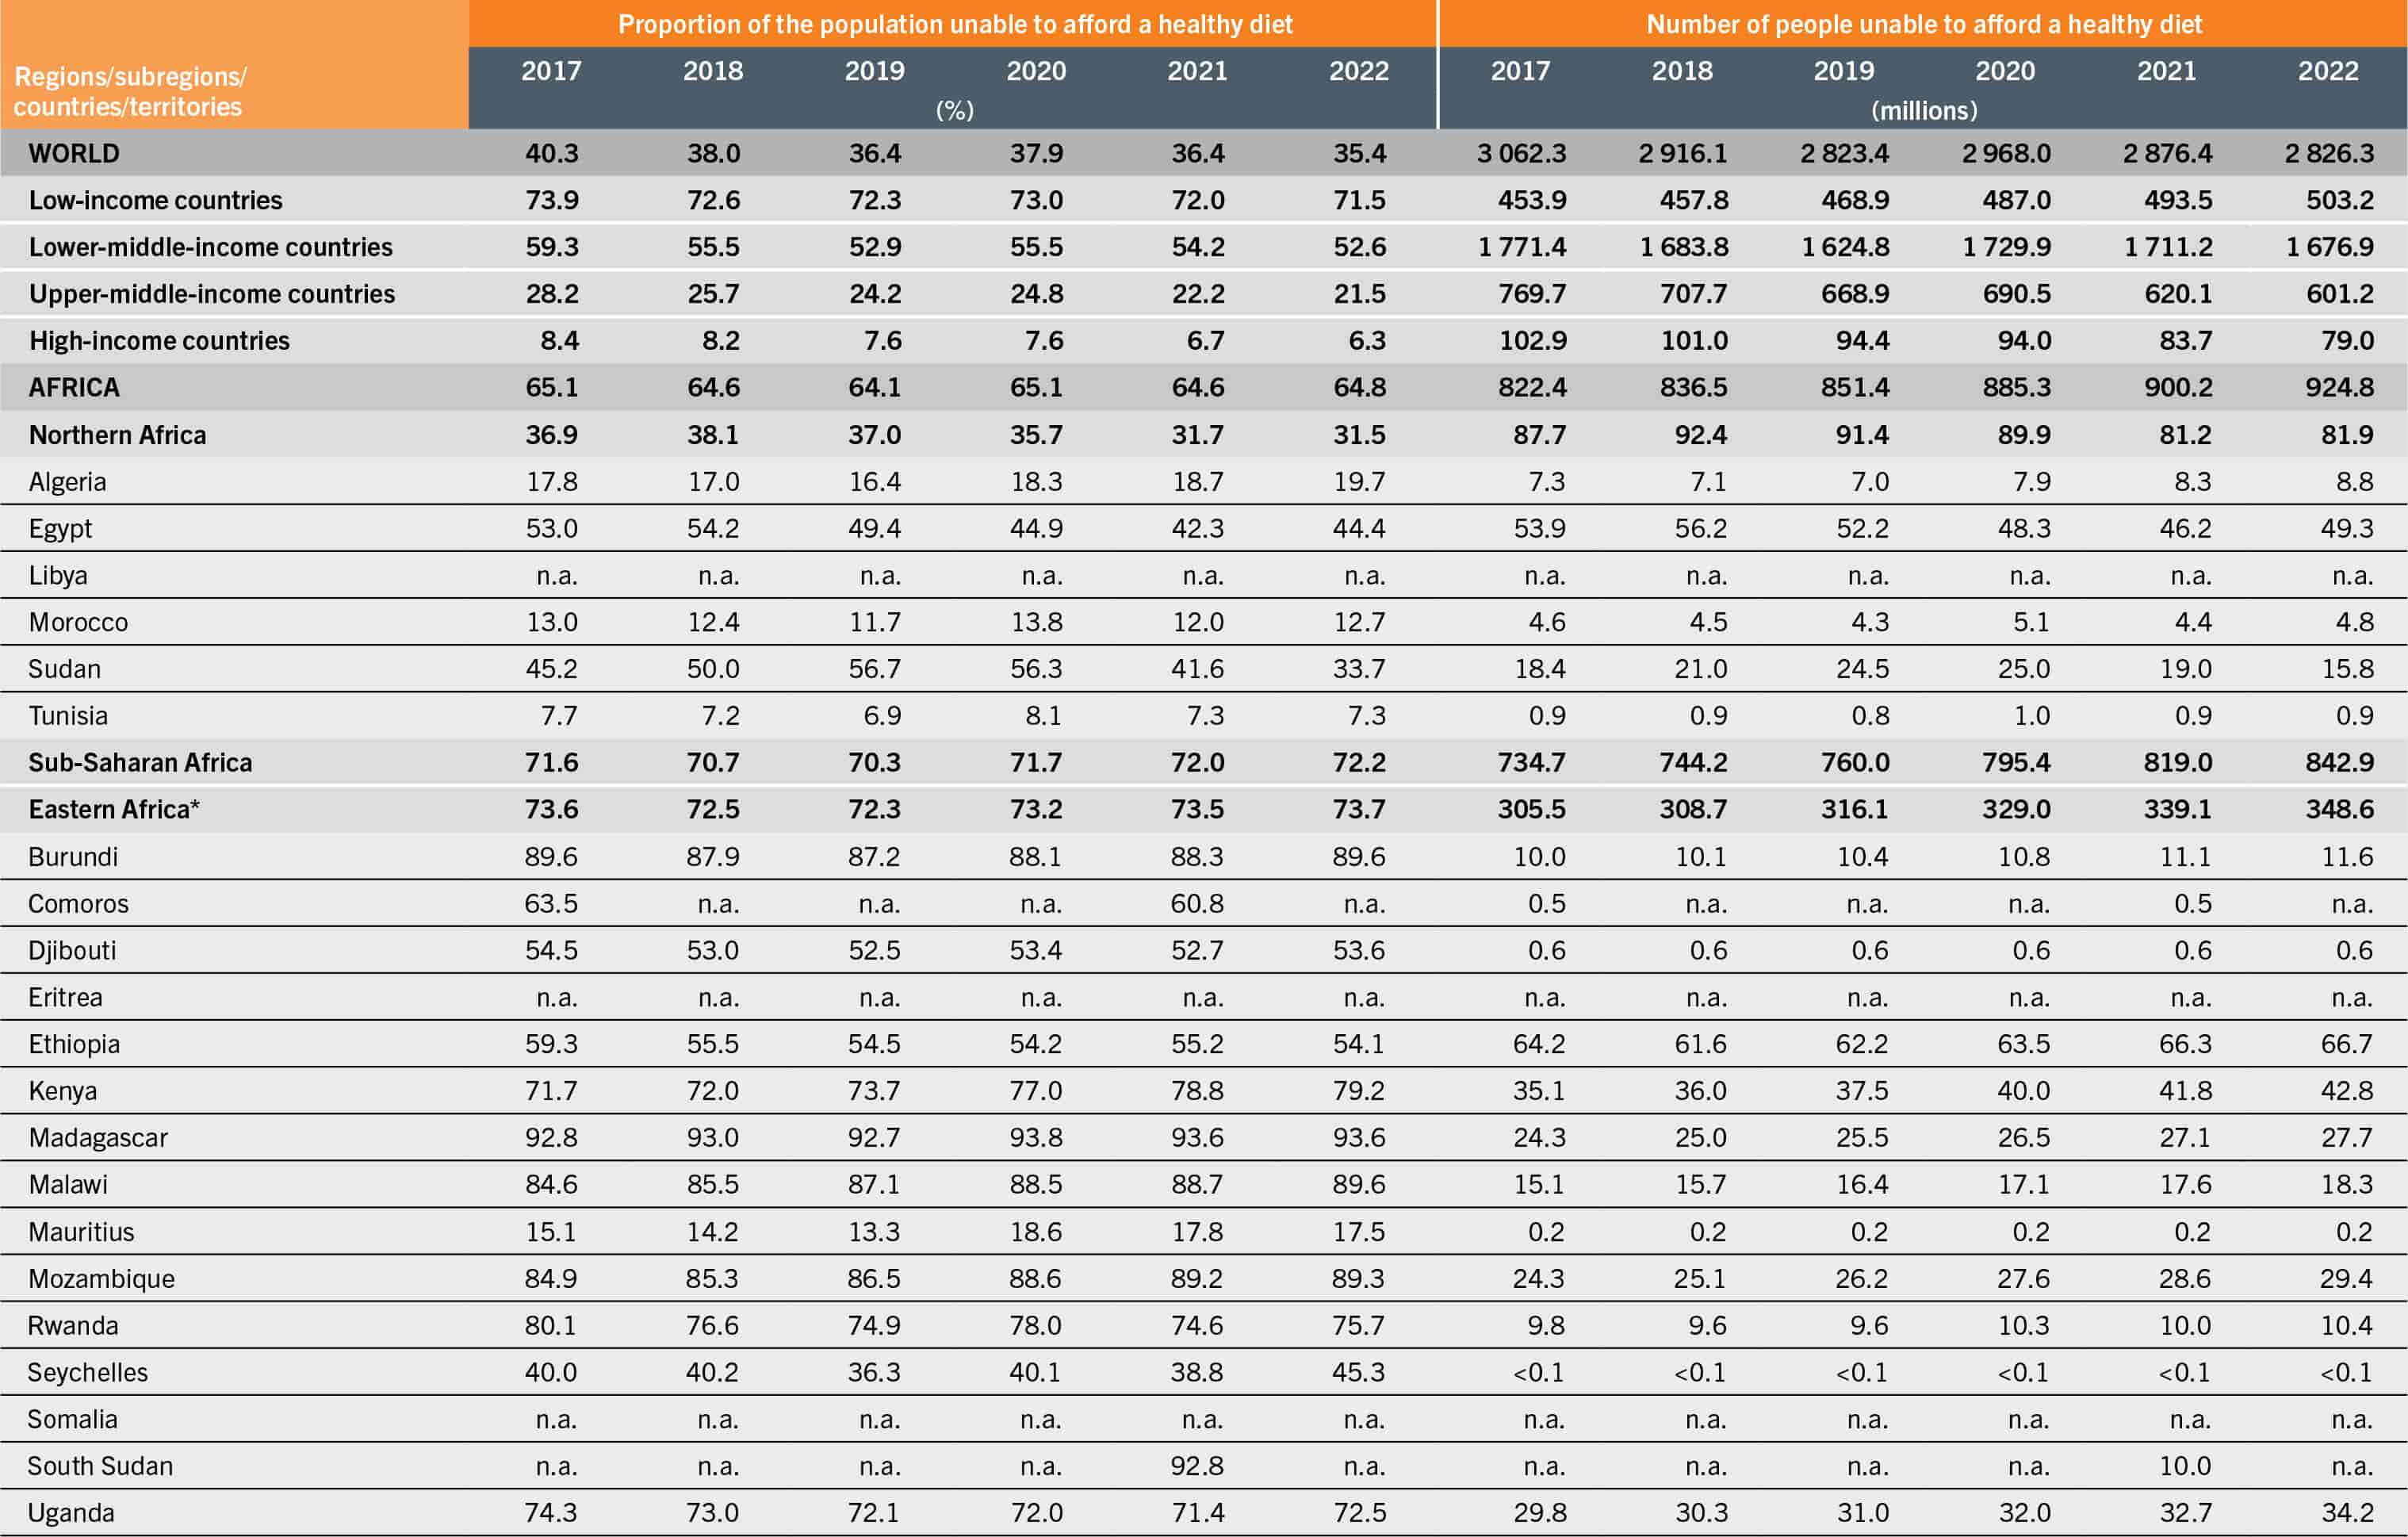
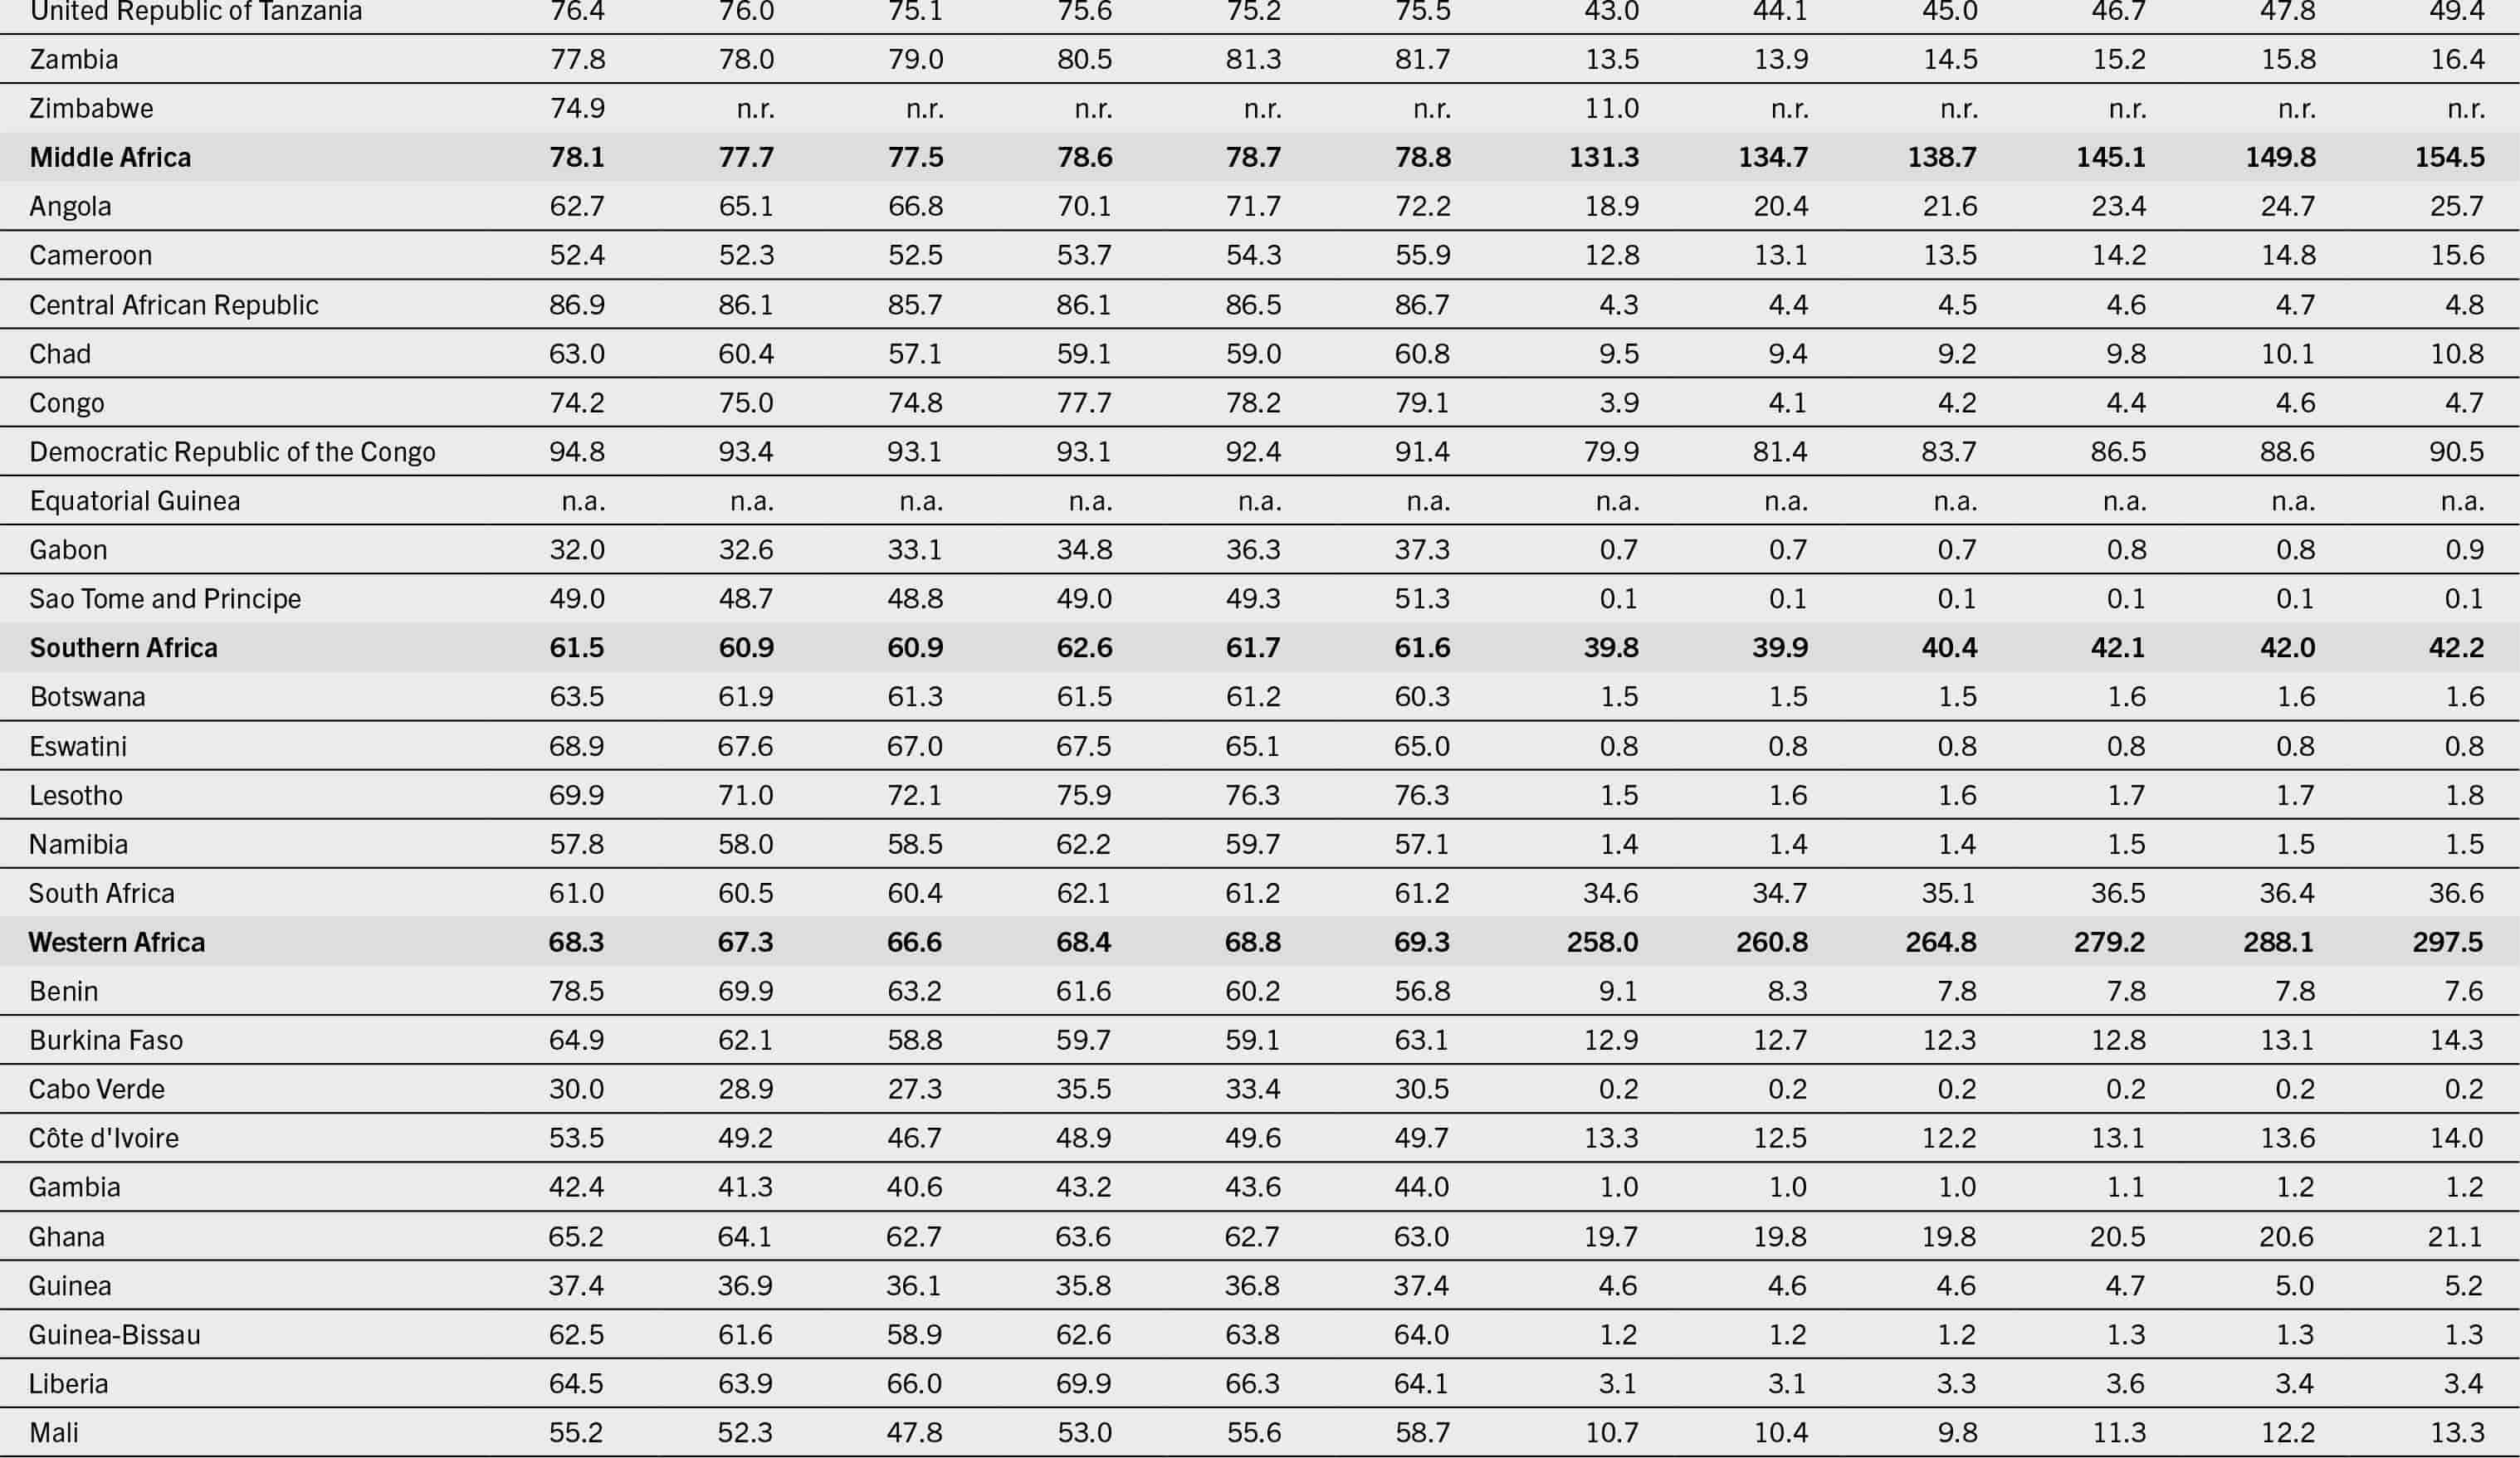
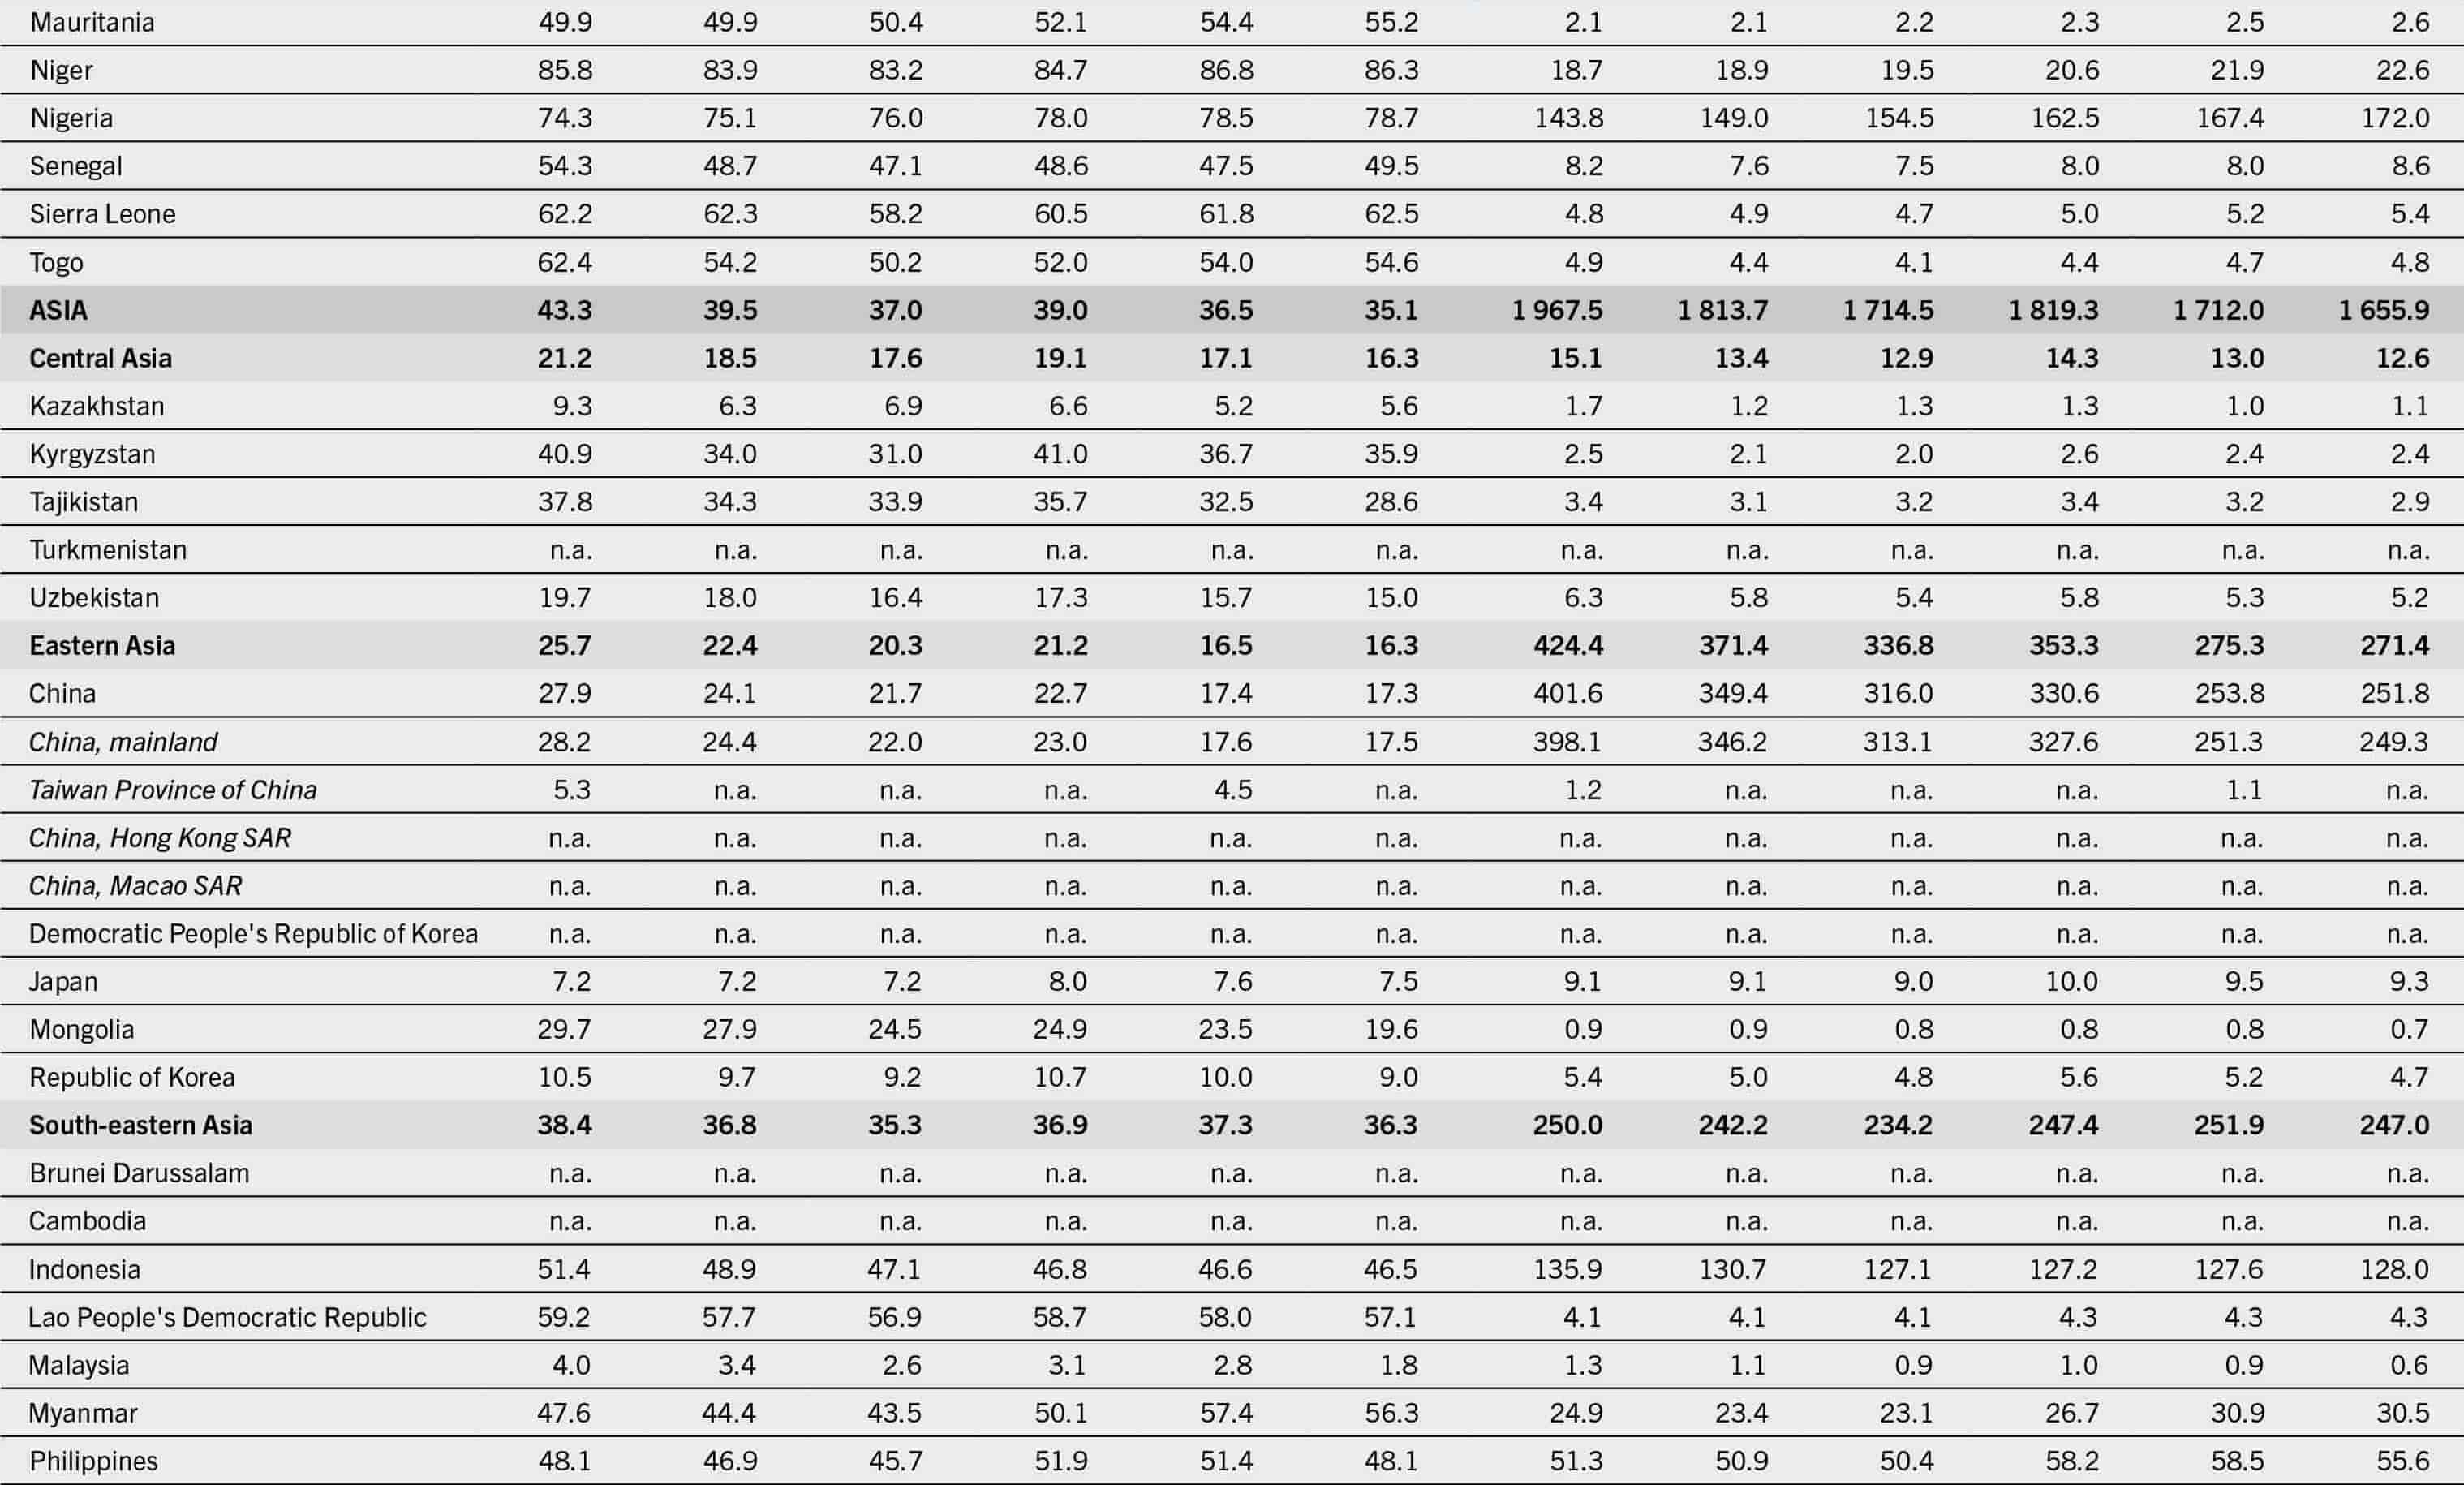
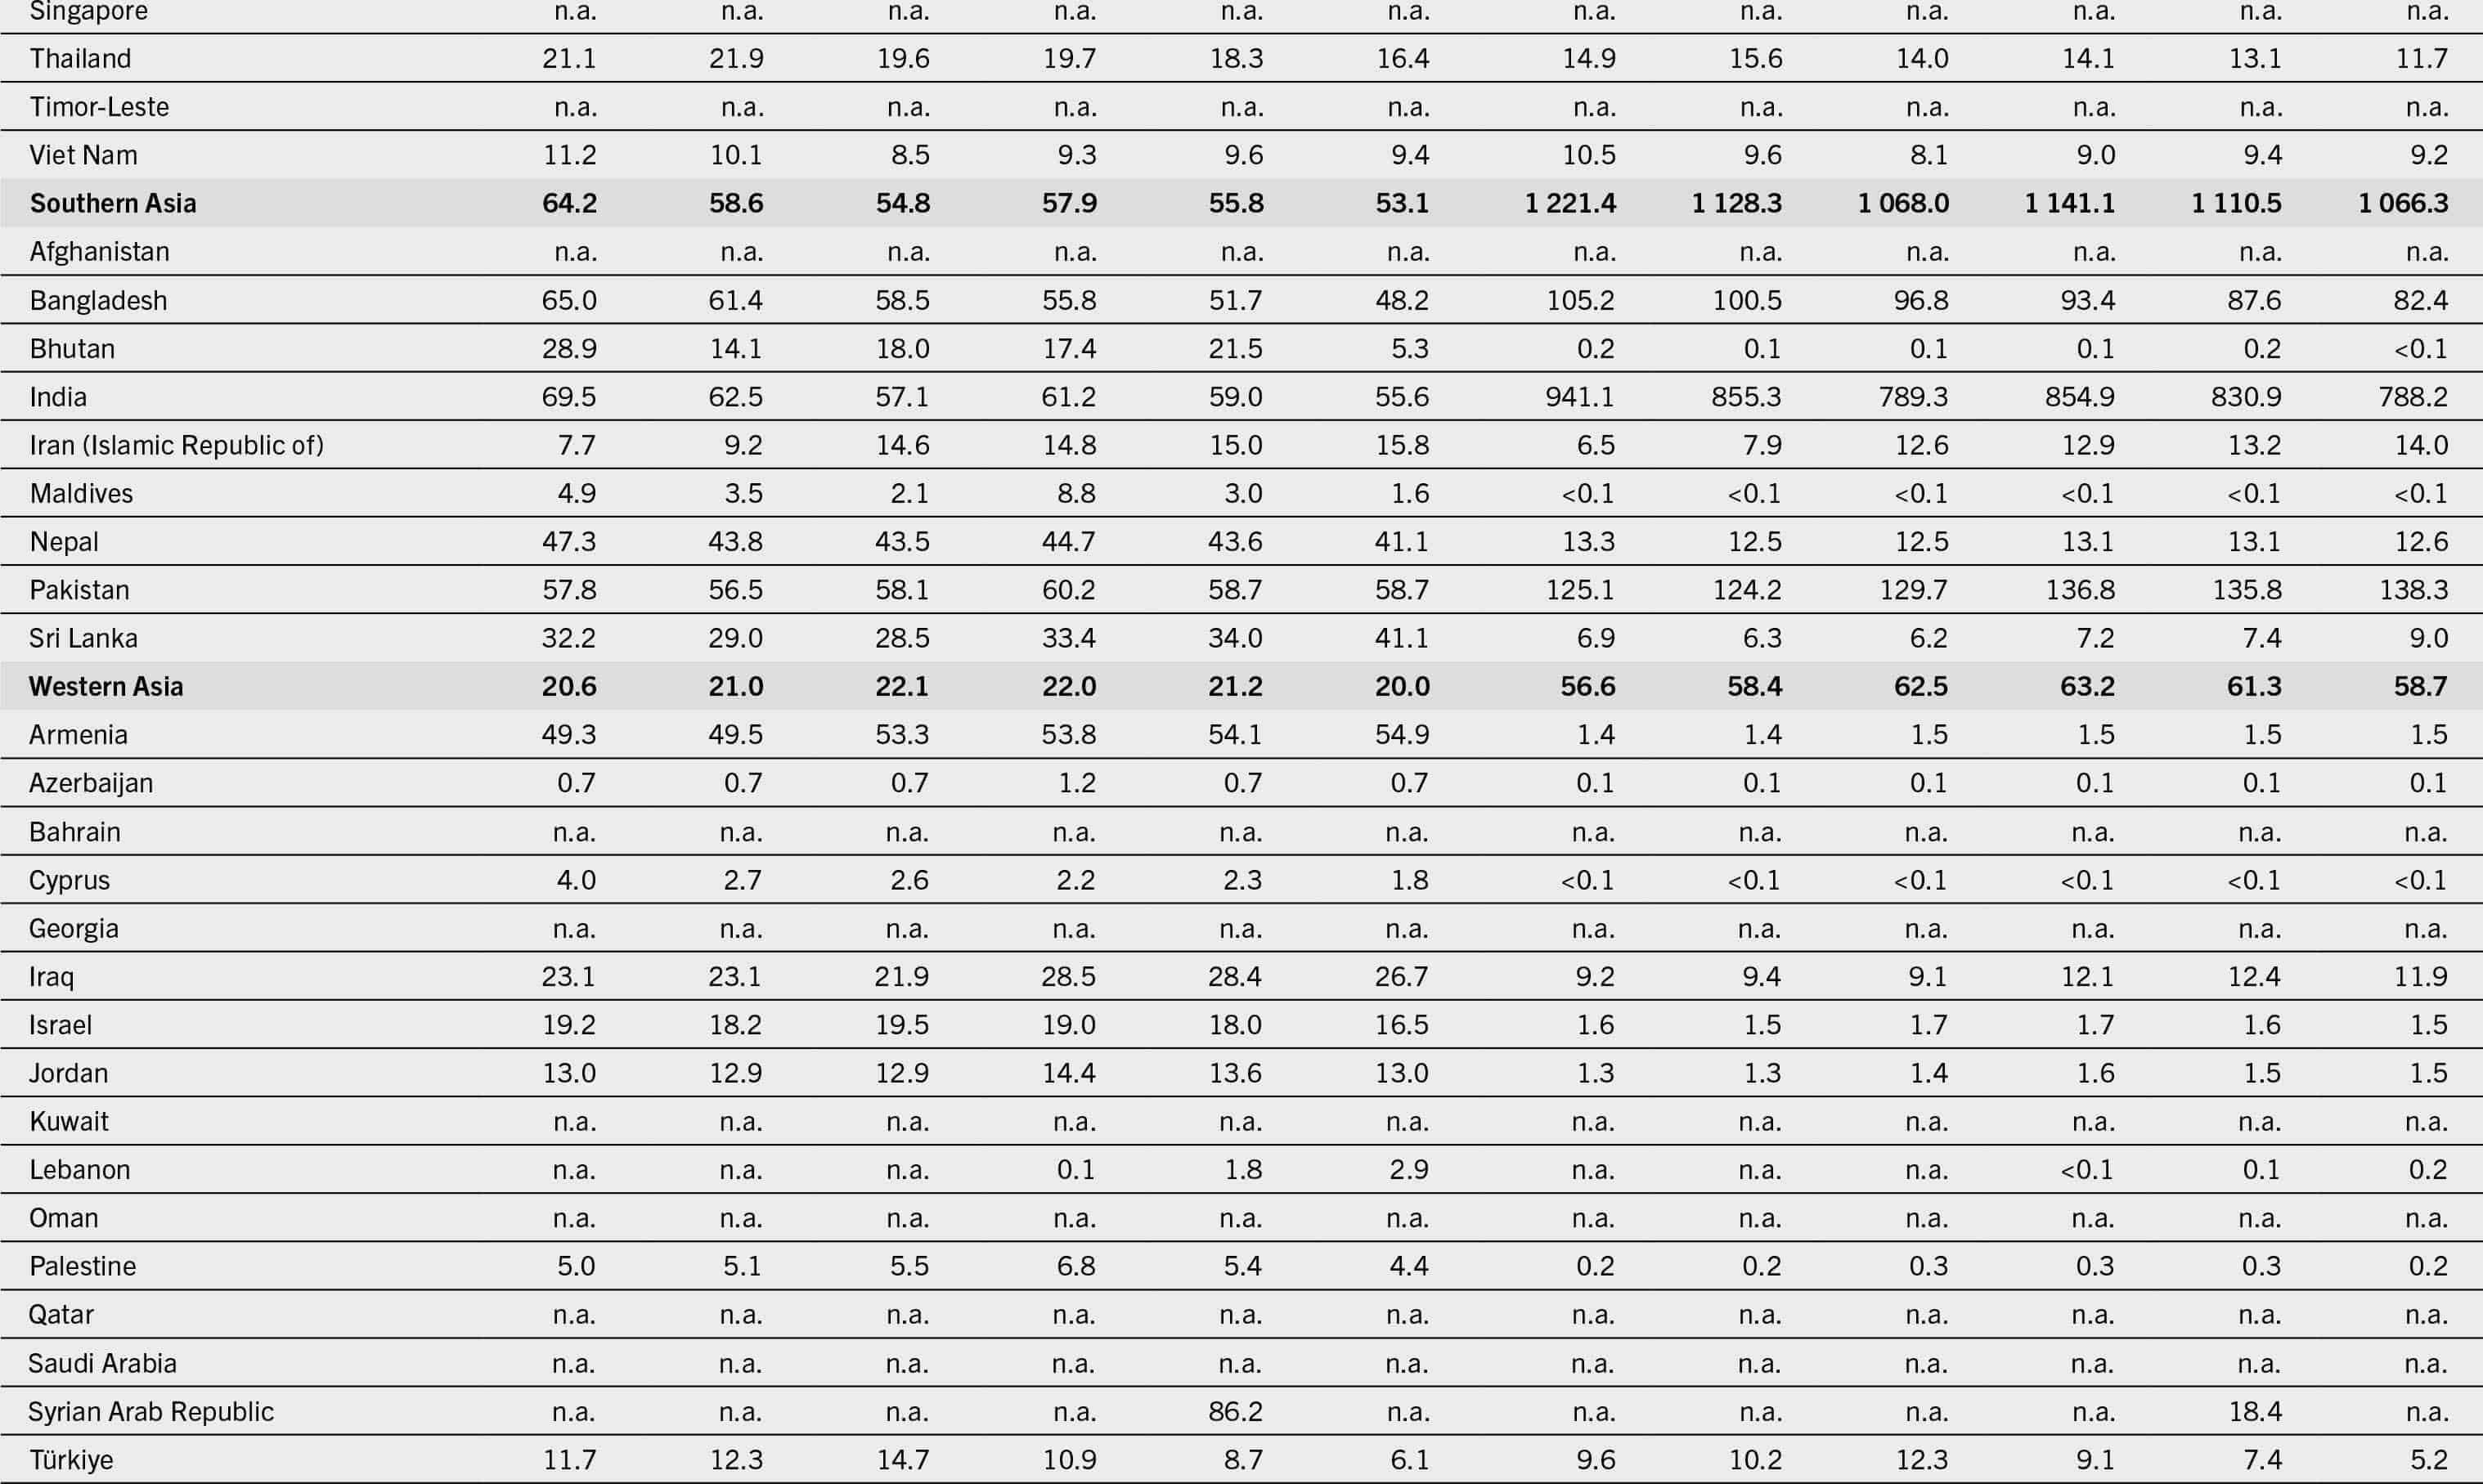
NOTES: n.a. = data not available. n.r. = data not reported.* Includes Zimbabwe. ** Includes Argentina. The global number of people unable to afford a healthy diet (NUA) estimate is obtained by multiplying the proportion of the population unable to afford a healthy diet for each of the five world regions by the total population size in each region. Calculating the global NUA estimate as the sum of the NUA estimates of other country groupings, such as those based on income levels, should be avoided.
SOURCE: FAO. 2024. FAOSTAT: Cost and Affordability of a Healthy Diet (CoAHD). [Accessed on 24 July 2024]. www.fao.org/faostat/en/#data/CAHD. Licence: CC-BY-4.0.
SOURCE: FAO. 2024. FAOSTAT: Cost and Affordability of a Healthy Diet (CoAHD). [Accessed on 24 July 2024]. www.fao.org/faostat/en/#data/CAHD. Licence: CC-BY-4.0.


