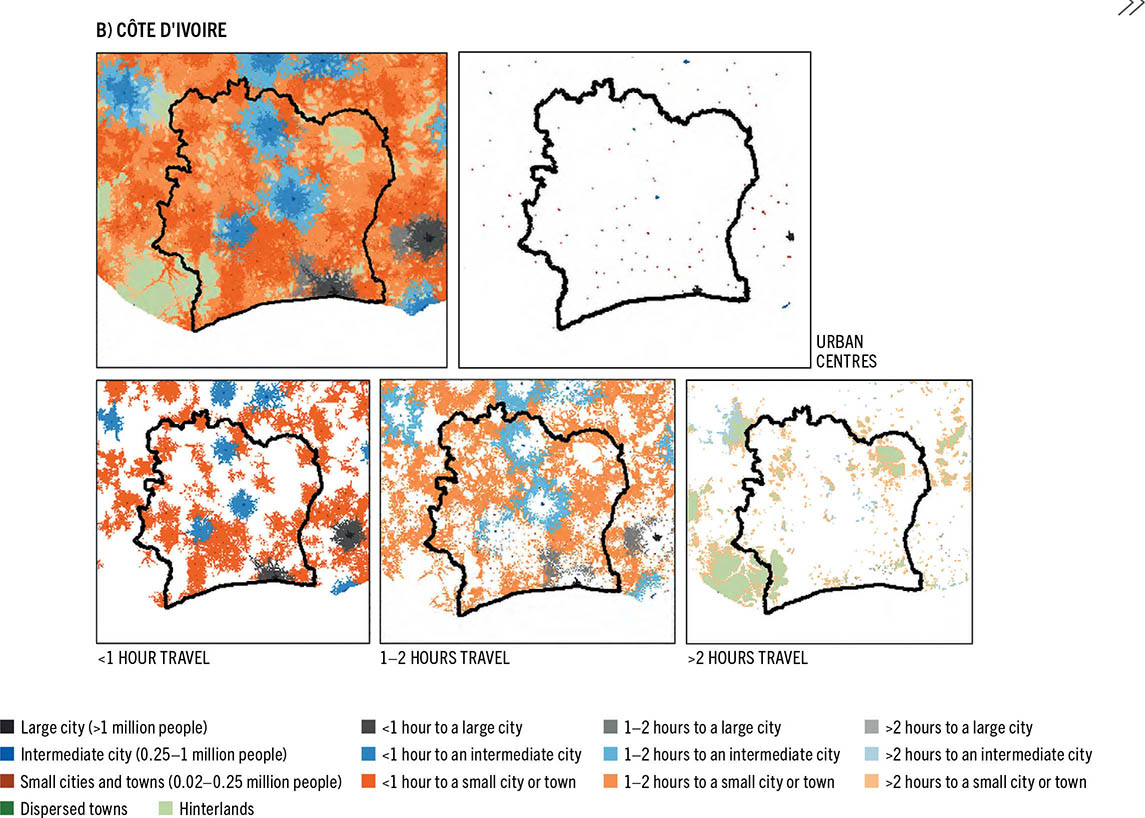
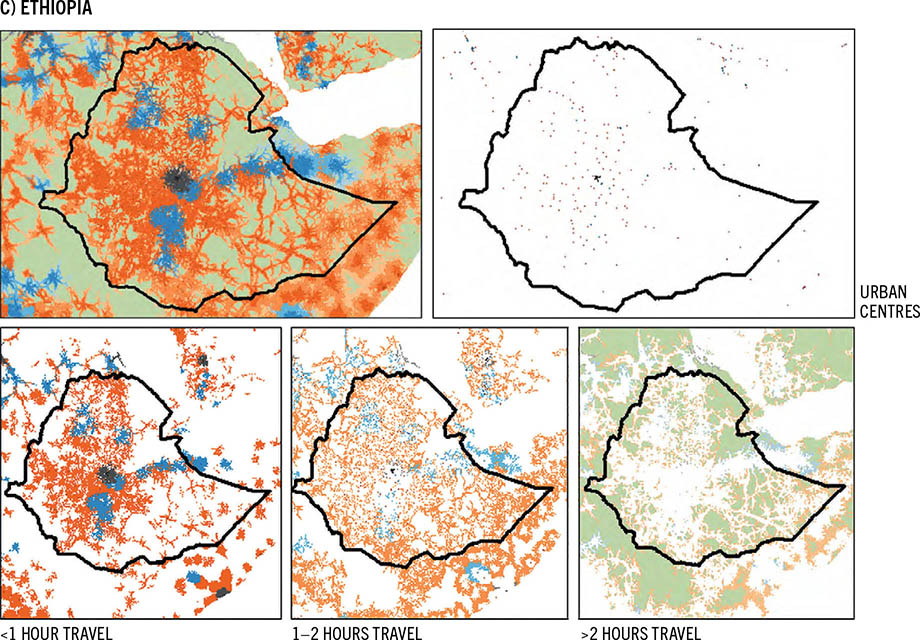
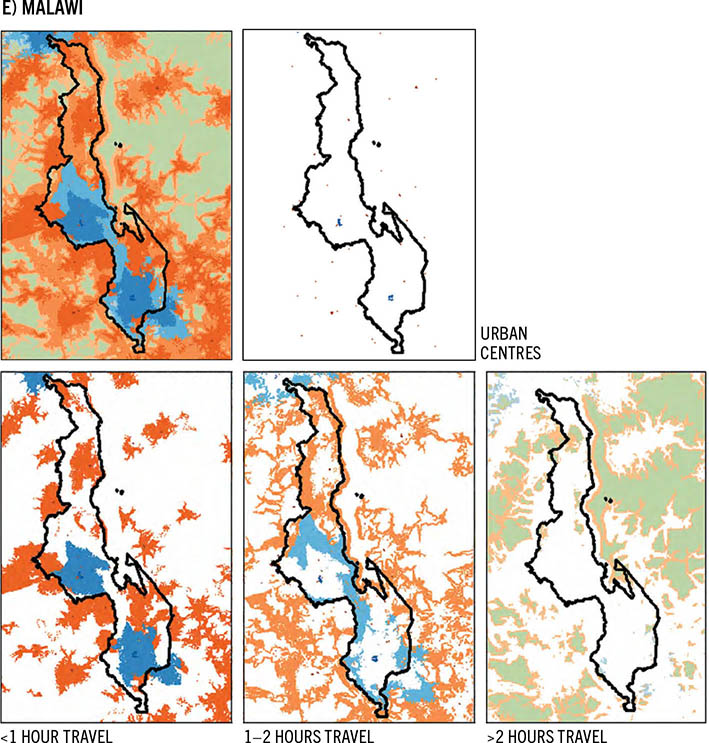
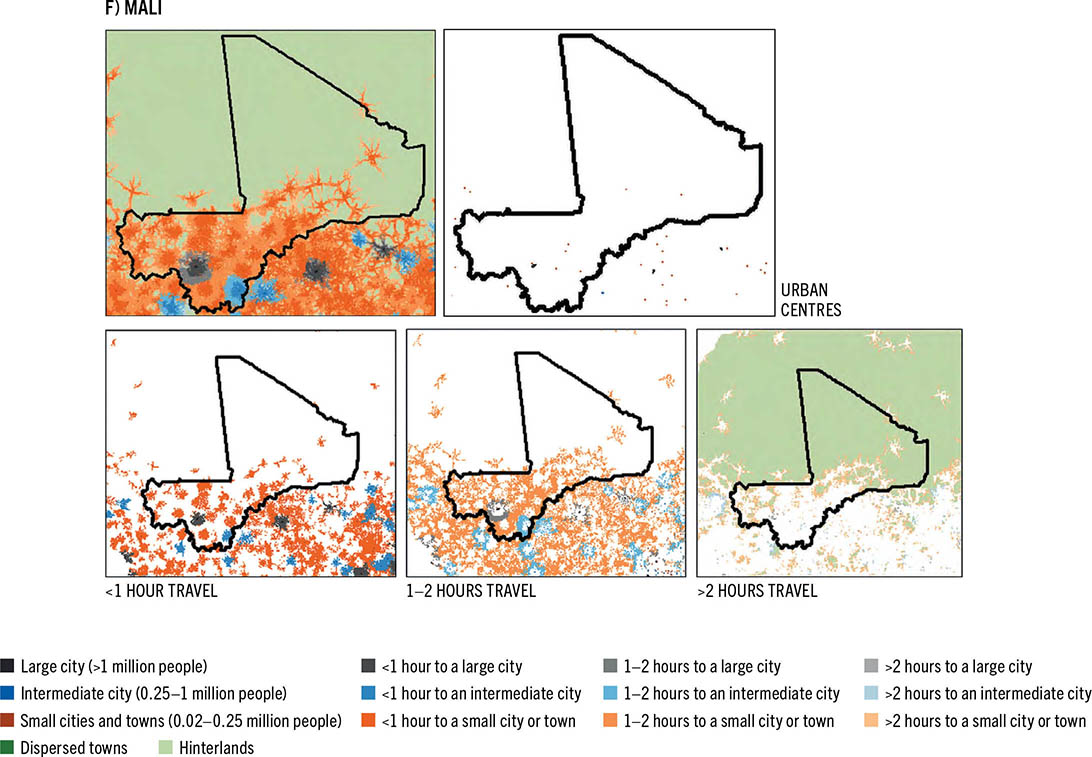
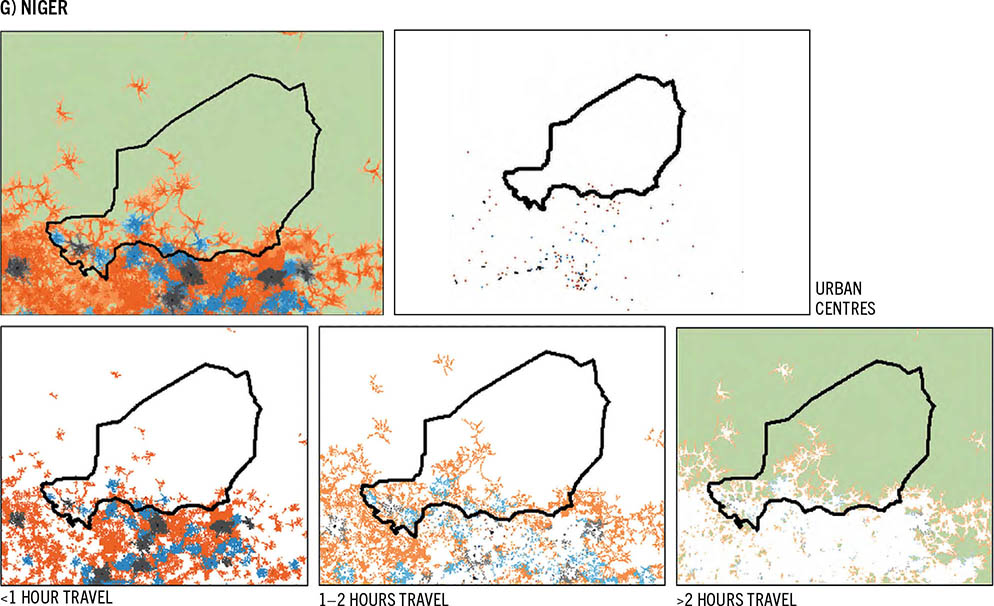
FIGURE A6-1: Long Description The top left map shows the overlay of all URCA categories and the top right map shows the location of urban centers. The bottom maps show, moving left to right, the areas that are less than 1 hour, 1 to 2 hours, and more than 2 hours travel to any urban centre. The URCA categories are color-coded are represent. Large city (greater 1 million people), Intermediate city (0.25 to 1 million people), Small city (50 to 250 thousand people), Town (20 to 50 thousand people), Less than 1 hour to a large city, Less than 1 hour to an intermediate city, Less than 1 hour to a small city, Less than 1 hour to a town, 1 to 2 hours to a city or town, and greater 2 hours to a city or town.
FIGURE A6-1 (Continued): Long Description The top left map shows the overlay of all URCA categories and the top right map shows the location of urban centers. The bottom maps show, moving left to right, the areas that are less than 1 hour, 1 to 2 hours, and more than 2 hours travel to any urban centre. The URCA categories are color-coded are represent. Large city (greater 1 million people), Intermediate city (0.25 to 1 million people), Small city (50 to 250 thousand people), Town (20 to 50 thousand people), Less than 1 hour to a large city, Less than 1 hour to an intermediate city, Less than 1 hour to a small city, Less than 1 hour to a town, 1 to 2 hours to a city or town, and greater 2 hours to a city or town.
FIGURE A6-1 (Continued1): Long Description The top left map shows the overlay of all URCA categories and the top right map shows the location of urban centers. The bottom maps show, moving left to right, the areas that are less than 1 hour, 1 to 2 hours, and more than 2 hours travel to any urban centre. The URCA categories are color-coded are represent. Large city (greater 1 million people), Intermediate city (0.25 to 1 million people), Small city (50 to 250 thousand people), Town (20 to 50 thousand people), Less than 1 hour to a large city, Less than 1 hour to an intermediate city, Less than 1 hour to a small city, Less than 1 hour to a town, 1 to 2 hours to a city or town, and greater 2 hours to a city or town.
FIGURE A6-1 (Continued2): Long Description The top left map shows the overlay of all URCA categories and the top right map shows the location of urban centers. The bottom maps show, moving left to right, the areas that are less than 1 hour, 1 to 2 hours, and more than 2 hours travel to any urban centre. The URCA categories are color-coded are represent. Large city (greater 1 million people), Intermediate city (0.25 to 1 million people), Small city (50 to 250 thousand people), Town (20 to 50 thousand people), Less than 1 hour to a large city, Less than 1 hour to an intermediate city, Less than 1 hour to a small city, Less than 1 hour to a town, 1 to 2 hours to a city or town, and greater 2 hours to a city or town.
FIGURE A6-1 (Continued3): Long Description The top left map shows the overlay of all URCA categories and the top right map shows the location of urban centers. The bottom maps show, moving left to right, the areas that are less than 1 hour, 1 to 2 hours, and more than 2 hours travel to any urban centre. The URCA categories are color-coded are represent. Large city (greater 1 million people), Intermediate city (0.25 to 1 million people), Small city (50 to 250 thousand people), Town (20 to 50 thousand people), Less than 1 hour to a large city, Less than 1 hour to an intermediate city, Less than 1 hour to a small city, Less than 1 hour to a town, 1 to 2 hours to a city or town, and greater 2 hours to a city or town.
FIGURE A6-1 (Continued4): Long Description The top left map shows the overlay of all URCA categories and the top right map shows the location of urban centers. The bottom maps show, moving left to right, the areas that are less than 1 hour, 1 to 2 hours, and more than 2 hours travel to any urban centre. The URCA categories are color-coded are represent. Large city (greater 1 million people), Intermediate city (0.25 to 1 million people), Small city (50 to 250 thousand people), Town (20 to 50 thousand people), Less than 1 hour to a large city, Less than 1 hour to an intermediate city, Less than 1 hour to a small city, Less than 1 hour to a town, 1 to 2 hours to a city or town, and greater 2 hours to a city or town.
FIGURE A6-1 (Continued5): Long Description The top left map shows the overlay of all URCA categories and the top right map shows the location of urban centers. The bottom maps show, moving left to right, the areas that are less than 1 hour, 1 to 2 hours, and more than 2 hours travel to any urban centre. The URCA categories are color-coded are represent. Large city (greater 1 million people), Intermediate city (0.25 to 1 million people), Small city (50 to 250 thousand people), Town (20 to 50 thousand people), Less than 1 hour to a large city, Less than 1 hour to an intermediate city, Less than 1 hour to a small city, Less than 1 hour to a town, 1 to 2 hours to a city or town, and greater 2 hours to a city or town.
FIGURE A6-1 (Continued6): Long Description The top left map shows the overlay of all URCA categories and the top right map shows the location of urban centers. The bottom maps show, moving left to right, the areas that are less than 1 hour, 1 to 2 hours, and more than 2 hours travel to any urban centre. The URCA categories are color-coded are represent. Large city (greater 1 million people), Intermediate city (0.25 to 1 million people), Small city (50 to 250 thousand people), Town (20 to 50 thousand people), Less than 1 hour to a large city, Less than 1 hour to an intermediate city, Less than 1 hour to a small city, Less than 1 hour to a town, 1 to 2 hours to a city or town, and greater 2 hours to a city or town.
FIGURE A6-1 (Continued7): Long Description The top left map shows the overlay of all URCA categories and the top right map shows the location of urban centers. The bottom maps show, moving left to right, the areas that are less than 1 hour, 1 to 2 hours, and more than 2 hours travel to any urban centre. The URCA categories are color-coded are represent. Large city (greater 1 million people), Intermediate city (0.25 to 1 million people), Small city (50 to 250 thousand people), Town (20 to 50 thousand people), Less than 1 hour to a large city, Less than 1 hour to an intermediate city, Less than 1 hour to a small city, Less than 1 hour to a town, 1 to 2 hours to a city or town, and greater 2 hours to a city or town.
NOTES: In all panels, the top left map displays all urban–rural catchments areas. The top right map shows only the three categories of urban centres (large, intermediate and small city or town). The bottom left map displays areas 1 hour travel or less to any urban centre, roughly corresponding to what are defined as peri-urban areas in
Chapter 4 . The bottom centre map displays areas 1 to 2 hours travel to any urban centre, and the bottom right map displays areas more than 2 hours travel to any urban centre. The bottom centre and bottom right maps roughly correspond to what are defined as rural areas in
Chapter 4 .
SOURCE: Dolislager, M.J, Holleman, C., Liverpool-Tasie, L.S.O. & Reardon, T. 2023.
Analysis of food demand and supply across the rural–urban continuum in selected countries in Africa. Background paper for
The State of Food Security and Nutrition in the World 2023. FAO Agricultural Development Economics Working Paper 23-09. Rome, FAO.

