1 State of land, soil and water
1.3 Water scarcity
The global water budget is under pressure. Internal renewable water resources (IRWRs) from rivers and aquifers amount to 44 000 km3/year, and withdrawals (all sectors) exceed 4 000 km3/year, almost 10 percent of IRWRs. The local impacts of physical water scarcity and freshwater pollution are spreading and accelerating. In many cases, the first sign of scarcity from increased withdrawals is falling groundwater levels.
1.3.1 Sustainable Development Goal indicator 6.4.2
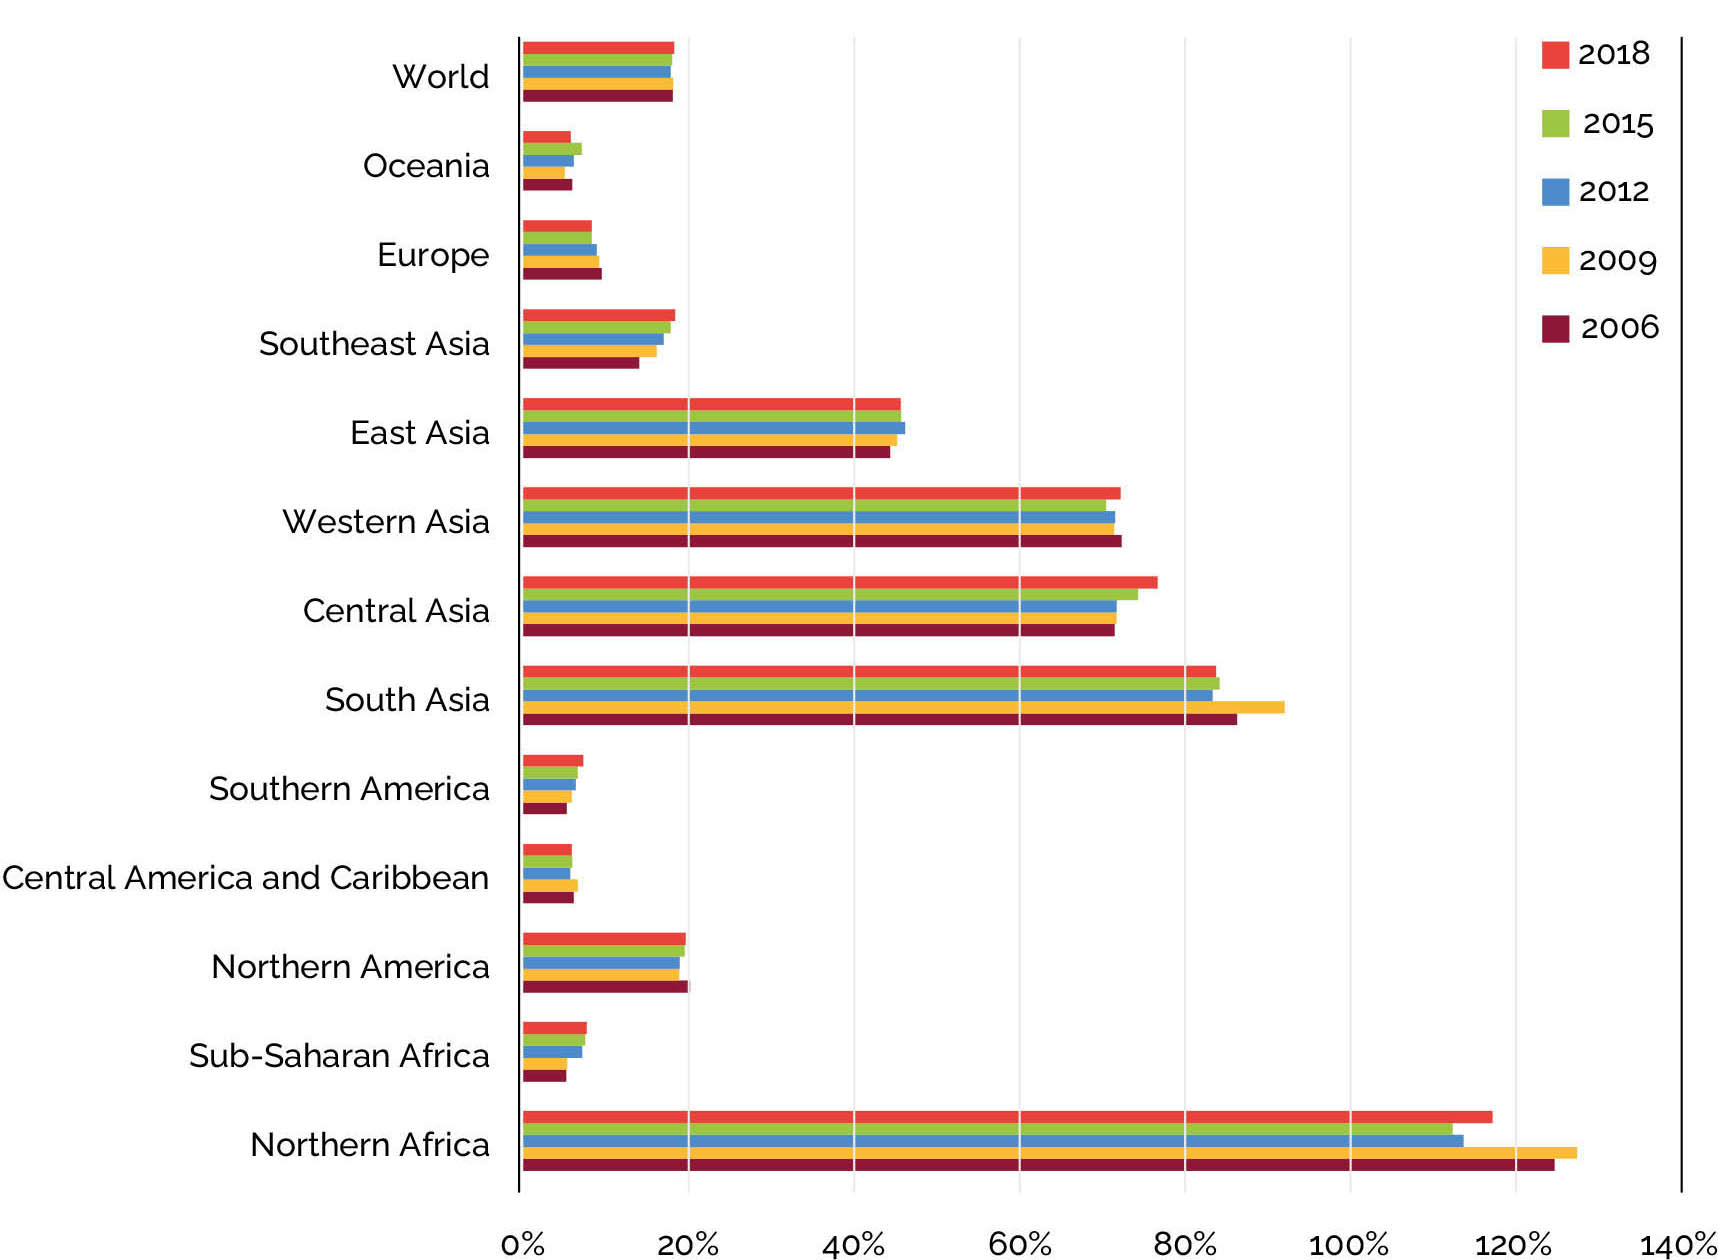
The SDG aggregate (all sectors) indicator 6.4.2 on water stress1 is taken as an overall measure of physical water scarcity. At the global level, SDG indicator 6.4.2 reached an average of 18 percent in 2018, but this masks substantial regional variations (Figure S.4). Europe is experiencing a low stress level of 8.3 percent. In comparison, the stress levels in East Asia and Western Asia are between 45 percent and 70 percent, in Central and South Asia, they are over 70 percent, while in Northern Africa, they are above 100 percent. Non-conventional water use in agriculture, such as water reuse and desalination, is still modest but growing, particularly in water-scarce areas such as the Middle East–Western Asia (Map S.8).
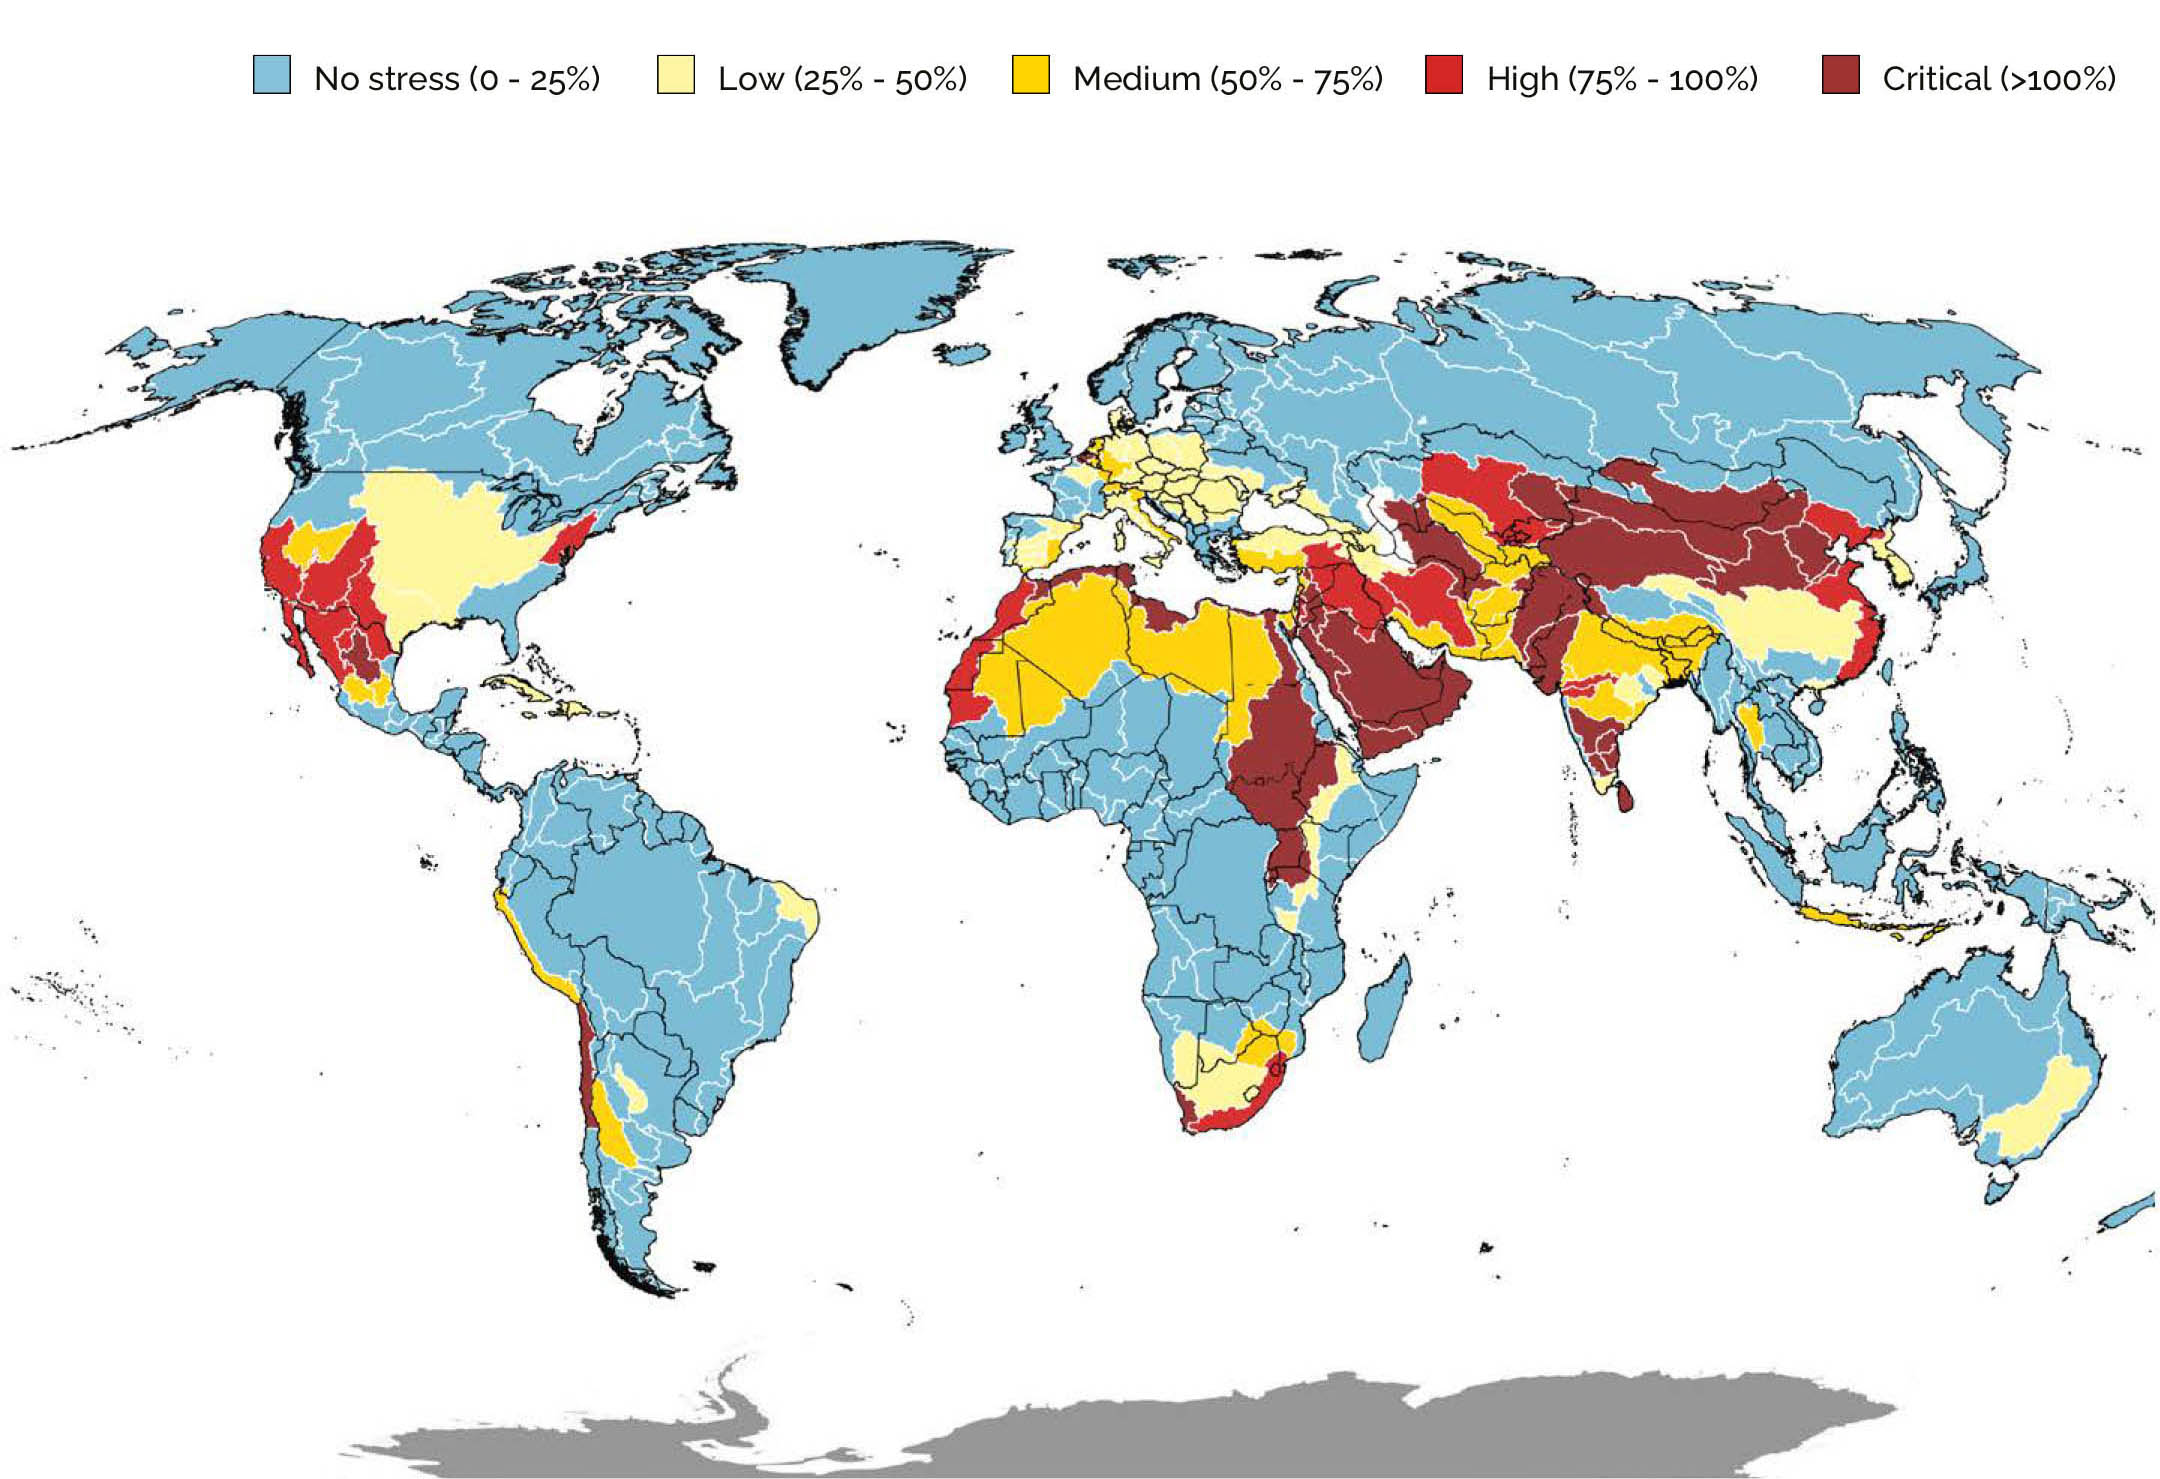
Water stress is high in all basins with intense irrigated agriculture and densely populated cities that compete for water, particularly where available freshwater resources are sparse due to climatic conditions. Countries are encouraged to disaggregate at the sub-basin level to give a detailed picture of water stress. Basins affected by high or critical water stress are located in regions with high water stress, such as Northern Africa, Northern America, Central and South Asia, and on the west coast of Latin America.
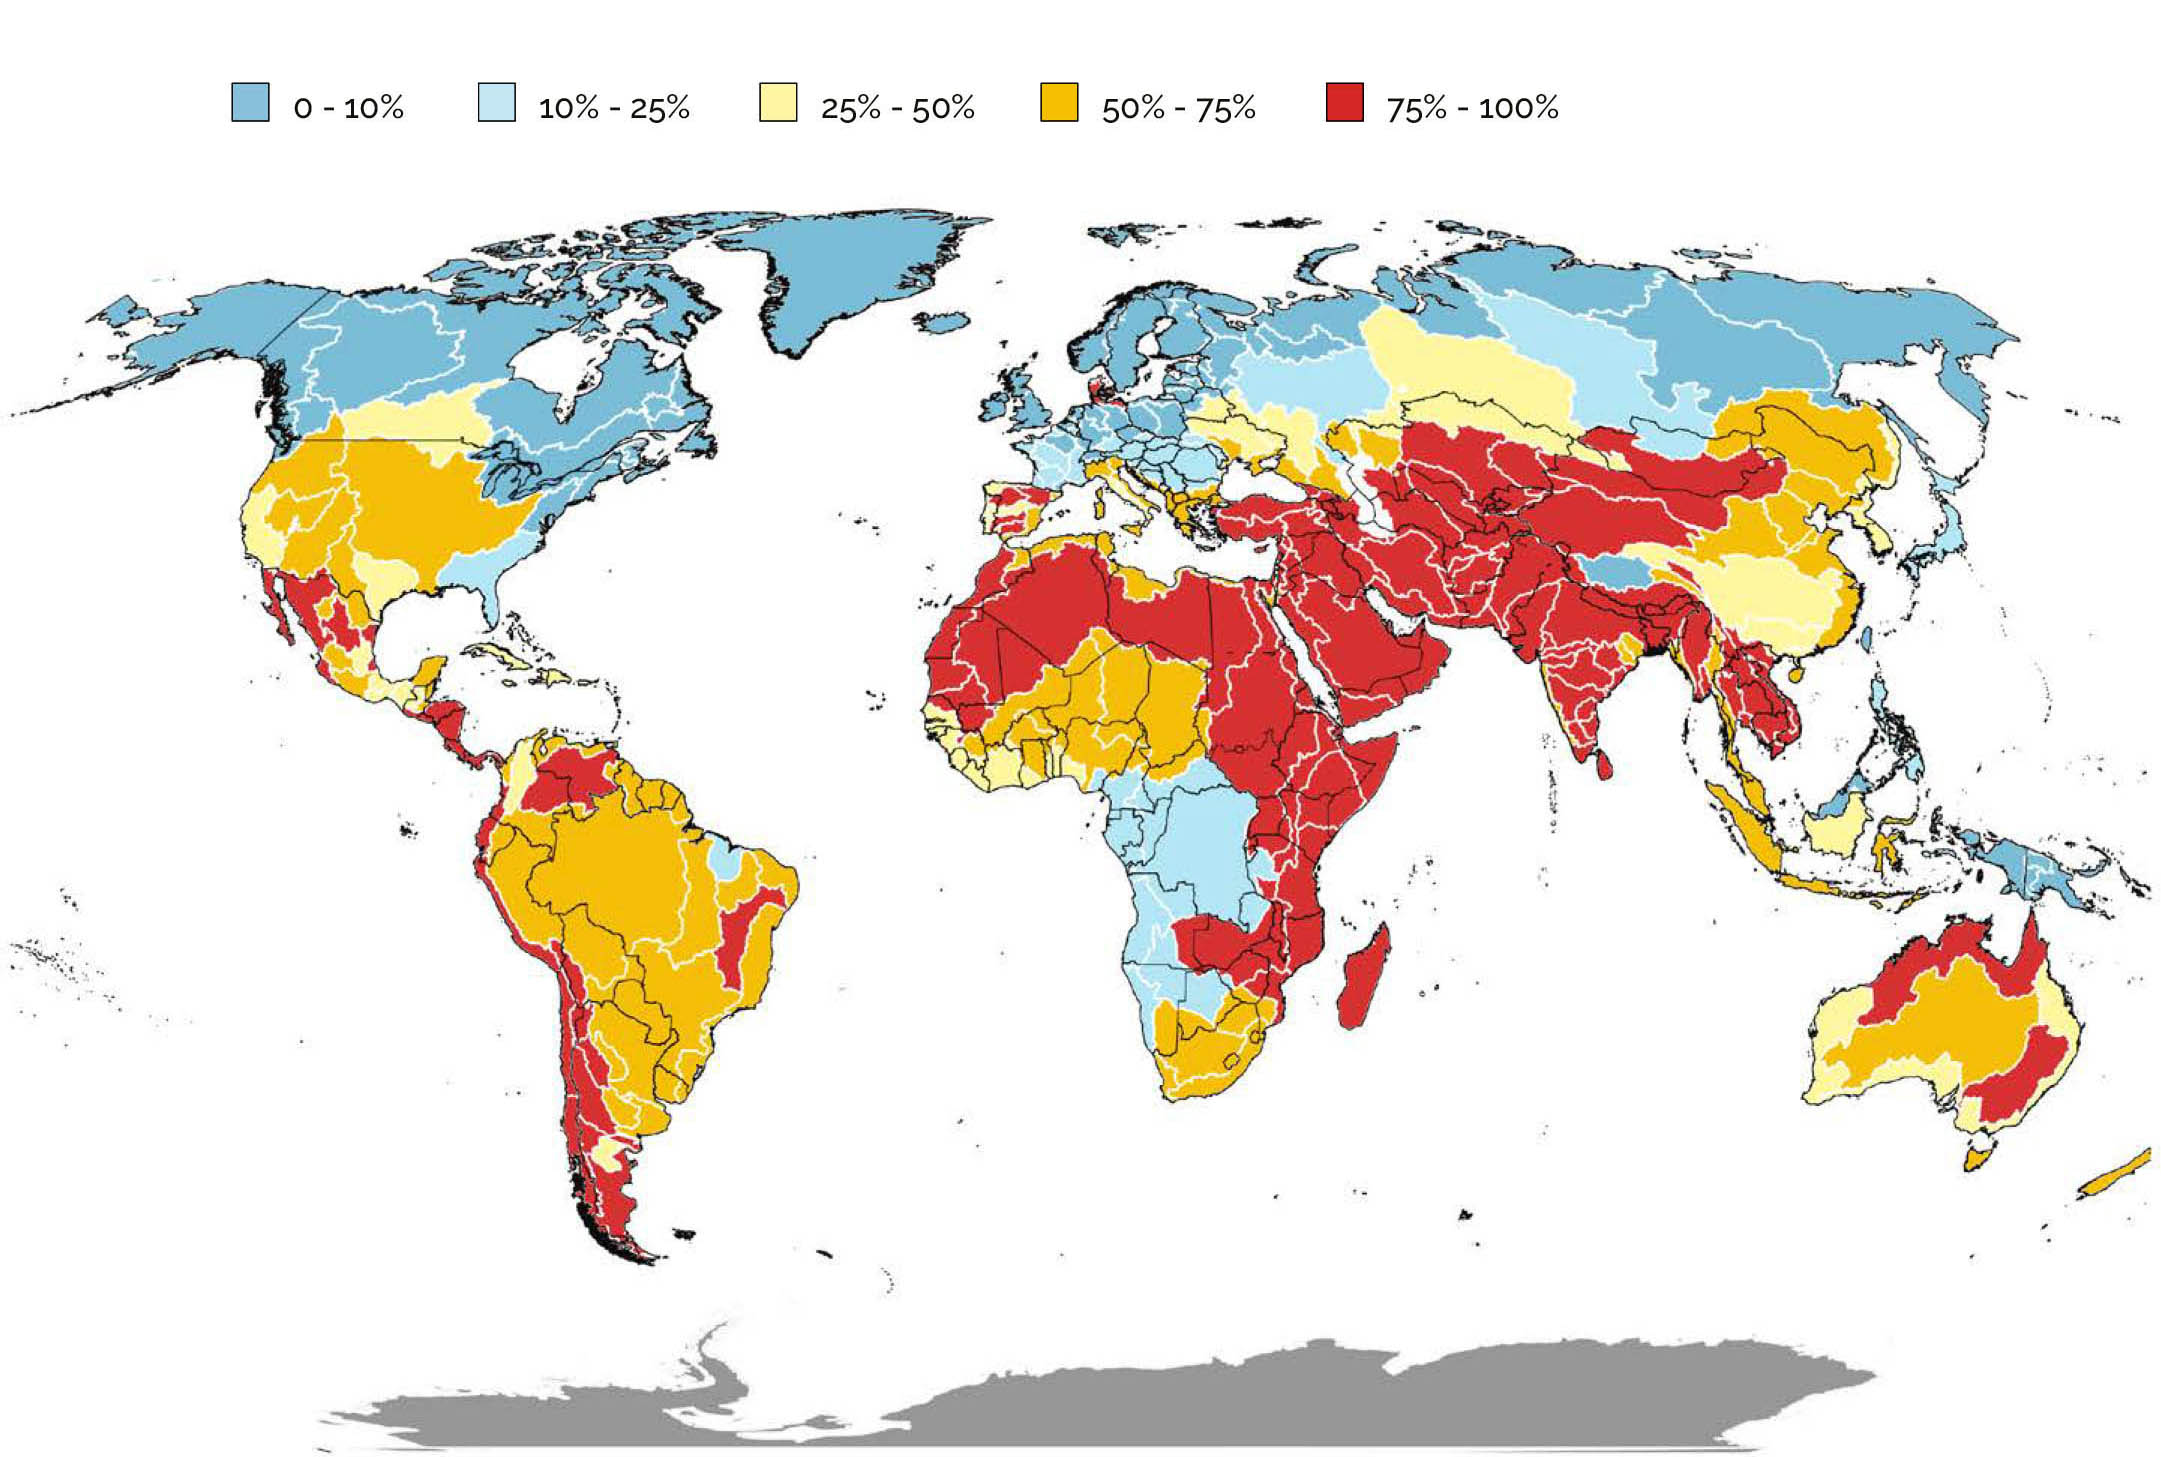
Agriculture is a significant contributor to water stress in countries with high levels of water stress. Agricultural withdrawals account for a substantial part of total withdrawals in Central Asia, the Middle East–Western Asia and Northern Africa (Map S.9). Water stress due to agricultural withdrawals illustrates the critical nature of the Nile and other river basins in the Arabian Peninsula and South Asia. These impacts are apparent in detail when distributed across areas equipped for irrigation.
1.3.2 Per capita freshwater availability and withdrawals
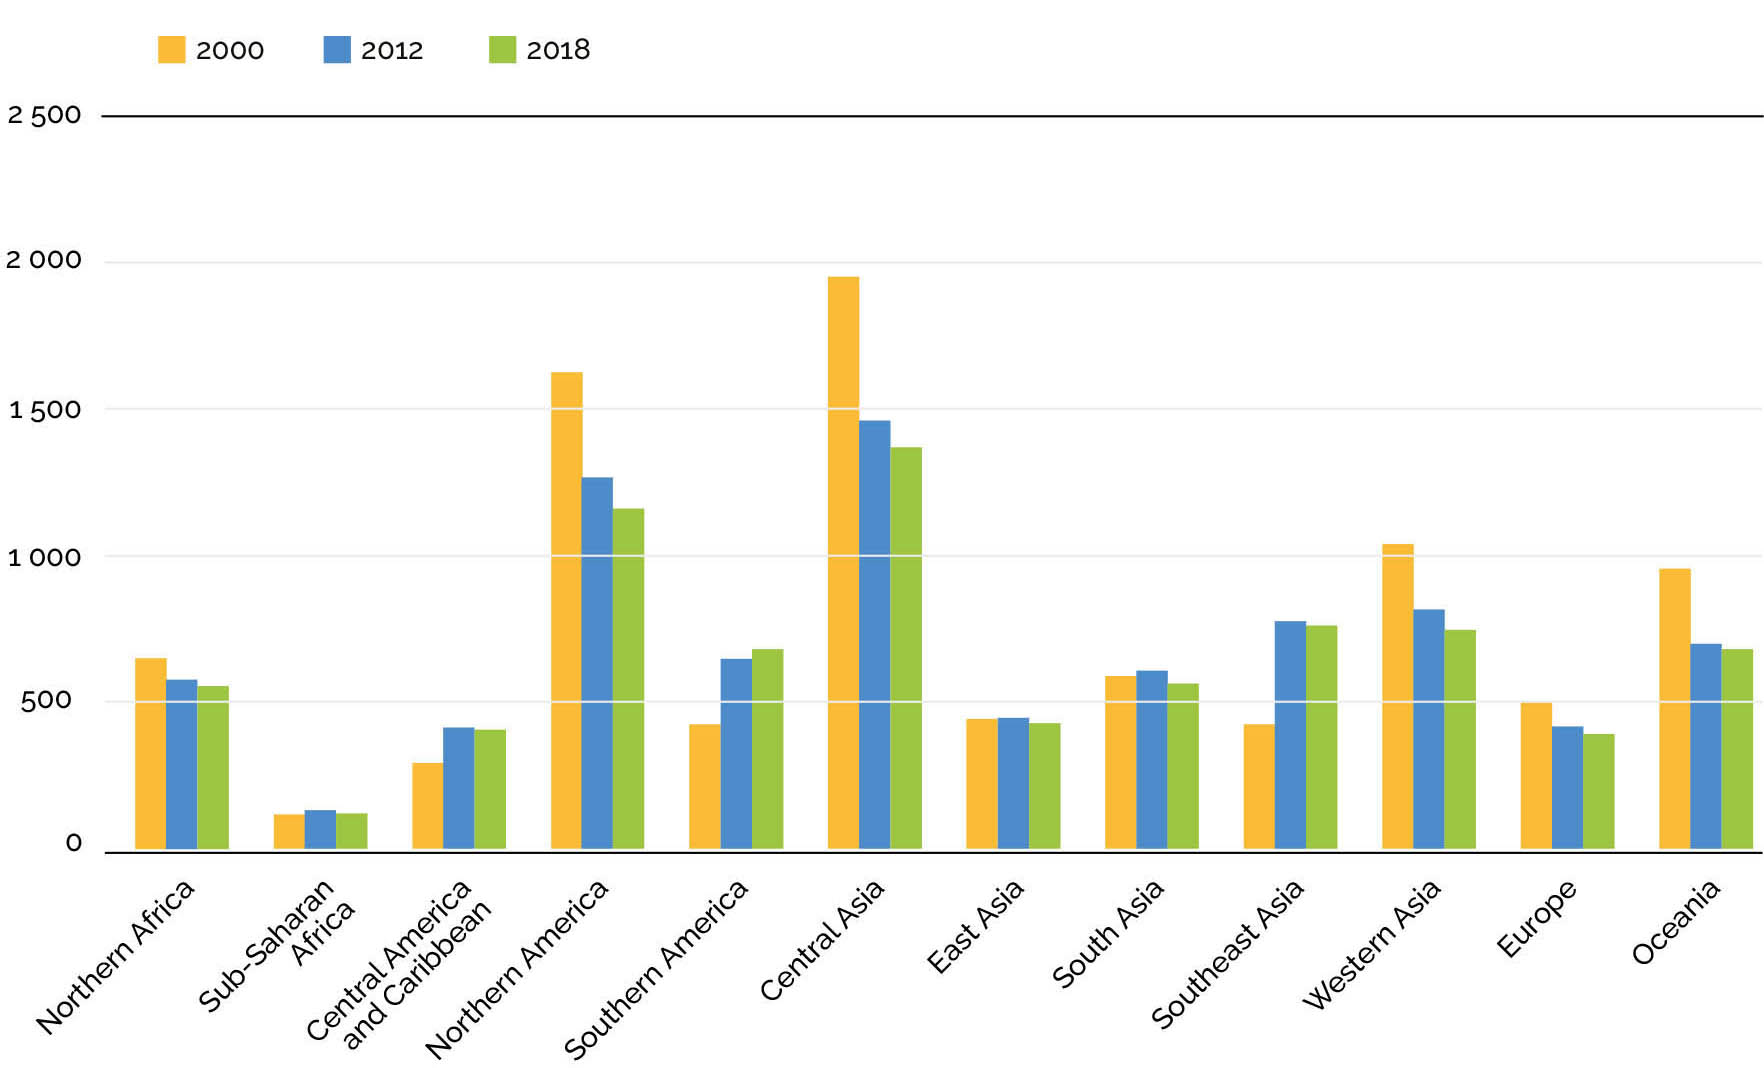
The overall change in the per capita distribution of freshwater resources is consistent with population growth. Between 2000 and 2018, the decline in global per capita IRWRs was about 20 percent (Figure S.5). The change was greater in countries with the lowest per capita IRWRs, such as sub-Saharan Africa (41 percent), Central Asia (30 percent), Western Asia (29 percent) and Northern Africa (26 percent). The region with the lowest percentage change was Europe (3 percent). On the demand side, the regions with the largest water withdrawals per capita were Central Asia and Northern America.
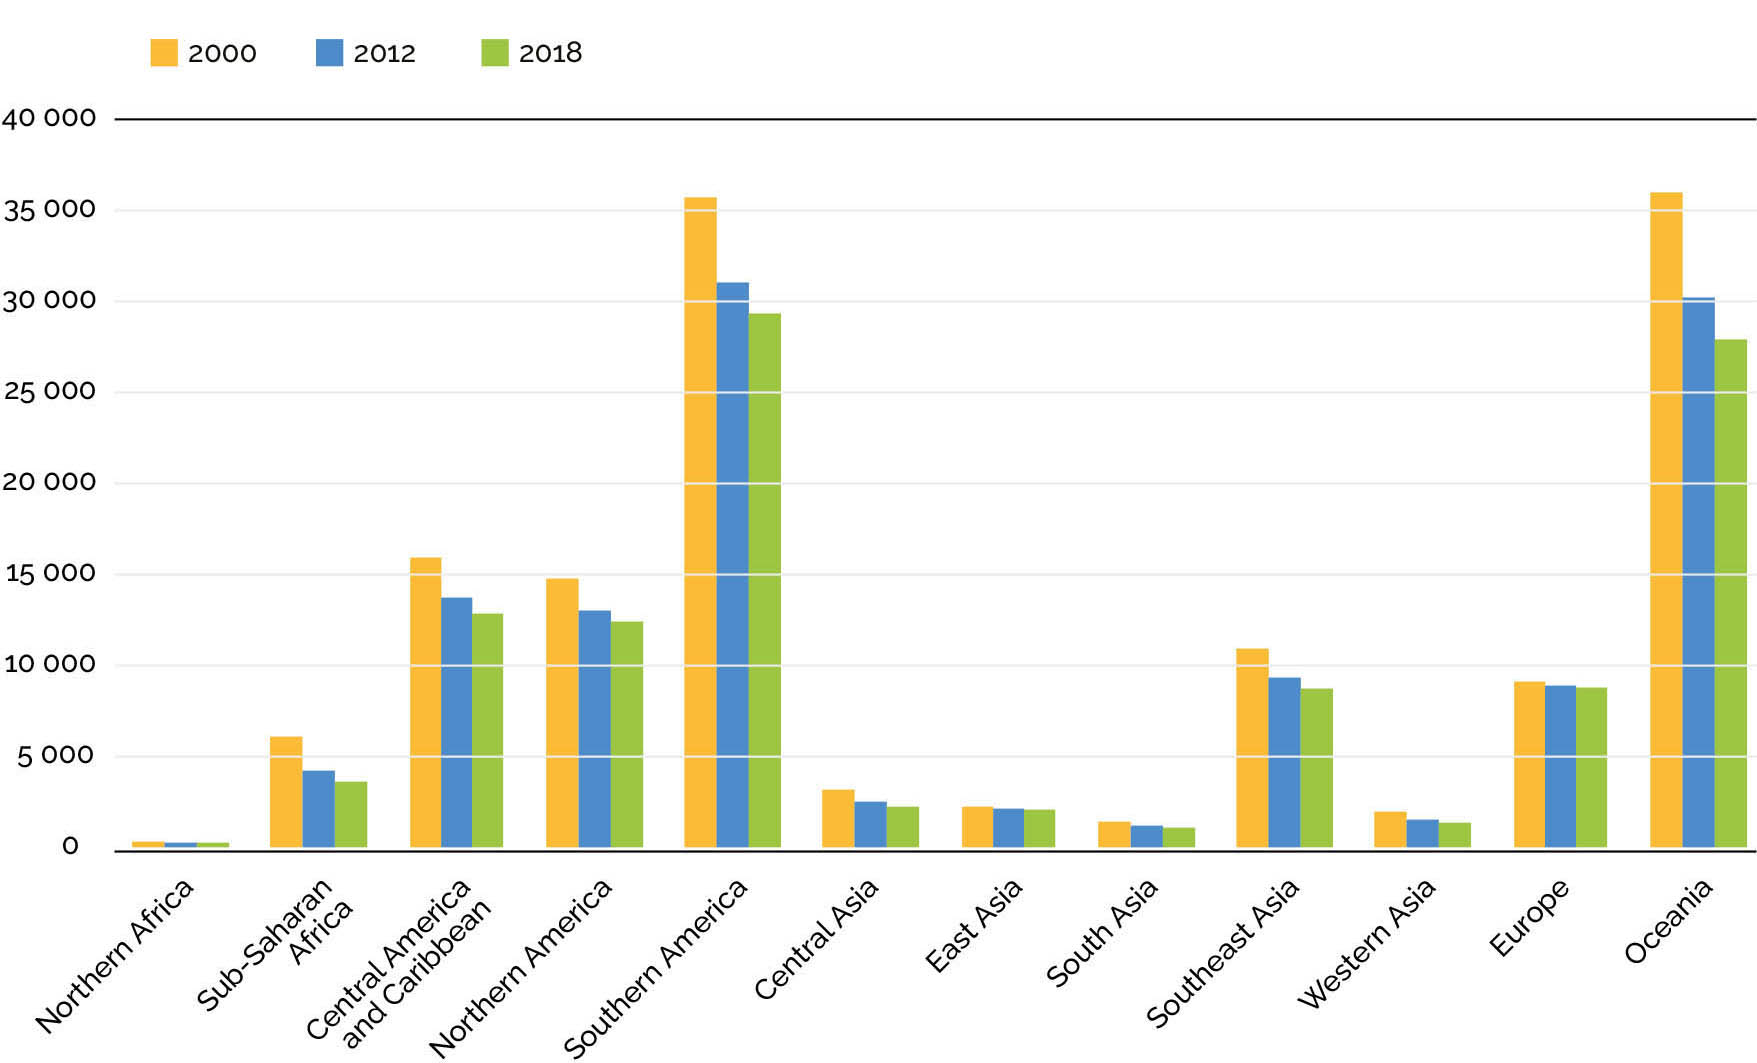
Total water withdrawals per capita declined from 2000 to 2018, except in Central America and the Caribbean, Southern America and Southeast Asia (Figure S.6). These trends are expected to persist as populations grow, partly due to overall increases in water productivity, including agriculture, and partly due to the prevalence of water scarcity induced by extended periods of aridity in areas of high population density.
1.3.3 Groundwater depletion
Global groundwater withdrawals for irrigated agriculture are estimated at 820 km3/year based on aggregated country-level reporting for 2018. This represents a 19 percent increase relative to 2010, when an estimated 688 km3 was withdrawn for irrigated agriculture. Groundwater withdrawals for irrigated agriculture account for over 30 percent of agriculture’s freshwater withdrawals and continue to grow at around 2.2 percent/year. The proportion of incremental evapotranspiration (consumption) over irrigated areas that can be attributed to groundwater is estimated at 43 percent due to the much lower conveyance losses associated with groundwater-sourced irrigation.
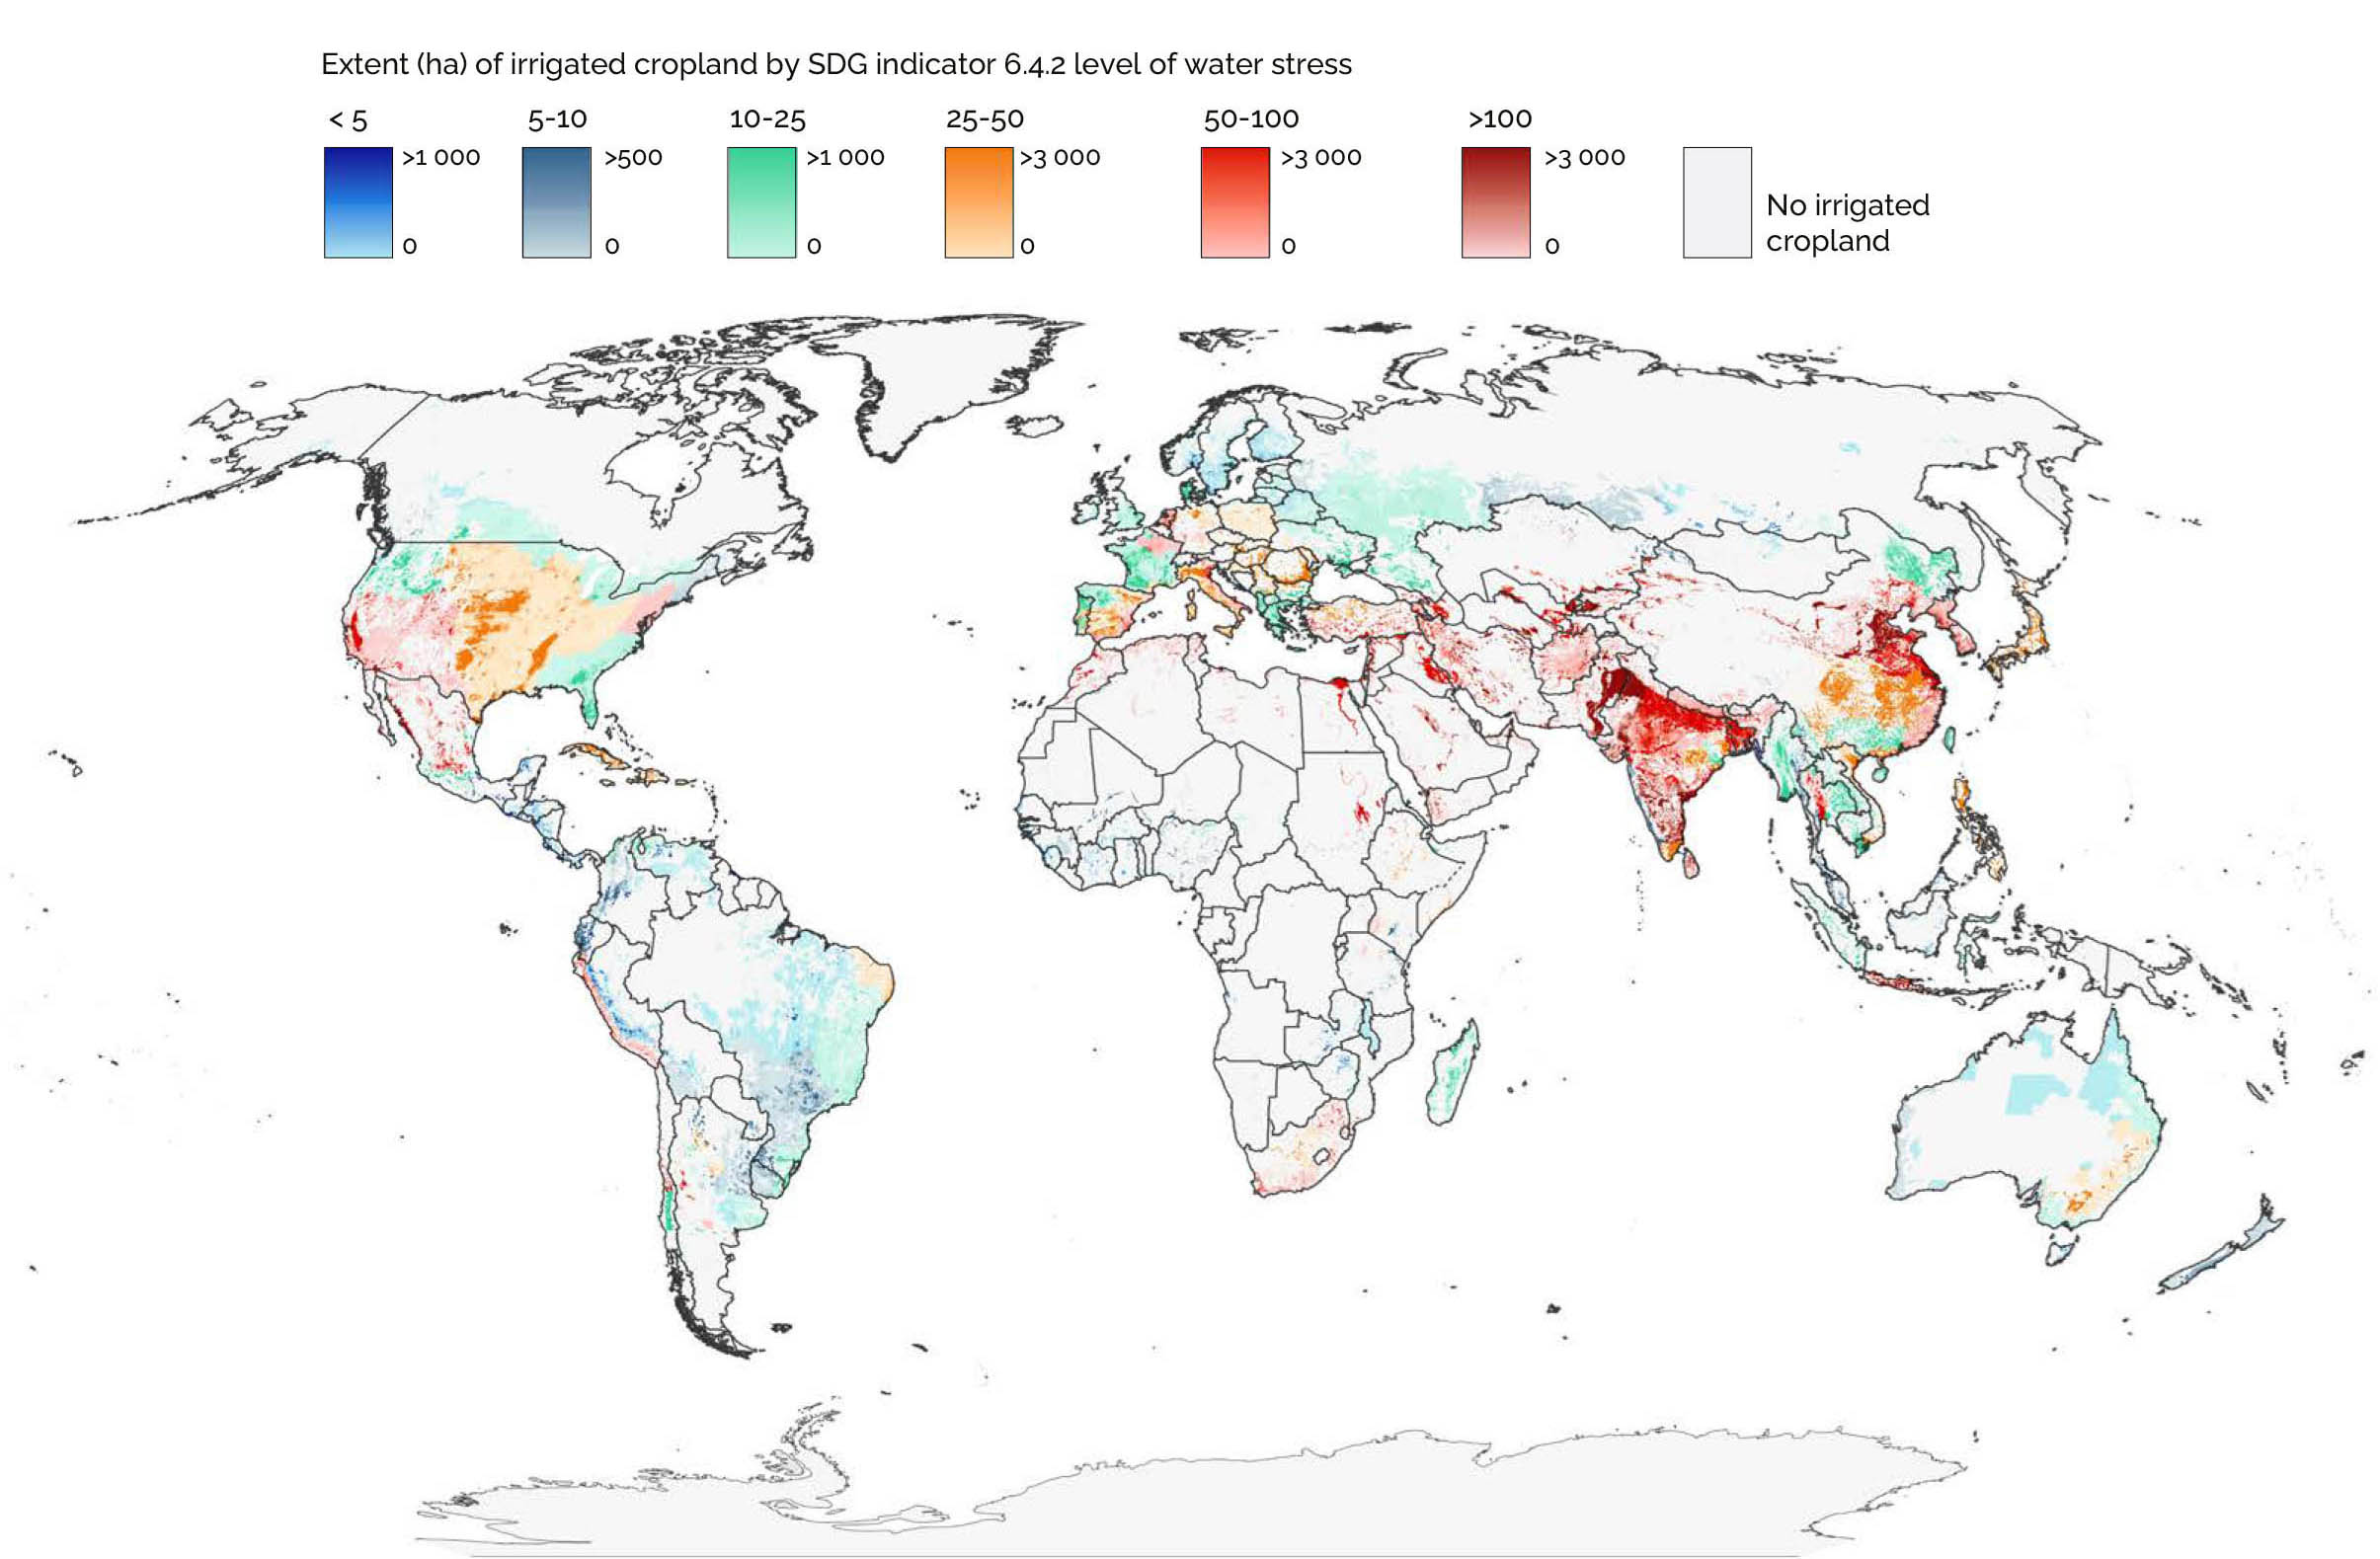
Groundwater use is already constrained. It is intensively exploited in most principal continental aquifers and along highly productive coastal plains, where saline intrusion is a constant threat. Irrigated areas under stress correlate strongly with intensive groundwater use and depleting aquifers (Map S.10).
This level of groundwater exploitation is considered responsible for the loss of aquifer storage of 250 km3/year, and more importantly, loss of aquifer function and utility to farmers as groundwater levels drop. Local impacts on production and livelihoods can be severe in aquifers that receive little or no recharge. Modelling the impact on irrigated crop production indicates that groundwater depletion will continue to place severe constraints in East Asia, the Middle East–Western Asia, Northern America and South Asia.
- 1 The SDG indicator 6.4.2 measures the level of water stress and is defined as the ratio of total fresh water withdrawn by all major sectors (agricultural, industrial and municipal) to total renewable freshwater resources, after considering environmental flow requirements. A ratio of 0–25 percent indicates no stress; 25–50 percent indicates low stress; 50–75 percent indicates medium stress; 75–100 percent indicates high stress; and more than 100 percent indicates critical stress.