2 Socio-economic drivers of demand for land and water
2.3 Patterns of landholding are skewed
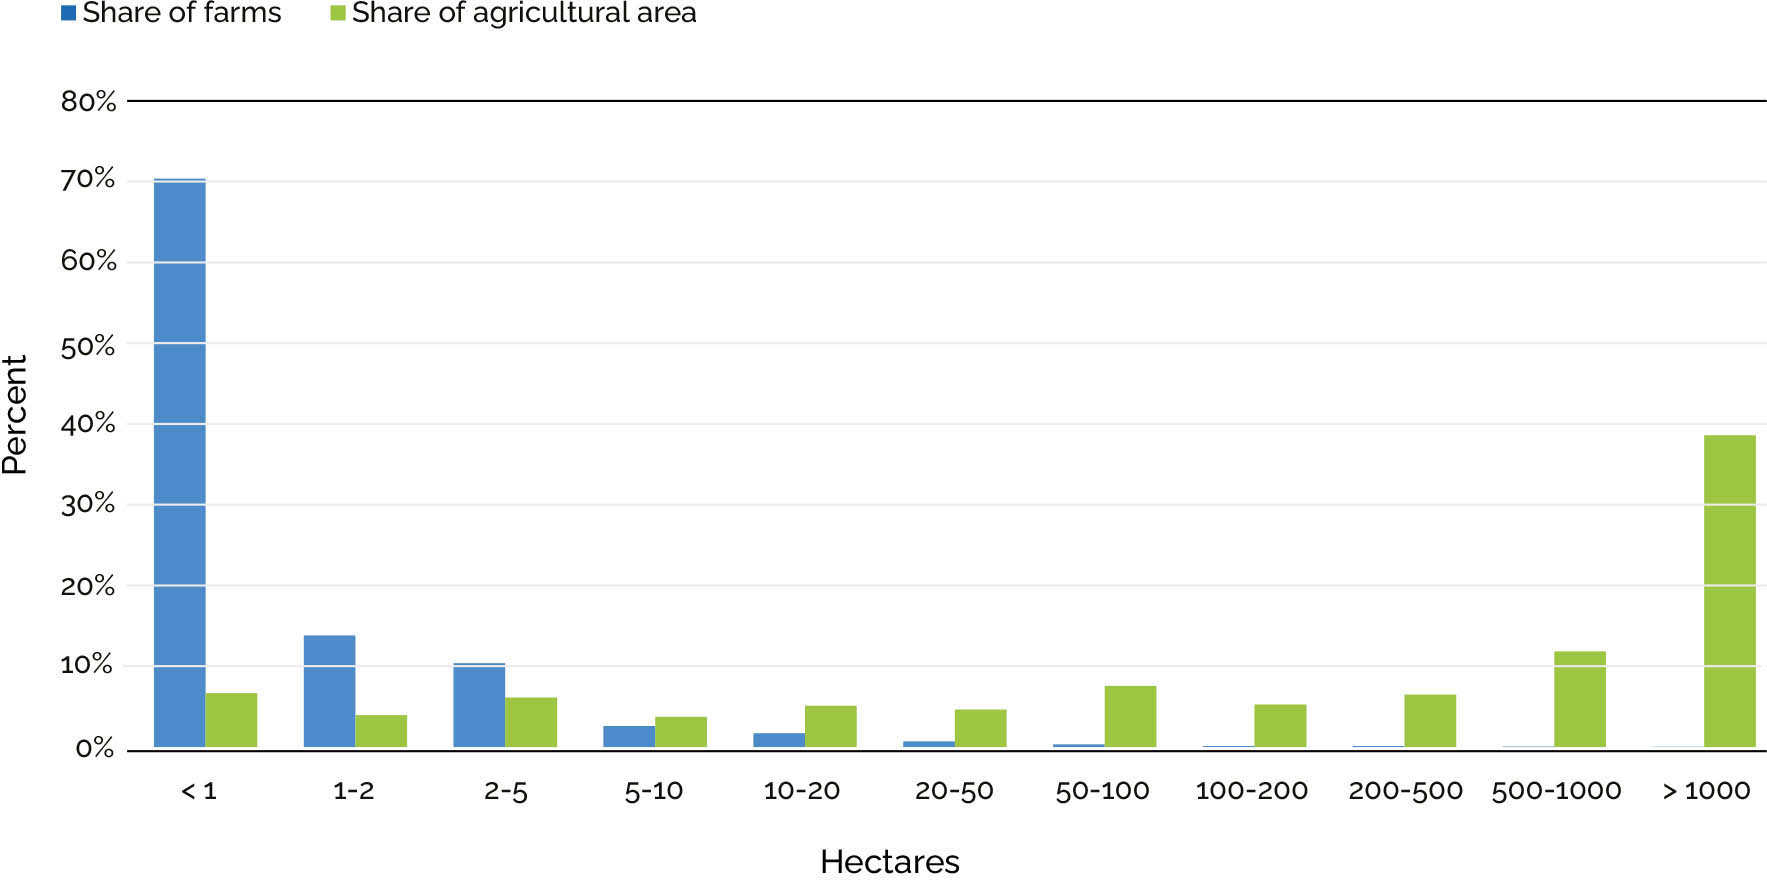
Although there are an estimated 608 million farm holdings in the world, farm size distribution is highly skewed towards large farms, with farms bigger than 500 ha accounting for more than 50 percent of total agricultural area. (Figure S.8). However, the number of farms is highly skewed towards smallholdings, with 84 percent of farms being below 2 ha, which occupy only 12 percent of the world’s farmland. Thus, policy interventions for land management need to address the increasing concentration of land under a relatively small number of large commercial farming enterprises as much as the millions of smallholders with 2 ha or less. Their continued viability is critical for local food security in many low-income countries.
Between 1960 and 2010, the average farm size decreased in nearly all low- and lower middle-income countries and increased in a third of middle-income and nearly all high-income countries. However, there was a slight increase in average farm size in low-income countries from 2000 to 2010. In many low- and lower middle-income countries of Africa and South Asia, average farm size is shrinking, with implications for economic viability.
Increased concentration of farmland among larger farms in countries with higher income levels is occurring in most of the larger European countries (except Spain), and in Brazil and the United States of America. There is increased inequality with an apparent re-emergence of small farms, while the share of farmland on the largest holdings has increased. In 2010, the average farm size was 1.3 ha in low-income countries, 17 ha in lower middle-income countries, 23.8 ha in upper middle-income countries (excluding China) and 53.7 ha in high-income countries.