3 Challenges Run Deep
3.2 Looking to the future
FAO estimates that by 2050, agriculture will need to produce almost 50 percent more food, fibre and biofuel than in 2012. Agricultural production in South Asia and sub-Saharan Africa will need to more than double (increase of 112 percent) to meet estimated calorific requirements. The rest of the world will need to produce at least 30 percent more. Achieving this will mean increasing crop yields and cropping intensities as well as diversifying crop varieties. There will be trade-offs among nutritional value, crop productivity and climate resilience because there are limited options for expanding the cultivated area.
The SOLAW 2011 report identified a wide range of risks to the overall performance of productive land and water systems. The main focus in the SOLAW 2021 report is on the most-prominent risks: land and soil degradation, water scarcity associated with agricultural withdrawals and pollution from land.
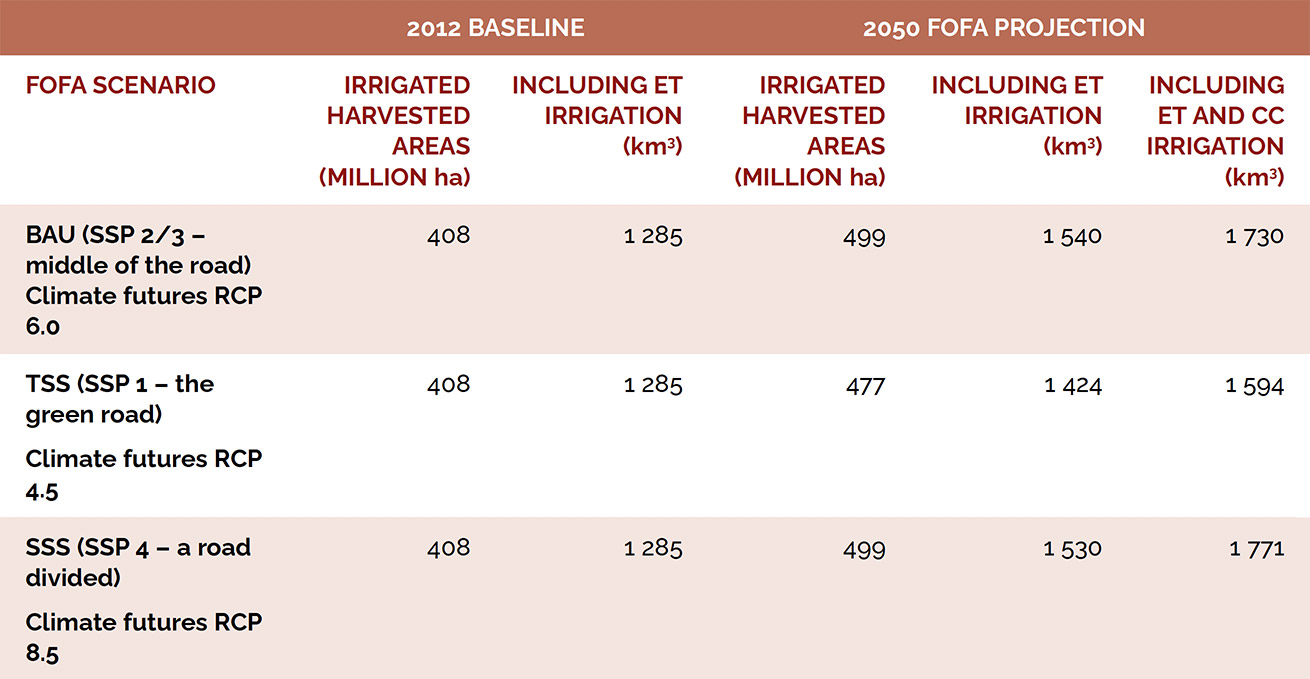
The FAO future of food and agriculture (FOFA) foresight scenarios for cropland apply a set of technical improvements and climate change drivers to arrive at harvested areas of crop production to satisfy food balance sheets by 2030 and 2050. The projections for harvested areas on rainfed and irrigated land generate demand for land and water resources under three scenarios (Box S.2).
Box S.2 FAO foresight scenarios from a land- and water-use perspective
Business as usual (BAU): Climate futures, RCP 6.0 and SSP 2/3 (“middle of the road”)
Arable land (the physical area under temporary and permanent agricultural crops) expands at faster annual rates than in the last decades, and land degradation is only partially addressed. Land intensity, the quantity of land per unit of output, decreases as crop and animal yields increase, but these achievements require the progressive use of chemicals. Deforestation and unsustainable raw material extraction continue while water efficiency improves, but the lack of significant changes in technology leads to the emergence of more water-stressed countries.
Towards sustainability (TSS): Climate futures, RCP 4.5 and SSP 1 (“green road”)
Low-input processes lead water intensity to decrease substantially and energy intensity to substantially improve against the levels seen under the BAU scenario. Land-use intensity, the quantity of land per unit of output, drops compared to current levels, thanks to sustainable agricultural intensification and other practices to improve resource efficiency. This helps to preserve soil quality and restore degraded and eroded land. Agricultural land is no longer substantially expanded, and land degradation is addressed. Water abstraction is limited to a smaller fraction of available water resources.
Stratified societies (SSS): Climate futures, RCP 8.5 and SSP 4 (“a road divided”)
The world suffers further deforestation. New agricultural land is used to compensate for increased degradation and satisfy additional agricultural demand, which is left unmanaged. The quantity of land per unit of output decreases for commercial agriculture but remains stable or increases for family farmers, who increasingly suffer from crop losses fuelled by extreme climate events. Water use is not sustainable in many regions, and there is little investment towards water-use efficiency. Climate change exacerbates water and land constraints.
Notes
Harvested areas and yield differentials for each cropping system (irrigated and rainfed)
Data on harvested areas are used to calculate the shares of irrigated and rainfed production systems by crop and yield differentials between the two systems in the base year. The FAO and the International Institute for Applied Systems Analysis Global Agro-Ecological Zones (GAEZ) data portal includes geospatial data sets consistent with country-level FAO statistical database (FAOSTAT) data on harvested areas, yields and crop production. These are derived by disaggregating (“downscaling”) country-level FAOSTAT production data for the period 2009–2011 to pixel level using an iterative rebalancing approach that ensures matching country totals. The assignment of crops and crop systems to each pixel is based on the FAO Global Land Cover Share, which provides high-resolution land-cover data, geospatial data on land equipped for irrigation (Global Map of Irrigated Areas, available at www.fao.org/nr/water/aquastat/irrigationmap/index.stm) and other data sets.
Land areas
Data on land cover are used to estimate the amount of suitable land available in the future under alternative climate scenarios. The GAEZ data portal includes pixel-level data on protected areas, based on a recent version of the World Database of Protected Areas, a comprehensive global data set of marine and terrestrial protected areas that includes those under the International Union for the Conservation of Nature such as nature reserves and national parks, protected areas with an international designation status, such as World Heritage and Ramsar Wetland areas, and those with national protection status. The land-suitability assessment does not account for land productivity changing over time due to natural or human-induced degradation and may overestimate potential land availability.
Source: FAO, 2018.
When harvested area projections for irrigated and rainfed production are converted to arable land requirements, the cultivated area under the BAU scenario would need to grow from 1 567 million ha in 2012 to 1 690 million ha by 2030 and 1 732 million ha by 2050. Based on expected yield growth and cropping intensities, satisfying the food balance sheets would require the cropland area to expand by 165 million ha by 2050. The BAU scenario projects irrigated harvested areas to increase by 91 million ha by 2050 (Table S.6), indicating an annual growth rate of only 0.14 percent. This represents a significant slowdown, compared to the period 1961–2009, when the global area under irrigation grew at an annual rate of 1.6 percent and more than 2 percent in the poorest countries. Most expansion of irrigated land is likely to take place in low-income countries. Under the BAU scenario, irrigated areas would need to increase their contribution to total production value from 42 percent in 2012 to 46 percent by 2050.
Source: SOLAW 2021 background studies.
The water resource implications for this growth have been modelled for the SOLAW 2021 report. They indicate evapotranspiration would increase from 1 285 km3 in 2012 to 1 540 km3 by 2050 without climate change and to 1 730 km3 with climate change (Table S.6). Taking account of water requirements for land preparation and leaching, plus conveyance losses from withdrawal to consumption, would push annual gross agricultural withdrawals towards 3 500 km3.