
Data presented in this section are sourced from FAO Food Balance Sheets (FBS) spanning from 1961. The balance sheets allow an estimation of the amount of food available for human consumption (apparent consumption) expressed in live weight equivalent, rather than the actual quantity of food consumed (effective consumption).
Trends in total apparent consumption of aquatic animal foods
In 2021,u global apparent consumption of aquatic animal foods (i.e. excluding algae) surged to an estimated 162 million tonnes (live weight equivalent) (Table 11), marking a substantial increase from 28 million tonnes in 1961. Historically, Europe, Japan and the United States of America have accounted for a significant portion of the global amount of aquatic animal foods available for human consumption. In 1961, their collective share was 47 percent of the world supply. However, by 2021, their combined share had dropped to 18 percent. Meanwhile, China, Indonesia and India experienced significant increases in their shares of global consumption of aquatic animal foods. While collectively representing only 17 percent in 1961, their combined share had surged to 51 percent by 2021, with China alone representing 36 percent. The notable decline in the prominence of historical countries for consumption of aquatic animal foods can be attributed to structural shifts in the sector. These shifts encompass the influence of Asian countries in fisheries and aquaculture production, in addition to the increasing urbanization and rising proportion of middle-class citizens in Asia. In 2021, Asia accounted for 71 percent of global consumption of aquatic animal foods, followed by Europe (10 percent), Africa (8 percent), Northern America (5 percent), Latin America and the Caribbean (4 percent) and Oceania (1 percent). Although Europe and Africa account for similar shares of global consumption, their population sizes are significantly different, resulting in notable differences in per capita consumption.
TABLE 11TOTAL AND PER CAPITA APPARENT CONSUMPTION OF AQUATIC ANIMAL FOODS BY REGION AND ECONOMIC CLASS, 2021

SOURCES: Preliminary data. Final data available here: FAO. 2024. Consumption of aquatic products. https://www.fao.org/fishery/en/collection/global_fish_consump. Licence: CC-BY-4.0.
Population data are based on United Nations Population Division. 2022. World Population Prospects 2022. [Accessed 13 January 2023]. https://population.un.org/wpp.
For sixty years, the global amount of aquatic animal foods available for human consumption has increased at a significantly higher rate than world population growth, resulting in a rise in consumption per capita (Figure 36). Between 1961 and 2021, the average annual growth rate of global consumption of aquatic animal foods was 3.0 percent, outpacing the annual population growth rate of 1.6 percent. Africa and Asia experienced the strongest consumption growth rates: 3.8 percent and 3.7 percent per year, respectively.
FIGURE 36APPARENT CONSUMPTION OF AQUATIC ANIMAL FOODS BY REGION, 1961–2021

SOURCES: Preliminary data. Final data available here: FAO. 2024. Consumption of aquatic products. https://www.fao.org/fishery/en/collection/global_fish_consump. Licence: CC-BY-4.0.
Population data are based on United Nations Population Division. 2022. World Population Prospects 2022. [Accessed 13 January 2023]. https://population.un.org/wpp
Furthermore, in the same period, the consumption of aquatic animal foods exhibited more robust growth than all terrestrial meats combined, which had an estimated average growth rate of 2.7 percent per year. Likewise, it outpaced that of individual meat categories such as bovine, sheep and goat, and pig; the exception was poultry meat, which experienced a higher growth rate of 4.7 percent per year.
Trends in apparent consumption per capita of aquatic animal foods
Globally, annual per capita apparent consumption of aquatic animal foods was estimated at 20.6 kg (live weight equivalent) in 2021, with preliminary estimates for 2022 currently standing at 20.7 kg. High food price inflation in many of the main consuming countries and limited growth in fisheries and aquaculture production are the main drivers for this limited growth.
However, the world average masks differences across countries (Figure 37). Of the 227 countries and territories for which FAO estimated the per capita consumption of aquatic animal foods, 135 were below the world average and 92 above it in 2021. Differences between countries can be attributed to diverse factors, in particular the availability of and access to aquatic and other foods. This availability is influenced by various factors such as proximity and access to aquaculture facilities, landing sites and markets. Moreover, differences in prices, income levels, nutritional awareness, culinary traditions, food habits and consumer preferences further contribute to this variation. For instance, in low-income countries, the per capita apparent consumption of aquatic animal foods averaged 5.3 kg in 2021, compared with 12.5 kg in lower-middle-income countries, 30.6 kg in upper-middle-income countries and 26.7 kg in high-income countries.
FIGURE 37APPARENT CONSUMPTION OF AQUATIC ANIMAL FOODS PER CAPITA, AVERAGE 2019–2021
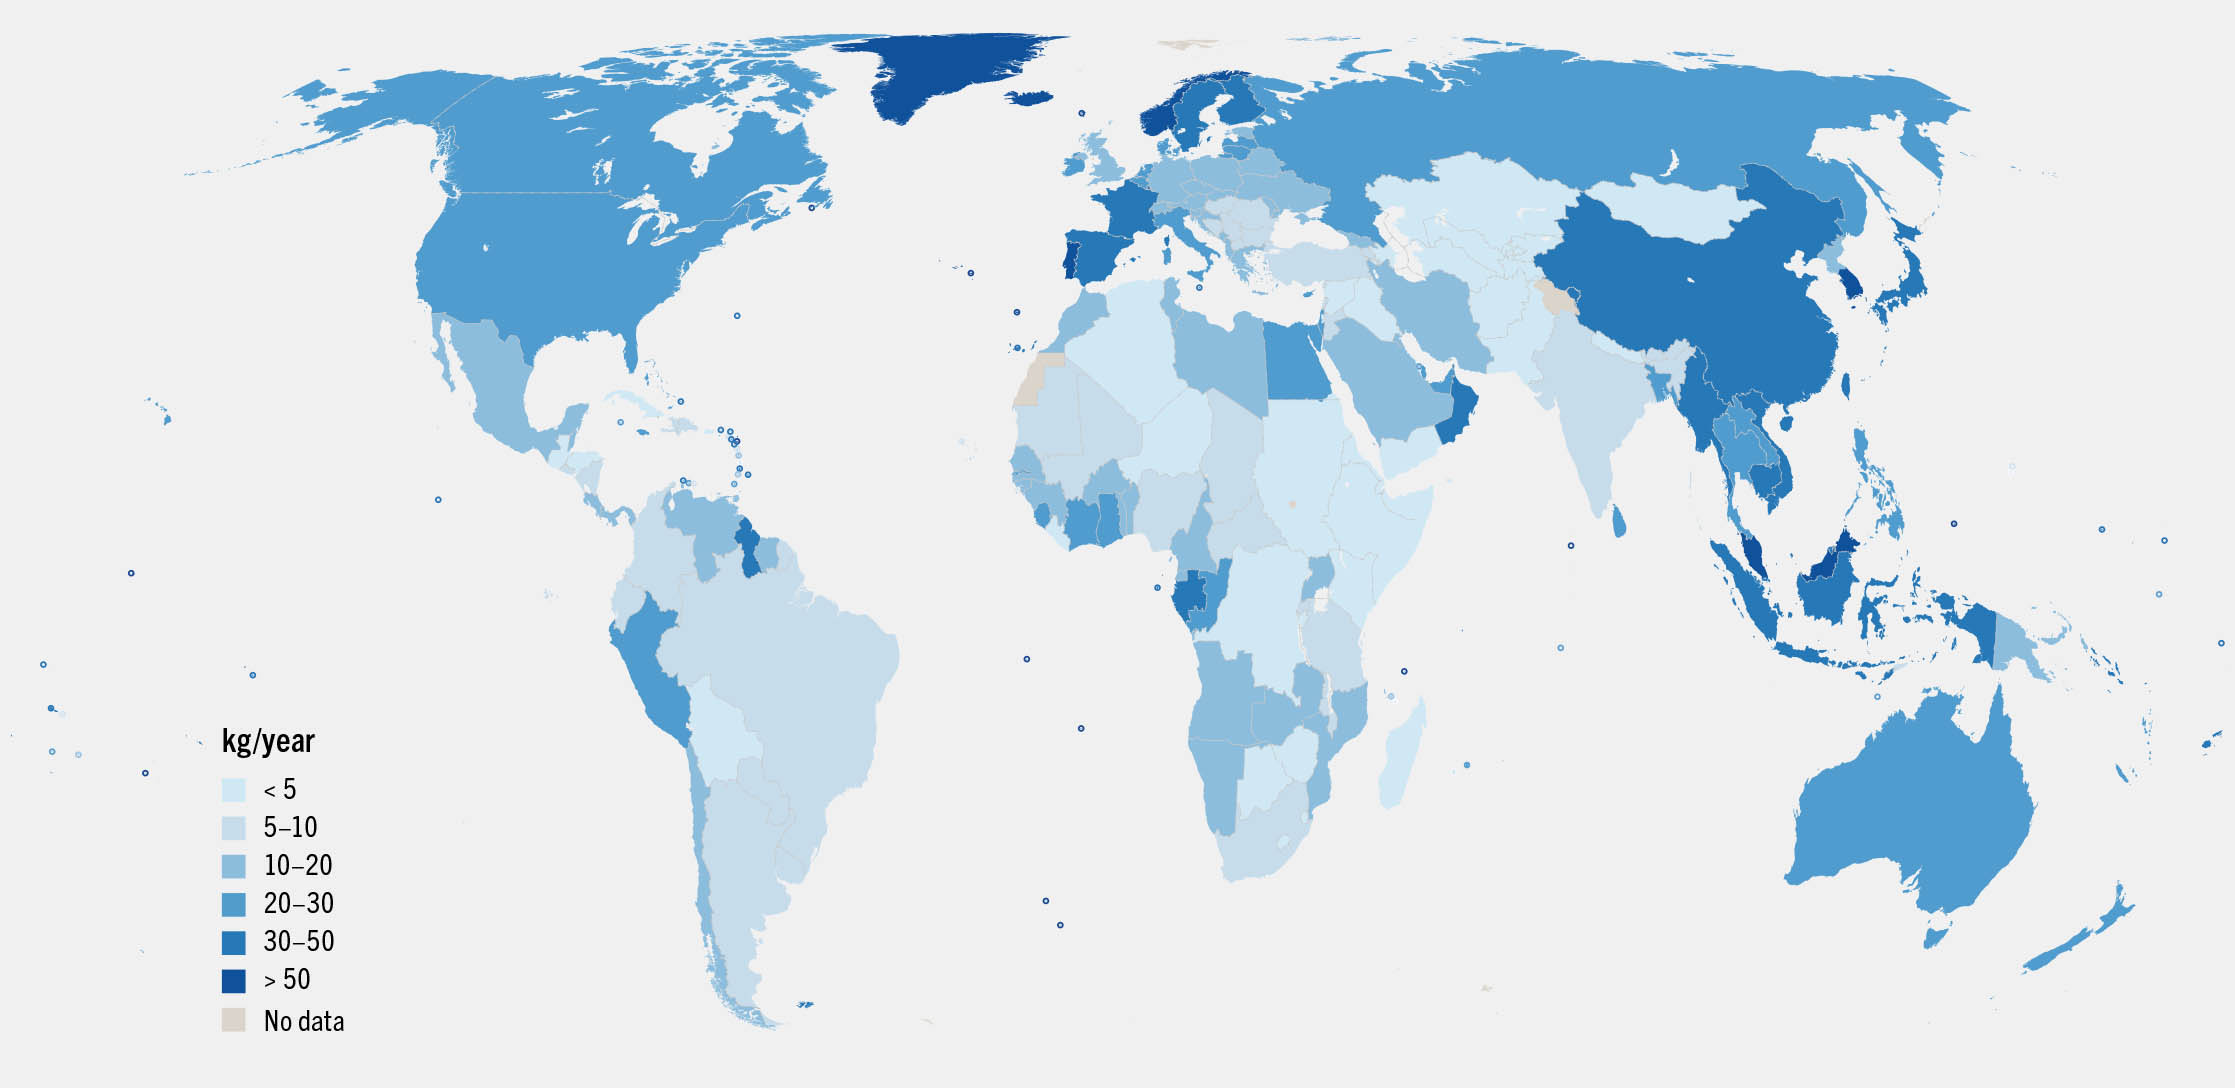
NOTES: Food for human consumption originating from animals grown in, or harvested from, water. It includes food from all types of aquatic animals, with the exception of aquatic mammals and reptiles. Data expressed in live weight equivalent.
SOURCES: Preliminary data. Final data available here: FAO. 2024. Consumption of aquatic products. https://www.fao.org/fishery/en/collection/global_fish_consump. Licence: CC-BY-4.0.
Population data are based on United Nations Population Division. 2022. World Population Prospects 2022. [Accessed 13 January 2023]. https://population.un.org/wpp
United Nations Geospatial. 2020. Map geodata.
During 1961–2021, apparent consumption per capita of aquatic animal foods increased at an average rate of about 1.4 percent per year, from 9.1 kg in 1961 to 20.6 kg in 2021. Japan was the most notable exception, with a decrease from 50.2 kg in 1961 to 43.1 kg in 2021. However, the rate of growth varied greatly across regions (Figure 38) and countries. Asia experienced the strongest annual growth rate (1.9 percent), followed by Latin America and the Caribbean (1.3 percent) and Africa (1.1 percent). China was the major driver for this growth, reflecting the expansion of its capture fisheries and aquaculture production. Its apparent consumption per capita grew from 4.3 kg in 1961 to 41.6 kg in 2021, an increase of 3.8 percent per year on average. Despite a relatively strong growth rate, Africa’s per capita consumption of aquatic animal foods has remained lower than in other regions. Conversely, Europe, Northern America and Oceania experienced the slowest growth rates in per capita consumption of aquatic animal foods, rising at an average annual rate of 0.7 to 0.9 percent. These regions have already high levels of per capita consumption of aquatic animal foods.
FIGURE 38APPARENT CONSUMPTION OF AQUATIC ANIMAL FOODS PER CAPITA BY REGION, 1961–2021

SOURCES: Preliminary data. Final data available here: FAO. 2024. Consumption of aquatic products. https://www.fao.org/fishery/en/collection/global_fish_consump. Licence: CC-BY-4.0.
Population data are based on United Nations Population Division. 2022. World Population Prospects 2022. [Accessed 13 January 2023]. https://population.un.org/wpp
The main factors driving the long-term upward trend in per capita consumption of aquatic animal foods, in addition to increased production, include urbanization, rising income levels, and demographic changes (e.g. smaller family size), all of which influence changes in dietary habits. Over time, the world has been increasingly urbanized, with the urban population increasing from 34 percent to 57 percent of the world population between 1961 and 2021 (FAO et al., 2023). Urbanization represents a multifaceted phenomenon, not only indicating an increase in urban residents and the expansion of urban infrastructure, but also triggering profound shifts in societal norms, cultural practices, and lifestyles, including dietary patterns. Traditionally, rural populations have tended to adhere to plant-based diets rich in grains, fruits and vegetables, and with low fat content. However, rural people migrating to urban areas often experience a shift towards diets that rely more on processed foods characterized by a higher content of energy, sugars, refined grains, and fats; furthermore, urban residents tend to consume diets with a greater proportion of animal proteins. Indeed, urban residents typically have reduced time available for at-home food preparation combined with increased disposable income, facilitating access to convenience foods and ready-to-eat meals. From 1961 to 2021, average world gross domestic product per capita experienced steady growth, with low- and middle-income countries exhibiting more pronounced increases than high-income countries.
Despite this overall upward trend, there have been a few instances of decline in per capita consumption of aquatic animal foods since 1961. Notably, such a decline occurred in 2020 when per capita consumption of aquatic animal foods decreased by 1.3 percent, falling from 20.5 kg in 2019 to 20.2 kg. This reduction was largely attributed to the effects of the COVID-19 pandemic, which resulted in stable global fisheries and aquaculture production and a decrease in traded volumes. The resulting drop in per capita consumption was strongest in Oceania (−5.3 percent), followed by Africa (−4.0 percent), Europe (−3.3 percent), Northern America (−2.9 percent), Asia (−0.4 percent) and Latin America and the Caribbean (−0.3 percent). In 2021, per capita consumption of aquatic animal foods increased at the global level, yet about half of the countries remained below pre-pandemic levels.
The COVID-19 pandemic resulted in reduced per capita consumption not only of aquatic animal foods but of all animal foods. The pandemic resulted in an estimated increase of nearly 90 million people experiencing hunger from 2019 to 2020. The impact was especially acute in low- and lower-middle-income countries and among disadvantaged populations worldwide, not due to actual food shortages, but because of income losses incurred at the peak of the pandemic (FAO et al., 2023).
Nutritional benefits of aquatic animal foods
Aquatic animal foods, with their diverse and valuable nutritional attributes, can contribute to reducing food and nutrition insecurity and tackling many forms of malnutrition, providing high-quality nutrients with a moderate energy contribution. Even small quantities of aquatic animal foods can provide essential nutrients for a healthy diet. They provide high-quality proteins and essential amino acids, vitamins (particularly B and D), and minerals such as calcium, zinc, iron, iodine, magnesium, potassium, phosphorus and selenium. Species such as sardines, mackerels, salmon and tuna are good sources of omega-3 fatty acids. Moreover, consuming the entire fish including the head, bones and skin can maximize nutritional benefits and reduce waste, contributing to global food security (see Box 44, p. 192 and Aquatic foods: an untapped potential for healthy diets, p. 191).
Aquatic animal foods contributed at least 20 percent of the per capita protein supply from all animal sources to 3.2 billion people – that is over 40 percent of the world’s population. Globally, aquatic animal foods supplied 15 percent of animal proteins and 6 percent of all proteins in 2021. However, the extent of their contribution varies from country to country (Figure 39), with non-high-income countries generally relying more heavily on proteins from aquatic animal foods, compared with high-income countries. This reflects their affordability, availability and accessibility, making them a staple in many culinary traditions. In 2021, aquatic animal foods accounted for 14 percent of animal proteins in low-income countries, 18 percent in lower-middle-income countries, 17 percent in upper-middle-income countries, and 10 percent in high-income countries.
FIGURE 39CONTRIBUTION OF AQUATIC ANIMAL FOODS TO ANIMAL PROTEIN SUPPLY PER CAPITA, AVERAGE 2019–2021

SOURCES: Preliminary data. Final data available here: FAO. 2024. Consumption of aquatic products. https://www.fao.org/fishery/en/collection/global_fish_consump. Licence: CC-BY-4.0.
Population data are based on United Nations Population Division. 2022. World Population Prospects 2022. [Accessed 13 January 2023]. https://population.un.org/wpp
United Nations Geospatial. 2020. Map geodata.
Despite the fact that apparent consumption of aquatic animal foods per capita was significantly lower in low-income than in high-income countries in 2021, aquatic animal foods contributed to a greater share of animal protein supply in low-income than in high-income countries (Figure 40). Similarly, apparent consumption of aquatic animal foods per capita averaged 9.4 kg in Africa in 2021, representing the lowest figure across regions, while aquatic animal foods supplied 18 percent of animal proteins, a figure well above the world average.
FIGURE 40APPARENT CONSUMPTION OF AQUATIC ANIMAL FOODS PER CAPITA AND CONTRIBUTION TO SUPPLY OF ANIMAL PROTEINS BY ECONOMIC CLASS, 2021

Population data are based on United Nations Population Division. 2022. World Population Prospects 2022. [Accessed 13 January 2023].
https://population.un.org/wpp
Enhancement of the FAO Food Balance Sheets on aquatic foods (Box 4) has made it possible to provide data on 22 additional macro- and micronutrients for aquatic foods, of which 13 are also available for all other food products, enabling comparisons between different food groups.
BOX 4ENHANCEMENT OF FAO’S FOOD BALANCE SHEETS ON AQUATIC PRODUCTS
Since the 1960s, FAO has annually compiled Food Balance Sheet (FBS) statistics for aquatic products across 227 countries and territories, providing a comprehensive overview of each country’s supply and utilization of aquatic foods. The latest FBS dataset released in 2023 includes revised time series due to updated population estimates and data on nutritional composition. These revisions were also implemented in FBS calculated by FAO for other foods. The population data were updated using the World Population Prospects published by the United Nations Population Division in 2022. These updates led to revisions of the per capita series, for the historical trends and absolute numbers.
The nutritional composition values used to convert food supply into calories, protein and fats were revised and their scope was expanded to include vitamins and minerals. FAO developed the global nutrient conversion table for FAO supply utilization accounts (Grande et al., 2024), which presents average nutrient profiles drawing data from 13 high-quality national and regional food composition tables. This global resource covers a total of 530 food items – 435 food items for crops and livestock and 95 food items for aquatic products. Moreover, to improve our understanding of the nutritional value of aquatic foods beyond calories, protein and total fats, nutritional conversion factors for aquatic foods were calculated for 22 additional macro- and micronutrients. As a result, the supply of aquatic foods can now also be expressed in terms of available carbohydrates, dietary fibre, calcium, iron, magnesium, potassium, phosphorus, zinc, copper, selenium, riboflavin, vitamin C, vitamin A (in RE and RAE),* thiamin, vitamin B6, vitamin B12, total saturated fatty acids, total monounsaturated fatty acids, total polyunsaturated fatty acids, docosahexaenoic acid and eicosapentaenoic acid. For all other food products, nutritional composition values are available for 13 out of the 22 new macro- and micronutrients, with plans underway to include the remaining nine nutrients.

© Alex Webb/Magnum Photos for FAO
The revision of the calorie and protein composition values had a minimal effect on the overall calories and protein provided by aquatic animal foods. On the other hand, the quantity of fats supplied by aquatic animal foods was seen to increase. This could be indicative of advancements in analytical techniques for measuring fat content in foods, increased data availability for aquatic animal foods across various food composition tables, and shifts in the production methods of aquatic animal foods. Among the different species groups, freshwater and diadromous fish experienced the most notable change in fat supply following the update; this is the species group that has the highest proportion of production originating from aquaculture.
These newly updated data are accessible under the Food and Diet domain of FAOSTAT.** Data on aquatic animal foods are aggregated under the food group “Fish, shellfish and their products” and can be compared with other food groups, except for nutrients currently exclusively available for aquatic foods.***
** The FAOSTAT Food and Diet domain can be accessed at: https://www.fao.org/faostat/en/#data/SUA
*** For further information on the FAOSTAT Food and Diet domain, see: https://www.fao.org/documents/card/en/c/cc9454en
SOURCE: Grande, F., Ueda, Y., Masangwi, S. & Holmes, B. 2024. Global nutrient conversion table for FAO supply utilization accounts. Rome, FAO. https://doi.org/10.4060/cc9678en
Globally, 6 percent of riboflavin, 6 percent of thiamin, 8 percent of calcium, 8 percent of vitamin C, 9 percent of vitamin A, 11 percent of zinc, 12 percent of iron, 13 percent of phosphorus, 13 percent of potassium and 17 percent of magnesium supplied by animal products were from aquatic animal products. However, notable variations exist among countries. For example, in Botswana, the contribution of aquatic animal foods to the nutrient supply sourced from animal products was very low, ranging from 0 percent for vitamin C to a mere 1 percent for magnesium. On the other hand, in Cambodia, the contribution of aquatic animal foods to the nutrient supply sourced from animal products ranged from 37 percent for thiamin to 74 percent for calcium.
Aquatic animal products are also valuable sources of fats, specifically unsaturated fatty acids, which are an essential component of a healthy diet. Aquatic animal products are rich in both monounsaturated and polyunsaturated (such as omega-3 fatty acids) fats. Omega-3 fatty acids, particularly eicosapentaenoic acid (EPA) and docosahexaenoic acid (DHA), are vital for human health, in particular the structural composition of cell membranes, the optimal development of a baby’s brain and nervous system, and the healthy functioning of the cardiovascular system. Since the human body cannot produce these fatty acids on its own, they must be obtained through diet.
Available data on the per capita supply of monounsaturated and polyunsaturated fats derived from aquatic animal foods reveal significant variations across countries and regions. For example, Iceland, Palau and Kiribati ranked highest in per capita supply of these fats, while Afghanistan, Ethiopia and Eritrea registered levels close to zero. At regional level, Africa, Latin America and the Caribbean and Northern America ranked lowest in per capita supply of these fats, while Asia, Europe and Oceania ranked highest. While differences in the quantities of aquatic animal foods consumed partly explain these variations, the types of aquatic animal foods also play a role. For instance, the apparent consumption of aquatic animal foods was estimated at 23.4 kg per capita in Northern America, higher than in Europe (estimated at 22.2 kg). Despite this, the supply of monounsaturated and polyunsaturated fats from aquatic animal foods in Northern America was 0.7 grams per capita per day – less than in Europe (estimated at 1.0 gram per capita per day).
Evolution of species composition of aquatic animal foods
Since the late 1990s, capture fisheries production has remained relatively stagnant, while there has been a significant increase in aquaculture production, driving the surge in apparent consumption of aquatic animal foods. As a result, the proportion of aquatic animal foods originating from aquaculture production has risen significantly, jumping from 6 percent in the 1960s to 56 percent in 2021, causing a shift in the species composition. Preliminary data point to a further growth to 57 percent in 2022. These figures represent available food in live weight equivalent and do not take into account that bivalves and crustaceans, which contain substantial amounts of inedible parts, represent a higher share of aquaculture than of capture fisheries production of aquatic animals (32 percent vs 8 percent in 2022). Therefore, it is likely that capture fisheries are still the main source of edible aquatic animal foods.v
Consumption has shifted away from finfish in favour of shellfish (Figure 41). The share of finfish in aquatic animal food consumption decreased from 86 percent in 1961 to 74 percent in 2021. Within finfish, the share of freshwater and diadromous species grew from 20 percent of the per capita consumption of finfish in 1961 to 55 percent in 2021. This reflects the increase in the production of farmed salmonoids, tilapia, carp and catfish over time. In parallel, the share of marine finfish species declined from 80 percent of the per capita consumption of finfish in 1961 to 45 percent in 2021, with the most significant declines registered for demersal and pelagic fish.
FIGURE 41APPARENT CONSUMPTION OF AQUATIC ANIMAL FOODS BY MAIN SPECIES GROUP, 1961 AND 2021

The share of shellfish has risen over time and nowadays most shellfish, particularly molluscs and to a lesser extent crustaceans, are farmed. Shellfish accounted for 14 percent of aquatic animal food consumption in 1961, compared with 26 percent in 2021; within shellfish, the share of crustaceans rose at the expense of cephalopods, while molluscs maintained a stable share, accounting for nearly half of shellfish consumption.
Algae
Seaweeds and other algae are currently not included in the FAO Food Balance Sheets for aquatic foods due to insufficient data on their utilization across most countries. Nevertheless, seaweeds have been important for the daily diets of various countries, particularly in East Asia, for centuries. Seaweeds can represent a nutritious, healthy, high-fibre and low-calorie food option. In light of the growing global population and mounting environmental challenges, seaweed emerges as a sustainable solution for bolstering food security and restoring aquatic ecosystems. Unlike land-based crops, seaweed cultivation makes use of seawater, thereby avoiding competition for arable land and freshwater resources. Throughout Asia and other regions, seaweeds like nori, Japanese kelp and Eucheuma seaweeds nei have significant cultural and nutritional importance. These seaweeds are not only fundamental elements of local cuisines but are also highly valued for their rich micronutrient content. As such, they play a crucial role in shaping national culinary traditions and show potential as valuable contributors to global efforts to improve food security.
- u Consumption data for 2021 should be considered preliminary. These values could differ slightly from those to be released in the FBS section of the FAO Yearbook of Fishery and Aquaculture Statistics 2022, and in the FishStatJ workspace to be disseminated in 2024. The updated data will be available through the FAO website, available at: https://www.fao.org/fishery/en/fishstat
- v For more information, please refer to the 2022 edition of this report (FAO, 2022b, p. 88).


