
Estimate of the global fishing fleet and its regional distribution
In recent years, FAO has adopted improved data collection tools and analysis, resulting in a significant revision of the 1995–2022 data on fishing fleet, in particular in Asian countries. The largest increase was in Indonesia, due to improved data collection and the inclusion of inland fishing vessels, with an estimated total of 1.1 million fishing vessels reported in 2022, making it the largest fleet in the world. Updates were also reported by the Philippines and India. Thailand reported undecked vessels for the first time in 2021, increasing the reported fleet size from 20 000 to 70 000 vessels. As a result, the revised figures are higher than those reported previously, with the exception of 1995. These reported increases in the time series since 1995 should not be attributed to an increase in fleet size.
In light of these revisions, the world fishing fleet was estimated at 4.9 million vessels in 2022, with data showing a decreasing trend since the peak of 5.3 million reported in 2019. Among many fishing nations such as China, Japan and European Union Member States, the downward trend of the fleet size continues, reflecting efforts to improve fisheries sustainability. However, it should be highlighted that merely reducing the number of vessels in a fleet is not sufficient to guarantee improved sustainability outcomes.
Asia hosts the world’s largest fishing fleet, estimated at 3.5 million vessels or 71 percent of the global total in 2022 (Figure 22). This proportion is a drop from 73 percent in 2019. Africa’s fleet has been increasing relative to the rest of the world and represented over 19 percent of the world’s fishing vessels in 2022, up from 18 percent in 2019. The shares of Latin America and the Caribbean (5 percent), Northern America, Europe (both 2 percent) and Oceania (less than 1 percent) have not changed since 2019.
FIGURE 22PROPORTION OF FISHING VESSELS BY MOTORIZATION STATUS, GEOGRAPHICAL REGION AND INCOME GROUP, 2022
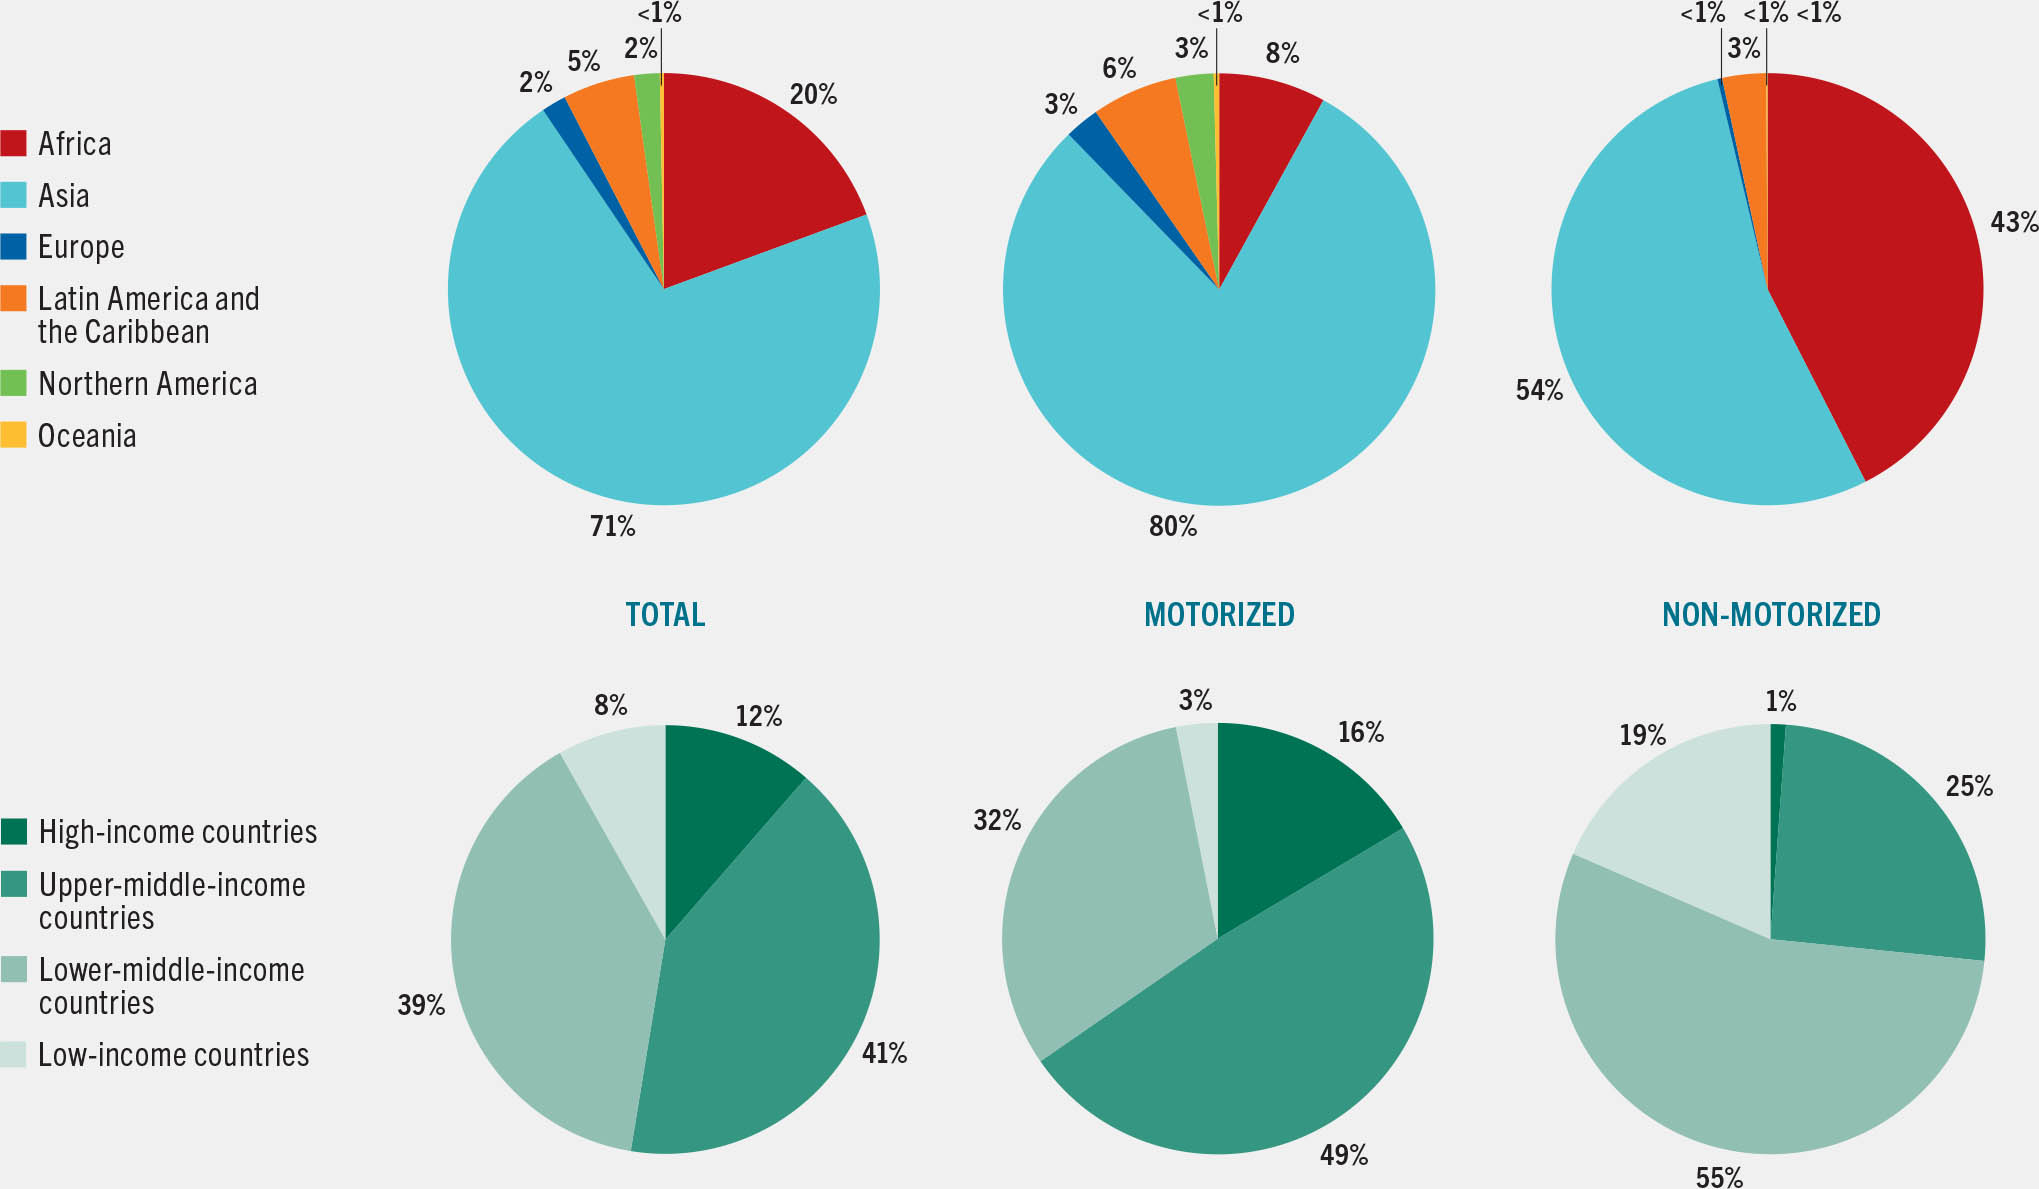
The largest part of the global fishing fleet is found in upper-middle-income (41 percent) and lower-middle-income (39 percent) countries, followed by high-income (11 percent) and low-income countries (8 percent).
Analysis by motorization status
There are approximately 3.3 million motorized vessels, comprising two-thirds of the global fishing fleet. Their number increased from 2.4 million units in 1995 to a peak of 3.5 million in 2020, after which it slightly decreased to 3.3 million vessels in 2022. Meanwhile, the number of non-motorized vessels decreased from 2 million in 1995 to 1.6 million in 2022 (Figure 23).
FIGURE 23GLOBAL FISHING FLEET, MOTORIZED VS NON-MOTORIZED, 1995–2022

Figure 22 shows that Asia had 80 percent (2.6 million) of the world’s motorized vessels and 54 percent (0.9 million) of non-motorized vessels in 2022. Africa has the second-largest non-motorized fleet, estimated at 42 percent of the world total. Together, Asia and Africa account for 96 percent of the global non-motorized fleet. Figure 24 presents the share of motorized and non-motorized vessels in the total fleet for each continent, showing that Africa is the only continent where non-motorized vessels outnumber motorized vessels. It is also the only continent where the number of vessels has increased since 2019.
FIGURE 24SHARE OF MOTORIZED AND NON-MOTORIZED VESSELS BY GEOGRAPHICAL REGION, 2022

Figure 22 shows also that nearly half of the world’s motorized vessels can be found in upper-middle-income countries (49 percent), followed by lower-middle-income countries (31 percent), high-income countries (16 percent) and low-income countries (3 percent). Non-motorized vessels have a very different distribution among income groups: more than half of these vessels are found in lower-middle-income countries (55 percent), followed by upper-middle-income countries (25 percent) and low-income countries (19 percent), while only 1 percent are found in high-income countries.
Size distribution of vessels and the importance of small boats
Information on the size of vessels is available for only 37 percent of the total vessels reported. This information is not available for the three countries with the world’s largest fleets that accounted for nearly half of the global fishing fleet in 2022 – China, Indonesia and the Philippines. Among those vessels for which information on length overall (LOA) was available in 2022, 89 percent were in the LOA class of under 12 m, 10 percent in the LOA class of 12 to 24 m, and 2 percent in the LOA class of over 24 m. Figure 25 and Figure 26 show a gradual increase in the information on size and indicate that the share of small vessels has been decreasing since 2010.
FIGURE 25SIZE DISTRIBUTION OF FISHING FLEET, 1995–2022

FIGURE 26SIZE DISTRIBUTION OF FISHING FLEET WITH KNOWN LENGTH OVERALL, 1995–2022

SOURCE: Preliminary data. Final data available here: FAO. (forthcoming). Fishery and Aquaculture Statistics – Yearbook 2022. FAO Yearbook of Fishery and Aquaculture Statistics. Rome. https://www.fao.org/fishery/en/statistics/yearbook
These data confirm FAO results (Van Anrooy et al., 2021), which underline general increases in gross tonnage and length overall observed in fleets around the world. Large vessels, though small in number, continue to account for around one-third of the total engine power of the global fishing fleet (Rousseau et al., 2019). It is important to consider the differences in data coverage and quality between the different size groups. While industrial vessels are usually subject to licensing and registration requirements, this is less often the case for small vessels, which may not always be reported in national statistics even when registries exist.
For motorized vessels, size data are available for only 30 percent of vessels. Of these, 80 percent belong to the LOA class of under 12 m, 18 percent to 12 to 24 m, and 3 percent to over 24 m. For non-motorized vessels, information on size accounts for 52 percent of the data. Around 99 percent of these are LOA class under 12 m, compared with just 1 percent 12 to 24 m and only a few vessels reported over 24 m.
Figure 27 shows the distribution of motorized vessels with known LOA in 2022 by geographical region. The same breakdown for non-motorized vessels is not shown because – as noted above – 99 percent belong to the small category. Small vessels represent the largest share among all motorized vessels with known LOA in all regions. In 2022, this share was highest in Oceania (89 percent) and over 80 percent also in Latin America and the Caribbean, Europe and Africa. In Asia, 77 percent of vessels belonged to this category, while in Northern America only half of the fleet consisted of small vessels. The proportion of large vessels (with an LOA of over 24 m and usually associated with over 100 gross tonnage) was highest in Northern America and Oceania (both 6 percent), followed by Europe (5 percent), Asia (3 percent), Latin America and the Caribbean and Africa (both 1 percent).
FIGURE 27SIZE DISTRIBUTION OF MOTORIZED FISHING FLEET BY GEOGRAPHICAL REGION, 2022

SOURCE: Preliminary data. Final data available here: FAO. (forthcoming). Fishery and Aquaculture Statistics – Yearbook 2022. FAO Yearbook of Fishery and Aquaculture Statistics. Rome. https://www.fao.org/fishery/en/statistics/yearbook
Data quality and improvements
Data collection at the country level continues to improve; furthermore, FAO’s comprehensive revision of fleet data dating back to 1995 involves close communication with countries to ensure correct interpretation of the data received, uncovering new data sources, controlling for data errors, and making informed estimations where necessary. Efforts are made to clarify and harmonize data coverage comprising all active vessels operating in marine and inland waters. FAO continues to provide support to countries to improve data collection and develop updated classifications and definitions (see Box 3), and the fishing fleet analysis will eventually include data from 1950 to 1995.
BOX 3NEW GUIDANCE TO ENHANCE GLOBAL REPORTING BY FISHING VESSEL TYPE
The design, size, equipment and other characteristics of the main types of semi-industrial and industrial fishing vessels have evolved significantly in recent decades. This has made it necessary for FAO to update its 1985 Fisheries and Aquaculture Technical Paper, Classification and definition of fishing vessel types (Thermes et al., 2023). This new edition includes most fishing vessel types with illustrations of selected vessels. The vessel type classification codes employed have been updated to align them to the revised version (2019) of the International Standard Statistical Classification of Fishery Vessels by vessel type of the Coordinating Working Party on Fishery Statistics. In addition, the publication also presents updates of the approximate relationship between the length overall of fishing vessels and their gross tonnage.
The technical paper assists FAO Members, regional fishery bodies and all those working on fishery statistics and management, by providing updated information on vessel types and characteristics. It includes the necessary information to identify and classify all types of semi-industrial and industrial fishing vessels for reporting purposes. This is particularly relevant for reporting data on vessels and on catches by vessel type. Likewise, the information can be useful in the implementation of the 1999 International Plan of Action for the Management of Fishing Capacity.

© FAO/Sirachai Arunrugstichai


