
Overall production status and trends
Global aquaculture production continued its increasing trend in 2020, 2021 and 2022, undisrupted by the COVID-19 pandemic. Growth patterns differed between regions, countries and territories, with important disparities in the scale of production, distribution, farming technologies, performance and management.
World aquaculture production in 2022 achieved an all-time record of 130.9 million tonnes, up by 8.1 million tonnes from 122.8 million tonnes in 2020. Its estimated farm-gate value was USD 312.8 billion in 2022, an increase of USD 34.2 billion from USD 278.5 billion in 2020. It comprised 94.4 million tonnes (live weight equivalent; worth USD 295.7 billion) of aquatic animals and 36.5 million tonnes (wet weight; worth USD 17 billion) of algae (seaweed and micro-algae), plus a further 2 700 tonnes (worth USD 138.5 million) of shells and pearls.
The year 2022 was the first time in history that global aquaculture production of animal species surpassed capture production estimated at 91 million tonnes. In fact, the 2022 figure of 94.4 million tonnes of farmed aquatic animals was higher than the annual capture production for every year since 1950 – with the sole exception of 2018, when 96.5 million tonnes of aquatic animals were caught from the wild.
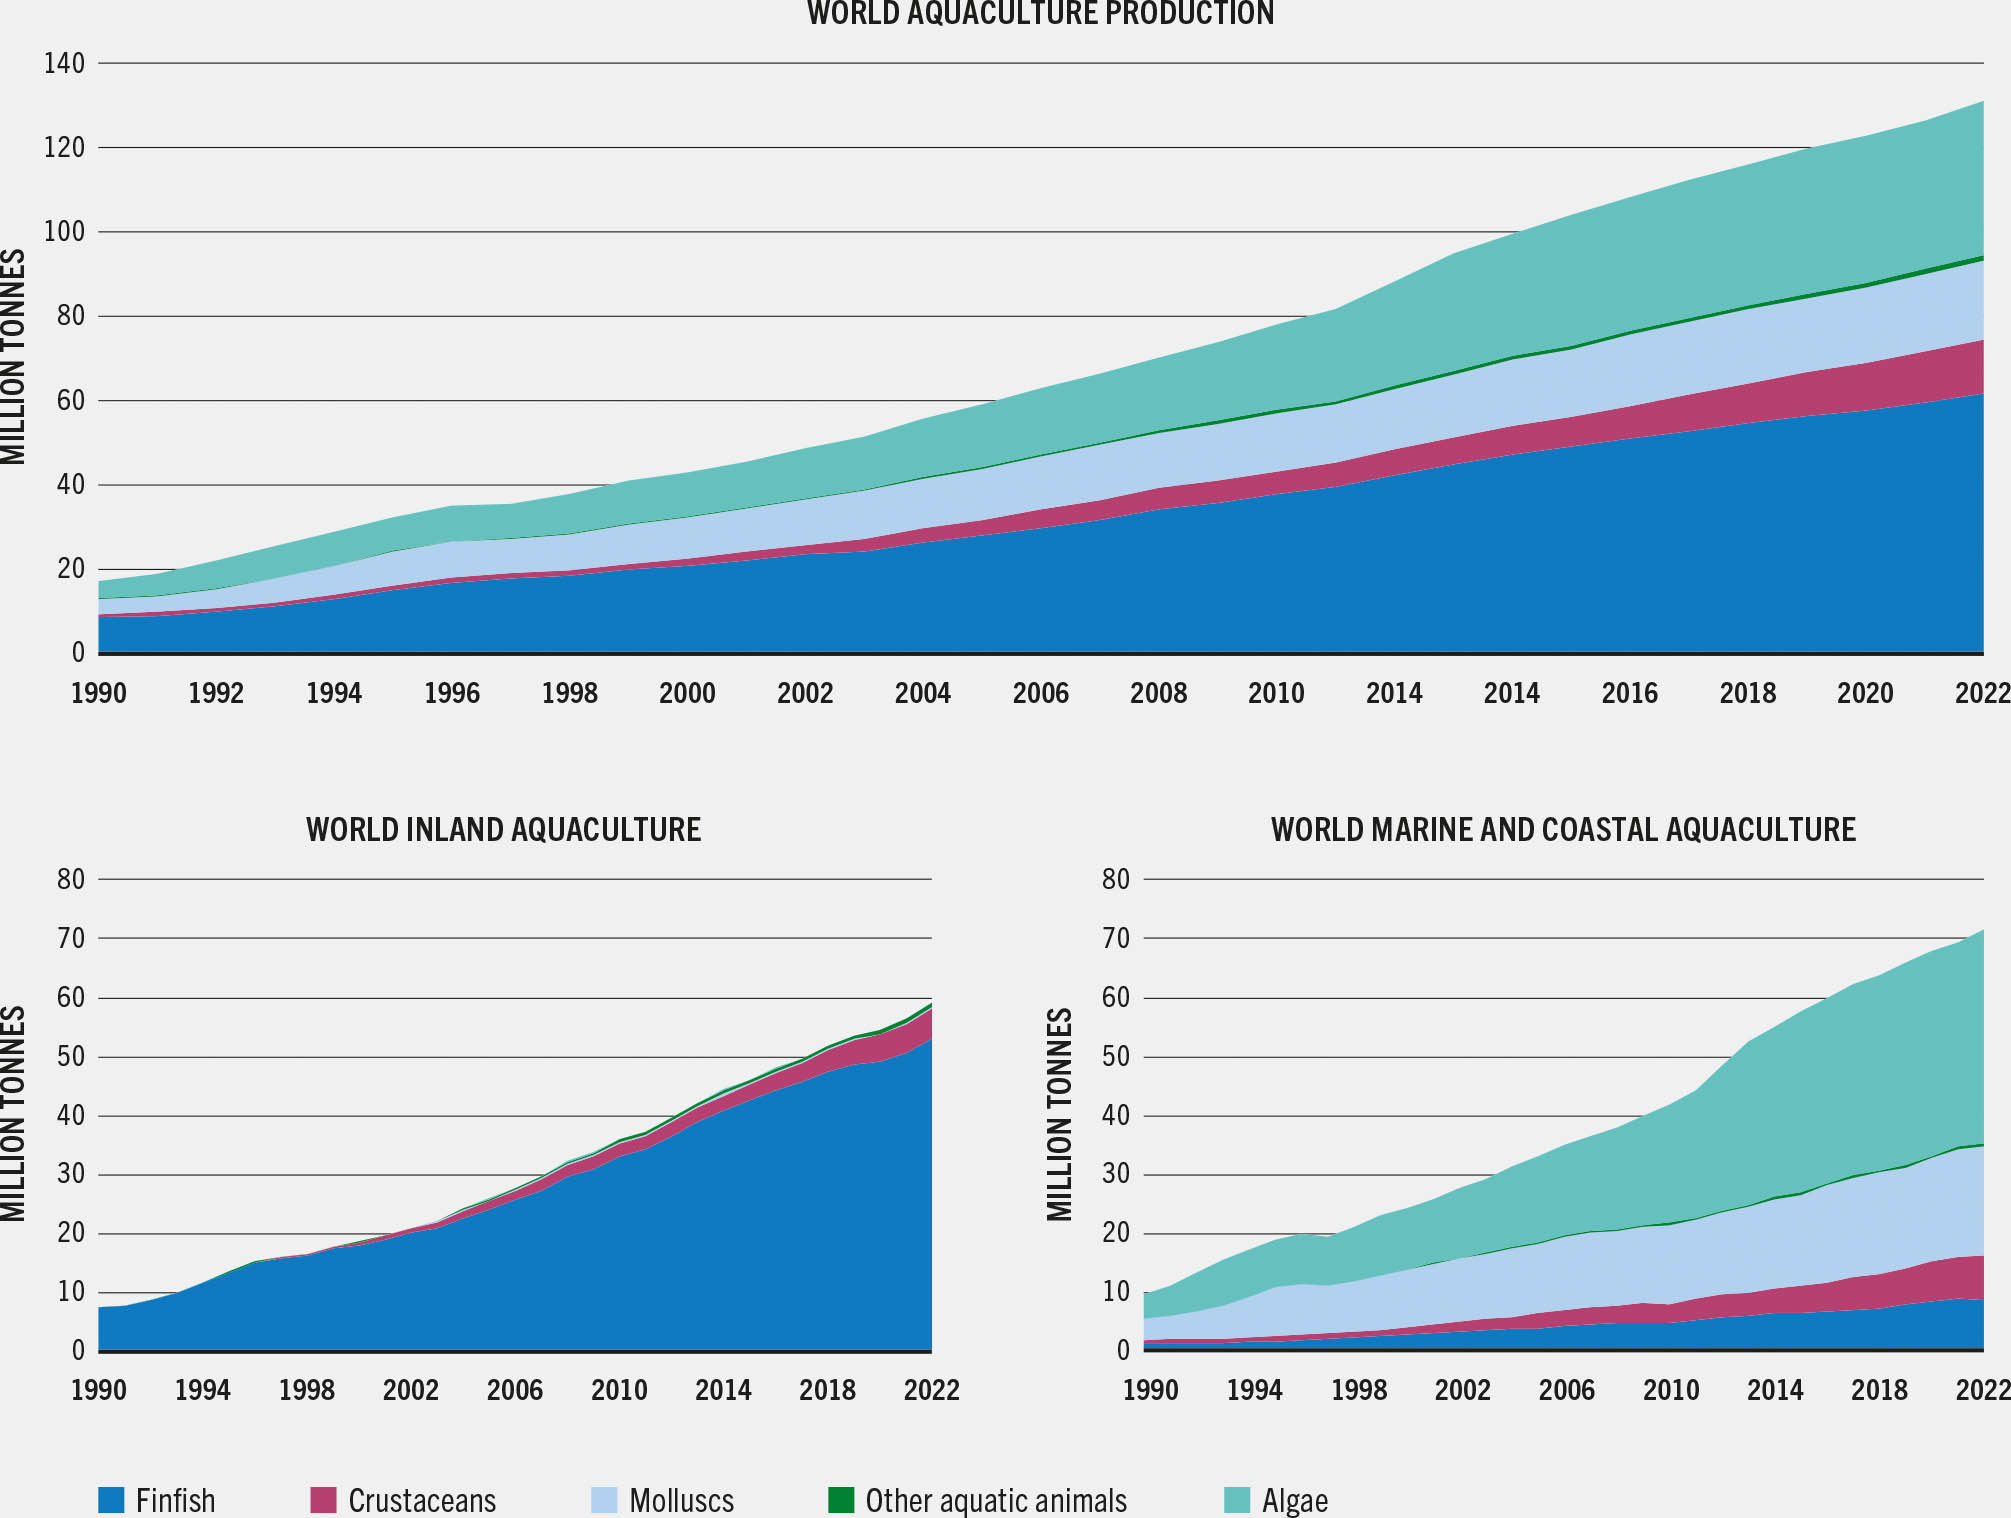
The production of farmed animal species increased in 2022 by 6.7 million tonnes (7.6 percent) from 2020. This net increase was due mainly to Asia, whose contribution (5.9 million tonnes, 87.9 percent) was far higher than that of Latin America and the Caribbean (448 300 tonnes, 7.3 percent), Europe (232 100 tonnes, 3.5 percent), Africa (50 500 tonnes, 0.8 percent), Northern America (26 500 tonnes, 0.4 percent) and Oceania (10 100 tonnes, 0.2 percent). By species group, the net increase was mainly attributed to finfish (3.9 million tonnes, 58.1 percent), followed by crustaceans (1.6 million tonnes, 24.6 percent), molluscs (1 million tonnes, 15.6 percent) and other aquatic animal species (121 800 tonnes, 1.8 percent).
Global production of farmed algae reached 36.5 million tonnes in 2022, an increase of 1.4 million tonnes (4.1 percent) from the 2020 production of 35.1 million tonnes. This increase was the result of production expansions led by China, followed by Malaysia, the Philippines, the United Republic of Tanzania, the Russian Federation and a few others, unfortunately offset by drops (in descending order of reduction in output) in Indonesia, the Republic of Korea, Japan and a few other smaller producers.
The breakdown and trend of production by major farmed species group of aquatic animals from inland and marine and coastal aquaculture during the period 1990–2022 are illustrated in Figure 7.
FIGURE 7WORLD AQUACULTURE PRODUCTION, 1990–2022
SOURCE: FAO. 2024. FishStat: Global aquaculture production 1950–2022. [Accessed on 29 March 2024]. In: FishStatJ. Available at: www.fao.org/fishery/en/statistics/software/fishstatj. Licence: CC-BY-4.0.
Total world aquaculture production in 2022 grew by 87.9 million tonnes from 43 million tonnes in 2000, an increase of 204 percent (average yearly growth rate of 5.2 percent). In the same period, farming of aquatic animals expanded by 62 million tonnes from 32.4 million tonnes, a 191 percent increase (average yearly growth rate of 5 percent). The production of cultivated algae more than tripled in the same period. Different regions show huge differences in the scale of aquaculture production and its growth pattern (Table 2).
TABLE 2WORLD AND REGIONAL AQUACULTURE PRODUCTION AND GROWTH
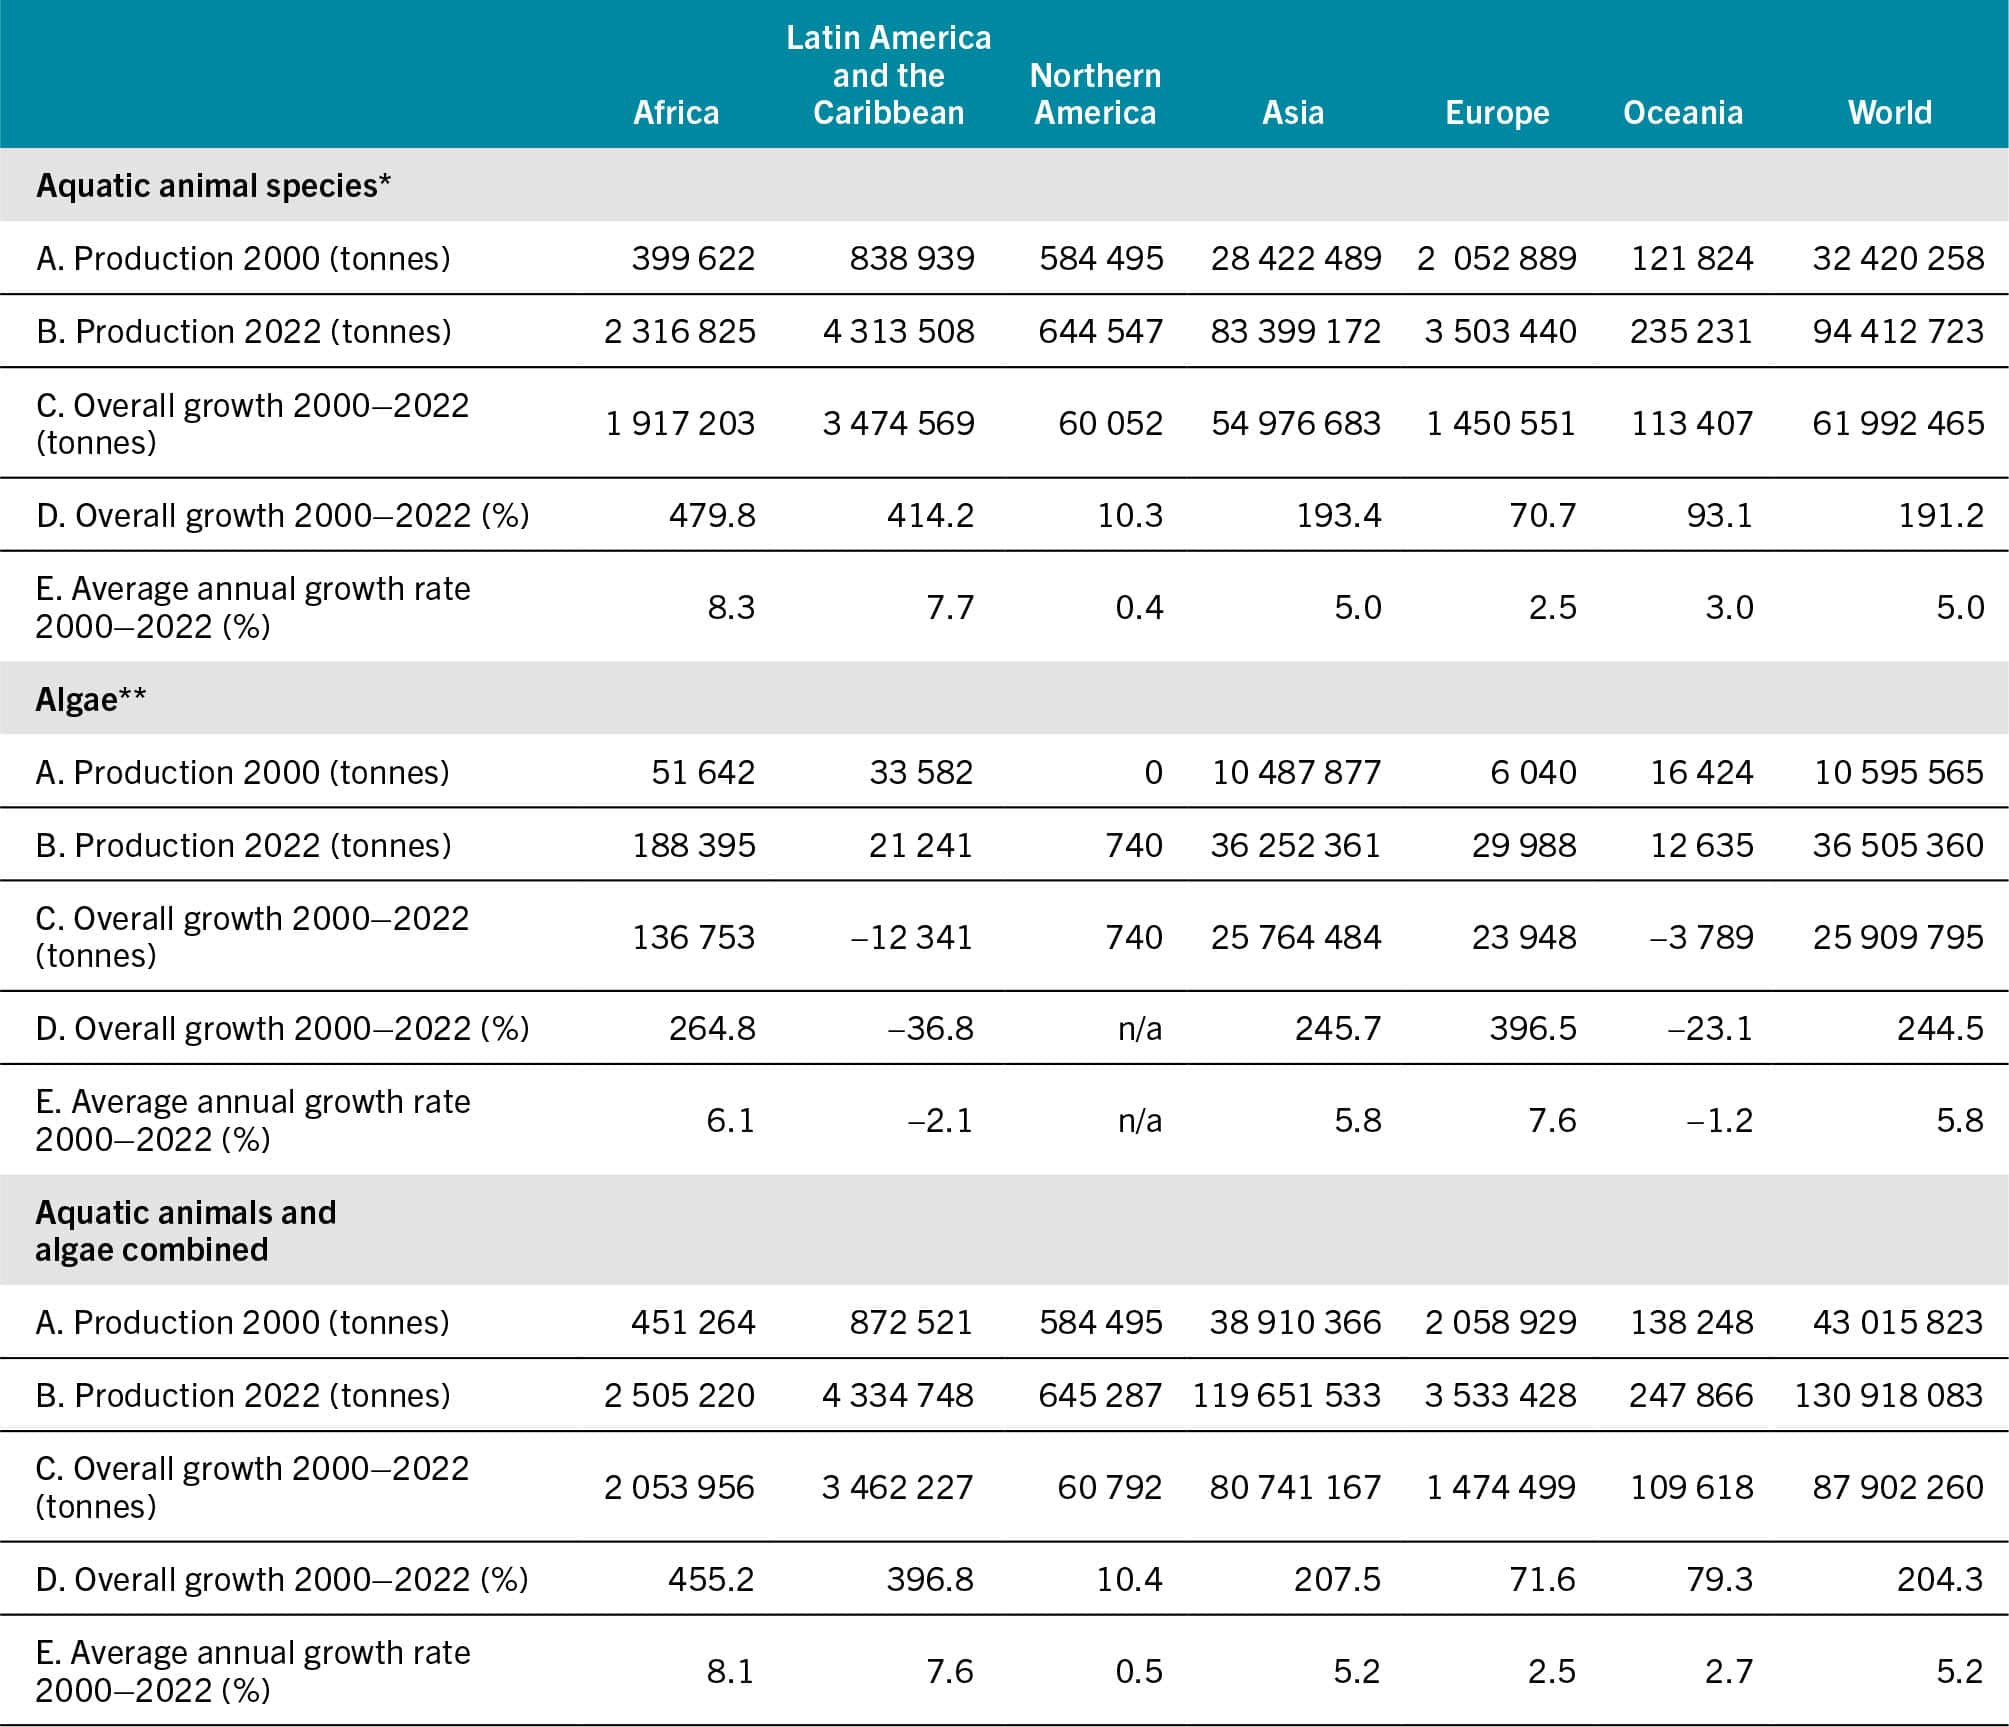
* Excluding crocodiles, alligators, caimans, aquatic products (corals, pearls, shells and sponges) and algae. Data expressed in live weight equivalent.
** Including marine macro-algae (seaweeds), micro-algae and cyanobacteria. Data expressed in wet weight.
SOURCE: FAO. 2024. FishStat: Global aquaculture production 1950–2022. [Accessed on 29 March 2024]. In: FishStatJ. Available at: www.fao.org/fishery/en/statistics/software/fishstatj. Licence: CC-BY-4.0.
Within each region, the scale and annual variation pattern differ from country to country. Figure 8 illustrates the trend in annual variation during the period 2001–2022 in six regions.
FIGURE 8ANNUAL GROWTH RATE OF AQUATIC ANIMAL AQUACULTURE PRODUCTION BY REGION, 2000–2022

SOURCE: FAO. 2024. FishStat: Global aquaculture production 1950–2022. [Accessed on 29 March 2024]. In: FishStatJ. Available at: www.fao.org/fishery/en/statistics/software/fishstatj. Licence: CC-BY-4.0.
Source of aquaculture data for analysis
The FAO aquaculture production statistics cover 208 producing countries and territories worldwide. They are the primary source of data used for the analytical review of status and trends in aquaculture development worldwide. They have been revised for some countries, based on newly available information and evidence, as per FAO’s standard practice. For example, the revised data of global farmed aquatic animal production is 87.7 million tonnes for 2020, that is 0.2 million tonnes higher than the 87.5 million tonnes reported prior to the revision. However, even though the revisions for certain data-poor countries are significant – even drastic – they do not modify the conclusions drawn on the global and regional scales or on trends reported previously.
The issue of numerous countries not reporting aquaculture data continues to be of concern. In addition, the fact that confidential data may be excluded from national data reports exacerbates the operational difficulties faced by FAO; indeed, demonstrating the real scale of aquaculture at the required level of detail is challenging in an increasing number of countries, particularly high-income countries.
For example, in 2022, about half of the 208 aquaculture producers worldwide did not report data to FAO. The ratio of non-reporting to total producers by region was 27:52 in Africa, 25:48 in the Americas, 22:48 in Asia, 8:40 in Europe and 17:19 in Oceania. FAO estimates for non-reporting producers were 13.3 million tonnes of aquatic animals and 736 900 tonnes of algae; this compares with the data for reporting producers (including adjustments and estimates of missing or misreported data for some countries), which totalled 81.1 million tonnes of aquatic animals and 35.8 million tonnes of algae.
Production distribution and trend
Africa was reported in The State of World Fisheries and Aquaculture 2022 as the only region that suffered a contraction in production during 2020 – the first year of the COVID-19 pandemic – caused mainly by reduced harvests in Egypt, Africa’s top producer, and Nigeria, the top producer in sub-Saharan Africa. Africa produced just over 2.3 million tonnes of farmed aquatic animal species in 2022, an increase of only 50 500 tonnes (2.2 percent) from 2020 (Table 3). The net increase came mainly from inland aquaculture, mostly in Ghana, followed by Zambia, the United Republic of Tanzania and Rwanda.
TABLE 3WORLD AQUACULTURE PRODUCTION OF AQUATIC ANIMALS BY REGION AND SELECTED MAJOR PRODUCERS

SOURCE: FAO. 2024. FishStat: Global aquaculture production 1950–2022. [Accessed on 29 March 2024]. In: FishStatJ. Available at: www.fao.org/fishery/en/statistics/software/fishstatj. Licence: CC-BY-4.0.
In 2022, Egyptian aquaculture production was 2.2 percent (39 500 tonnes) lower than the 1.6 million tonnes produced in 2020 – the result of slight drops in two consecutive years – while Nigeria witnessed a fall to below its 2020 production level following a recovery in 2021. Double-digit percentage contractions in output (compared with 2020 production levels) were observed in landlocked Malawi (−23.9 percent), Uganda (−18.2 percent) and Zimbabwe (−60.7 percent). Important African finfish producers adopting marine cage culture recorded decreases in production from 2020: by 11.6 percent in Tunisia, despite an all-time high in 2021, and by more than half (53.2 percent) in Mauritius.
Latin America and the Caribbean raised 4.3 million tonnes of aquatic animals in 2022, an increase of 448 300 tonnes (12.8 percent) from 3.8 million tonnes in 2020. This increase was largely driven by Ecuador (348 400 tonnes, 71.4 percent) and Brazil (108 000 tonnes, 22.1 percent), followed by Columbia (25 600 tonnes, 5.2 percent), Chile (22 700 tonnes, 4.6 percent) and the Bolivarian Republic of Venezuela (12 600 tonnes, 2.6 percent), and most of the smaller producers in the region. Chile, the regional top producer, increased its production by just 1.5 percent. On the other hand, significant contractions in production were observed in Mexico and Cuba – by 59 000 tonnes (16.9 percent) and 10 500 tonnes (40.66 percent), respectively – compared with 2020. Peruvian aquaculture experienced growth in 2021, but then fell in 2022 by 2 percent compared with its 2020 level; the strong growth in the marine shrimp and finfish subsectors was unable to offset the plunge by 44.2 percent in the harvest of farmed scallop.
Northern America increased its overall farmed aquatic animal production, reaching 644 500 tonnes in 2022, up by 4.3 percent from 618 000 tonnes in 2020. The United States of America saw a 6.7 percent rise to 478 100 tonnes in 2022, while production in Canada dropped by 2 percent to 166 500 tonnes. These levels were lower than their record-high production levels of 607 600 tonnes (United States of America, 2004) and 200 800 tonnes (Canada, 2016).
Asia harvested 83.4 million tonnes of farmed aquatic animals in 2022, up by 5.9 million tonnes (7.6 percent) from 77.5 million tonnes in 2020. China remained the major driver, contributing 55.4 percent (3.3 million tonnes) of the growth in Asian aquaculture. India produced 10.2 million tonnes in 2022 (an increase from 8.6 million tonnes in 2020) and was second after China, contributing 27.1 percent (1.6 million tonnes) to Asia’s aquaculture growth, followed in order of importance by Viet Nam, Bangladesh and Indonesia with a combined contribution of 14.1 percent (826 400 tonnes). Thailand and the Philippines were the only two of the top ten Asian producers whose 2022 production contracted compared with 2020 – by 5.8 percent (49 900 tonnes) and 1 percent (10 400 tonnes) respectively. Among other Asian producers, Türkiye was the main contributor to the increase in West Asia, while Uzbekistan and Kyrgyzstan were the main contributors to the growth in Central Asia.
Europe farmed 3.5 million tonnes of aquatic animals in 2022, up by 232 100 tonnes (7.1 percent) from 3.3 million tonnes in 2020. This increase in production came mainly from Norway (158 200 tonnes, 68.1 percent), followed by the Russian Federation (49 200 tonnes, 21.2 percent). The Faroe Islands, Iceland, Greece, France, Italy, Ireland and Croatia, in order of importance, contributed 68 200 tonnes (29.4 percent) collectively. In the same period, there was a total drop in production of 47 800 tonnes in 17 European countries, mainly in the United Kingdom of Great Britain and Northern Ireland, followed by Germany, Bulgaria, Denmark and Ukraine.
Oceania recorded an increase in farmed production of aquatic animal species of 10 100 tonnes, up by 4.5 percent from 225 100 tonnes in 2020 to 235 200 tonnes in 2022. This was mainly due to the 22 percent growth in Australia, contrasted by a 10.5 percent fall in New Zealand. Indeed, the combined production of the other 18 island countries and territories in the region was much smaller, unchanged from the 2020 estimated figure of 3 800 tonnes.
The regional disparity in aquaculture production reflects significant differences at the country level. Figure 9 presents the production distribution patterns for six selected species and subsectors of aquaculture, typically characterized by the dominance of a small number of leading producers.
FIGURE 9AQUACULTURE PRODUCTION OF SELECTED MAIN SPECIES GROUPS BY MAJOR PRODUCER, 2008–2022
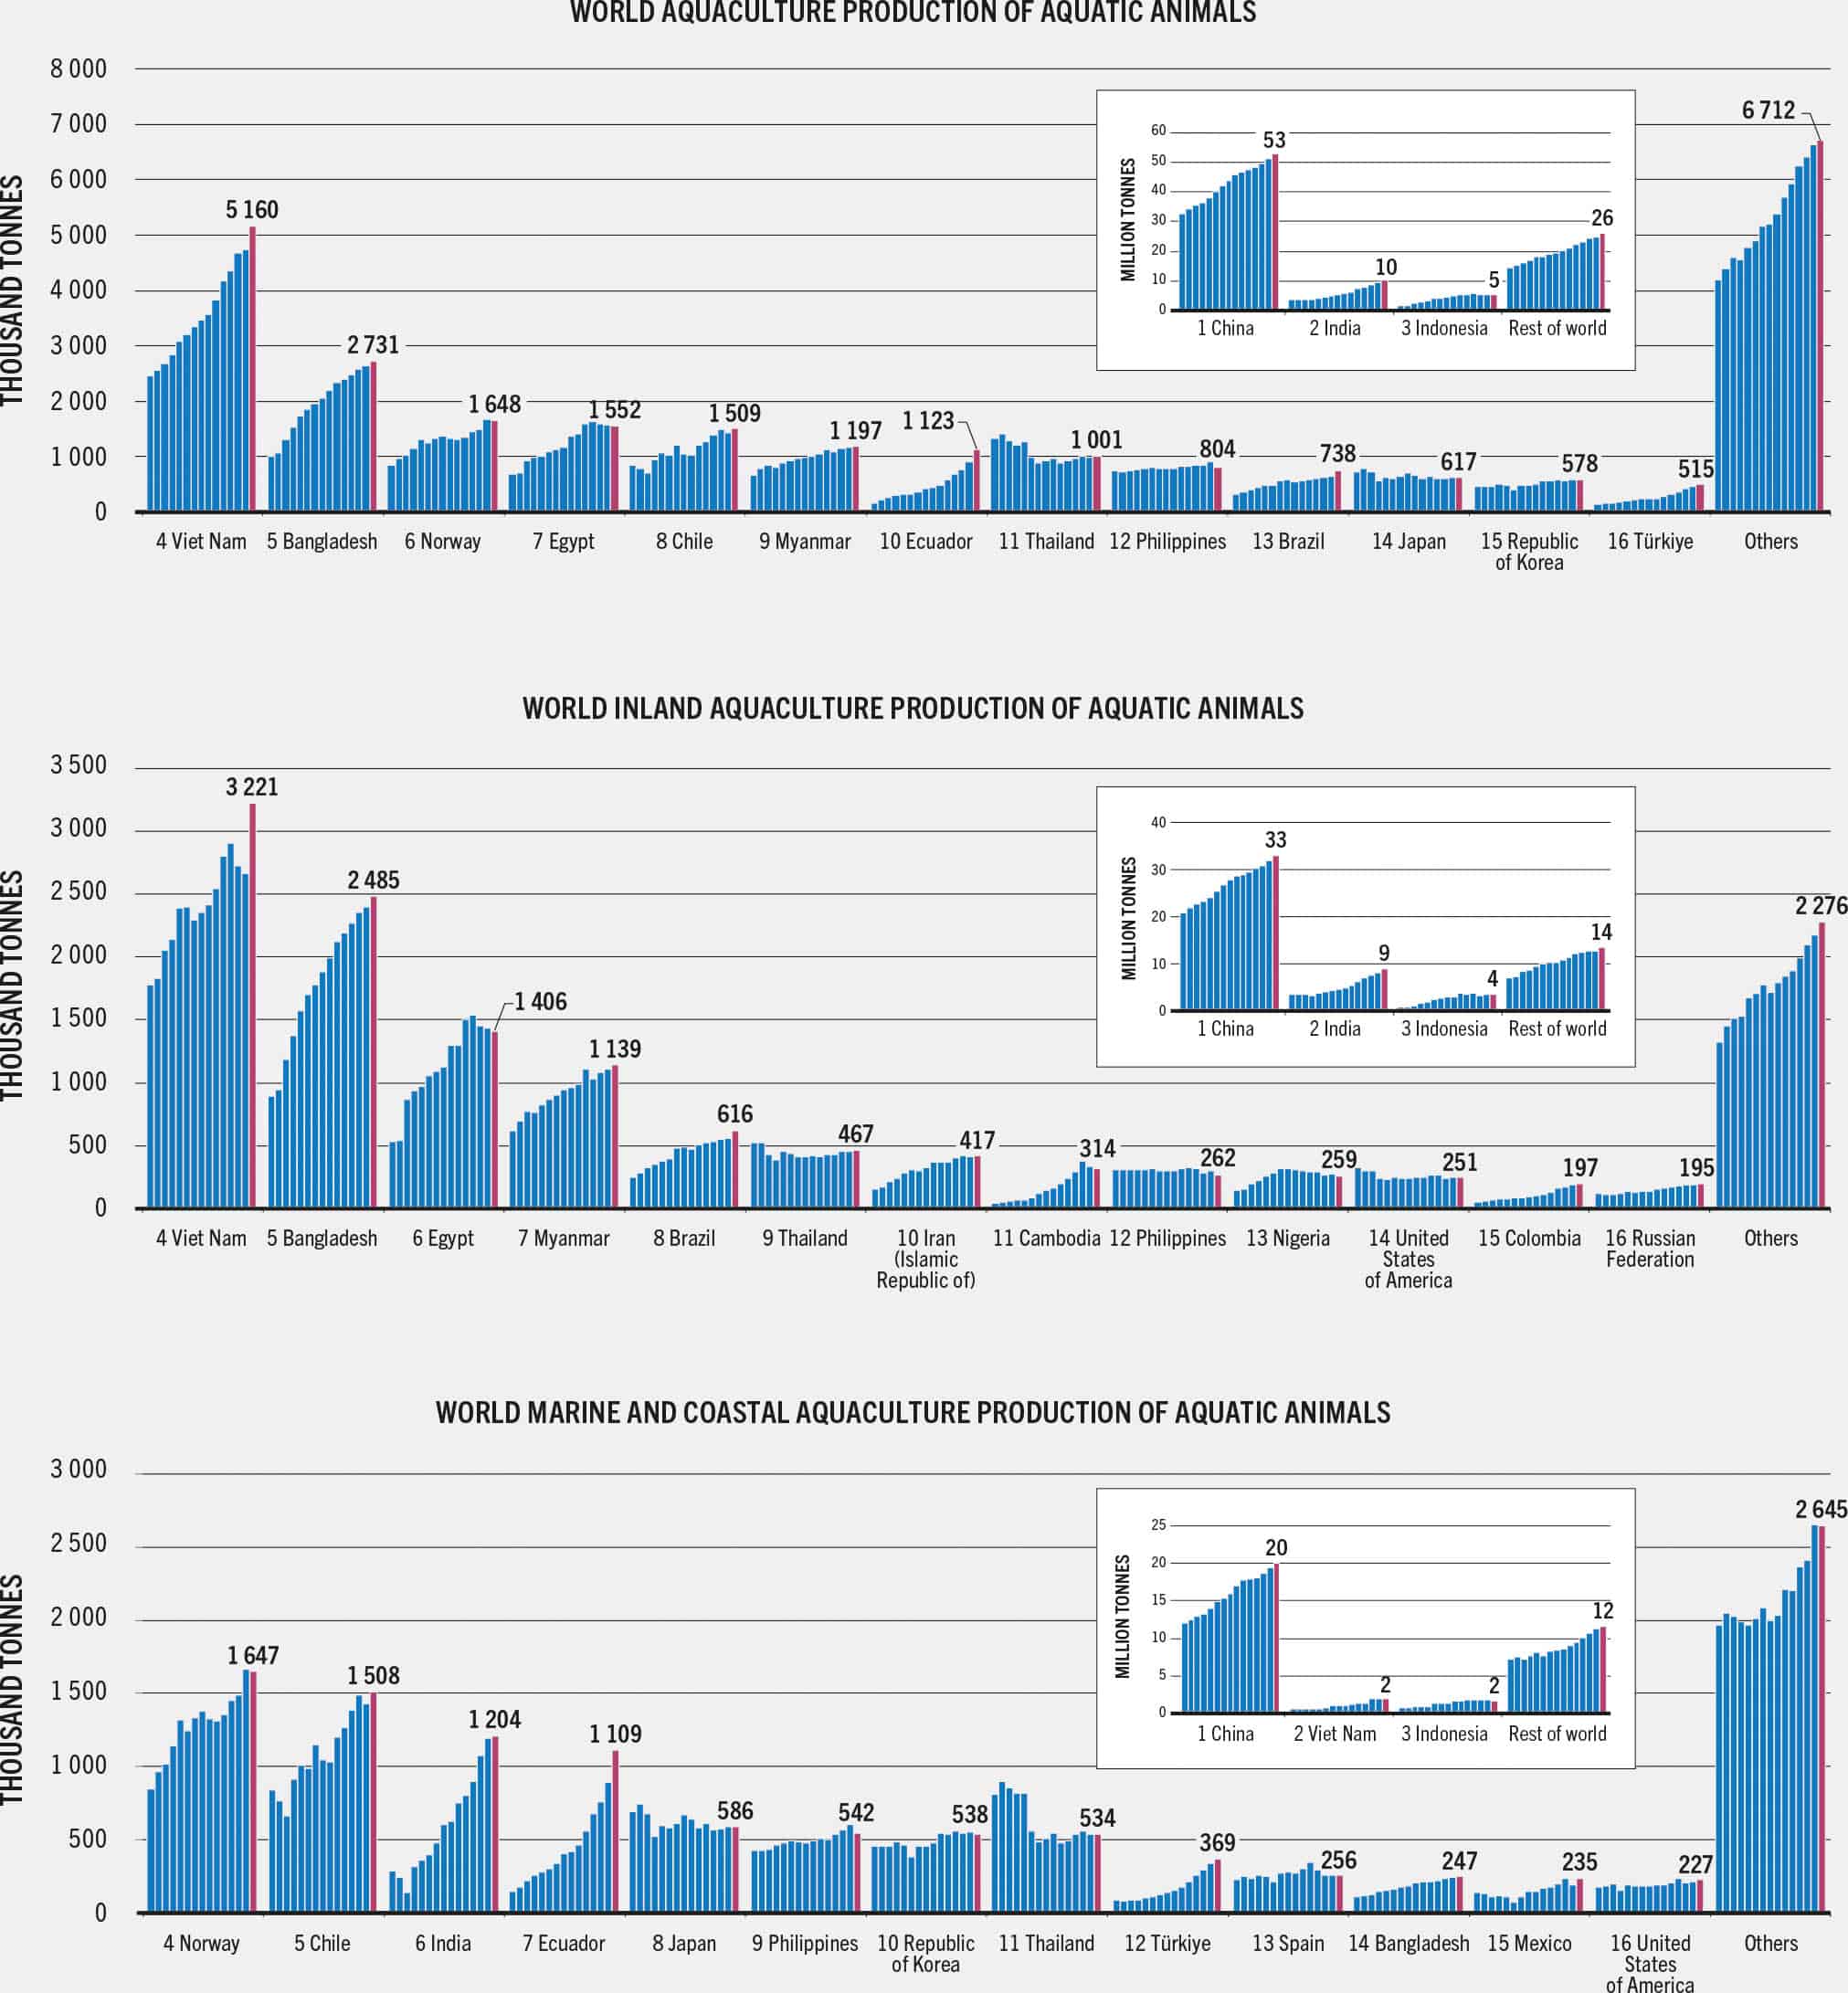

SOURCE: FAO. 2024. FishStat: Global aquaculture production 1950–2022. [Accessed on 29 March 2024]. In: FishStatJ. Available at: www.fao.org/fishery/en/statistics/software/fishstatj. Licence: CC-BY-4.0.
Aquaculture contribution to total fisheries and aquaculture production
World production of farmed aquatic animals contributed 50.9 percent to the combined production of capture and aquaculture in 2022, up from 49.4 percent in 2020. Aquaculture production has surpassed capture fisheries for years in several countries, particularly major aquaculture producers, led by China, India, Viet Nam and Bangladesh, as well as some small producers with limited capture fishery resources such as Jordan or Lesotho. In 2022, there were 45 countries where farmed production of aquatic animals exceeded capture fisheries production. There were a further ten producers whose aquaculture share ranged between 40 and 50 percent of the total, including (in order of production) Indonesia, Norway, Chile, Thailand and Brazil. In many other countries, especially low-income countries, aquaculture remains insignificant (Figure 10) and it is vital that aquaculture development be urgently accelerated in countries which have an aquaculture potential.
FIGURE 10SHARE OF AQUACULTURE IN TOTAL FISHERIES AND AQUACULTURE PRODUCTION OF AQUATIC ANIMALS BY REGION, 2000–2022
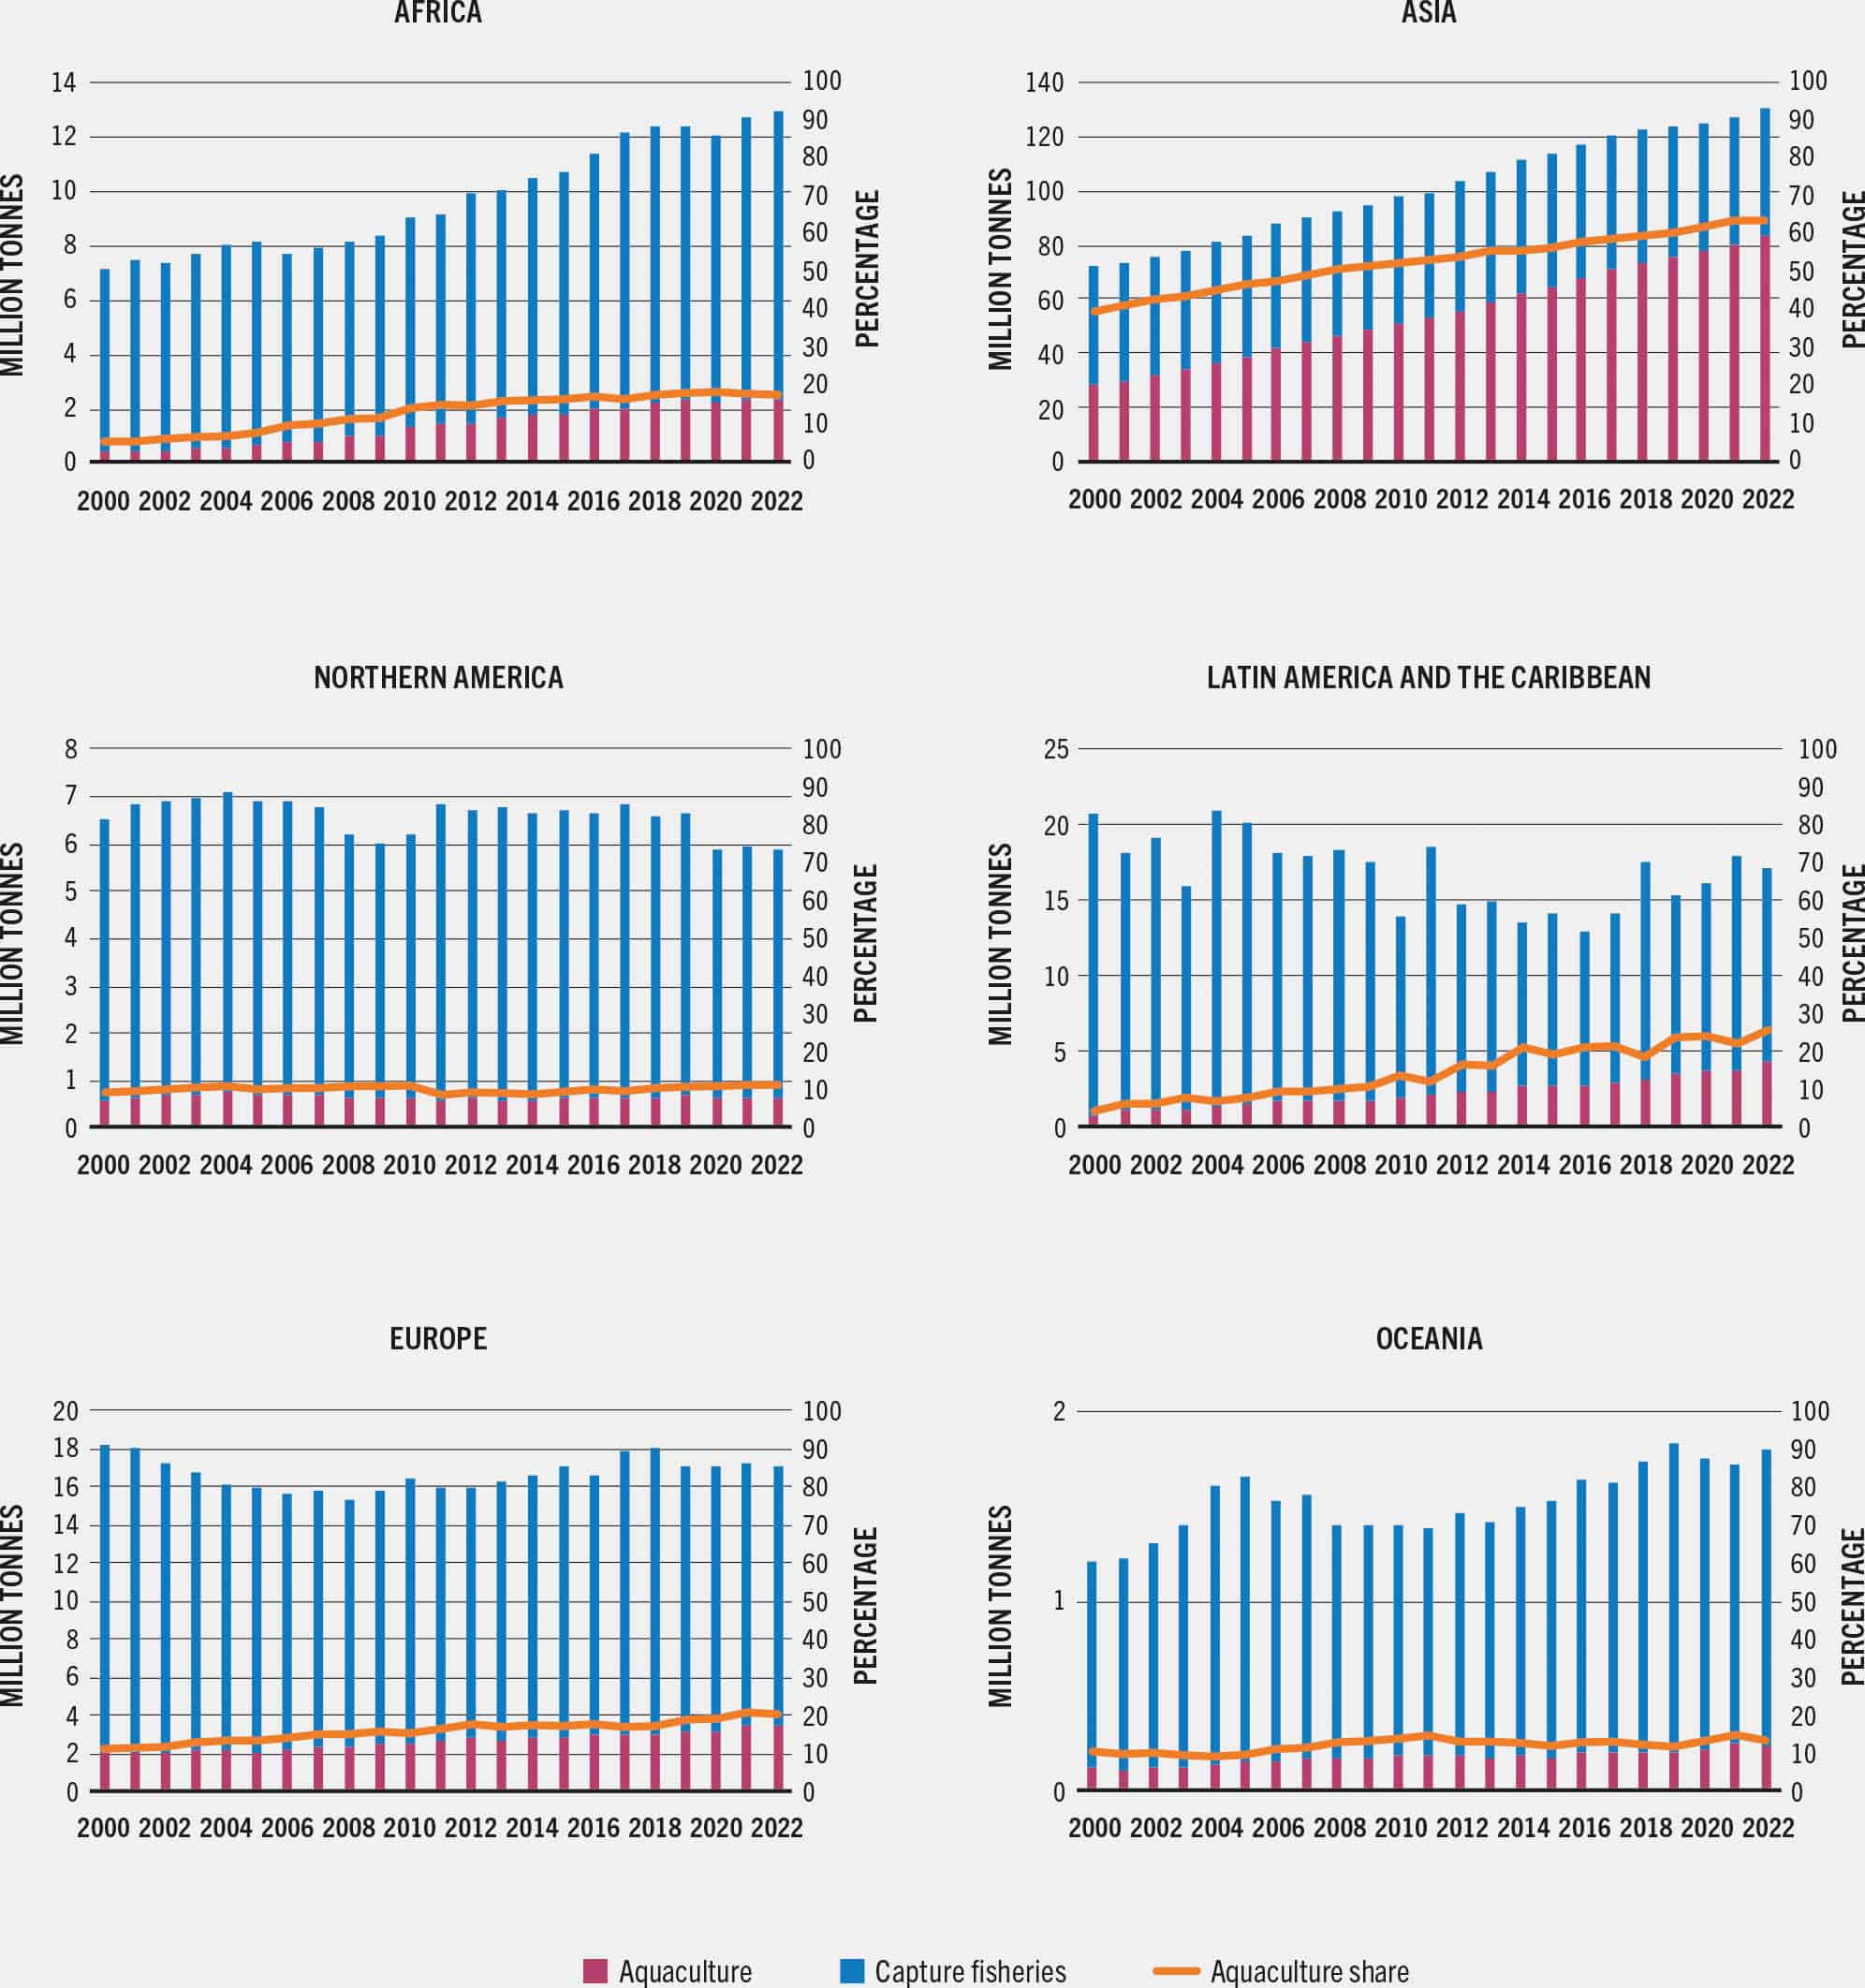
SOURCE: FAO. 2024. FishStat: Global production by production source 1950–2022. [Accessed on 29 March 2024]. In: FishStatJ. Available at: www.fao.org/fishery/en/statistics/software/fishstatj. Licence: CC-BY-4.0.
Inland aquaculture
Global aquaculture of aquatic animals in inland waters produced 59.1 million tonnes in 2022, accounting for 62.6 percent of the total world aquaculture production. Finfish contributed 89.7 percent of global inland aquaculture production, followed by crustaceans (8.7 percent), far ahead of all other species groups (Table 4). At the regional level, farming of crustaceans, molluscs and other species such as aquatic turtles and frogs is of limited importance except in Asia. Within Asia, farming of non-fish species is mostly practised in East and Southeast Asia.
TABLE 4WORLD INLAND AQUACULTURE AND MARINE AND COASTAL AQUACULTURE PRODUCTION BY REGION AND MAIN SPECIES GROUP, 2022

* Data on algae expressed in wet weight.
SOURCE: FAO. 2024. FishStat: Global aquaculture production 1950–2022. [Accessed on 29 March 2024]. In: FishStatJ. Available at: www.fao.org/fishery/en/statistics/software/fishstatj. Licence: CC-BY-4.0.
World inland aquaculture employs a diverse range of culture methods and technologies. It varies greatly in terms of input intensity, level of technological and management sophistication, and degree of integration with other economic activities. Globally, raising finfish and other species in constructed earthen ponds remains the most widely adopted culture method. In the recent past, many technical innovations in pond-based aquaculture production have been adopted by farmers to improve production efficiency and to reduce impact on the environment. For example, the in-pond raceway system, characterized by higher production rate and lower fish waste accumulation in the farming environment, is increasingly adopted in many provinces in China, followed by, to a lesser extent, other countries including Viet Nam, Colombia, Mexico, Uzbekistan, Bangladesh and Egypt. Fish farm cluster-based effluent treatment with constructed wetland and a low-cost filter for recycled use of water is another example.
Mariculture and coastal aquaculture
Mariculture – or marine aquaculture – takes place in the sea and may last the entire production cycle or only the grow-out phase. Mariculture lasting the full cycle is for species dependent on wild seeds from the sea, for example, sea mussels. On the other hand, mariculture lasting only the grow-out phase is for species produced in a land-based hatchery and sometimes even in freshwater, as is the case with Atlantic salmon. Coastal aquaculture, typically practised in constructed ponds onshore or in intertidal zones, plays an important role by providing livelihoods and employment, facilitating economic development among coastal communities in many countries, particularly in Asia and Latin America.
Global production of marine and coastal aquaculture reached 71.1 million tonnes in 2022, including 35.3 million tonnes of aquatic animals and 36.4 million tonnes of algae. Table 4 presents data on mariculture and coastal aquaculture production in 2022, disaggregated by region and by main species group.
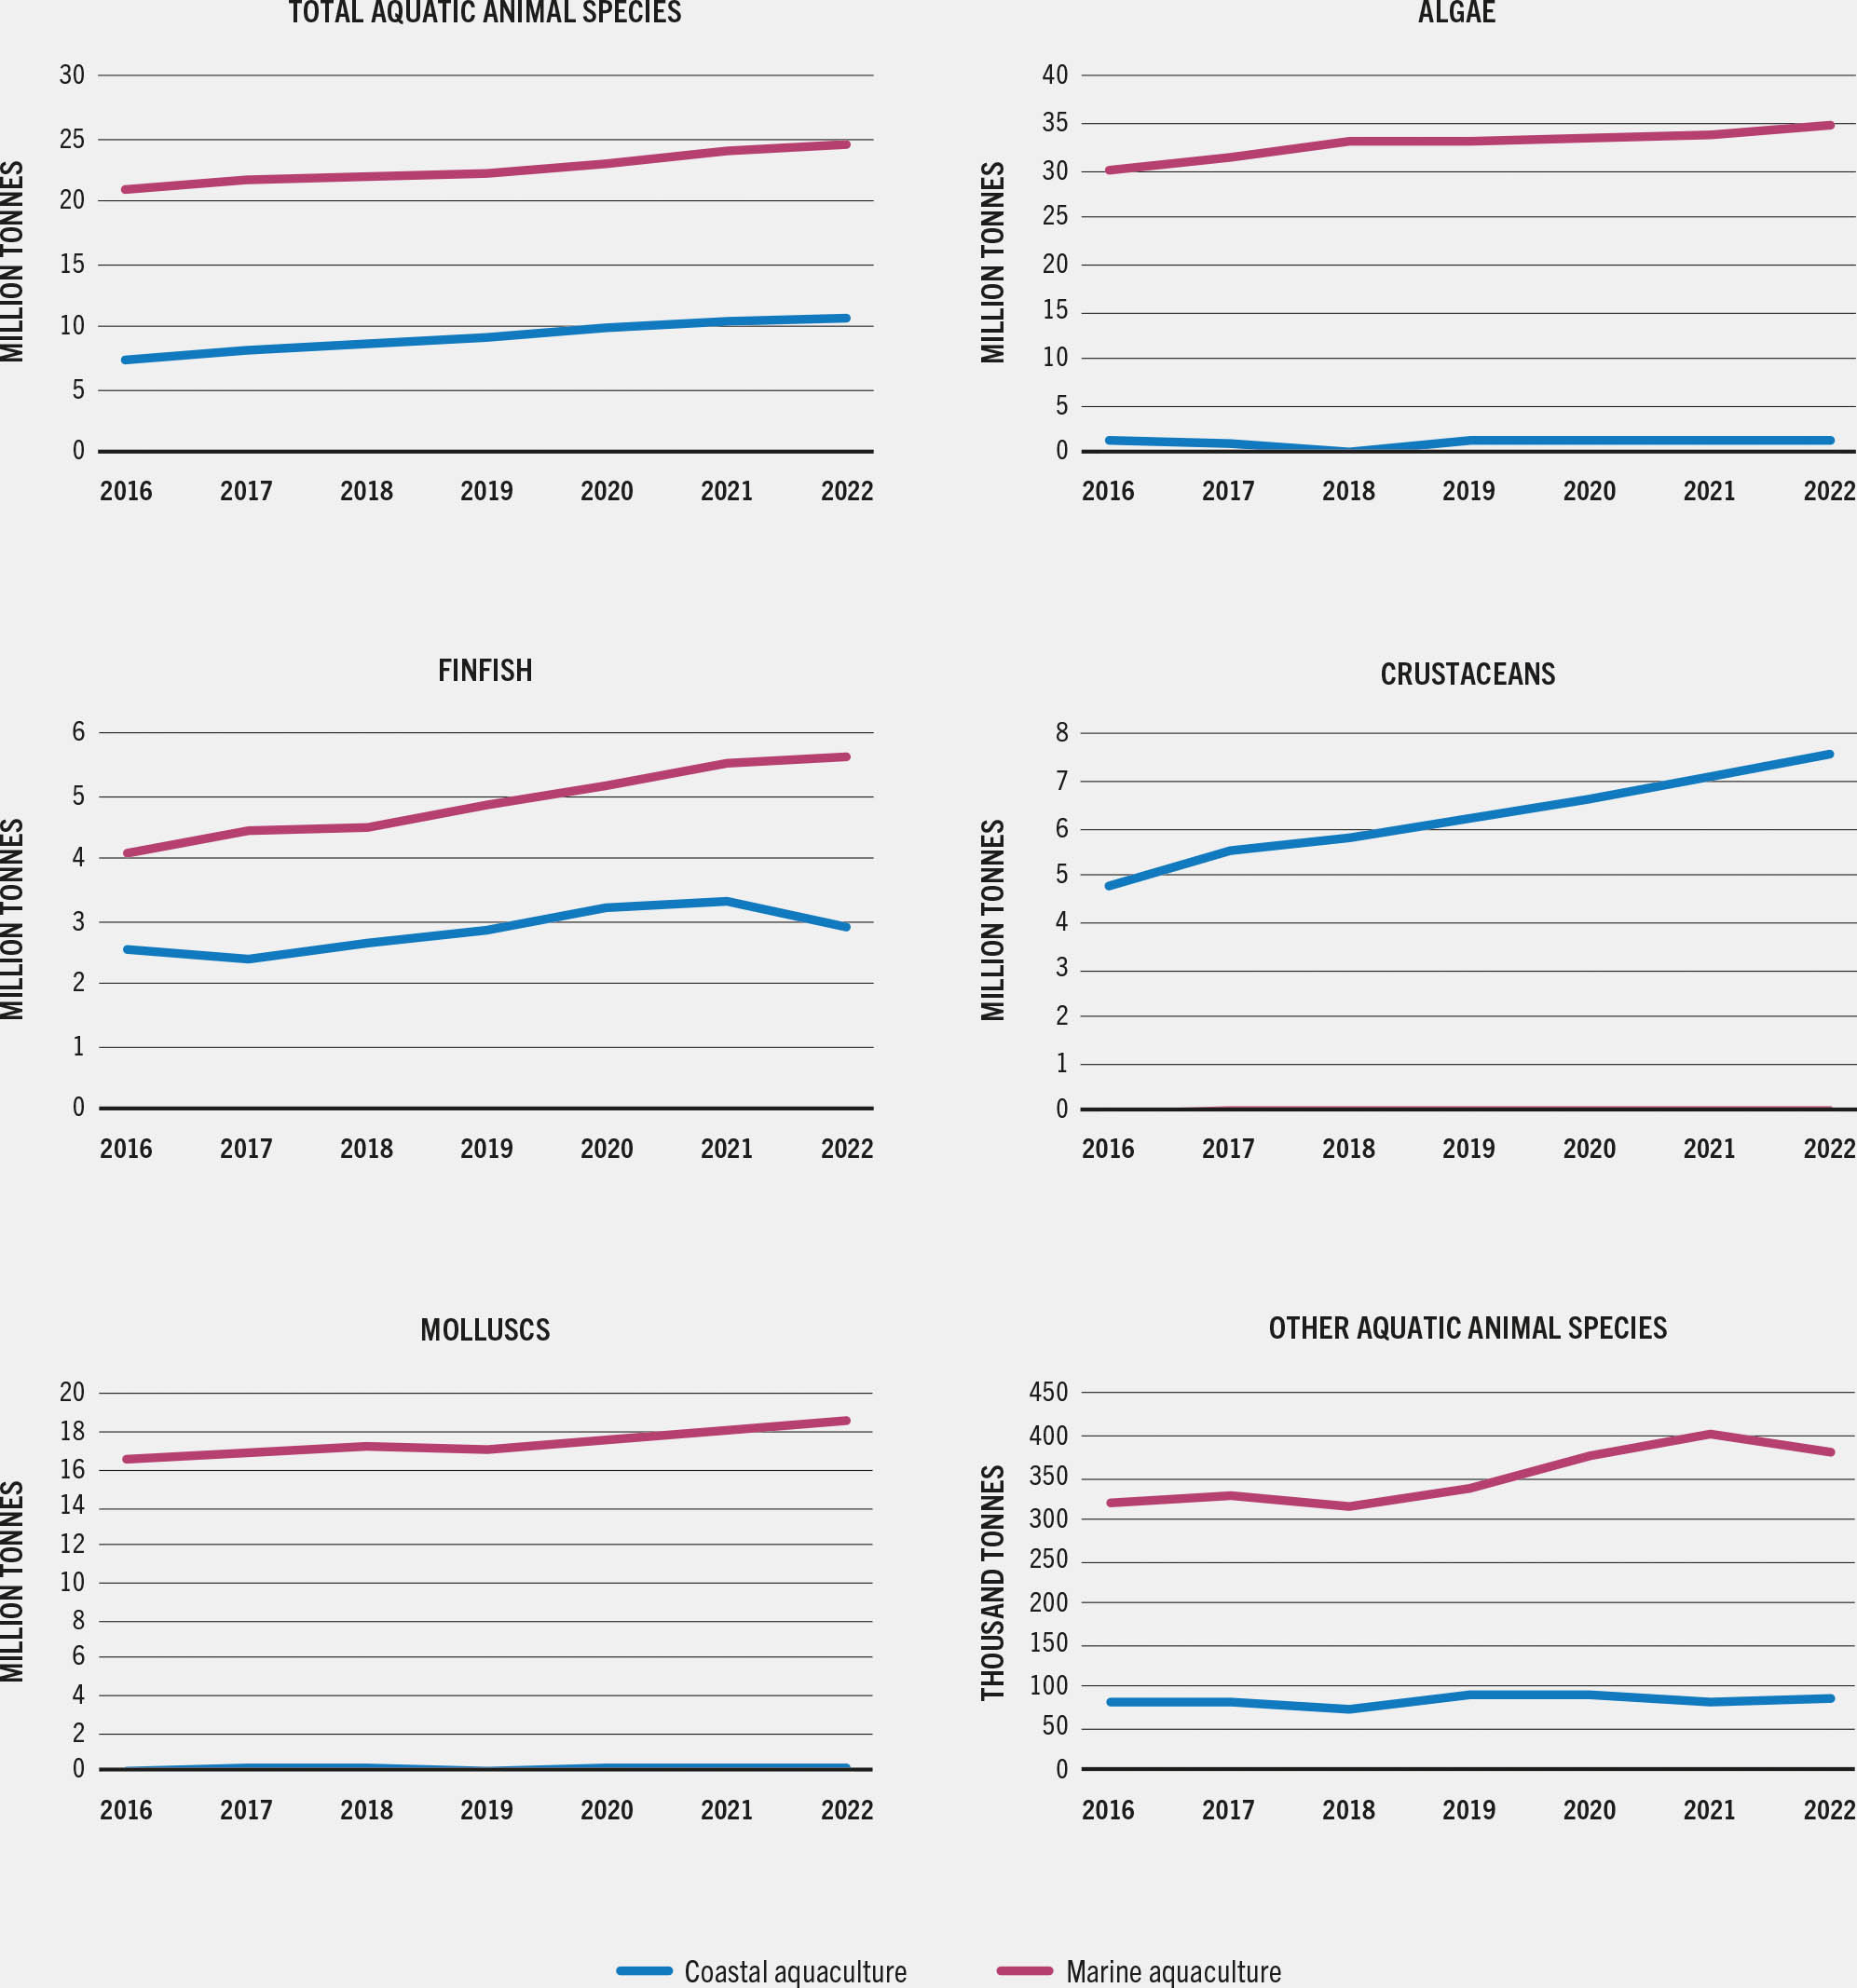
Separating the production of mariculture from coastal brackish water is traditionally difficult, as the two are often aggregated in national production data, particularly from countries farming finfish in both environments. Figure 11 herein presents an estimation of the production of major species groups since 2016, separating mariculture and coastal aquaculture, using information and data from alternative sources. On a global scale, seaweed farming and mollusc culture are overwhelmingly dominated by production in the sea, while crustaceans are primarily raised in coastal brackish water ponds and tanks. According to the available information, cage culture in the sea contributes around 65 percent of the total world production of finfish farmed in marine and coastal aquaculture combined.
FIGURE 11COMPOSITION OF WORLD MARINE AND COASTAL AQUACULTURE BY MAIN SPECIES GROUP, 2016–2022
SOURCE: FAO estimates based on FAO. 2024. FishStat: Global aquaculture production 1950–2022. [Accessed on 29 March 2024]. In: FishStatJ. Available at: www.fao.org/fishery/en/statistics/software/fishstatj. Licence: CC-BY-4.0.
Aquaculture production with and without feeding
The production of fed aquaculture continued to outpace that of non-fed aquaculture in 2021–2022. Globally, the share of non-fed aquaculture in total farmed animal species production fell from 39.7 percent in 2000 to 27.6 percent in 2020 and to 26.9 percent in 2022 (Figure 12).
FIGURE 12FED AND NON-FED AQUACULTURE PRODUCTION OF ANIMAL SPECIES BY REGION, 2000–2022

SOURCE: FAO estimates based on FAO. 2024. FishStat: Global aquaculture production 1950–2022. [Accessed on 29 March 2024]. In: FishStatJ. Available at: www.fao.org/fishery/en/statistics/software/fishstatj. Licence: CC-BY-4.0.
However, in inland or coastal multispecies polyculture systems, the separation between fed and non-fed species is not easily defined, as feeds intended for fed species benefit also filter-feeding species, especially when using powder feeds or pellet feeds with low water stability that dissolve quickly. In some areas in Asia, for example, bivalve species such as hard clams and constricted razor clams grown in coastal ponds are intentionally fed with specially prepared feed in fine particle form at the final stage of culture for “fattening” purposes.
Farmed aquatic species and diversity
FAO’s global aquaculture production statistics dataset 1950–2022 released in March 2024 reports 731 statistical units technically known as “species items” – an increase from the 652 reported in 2022. They comprise 564 aquatic species identified at species level and 7 interspecific hybrids of finfish, 99 species groups identified at genus level, and 61 groups of species identified at family or higher levels. The 564 farmed species taxonomically recognized in the world comprise 368 species of finfish grouped in more than 200 genera, 88 species of molluscs, 62 species of crustaceans, 32 species of algae, 2 species of cyanobacteria, 7 species of marine invertebrates, 3 species of frogs, and 2 species of aquatic turtles.
Despite this great diversity of aquatic species farmed worldwide, a relatively small number of “staple” species dominate total aquaculture production globally, regionally and nationally. Table 5 illustrates the dominant species or species groups and their relative importance in global production by subsector of aquaculture.
TABLE 5WORLD PRODUCTION OF MAJOR AQUACULTURE SPECIES AND MAIN SPECIES GROUPS

SOURCE: FAO. 2024. FishStat: Global aquaculture production 1950–2022. [Accessed on 29 March 2024]. In: FishStatJ. Available at: www.fao.org/fishery/en/statistics/software/fishstatj. Licence: CC-BY-4.0.


