
In 2022, global capture fisheries production reached 92.3 million tonnes, comprising 91.0 million tonnes (live weight equivalent) of aquatic animals and 1.3 million tonnes (wet weight) of algae, in addition to about 7 700 tonnes of other aquatic products such as corals, pearls, shells and sponges. Capture fisheries production of aquatic animals (91.0 million tonnes) decreased by 0.2 percent compared with the average of the previous three years (see Table 1, p. 4). It peaked in 2018 at 96.5 million tonnes, coinciding with the exceptionally high catches of anchoveta (Engraulis ringens) reported by Peru and Chile. Catches then dropped to marginally lower levels, impacted in 2020 by the COVID-19 pandemic. The relatively static trend in global capture fisheries continued in 2022, fluctuating between 86 million tonnes and 93 million tonnes per year from the late 1980s (Figure 13).
FIGURE 13WORLD CAPTURE FISHERIES PRODUCTION OF AQUATIC ANIMALS, 1950–2022
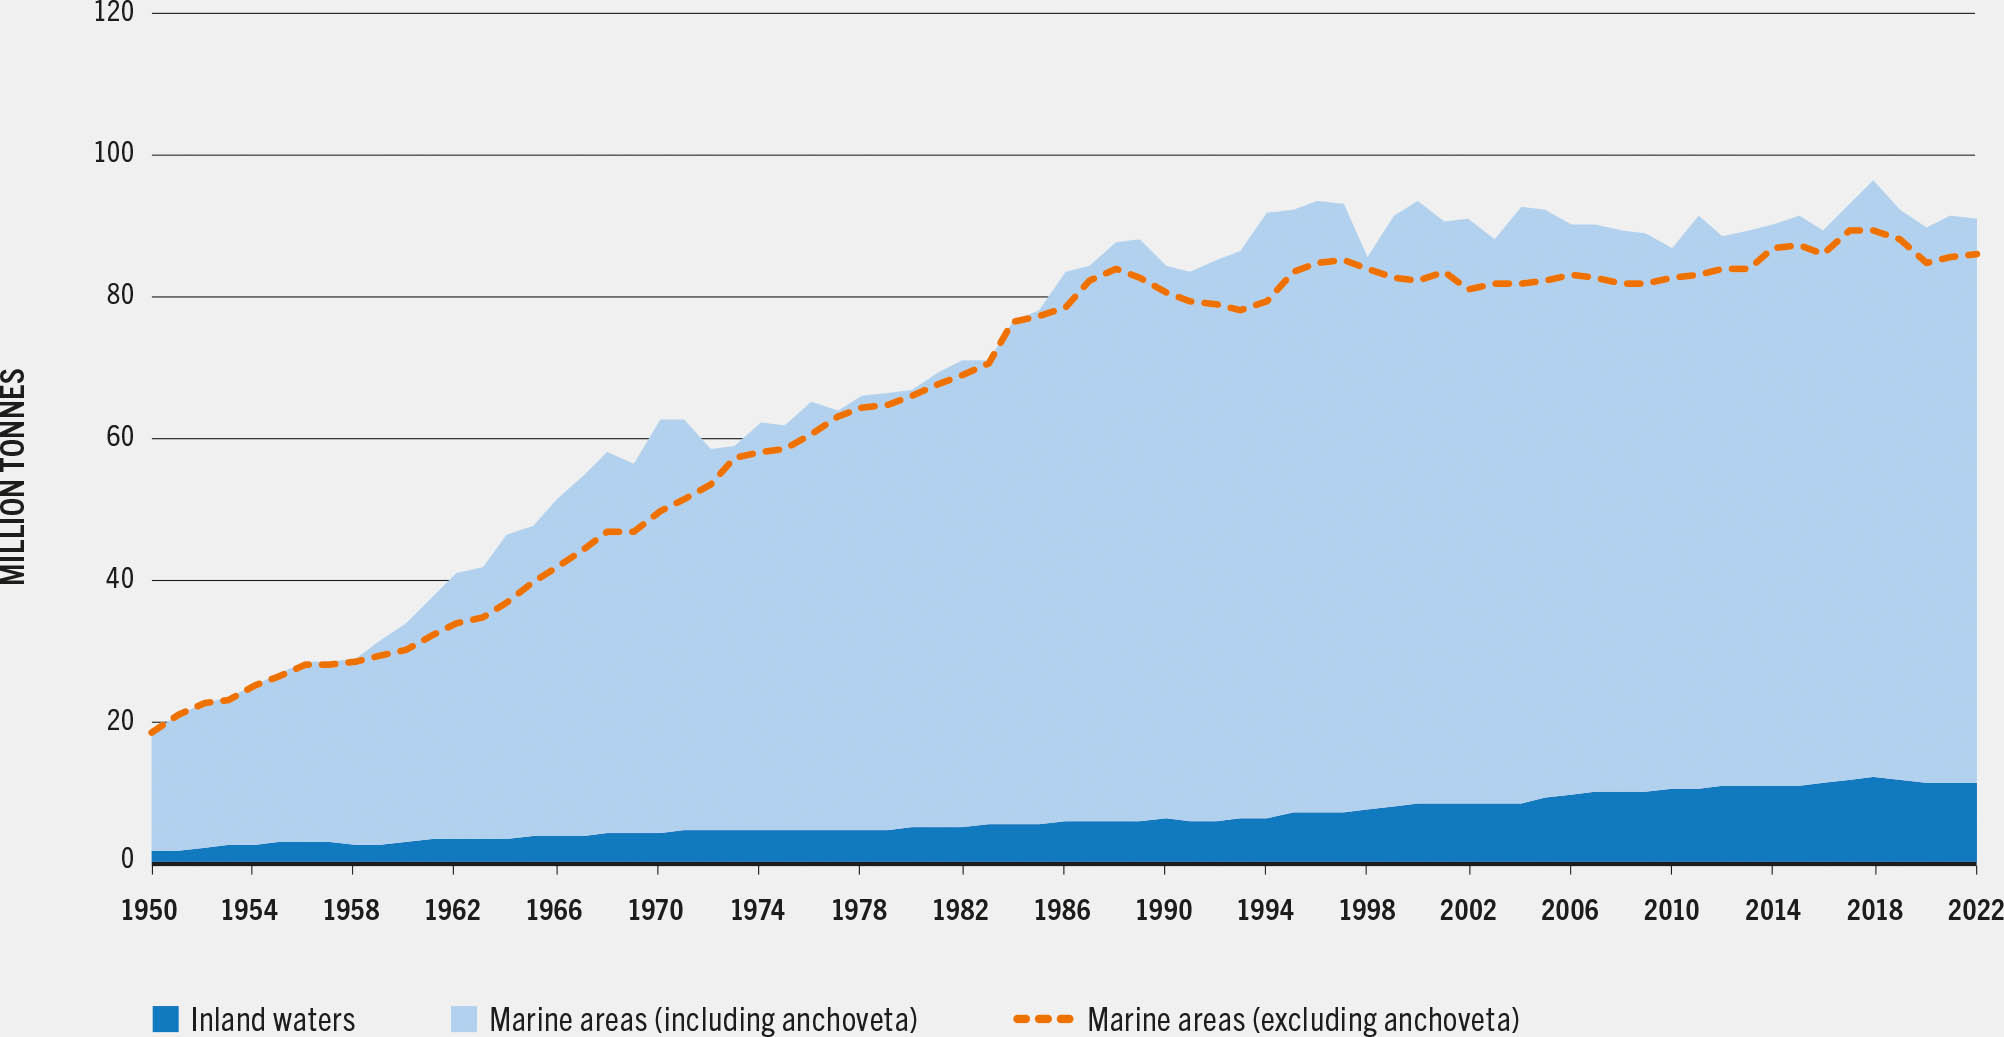
SOURCE: FAO. 2024. FishStat: Global capture production 1950–2022. [Accessed on 29 March 2024]. In: FishStatJ. Available at: www.fao.org/fishery/en/statistics/software/fishstatj. Licence: CC-BY-4.0.
China remained the top producer with 13.0 million tonnes, accounting for 14.3 percent of global captures of aquatic animals in 2022, more than the total captures of the second- and third-ranked countries combined. The top seven capture producers (China, Indonesia, India, Peru, Russian Federation, United States of America and Viet Nam) accounted for over 48 percent of total global capture production, while the top twenty producers accounted for about 73 percent.
The latest trends in marine areas and inland waters, which represent 87.5 percent and 12.5 percent, respectively, of the global production of capture fisheries, are discussed below.
Marine capture production
In 2022, total production of aquatic animals in marine areas was 79.7 million tonnes, a decrease of 0.7 percent compared with 2021, and 5.5 percent lower than the most recent peak of 84.4 million tonnes in 2018, when relatively high catches of anchoveta were reported by Peru and Chile (Table 6).
TABLE 6CAPTURE FISHERIES PRODUCTION OF AQUATIC ANIMALS IN MARINE AREAS BY MAJOR PRODUCER

SOURCE: FAO. 2024. FishStat: Global capture production 1950–2022. [Accessed on 29 March 2024]. In: FishStatJ. Available at: www.fao.org/fishery/en/statistics/software/fishstatj. Licence: CC-BY-4.0.
Global trends in marine water captures in recent years continue to be driven to a large extent by the main producers and also top species, notably the ongoing and planned reduction in catches by China, and fluctuations in the abundance of major species such as anchoveta, Pacific sardine (Sardinops sagax) and Pacific jack mackerel (Trachurus symmetricus), which are highly variable and influenced by El Niño events and other variations in oceanographic conditions (see Impacts of El Niño on marine fisheries and aquaculture, p. 202).
Despite the ubiquitous nature of fishing in marine areas, production is concentrated in a small number of countries (Figure 14a). As in previous years, the top seven producers in 2022 accounted for 50 percent of total marine captures (Figure 14b). China alone accounted for 14.8 percent of the world total, followed by Indonesia (8.6 percent), Peru (6.6 percent), the Russian Federation (5.9 percent), the United States of America (5.3 percent), India (4.5 percent) and Viet Nam (4.3 percent) (Table 6).
FIGURE 14WORLD CAPTURE FISHERIES PRODUCTION OF AQUATIC ANIMALS IN MARINE AREAS

SOURCE: United Nations Geospatial. 2020. Map geodata.
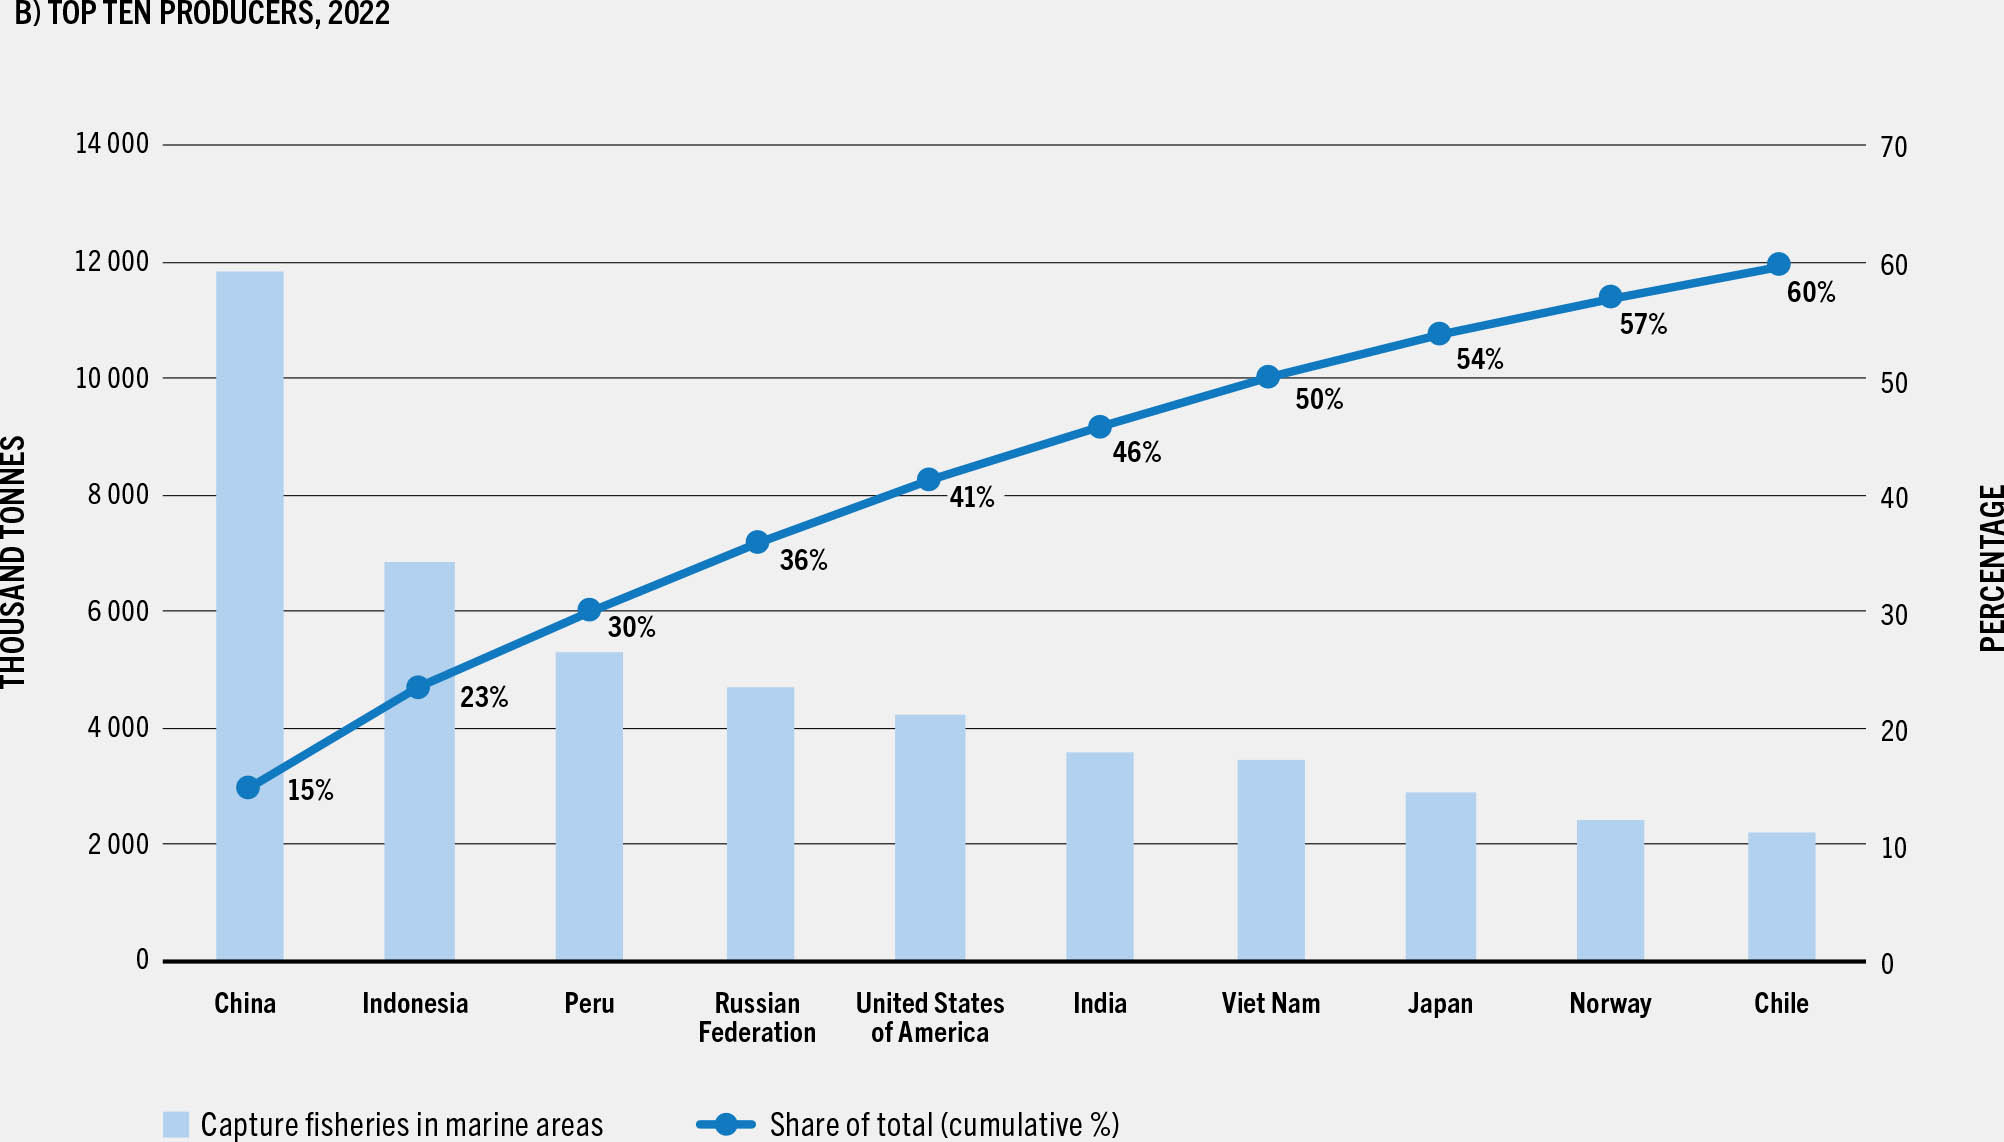
SOURCE: FAO. 2024. FishStat: Global capture production 1950–2022. [Accessed on 29 March 2024]. In: FishStatJ. Available at: www.fao.org/fishery/en/statistics/software/fishstatj. Licence: CC-BY-4.0.
While China remains the world’s top producer of marine captures, its catches have declined by 17.9 percent, from 14.4 million tonnes in 2015 to 11.8 million tonnes in 2022. A continuation of a catch reduction policy beyond the Thirteenth and Fourteenth Five-Year Plans (2016–2020 and 2021–2025) is expected to result in further decreases in coming years, although 2022 marine capture catches were broadly similar to those in 2021.
While China regularly reports capture production data to FAO, in recent years only partial information has been submitted by species and fishing area. In 2022, China reported a total of 2.3 million tonnes for its “distant-water fishery”, but only provided details on species and fishing areas for catches landed in China (Northwest Pacific, area 61). To complement the missing catch data in other fishing areas, catch data were taken from the regional fisheries management organizations (RFMOs), and an additional 1.3 million tonnes were entered into the FAO database under “marine fishes not elsewhere included” in area 61, likely overstating total catches occurring in this area and the species group “other fish and aquatic animals” shown in Figure 15. As the largest marine capture producer, further work is needed – in close collaboration with the official agencies involved – to ensure the timely reporting and correct allocation of China’s capture statistics by fishing area.
FIGURE 15WORLD CAPTURE FISHERIES PRODUCTION OF AQUATIC ANIMALS IN MARINE AREAS BY FAO MAJOR FISHING AREA, AVERAGE 2020–2022

SOURCES: FAO. 2024. FishStat: Global capture production 1950–2022. [Accessed on 29 March 2024]. In: FishStatJ. Available at: www.fao.org/fishery/en/statistics/software/fishstatj. Licence: CC-BY-4.0.
United Nations Geospatial. 2020. Map geodata.
At the regional level, Asian countriesf were responsible for 50.0 percent of global marine captures in 2022, followed by Latin America and the Caribbean (15.6 percent), Europe (16.7 percent), Africa (9.2 percent), Northern America (6.5 percent) and Oceania (2.0 percent).
The FAO global marine capture database includes catches for more than 3 000 species (including “not elsewhere included” categories); finfish account for about 85 percent of total marine capture production in 2022, with small pelagics as the main group, followed by gadiformes and tuna and tuna-like species. An overview of marine catch data by main species and by FAO Major Fishing Area is shown in Figure 15.
The top three marine species have remained unchanged since 2010. In 2022, the catches of anchoveta continued to rank first at almost 4.9 million tonnes per year, in line with recent years but lower than the 2018 peak that exceeded 7.0 million tonnes. Alaska pollock (Gadus chalcogrammus) was second at 3.4 million tonnes, and skipjack tuna (Katsuwonus pelamis) third at 3.1 million tonnes (Table 7). Of the top ten species in 2022 – all finfish – three species, European pilchards (Sardina pilchardus), skipjack tuna and yellowfin tuna (Thunnus albacares), reported catches in 2022 close to their highest levels recorded.
TABLE 7CAPTURE FISHERIES PRODUCTION OF AQUATIC ANIMALS IN MARINE AREAS BY MAJOR SPECIES AND GENUS
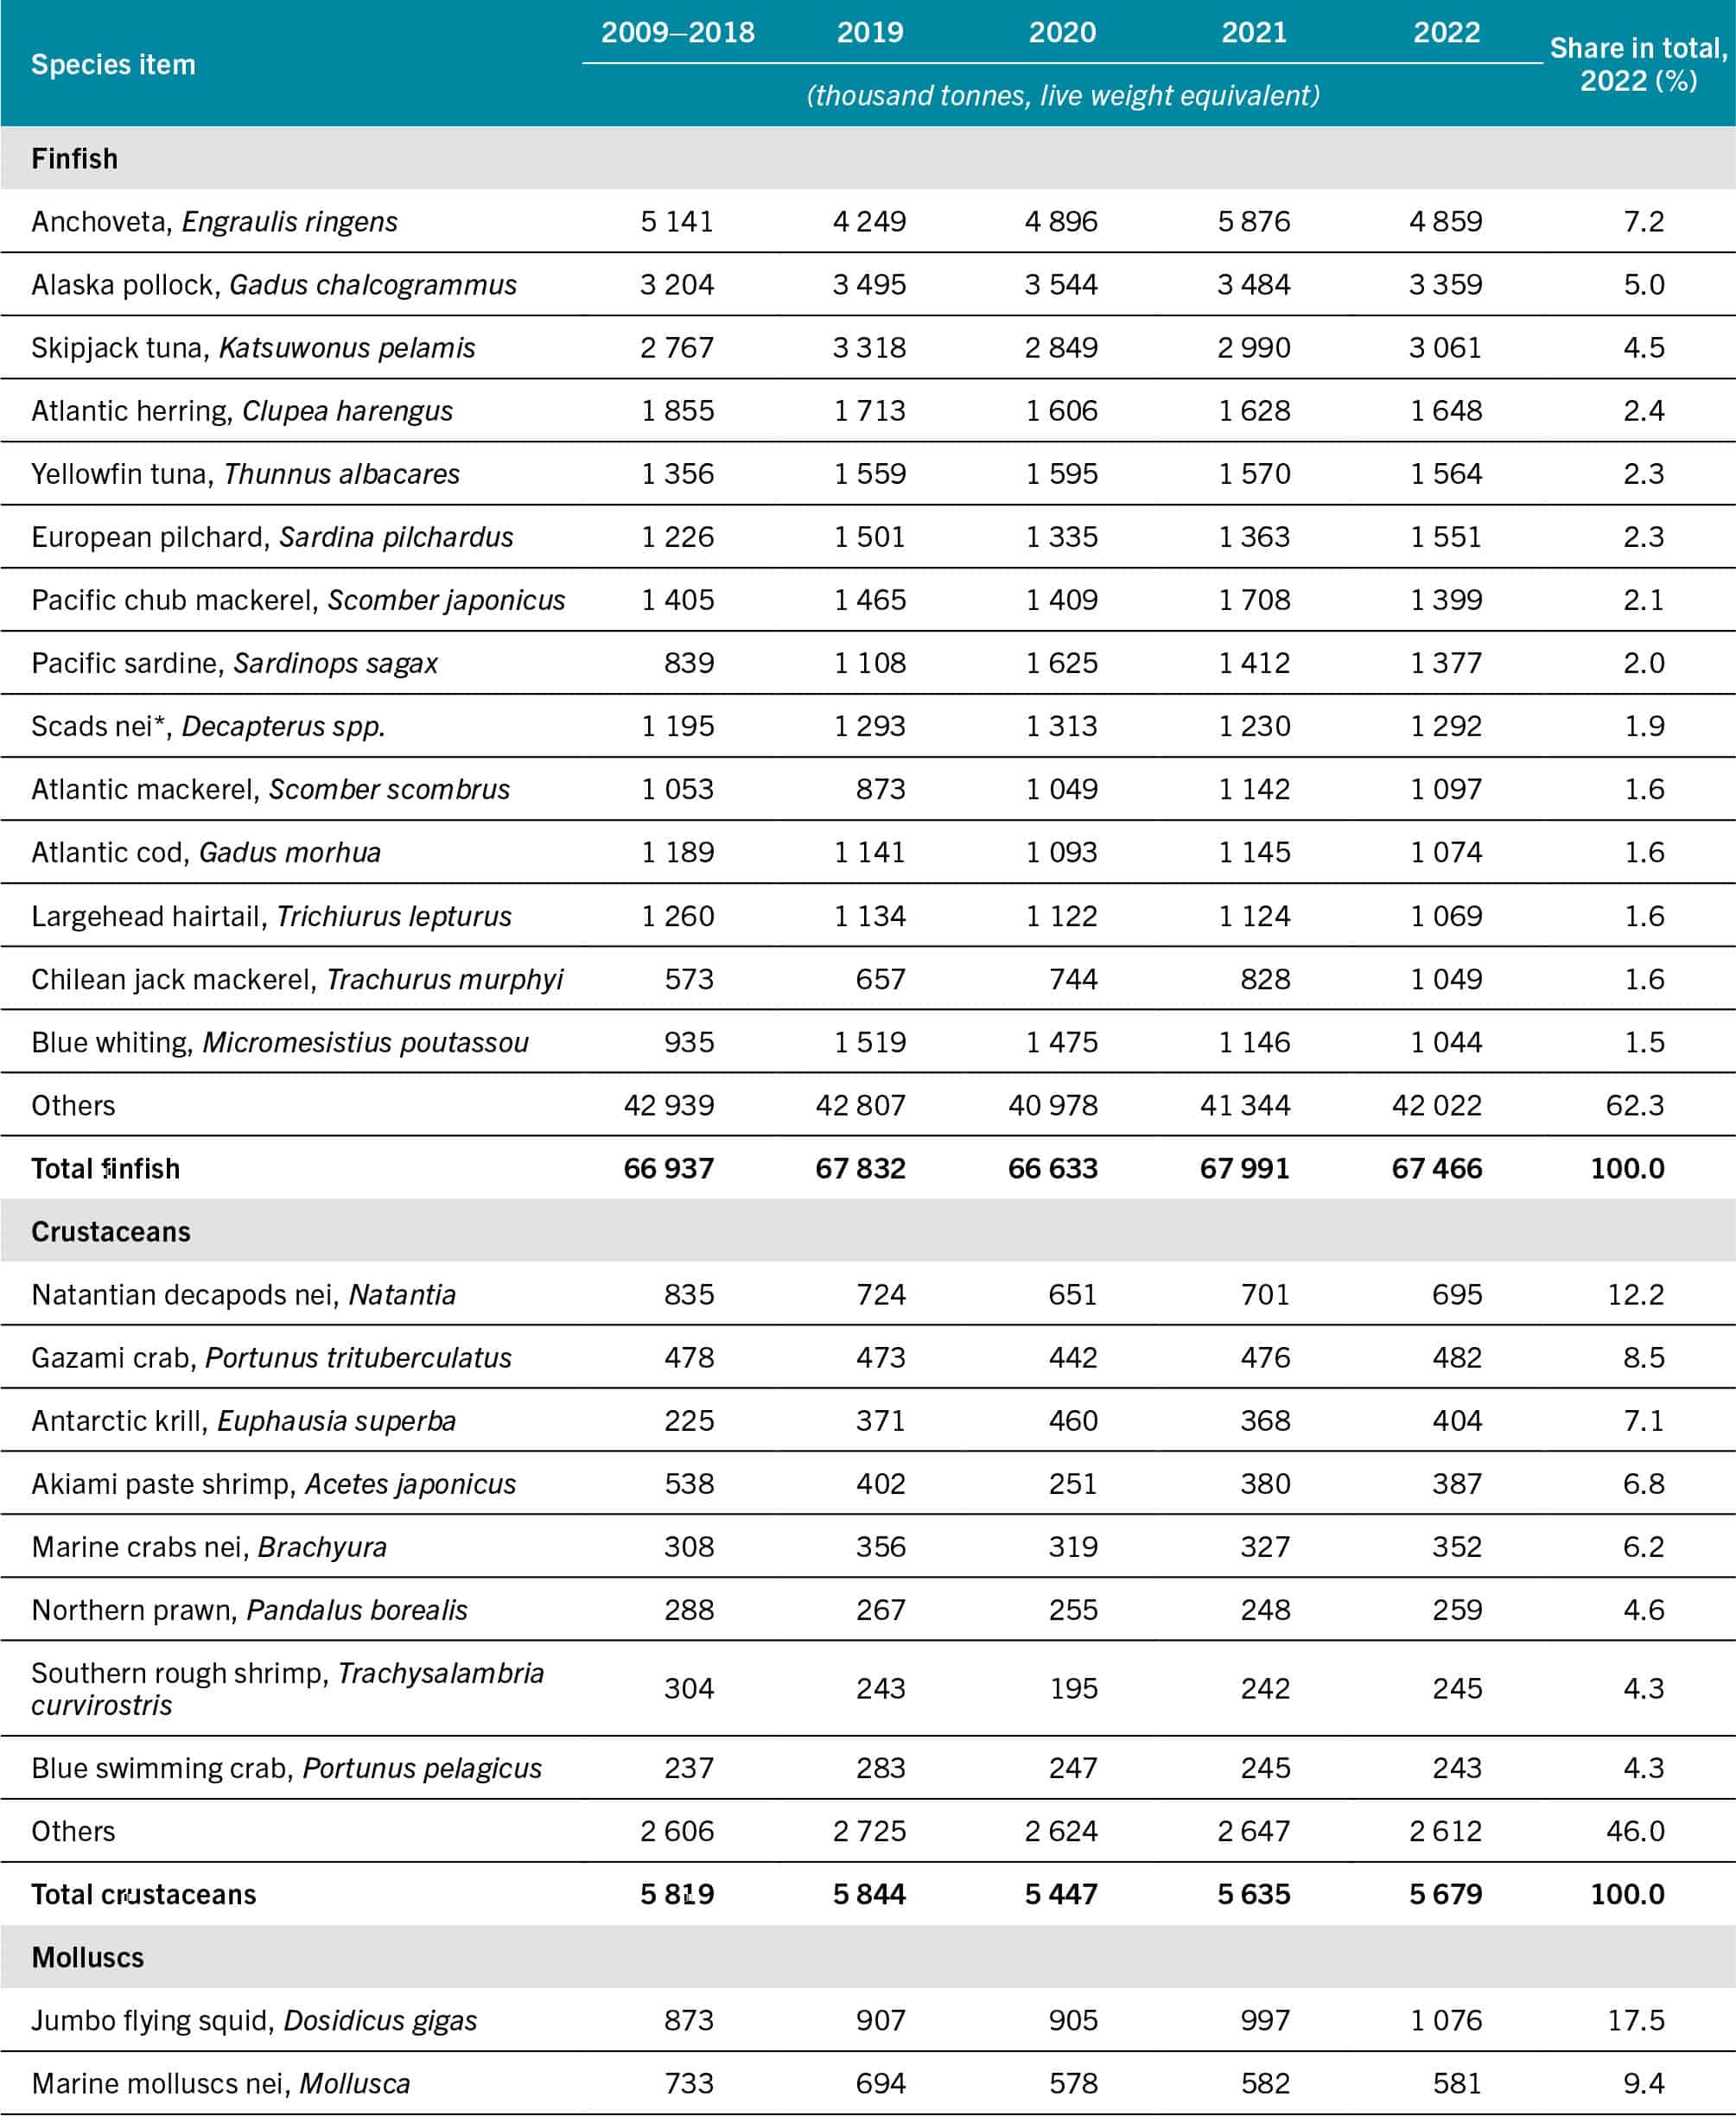

SOURCE: FAO. 2024. FishStat: Global capture production 1950–2022. [Accessed on 29 March 2024]. In: FishStatJ. Available at: www.fao.org/fishery/en/statistics/software/fishstatj. Licence: CC-BY-4.0.
Catches of tunas in particular, one of the most valuable groups, continued to increase, reaching 8.3 million tonnes in 2022, the highest level recorded. Catches of other highly valuable groups such as cephalopods, shrimps and lobsters also maintained their highest levels in 2022. In the case of lobsters – one of the species groups most impacted by COVID-19 restrictions and the closure of export markets – catches have recovered and in 2022 they increased to over 290 000 tonnes, albeit not to the same level as the immediate pre-pandemic years.
Catch statistics by FAO Major Fishing Area for the last four years, as well as marine catches in recent decades, are presented in Table 8.
TABLE 8CAPTURE FISHERIES PRODUCTION OF AQUATIC ANIMALS BY FAO MAJOR FISHING AREA

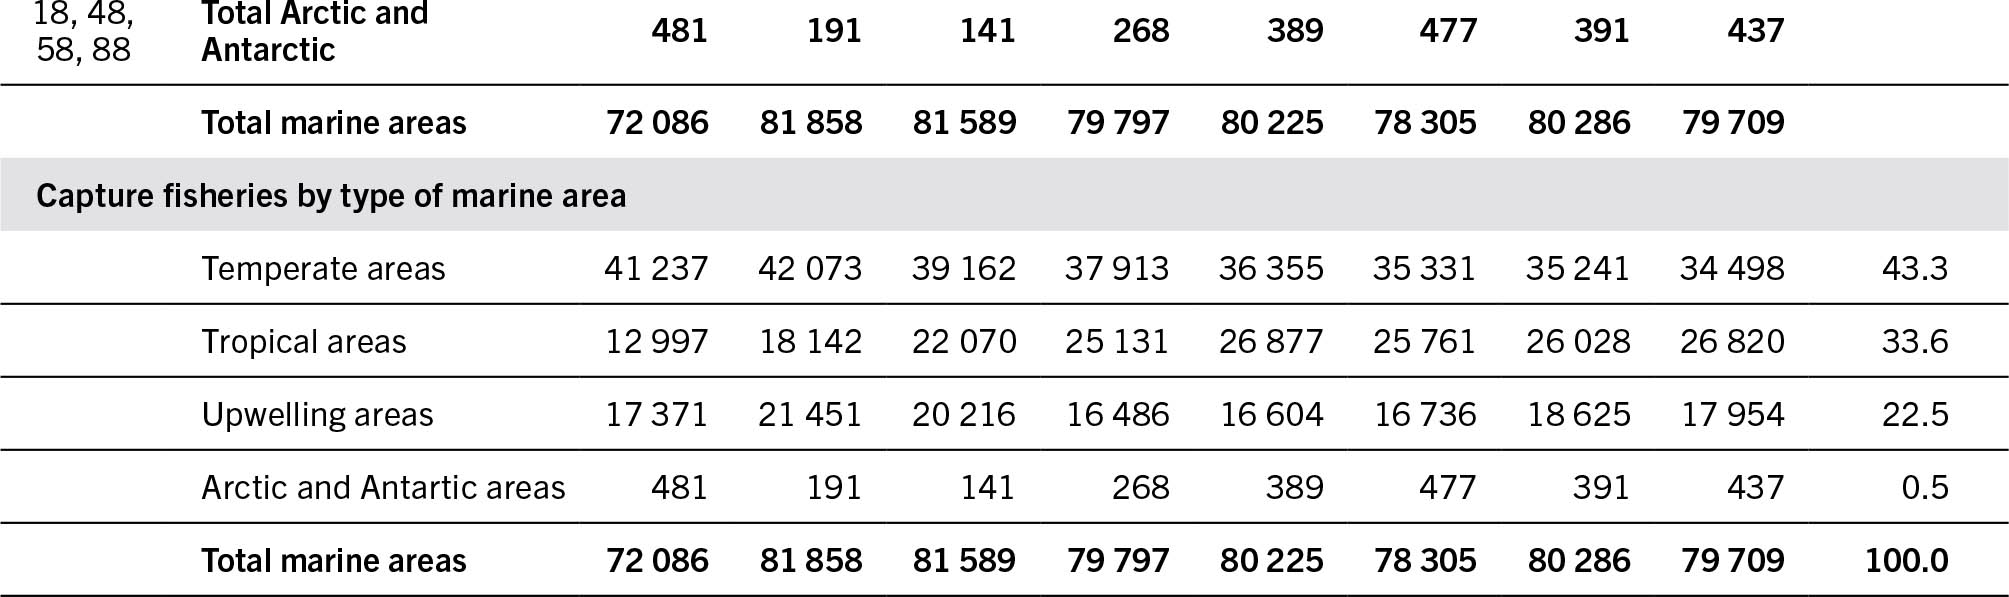
FAO Major Fishing Areas defined as: temperate areas (fishing areas 21, 27, 37, 41, 61, 67 and 81); tropical areas (areas 31, 51, 57 and 71); upwelling areas (areas 34, 47, 77 and 87); Arctic and Antarctic areas (areas 18, 48, 58 and 88).
* Up to 1991.
SOURCE: FAO. 2024. FishStat: Global capture production 1950–2022. [Accessed on 29 March 2024]. In: FishStatJ. Available at: www.fao.org/fishery/en/statistics/software/fishstatj. Licence: CC-BY-4.0.
The contribution to global marine catches varies considerably between fishing areas, with over 50 percent of the marine catches in 2022 occurring in the Northwest Pacific (area 61), Western Central Pacific (area 71) and Southeast Pacific (area 87).
The Northwest Pacific (area 61) continued to have the highest production among the FAO Major Fishing Areas, with 18.6 million tonnes (23.3 percent) of global marine area catches in 2022, driven largely by catches of its two most productive species, Alaska pollock and Pacific sardine (Sardinox sagax). Even after discounting the 1.3 million tonnes in 2022 re-assigned from China’s distant-water fishery, this area still recorded the highest production by a significant margin compared with the Western Central Pacific (area 71), which was second with 13.8 million tonnes or 17.3 percent of global marine area catches in 2022.
The Southeast Pacific (area 87) was the third-highest, producing 9.0 million tonnes in 2022, equivalent to 11.3 percent of global landings. Recent catches in this area indicate a partial reversal of the decreasing trend from the early 1990s to 2016, primarily due to the increase in landings of anchoveta. Fluctuating catches in area 87 are also characteristic of the high annual variability associated with upwelling areas, particularly in the case of anchoveta, which accounts for 50–70 percent of total catches in this area, as well as jumbo flying squid (Dosidicus gigas).
All-time record marine captures in 2022 were also notable for the following fishing areas:
- Eastern Central Atlantic (area 34): 5.5 million tonnes in 2022. This area is characterized by great biological diversity including coastal and offshore pelagic resources and deep demersal resources. The 2022 catches continued the upward trend observed since the 1970s, notable in particular for the increasing catches of European pilchards.
- Western Central Pacific (area 71): 13.8 million tonnes in 2022. Tuna and tuna-like species are important and account for the area’s top two most productive species (skipjack tuna and yellowfin tuna). In addition, the area is characterized by small pelagic species such as sardines, anchovies and scads. However, this area is also noted for the substantial proportion of catches reported as “marine fishes not elsewhere included” (23 percent in 2022), or other generic categories.
- Western Indian Ocean (area 51): 5.7 million tonnes in 2022. Tunas and tuna-like species contribute the most in this fishing area, followed by small pelagics and mixed (mainly reef-associated) fishes. Catches in the Indian Ocean have generally increased steadily since the 1950s, driven in particular by catches in the Eastern Indian Ocean (area 57); however, in recent years, catches have decreased due to a reduction in fishing pressure.
In light of the 2023 Agreement under the United Nations Convention on the Law of the Sea on the Conservation and Sustainable Use of Marine Biological Diversity of Areas beyond National Jurisdiction, there is a growing interest in the management of high seas resources – due in part to general concerns regarding overfishing, but also to better understand the status of exploitation of the species in these areas (see Fisheries and aquaculture in the context of global biodiversity agreements, p. 205). High seas areas are defined as those occurring outside exclusive economic zones (EEZs), that is, extending beyond 200 nautical miles into the sea and covering nearly two-thirds of the world’s oceans. Unfortunately, it is not possible to assess the status of fishing on the high seas, because the FAO global capture fisheries statistics make no distinction between those taken within EEZs and those taken on the high seas. In the annual data calls, countries are requested to report to FAO their capture fisheries production by species and by fishing area. The FAO Major Fishing Areas were established in the 1950s, many years before the EEZs, and are therefore the two are not directly comparable.
Indications of prevailing trends in high seas catches can be obtained through an analysis of the catches of oceanic (epipelagic and “deep-water”) species that are likely to occur in high seas areas. The total catches of these species indicate an increase since the 1950s, from 1 million tonnes to about 11 million tonnes in 2022, with more sustained growth from the late 1970s to the mid-2000s, in particular for deep-water resources, due to technological developments facilitating fishing in deeper waters as well as the need to exploit new fishing grounds following reduced opportunities owing to extended jurisdictions and declining resources in coastal areas.
Inland waters capture production
In 2022, global catches in inland waters were 11.3 million tonnes (Table 9), a decrease of 0.3 percent from 2021. While fishing in inland waters was also severely impacted by the COVID-19 pandemic during 2020, recent trends in global inland water production have been driven more by the recent decline in China’s catches. Otherwise, global inland water catches appear to remain relatively static – according to the officially reported data – and marginally below the highest level of 12.1 million tonnes recorded in 2018.
TABLE 9CAPTURE FISHERIES PRODUCTION OF AQUATIC ANIMALS IN INLAND WATERS BY MAJOR PRODUCER AND REGION


* Includes Union of Soviet Socialist Republics up to 1991.
SOURCE: FAO. 2024. FishStat: Global capture production 1950–2022. [Accessed on 29 March 2024]. In: FishStatJ. Available at: www.fao.org/fishery/en/statistics/software/fishstatj. Licence: CC-BY-4.0.
Since 2020, China has no longer been the top inland water producer. It was surpassed in 2022 by India and Bangladesh with catches of 1.9 million tonnes and 1.3 million tonnes, respectively. While China continues to be in the top three inland water capture producers (1.2 million tonnes in 2022), official catches have decreased by almost 47 percent from 2.2 million tonnes in 2017 as a result of policies by China’s Ministry of Agriculture and Rural Affairs, most notably a ten-year fishing ban in the waters of the Yangtze River, that aims for conservation of living aquatic resources. The decrease in China’s inland water catches has also been offset by the expansion of inland aquaculture and culture-based fisheries that has resulted in an overall increase in China’s total inland water production over the same period.
With the exception of China, the relatively modest growth in inland water catches in recent years has been driven by increasing production among several of the major producing countries – notably Bangladesh, India and the United Republic of Tanzania.
However, assessing the long-term trend in inland waters capture production is problematic. The catch increases of the last 20 years are partly attributed to improvements in reporting and assessment at the country level, rather than an actual increase in catches reported by some countries. These improvements may also mask static or declining trends in inland water fisheries. Many of the national data collection systems for inland waters continue to be unreliable and of low quality, or in some cases non-existent, leading to underestimation of inland water catches – including for several major producers. Catches for subsistence fisheries and recreational fisheries are generally either under-reported or missing entirely from official catches. Many countries also do not report, or report only partial inland water catches to FAO. Hence work has recently been undertaken by FAO to evaluate the potential of alternative methods to address these gaps and improve FAO’s inland water fisheries statistics (Box 2).
BOX 2EVALUATING THE STATUS OF FAO’S INLAND FISHERY STATISTICS
While the quality and completeness of inland water fisheries statistics have improved significantly in recent years, there continue to be persistent issues with the collection and reporting of the relevant data to FAO.
The importance of inland fisheries for national and global food security and livelihoods, especially in low-income food-deficit countries and landlocked developing countries, is well recognized. Unfortunately, production statistics are not routinely collected by many countries, jeopardizing the development of national and regional fisheries policy and planning, and the management and conservation of resources and ecosystems, all of which require updated and reliable statistics. Fisheries administration and stakeholders are also often marginalized within the circle of policy- and decision-makers in charge of inland water resources management, and improved statistics can help reduce this marginalization (see Management priorities for inland fisheries, p. 163).
The official inland fisheries data reported to FAO are often incomplete in terms of fisheries coverage or reported species. The wide species diversity of inland fisheries contrasts with the relatively low number of species actually reported by many countries. As a result, in many cases only major target or commercial species are being routinely monitored. Consequently, around 50 percent of global inland water catches are only available at the highest level of aggregation, the so-called freshwater fishes nei (Actinopterygii). The contribution of low value, but locally important catches of informal or subsistence fisheries in inland waters is either under-reported or excluded entirely. Countries that have improved catch surveys or reporting commonly do not include retrospective analysis or revisions to the historical time series, creating breaks in the time series or year-on-year increases in catches as an artefact of improvements in the data collection.
These issues are largely driven by the practical challenges of monitoring inland fisheries, which are predominantly small-scale, often highly dispersed, and seasonal or occasional in terms of fishing operations. Inland water fishing also occurs in diverse environments such as large lakes, reservoirs, rivers and floodplains, streams, and rice fields. For many inland fisheries, particularly those that constitute a critical source of nutrition for local communities, these practical challenges are compounded by limited resources available for monitoring and management of inland waters. Most inland water producers are in less advanced economies, with five of the top ten inland water producers categorized as least developed countries* (Bangladesh, Cambodia, Myanmar, Uganda and United Republic of Tanzania).
Consequently, FAO estimates or adjusts a higher proportion of catches from inland fisheries than from marine fisheries – in some cases based on limited alternative information of the prevailing trends occurring within the fisheries in question. Catch estimates may also be repeated over several years, potentially leading to systematic under- or over-reporting.
To address this situation, FAO has proactively initiated an assessment of inland fisheries statistics that are publicly disseminated. The aim is to identify countries where efforts and future support may be needed to strengthen the collection of data from inland water fisheries. FAO is developing technical guidelines to assess the potential of alternative methods to estimate inland water catch production alongside conventional catch assessment surveys. This includes an evaluation of predictive methods, for example, fish habitat models, fishing effort density models, and inference-based methods such as fish consumption models. The objective is to improve the overall quality of national and FAO inland fisheries statistics, increasing recognition in policy fora discussing the importance and critical contribution of inland fisheries for food security, livelihoods and poverty alleviation, as well as aquatic resources management.
© FAO/Luis Tato
The lack of species granularity available for inland water capture fisheries is a persistent and longstanding issue. Despite improvements in the monitoring of inland waters by many countries, 50 percent of global inland water capture production is available only at the highest level of aggregation of the so-called freshwater fishes nei (Actinopterygii) – a figure that has remained largely unchanged in the last 20 years. This proportion of unidentified catches, however, varies significantly between countries and regions, ranging from as low as 10 percent for Europe to over 60 percent for some countries in Asia.
One of the main species groups, “carps, barbels and other cyprinids”, has shown a continuous increase, rising from around 0.7 million tonnes per year in the mid-2000s to almost 1.8 million tonnes in 2022, and accounts for most of the increase in catches from inland waters in recent years. Catches of “tilapias and other cichlids” have also increased in recent years from less than 0.7 million tonnes to over 0.8 million tonnes per year. Catches of “freshwater crustaceans” remained stable at between 0.4 million tonnes and 0.45 million tonnes per year but have fallen in recent years to 0.27 million tonnes in 2022, mostly as a result of the decrease in China’s inland water catches.
Captures in inland waters are more concentrated than in marine areas. They are harvested by many major producers in areas endowed with important waterbodies or river basins (Figure 16a and Figure 16b). In 2022, 14 countries produced over 75 percent of total inland captures, compared with 19 countries for marine captures. Most major inland water producers are located in less developed economies – with over 90 percent of total inland water captures occurring in Asia and Africa, where producing countries face severe challenges in monitoring inland fisheries that are by their nature highly dispersed, complex in operation and resource intensive to monitor.
FIGURE 16CAPTURE FISHERIES PRODUCTION OF AQUATIC ANIMALS IN INLAND WATERS

SOURCE: United Nations Geospatial. 2020. Map geodata.

SOURCE: FAO. 2024. FishStat: Global capture production 1950–2022. [Accessed on 29 March 2024]. In: FishStatJ. Available at: www.fao.org/fishery/en/statistics/software/fishstatj. Licence: CC-BY-4.0.
Asia has consistently accounted for over 60 percent of global inland water production since the mid-1990s (7.2 million tonnes in 2022) and includes the top five producers harvesting over 50 percent of inland water catches in 2022. However, in many Asian countries, the historical contribution of inland fisheries is complemented or replaced by the contribution of aquaculture.
The situation in Africa is markedly different. With 3.3 million tonnes harvested in 2022, accounting for around 29 percent of global inland captures, for many African countries inland fisheries represent an important source of food security compared with the relatively small contribution of aquaculture. For many landlocked countries in Africa, inland water capture fisheries represent between 80 percent and 100 percent of total production of aquatic animals (Figure 17). This production is important but also highly uncertain for many of these countries (e.g. Chad, Democratic Republic of the Congo and Nigeria), stressing the urgent need for effective monitoring and management of the sector.
FIGURE 17SHARE OF CAPTURE FISHERIES IN INLAND WATERS IN TOTAL FISHERIES AND AQUACULTURE PRODUCTION OF AQUATIC ANIMALS BY VOLUME, AVERAGE 2020–2022

NOTES: Aquatic animals excluding aquatic mammals, crocodiles, alligators, caimans, aquatic products (corals, pearls, shells and sponges) and algae. Based on live weight equivalent.
SOURCES: FAO. 2024. FishStat: Global capture production 1950–2022. [Accessed on 29 March 2024]. In: FishStatJ. Available at: www.fao.org/fishery/en/statistics/software/fishstatj. Licence: CC-BY-4.0.
United Nations Geospatial. 2020. Map geodata.
Data quality of FAO capture statistics
National reports are the main, although not the only, source of data used to maintain and update FAO’s capture fishery databases. Hence, the quality of FAO statistics is highly dependent on the accuracy, completeness and timeliness of the data collected by national fisheries institutions and reported annually to FAO.
Often, the data submitted are incomplete, inconsistent or do not comply with international reporting standards, and FAO works to curate the data as far as possible in collaboration with Members. Unfortunately, in many cases the countries concerned do not respond to FAO calls to address the identified official data issues. In such cases and in the event of inconsistencies in the data, FAO may make estimates or adjustments based on the best data available from alternative official data sources (including data published by RFMOs, or through standard methodologies).
Issues of timeliness or the non-reporting of the data to FAO by Member Nations also persist, affecting the overall quality of FAO’s estimates of total capture fisheries production. Late submissions of questionnaires make it challenging for FAO to process, validate and review the statistics – in particular for the most recent year – prior to the official annual release of the data, usually in mid-March.
While most capture fisheries production statistics are reported by the largest producers, ensuring the reliability of FAO estimates of global capture production, FAO continues to express concern regarding issues of data submission or data quality for some important countries.


