
Total production of aquatic animals has increased over the decades, going from 19 million tonnes (live weight equivalent) in 1950 to an all-time record of over 185 million tonnes in 2022, with an average annual growth rate of 3.2 percent. The total first sale value was estimated at USD 452 billion in 2022, of which USD 296 billion came from aquaculture production.
The overall growth of production has been regular since 1950, except for a few marginal declines. The last decline was experienced in 2019 (−0.8 percent compared with 2018), followed by static production in 2020 and subsequent yearly increases of 3.0 percent in 2021 and 1.5 percent in 2022. The stagnation during 2019 and 2020 was mainly linked to a marginal decline in capture fisheries caused by fluctuating catches of pelagic species (particularly anchoveta), the reduction in China’s catches and the impacts on the sector of the COVID-19 pandemic in 2020.
Global capture fisheries production has been relatively stable since the late 1980s, fluctuating between 86 million tonnes and 94 million tonnes per year with an isolated peak at 96 million tonnes in 2018. Aquaculture on the other hand has grown significantly during the same period (Figure 3), albeit at a slower rate during the last two decades. Aquaculture growth averaged 6.1 percent per year in the 2000s, 4.4 percent in the 2010s and 3.7 percent in the first three years of the 2020s. These decelerations are due to a range of factors, including the impact of recent policy changes in China focused on environmental protection, and reductions in the availability of land, water and sites suitable for aquaculture in the traditional producing regions and countries.
FIGURE 3WORLD FISHERIES AND AQUACULTURE PRODUCTION

SOURCE: FAO. 2024. FishStat: Global production by production source 1950–2022. [Accessed on 29 March 2024]. In: FishStatJ. Available at: www.fao.org/fishery/en/statistics/software/fishstatj. Licence: CC-BY-4.0.
The share of aquaculture in total production was around 4 to 5 percent during the period 1950–1970, before rapidly rising to 20 percent in the 1990s and 44 percent in the 2010s. The year 2022 marked the first time in history that aquaculture production of aquatic animals surpassed capture fisheries production. Of the 185 million tonnes of aquatic animals produced in 2022, 51 percent (94 million tonnes) was from aquaculture and 49 percent (91 million tonnes) from capture fisheries. Aquaculture production in 2022 represents the second-highest yearly amount of aquatic animal production by subsector, following the over 96 million tonnes produced by capture fisheries in 2018.
Of the total production of aquatic animals in 2022, 62 percent (115 million tonnes) was harvested in marine areas (69 percent from capture fisheries, 31 percent from aquaculture) and 38 percent (70 million tonnes) in inland waters (84 percent from aquaculture, 16 percent from capture fisheries). The expansion of aquaculture in the last few decades has boosted the overall growth of production in inland waters. Between the 1950s and the late 1980s, fisheries and aquaculture production in inland waters fluctuated at around 12 percent of the total production of aquatic animals. With the growth of aquaculture production, this gradually increased to 18 percent in the 1990s, 26 percent in the 2000s and 35 percent in the 2010s. Capture fisheries in marine areas remain however the main source of production (43 percent of total aquatic animal production in 2022); still, this is well below the 87 percent share during 1950–1980. Marine capture fisheries are also the dominant method of production for several species and have remained fairly stable since the late 1980s at around 80 million tonnes, with some interannual fluctuations (up and down) in the range of 3–4 million tonnes.
These general trends mask important variations between continents, regions and countries. In 2022, Asian countries produced 70 percent of the total output of aquatic animals, followed by countries in Europe and Latin America and the Caribbean (9 percent each), Africa (7 percent), Northern America (3 percent) and Oceania (1 percent).d Overall, total fisheries and aquaculture production has seen important increases in most of the continents in the last few decades (Figure 4). The exceptions are Europe (with a gradual decrease from the late 1980s, but recovering slightly since the late 2000s with some interannual fluctuations), Northern America and Latin America and the Caribbean (with several ups and downs since the peak of the mid-1990s, mainly due to fluctuations in catches of anchoveta). Total production has almost doubled during the last 20 years in Africa and Asia.
FIGURE 4WORLD FISHERIES AND AQUACULTURE PRODUCTION OF AQUATIC ANIMALS BY REGION, 1950–2022

* Europe includes data for the Union of Soviet Socialist Republics for the years 1950–1991.
SOURCE: FAO. 2024. FishStat: Global production by production source 1950–2022. [Accessed on 29 March 2024]. In: FishStatJ. Available at: www.fao.org/fishery/en/statistics/software/fishstatj. Licence: CC-BY-4.0.
In 2022, China remained the major producer (36 percent of the total production of aquatic animals), followed by India (8 percent), Indonesia (7 percent), Viet Nam (5 percent) and Peru (3 percent). These five countries were responsible for about 59 percent of the world production of aquatic animals in 2022. Differences exist also in terms of the sector’s contribution to economic development.e In recent decades, the share of total fisheries and aquaculture production of aquatic animals harvested by non-high-income countries (as per 2024 World Bank classification) has increased, rising from about 33 percent in the 1950s to 84 percent in 2022. Upper-middle-income countries, including China, were responsible for 56 percent of the total production of aquatic animals in 2022, followed by lower-middle-income countries (26 percent), high-income countries (16 percent) and low-income countries (2 percent).
An analysis of the 2022 global fisheries and aquaculture data by FAO Major Fishing Area reveals significant differences. About 34 percent of the total production of aquatic animals came from inland waters in Asia, followed by 22 percent in the Pacific Northwest and 10 percent in the Western Central Pacific. It is worth highlighting that, while in the 1950s more than 40 percent of total production was harvested in the Atlantic Ocean and adjacent area, in contrast, the largest share of total production in 2022 originated in the Pacific Ocean (41 percent) against just 13 percent in the Atlantic Ocean (Figure 5). Production differs from area to area depending also on a range of factors, including the level of development of the coastal country to fully exploit its fishery resources, including through fishing agreements with distant water fishing nations; the fisheries and aquaculture management measures implemented; the amount of illegal, unreported and unregulated (IUU) fishing; the status of fishery stocks; the availability and productivity of inland waters; and the species harvested. As an example of the latter, in some fishing areas, capture fisheries production may vary more when catches comprise predominantly small pelagic fish, because they are more prone to significant fluctuations linked to climatic variability; this is the case for catches of anchoveta in the Pacific Southeast in South America (see Impacts of El Niño on marine fisheries and aquaculture, p. 202).
FIGURE 5WORLD FISHERIES AND AQUACULTURE PRODUCTION OF AQUATIC ANIMALS BY AREA AND RELATIVE SHARES OF WORLD PRODUCTION, 2022
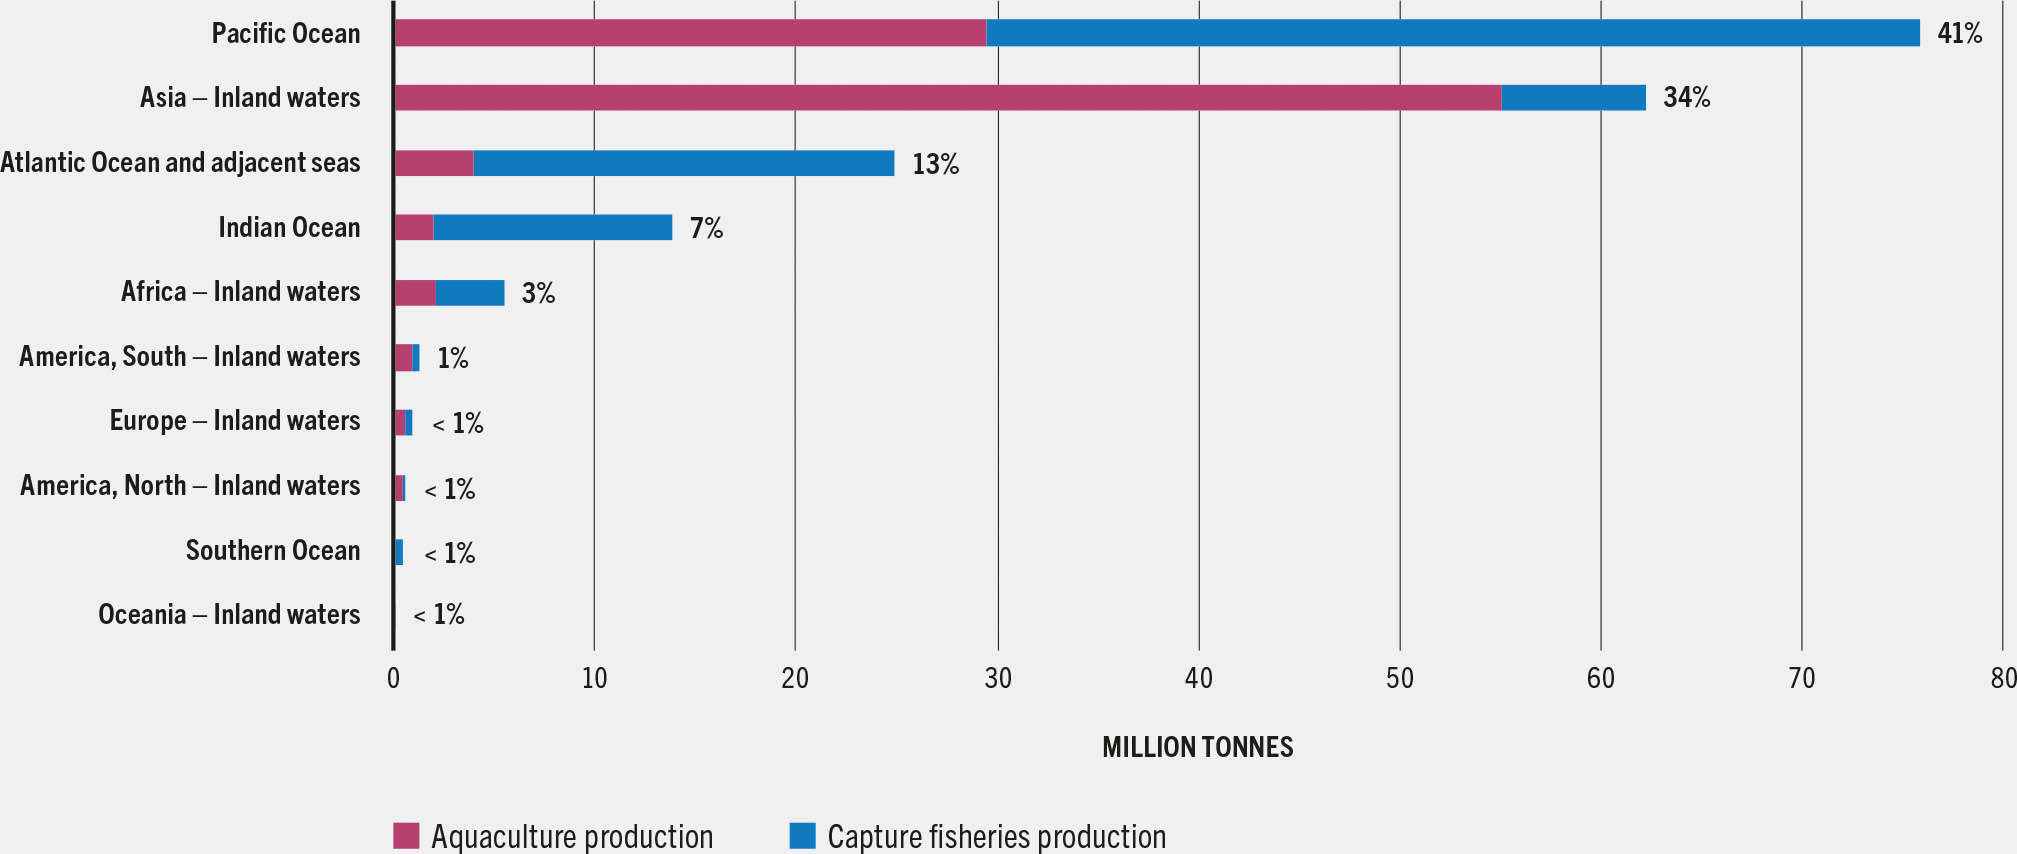
SOURCE: FAO. 2024. FishStat: Global production by production source 1950–2022. [Accessed on 29 March 2024]. In: FishStatJ. Available at: www.fao.org/fishery/en/statistics/software/fishstatj. Licence: CC-BY-4.0.
The number of species harvested has varied greatly over the years, with major differences from region to region. Until the late 1970s, finfish represented about 90 percent of the total production of aquatic animals, compared with 75 percent in 2022; this was due to the increase in aquaculture production, which caused a rise in the shares of molluscs and crustaceans. In 2022, marine fishes represented 50 percent of the total finfish and 38 percent of the total aquatic animal production, followed by freshwater fishes, representing 44 percent of the total finfish and 33 percent of the total aquatic animal production. Carps, barbels and other cyprinids represented the main group of species produced in 2022, with a share of 18 percent of the production of aquatic animals, followed by miscellaneous freshwater species (11 percent) and Clupeiformes such as herrings, sardines and anchovies (10 percent). At the species level, whiteleg shrimp (Penaeus vannamei), with 6.8 million tonnes, was the top species produced in 2022, closely followed by cupped oysters nei (Crassostrea spp., 6.2 million tonnes), grass carp (=white amur; Ctenopharyngodon idellus, 6.2 million tonnes), Nile tilapia (Oreochromis niloticus, 5.3 million tonnes), silver carp (Hypophthalmichthys molitrix, 5.1 million tonnes) and anchoveta (=Peruvian anchovy; Engraulis ringens, 4.9 million tonnes). It is worthy of note that aquaculture was the main source of production of the top five species and of eight of the top ten species of aquatic animals in 2022 (Figure 6).
FIGURE 6WORLD FISHERIES AND AQUACULTURE PRODUCTION OF AQUATIC ANIMALS BY ISSCAAP DIVISION AND TOP TEN SPECIES ITEMS, 2022
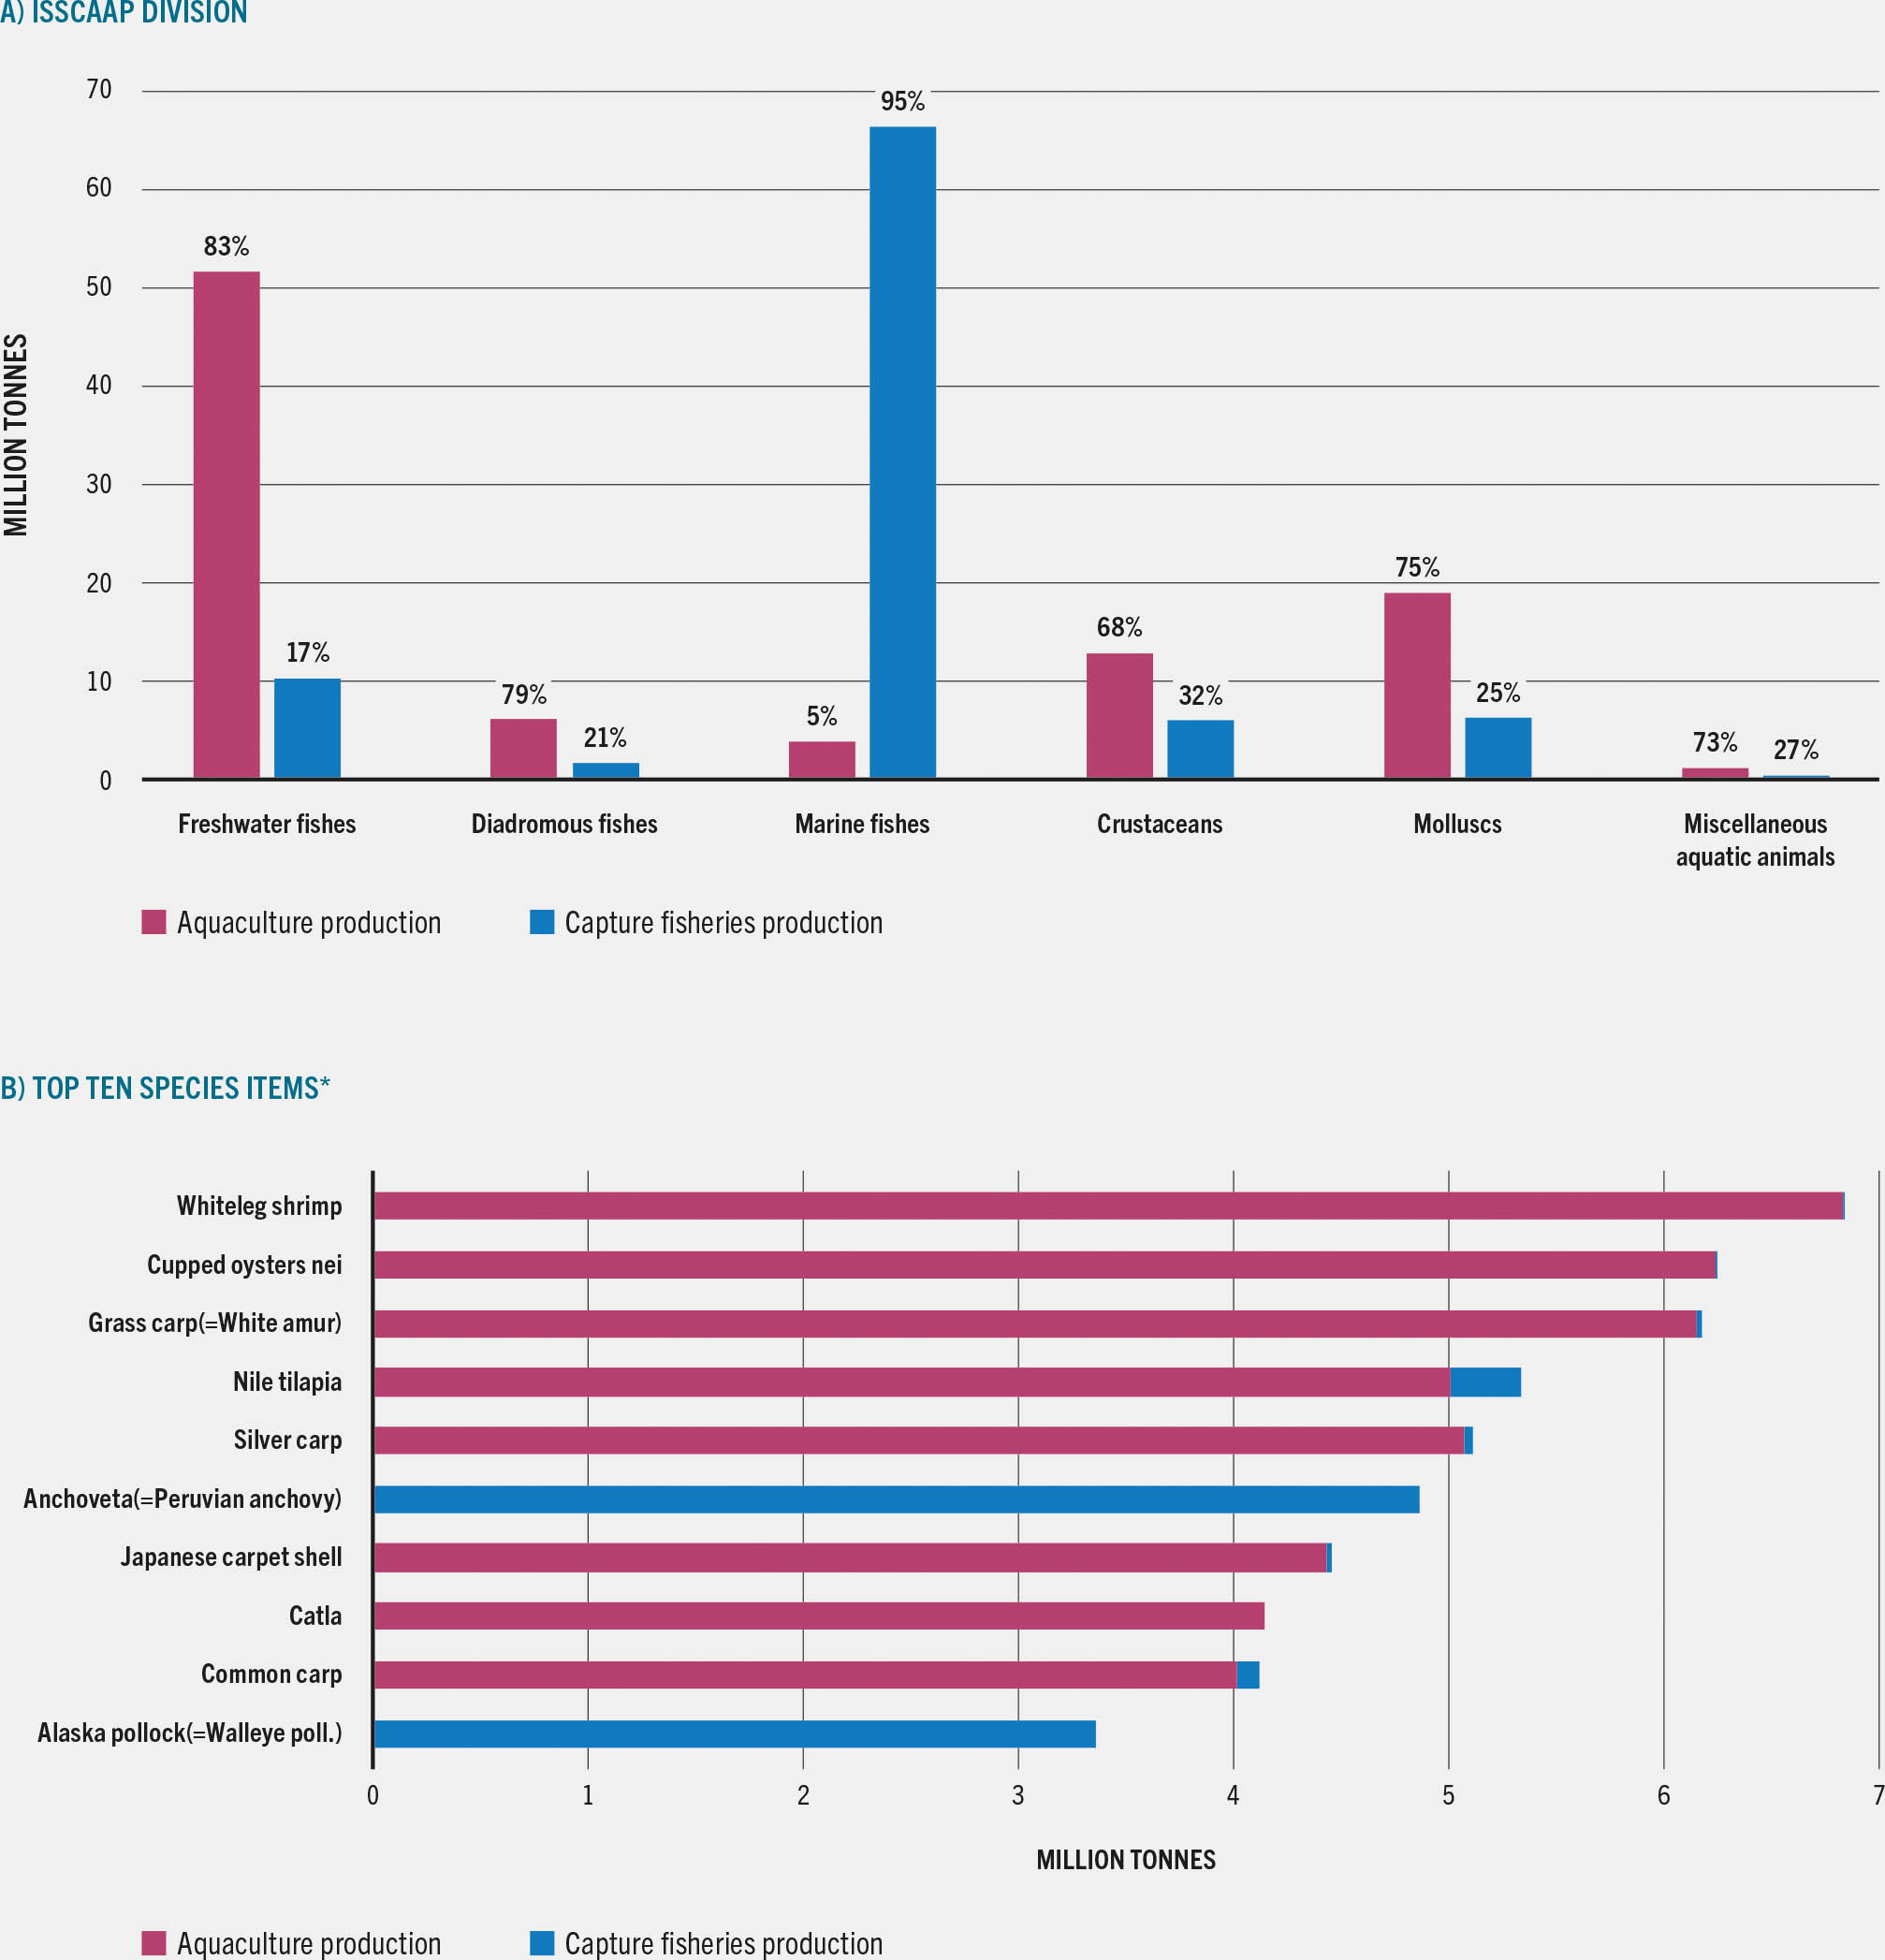
Aquatic animals excluding aquatic mammals, crocodiles, alligators, caimans, aquatic products (corals, pearls, shells and sponges) and algae. Data expressed in live weight equivalent.
* Excluding species items "marine fishes nei" and “freshwater fishes nei".
SOURCE: FAO. 2024. FishStat: Global production by production source 1950–2022. [Accessed on 29 March 2024]. In: FishStatJ. Available at: www.fao.org/fishery/en/statistics/software/fishstatj. Licence: CC-BY-4.0.
Production of algae reached 38 million tonnes (wet weight) in 2022, of which 97 percent originated from aquaculture. This is a 4 percent increase from 2020, continuing the impressive growth of the last decades, from just 12 million tonnes in 2000. Asian countries produced 97 percent of the total, with China alone accounting for 60 percent of the overall total algae produced, followed by Indonesia (25 percent), the Republic of Korea (5 percent) and the Philippines (4 percent). In addition, there were 10 420 tonnes of aquatic products such as sponges, corals, shells and pearls harvested from both aquaculture and capture fisheries operations.
Total production of algae, aquatic animals and aquatic products reached an all-time record of 223 million tonnes in 2022, with an overall growth of 1.9 percent compared with 2021 and 4.4 percent compared with 2020. Since 2013, aquaculture has overtaken capture fisheries as the primary source of total production, and this share reached 59 percent in 2022 (see Figure 3, p. 8). Of the 223 million tonnes, Asian countries produced 75 percent, followed by countries in Europe and Latin America and the Caribbean (8 percent each), Africa (6 percent), Northern America (3 percent) and Oceania (1 percent). China further confirmed its role as top producer with a share of 40 percent of the total, followed by Indonesia (10 percent) and India (7 percent). The overall value of total fisheries and aquaculture production was USD 472 billion in 2022.
- d The percentages do not add up to a total of 100 due to data on not identified countries (others nei) and rounding issues.
- e The analysis by income groups carried out in this publication is based on the World Bank income group classification (2024 revision) that assigns the world’s economies to four income groups: low, lower-middle, upper-middle and high. More information about the classification, including the country composition for each of the four groups, is available at: https://datatopics.worldbank.org/world-development-indicators/the-world-by-income-and-region.html


