
In today’s interconnected world, overlaying and compounding risks lead to both indirect and direct impacts on agriculture. Risk is omnipresent and is growing at a rate that is outstripping our efforts to reduce it. The interconnectedness of global systems, including food systems, means they are more vulnerable in an increasingly uncertain and changing risk landscape. Global risks like climate change, environmental degradation and biodiversity loss are existential in nature, and contribute to increasing disaster risk. Beyond the direct impact of disasters, indirect, cascading impacts are also significant, even at the global level. This section discusses the systemic nature of risk from the perspective of the agriculture sector.
Addressing risk requires not only an assessment of the direct impacts of disasters, but also an understanding of how the impact of disasters cascade within and across sectors and over geographic areas, the way in which elements of affected systems interact with each other during a hazard event and the systemic factors driving risks. This depends on the context in which the risk manifests, including the adverse or positive outcomes of policies and actions. The future cost of damage and loss will continue to escalate unless vulnerability and exposure to hazards, along with other concurrent crises, are systematically addressed.
This part of the report builds on the analysis presented in Part 2 by advancing an understanding of the drivers and the increasing exposure to systemic risk in agriculture. It does so through a series of case studies selected based on four criteria: i) scale of impacts; ii) data availability; iii) recent occurrence; and iv) evidence of implications on a scale from the origin of the hazard to global. The study cases that are presented reflect the main underlying risk drivers, which are climate change, pandemics and epidemics, and conflicts. The limited availability of case studies and data sets restricts the amount of evidence that can be drawn upon, and although disasters and crises affect vulnerable populations such as women, older persons, persons with disabilities, migrants, or Indigenous Peoples, it was not possible at this stage to unpack these subdimensions in detail within the following case studies.
The first section of Part 3 focuses on climate change as a risk driver in agriculture. An impact modelling approach is deployed based on attribution science to disentangle the effect that climate change has on agricultural yields and increased disaster risk. If climate change impacts further increase, some extreme events are likely to become more frequent, with a higher likelihood of unprecedented intensities, durations or spatial extent. The analysis in this section is limited in geographic and product scope, but the modelling approach demonstrates a method that can potentially be expanded and scaled up. Advancing the understanding of how disaster-affected yields were influenced by climate change in the past is important to enhance the understanding of this driver in the evolving risk landscape.
In the following section, the discussion moves to the impacts of biological hazards – pandemic and epidemic – which also cause substantial damage and loss in agriculture and the agrifood systems. The COVID-19 emergency is analysed as an example of a pandemic, while the African swine fever (ASF) outbreak is presented as a case of an epidemic. The cascading global impacts of these disasters caused by biological hazards and their interplay with underlying risk drivers are analysed. Information on armed conflicts in the Syrian Arab Republic, Somalia and Ukraine complements this section as a key example of this type of hazard and its impact.
These case studies contribute to an understanding of risk and of the cascading nature of systemic risks. Climate change is driving a rise in the frequency and intensity of natural hazards. Starting off as a public health disaster, the COVID-19 pandemic amplified existing risks and vulnerabilities and aggravated losses in agriculture by restricting access to resources and services. ASF is a clear example of how transboundary animal diseases (TADs) that are non-transmissible to humans have wide-ranging systemic impacts, including when occurring simultaneously with other disasters such as the COVID-19 pandemic. In conflict situations, the combination of armed conflict, multiple hazards, climate change and the depletion of natural resources is amplifying disaster risk. Armed conflict can exacerbate a country’s underlying exposure and vulnerability and diminish coping capacity for hazards of all kinds.
Together, these three sections provide evidence on the systemic nature of risk, and the increasing vulnerability and exposure to disasters that agriculture is currently facing in several countries. Lessons learned and recommendations stemming from these studies demonstrate that policies, plans, programmes and investments should be reoriented further towards enhancing resilience.
3.1 Linking climate change to agricultural production loss
Climate change is contributing to a rise in hazard incidence, leading to increased vulnerability and exposure and diminishing the coping capacity of individuals and systems.5 The consequences are manifested not only in the loss of crops and agricultural production, but also in the devastation of agricultural livelihoods with cascading negative chain reactions with long-lasting effects at the domestic, community, national, regional and even international levels.
Agriculture is particularly exposed and vulnerable to a multitude of changes and events in the climate system, impacting agricultural production, food security and agricultural livelihoods (FIGURE 33). When occurring simultaneously with other disasters and crises, such as biological hazards and conflict (explored later in Part 3), climate change risks will become increasingly complex and more difficult to manage. Climate and weather-related hazards are already affecting food security, particularly in low-latitude regions, and the likelihood of abrupt and irreversible changes and their impacts is estimated with a high level of probability to increase with higher global warming levels. According to the IPCC report, cereal prices will increase by 1–29 percent in 2050 due to climate change, and an additional 1–183 million people will be at risk of hunger.137 Enhancing the understanding of how climate change is driving disaster risk in food systems is essential for understanding how food systems will be impacted, and should influence the design of the policies, programmes, and financing mechanisms necessary to strengthen the resilience of agriculture and agrifood systems.
FIGURE 33 CLIMATE IMPACTS ON AGRIFOOD SYSTEMS AND RELEVANT ATTRIBUTION CONCEPTS
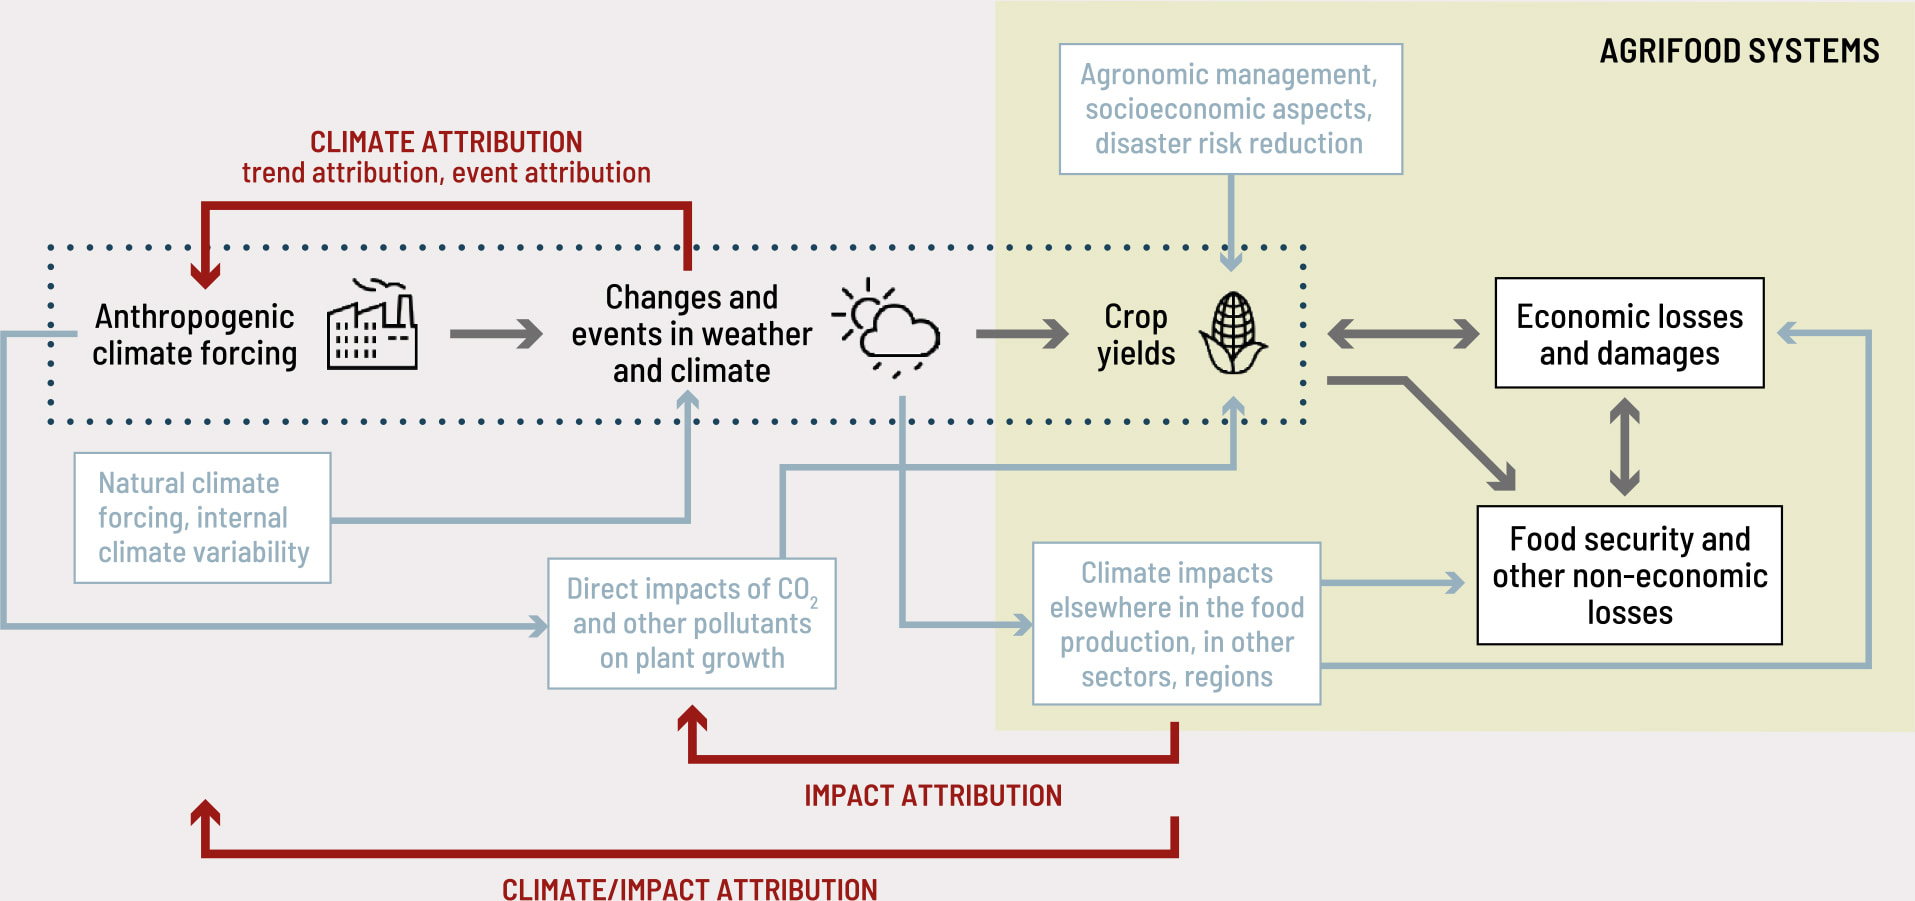
The analysis method outlined in this chapter concentrates on agricultural crops. It isolates the climate change contribution and models the impacts while considering the interactions of multiple climate hazards.
3.1.1 ATTRIBUTION OF THE IMPACTS OF CLIMATE CHANGE ON AGRICULTURE
Attribution sciences offers an entry point for estimating the effect of climate change on crop yields and the degree to which agricultural production is being influenced by extreme and slow-onset events exacerbated by climate change. Attribution science is defined as evaluating and communicating linkages associated with climate change,43,138 such as between greenhouse gas emissions over climate and extreme weather events and impacts in human and natural systems. Synthesizing such linkages builds up a general picture of the effect of climate change to date on certain types of hazards in given regions, with hazard- and region-dependent uncertainty.139
BOX 10 Methodology to attribute yield change to climate change
The aim of this analysis is to evaluate how climate change affects yield levels in different contexts. The results of this study are based on comparing observed yield records with estimated counterfactual and factual crop yield distributions for soy yields in Argentina, wheat yields in Kazakhstan and Morocco, and maize yields in South Africa (see Technical annex 3 for a more detailed description of the methods and data used).
Factual yields are the yields simulated for climate as it has actually been evolving, while counterfactual yields are those simulated for climate as it might have been without greenhouse gas increases and other anthropogenic climate forcing factors. For that purpose, a statistical, multivariate crop yield model based on the observed crop yield data in the full length of their available record140 and observationally derived climate data (20CRv3–W5E5) is built.
The statistical yield model is then applied to a set of factual and counterfactual climate data, taken from the Detection and Attribution Model Intercomparison Project (DAMIP)141 component of the Coupled Model Intercomparison Project Phase 6 (CMIP6). A set of historical simulations includes historical changes of both anthropogenic (greenhouse gases, ozone, aerosols, land use, etc.) and natural (solar irradiance, volcanic aerosol) climate forcing factors. Using the variable selection and model parameters from the observationally derived statistical model gives the distributions of factual and counterfactual yields, from which the likelihoods of yield levels associated with a specific extreme event are derived.
To demonstrate the effectiveness of this approach, the methodology was applied to estimate crop loss and damage in four countries: soy in Argentina, wheat in in Kazakhstan and Morocco, and maize in South Africa – representing the most important crops for each country in terms of economy and food security. TABLE 5 summarizes the attributed influence of climate change – integrating slow-onset changes as well as different types of extreme weather and climate events – on yield anomalies. The “historical attribution” result states the influence that climate change since pre-industrial times is estimated to have had on yields overall in the period of 2000–2019. This is negative for three out of the four countries. The magnitude of the influence is demonstrated by giving a best estimate for the climate change impact on the mean yield. The “event attribution” result states complementarily how more or less likely the yield levels recorded in a specific year of interest have become because of climate change. For this, a year in the recent past is chosen with particularly low yields, for which substantial socioeconomic impacts are documented. An important caveat concerning the results is that there is a significant degree of uncertainty involved in the estimation of such attributions, and although no uncertainty quantification was attempted for this assessment, all results should be treated as approximations.
TABLE 5 OVERVIEW OF ATTRIBUTION RESULTS
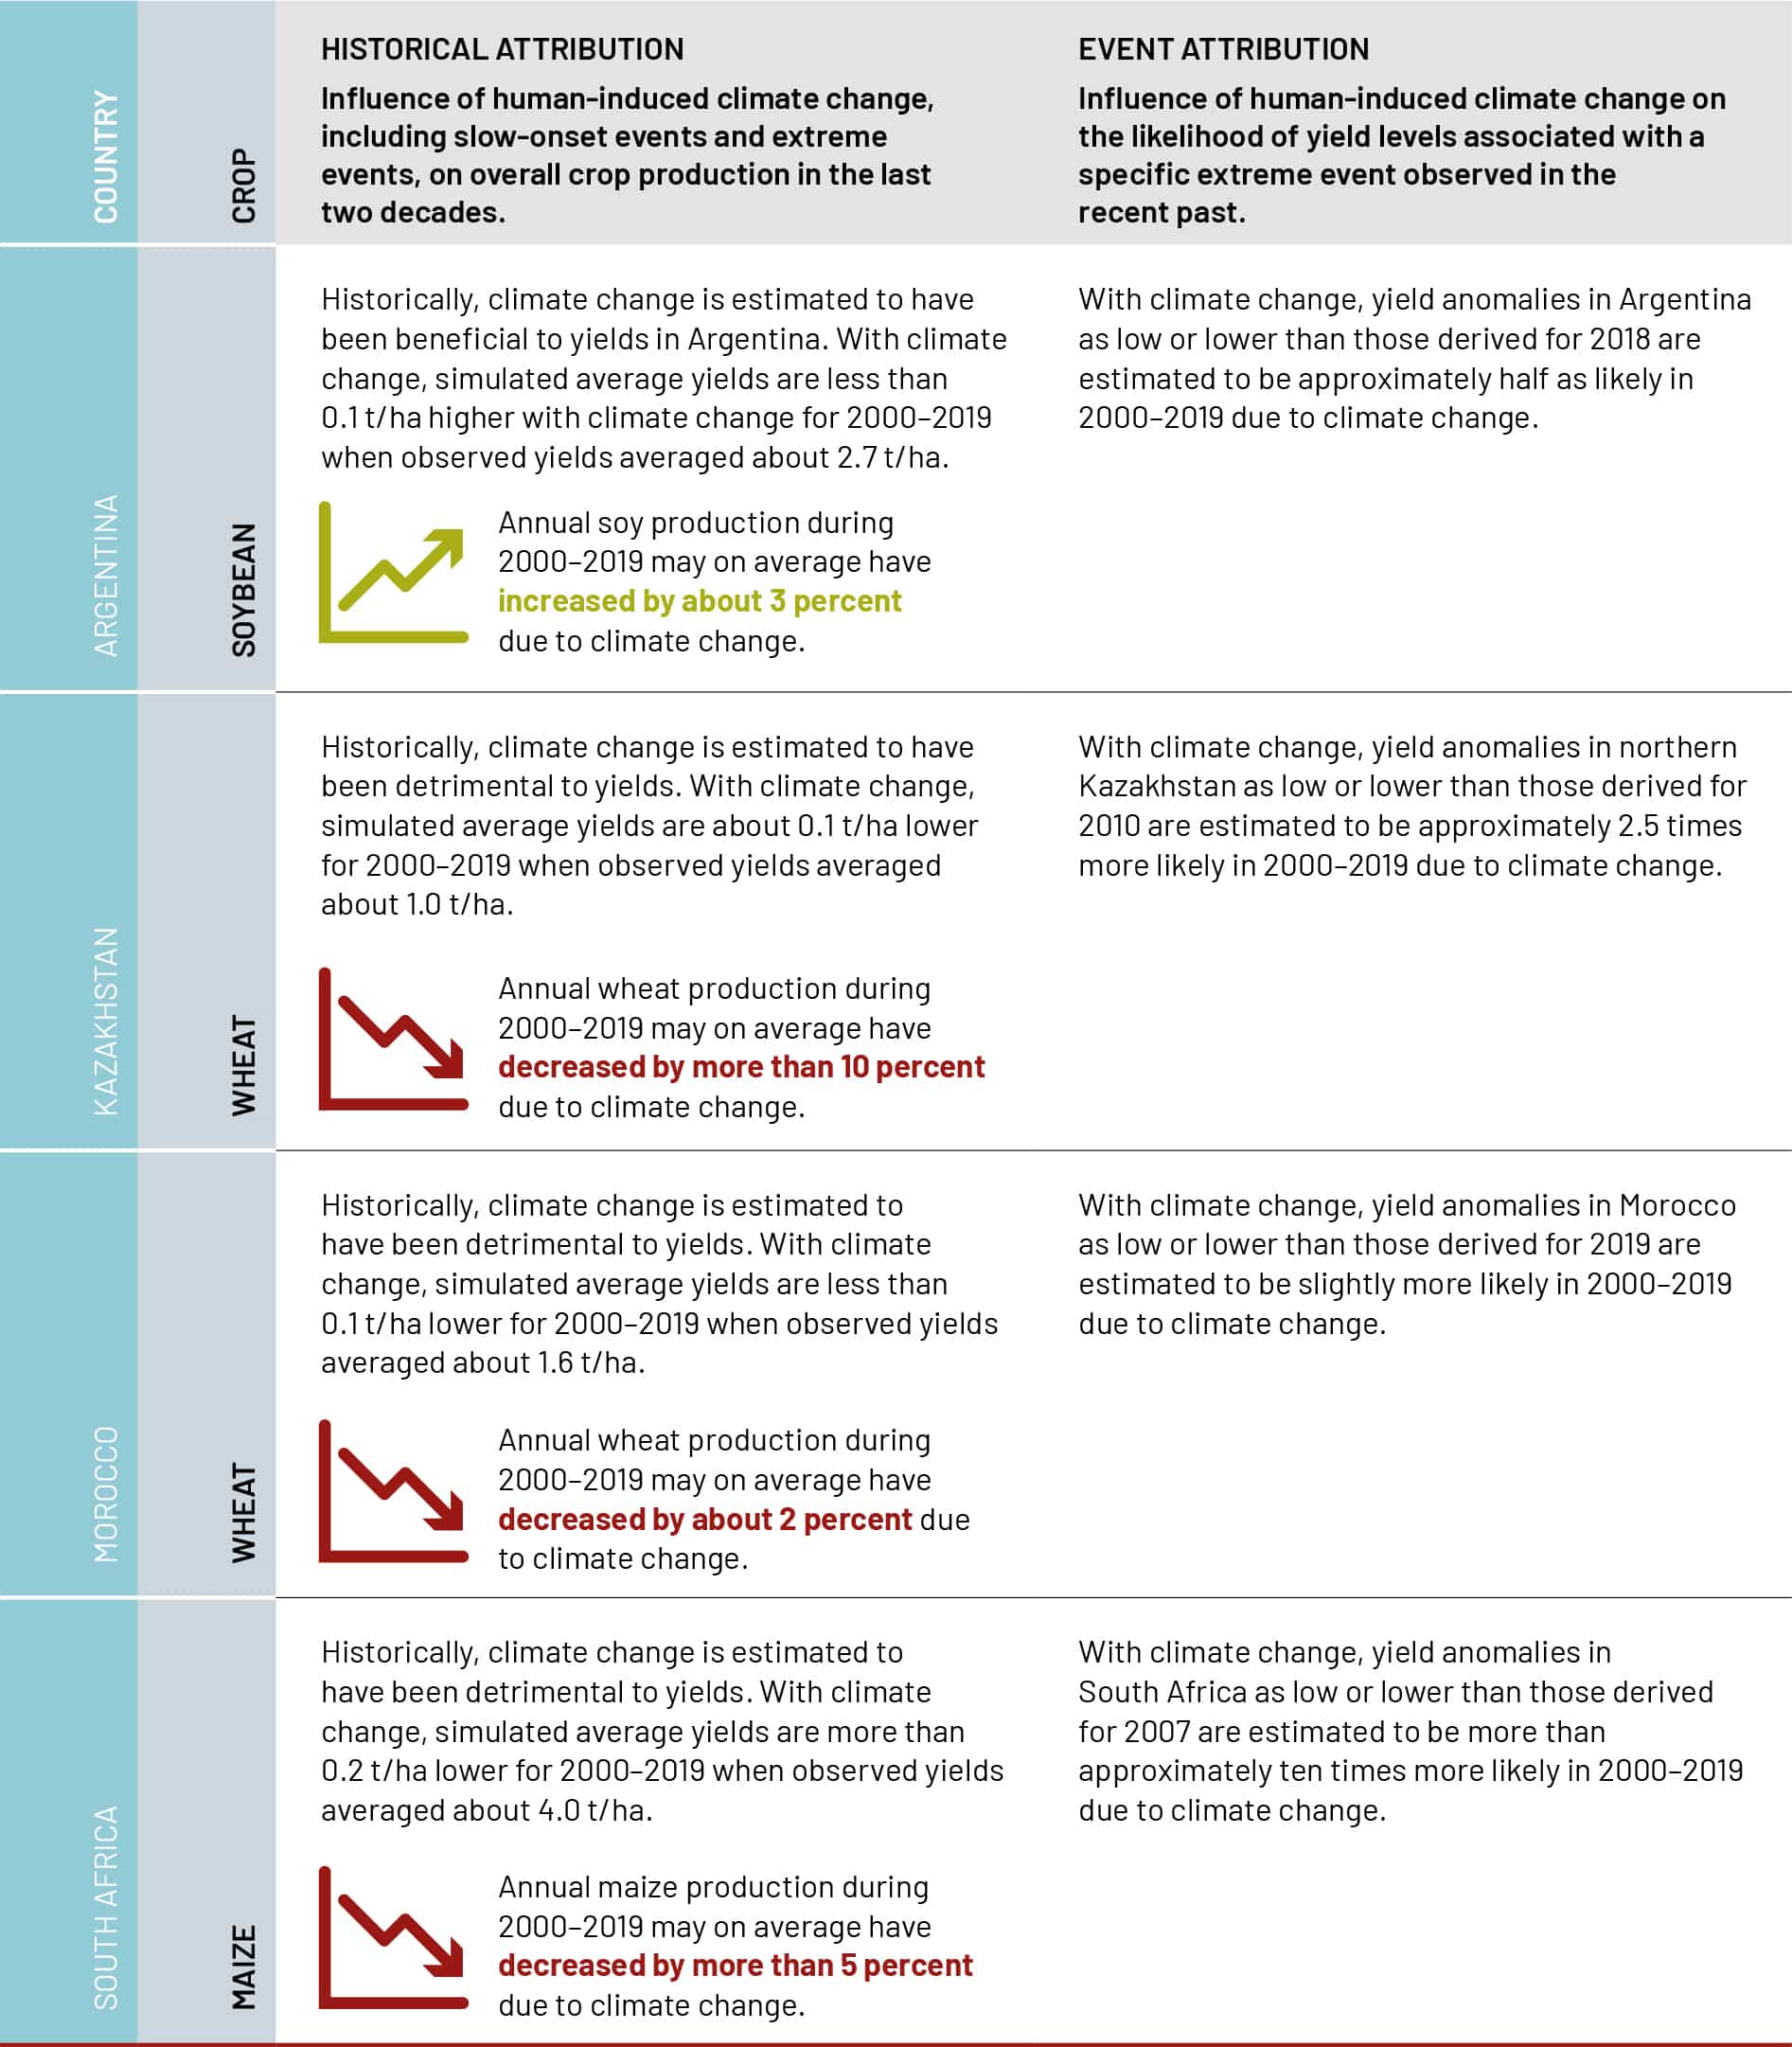
Note: The results are subject to uncertainty that is not quantified.
Results of the attribution analysis
In Argentina, the model shows that observed variations in high and low temperatures, rainfall intensity and drought explain the higher share of the recorded soy yield variations in the highest-producing provinces of Argentina. The model indicates that climate change to date has been statistically significantly beneficial to soybean yields in Argentina (FIGURE 34). Results suggest that climate change increased average yields during the period of 2000–2019 by less than 0.1 t/ha, amounting to about 3 percent of the average observed yield during that period. Low yield levels recorded in 2018 specifically make for an interesting case study due to the lasting impact they had as a reference point for bad years, with the Rosario Grains Exchange speaking in 2022 of “the ghost of the 2018 production disaster.”2,142 Results also indicate that yield anomalies in Argentina that are as low or lower than those in 2018 may have become about half as likely due to climate change, subject to uncertainty. Note, however, that the yield model only captures some of the recorded yield anomaly.
FIGURE 34 ESTIMATED INFLUENCE OF CLIMATE CHANGE ON CROP YIELDS TO DATE: FOUR CASE STUDIES
![Source: Authors’ own elaboration showing analysis results based on crop yield data from FAOSTAT. 2023. Argentina, Morocco, South Africa. In: FAO. Rome. [Cited June 2023]. https://www.fao.org/faostat/en/#data/QCL and Bureau of National Statistics Kazakhstan. 2022. Statistics of agriculture, forestry, hunting and fisheries.; climate reanalysis data from Frieler, K., Volkholz, J., Lange, S., Schewe, J., Mengel, M., del Rocío Rivas López, M., Otto, C. et al. 2023. Scenario set-up and forcing data for impact model evaluation and impact attribution within the third round of the Inter-Sectoral Model Intercomparison Project (ISIMIP3a). Preprint. In: EGUsphere. [Cited July 2023]. doi:10.5194/egusphere-2023-281; Lange, S., Mengel, M., Triu, S. and Büchner, M. 2022. ISIMIP3a atmospheric climate input data (v1.0). In: ISIMIP. [Cited July 2023]. doi:10.48364/ISIMIP.982724 and references therein; output data from the MIROC6 climate model from Tatebe, H., Ogura, T., Nitta, T., Komuro, Y., Ogochi, K., Takemura, T., Sudo, K. et al. 2019. Description and basic evaluation of simulated mean state, internal variability, and climate sensitivity in MIROC6. Geoscientific Model Development, 12(7): 2727–2765. doi.org/10.5194/gmd-12-2727-2019 that are part of CMIP6/DAMIP (Eyring, V., Bony, S., Meehl, G.A., Senior, C.A., Stevens, B., Stouffer, R.J. and Taylor, K.E. 2016. Overview of the Coupled Model Intercomparison Project Phase 6 (CMIP6) experimental design and organization. Geoscientific Model Development, 9(5): 1937–1958. doi.org/10.5194/gmd-9-1937-2016; Gillett, N.P., Shiogama, H., Funke, B., Hegerl, G., Knutti, R., Matthes, K., Santer, B.D. et al. 2016. The Detection and Attribution Model Intercomparison Project (DAMIP v1.0) contribution to CMIP6. Geoscientific Model Development, 9, 3685–3697. doi:10.5194/gmd-9-3685-2016); bias-correction code from Lange S. 2019. Trend-preserving bias adjustment and statistical downscaling with ISIMIP3BASD (v1.0). Geoscientific. Model Development, 12, 3055–3070. doi:10.5194/gmd-12-3055-2019 developed for ISIMIP3, and methods adapted and combined from the climate attribution and impact modelling literature.](../img/CC7900EN_fig34.jpg)
Source: Authors’ own elaboration showing analysis results based on crop yield data from FAOSTAT. 2023. Argentina, Morocco, South Africa. In: FAO. Rome. [Cited June 2023]. https://www.fao.org/faostat/en/#data/QCL and Bureau of National Statistics Kazakhstan. 2022. Statistics of agriculture, forestry, hunting and fisheries.; climate reanalysis data from Frieler, K., Volkholz, J., Lange, S., Schewe, J., Mengel, M., del Rocío Rivas López, M., Otto, C. et al. 2023. Scenario set-up and forcing data for impact model evaluation and impact attribution within the third round of the Inter-Sectoral Model Intercomparison Project (ISIMIP3a). Preprint. In: EGUsphere. [Cited July 2023]. doi:10.5194/egusphere-2023-281; Lange, S., Mengel, M., Triu, S. and Büchner, M. 2022. ISIMIP3a atmospheric climate input data (v1.0). In: ISIMIP. [Cited July 2023]. doi:10.48364/ISIMIP.982724 and references therein; output data from the MIROC6 climate model from Tatebe, H., Ogura, T., Nitta, T., Komuro, Y., Ogochi, K., Takemura, T., Sudo, K. et al. 2019. Description and basic evaluation of simulated mean state, internal variability, and climate sensitivity in MIROC6. Geoscientific Model Development, 12(7): 2727–2765. doi.org/10.5194/gmd-12-2727-2019 that are part of CMIP6/DAMIP (Eyring, V., Bony, S., Meehl, G.A., Senior, C.A., Stevens, B., Stouffer, R.J. and Taylor, K.E. 2016. Overview of the Coupled Model Intercomparison Project Phase 6 (CMIP6) experimental design and organization. Geoscientific Model Development, 9(5): 1937–1958. doi.org/10.5194/gmd-9-1937-2016; Gillett, N.P., Shiogama, H., Funke, B., Hegerl, G., Knutti, R., Matthes, K., Santer, B.D. et al. 2016. The Detection and Attribution Model Intercomparison Project (DAMIP v1.0) contribution to CMIP6. Geoscientific Model Development, 9, 3685–3697. doi:10.5194/gmd-9-3685-2016); bias-correction code from Lange S. 2019. Trend-preserving bias adjustment and statistical downscaling with ISIMIP3BASD (v1.0). Geoscientific. Model Development, 12, 3055–3070. doi:10.5194/gmd-12-3055-2019 developed for ISIMIP3, and methods adapted and combined from the climate attribution and impact modelling literature.
In Kazakhstan, results show that a substantial share of recorded wheat yield variations in the highest-producing oblast can be explained by variations in growing degree days, temperature variability, cold, precipitation variability and drought. The yield model is less robust than is the case with the other case studies. Still, the modelling indicates that climate change to date has been statistically significantly detrimental to wheat yields in this part of Kazakhstan (FIGURE 34). It suggests that climate change decreased average yields during the period of 2000–2019 by about 0.1 t/ha, which is more than 10 percent of the average observed yield during that period. Low yield levels recorded in 2010 specifically make for an interesting case study because that year showed a record low of below 8 million tonnes of wheat production in northern Kazakhstan.143 The model results also indicate that yield anomalies in this region of Kazakhstan as low or lower than those found for 2010 may have become about 2.5 times more likely due to climate change to date, subject to uncertainty.
The model shows that a large share of the recorded wheat yield variability in the highest-producing regions of Morocco can be explained by variations in temperature variability, high temperatures, drought and high precipitation. The modelling indicates that climate change to date has been statistically significantly detrimental to wheat yields in Morocco (FIGURE 34). It suggests that climate change decreased average yields during the period of 2000–2019 by less than 0.1 t/ha and amounted to about 2 percent of the average observed yield during that period. Low yield levels recorded in 2019 specifically make for an interesting case study because they prompted a response from Morocco’s central bank144 and were followed by even lower yields in 2020,145 multiplying the impacts. The modelling indicates that yield anomalies in Morocco as low or lower than those derived for 2019 may have become slightly more likely due to climate change, subject to uncertainty.
For South Africa, the model shows that a large share of the recorded maize yield variations in the highest-producing provinces can be explained by variations in growing degree days, temperature variability, cold, drought and high precipitation. Climate change to date has been statistically significantly detrimental to maize yields in South Africa (FIGURE 34). It suggests that climate change decreased average yields during the period of 2000–2019 by more than 0.2 t/ha, amounting to more than 5 percent of the average observed yield during that period, and that the negative impact of climate change was even stronger in the lowest-yielding years. Low yield levels recorded in 2007 specifically make for an interesting case study because of the food insecurity that ensued. Together with similar maize yield anomalies in neighbouring Lesotho, which is subject to largely the same weather and climate, the low yields in South Africa in this year have been implicated in food shortages in Lesotho.146,5 The modelling indicates that maize yield anomalies in South Africa, as low or lower than those derived for 2007, have become about ten times more likely due to climate change to date, subject to uncertainty.
The results show negative impacts of climate change in three out of the four cases analysed, with a range of yield losses explained by anthropogenic climate change depending on crop type and country of up to 10 percent, subject to yet unquantified uncertainty. Going forward, it will be important to further evaluate how much climate change contributes to aspects of the agrifood system’s other yields. The nutrient content of crops is also thought to be impacted by climate change,5,147 as well as other parts of the crop value chain (food processing, aggregation, transport, distribution), the demand side, and other agricultural sectors such as animal and livestock health and productivity, or fisheries yields and aquaculture.5
To summarize, results suggest that climate change may be already exacerbating agricultural losses. The results also highlight the importance of investing in measures to reduce losses and damages. If the methodology presented here is applied to future climate projections, as opposed to the counterfactual past, and complemented with a quantification of economic losses and consideration of non-economic losses, such evidence may inform comprehensive climate and disaster risk management and contribute to the loss and damage negotiations, including aspects of the agriculture sectors under the United Nations Framework Convention on Climate Change (UNFCCC) framework.
The results suggest that climate change may be already exacerbating agricultural losses, and they highlight the importance of investing in mitigation, adaptation and disaster risk reduction among other measures to avert, minimize, and address losses and damages.


