
2.4 Measuring impacts in forestry and fisheries and aquaculture
This section provides case studies for the forestry and fisheries and aquaculture subsectors, where limited data availability does not allow for the same type of systematic assessments of losses from extreme events as conducted for crops and livestock in section 2.3.1. The reasons for this data gap are a lack of baseline data, the complexity of the relationship between disasters and productivity in these two subsectors, which makes it complex to build a counterfactual scenario with no disasters. In the case of marine fisheries, it is also challenging to link national production areas to locations where disasters occur. Insights on the importance and relevance of losses from disasters in forestry and fisheries and aquaculture are therefore gathered from published literature and anecdotal evidence obtained from the analysis of specific cases.
The following subsection provides an overview of the two most significant hazards – wildfire and insect infestations – that are threatening the health and sustainability of forests around the world. It outlines the challenges of data collection in the subsector and offers a potential methodology for loss assessment. The last subsection looks at induced losses in the fisheries and aquaculture subsector, providing an overview of the specificities of the impact of disasters in that context.
2.4.1 FORESTRY: THE IMPACT OF WILDFIRES AND PEST INFESTATIONS ON FORESTS
Forests are extremely vulnerable to the impacts of disasters and climate change but also play a key role in risk reduction and mitigation. Halting deforestation and increasing forest cover are cost-effective solutions for mitigating climate change and cutting emissions by over five gigatonnes of CO2 equivalent each year, which is about 11 percent of total annual emissions. Doing so also boosts biodiversity and provides ecosystem services, which enhance the adaptive capacity and resilience of people and ecosystems to extreme events.5 At the same time, forests worldwide are threatened by many natural hazards, including wildfires, insect pests, diseases, droughts, storm damage, floods and landslides. The frequency and severity of disasters can result in forest degradation and loss, reducing their ability to store carbon, adapt to climate change and support vulnerable livelihoods.
Most hazards affecting the forestry sector are driven by meteorological factors (e.g. temperature and precipitation patterns), long-term climate variability and human influence (land-use change, land management practices and introduction of invasive species through international trade). Assessing and reducing forest risks are essential to helping countries meet their climate mitigation and adaptation goals, but the effective monitoring of forest degradation is still in the early stages. In the Global Forest Resources Assessment 2020, only 58 countries, representing 38 percent of the global forest area, reported monitoring the area of degraded forests.79 Collecting data on forest impacts poses challenges due to inconsistent approaches to loss and damage assessments, insufficient application of methodologies, and a lack of comprehensive coverage of the full range of impacts. There is a clear need for better data and integrated risk management approaches.
The following sections elaborate on two of the most important hazards affecting the forest sector: wildfires and pest infestations. Fire is an essential component of many terrestrial ecosystems, and its impacts can be beneficial or adverse. Along with climate conditions, fire is a major driver of global vegetation patterns,80,81 but it also poses a serious threat. Uncontrolled wildland fires (wildfires) have significant negative impacts, including CO2 emissions, the loss of forest products and productivity, degradation of landscapes, the loss of human life, built assets, biodiversity, and habitats, and the disruption of livelihoods.82 No vegetated region or country is spared this risk.81 Reducing risk and managing the destructive effects of wildfires is an increasingly significant problem across the globe.
Trade, transport and human mobility have experienced exponential growth, and alongside them, non-native invasive species of insect pests, pathogens, vertebrates and plants have emerged as a growing threat to forests. Invasive species are now considered one of the most significant causes of biodiversity loss, especially in certain island countries.83 Insect pests damage about 35 million ha of forests annually.83 Invasive species, specifically insect pests and disease pathogens, affect tree growth and survival, reduce wood quality and impact other ecosystem services. Invasive plant species inflict harm upon forests by competing with native species and obstructing the regeneration of the latter. Endemic species, triggered by climate change or through ensuing weakened host plant defences, also contribute to increasing impacts. This alters the composition and structure of flora. Many countries are experiencing outbreaks of native pests like bark beetles due to the impacts of climate change and poor forest management practices.
Fire and forests
Driven by a rising population density in the wildland–urban interface, wildfires are increasingly damaging the environment, wildlife, human health and infrastructure.84 Every year, about 340 million–370 million ha of the Earth’s surface are burnt by wildfire.85,86 Data show that nearly 391 million ha – including 25 million ha of forest land – were burnt in 2021 alone.87 Actual burnt area is often underestimated due to technical limitations like sensor resolution (meaning small fires can go undetected), temporal coverage and clouds. Using Sentinel-2 data at a spatial resolution of 20 m, Chuvieco et al. calculated sub-Saharan Africa’s burnt area to be 120 percent greater than that estimated by the moderate-resolution imaging spectroradiometer (MODIS) (500 m).88 This means that fires not mapped by MODIS are not yet being accounted for in global burnt area analyses.
Changing demographics, climate and land use are causing wildfires to become more frequent and intense. They are also occurring in previously unaffected areas.89 Relative to the levels in 2000, the global occurrence of extreme fire events is expected to increase by 14 percent in 2030, 30 percent in 2050 and 50 percent by 3000. Climate change and future fire meteorology will play the most significant role in enhancing wildfires, followed by land cover changes, lightning activity and land use.90
Caused primarily by greenhouse gas released from fossil fuel combustion, climate change has had a substantial impact on the fire environment.91 Wildfires can accelerate the carbon cycle’s positive feedback loop, making it more difficult to halt rising temperatures. Satellite observations of active fires indicate that wildfires in 2021 emitted 6 450 megatonnes of CO2 globally, which was 148 percent more than total European Union fossil fuel emissions in 2020. According to recent IPCC findings, hotter, drier and windier weather is becoming more frequent in some regions and will continue to increase if countries do not meet and exceed their Paris Agreement commitments.5 Many members of the international fire community recognize the growing problem of managing fire under increasingly difficult fire weather conditions and extended fire seasons influenced by climate change.83
FIGURE 31 shows burnt area, number of fires and CO2 emissions for the period 2000–2021. There are no clear trends in the graphs, but it is notable that the Global Wildfire Information System (GWIS) dataset is based on the MODIS sensor (500 m resolution), and the analysis of global data does not reflect ground specificities. The charts demonstrate that fire data for Africa is significantly higher than that of other continents – approximately 70 percent of all global wildland fire occurred in sub-Saharan Africa, followed by 21 percent in Australia and South America.85
FIGURE 31 HISTORICAL DATA OF BURNT AREA, NUMBER OF FIRES AND CO2 EMISSIONS FROM WILDFIRES (2000–2021)

Earlier estimates of nationally reported annual forest burnt area (2002–2012) were approximately 67 million ha, which is equivalent to 1.7 percent of all forests worldwide.86 However, the GWIS global fire dataset for 2002–201992 indicates an average of 176.9 million ha of burnt forest, which represents 3.6 percent of total global forest cover and 42.9 percent of global burnt area. According to Van Lierop et al.,86 the global distribution of forest burnt area, and the percentage burnt of total forest land in that region, is:
- South America, 35 million ha (4 percent)
- Africa, 17 million ha (2.5 percent)
- Oceania, 7 million ha (4 percent)
- Northern and Central America, 5 million ha (0.7 percent)
- Europe and northern Asia, <5 million ha (0.3 percent)86
Nearly 58.6 percent of all fires in 2002–2019 (the latest available period of country level fire statistics) occurred in the 46 least developed countries, even though they accounted for just 14.2 percent of global vegetation cover, including cropland and natural vegetation. This suggests a connection between fire risk, lower income and resource management contexts. In 33 of the least developed countries, Africa appears to be the primary driver of this poverty–fire linkage, although Central and South American countries also suffer from it.
The 2002–2019 GWIS dataset shows 146 million ha of forest classified burnt land (including open and closed forests) in African least developed countries, which represents 82.6 percent of all forest fires globally. This could be an artefact of land cover classification (e.g. treed savanna is classified as open forest). However, it undoubtedly includes some forest cover burnt by fire that spreads from burning in grasslands/shrublands and croplands.
Wildfire-related damages and losses include negative ecological impacts (vegetation cover and biodiversity losses, soil losses, decreasing soil fertility) and socioeconomic harm (fatalities, livelihoods, agricultural, productivity, food security, human health, water security and infrastructure/assets).93 Unfortunately, it is difficult to assess short- to long-term ecosystem responses to fire and measure ecological values. There is no consistent global database that reports socioeconomic fire impacts or even suppression costs, and many governments do not routinely assess and record this information or make it available.94
Tackling the underlying causes of fires using risk reduction actions can help avoid considerable losses. The purpose of integrated fire management (IFM) is to make landscapes and livelihoods resilient and sustainable. IFM does so by considering the ecological, socioeconomic and technical aspects of fire management. A focus on wildfire risk reduction is the right approach, but it must include using fire as a management tool. Some fires identified as extreme wildfire events in the United States of America were described in fire reports as the product of over-dense forests stemming from fire suppression policies in fire-adapted biomes.94 The same happens in other countries. There is an opportunity to count on indigenous and traditional knowledge and experience in fire management to establish healthier fire regimes.
An IFM framework that assists in systematically assessing, planning and managing fires has evolved as part of FAO’s Strategy on Forest Fire Management.95 This framework focused on the five Rs: review and analysis, risk reduction, readiness, response and recovery. Applying the IFM approach and the five Rs and promoting dialogue through the experience, knowledge and good practices of researchers, practitioners, and indigenous and traditional communities can help decrease the vulnerability of people and landscapes.
Impact of forest invasive species and outbreaks of native pests
Forest damage by invasive species can be economically catastrophic, but there is a lack of information to quantify their global economic impact.96 A major reason for this lack of data is the difficulty of establishing thresholds beyond which a tolerable presence of pests evolves into an infestation. Other factors include calculating the extent of forest damage and estimating the monetary value of lost tree and plant stocks.
Economic costs include timber losses, tree replacements, changes in ecosystem services, water retention, management costs, and climate and carbon loss mitigation. There are also socioeconomic consequences like public health outcomes, the loss of revenue by local communities that rely on productive forests, and the cultural and social significance of forests, which are difficult to quantify in economic terms. However, very little research has been done to quantify the implications of pests and diseases on forest ecosystem services and local communities. Current reporting of pest and disease damage is based on land area of damage, volume of tree mortality or economic impacts — there is no harmonized system for reporting impacts. For large outbreaks, it is relatively easy to assess damage based on land area for agents such as bark beetles. However, this method is not suitable for pests and pathogens that cause mortality in individual trees surrounded by non-hosts.
Overall, data on insect pest and disease outbreaks is limited, especially in developing countries. Additionally, available data focuses mainly on plantations and planted trees. Although forest declines and diebacks have been reported in many countries, there is a lack of accurate survey data. Australia, China, some Central American countries, New Zealand, the United States of America, and the United Kingdom of Great Britain and Northern Ireland have all reported losses by recent invasive species, native insect pests and pathogens.
The USDA Forest Service’s annual report describes major forest insect pests and disease conditions in the United States of America. Tree mortality caused by forest insect pests and disease varies year to year, but over 11.8 million acres (4.8 million hectares) of mortality were reported in 2009.97 By contrast, 5.9 million acres (2.4 million hectares) were affected by forest fires the same year. In 2018, more than 6 million acres (2.4 million hectares) of tree mortality was caused by insect pests and diseases in the United States of America, which was approximately 2.6 million acres (over 1 million hectares) less than that reported in 2017.
The United States of America estimates the annual economic damage arising from all invasive forest pests in the country to be USD 4.2 billion.98 More recent studies for specific sets of species indicate even higher costs. In 2019, the United States of America estimated biomass loss associated with elevated mortality rates caused by the 15 most damaging non-native forest pests. The study found a combined tree mortality rate of 5.53 teragrams of carbon (TgC) per year.99
Elsewhere, Turner et al. concluded that the net value of economic impacts associated with a new forest pest in New Zealand was NZD 3.8 billion to NZD 20.3 billion when projected to 2070.100 Damage by invasive species costs the United Kingdom of Great Britain and Northern Ireland’s economy an estimated GBP 1.7 billion (more than USD 2.2 billion) per year.101 In the Islamic Republic of Iran, the boxwood moth Cydalima perdpectalis and boxwood blight Calonectria pseudonaviculata affected about 80 000 ha of natural stands of box wood trees (Buxus hyrcana).79 In Australia in 2015, the dieback of mangrove forests along the southern coast of the Gulf of Carpentaria included an area of 7 000 to 10 000 ha along a 700 km stretch of coastline. It is one of the largest mass-death events ever reported of mangrove ecosystems and is linked to climate anomalies.102
Other notable examples are the large outbreak of gum-leaf skeletonizer (Uraba lugens) that severely defoliated about 250 000 ha of jarrah (E. marginata) forest in western Australia during 2010–2011, although forests have since recovered.103 In northeast Victoria, up to 3 000 ha of plantation have been treated for Dothistroma needle blight (caused by Dothistroma septosporum) each year since 2011. At the end of 2016, the cumulative total area of publicly owned native forests in western Australia affected by phytophthora dieback was 274 000 ha.102 Sirex woodwasp in Australian softwood plantations is estimated to have cost around AUD 35 million in losses and control.104 A similar sum was spent on the attempted eradication and containment of the European house borer since its detection in 2004.105 In South Africa, 12 301 ha of planted trees are affected by pests and/or pathogens annually.
The southern pine beetle (SPB), Dendroctonus frontalis, is the most destructive native insect pest of pine forests in the south-eastern United States of America, Mexico and Central America.109 SPB spread has remained low in the southern and north-eastern regions of the USA since 2002, when 5.26 million ha of pine forests were affected. In Mexico and Central America, the most recent SPB outbreak — with the possible involvement of the meso-American pine beetle — occurred in Honduras and accounted for some 500 000 ha of tree mortality in 2014/15.110 An unprecedented outbreak of Ips calligraphus occurred in the Dominican Republic in 2019,111 impacting over 8 000 ha of native and exotic pine forests.112
However, the bark beetle species causing the most pine forest losses in northern America has been the MPB since 2000. According to Canadian government records, an ongoing MPB outbreak that began in the early 1990s has affected over 18 million ha of pine forests in British Columbia. This had resulted in a loss of approximately 723 million m3 (53 percent) of merchantable pine volume by 2012.108 In 2010, surveys detected over 6.8 million acres with MPB mortality across the western states of the United States of America.97
Like all programmes, there are inevitable gaps and areas that require improvement. As mentioned above, one major gap is the lack of consistent data – not just on the losses caused by invasive and native species, but also on how countries are mitigating loss and damage. To better assess, prioritize and respond to the impacts that invasive and native species have on forests, harmonized information at the global, national and local levels must be collected through on-ground surveys, questionnaires, and technologies like satellite and remote imagery.
BOX 8 Two pests affecting forests
Pine wood nematode
The pinewood nematode is considered one of the most devastating pine pests,106 having caused severe damage to plantations in Portugal and native forests in China, Japan and the Republic of Korea. The Korea Forest Service reported the loss of 12 million pine trees to the pest over 1988–2022. The Forestry Agency of Japan reported an annual loss of about 0.3 million m3 of pine trees due to pine wilt disease.107
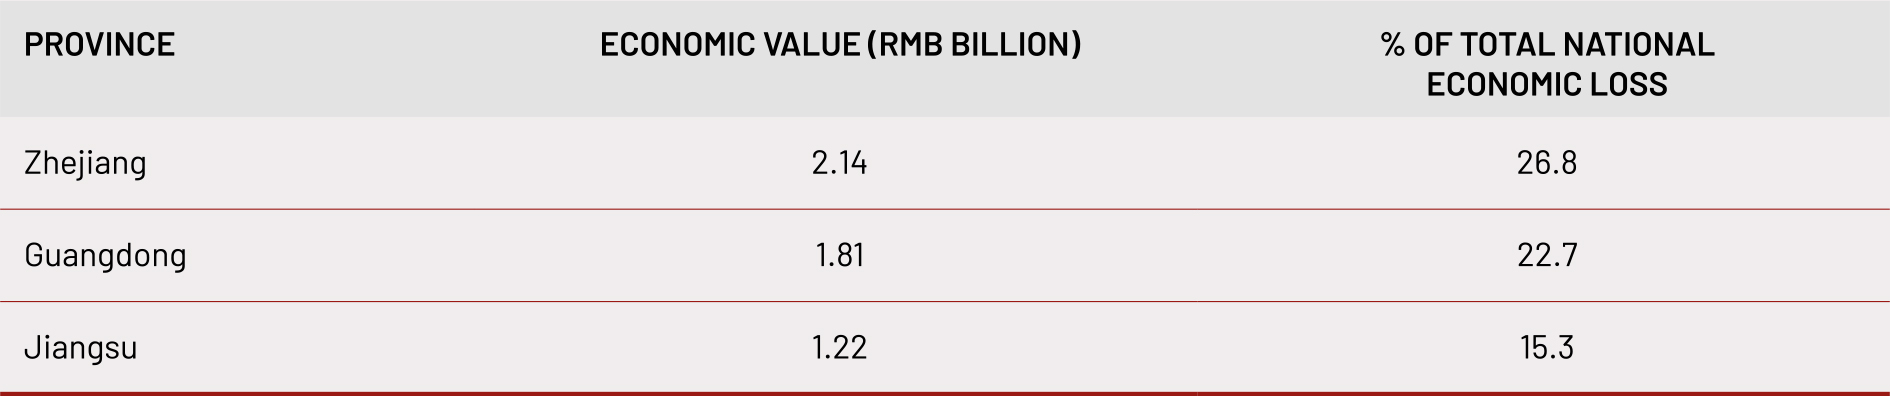
Similarly, the eastern and southern areas of China have been hit the hardest by pinewood nematode disease. The economic losses of these regions accounted for 79.9 percent of total national economic losses (TABLE 2).
TABLE 2 PINEWOOD NEMATODE DISEASE IN CHINA
Bark beetles
Bark beetles are a natural component of forest regions around the world, but they can also be a major disturbance agent, especially in coniferous forests with low diversity of tree species, high density and environmental stresses. In Central and northern America and Europe, tree mortality caused by bark beetles was estimated in the millions of hectares in recent decades. In Belarus, bark beetles caused a loss of 36 million m3 of pine wood from 2016–2021. In Canada, the forest area disturbed by the mountain pine beetle (Dendoctronus ponderosae) continued to decrease, from a high of almost 9 million ha in 2009 to only 357 000 ha in 2019.108
Estimating loss and damage in forestry
Disasters affect forests in multifaceted ways and require the collection of a diverse range of data and indicators to assess loss and damage in all dimensions (TABLE 3). Direct impacts on productive assets – such as equipment – are the easiest to measure, as compared to estimating the effect on wood production, which requires differentiating maturity and values for the timber affected. In several country contexts, smallholder livelihoods can be affected by a loss of income from forest resources, both in terms of wood production and non-timber forest products like fuelwood, fruit, mushrooms, flowers and recreational activities.117
TABLE 3 DIMENSIONS OF DISASTER IMPACTS IN FORESTRY
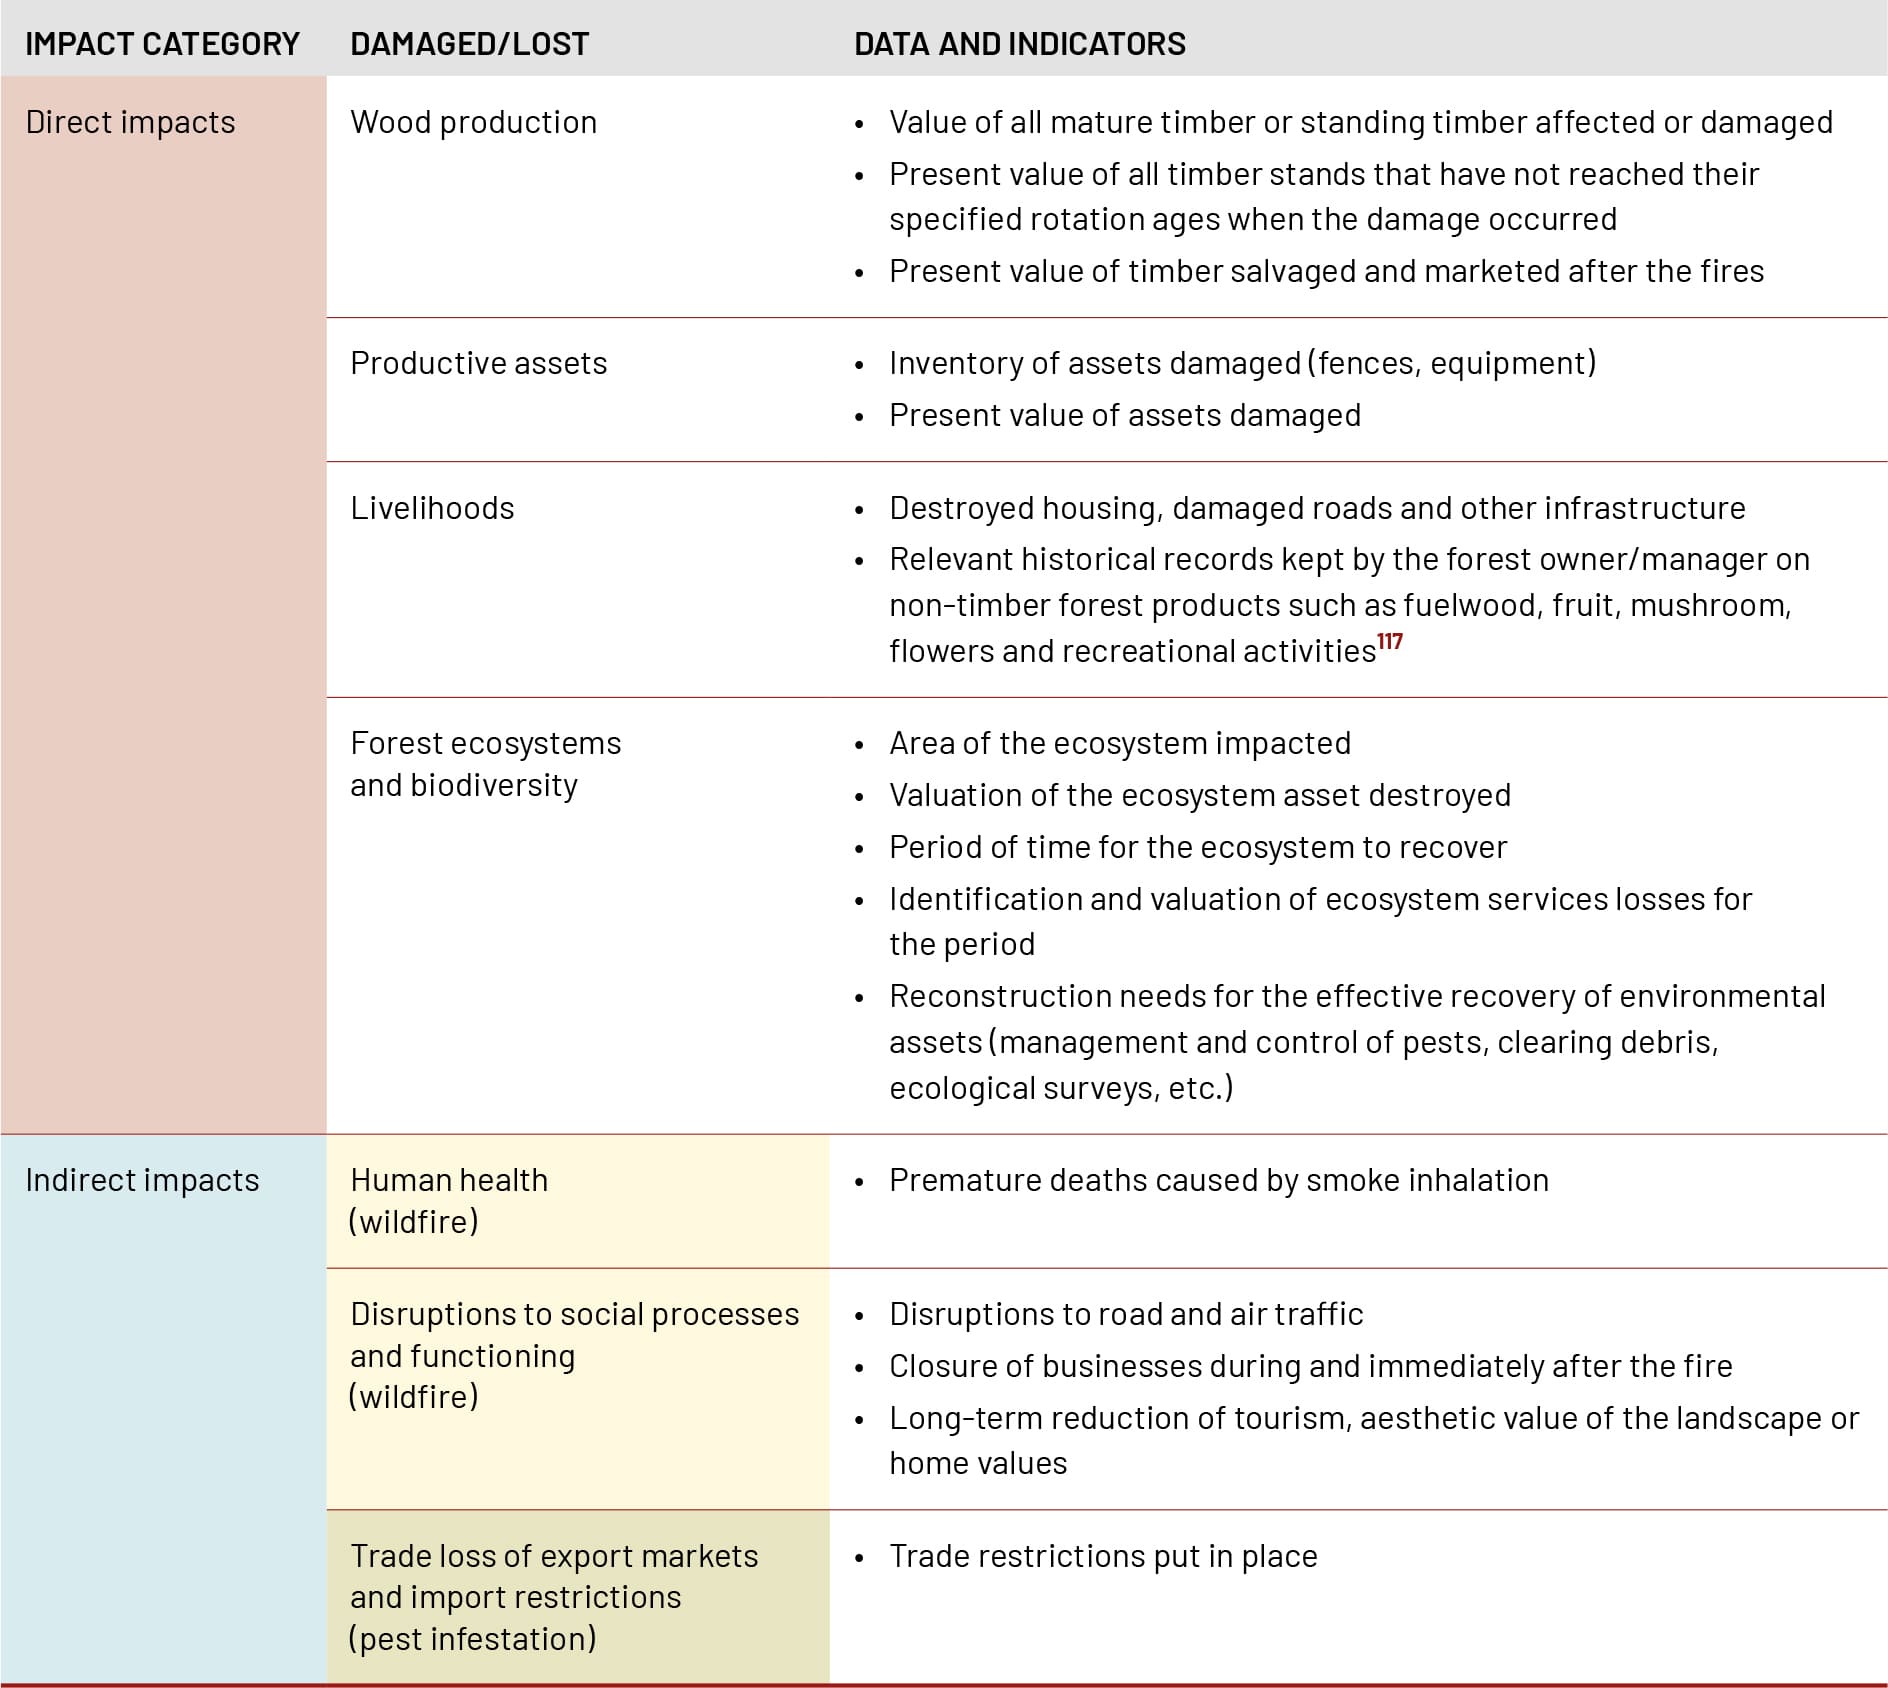
Secondary impacts on livelihoods require an assessment of records and data from household-level questionnaires. As highlighted previously, there is a lack of standardized methodologies for assessing disaster impacts on ecosystem services. Certain post disaster needs assessments have sought to address this gap by creating indicators and assigning monetary values to ecosystem losses.118 The impacts of certain hazards, such as trade disruptions caused by pest infestations, are not limited to forestry but have a direct effect on forest-based revenues.
An important aspect of assessing timber losses after large-scale disasters in the forestry sector is that a significant portion of damaged timber can usually be salvaged. The number of trees destroyed after a disaster does not automatically result in a drop in timber production. Rather, an increase in timber sales is observed in the immediate aftermath of the event as more timber is put on the market than usual.
The delayed pattern of losses provides a challenge when conducting large-scale regression analysis on disaster and wood production over multiple countries and years. Actual timber production disaster losses might be observed over more extended periods after the salvaged wood has been sold and wood production does not return to normal. Estimating this long-term effect on forest productivity would require production analysis based on supply and demand characterizations that are context-specific. This approach is not globally feasible, which is why most of the currently available assessments of disaster impacts in forestry focus on specific disasters for which precise data collection was carried out post-event, relying on the availability of localized data (TABLE 3).
BOX 9 Bark beetle damage in Honduras
The SPB killed trees in more than 580 000 ha in Honduras over the last 20 years during unprecedented outbreaks.109 Honduras has a land area of about 11 million ha, of which 4.5 million ha (or 41 percent of the country) is forested. Around 60 percent of the forest area comprises Pinus species. Over 2 million ha were affected by SPB due to over-stocked stands, wildfires and a prolonged drought during 1962–1965. In 1964, the outbreak was estimated to be spreading at a rate of 150 000 ha per month.113 This remains Honduras’s most devastating SPB epidemic to date.
A notable SPB outbreak occurred in second-growth pine stands of P. oocarpa primarily in the country’s Yoro region from 1982 to 1983,114 where over 8 000 ha of young pine forests were attacked and killed. Honduras had developed an effective forest pest management programme for pine bark beetles since its 1982 outbreak. Losses during 1984–1998 were kept to a minimum through early detection and the prompt application of control measures, particularly cut-and-leave.115
However, another SPB outbreak occurred during 1998–2003 and killed an estimated 45 885 ha of pine forests.116 Just 17 percent (403 000 m3) of the 2.4 million m3 of dead timber resulting from the outbreak were salvaged. Another severe SPB outbreak developed in 2014, where delayed control action eventually affected 500 000 ha of P. oocarpa forests110 before declining in 2017. Outbreaks of native bark beetles in northern and Central America and introduced bark beetles in the Caribbean can be expected to occur periodically, particularly in older, unmanaged pine forests and plantations.
FAO has been promoting a specific methodology for data collection and for calculating losses and damages to improve and standardize the estimation of forestry losses from disasters. It offers an assessment of forest resources that differentiates between the value of mature merchantable timber stands (stumpage) and timber stands that have not yet reached their rotation ages at the time of damage.
The market value of the unit stumpage is used for calculating the loss in merchantable timber stands, while four valuation techniques can be employed to estimate the value of pre-merchantable timbers lost, which are comparable sale, replacement cost, internal rate of return and income approaches. Income generated by non-timber forest products is the third aspect of forest resources. This includes all activities related to tourism, hunting or other forest products. Based on the annual income generated in this category, a loss estimate is computed by evaluating the proportion of damaged forest area and the rotation age of the timber stands. Given that a portion of forest resources can be salvaged after a disaster, this estimated value is deducted from the income loss estimated.
2.4.2 FISHERIES AND AQUACULTURE: DIVERSE RISKS AND DISASTER IMPACTS
The sustainability of fisheries and aquaculture around the world is being threatened by the increasing frequency and intensity of disasters. Fisheries and aquaculture are of great importance in providing food security, nutrition and livelihoods for some of the most vulnerable and disadvantaged communities worldwide. As of 2020, 58.5 million people worldwide were engaged in capture fisheries (38 million people) and aquaculture (20.5 million people).119 Of that global total, 84 percent are in Asia, and 21 percent are women.119 The livelihoods of about 600 million people, including subsistence and secondary sector workers and their dependents, rely at least partially on fisheries and aquaculture, which forms approximately 7.5 percent of the global population.
Wild capture and aquaculture fisheries are vulnerable to multiple sudden and slow-onset disasters, including storms, tsunamis, floods, droughts, heatwaves, ocean warming, acidification, deoxygenation, disruption to precipitation and freshwater availability, and salt intrusion in coastal areas.120 A key ecosystem risk driver for capture fisheries is the increasing intensity and frequency of marine heatwaves, which threaten marine biodiversity and ecosystems, make extreme weather more likely, and also negatively impact fisheries and aquaculture. In aquaculture, short-term impacts can include losses of production and infrastructure, increased risks of diseases, parasites and harmful algal blooms. Long-term impacts can include reduced availability of wild seed as well as reduced precipitation leading to increasing competition for freshwater. There are also increased risks for animal health, for example the changing occurrence and virulence of pathogens or the susceptibility of the organisms being cultured to pathogens and infections.
Extreme events and climate change directly affect the distribution, abundance and health of wild fish, and the viability of aquaculture processes and stocks. They compound other pressures arising from human activities such as overfishing, further affecting the environmental and economic sustainability of fisheries. In addition to natural hazards, technological disasters (e.g. chemical and oil spills), conflict and complex emergencies also affect the viability of fisheries and fishing communities. Fisheries are also exposed to a diverse range of direct and indirect disaster impacts, including displacement and migration of human populations, impacts on coastal communities and infrastructure due to rising sea levels, and changes in the frequency, distribution or intensity of tropical storms.
All these emergencies pose serious challenges to fish production, and lead to disruptions in value chains that adversely affect the well-being and livelihoods of people. The fisheries sector is greatly affected by increases in the price of inputs such as fuel, rising food costs, shifting populations and trade restrictions such as those that occurred during the COVID-19 pandemic. Located at the interface between land and water, disasters affecting fisheries can develop in isolation, in triggered consecutiveness (e.g. a tsunami following the volcanic eruption in Tonga in 2021) or in simultaneous combination, and often have mutually amplifying effects.
Fishing communities, ports, harbours, market infrastructure and aquaculture installations are commonly located at the seashore, as well as along rivers and lakes, which are areas vulnerable to various hydrological and meteorological threats. Climate change, variability and extreme weather events are compounding threats to the sustainability of capture fisheries and aquaculture development in marine and freshwater environments.
At the same time, the rapid restoration of capture fisheries activities after a disaster can provide nutritious food and employment and can fast track a community’s return to normal economic activity. Fishing vessels are often used after a disaster to trade foods, materials and transport people supporting food security and livelihoods. In the event of conflicts and complex emergencies, when the movement of internally displaced people (IDP) and refugees intensifies, fisheries can play an important role in providing food security and livelihoods for them as well as the local population.
The adaptation of fisheries to the impacts of extreme events and climate change is hampered by a lack of targeted vulnerability assessments and uncertainty in the impacts on commercial fisheries, especially for countries located in tropical areas. Climate change is anticipated to have a profound impact on critical food production sectors, with the tropics projected to experience losses, particularly in the context of fisheries. For example, by 2100, fishable biomass in the ocean could drop by up to 40 percent in some tropical areas. Simulations suggest that climate change has already reduced stocks in just under half of the marine regions studied. The effects of 1.8 °C warming would see fish stocks unable to rebuild themselves, and paired with overfishing beyond sustainable levels, the result is estimated to be a decrease of global stocks of over 35 percent.
The following section discusses impacts of disasters in the fisheries and aquaculture sector and showcases various national case studies of disaster impacts on the fisheries and aquaculture sector.
Droughts, floods and harmful algal blooms (HABs) in South Africa
The fisheries and aquaculture sector in South Africa faces considerable impacts from climate change and associated disaster events, which affect the livelihoods of numerous people, especially those who are vulnerable to food insecurity and live in poverty or are dependent on this sector for their livelihoods.121,122
HABs occur when algae – simple photosynthetic organisms that live in the sea and freshwater – grow out of control and produce toxic or harmful effects on people, fish, shellfish, marine mammals and birds. There are many kinds of HABs globally, caused by a variety of algal groups with different toxins. Anoxic coastal waters in South Africa are associated with the development of red tides or HABs and pose a serious threat to the fisheries and aquaculture sector. HABs are associated with a group of phytoplankton known as dinoflagellates accumulating and decaying. The resulting decay causes hypoxic conditions that can result in the mortality of marine species.123 On the west coast of South Africa, red tides are routine in nature, while on the east coast of the country they are less predictable.124
In March 2021, South Africa’s west coast experienced a 500 tonne “walk out” of west coast rock lobster.125 Walkouts are a recurring event, characterized by lobsters moving out of the ocean due to hypoxic conditions resulting from local red tides, and dying on the beach.126 While a lobster walk out in 1997 was estimated at 2 000 tonnes,127 the 2021 event should still be considered highly impactful considering the stock status of the species (estimated at 1.9 percent of pristine levels).128 This event was of particular concern given that local small-scale fishers identified most of the lobster that died to be small in size. In addition to the red tide-induced lobster walkout, several fish species were found beached and in shallow waters outside of their typical habitat. Also, most lobster fishers, traditional line fishers and commercial line fishers were unable to access their nearshore fishing grounds. While some fishers managed to collect lobsters that had walked out, enabling them to meet their total allowable catch quota, many others were unable to do so by the end of the season due to the loss of fishing days caused by the red tide. The red tide, therefore, resulted in a loss of income for many households, and this event could be considered economically devastating for small-scale fishers.
Data on the impact of typhoons in the Philippines
Since 1990, the Philippines has been affected by 565 disaster events that have caused an estimated USD 23 billion in damage. Approximately 85 percent of the sources of the country’s production have been reported to be susceptible to disasters, and 50 percent of its territory is economically at risk. Coastal communities, especially small-scale enterprising poor people, such as fishers and shellfish gatherers, have been found to be most vulnerable to coastal flooding, coastal erosion and saltwater intrusion.
Even though the Bureau of Fisheries and Aquatic Resources (BFAR) collects specific information on the impacts of disasters in the fisheries sector, the significance of the fisheries and aquaculture sector to the national economy and as an essential source of livelihood for numerous people is not adequately reflected in government allocations, especially when compared to other agriculture subsectors. For example, for four regions impacted by Typhoon Odette (December 2021), the fisheries and aquaculture sector was allocated one-quarter of the sum directed towards the relief for rice farmers of one region only. For this reason, BFAR is frequently required to bridge the financial relief gap left for the fisheries and aquaculture sector.
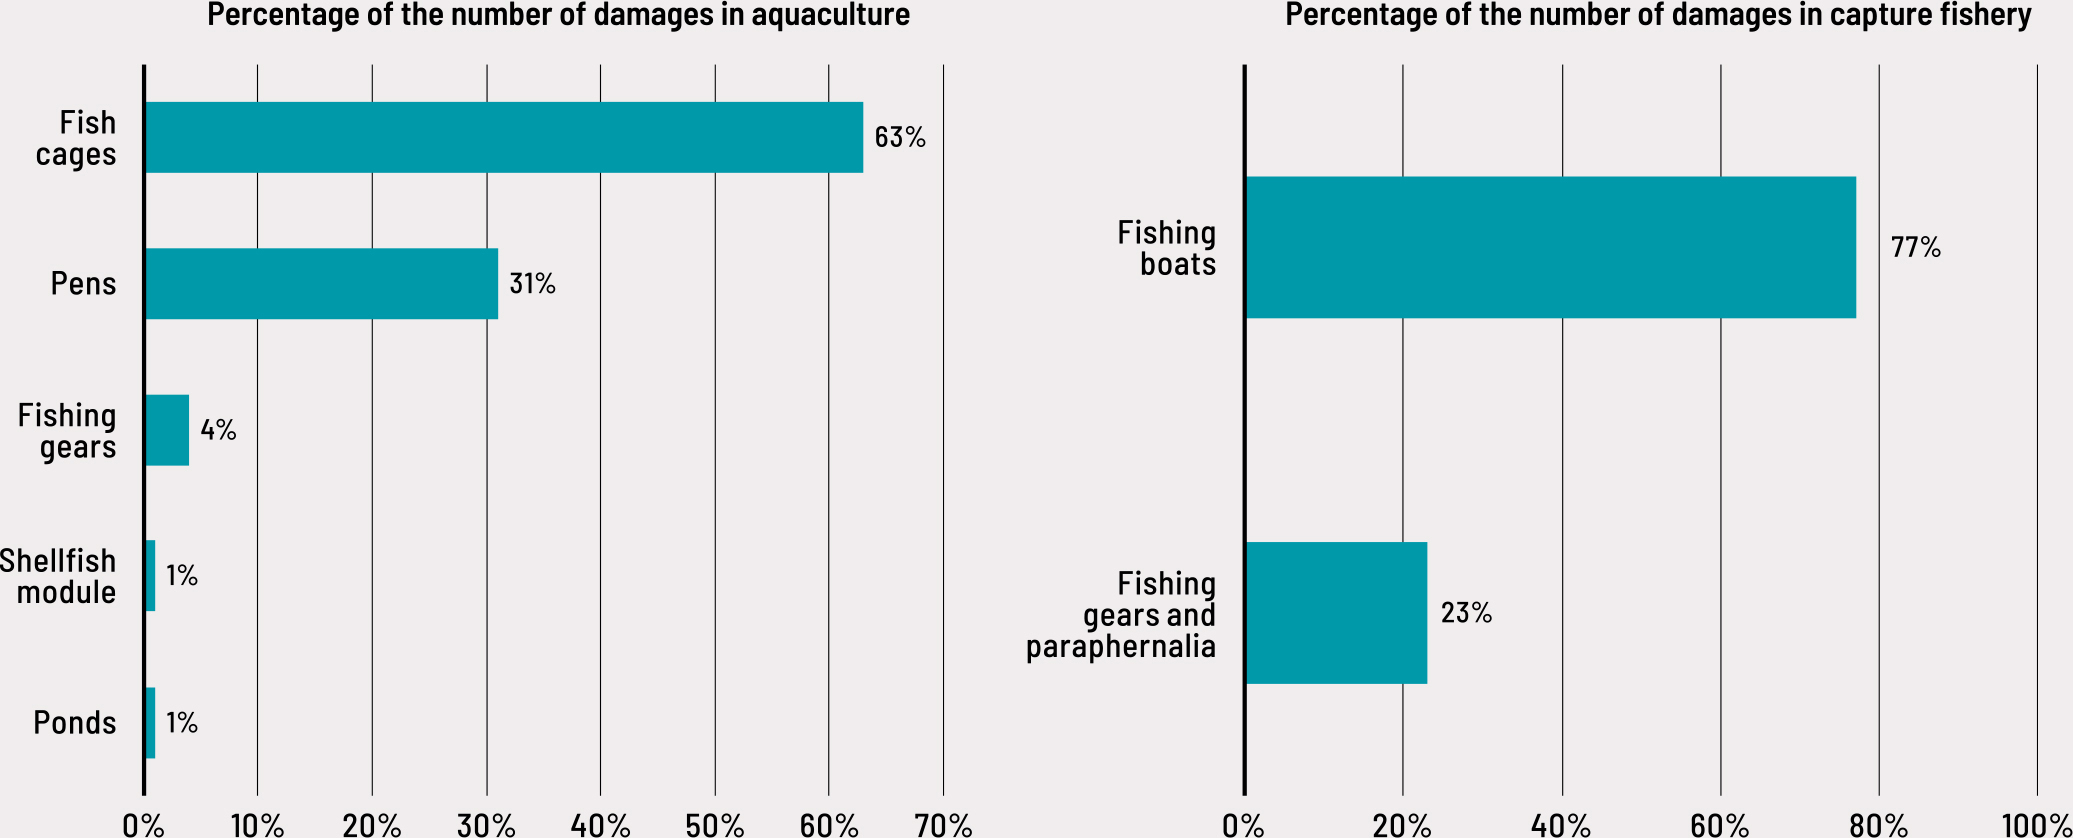
In addition, the available data does not appear to be sufficiently reflected in needs assessment reports. In the needs assessment reports of the three larger typhoons that hit the Philippines in the last five years, namely Typhoon Kammuri (Tisoy), 2019,129 Typhoon Goni, 2020,130 Typhoon Rai (Odette), 2021,131 the necessity to better highlight the impacts on the fishing and aquaculture communities is well reflected, including the sector-specific needs and priorities. While the assessments provide estimates for crop damages and losses, none or very few figures are reported for the fisheries and aquaculture sector. Some information on fisheries is presented for Typhoon Rai (Odette), which may indicate a push to better highlight impacts on this sector. Fish cages accounted for 63 percent of damages in aquaculture, whereas in capture fishing, fishing boats suffered the most significant part of the damage (FIGURE 32). For fisheries, 2 126 fishers were affected by the loss of their produce of USD 3.5 million from seaweeds, milkfish, tilapia and shrimp production (cages and ponds) in the three regions. For fisheries and aquaculture, fishers were unable to continue fishing after the typhoon as they lost their equipment and gear.132 FAO observed even more significant damages to the fisheries and aquaculture sector, with losses amounting to PHP 3.97 billion (USD 79.4 million).131
FIGURE 32 DAMAGE AND LOSS IN FISHERIES AND AQUACULTURE CAUSED BY TYPHOON RAI
Volcano eruption in Tonga
The Hunga Tonga–Hunga Ha’apai (HT–HH) undersea volcano in Tonga erupted on 15 January 2022 in a blast that was felt across the world. The eruption resulted in two events: the fallout of the volcanic ash cloud and a tsunami, both of which had potential impacts on fisheries production and livelihoods.
The initial disaster assessment report produced in February 2022 by the Ministry of Fisheries in Tonga focused on damage to fisheries assets covering small-scale tuna and snapper vessels, and their engines and gear. The total estimated damage to the fisheries and aquaculture subsector was USD 4.6 million. Since the report only examined damage, a second assessment was conducted as a collaboration between the Ministry of Fisheries and FAO to further examine incurred loss, reductions in economic flows and recovery requirements.
When including losses in economic flows, the HT–HH eruption and associated tsunami in January 2022 caused an estimated USD 7.3 million loss in the fisheries and aquaculture sector in Tonga (TABLE 4). Ash fall impacts were not considered in this assessment, as physical impacts from the fallout of the ash cloud were estimated as relatively minor.
TABLE 4 LOSS AND DAMAGE IN FISHERY AND AQUACULTURE CAUSED BY THE HUNGA TONGA–HUNGA HA’APAI ERUPTION AND TSUNAMI
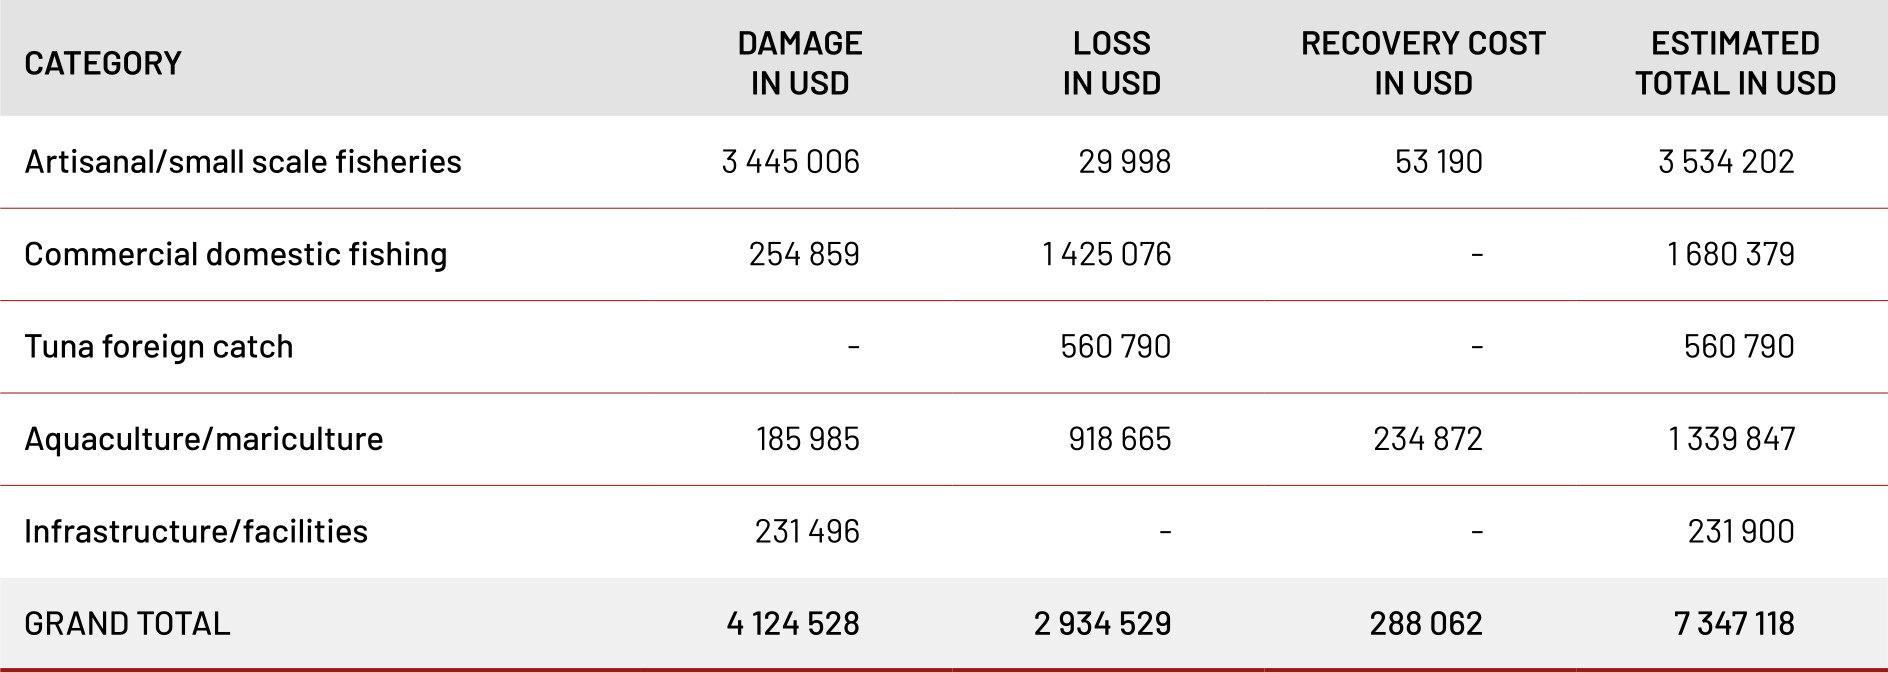
The fishery sector made up 2.1 percent of Tonga’s GDP in 2020–2021.133 With a total GDP of USD 488.83 million in 2020 according to World Bank data,134 this presents a value of about USD 10.3 million. The estimated USD 7.3 million incurred in loss and damage in the fisheries and aquaculture sector represents roughly 71 percent of the fishery sector value in GDP, indicating how significant this disaster was for the sector.
The category most impacted by this event is the artisanal/small scale fisheries, with estimated damages and losses of USD 3.5 million accounting for 48 percent of the total estimated. According to the 2015 agriculture census,135 only 15 percent of all households surveyed are involved in fishing activities. Out of those, 54 percent are engaged in subsistence fishing for consumption, about 42 percent in semi-subsistence (mainly for consumption and some for sale), and only 4 percent in commercial fishing. These are households indicating fishing as a main income or livelihood source. The fact that their loss is the highest despite representing a small share of Tonga’s households suggests they were strongly affected. Moreover, from a food security point of view, fish and seafood make up 10 percent, 11 percent and 13 percent of overall food expenditure in ‘Eua, Tongatapu and Ha’apai divisions, respectively, according to the Household Income and Expenditure survey 2015/16.136 About 10 percent of the total fish and seafood expenditure is covered by subsistence, i.e. households fishing activities. Overall, the access to and consumption of fish and seafood are critically important to household food security and nutrition for most households in Tonga.
The aquaculture and mariculture sector present an overall estimate of USD 1.3 million worth of losses, about 18.2 percent of the overall sector total. Within these sectors, economic losses dominated the overall estimates due to the loss of harvestable stock. The highest economic losses were experienced within commercial domestic fishing. Fortunately, very little damage occurred to brood stock since Tonga follows a catch-and-release approach for brood input and assets. However, there is no available information on impacts on the marine environment where brood stock are captured for spawning at the aquaculture farms. Apart from ornamental tropical aquarium fish production, all losses were experienced in pilot farms and projects. The large economic loss for sea cucumber was due to the loss of an estimated 6 000 mature and ready to harvest sandfish that were affected by the tsunami.


