
2.3 Measurement and evidence on crops and livestock
Disaster risk reduction and climate change adaptation polices are key to ensuring sustainable development. However, the ability to make accurate and effective decisions requires first and foremost a reliable knowledge framework. Despite the urgent need to understand the full extent of disaster impacts on production in agriculture, data on loss and damage are not being systematically collected or reported and remain limited in scope. As a means of addressing this gap, the following sections draw on secondary data, notably EM-DAT and FAOSTAT production data, to provide a quantification of the impact of disasters on agricultural production, focused on crops and livestock production.
EM-DAT provides the most comprehensive coverage of historical disaster events, including storm, flood, drought, extreme temperature, insect infestation, wildfire, earthquake, landslide, mass movement and volcanic activity. These hazard types form the basis of the assessment.l Direct losses due to these disasters are estimated using agricultural production data available from FAOSTAT for 192 crops and livestock items over the period 1991–2021. National average productivity reductions by items are compared to a counterfactual scenario in which disaster events did not occur, estimated on the basis of total factor productivity (TFP) growth (see Technical annex 2 for details). Losses are aggregated across different products using prices deflated with 2017 purchasing power parity (PPP) USD. To estimate losses associated with each hazard type, weights are calculated using the parameters of a mixed effects regression model, in the absence of reliable information on their differential potential impact.
Among the assumptions of this exercise, it is important to note that in the absence of more granular data, productivity reductions in comparison to the counterfactual are attributed to disasters. Additionally, when disasters strike, they produce negative outcomes in combination with pre-existing climate conditions, socioeconomic factors and institutional contexts. The impacts also result from, and simultaneously produce, a dynamic interaction between the subsectors of crops and livestock. For example, droughts can result in water scarcity, affecting both crop growth and livestock hydration. Floods can cause crop damage, soil erosion and destruction of livestock infrastructure. Similarly, wildfires can destroy crops, pastureland and livestock feed, posing risks to both crop production and livestock well-being.52 However, the impact of disasters on crops and livestock production are treated as independent and instantaneous occurrences in this estimation, without considering the dynamic nature of their interdependency.
2.3.1 GLOBAL LOSSES IN CROPS AND LIVESTOCK PRODUCTS
Findings reveal that estimated losses in the crops and livestock subsectors of agriculture have been following a slowly increasing trend over the last three decades. When aggregating losses from extreme events that occurred worldwide over the past 31 years, the estimated total loss amounts to USD 3.8 trillion, equivalent to an annual average of approximately USD 123 billion (FIGURE 9). This value is equivalent to 5 percent of global agricultural GDP. In relative terms, the total amount of USD losses over 31 years is approximately equivalent to Brazil’s GDP in 2022.
FIGURE 9 TOTAL ESTIMATED AGRICULTURAL PRODUCTION LOSSES
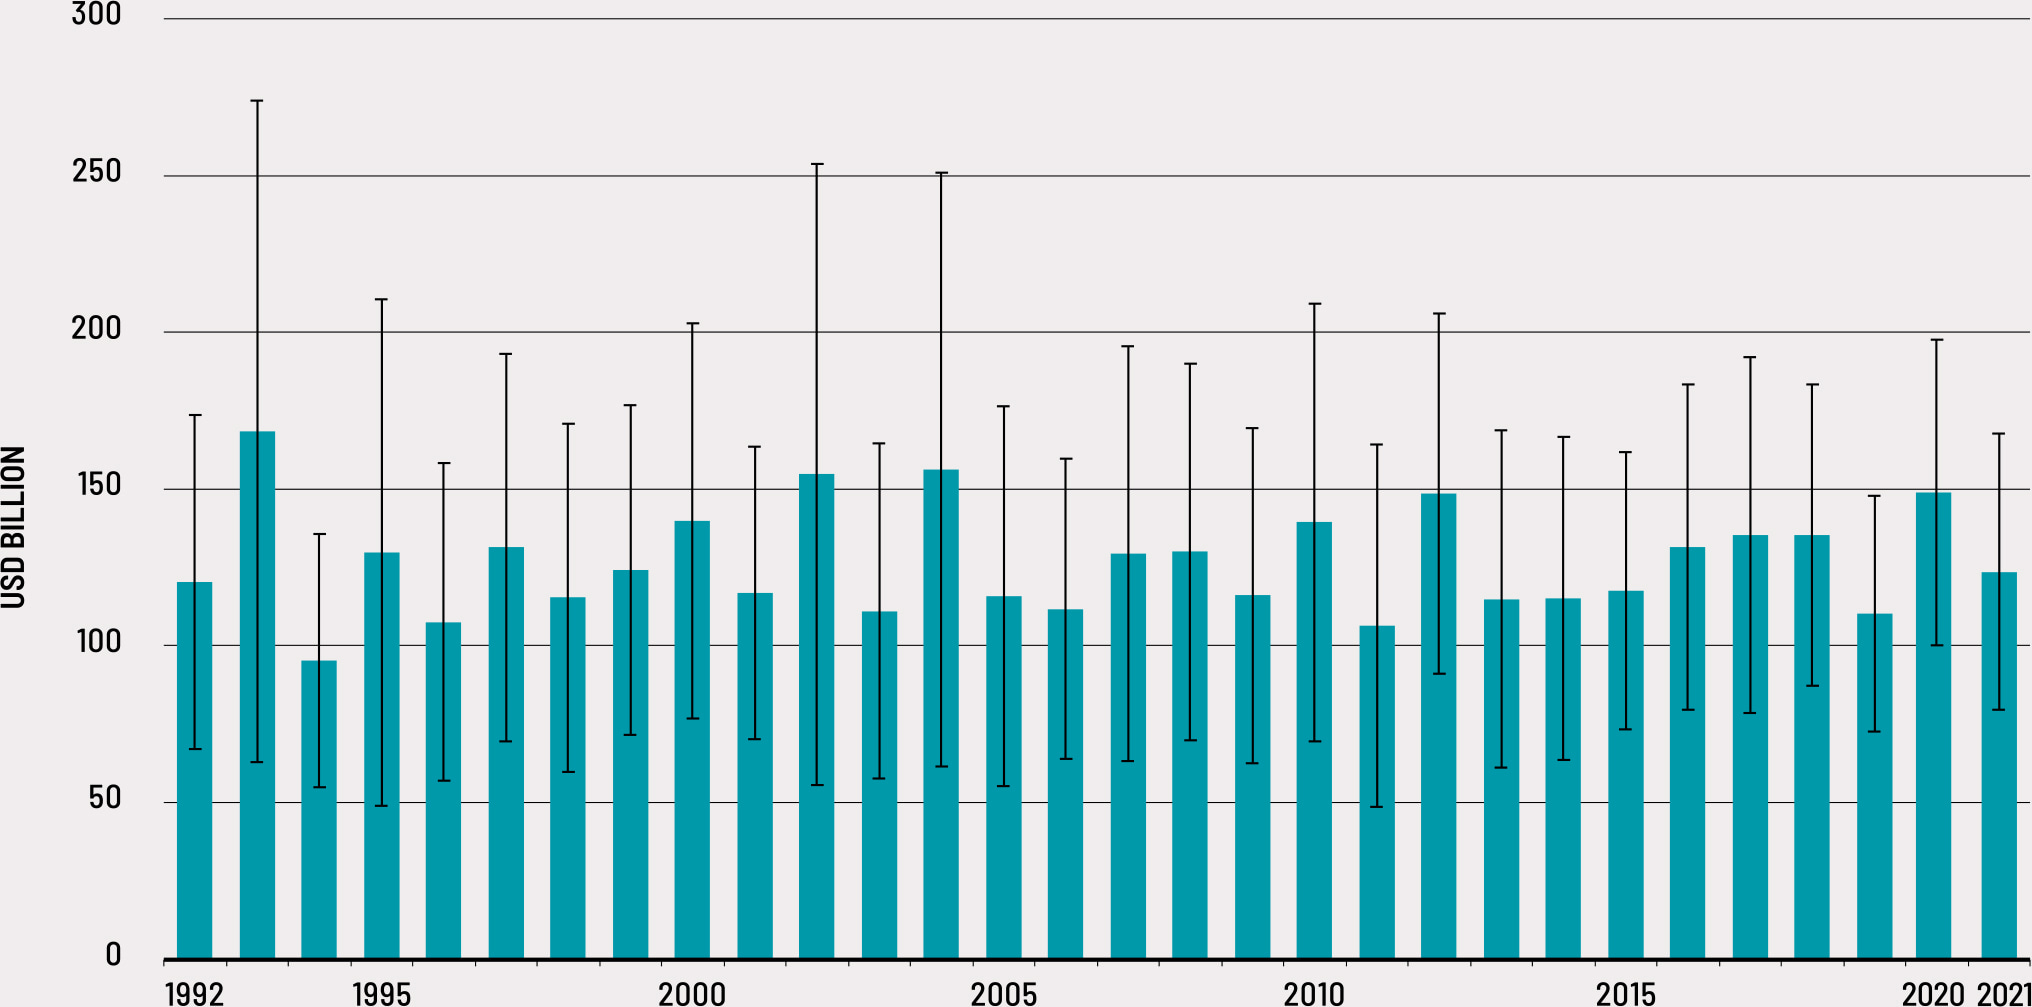
Major spikes approximately equivalent to USD 150 billion appear in the years 1993, 2002, 2004, 2010, 2012 and 2020. As the estimates presented here aggregate negative impacts from all recorded events of varying intensities, it is difficult to correlate these high losses with specific disaster events. However, correlations with certain recorded disaster events are observable. For example, spiking losses levels reflect the massive floods that affected cereals and soybean production in northern America in 1993; the large scale droughts that occurred in southern Asia and Africa in 2002; major droughts that affected China and caused extensive famine in the Sahel in 2010, at the same time as the Russian Federation experienced heatwaves; the disrupted monsoons that affected southern Asia in 2012; and the floods and cyclones that hit China and India respectively, at the same time as the record breaking Atlantic hurricane season that plagued northern America in 2020.
Aggregated global losses mask the considerable variability of impacts experienced at the national level. In this respect, the size of the standard deviation bars in FIGURE 9 makes it possible to assess the extent to which losses arose from a few localized events, or from many events taking place in several different countries. The standard deviation bars appear generally smaller in more recent years compared to the earlier periods. For instance, while the average variability around the central value was around ±35 percent in the years 1991 to 1993, that same average is down to ±17 percent in the last three years. Conversely, the years 1991 to 1993 saw on average 156 disasters reported around the world, whereas in the period of 2019 to 2021, this number was as high as 397.m This suggests that, over time, the concentration of losses has decreased as extreme events contributing to the total estimated annual losses become progressively more widespread across countries and products. Therefore, compared to the early 1990s, while overall losses (in value terms) have increased only moderately, they have become more widespread in terms of the countries and products that they affect. The covariate nature of the extreme events that generate losses in crops and livestock around the world seems to be increasing, as is its frequency.
BOX 4 Methodology for estimating disaster-induced crop and livestock losses at the global scale
To estimate disaster losses in agriculture on a global scale over 1991–2021, counterfactual yields are estimated for disaster years for 186 items and 197 countries/territories (see Technical annex 2). The differences between the estimated counterfactual yields and the actual yields correspond to disaster-induced yield losses, after filtering by significance levels. Using the yield losses estimated for a particular item at the country level, production losses in tonnes and monetary losses in 2017 USD are calculated.
Disaster data are drawn from EM-DAT, production and prices data from FAOSTAT, and some agricultural TFP data from the United States Department of Agriculture (USDA). Three counterfactual estimation methods are used depending on the country and item time series: a structural model with Kalman Filter (58 percent), a statistical method based on TFP clustering (39 percent), and a regression method based on TFP data (3 percent). Once the differences between counterfactual yields and actual yields are imputed, the estimation is repeated 1 000 times, including random disaster events, to create a null distribution that determines significance levels and filters for significant yield losses.
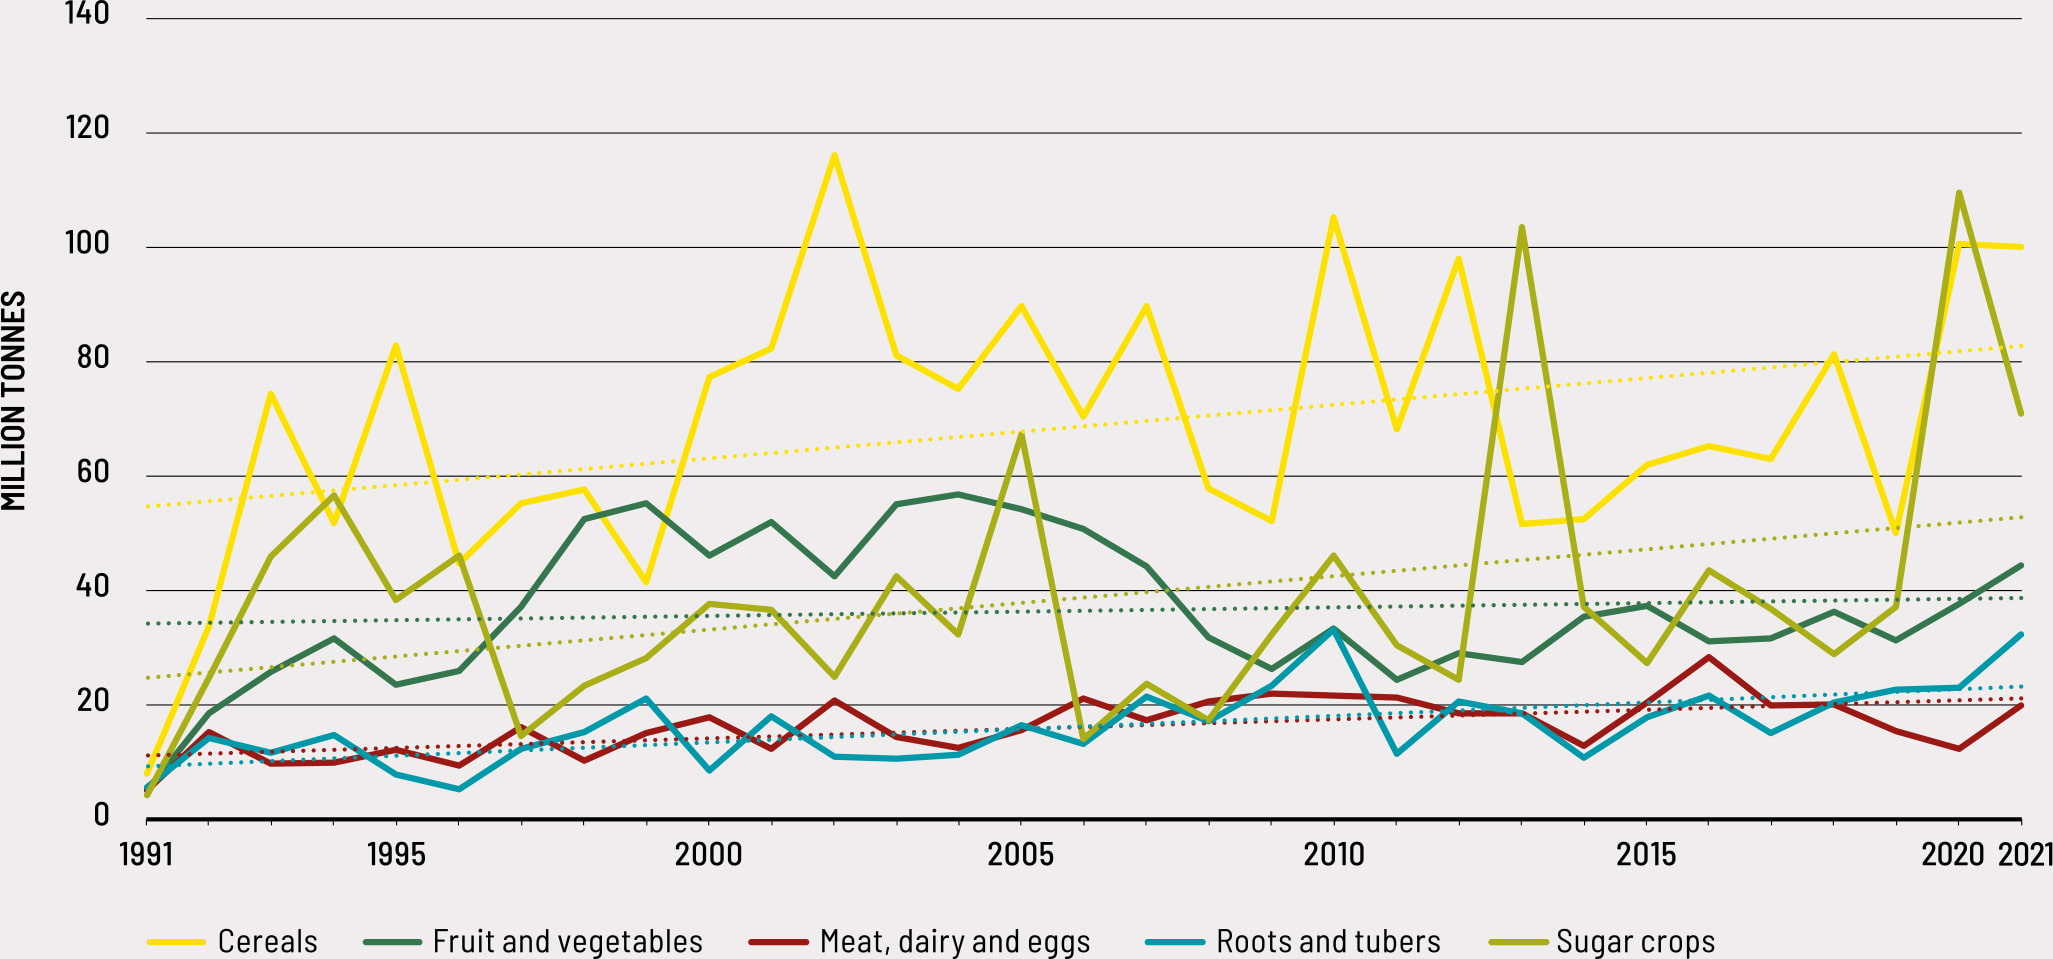
Losses for all major crop and livestock product groups display increasing trends (FIGURE 10). Estimated losses in cereals added up to an average of 69 million tonnes per year in the last three decades, followed by fruits and vegetables and sugar crops, which both approached an average of 40 million tonnes per year. Meats, dairy products and eggs show an average estimated loss of 16 million tonnes per year, along with roots and tubers; both these product groups present a markedly increasing trend. These amounts are significant: they correspond to little more than the entire 2021 production of cereals in France, of fruits and vegetables in Japan and Viet Nam, and of meats, dairy products and eggs in Mexico and India.
FIGURE 10 ESTIMATED LOSSES IN MAIN PRODUCT GROUPS (1991–2021)
In order to estimate losses in crops and livestock relative to other sectors, we look at Post-Disaster Needs Assessment (PDNAs). As seen in section 2.2, agriculture appears to account for 23 percent of total economic losses, but these data are limited in providing an assessment of total losses. The World Meteorological Organization (WMO) recently published an estimate of USD 4.3 trillion in economic losses between 1970 and 2021,53 which was computed using 3 612 hydrometeorological disaster events from EM-DAT. These events represent a small subset of disasters for which information on economic losses is available, corresponding to only 35 percent of the 10 000 plus disasters considered in the estimate of losses for crops and livestock presented in this section. Although information on total economic losses is available in EM-DAT, the database is missing loss values for more than 40 percent of its recorded disaster events.54 According to a joint report from the Centre for Research on the Epidemiology of Disasters (CRED) and the UNDRR, their findings indicate a significant disparity in disaster reporting. Specifically, during the period from 1998 to 2017, high-income countries reported losses in 53 percent of cases, while low-income countries only reported losses in 13 percent of disaster incidents. Notably, the report highlights that there is an absence of loss data for approximately 87 percent of disasters in low-income countries.55 In a recent report by UNDRR, it was noted that the economic loss figures recorded in EM-DAT are prone to underestimation due to data gaps in many countries, as well as the omission of medium- and long-term economic losses from the tracking mechanism.56
Evidence available at country level corroborates the fact that estimates of total economic losses obtained from the EM-DAT dataset are underestimated. For instance, extreme events occurring in the United States of America produced economic losses of over USD 122 billion per year during 2018–2022, and USD 149 billion per year during 2000–2022 according to NOAA, and these figures have been increasing systematically since the 1980s.9 Similarly, estimates of loss and damage resulting solely from the 2019 African swine fever outbreak in China range from USD 60 billion to USD 297 billion.24
While the absolute total of economic losses from extreme events remains unknown, the order of magnitude of the estimated losses in crops and livestock estimated here appears consistent with these examples and the amount obtained through the PDNAs, as illustrated in section 2.2.
Losses around the world
The estimation of global agricultural losses masks significant variability across regions, subregions and country groups. Disasters affect different regions and countries differently, both due to pre-existing social and environmental conditions and the vulnerability or resilience of agriculture and agricultural communities in dealing with disaster risk. The varying capacities for adaptation, resilience, risk reduction and recovery result in asymmetries in the degree to which a country is affected by a disaster event. While economic losses may be greater in high-income countries and regions – where agriculture produces higher-value goods and assets, and infrastructure is more widespread and developed – social consequences may be lower given the relatively higher ability of farmers and other affected stakeholders to cope with losses or obtain access to social protection. In lower-income countries, agriculture tends to be associated with lower-value commodities, assets and infrastructure, which makes the net economic value of losses relatively low. However, the ability to recover from shocks generally tends to be lower in such contexts, resulting in knock-on effects on vulnerability and disruptions to livelihoods that generate serious long-term consequences for poverty and food insecurity.
Somewhat predictably, the distribution of total losses across regions for the entire 1991–2021 period reflects the overall geographic size of the region (FIGURE 11). Asia experienced by far the largest share of total economic losses. Africa, Europe and the Americas together display a similar order of magnitude despite the large differences in land use and agricultural practices in these regions. As the smallest region, Oceania accounts for the lowest total losses.
FIGURE 11 DISTRIBUTION OF TOTAL ESTIMATED LOSSES OF USD 3.8 TRILLION BY REGION (1991–2021)
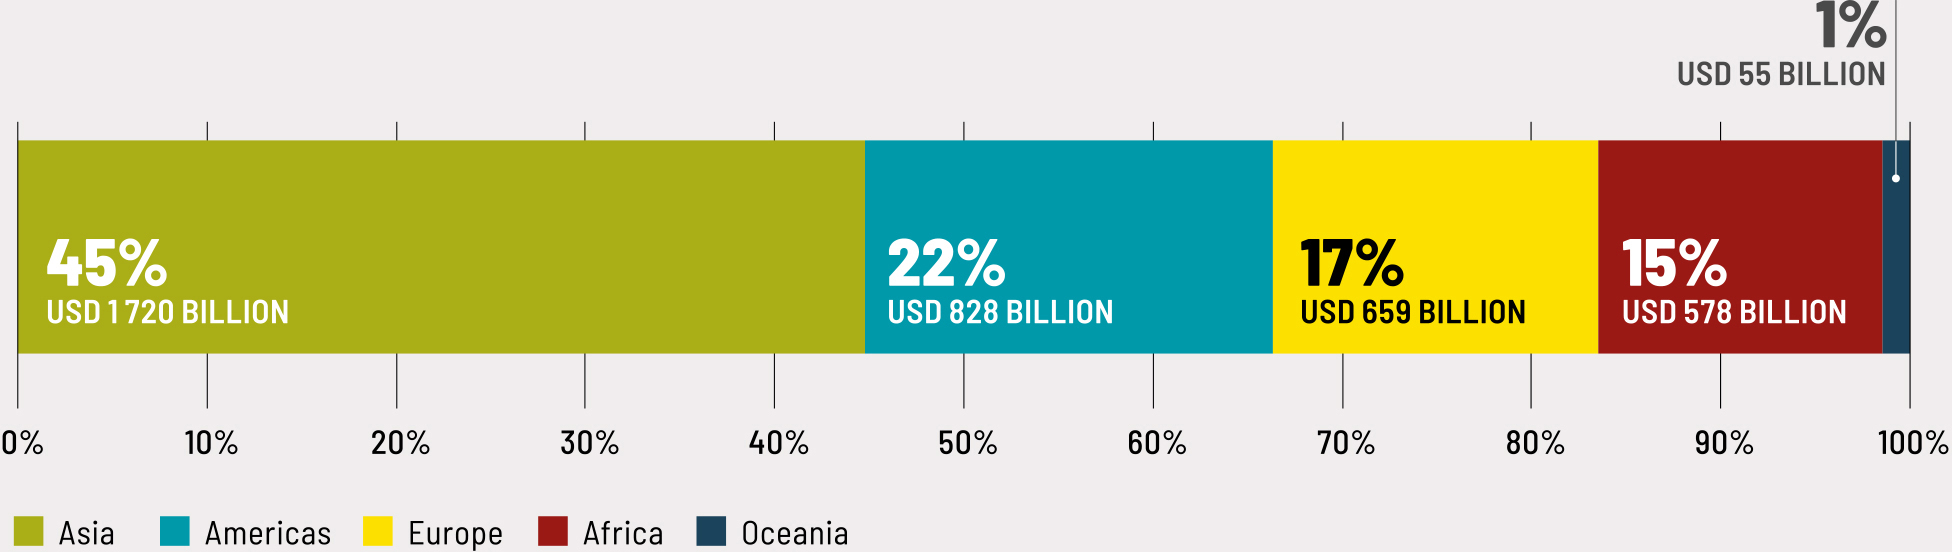
To put these losses in perspective, it is useful to consider their value relative to total agricultural value added in each region (FIGURE 12), as losses in production have a different bearing in each region’s economy, depending on the importance of the agricultural sector and relative values lost. While Asia shows the largest share of absolute global losses (45 percent), it shows the smallest share (4 percent) relative to agricultural GDP. In contrast, the total losses in Africa are about one-quarter of Asia’s losses, which corresponds to nearly 8 percent of the agricultural value added, or double that of Asia. Losses in Europe and the Americas represent around 7.5 percent and around 5 percent in Oceania.
FIGURE 12 LOSSES AS SHARE OF AGRICULTURAL GROSS DOMESTIC PRODUCT (1991-2021)
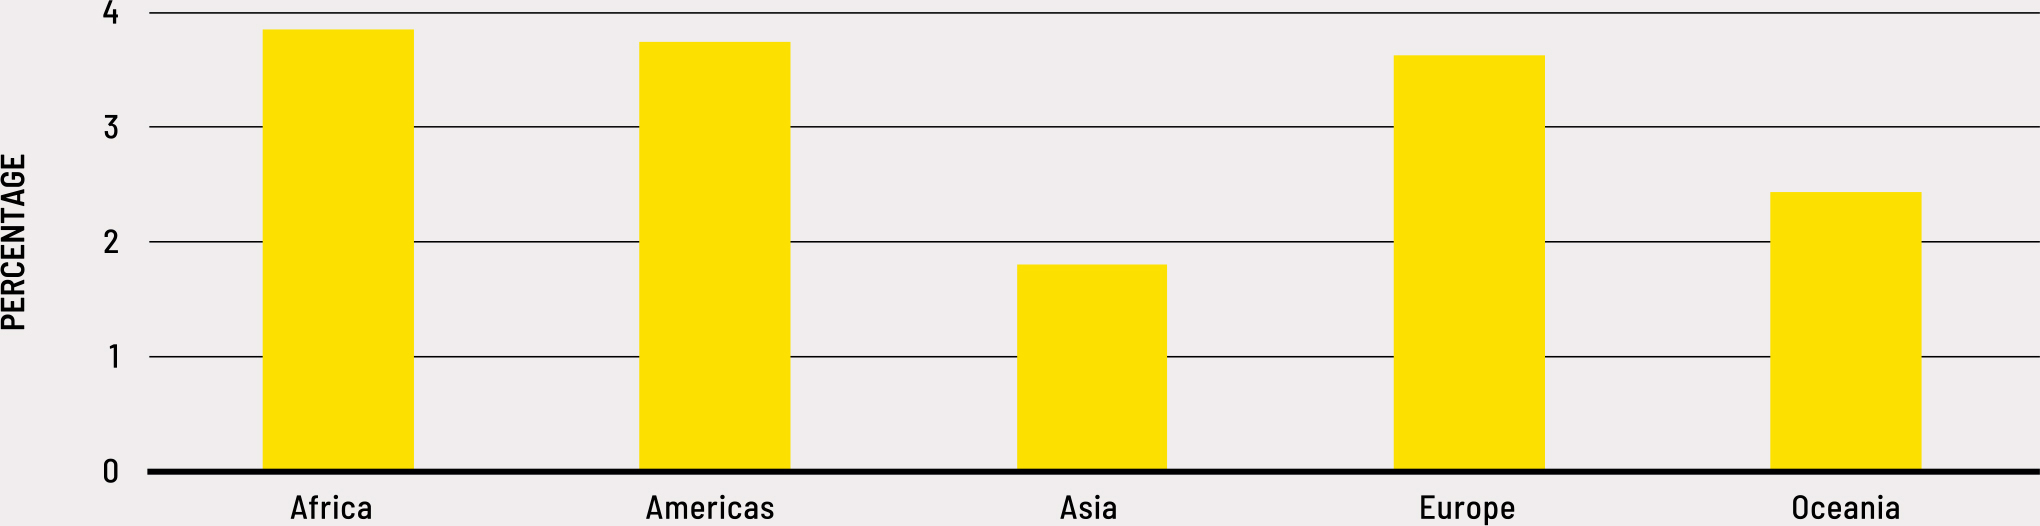
Source: Authors’ own elaboration based on FAO and EM-DAT data.
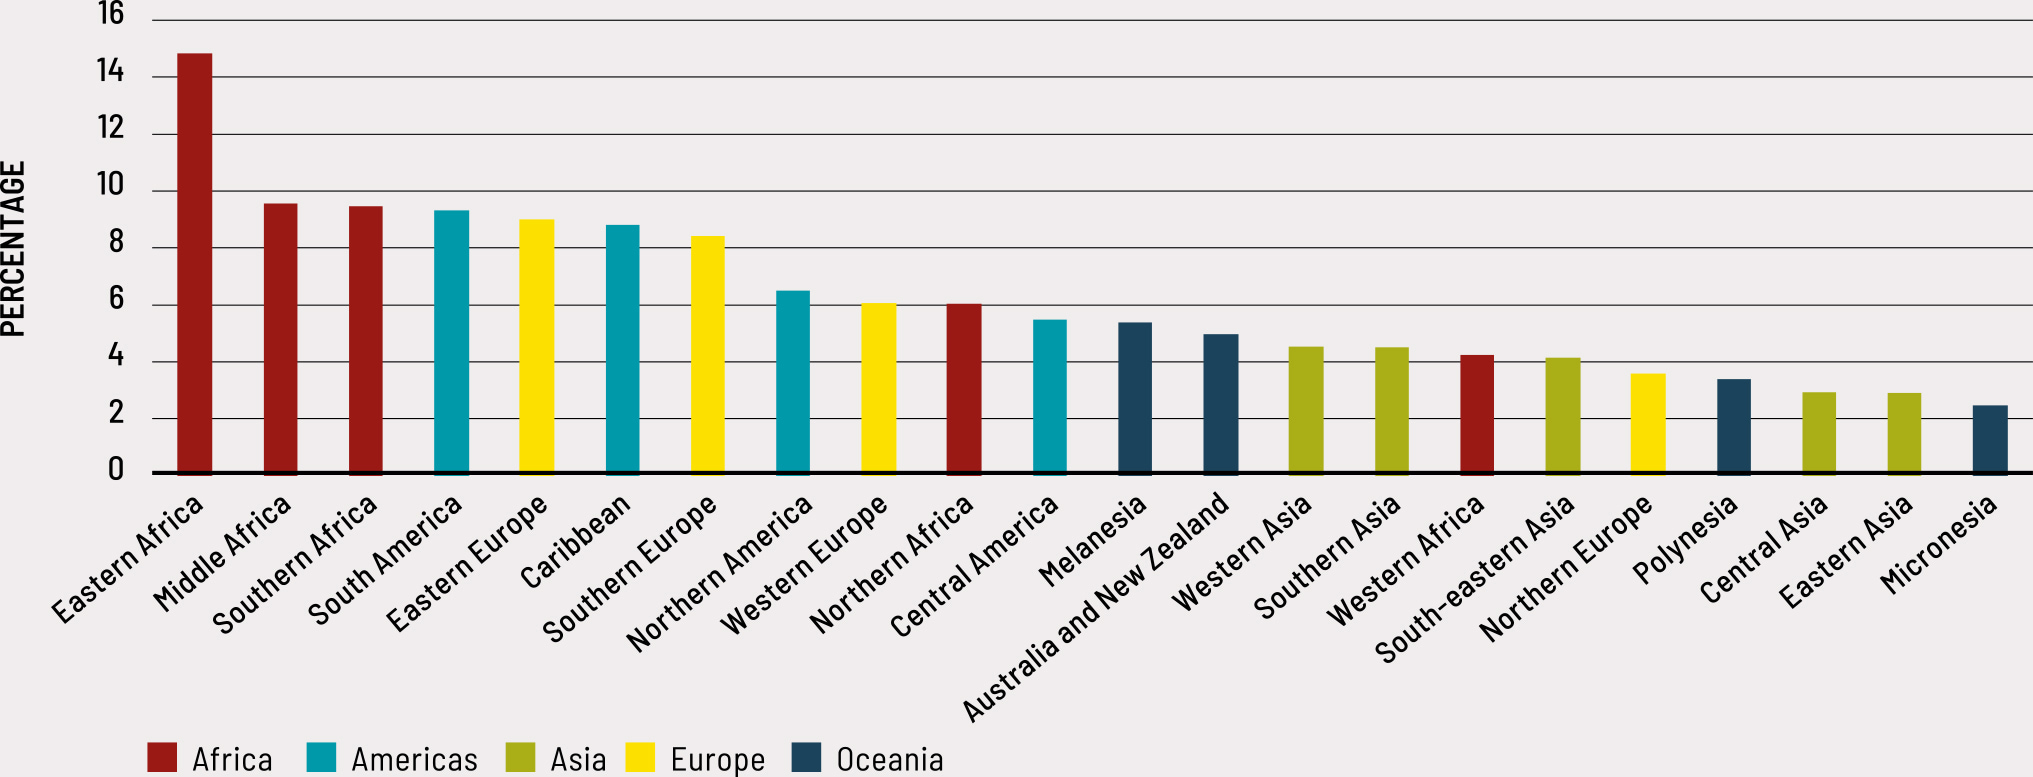
At the subregional level, the relative importance of losses in economic terms reveals an even more nuanced picture (FIGURE 13). The prominence of eastern Africa, with almost 15 percent of value added in agriculture lost due to extreme events affecting crops and livestock, relates to the disruptive power of the large-scale droughts that have occurred in the Horn of Africa during the 2010s and in more recent years.
FIGURE 13 TOTAL AGRICULTURAL LOSSES AS A SHARE OF AGRICULTURAL GROSS DOMESTIC PRODUCT BY SUBREGION (1991-2021)
Source: Authors’ own elaboration based on FAO and EM-DAT data.
Similarly, in Latin America and the Caribbean, albeit for different reasons, losses from extreme events are substantial, with values reaching close to 10 percent. Asian subregions, on the contrary, appear to undergo significant losses that account for a smaller share of the agricultural value added, notwithstanding the significant extreme experienced, such as the several floods experienced in the southern region, or the extent of occurrences such as the outbreak of African swine fever in China. It is also noteworthy that northern America has witnessed substantial losses from floods, hurricanes and other disasters occurring over the past three decades. (FIGURE 13).
Further insights can be gained by looking beyond the regions and towards country groups defined by per capita income levels. In this report, special consideration is assigned to SIDS, which are particularly exposed and vulnerable to disruptive extreme events. As expected, in absolute terms, losses are higher in high-income countries, lower-middle-income countries and upper-middle-income countries (FIGURE 14, upper panel). On the contrary, low-income countries, and SIDS, show very low levels of absolute losses. These relative positions reflect a combination of the small physical size of the countries in each group and the low unit price of the products involved. The small physical size is the reason for the low value reported by SIDS. The low level reported by low-income countries, instead, stems mostly from low unit values of crops and livestock products.
FIGURE 14 TOTAL AGRICULTURAL LOSSES (TOP) and TOTAL AGRICULTURAL LOSSES AS A SHARE OF AGRICULTURAL GROSS DOMESTIC PRODUCT (BOTTOM) BY COUNTRY groups (1991-2021)
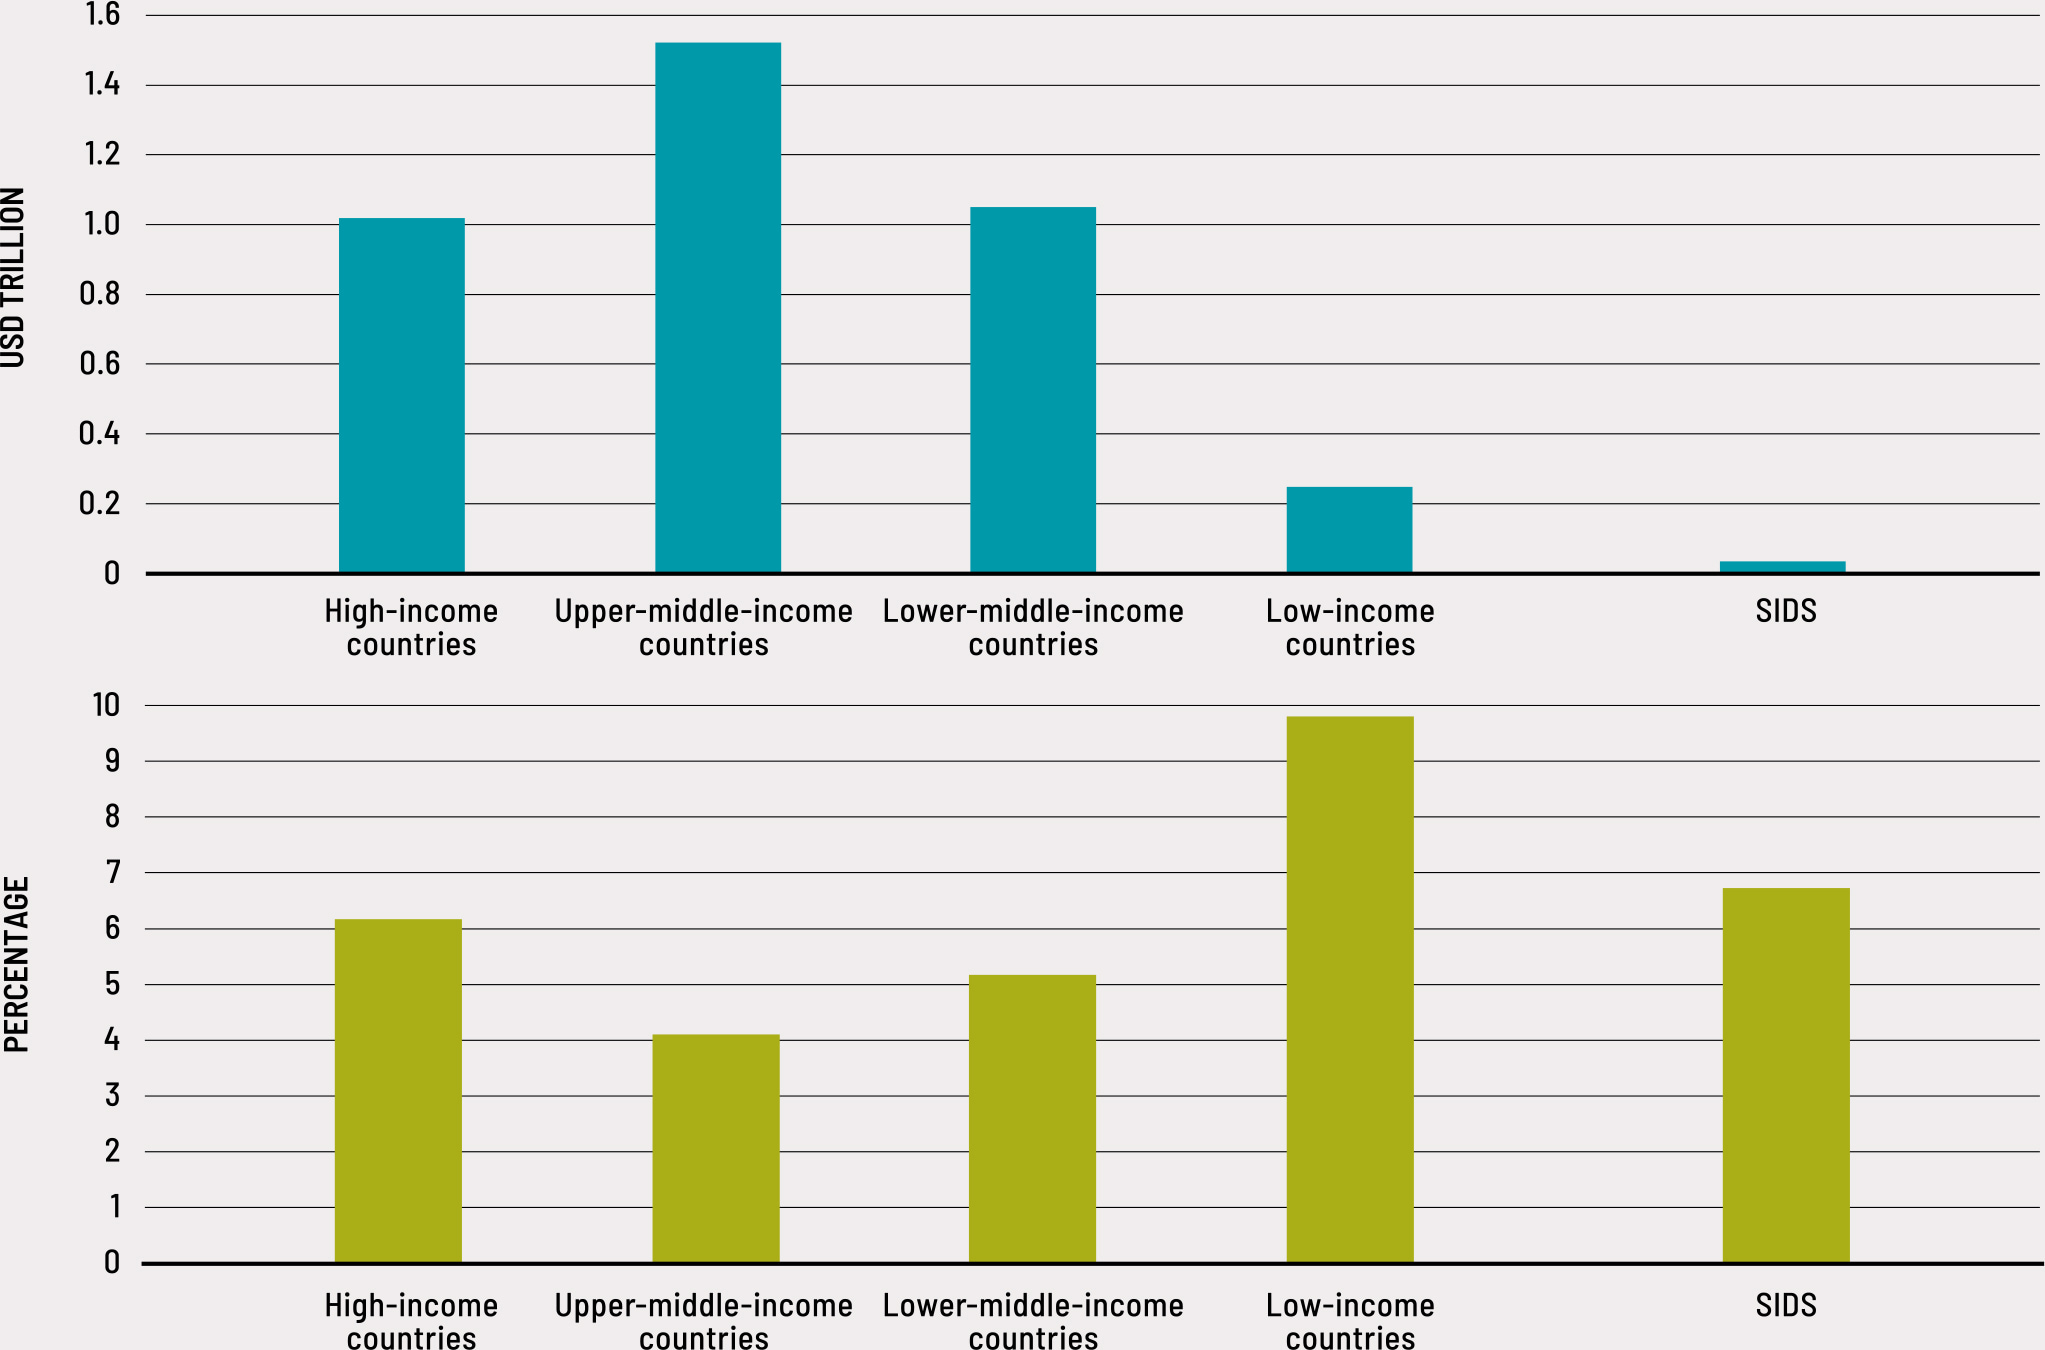
The picture changes significantly when the distribution of losses across these groups is considered in relative terms as a share of agricultural value added (FIGURE 14, bottom panel). Expressed in this way, it becomes evident that the extent of the losses suffered by low-income countries is, on average, more than double that of the losses experienced by upper-middle-income countries. Something similar can be seen in SIDS where losses are quite extensive due to the small agricultural production basis. High-income and lower-middle-income countries appear in an intermediate position, following the different combination of an extensive agricultural production basis with a significant number of extreme events recorded.
It is also worth considering losses in the crops and livestock subsectors compared to production. For each main product group, the losses estimated are reported on the amount of production estimated in the counterfactual scenario where no reported extreme event would occur (see Technical annex 2 for details). Considering the data in this manner provides information on the lost potential production in each of the main product groups due to the occurrence of disasters, and qualifies this potential in the world regions and different economic country groupings.
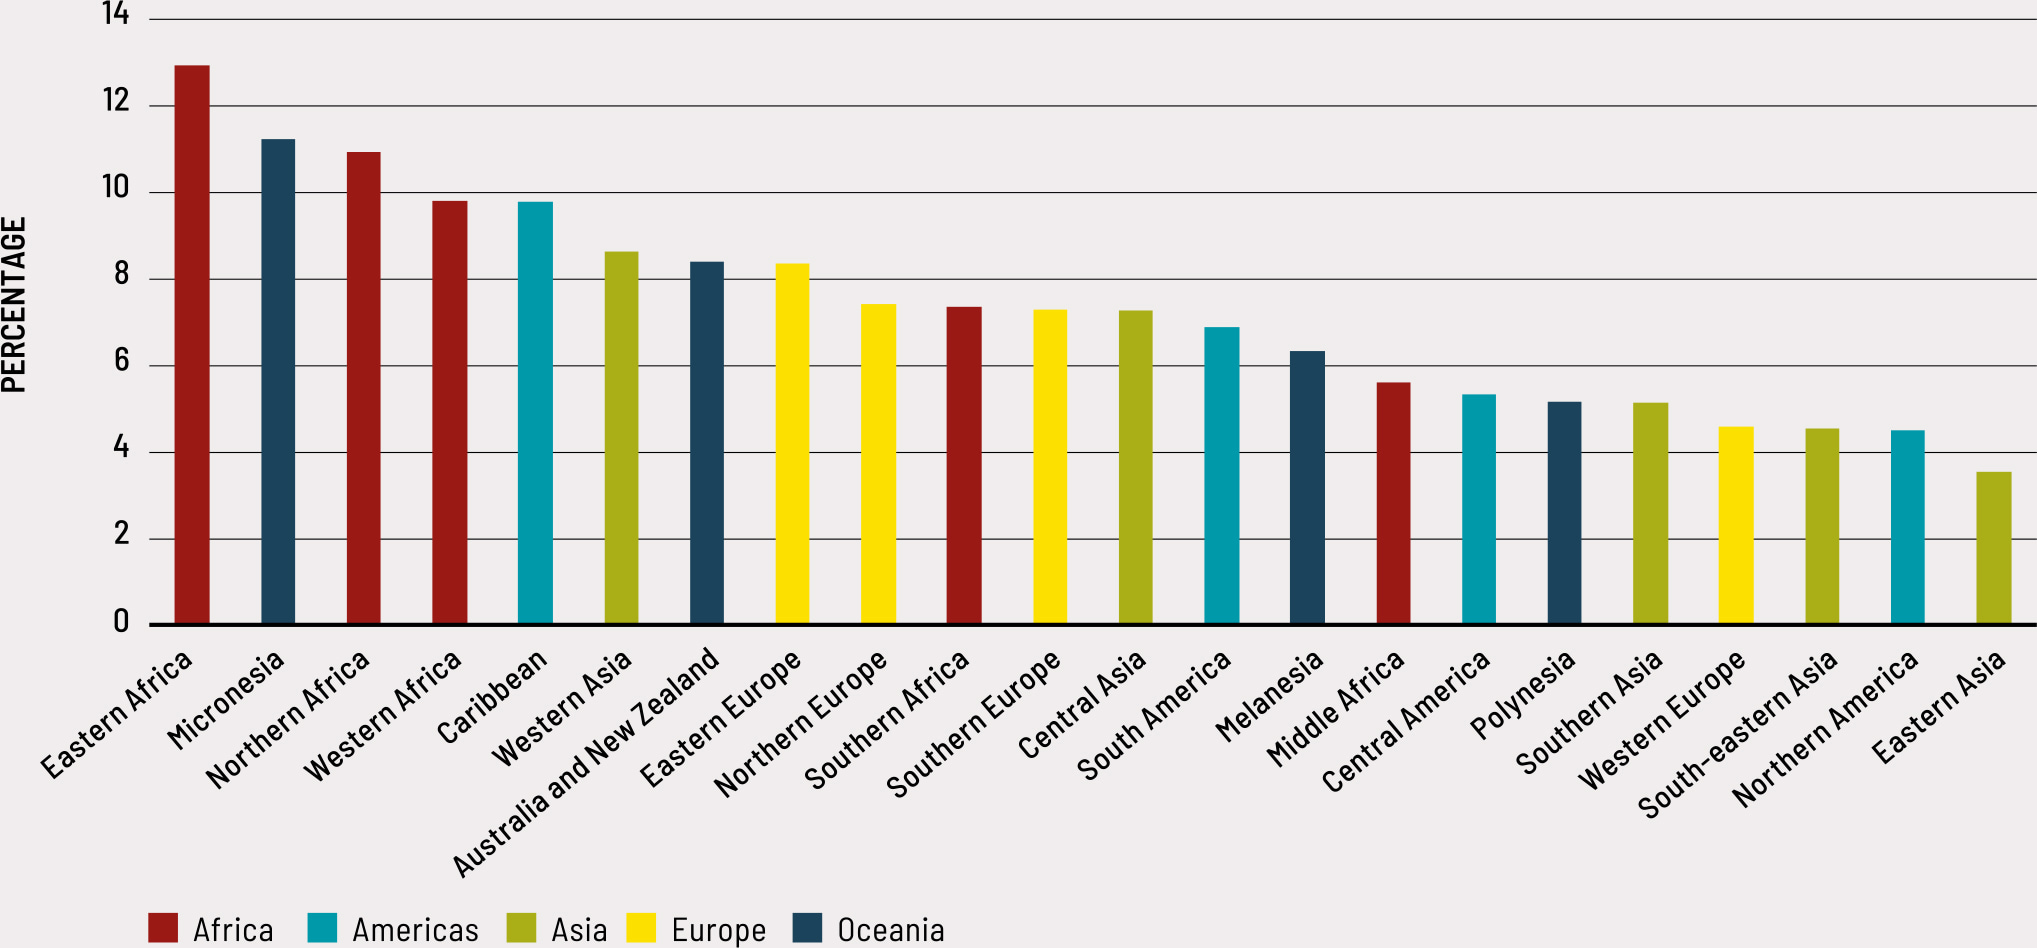
The losses compared to the counterfactual production can be observed for all crops and livestock products as a whole by using prices deflated with PPP 2017 USDn (FIGURE 15). In these terms, results emphasize the importance of losses in several parts of Africa, primarily the eastern, northern and western parts. The impact of extreme events appears less prominent in eastern, southern and south-eastern Asia, despite their absolute magnitude. This is due to the large scale of production in these regions, which absorbs the frequent occurrence of disasters.
FIGURE 15 TOTAL AGRICULTURAL LOSSES AS A PERCENTAGE OF ESTIMATED COUNTERFACTUAL PRODUCTION BY SUBREGION (1991-2021)
Notwithstanding considerable year-to-year variability, extreme events seem to cause losses ranging around 10 percent of the counterfactual production at the global level. Moreover, examining individual product groups in these physical terms provides an interesting perspective on their behaviour (FIGURE 16).o This is the case of most product groups, with the exception of meats, which report slightly lower shares. Losses in cereals seem to be on the rise in the past few years, while those of fruits and vegetables seem to have decreased in the last decade. Losses in roots and tubers, however, seem to have increased consistently since the mid-2010s.
FIGURE 16 TOTAL AGRICULTURAL LOSSES AS A PERCENTAGE OF ESTIMATED COUNTERFACTUAL PRODUCTION BY COMMODITY GROUP WORLDWIDE IN LOW-INCOME COUNTRIES AND IN SMALL ISLAND DEVELOPING STATES (1991–2021)
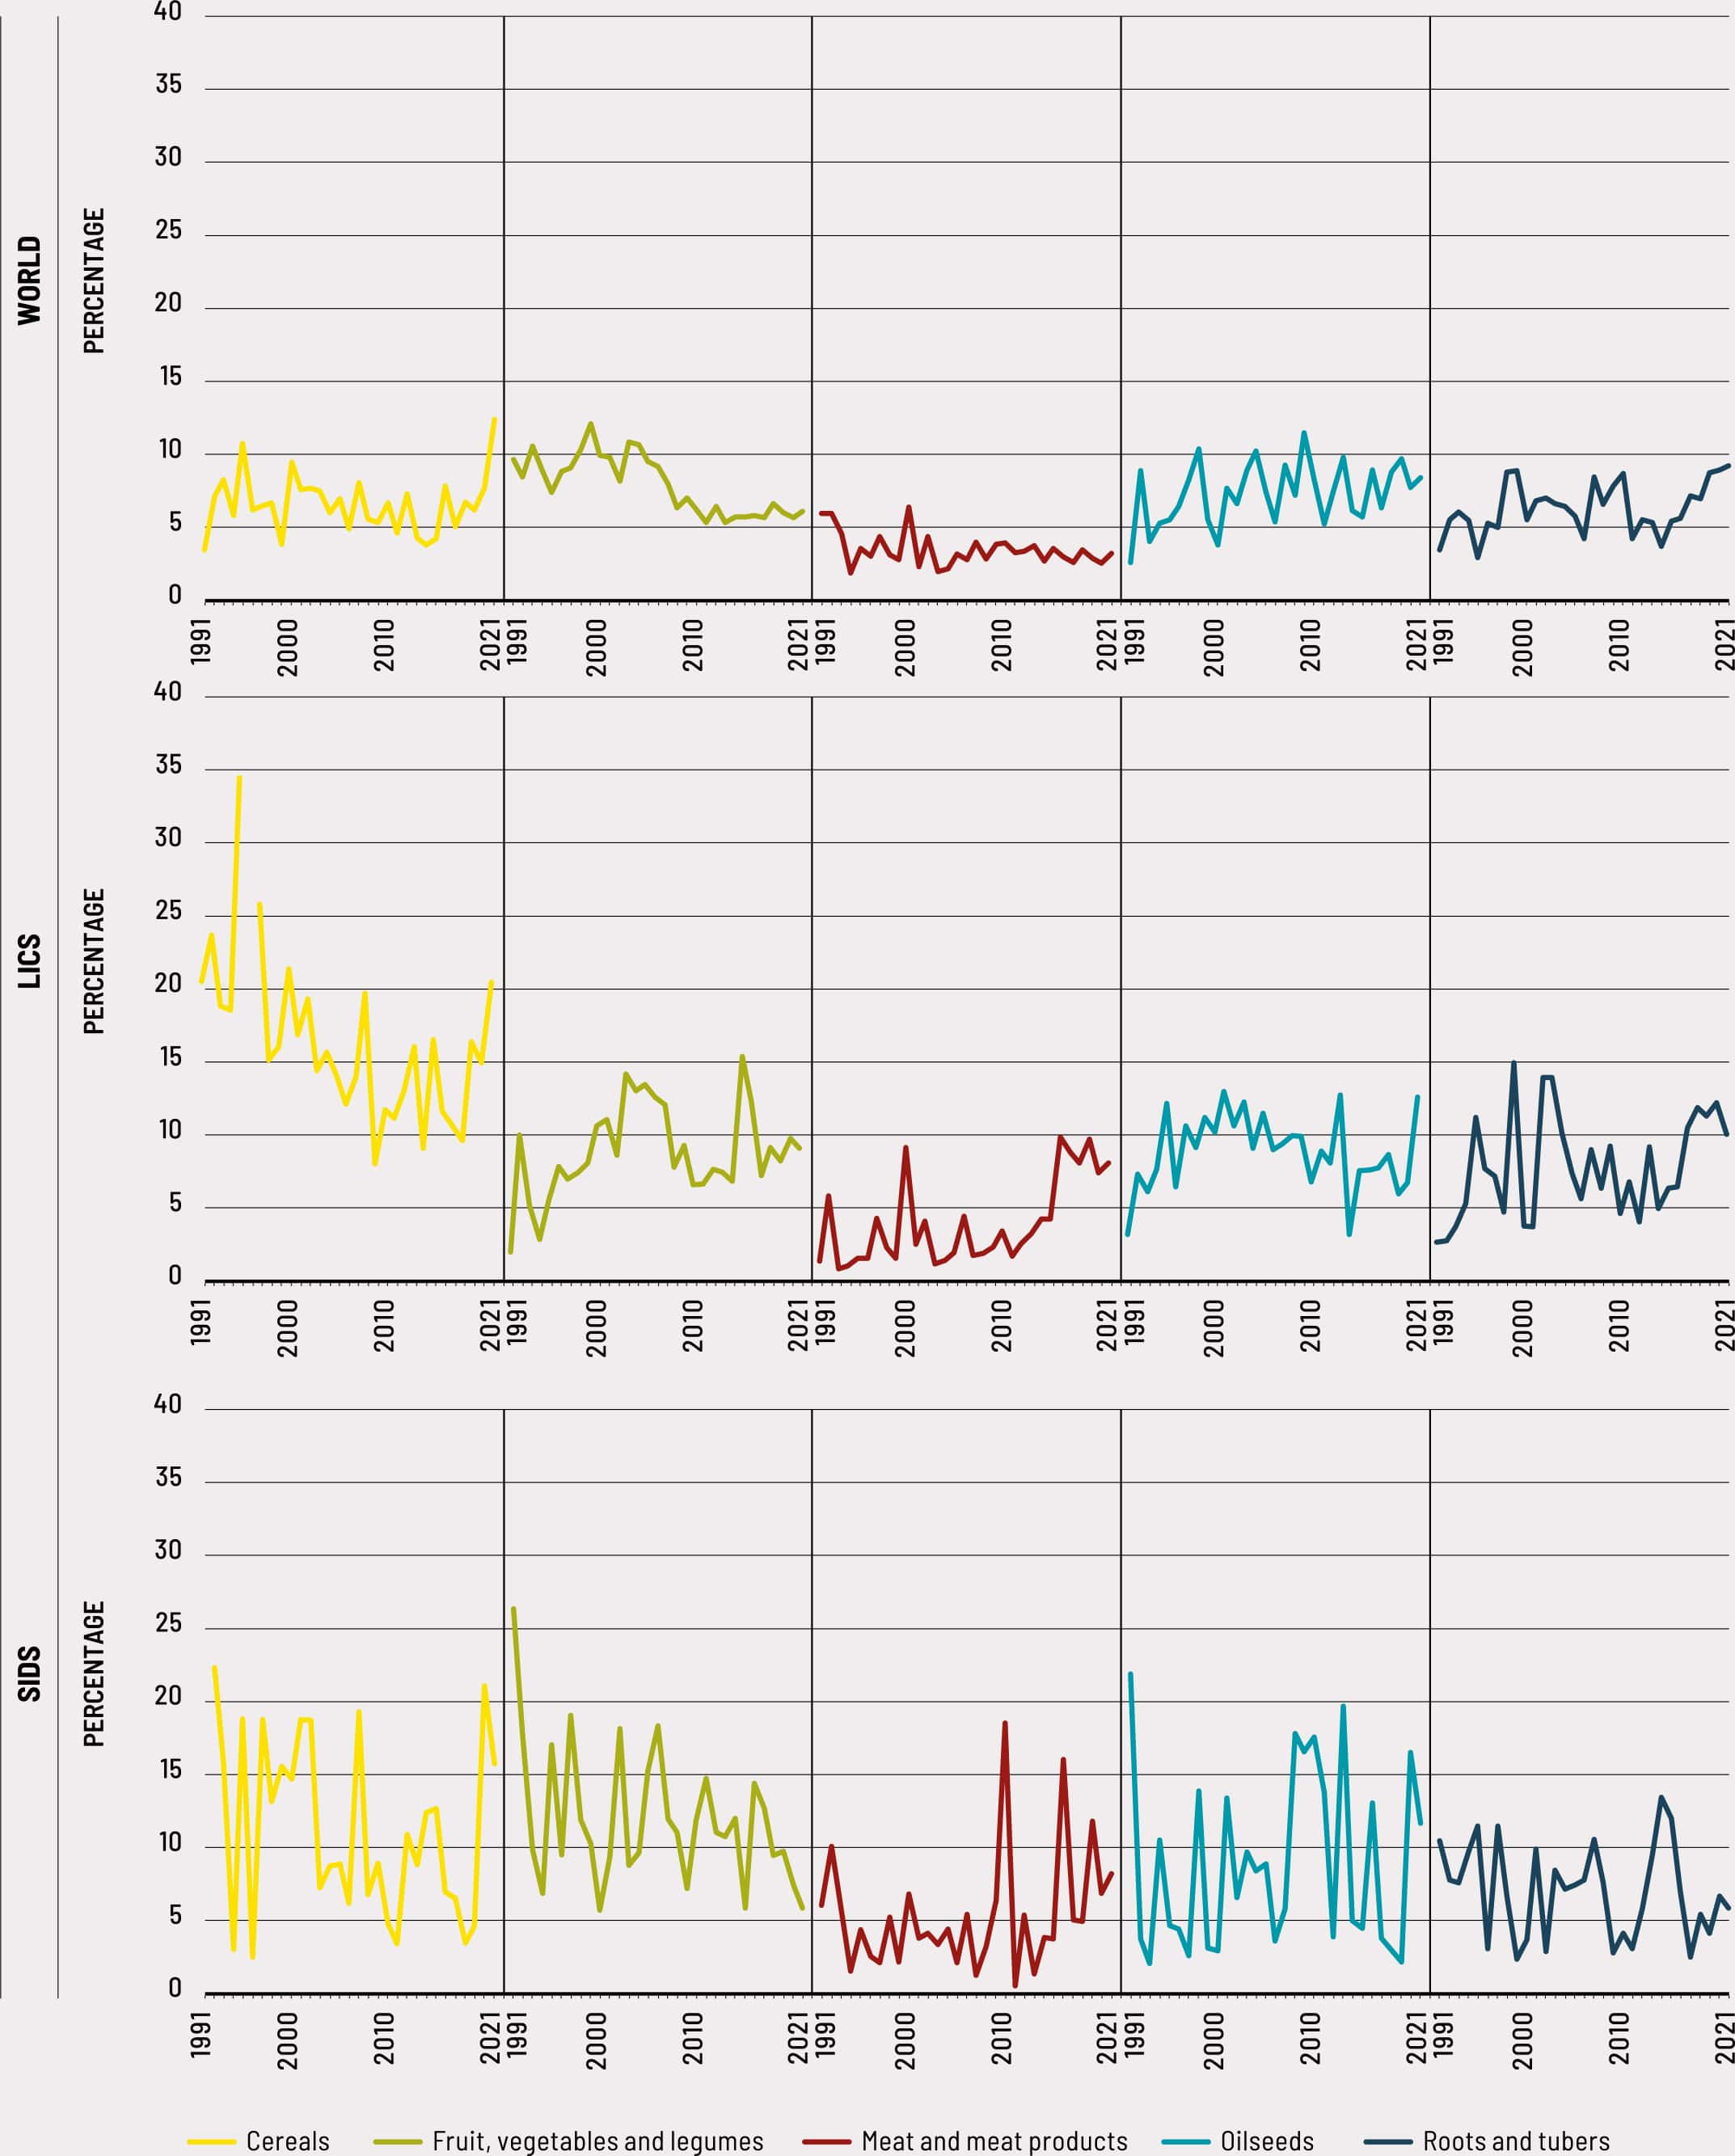
Also in these terms, the global figures mask significant differences among regions and subregions. In low-income countries (FIGURE 16), estimated losses of cereals in the past three decades range between 10 and 20 percent of the counterfactual production; that is, they appear to be double those computed at the global level. In general, the variability appears to be wider for all product groups, and particularly for roots and tubers, which are food staples. In the case of the SIDS (FIGURE 16), shares of losses in the counterfactual production appear to be extremely variable as well as large. Cereal losses range up to above 20 percent in almost every other year, especially during the 1990s, but also in the following decades. Fruits and vegetables, too, display highly frequent spikes in losses.
Impact of specific hazards in agriculture
An attribution of losses to specific hazard types cannot be determined by the methodology for assessing losses described in the earlier section due the difficulty of disaggregating impacts for multiple disasters occurring in one year. Despite their limited coverage, the PDNAs reviewed in section 2.2 provide a better source for understanding the distribution of losses in agriculture across different hazard types. Despite differences in the scope and parameters of each dataset, findings on the distribution of losses across hazard type from both the PDNAs and EM-DAT point in a similar direction.
According to data reported in the PDNAs, droughts appear to be the most significant hazard type causing damage in agriculture during the 2006–2022 period, followed by cyclones and floods. While droughts constituted over 80 percent of the estimated losses in agriculture in 2017,57 it is floods, in conjunction with storms and cyclones, that generate the most substantial losses. As the risk of climate change increases, the frequency and intensity of meteorological hazards such as floods and storms, along with drought and extreme temperatures, are expected to increase.56,5
To elaborate on the degree to which different hazard types impact agriculture, a further exercise was conducted to assess the average amount of production lost for every hazard type during the 1991–2021 period. This was done by fitting a mixed effects regression model, in which losses in tonnes for a specific product in a given country during a given year were regressed against the number of events reported for each type of disaster in that same country and year. The results were estimated at a global level, and various parameters are used to compute weights and unit losses per hazard type in each region. Details of this analysis are in Technical annex 2a.
Results are presented as a percentage of the average total losses that each hazard type produces in agriculture (FIGURE 17). On a global scale, extreme temperatures and droughts are the hazards that exert the most significant impact per event, followed by floods, storms and wildfires.
FIGURE 17 PRODUCTION LOSS PER EVENT BY HAZARD TYPE IN CROPS AND LIVESTOCK (1991-2021)

As mentioned above, the estimates presented in this section on losses due to disasters were generated through probabilistic modelling using secondary data. In an ideal setup, this information may be collected though questionnaires, yielding harmonized information on disaster losses at the national and subnational levels. There are however some successful experiences of this type of assessments (see BOX 5 and 6). While there are no standardized protocols, the case studies presented in the following boxes are meant to provide information that can be used to develop protocols.
BOX 5 Animal health: Impact of the 2016–2017 drought on Somali livestock keepers
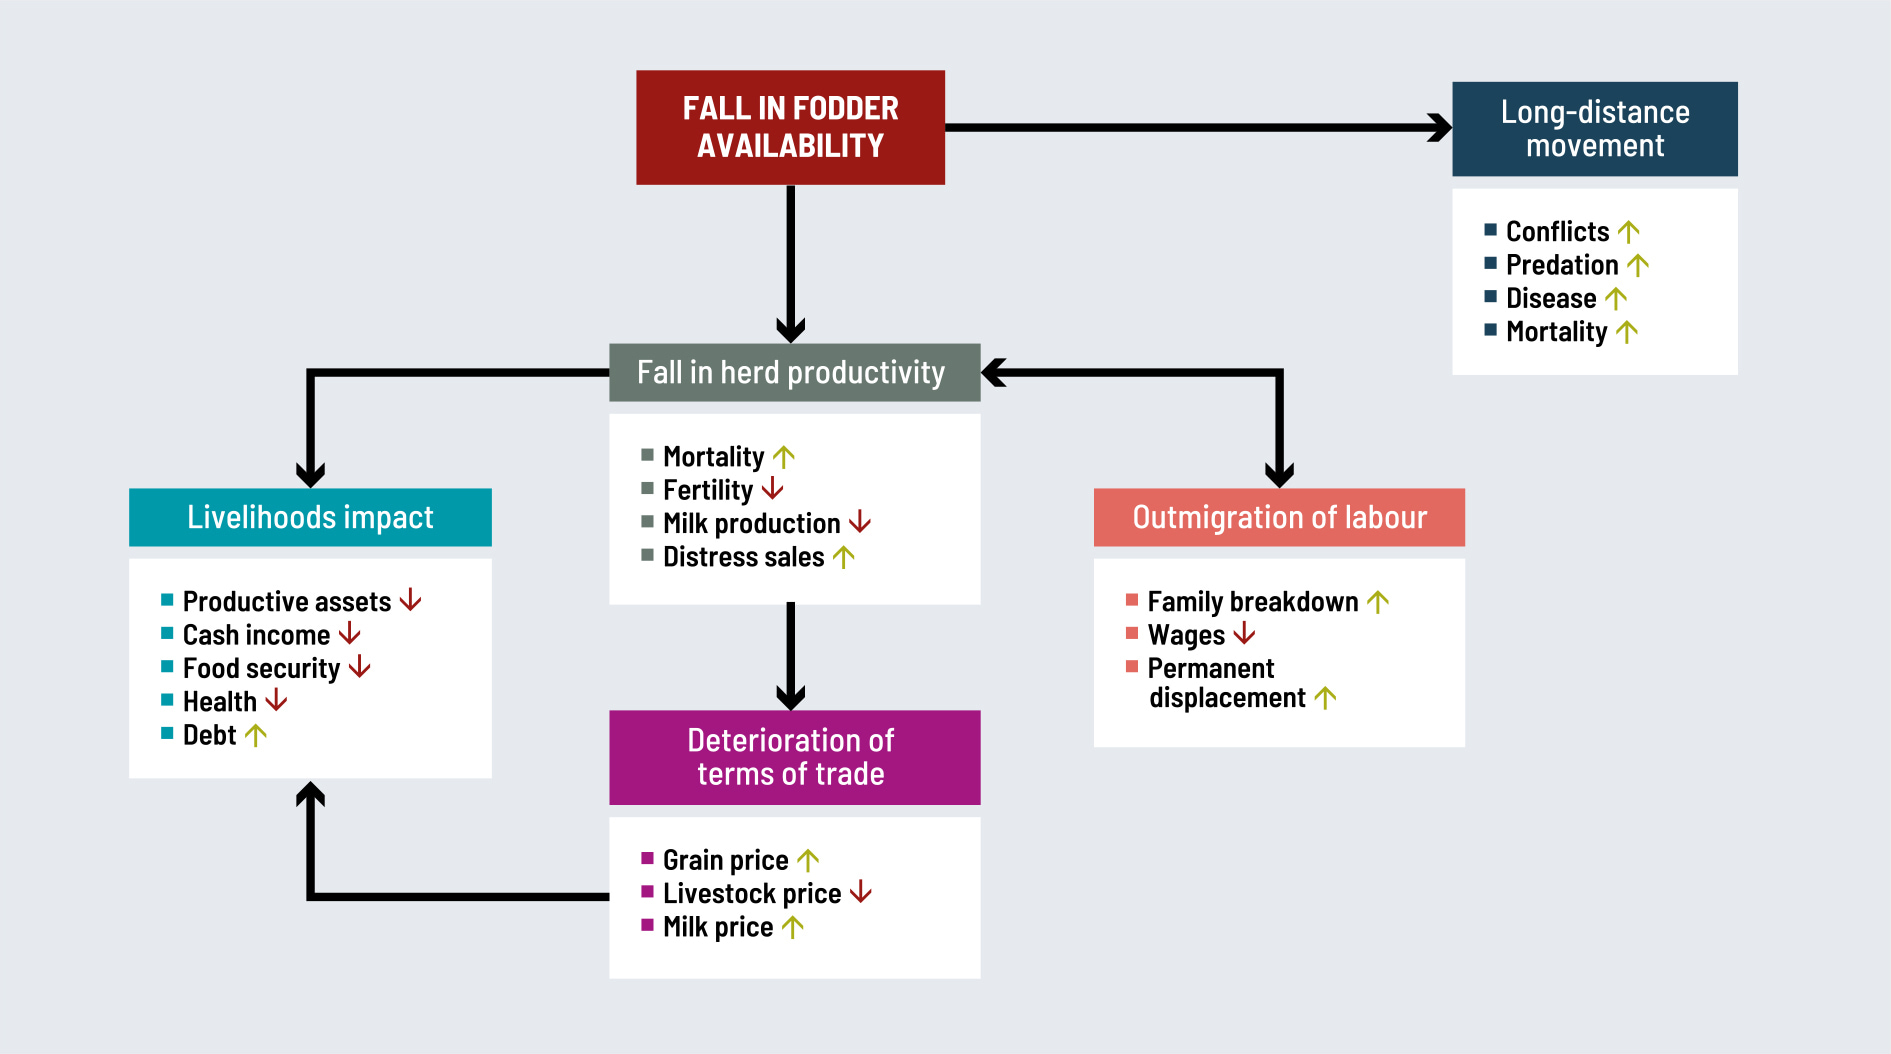
Ethiopia, Kenya and Somalia are currently grappling with severe water shortages and degraded rangelands due to below-average rainfall and high temperatures, affecting nearly 23 million people. Compounded by food inflation and other economic shocks, this situation echoes past droughts in 2011, 2016/17, and 2020/21. In Somalia, a national disaster was declared in 2017 after three consecutive seasons of insufficient rainfall. With limited precipitation, pastoralism serves as the primary land use, contributing 60 percent to GDP in 2013–2016.58 Livestock plays a vital role, providing milk, meat, employment and livelihoods, and constituting 80 percent of export earnings. Somalia heavily relies on food aid and imports as local grain production covers only 22 percent of cereal needs on average, even in favourable years. During droughts, herders are compelled to sell livestock to afford food and care for the remaining animals, leading to a surge in livestock sales, causing price depression. To cope, some pastoralists send family members elsewhere to reduce reliance on the family herd, while others migrate to towns for income (FIGURE 18). The impact of drought varies based on wealth and resource access, often exacerbating wealth disparities, with larger herd owners more likely to maintain breeding herds, while smaller ones may struggle to survive.
FIGURE 18 DROUGHT IMPACT ON LIVESTOCK KEEPERS
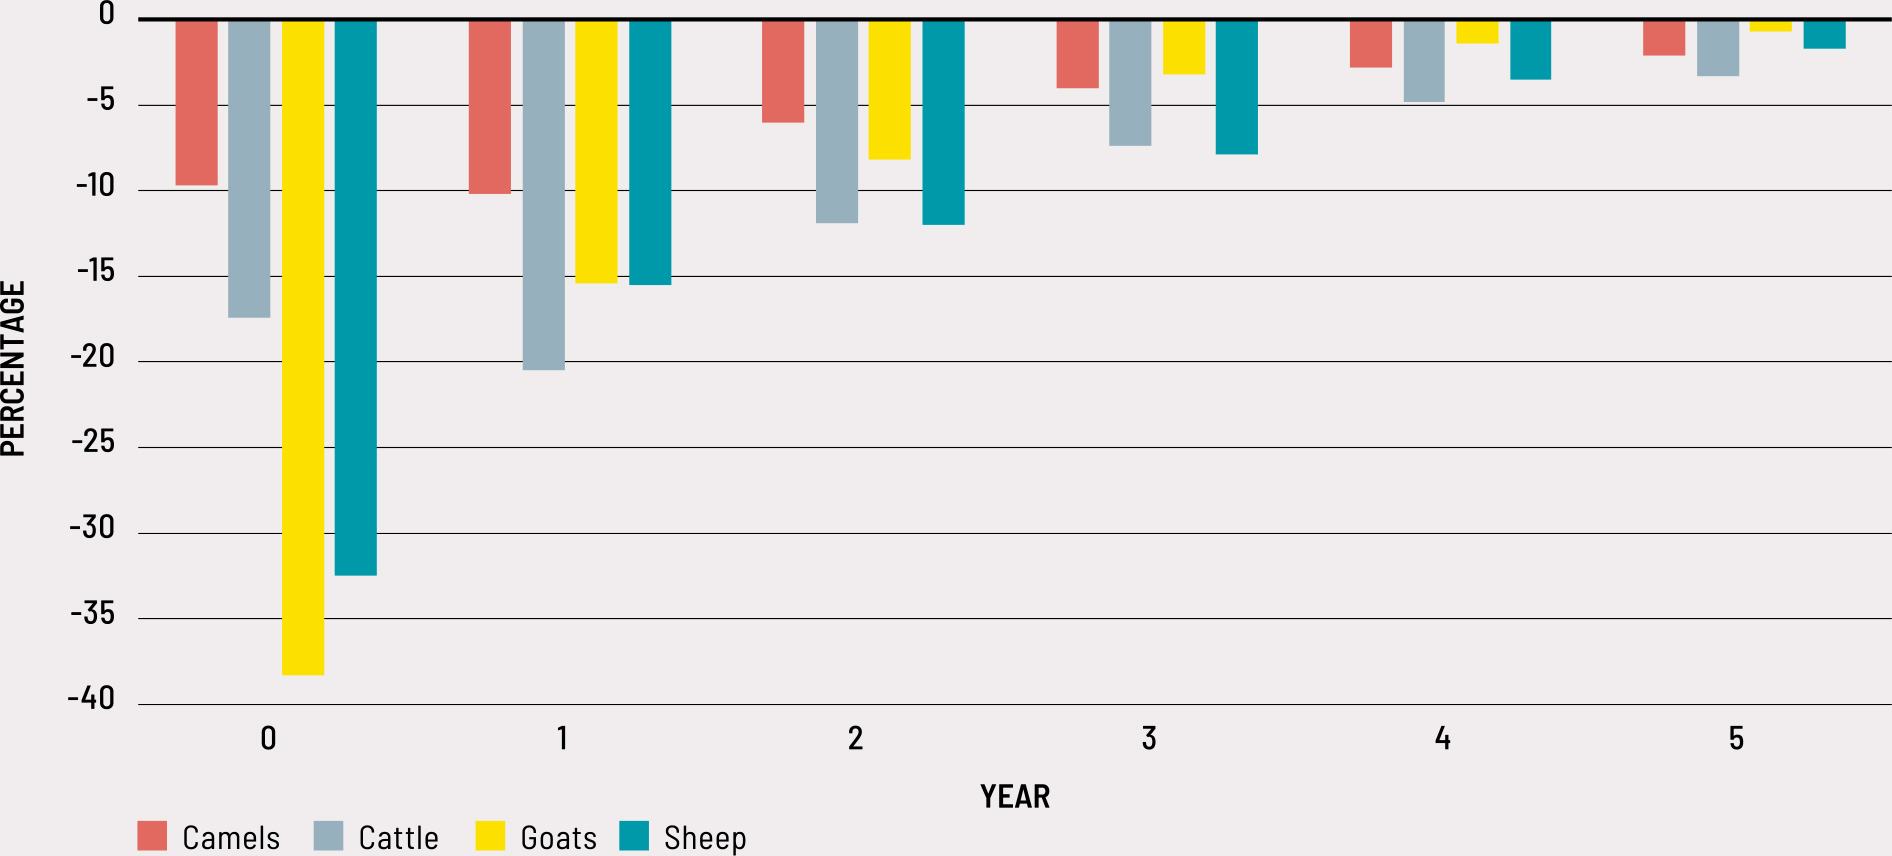
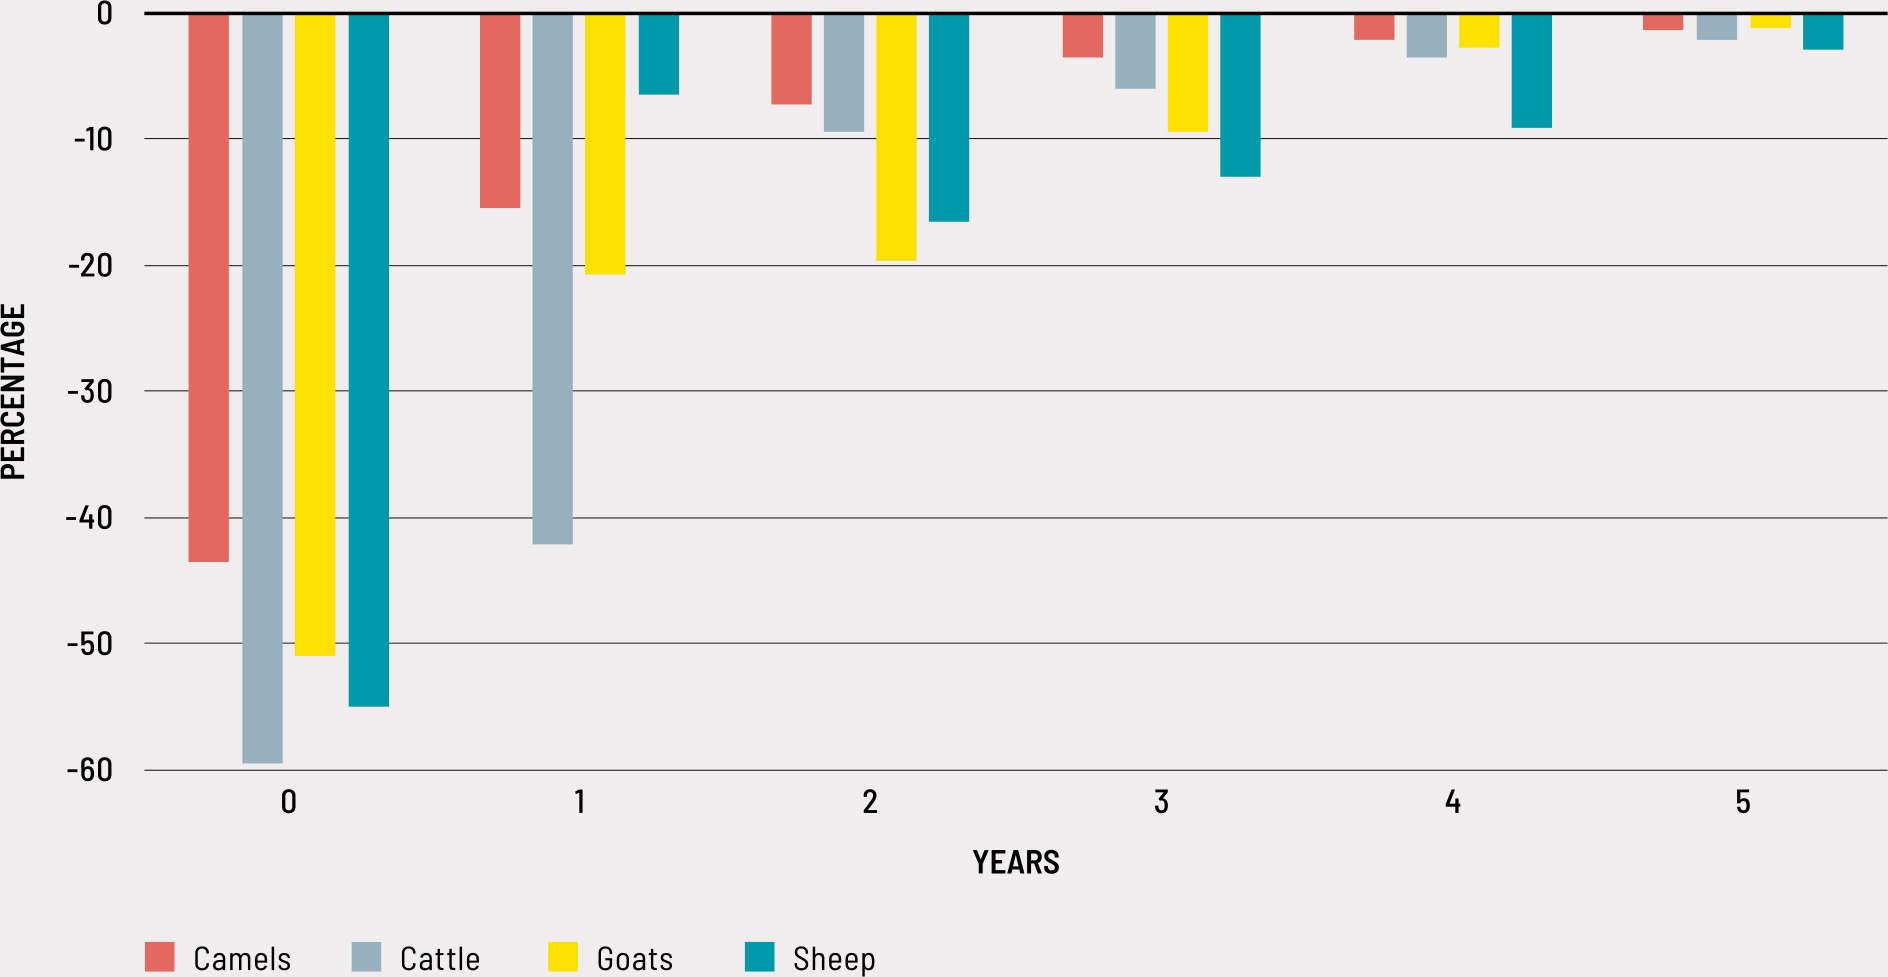
In comparison to the baseline scenario without drought, the impact of drought led to a substantial reduction in livestock numbers (FIGURE 19). The pre-drought count of 52.9 million animals decreased to 36.1 million by the end of the drought year, representing a 32 percent drop. This decline affected all livestock categories, with sheep and goats experiencing over a 30 percent decrease and camels and cattle seeing reductions of under 20 percent. The decline resulted from both increased drought-induced mortality and reduced reproductive performance, particularly in small ruminants. Although 4 million animals died in the drought year, the deficit of 14.8 million births, primarily in goats (10.5 million) and sheep (4 million), was more significant. In contrast, excess mortality was the main factor behind the decline in camel and cattle numbers during the drought year, with reduced fertility rates mainly evident in the post-drought year. The combined effect of excess deaths and birth deficits (18.8 million animals) was exacerbated by an estimated reduction in animal offtake of about 2 million heads. None of the four species fully recovered to pre-drought numbers within the modelled timeframe, with cattle numbers remaining 0.1 million heads (3 percent) below the baseline.
FIGURE 19 RELATIVE DIFFERENCE IN LIVESTOCK POPULATION COMPARED TO PRE-DROUGHT YEAR
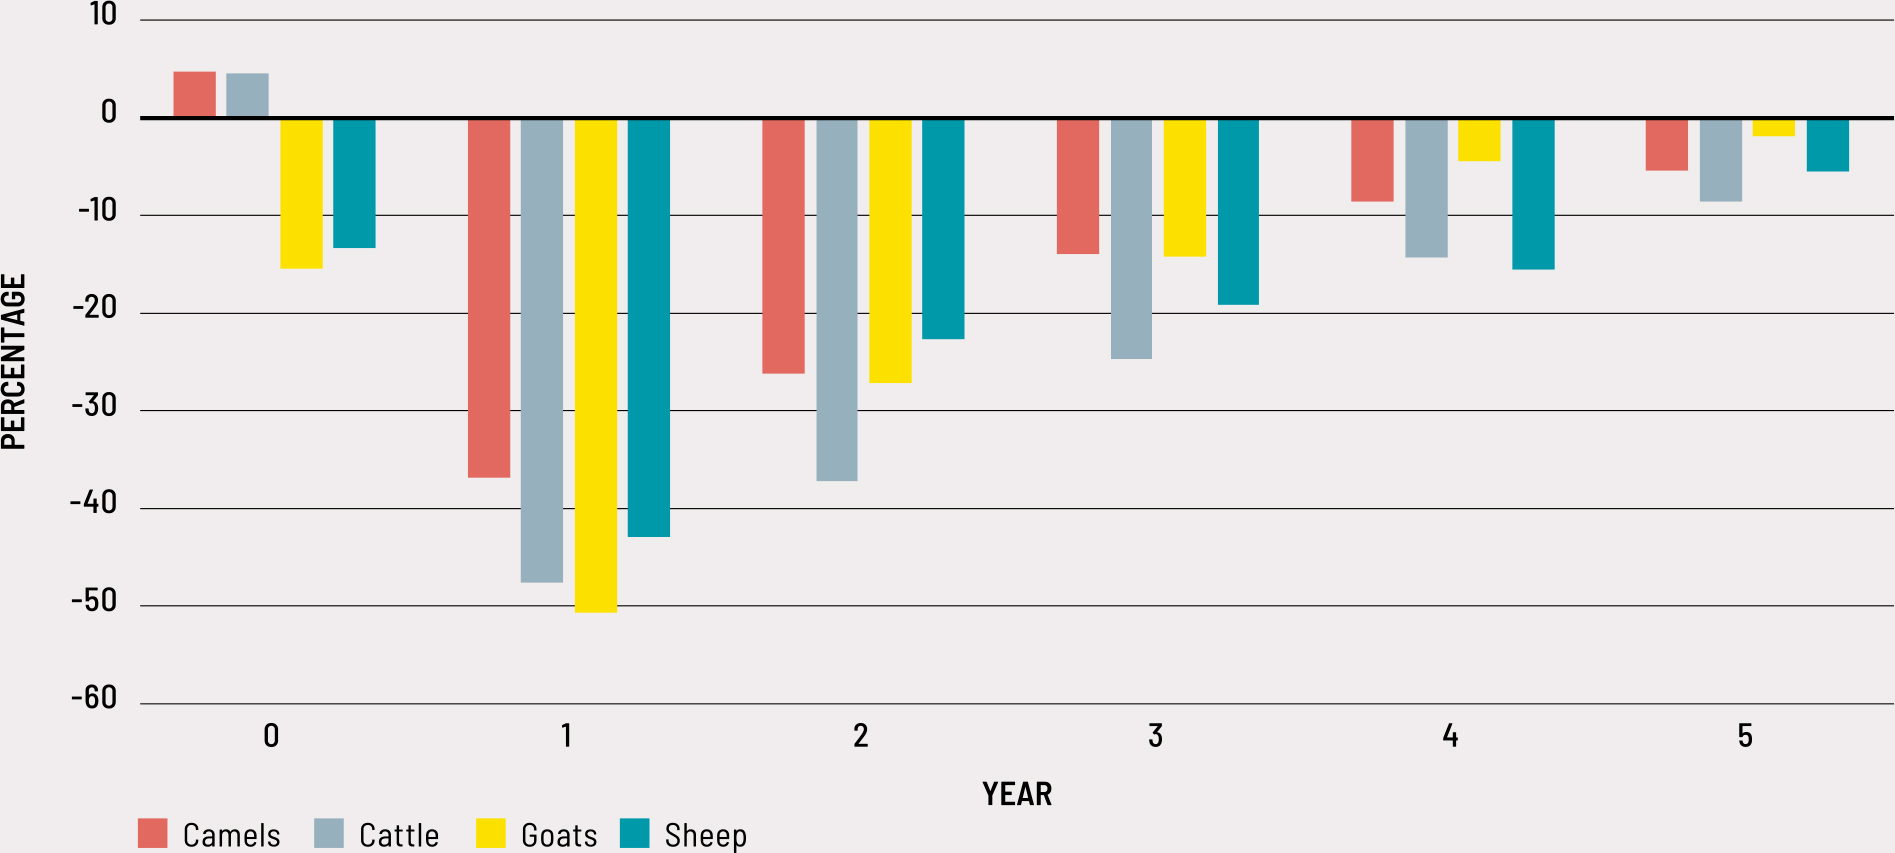
In the post-drought year, live animal offtake dropped significantly to 8.2 million heads from 15.7 million heads in the pre-drought year (FIGURE 20). This sharp decline is mainly due to the previous year’s birth deficit among small ruminants. Camels and cattle also saw notable reductions in offtake, primarily driven by increased mortality during the drought year. Efforts to rebuild herds further contributed to the decreased offtake. As livestock populations have not fully recovered to pre-drought levels even after five years, animal offtake is expected to remain slightly below pre-drought levels.
FIGURE 20 RELATIVE DIFFERENCE IN LIVESTOCK OFFTAKE COMPARED TO PRE-DROUGHT YEAR
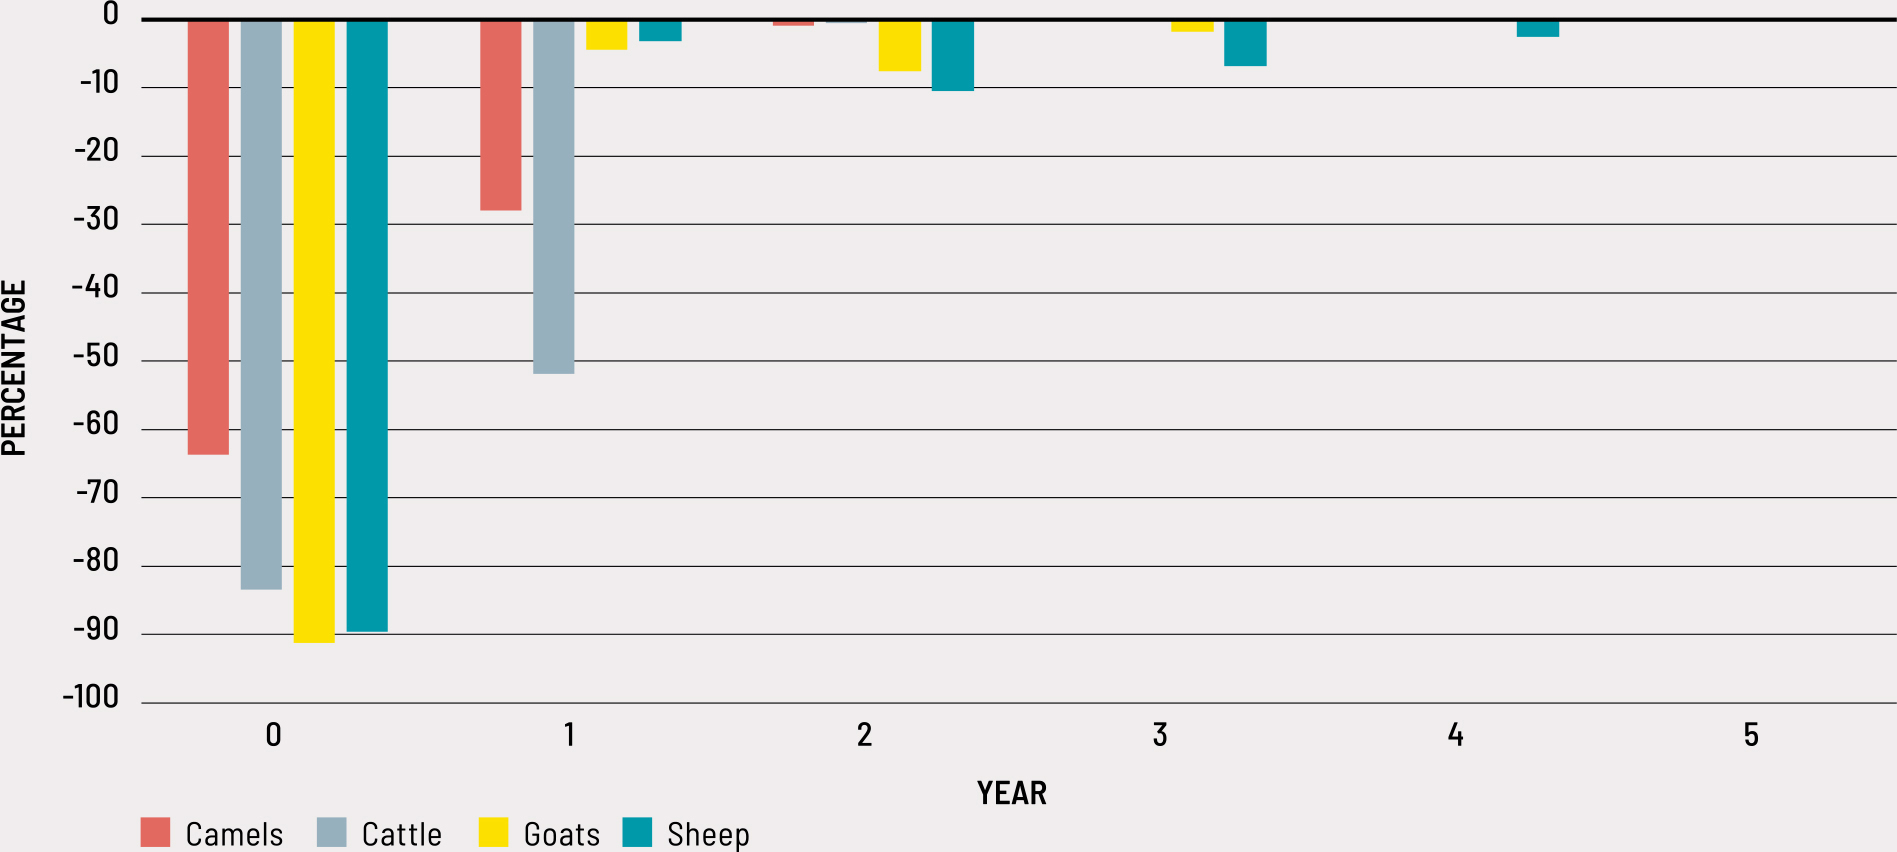
During the drought year, milk offtake plunges by roughly 1.75 million tonnes, a 75 percent decrease compared to the 2.4 million tonnes in the pre-drought year (FIGURE 21). In the post-drought year, milk offtake remains at around 1.7 million tonnes, 30 percent below pre-drought levels. Small ruminants’ milk production bounces back due to improved feed availability, while cattle and camels continue to have milk deficits due to reduced calving rates. Despite drought-tolerant camels forming a significant part of Somalia’s milking herd, milk losses make up nearly 90 percent of lost income in the drought year. In the post-drought year, most losses stem from reduced live animal offtake, driven by the sharp decline in small ruminants’ birth rate during the drought year and the need to rebuild herds. Rebuilding takes time, and even five years after a drought, livestock numbers remain nearly 5 percent below the baseline.
FIGURE 21 RELATIVE DIFFERENCE IN MILK OFFTAKE COMPARED TO PRE-DROUGHT YEAR
In FIGURE 22, rural market prices and terms of trade for local-quality grain, goat and camel milk are depicted in the pre-drought, drought and post-drought years, illustrating drought-induced price fluctuations. According to the Food Security and Nutrition Analysis Unit (FSNAU), live cattle prices did not significantly decrease in the drought year, while prices for camels, goats and sheep dropped by 10 to 15 percent. Conversely, milk prices saw a 20 to 25 percent increase in the drought year. Small ruminant prices rebounded in the post-drought year, rising over 10 percent above the baseline, while camel and cattle prices remained stable. The rise in small ruminant prices after a drought is due to their demand as “seed” animals for herd repopulation and their affordability for average consumers. Despite milk production more than doubling in the post-drought year, milk prices still experienced a slight increase.
FIGURE 22 AVERAGE LOCAL MARKET PRICES (USD) FOR LOCAL QUALITY GOAT AND CAMEL MILK (TOP ROW) AND TERMS OF TRADE IN THE PRE-DROUGHT, DROUGHT AND POST-DROUGHT YEARS (BOTTOM ROW)
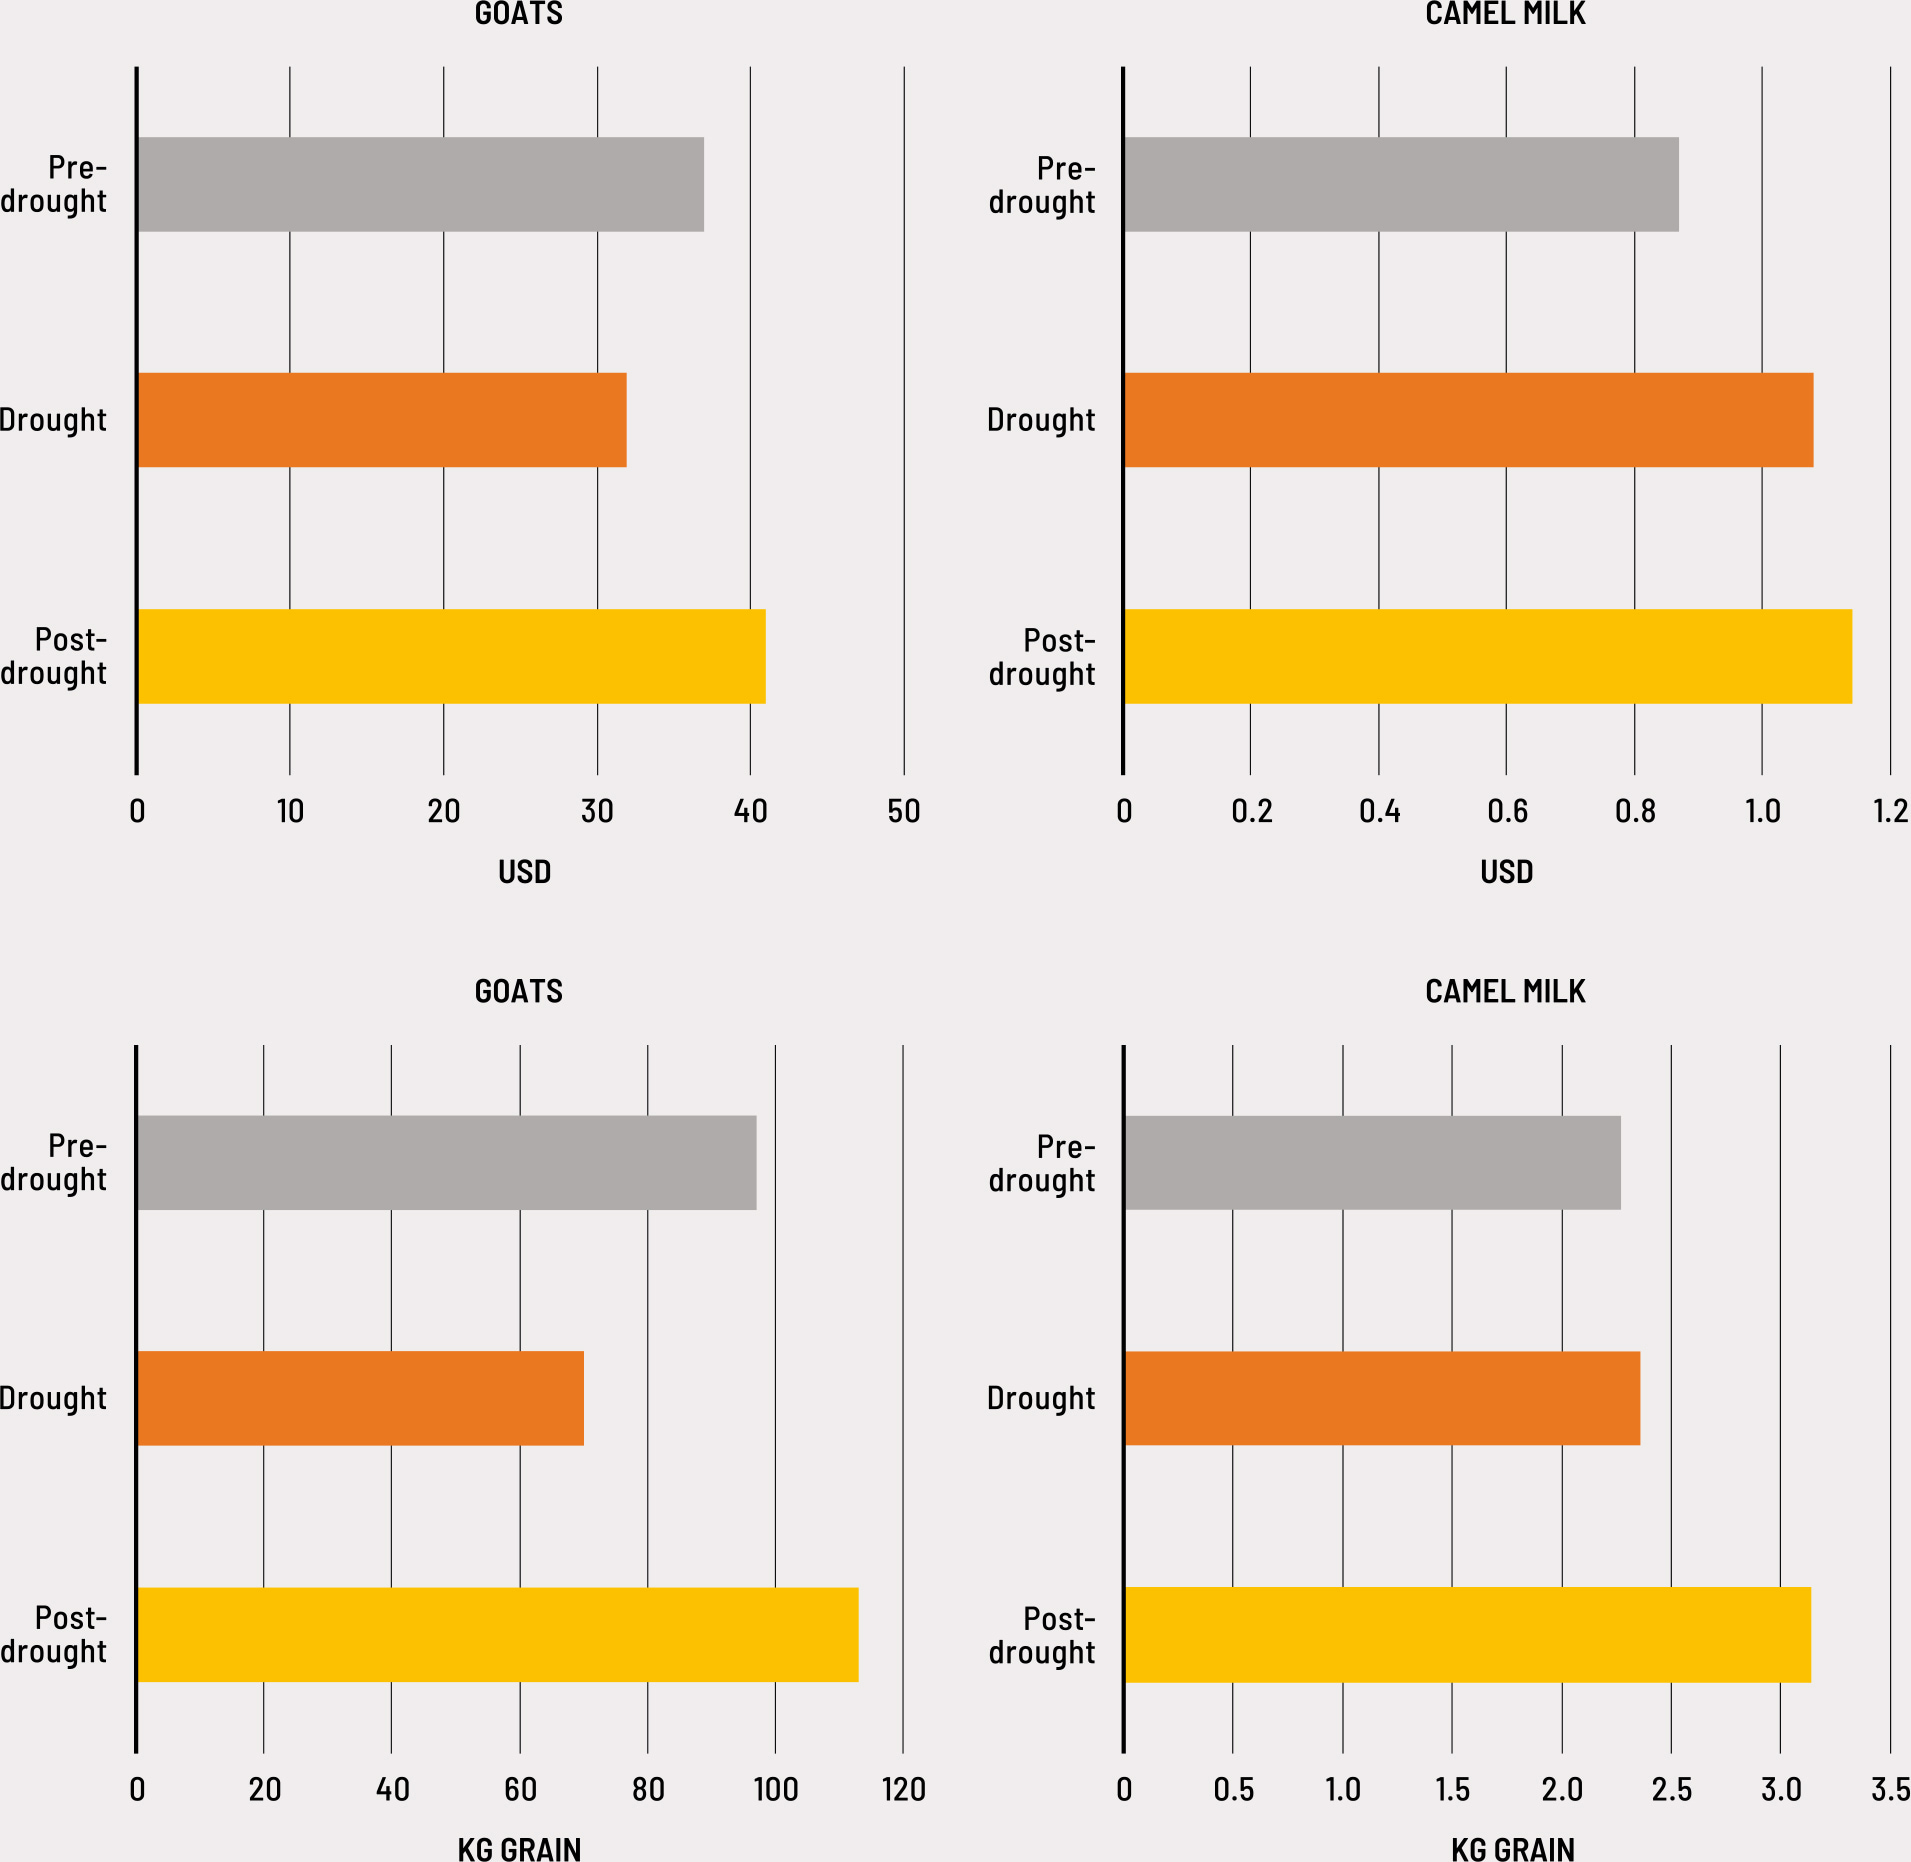
Fluctuations in the terms of trade of livestock compared to grain were more pronounced than the changes in livestock prices — the amount of grain exchanged for livestock decreased by 20 to 40 percent or more in the drought year and increased by 15 to 20 percent for goats and sheep in the post-drought year.
In the case of milk, the drought-year price increase was similar to the average price increase in grain, leaving the milk–grain terms of trade relatively unaffected. However, milk prices continued to rise while grain prices declined in the post-drought year. This caused the milk–grain terms of trade to shift heavily in favour of pastoralists capable of supplying milk to the market. This reflects a typical drought/post-drought scenario and its impact on income distribution.
Using prevailing rural market prices, the value of animal and milk offtake dropped from USD 3 billion in the year preceding the drought to USD 1.5 billion in the drought year. Revenue from cattle was the most affected, dropping by around 70 percent due to the high loss in milk revenue (FIGURE 23). This was followed by small ruminant revenue falling by around 50 percent and camel revenue falling by around 40 percent. Revenue from cattle was still more than 40 percent below the pre-drought level in the year following the drought, while the revenue losses of other species were only 20 percent or lower compared to pre-drought; they were assisted by price increases of small ruminants and milk in the post-drought year. It was only in post-drought year 4 that the estimated revenue losses fell below 10 percent for all species. The deterioration of the livestock–grain terms of trade in the drought year augments revenue losses by an additional 10 percent when expressed in kilogram–grain equivalent.
FIGURE 23 RELATIVE DIFFERENCE IN THE ESTIMATED VALUE OF ANIMAL AND MILK OFFTAKE COMPARED TO PRE-DROUGHT YEAR
In summary, it is estimated that around 4 million excess animal deaths, mainly those of small ruminants, occurred in the drought year, inflicting damage of approximately USD 290 million. Estimated losses incurred in the drought year amounted to nearly USD 1 300 million from foregone milk production and USD 160 million from reduced quantity and value of animal offtake. In the post-drought year, the value of milk losses dropped to USD 150 million while the losses from reduced animal offtake rose to USD 460 million, mainly due to the reduced kid and lamb crop in the drought year. Further losses of USD 640 million accrued in post-drought years 2 to 5 as livestock populations remained below pre-drought levels and animal offtake did not reach pre-drought values.
BOX 6 Crop losses on the ground: the case of the fall armyworm infestation
Transboundary pest infestations are slow-onset disasters that generate increasingly significant agricultural losses in many parts of the world. This challenge may likely worsen in the coming years, as trade and tourism expand and environmental stressors like climate change and biodiversity loss become more severe.59
The fall armyworm (FAW) (Spodoptera frugiperda, J.E. Smith), is native to tropical and subtropical America and has been a major crop pest in the region for many decades. Its first appearance outside the Americas occurred in January 2016, when a severe outbreak was reported in western Africa.60 FAW’s presence has now been confirmed in most of sub-Saharan Africa. It is invasive, highly mobile and destructive, and causes severe losses to agriculture globally, with countries now having to deal with it as a major threat to their agricultural development efforts. The first report of FAW in Asia was confirmed in Karnataka, India in 2018. More recently, FAW was reported in Australia, the Canary Islands and New Caledonia (FIGURE 24).61
FIGURE 24 GLOBAL MAP OF FAW INVASION
![Source: Authors’ own elaboration based on FAO data and UN Geospatial. 2020. Map geodata [shapefiles]. New York, USA, UN.](../img/CC7900EN_fig24.jpg)
The rapid spread of FAW, especially in Africa, has been driven by several factors, including its ability to utilize various perennial host plants, which, together with warm and conducive climatic conditions, favour its multiplication. Although FAW can feed on various crops and eats more than 350 plant species,62 it prefers maize (Zea mays L.), Africa’s major cereal crop and Asia’s second most important one.
FAW causes losses through reduced harvestable yields and the increased production cost from additional pest control investments. Estimates indicate that Brazil spent USD 600 million to control FAW in 2009. In Africa, maize yield losses in Ghana and Zambia were estimated at USD 284 million and USD 198 million, respectively, with an extrapolated loss estimate of USD 2.5 billion to 6.3 billion across 12 African countries in 2017.63 As FAW spread, losses for maize, rice, sorghum and sugarcane were estimated to be USD 13 billion per annum across sub-Saharan Africa.64
Measuring FAW infestation and crop damage
Attributing crop loss and damage to FAW is challenging, due to the diversity of crop species, varieties, growth cycles, pest life stages and other confounding factors like weather, soil health and the ecological forces affecting FAW. A review of published literature, institutional reports and other data sources reveals an increasing number of assessments on FAW’s impact in Africa and Asia, with diverse measurements of their effects on maize. These are primarily plot-level assessments, with synthetic reviews or models only starting to be conducted.
An analysis of data in the literature indicates that direct FAW-induced yield loss in maize ranges from 0.4 to 94.8 percent. Regarding country-to-country variations, the average yield loss in the analysis ranged between 15.7 percent in Ecuador and 45.7 percent in India. Notably, these losses do not include quality reductions and are based on field (plot)-level measurements at various scales and with variable numbers of observations in the different countries. Different methods produce different yield loss estimates. For example, in Zimbabwe, maize yield loss in 2017 was estimated at 58 percent through farmer perceptions65 and 12 percent from a rigorous analysis of field data in 2018.66 This implies that farmers’ perceptions might overestimate yield losses.67 However, a pairwise comparison of such estimates in the same space and time is not available. Additionally, it is challenging to estimate national FAW-induced yield loss estimates from plot-level data due to high variability at various scales, making extrapolation difficult. There is a clear need to develop and apply standardized methodologies, incorporate more variables, target sampling across scales and create appropriate crop models to support effective interventions against FAW.
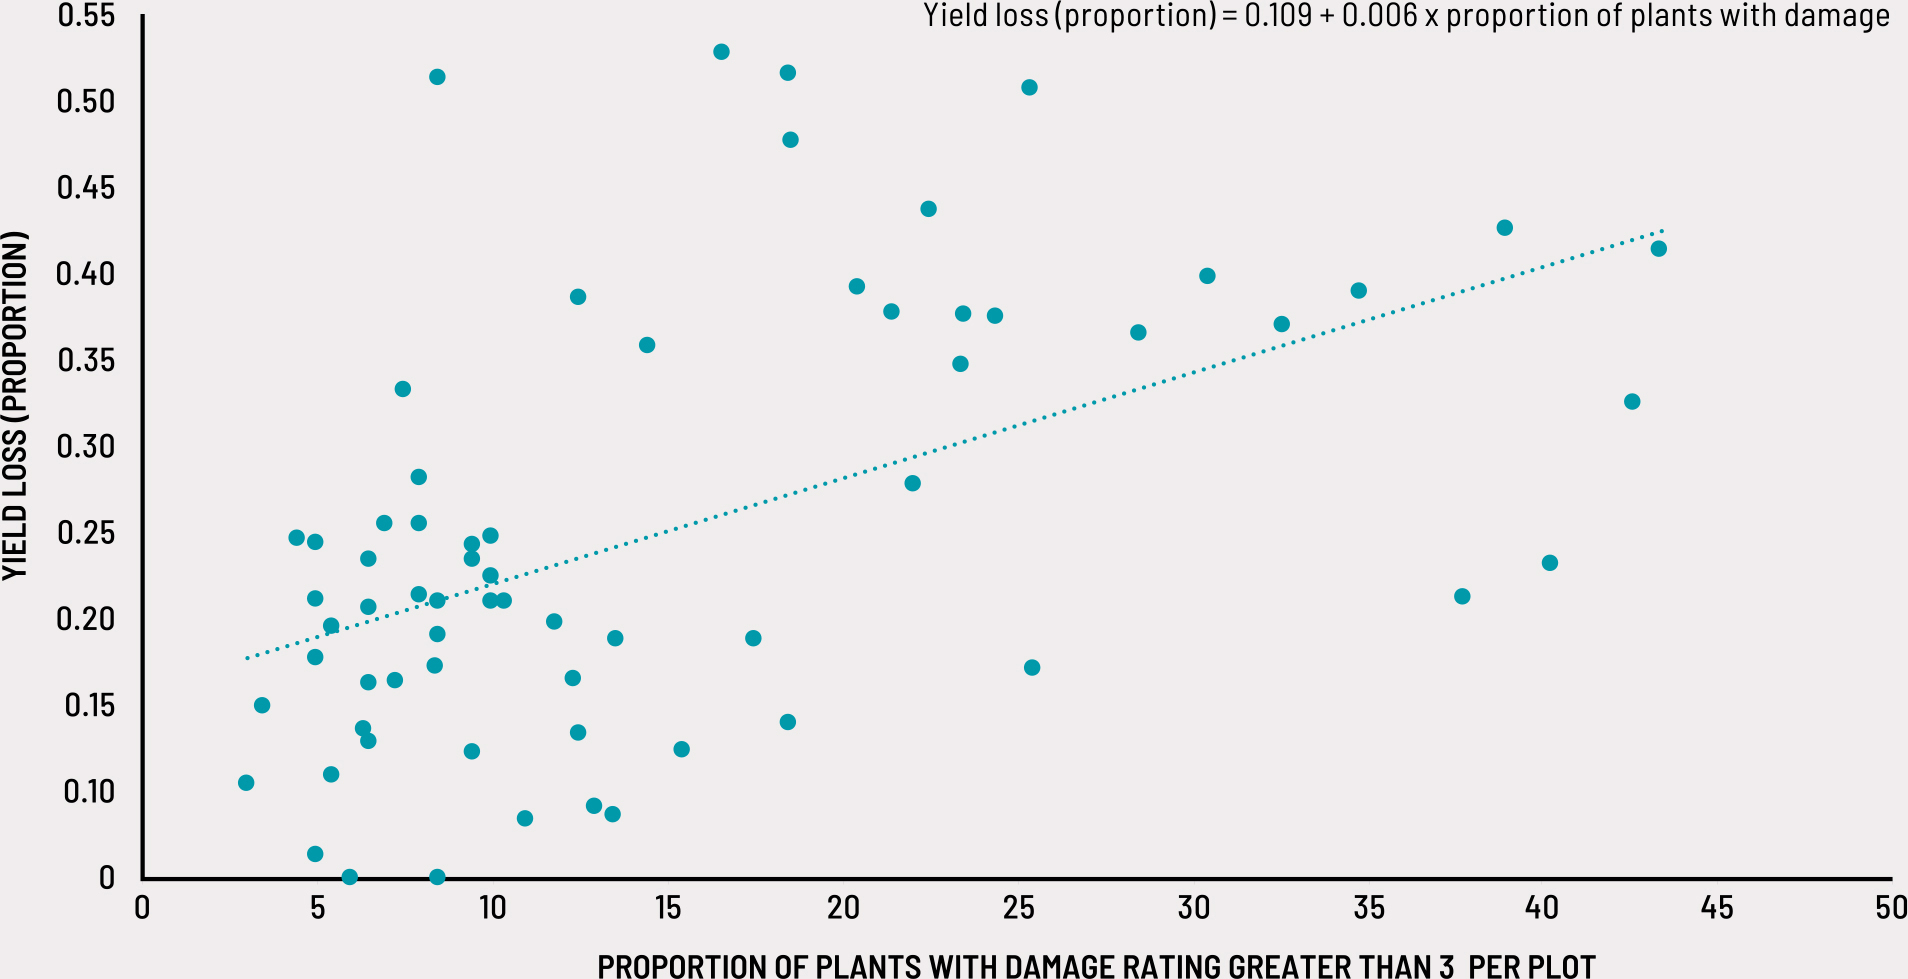
Measured through a damage rating scale, results show that maize grain yield loss tends to increase with the rise in the severity of plant damage, with one unit increase in damage rating score being associated with approximately 10 percent increase in yield loss (FIGURE 25). A much stronger and statistically significant relationship is observed in studies that reported damage as the proportion of plants with a damage rating greater than three (FIGURE 26).68 This implies that a significant impact on yields is likely to materialize once plant damage reaches a certain level. Additionally, yield loss seemed to be influenced by pest infestation level, measured as the number of FAW larvae per plant. Although based on plot-level data, these results imply that regardless of scale, measurements of the impact of FAW on yield losses should incorporate crop damage measures and, where possible, pest population levels.
FIGURE 25 LINE OF BEST FIT WHEN TOTAL YIELD LOSS (PROPORTION) IS REGRESSED ON PLANT DAMAGE RATING
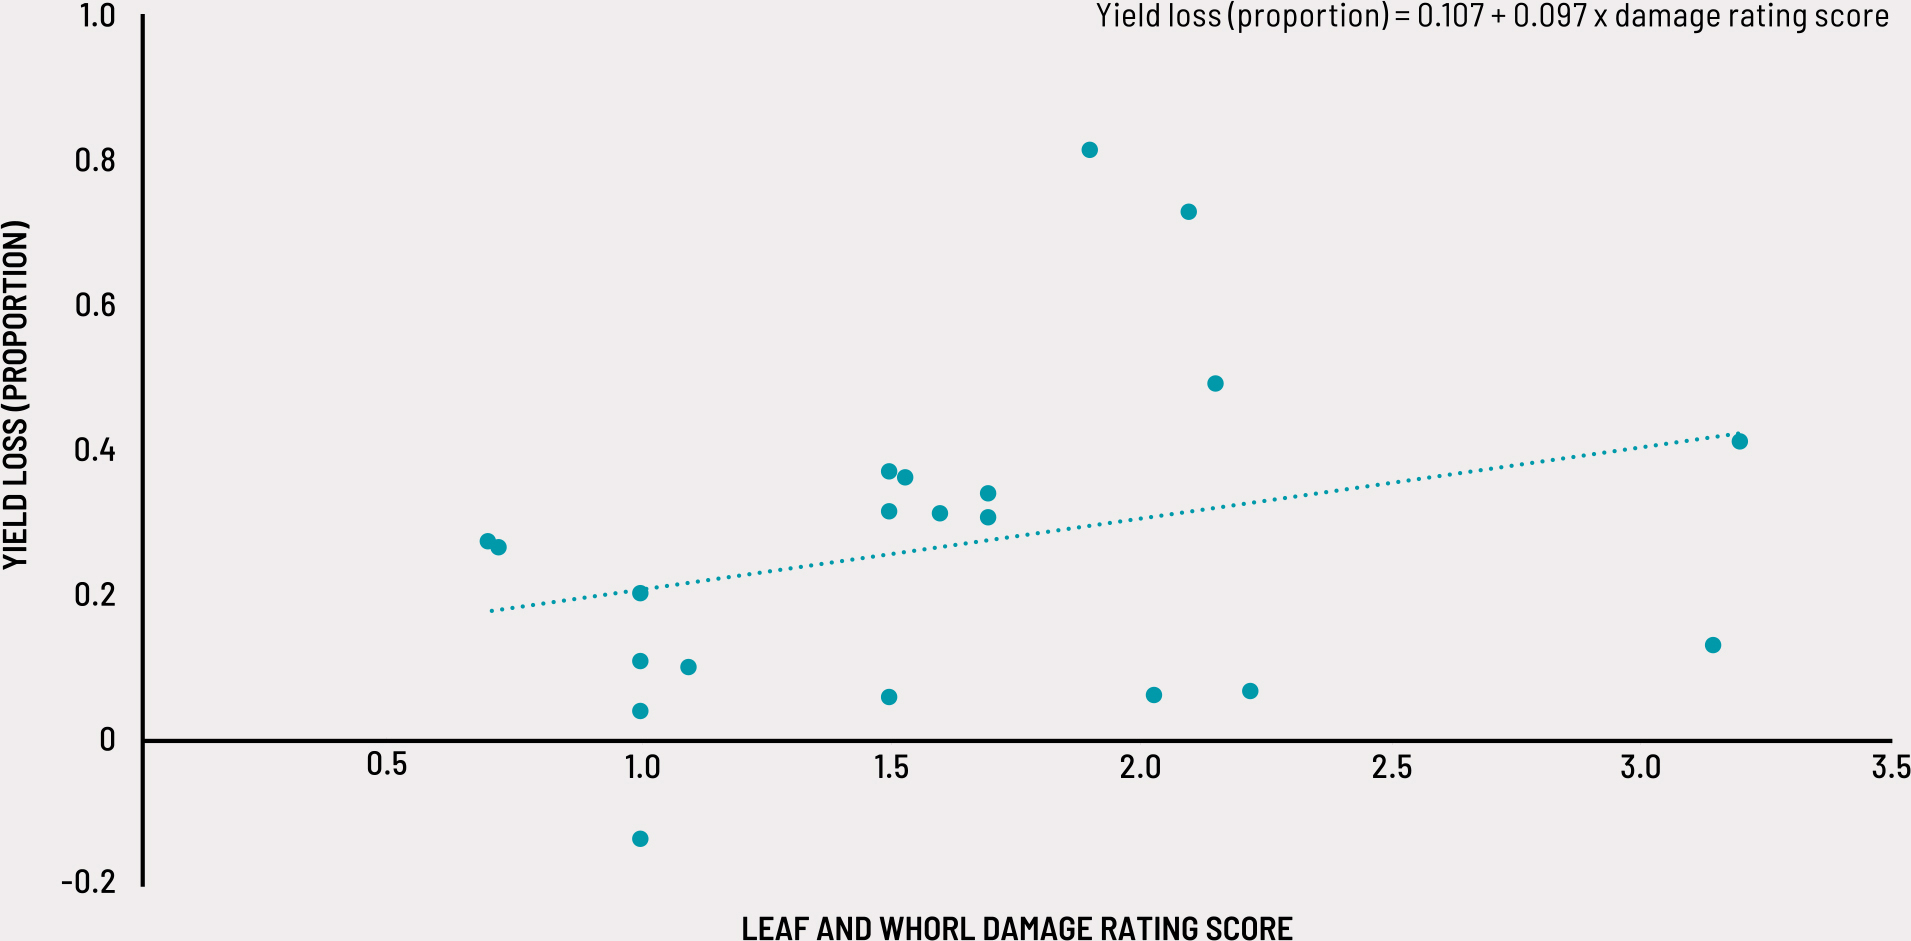
FIGURE 26 LINE OF BEST FIT FOR MAIZE WHEN YIELD LOSS (PROPORTION) IS REGRESSED FOR PLANTS WITH A DAMAGE RATING GREATER THAN THREE
Modelling fall armyworm impacts to estimate the potential for direct economic yield loss
To correctly estimate the economic loss potential from the FAW invasion, it is essential to consider all main crops that can be attacked by FAW, and include both quality and quantity losses, along with lost trade opportunities.63,69
Below is a proposed accounting framework to estimate FAW’s direct economic loss potential in the field without management.67
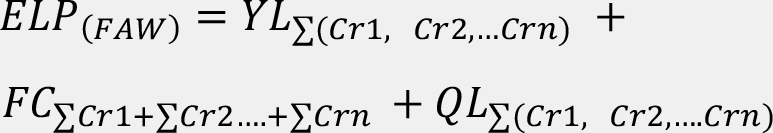
ELP = economic loss potential from FAW invasion
YL = monetary value of yield loss attributed to FAW for crops (Cr) 1, 2…n
FC = the cost of FAW control in crops (Cr) 1, 2…n, accounting for the costs of the various control options applied to each crop
QL = quality loss attributed to FAW for crops (Cr) 1, 2…n, accounting for the economic value of the crop, the quality of which is either reduced or lost to FAW
The model computes losses to FAW invasions by estimating the monetary value of yield losses in different crops, the cost of enacting control measures, and the value corresponding to a decline in crop quality.
In fact, FAW invasions have continued to negatively affect productivity, especially in smallholder farming systems, thereby worsening the vulnerability of millions of African and Asian smallholder farmers. FAW has an indirect negative impact on human health, although this has not been measured in any systematic way. Other invasion impacts include an increased use of synthetic pesticide, increased pest management costs, reduced crop yields and farm-level income, and aggravated environmental and welfare impacts.
Climate projections suggest that FAW may progressively and severely impact agriculture over the next several decades.70,71 This highlights the need to put in place effective and well-coordinated management systems, including surveillance, monitoring and response systems. The use of synthetic insecticide remains the most mentioned and practised approach for FAW control in Africa and Asia.72,73 The dangers posed by synthetic pesticides suggest a need for control strategies that effectively suppress the pest without compromising human health, the resilience of agrifood production systems and the natural environment. Some of these include nature-based solutions within the Integrated Pest Management framework, such as biological control of FAW.
2.3.2 NUTRIENT LOSSES IN THE FOOD SUPPLY DUE TO DISASTERS
Disasters and crises have well-known effects on food security, with critical implications for nutrition. They also impact nutrition through other pathways, specifically, the loss of food and the nutrients it contains, which could otherwise have contributed to healthy diets. Global losses in crops and livestock are converted to corresponding energy and nine micronutrient values lost for human consumption. Expressing losses as a percentage of requirements helps to gauge the extent to which food supply shortfalls resulting from disasters and crises may affect the ability to meet the population’s nutritional needs.
It is important, in this connection, to emphasize that the focus here is on availability, and not on changes in consumption patterns due to disasters. Assessing lost consumption would require comprehensive and specific data that are currently limited. It is crucial to acknowledge that the availability of energy and nutrients in the food supply does not necessarily translate into an amount that individuals are taking in.
To provide a measure of the quantity of energy and nutrients lost, food composition data74 were used to translate estimated losses in agricultural production into nutrient losses for nine vitamins and minerals (calcium, iron, zinc, vitamin A, thiamine, riboflavin, vitamin C, magnesium and phosphorus), as well as energy. Population estimates were then used to convert these values into the average amount of nutrients lost per person per day. These values are expressed as a percentage of adult requirements, using the daily estimated average requirement (EAR)p for each nutrient.q,75,76,77,78
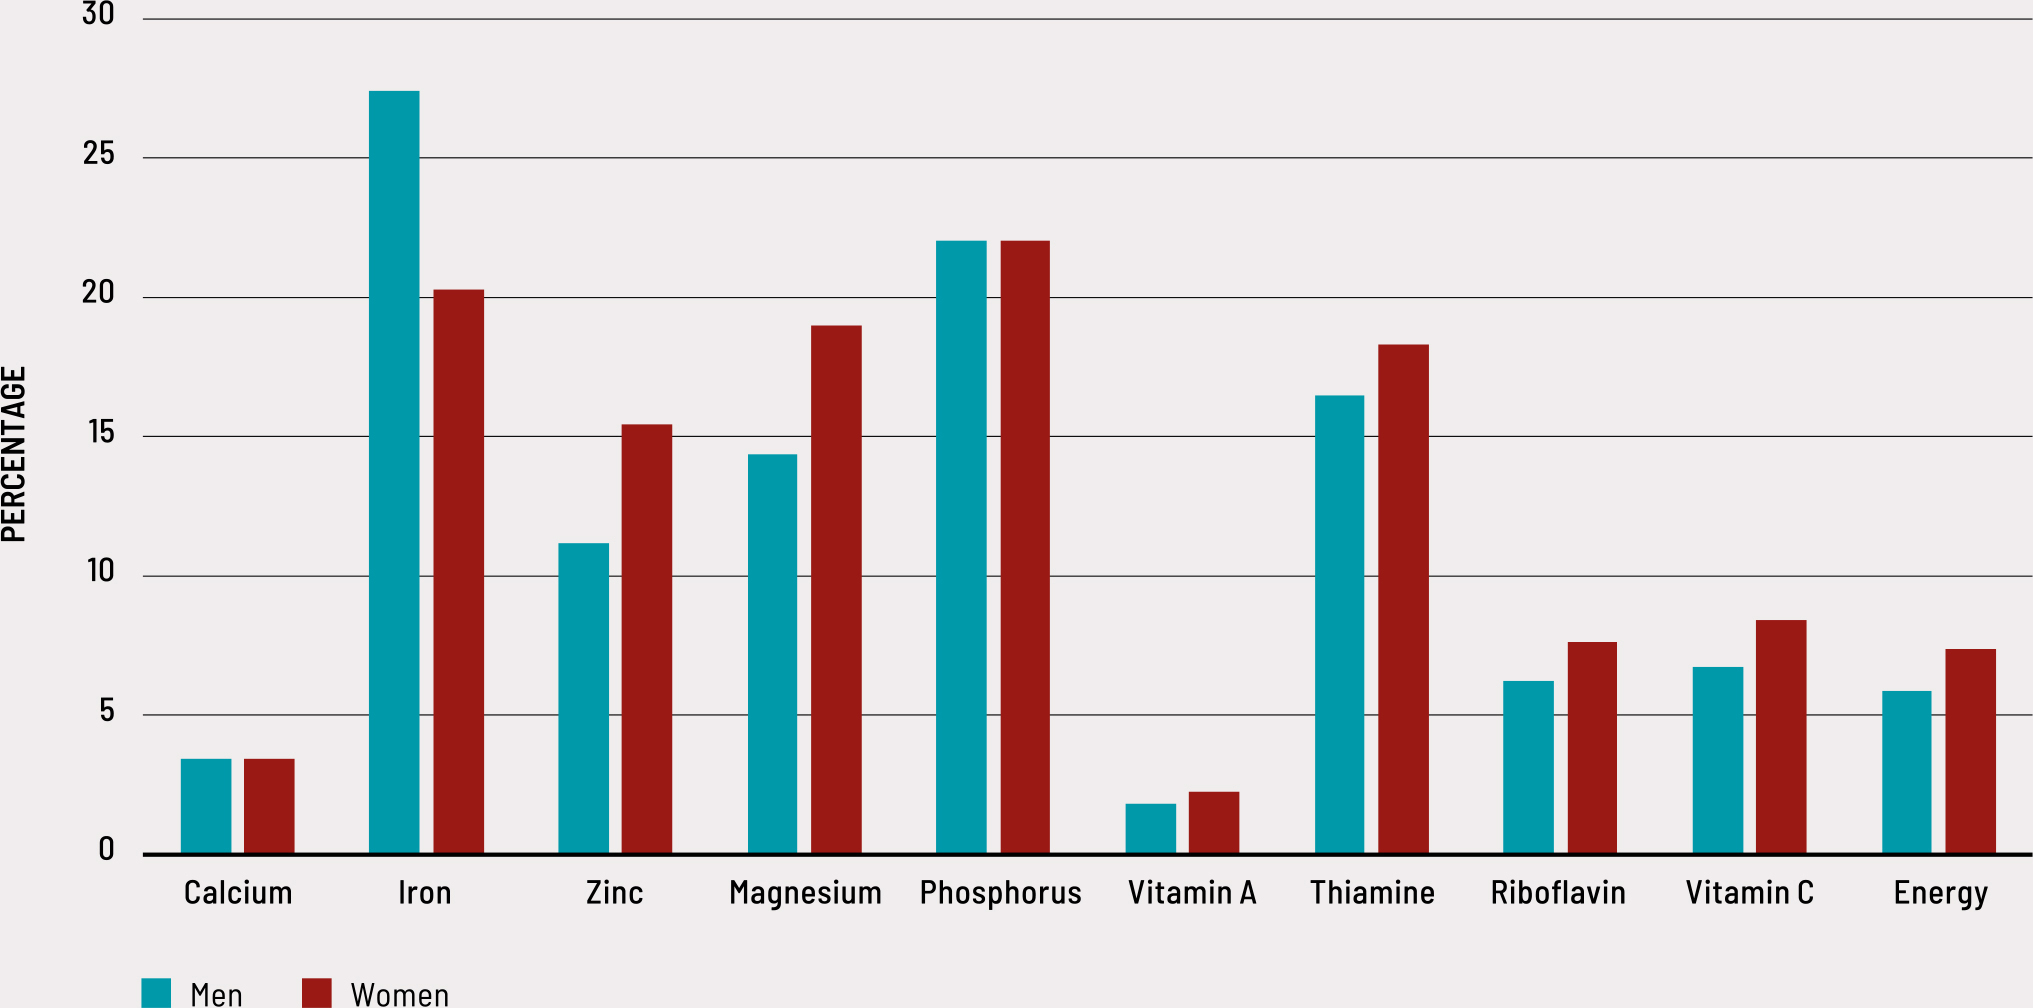
FIGURE 27 illustrates that on a global scale, estimated losses from disasters in the crops and livestock subsectors have averaged approximately 147 kcal per person per day over the past 31 years. This figure corresponds to about 6 to 7 percent of the average energy requirement for men and women, respectively (FIGURE 28). This reduced availability of energy corresponds to the requirements of approximately 455 million people (around 400 million men or 500 million women) each year over the last three decades.
FIGURE 27 TOTAL ESTIMATED DAILY LOSSES OF ENERGY AND NUTRIENTS PER PERSON PER DAY BY FOOD (1991-2021)
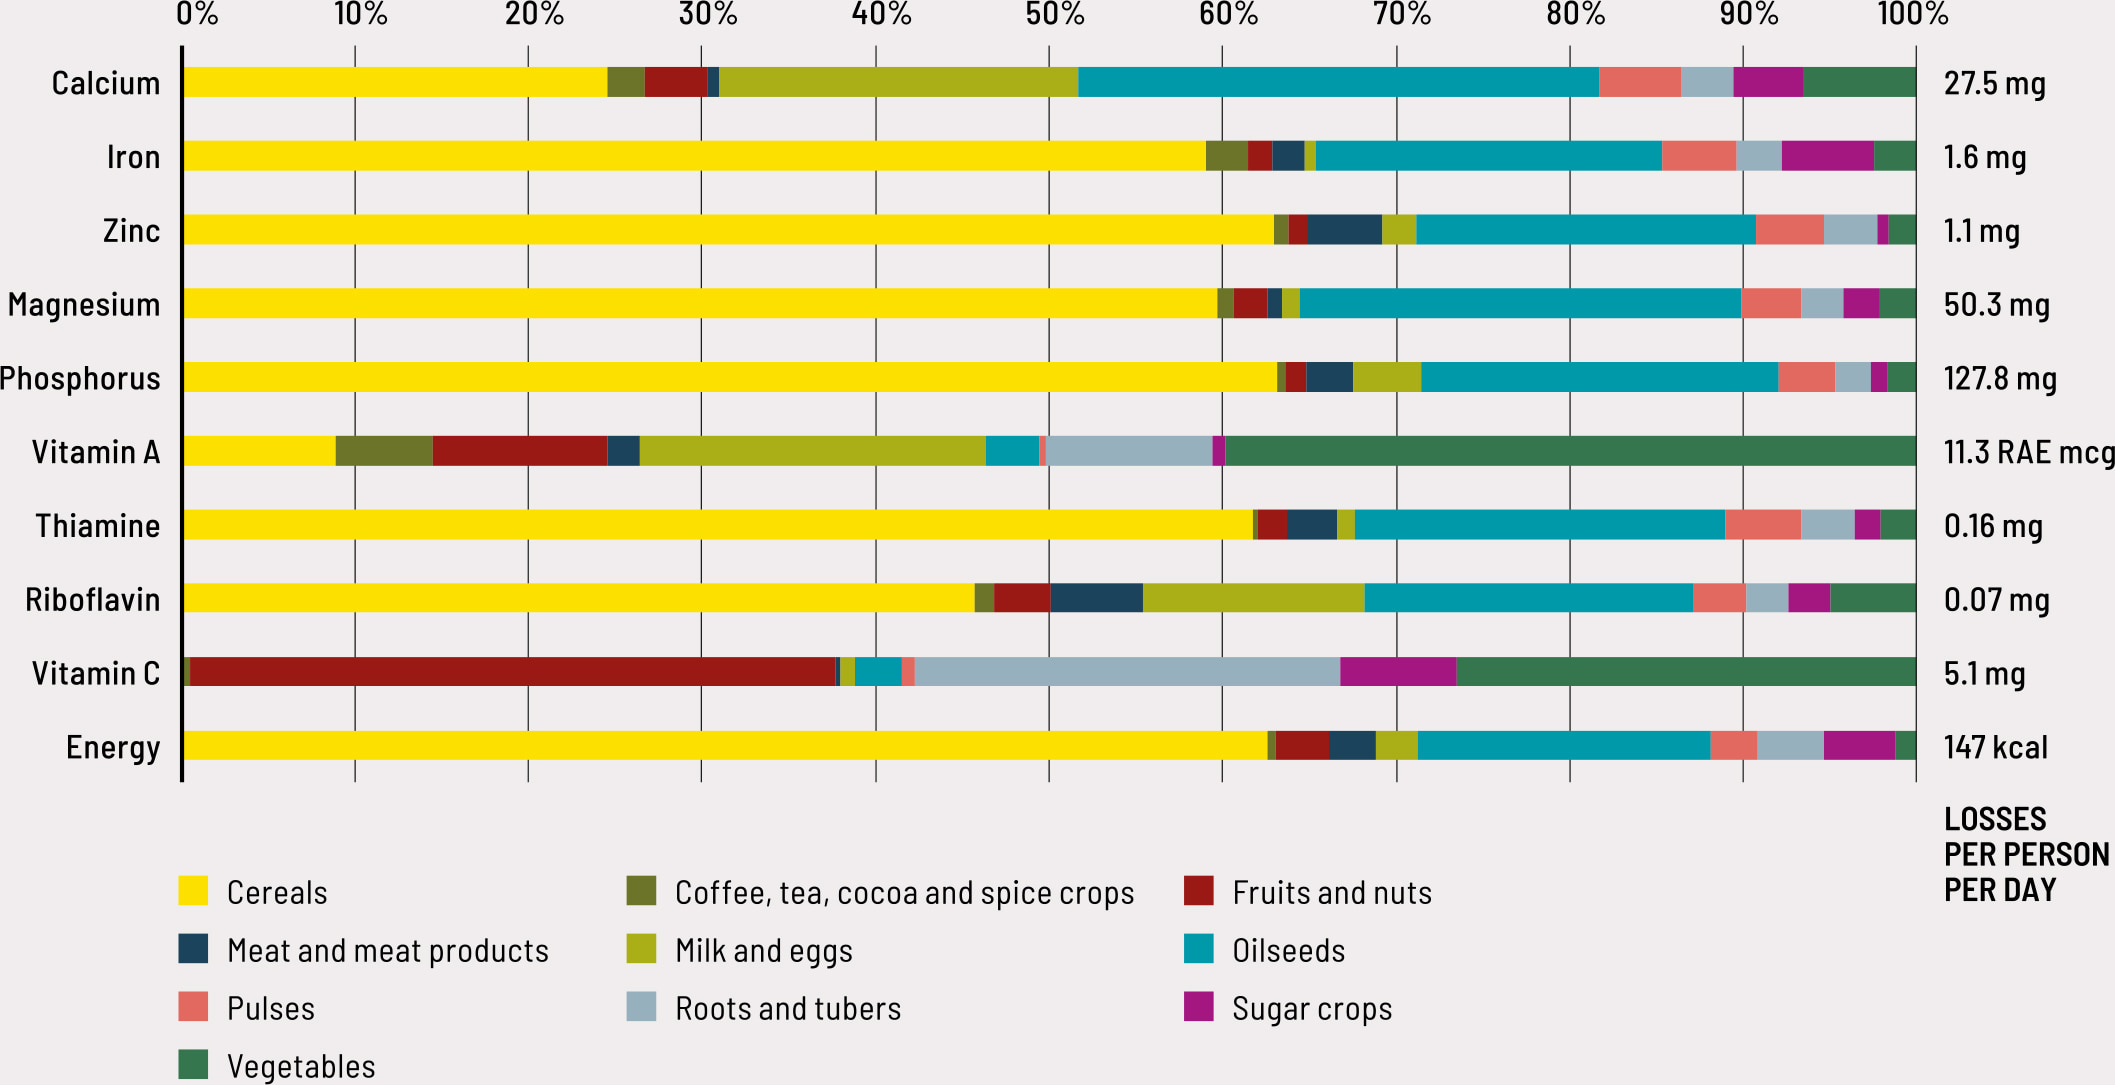
FIGURE 28 ESTIMATED DAILY LOSSES OF ENERGY AND NUTRIENTS AS A SHARE OF HUMAN REQUIREMENTS (1991-2021)
Cereals contribute predominantly to the losses for energy and several nutrients (FIGURE 27), including iron, zinc, magnesium, phosphorus, thiamine and riboflavin. Cereal-based products are staple foods in many regions and serve as a significant source of these nutrients. Vegetables primarily contribute to the losses in vitamin A. This highlights the importance of vegetables as a source of this essential vitamin, which is crucial for vision, immune function and overall health. Fruits and nuts, along with roots and tubers, contribute mainly to the losses in vitamin C. These food groups are recognized for their richness in vitamin C, an antioxidant nutrient important for immune function and collagen synthesis. Milk and eggs contribute to losses in calcium, vitamin A and riboflavin. These food sources are known for their calcium content, which is vital for strong bones and teeth. Milk and eggs also provide vitamin A, crucial for vision and immune function, and riboflavin, which is important for energy production.
Compared to requirements, nutrient losses appear to be particularly prominent for iron, phosphorus, magnesium and thiamine (FIGURE 28). Percentage losses appear similar by gender for calcium, phosphorus and vitamin A, but display differently for the other nutrients. Given higher requirements, the potential nutrition impact would be more important for women for zinc, magnesium, thiamine, riboflavin, and vitamin C, with between 1 percent to 5 percent higher losses as a percentage of the EAR for these nutrients. Iron is the only nutrient for which potential loss could affect men more than women by a 7 percent difference.
At a regional level, the estimated nutritional losses linked to production lost due to disasters are around 31 percent in Asia and the Americas, 24 percent in Europe, 11 percent in Africa and 3 percent in Oceania. However, when looking at these losses with respect to the energy requirements of the population of the regions, these appear to be particularly prominent in Oceania with about 50 percent, followed by the Americas with about 15 percent and Europe at about 13 percent. In Africa and Asia, the share of lost availability of requirements due to disasters is much lower, with about 3.5 percent and 4.5 percent, respectively. It is worth noting that the estimated losses for Africa alone correspond to the daily energy requirements of more than 43.5 million men or 54.4 million women.
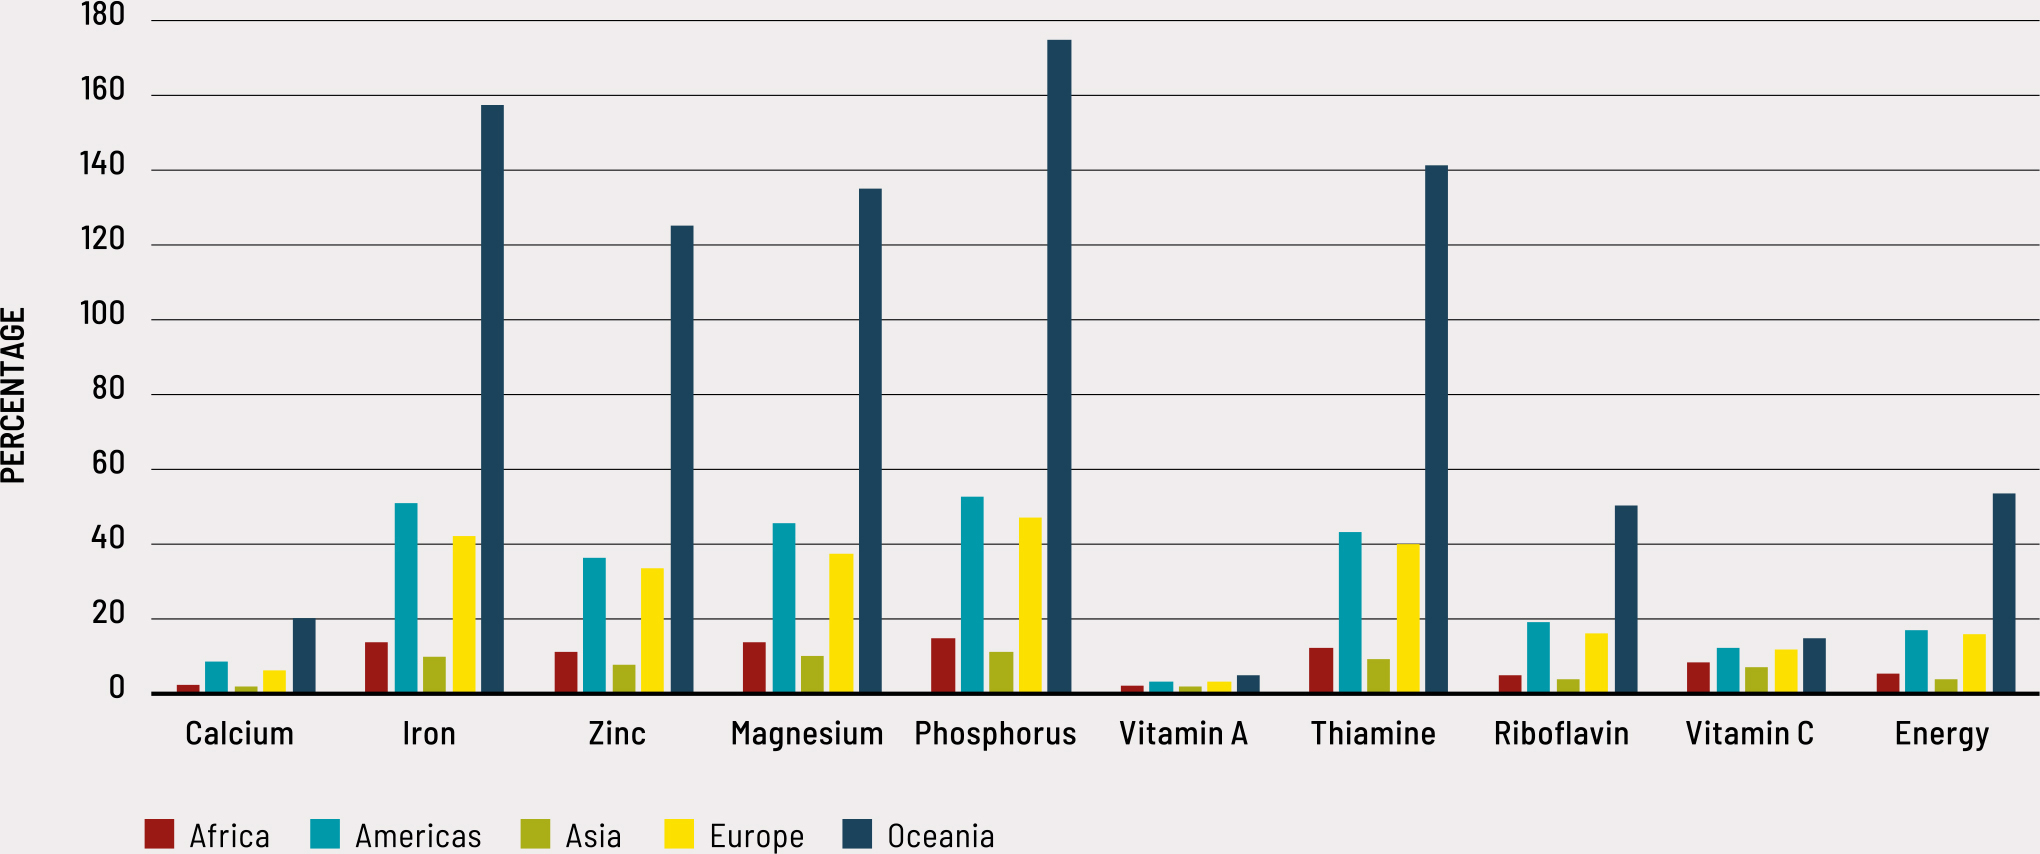
As seen in FIGURE 29 and FIGURE 30, the estimated daily losses as a percentage of the EAR are greatest in Oceania, with losses over 100 percent of EAR for both men and women for iron, magnesium, phosphorus, thiamine and, for women, zinc. This is a consequence of considering losses in the availability of nutrients rather than in actual intake. Even though nutrients lost in this region are lower than those presented by the other regions, the population in Oceania is small compared to that of other regions, and food exports are significant. This results in a high loss of nutrients per capita per day, which translates into a very high loss as a percentage of EAR. For iron, as an example, the estimated loss per capita per day in Oceania is 12.7 mg. The absolute losses might not seem very concerning; however, this translates into 212.5 percent of the share of EAR for men (EAR of 6 mg/day) and 157.4 percent for women (EAR of 8.1 mg/day).
FIGURE 29 ESTIMATED DAILY LOSSES OF ENERGY AND NUTRIENTS AS A SHARE OF HUMAN REQUIREMENTS FOR MEN BY REGION (1991-2021)
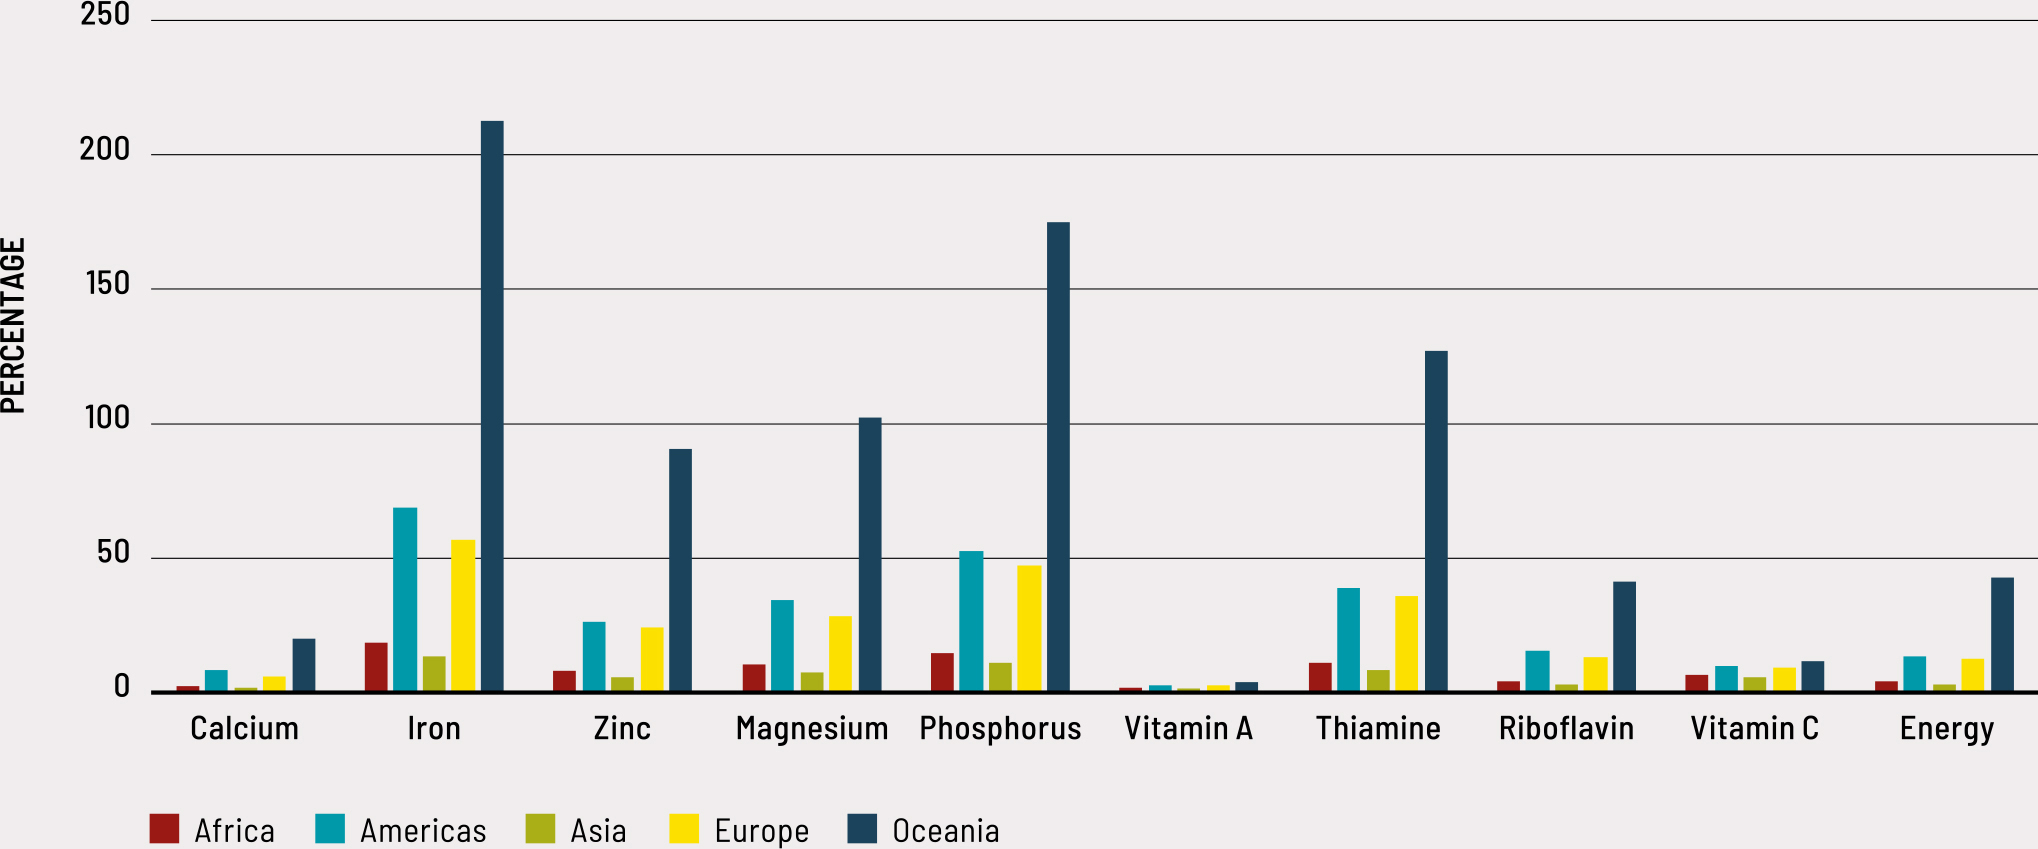
FIGURE 30 ESTIMATED DAILY LOSSES OF ENERGY AND NUTRIENTS AS A SHARE OF HUMAN REQUIREMENTS FOR WOMEN BY REGION (1991-2021)
Finally, the exclusion of fish and aquatic foods – due to the absence of systematic estimates of losses – may be particularly relevant when assessing the reduced availability, as these foods are important sources of specific nutrients. At the same time, these data, if available at a more granular level, allow for context when evaluating the availability in the food supply of specific countries.r
BOX 7 Estimating nutrient availability reductions caused by disasters
From the global disaster losses estimated in agricultural production over 1991–2021, nutritional losses are computed for calories and nine micronutrients, representing their reduced availability in the global food supply. Crop and livestock commodities lost due to disasters are matched to appropriate nutrient values in the global nutrient conversion table for calcium, iron, zinc, vitamin A, thiamine, riboflavin, vitamin C, magnesium and phosphorus, considering their edible coefficient. Total losses of nutrients from 1991 to 2021 are divided by the world population, and days in this period, to convert values into the average quantity of energy and nutrients lost per person per day due to disasters. The national population data used was retrieved from FAOSTAT. To express values as a percentage of human requirements for these nutrients, the daily per capita loss of each nutrient is divided by its estimated average EAR for adult men and women.


