
2.2 Towards an assessment of global agricultural losses
Understanding the extent and degree to which these weather anomalies and extreme events affect agriculture is the first step to developing disaster risk reduction and climate adaptation strategies. Although several databases record losses and damage associated with disaster events, losses occurring in agriculture and its subsectors are currently not comprehensively assessed or reported as part of total economic losses in existing global, multihazard disaster databases. Where agricultural losses are included in economic loss estimations, there is often little to no breakdown of monetary losses in relation to other economic sectors, or information on the types of agricultural losses that occurred after specific events. The impact of disasters in agriculture is rarely disaggregated down to the subnational level, and little to no information is provided on land use and total agricultural area affected.
Missing data and a lack of consistency in definitions and typologies of hazards and data indicators across these data systems is an ongoing challenge, and acts as a limitation for international repositories such as the EM-DAT,f DesInventar,g the World Bank,h the IFRC,i databases maintained by global reinsurance groups,j as well as national level databases.50
Monitoring and measuring progress towards the goals and targets of the SDGs, the Sendai Framework and the Paris Agreement will require addressing the significant data gaps at the global, regional, national and subnational levels. FAO has been working towards improving coverage and standardizing data collection techniques to assess the impacts of extreme events in agriculture, and towards establishing regular monitoring and reporting at the country and subnational levels. Currently, there are two sets of methodologies that are used to collect information on disaster losses in agriculture. The first forms part of post disaster needs assessment surveys, which are undertaken by governments and international agencies in the aftermath of disasters to assess the monetary value and replacement costs of loss and damage for all major affected sectors. The second methodology was developed by FAO in coordination with UNDRR to measure direct economic losses in agriculture attributed to disasters for indicator C2 of the Sendai Framework Monitor for Disaster Risk Reduction. Data from these two sources were utilized to estimate losses in agriculture relative to other productive sectors.
2.2.1 POST DISASTER NEEDS ASSESSMENTS
Post disaster needs assessment (PDNA) surveys typically include information about the impact of disasters on the productive sectors of agriculture, commerce, industry, trade, tourism and livelihoods; social sectors such as education, health, housing, culture and nutrition; and infrastructure such as transport and telecommunications, water and sanitation, and energy and electricity. The information included in PDNAs is detailed, but, at the same time, limited in scope, given that these exercises are conducted after a limited number of events and in countries with relatively less capacity to cope. As such, data derived from PDNAs must be used with caution due to their limitation.
Data are currently available from 88 PDNAs undertaken during the 2007–2022 period in 60 countries (see Technical annex 1). Findings show that agricultural losses made up an average of 23 percent of the total impact of disasters across all sectors (FIGURE 4). The data, however, are limited by the number of available PDNAs, which were conducted only in low-income countries and after the most damaging extreme events. A more general and comprehensive estimate with a reliable quantification of the extent of global economic losses from all economic sectors is not available to date.
FIGURE 4 SHARE OF SECTORAL LOSSES
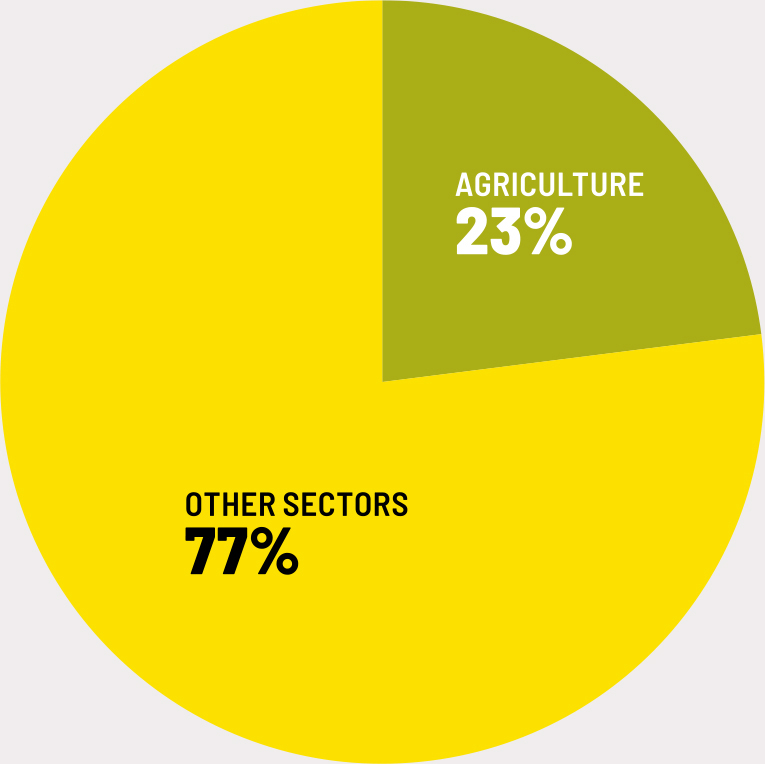
Source: Authors’ own elaboration based on data derived from PDNAs.
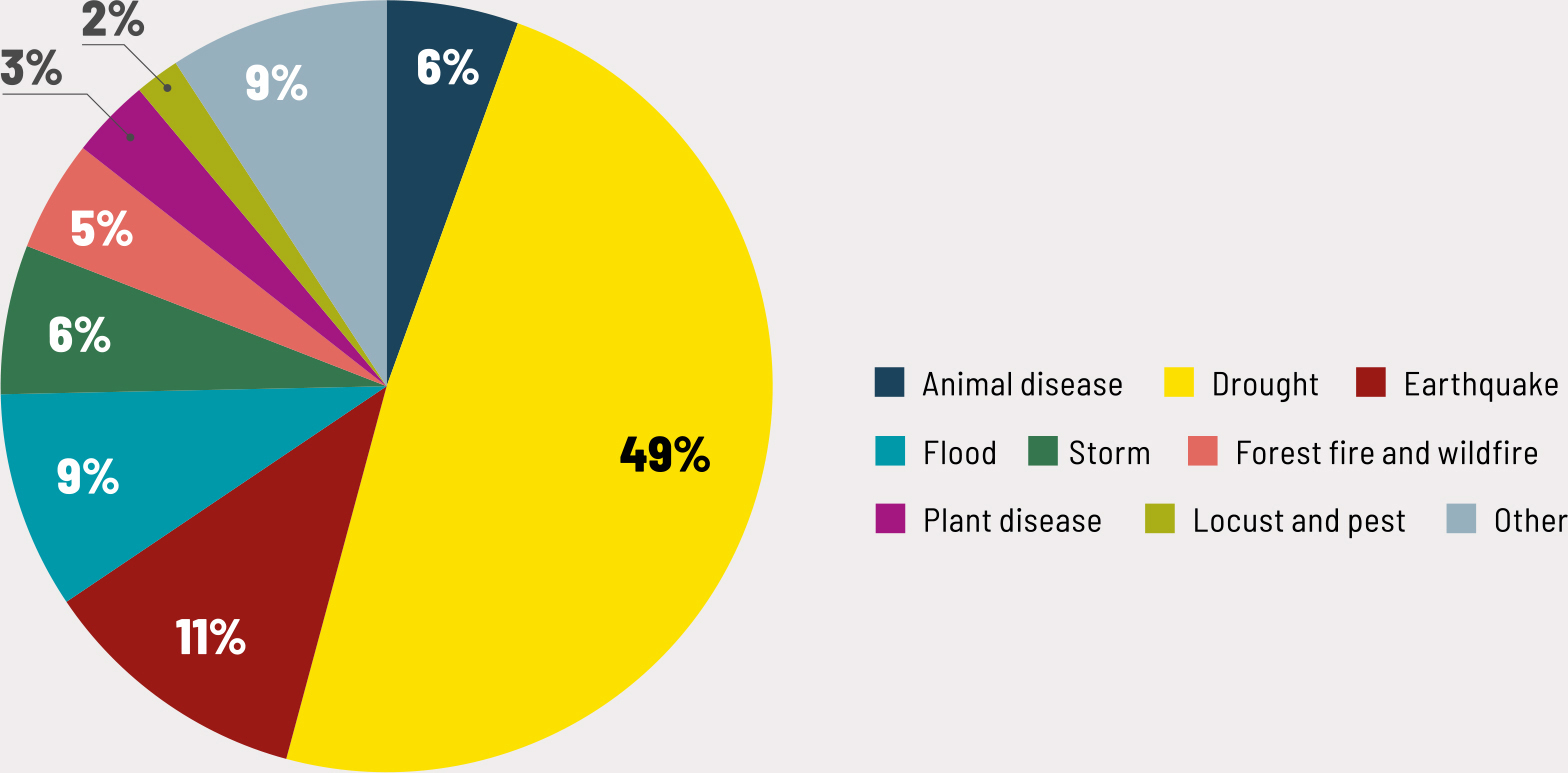
Data from PDNAs can also be utilized to assess the degree to which different hazards affect agriculture. However, this information needs to be considered with care as losses in agriculture can vary by the type of hazard, its magnitude, geographic location and ecosystems. The period in which a hazard hits relative to the agricultural production calendar, the type of activities taking place and other details of production processes are also important. Altogether, PDNAs show that over 65 percent of losses caused by droughts were experienced in the agriculture sector. Floods, storms, cyclones and volcanic activities account for around 20 percent each, thus underscoring the disproportionately high impact of droughts in the sector (FIGURE 5).
FIGURE 5 SHARE OF (PERCENTAGE) LOSS IN AGRICULTURE BY HAZARD TYPE

Source: Authors’ own elaboration based on data derived from PDNAs.
Although the sample size is limited, PDNAs provide information on subsectoral losses in agriculture. This information is available for 50 out of the total 80 PDNAs (FIGURE 6). Crops and livestock account for most of the losses suffered, both around 50 percent. The significantly higher share of crop and livestock loss is also due to the fact that fisheries and aquaculture and forestry do not receive enough attention in these evaluations.
FIGURE 6 BREAKDOWN OF LOSSES IN AGRICULTURE BY SUBSECTORS (2007-2022)
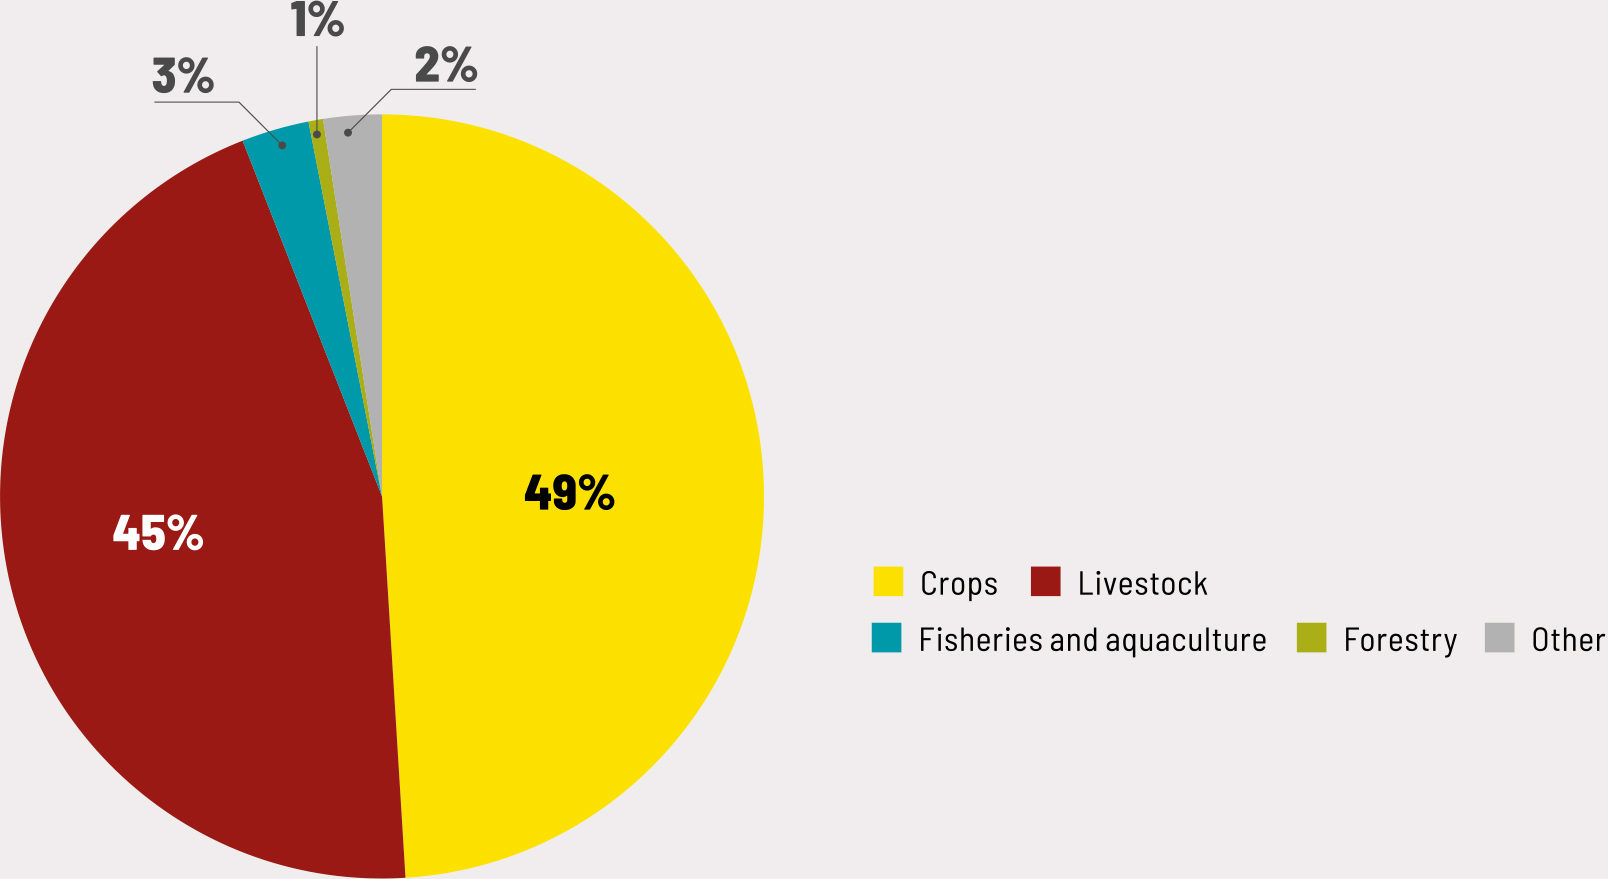
Source: Authors’ own elaboration based on data derived from PDNAs.
2.2.2 SENDAI FRAMEWORK MONITOR INDICATOR C2
The Sendai Framework for Disaster Risk Reduction 2015–2030 was the first major agreement of the post-2015 development agenda that monitors the actions of the United Nations Member Countries to protect development gains from the risk of disasters. The overarching goal of the framework is to prevent new risks and reduce existing ones while increasing resilience. The framework is guided by four priorities for action and seven global targets, labelled A to G, to support the assessment of global progress in achieving the Sendai Framework. Following the adoption of the Sendai Framework, the United Nations General Assembly established an open-ended intergovernmental expert working group (OIEWG) aimed at developing a set of indicators to measure progress against the Sendai Framework’s seven global targets, and to establish agreed terminology related to DRR.51 The report of the OIEWG on terminology and indicators related to DRR recommended 38 indicators to evaluate progress against the seven targets of the Sendai Framework, which were subsequently endorsed by the United Nations General Assembly.k
Within global target C of the Sendai Framework, subindicator C2 corresponds to direct agricultural losses attributed to disasters. These include losses in crops, livestock, fisheries, apiculture, aquaculture and forest subsectors, as well as their associated facilities and infrastructure. Following a request by the United Nations General Assembly, FAO has supported the development of a methodology to measure subindicator C2. As with all other indicators of the framework, reporting is voluntary, and Member Countries can choose to adapt the recommended methodology based on national or other systems of measurement and calculation. Data are compiled in the online Sendai Framework Monitor, which allows for the inclusion of all agricultural subsectors and further disaggregation by commodity types.
Since reporting began under the Sendai Framework, 82 countries out of the 195 reporting to the Sendai Framework Monitor have reported on indicator C2 at least once. The highest number of reports by countries was in 2019 (FIGURE 7). Of these 82 countries, 38 have included subsectoral data, with 31 reporting agricultural loss by crops and 24 reporting agricultural loss by livestock. It is important to note that the decline observed in 2020 and 2021 stems from a drop in reporting by Member Countries and should not be interpreted as an actual decrease of events in 2020 and 2021. A more complete picture of agricultural losses is expected to emerge as countries scale up data reporting, including disaggregation by agricultural subsectors at the national and subnational levels. Since subsector and commodity type data reporting is optional, there is still a critical information gap for understanding granular level impacts that disasters produce in agriculture, livelihoods and food security.
FIGURE 7 AGRICULTURAL LOSSES DECLARED UNDER SENDAI FRAMEWORK INDICATOR C2 (2015–2021)

Total agricultural losses from disasters reported in the Sendai Framework Monitor amount to an average of USD 13 billion per year. The most prevalent disaster types as reported by 31 countries providing hazard disaggregated information on agricultural losses were floods (16 percent), fire and wildfire (13 percent) and drought (12 percent). In contrast, nearly half of all agricultural losses reported in this data subset were caused by droughts, once again underscoring the significant effect of this hazard on agriculture (FIGURE 8).
FIGURE 8 SHARE OF IMPACT BY HAZARD TYPE DECLARED UNDER SENDAI FRAMEWORK INDICATOR C2 (2015-2022)
These figures are likely to be a significant underestimation of agricultural losses due to the limited number of countries reporting and delays in reporting caused by the COVID-19 pandemic. More timely data are necessary to predict and mitigate disasters that may likely affect agriculture and determine the best risk-informed practices.
Improved information on disaster losses can enhance the understanding of how the agriculture sector is affected and to address the ways in which it is affected. It will also inform the development and adoption of policies, programmes and financial mechanisms that help protect the sector’s development from shocks and crises, thus strengthening its resilience. To address the gap created by the absence of relevant and granular data to describe the precise impacts of disasters on agriculture and food security, this report adopts a macro level approach for estimating losses in agriculture using national level data on agricultural production and the occurrence of disasters. The following section outlines an innovative and novel methodology for estimating global losses in agriculture resulting from extreme events spanning from 1991 to 2021. This assessment, for the first time, provides a global overview of losses in agriculture resulting from small-, medium- and large-scale disasters in all countries of the world over the past 31 years.


