
Employment in the primary sector
Similarly to the data on fishing vessels, the data on global employment in fisheries and aquaculture have been revised resulting in figures higher than those previously reported for 1995–2021. In 2022, an estimated 61.8 million people were engaged as full-time, part-time, occasional or unspecified workersm in the primary sector of commercial fisheries and aquaculture – a slight decrease from 62.8 million in 2020. The aquaculture sector accounted for 36 percent of this global workforce, 54 percent were employed in capture fisheries, while it was not possible to break down the remaining 10 percent between fisheries and aquaculture.
Asia accounted for the vast majority (85 percent) of workers involved in fisheries and aquaculture, followed by Africa (10 percent) and Latin America and the Caribbean (4 percent), while Europe, Oceania and Northern America combined accounted for just 1 percent. The total fisheries and aquaculture workforce comprised 1.7 percent of the working age population (15–64 years of age) in Asia, followed by Africa (0.8 percent), Latin America and the Caribbean (0.5 percent), Oceania (0.3 percent) and Northern America and Europe (both 0.1 percent). It should be noted that the age of employment may fall outside this age range, as child labour is a notable issue in the sector (FAO, 2021a; Lozano et al., 2022).
Considered separately, aquaculture provided employment for approximately 22 million people globally, mainly in Asia (95 percent), followed by Africa (3 percent) and Latin America and the Caribbean (2 percent). Comparatively, 77 percent of the global fisheries workforce was in Asia, while Africa and Latin America and the Caribbean employed about 16 percent and 5 percent of the world’s fishers, respectively. Northern America, Europe and Oceania each contributed 1 percent or less in both subsectors. Table 10 presents the number of fishers and fish farmers by geographical region and subsector, breaking down further fisheries into inland and marine.
TABLE 10EMPLOYMENT IN THE PRIMARY SECTOR OF FISHERIES AND AQUACULTURE BY GEOGRAPHICAL REGION AND SUBSECTOR, 1995–2022

Total employment in fisheries and aquaculture gradually increased from 41.3 million in 1995 to a peak of an estimated 63.1 million in 2018, after which a slight decrease is observed (Figure 28). The trends in the number of people engaged as fishers or fish farmers vary by region. Between 1995 and 2022, this workforce increased in Africa, Asia and Latin America and the Caribbean by 91 percent, 49 percent and 44 percent, respectively, while it decreased in Europe, Northern America and Oceania by 32 percent, 26 percent and 20 percent, respectively.
FIGURE 28EMPLOYMENT IN THE PRIMARY SECTOR OF FISHERIES AND AQUACULTURE BY GEOGRAPHICAL REGION, 1995–2022

Where data could be disaggregated by subsector, employment in aquaculture more than doubled between 1995 and 2016, when it peaked at 22.8 million. Since 2016, there has been a slight decrease, reaching 22.1 million in 2022. The number of people employed in fisheries increased from 23.2 million in 1995 to 34.3 million in 2020, after which it fell slightly to 33.6 million in 2022.
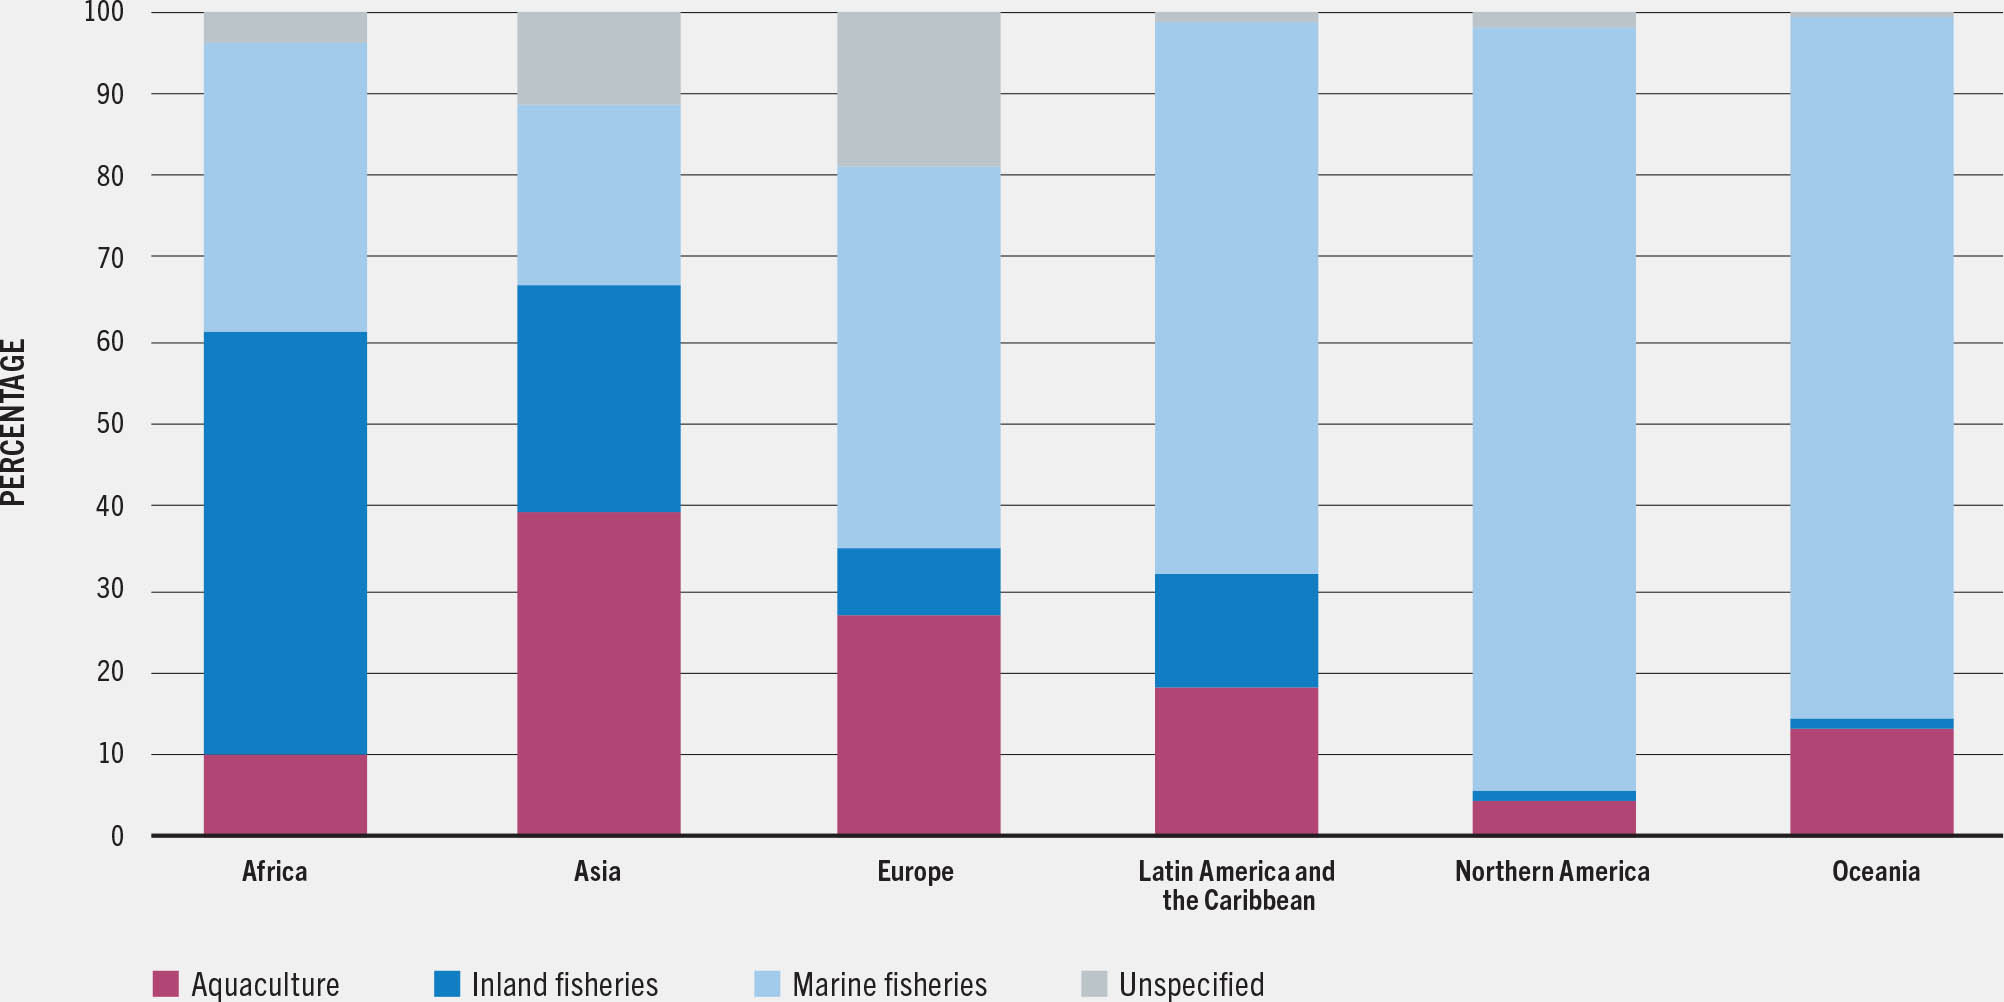
Figure 29 shows the share of fishers and fish farmers by geographical region in 2022, separating aquaculture, inland fisheries, marine fisheries and the unspecified sector. Aquaculture provides the largest share of employment only in Asia (40 percent), compared with 25 percent of total employment in the sector in Europe. Marine fisheries is the most important subsector in Northern America (93 percent), Oceania (85 percent), Latin America and the Caribbean (67 percent) and Europe (45 percent). Inland fisheries is the most important subsector in Africa (51 percent) and accounts for over 25 percent of employment in the sector in Asia.
FIGURE 29SHARE OF SUBSECTOR EMPLOYMENT IN THE PRIMARY SECTOR OF FISHERIES AND AQUACULTURE BY GEOGRAPHICAL REGION, 2022
Most fishers and fish farmers are found in lower-middle-income countries (62 percent in 2022), followed by upper-middle-income countries (31 percent). In 2022, low-income countries hosted 5 percent of fishers and fish farmers, and high-income countries only 2 percent. Where data can be separated by subsector, major differences are revealed between fisheries and aquaculture. While lower-middle-income countries host most fishers and fish farmers, the second-largest group is found in low-income countries for aquaculture (10 percent in 2022) and in upper-middle-income countries for fisheries (19 percent). There is also a difference in the share of employment in high-income countries, which are home to just 3 percent of fishers and less than 1 percent of fish farmers.
As Figure 30 shows, close to half of global employment data cannot be disaggregated into full-time, part-time, occasional or unspecified work, limiting significantly the analysis of the data from this perspective. This issue is most pronounced in the aquaculture sector (58 percent), as the relative disaggregated data are not available in some countries with large aquaculture workforces.
FIGURE 30TIME USE CATEGORIES REPORTING IN THE PRIMARY SECTOR OF FISHERIES AND AQUACULTURE, 2022

Considering only data where time use is available, in 2022, 82 percent of fish farmers were employed full time, 7 percent part time and 11 percent on an occasional basis. In fisheries, only 48 percent of inland fishers and 71 percent of marine fishers were engaged full time, while, respectively, 33 percent and 13 percent were engaged part time, and 19 percent and 16 percent were engaged on an occasional basis.
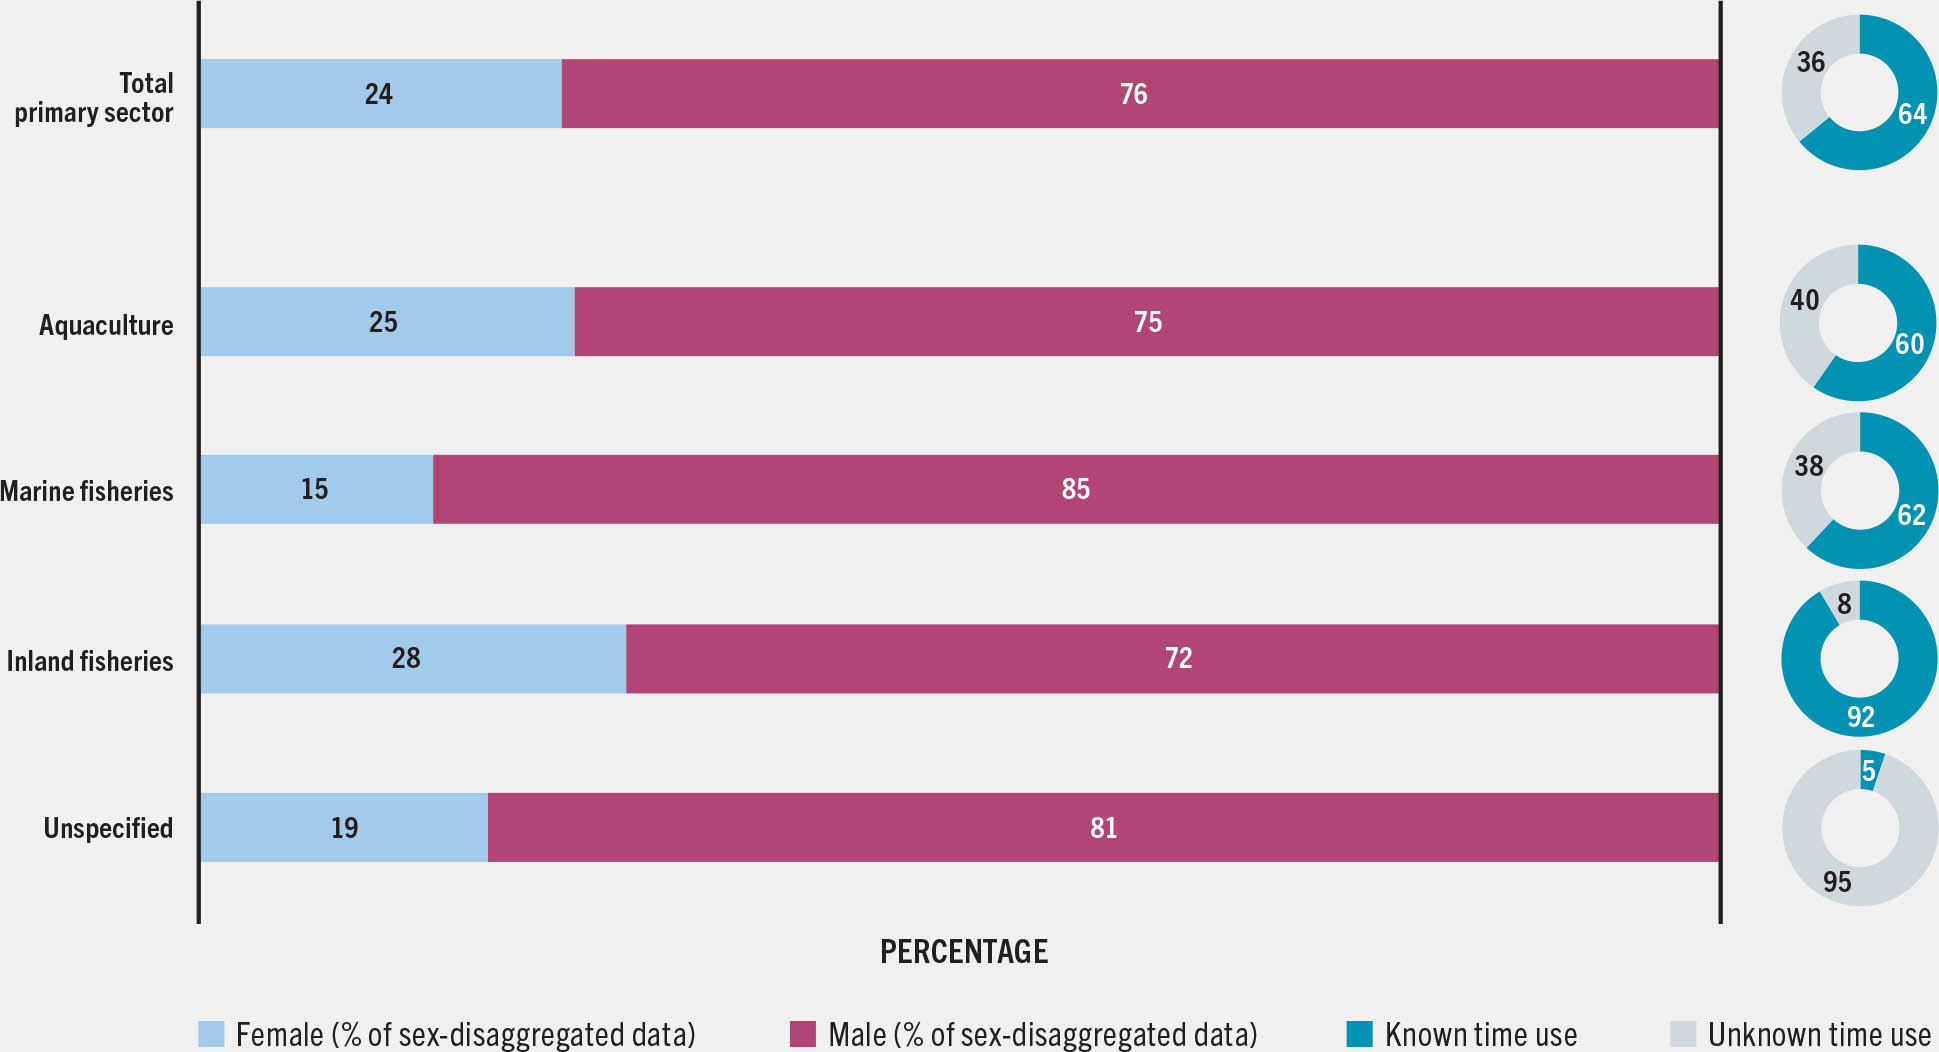
Similarly to information on time use, 36 percent of the employment data in the primary sector cannot be disaggregated by sex (Figure 31). There is no sex disaggregation for 40 percent of data in aquaculture, 8 percent in inland fisheries, 38 percent in marine fisheries and 95 percent in the unspecified sector. Where there is sex disaggregation, women accounted for 24 percent of fishers and fish farmers in 2022: 28 percent in inland fisheries, 25 percent in aquaculture, 15 percent in marine fisheries and 19 percent in the unspecified subsector.
FIGURE 31SEX-DISAGGREGATED DATA ON EMPLOYMENT IN THE PRIMARY SECTOR OF FISHERIES AND AQUACULTURE BY SUBSECTOR, 2022
Where sex-disaggregated data are available, 53 percent of women were reported to be employed on a full-time basis, compared with 57 percent of men. This represents a great improvement since 1995, when only 32 percent of women were employed full time compared with 48 percent of men. Despite this improvement, research shows that women tend to have more unstable positions within the value chains of aquaculture and fisheries (EUROSTAT, 2023; UN Women, 2020). This difference is greater in the processing sector, where 63 percent of women are employed on a full-time basis compared with 74 percent of men. Furthermore, several issues related to gender inequality remain, including difference in wages (Aini, 2022), no acknowledgement of work (UN Women, 2020), and violence against women in the sector (Mangubhai et al., 2023; see also Box 23, p. 149).
Employment in the processing sector
In recent years, FAO has been collecting data on employment in the processing of aquatic products from the time they are harvested through to delivery of the final product to the customer. At present, data have been received from 52 out of 223 reporting countries and territories, regarding a total of 1.7 million people. Sex-disaggregated data for 27 countries are available for 238 000 processing workers, 62 percent of whom are women. These figures are complemented by the Illuminating Hidden Harvests study (FAO, Duke University and WorldFish, 2023b), which reports that 39.6 percent of workers (both formally employed and subsistence workers) throughout the entire small-scale fisheries value chain and 49.8 percent of post-harvest workers are women. The focus on small-scale actors is particularly important, because although data availability is insufficient, they seem to comprise a greater proportion of women workers.
Data quality and improvements
Collection and analysis of employment data in fisheries and aquaculture continue to improve as a result of enhanced country reporting combined with FAO’s ongoing effort to improve the quality of these data. This process applies to the entire dataset from 1995 onwards, and the aim is to apply it also to earlier years, where feasible. FAO strives to improve and harmonize definitions, to ensure a common understanding between data collectors, data processors and data users, and to be able to present more disaggregated data in the future. For 53 countries, FAO has worked in collaboration with the Organisation for Economic Co-operation and Development (OECD). The two organizations have also harmonized their employment datasets and streamlined data collection through a joint questionnaire on fisheries and aquaculture employment to eliminate a double reporting burden for countries.
In addition to regular data updates and checks for inconsistencies, there is an increasing focus on improving data coverage, in particular for subsistence fishers. Currently, such data are available for only 40 countries – thus excluding this category from the analysis above – but efforts are ongoing to expand coverage and include subsistence fisheries in future analyses. Information on small-scale and artisanal fisheries can be found in the Illuminating Hidden Harvests study (FAO, Duke University and WorldFish, 2023b), where it is estimated that subsistence fishing engages around 53 million people, of whom 45.2 percent (23.8 million) are women.
Efforts are also made to improve data disaggregation; for example, “unspecified” is presented as a separate category, rather than under capture fisheries as previously. FAO supports and encourages data collectors to disaggregate the data for the two main subsectors (fisheries and aquaculture), but when such disaggregated data or reliable estimations are not available, it is deemed preferable to include these data as a separate category.
Finally, work on data collection in the processing sector will continue with regular updates in this report and in future editions of the FAO Yearbook of Fishery and Aquaculture Statistics.


