
Introduction
The 2030 Agenda for Sustainable Development (UN, 2015) acknowledges the key role of agrifood systems in combating hunger and food insecurity and alleviating poverty (FAO, 2024a). The year 2022 marked the mid-term pathway of the 2030 Agenda with an alarming declaration by the United Nations General Assembly: “at the midpoint of the 2030 Agenda, the progress on most of the SDGs is either moving much too slowly or has regressed below the 2015 baseline”.x The progress made with agrifood systems remains insufficient, and there is an urgent call to accelerate the transformational change required to address the many challenges of the 2030 Agenda (UN, 2020).
The Sustainable Development Goals (SDGs) have become central to the FAO Strategic Framework 2022–2031 (FAO, 2024b) and to the Blue Transformation Roadmap, which identifies key objectives, outcomes, priority actions and targets to transform aquatic food systems (see Blue Transformation: a roadmap, p. 119). Blue Transformation fully engages FAO in supporting Members and other actors to achieve several SDG targets, in particular the targets of SDG 14 (Life below Water) relevant to fisheries and aquaculture, measuring and reporting progress through the SDG indicator framework (FAO, 2022b). FAO is custodian of four SDG 14 indicators (14.4.1, 14.6.1, 14.7.1, 14.b.1). Table 12 summarizes countries’ participation in FAO calls for reporting during 2018–2024.
TABLE 12NUMBER OF COUNTRIES AND TERRITORIES CALLED FOR REPORTING, AND NUMBER OF REPORTING COUNTRIES AND TERRITORIES FOR SDG INDICATORS 14.4.1, 14.6.1 AND 14.B.1

* Countries which did not validate the indicator score or which were found to be not applicable were not included in the reported numbers.
Quantifying fishery stocks within biologically sustainable levels: Indicator 14.4.1
Target SDG 14.4 aims to achieve 100 percent of fishery stocks within biologically sustainable levels by 2020. The latest assessment of the global and regional status of fishery resources (FAO, 2024c) (see The status of fishery resources, p. 42) confirms that this target has not been achieved (UN, 2020). This is supported by the results of the country reports on Indicator 14.4.1.y
FAO piloted two questionnaire calls – in 2019/20 and 2022/23 – to facilitate harmonized and consistent reporting by countries on Indicator 14.4.1 (UNSD, 2024a). Of the 157 FAO Members with maritime coastlines and 23 of their territories, 48 reported once, 69 reported twice, and 63 did not report. Their participation increased from 87 in 2019/20 to 99 in 2022/23 (Table 12). These 99 submitted reports were reviewed by FAO for quality assurance and validation (FAO, 2022b). Reports of 46 countries passed both first and second levels of quality assurance, an increase of 48.4 percent from 2019 when there were 31 high-quality reports. Thirty-three countries passed only the first level of quality assurance, down by 10.8 percent from 2019, and 20 countries failed to pass the first level of quality assurance, compared with 19 in 2019. Finally, nine countries acknowledged interest but could not submit reports because of lack of data.
Though these improvements in the quantity and quality of country reporting indicate a positive trend in monitoring practices (see Box 7, p. 104), many of the challenges faced in the 2019/20 call remain, as countries are hindered by limited capacity to effectively address deficiencies in fisheries data collection and management, with poor coordination among agencies involved in the reporting process. FAO’s efforts and support to build countries’ capacities (FAO, 2022b) contributed to increased reporting and improved quality of the responses by countries (Figure 51a). Though these positive trends are encouraging, indicator scores require more frequent reporting by countries in order to stabilize. FAO will build on this experience to enhance its support to countries, particularly developing countries, ensuring a progressive convergence between national SDG reporting and the FAO State of Stocks Index (SoSI) (see Evolving the way we assess the status of marine fishery stocks, p. 159).
BOX 7REGIONAL ANALYSIS OF REPORTING ON SDG INDICATOR 14.4.1
Sustainable Development Goal Indicator 14.4.1 measures the percentage of fishery stocks within biologically sustainable levels. Between the 2019 and 2022 calls for reporting on Indicator 14.4.1, data show equal or increased reporting rate by region, with Oceania (which lags behind) showing a notable increase thanks to four newly reporting Pacific Small Island Developing States in 2022. The exception is sub-Saharan Africa, which had a lower reporting rate in 2022 and very low recurrence of reporting countries across the two calls (Figure A). The number of high-quality questionnaires (i.e. questionnaires that passed Quality Assurance level 2) rose in most regions, with the greatest improvements in Europe and Northern America, Latin America and the Caribbean, Eastern and South-Eastern Asia, followed by Northern Africa and Western Asia, finally Central and Southern Asia. The number of high-quality questionnaires remained unchanged in Oceania and slightly decreased in sub-Saharan Africa (Figure B). The general quality of the reported questionnaires (i.e. questionnaires that passed both Quality Assurance level 1 and 2) increased between 2019 and 2022 in most regions; the greatest improvements were in Oceania, Northern Africa and Western Asia, and Europe and Northern America, followed by Eastern and South-Eastern Asia, and latin America and the Caribbean.
FIGURE ASDG INDICATOR 14.4.1 – NATIONAL REPORTING RATE BY SDG REGION IN 2019 AND 2022 CALLS
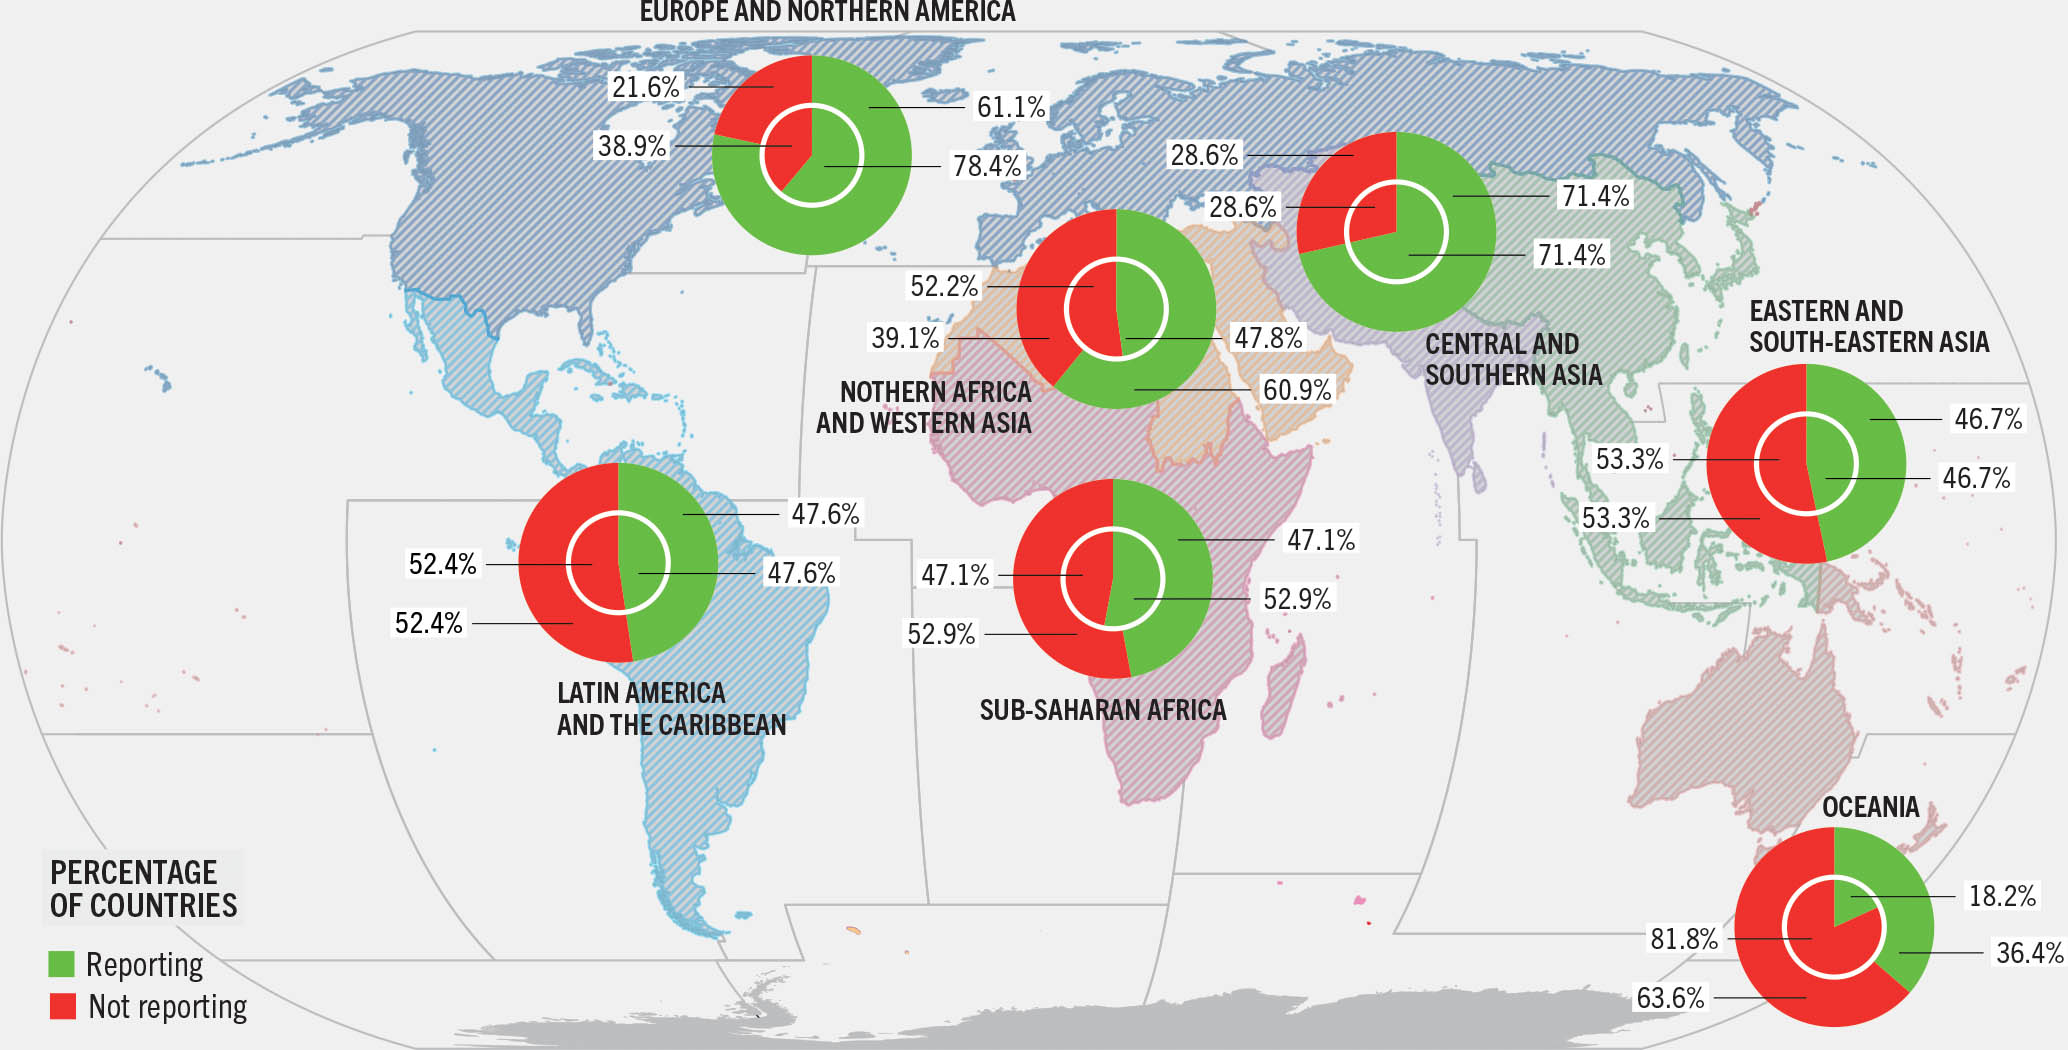
SOURCES: For the donut chart: UNSD. (forthcoming). SDG Indicators Database. https://unstats.un.org/sdgs/
For the map of the SDG regions: UNSD. 2024. SDG Indicators. Regional groupings used in Report and Statistical Annex. In: United Nations. New York. [Cited 19 April 2024]. https://unstats.un.org/sdgs/indicators/regional-groups/
FIGURE BSDG INDICATOR 14.4.1 – NATIONAL REPORTING QUALITY LEVEL IN 2019 AND 2022 CALLS
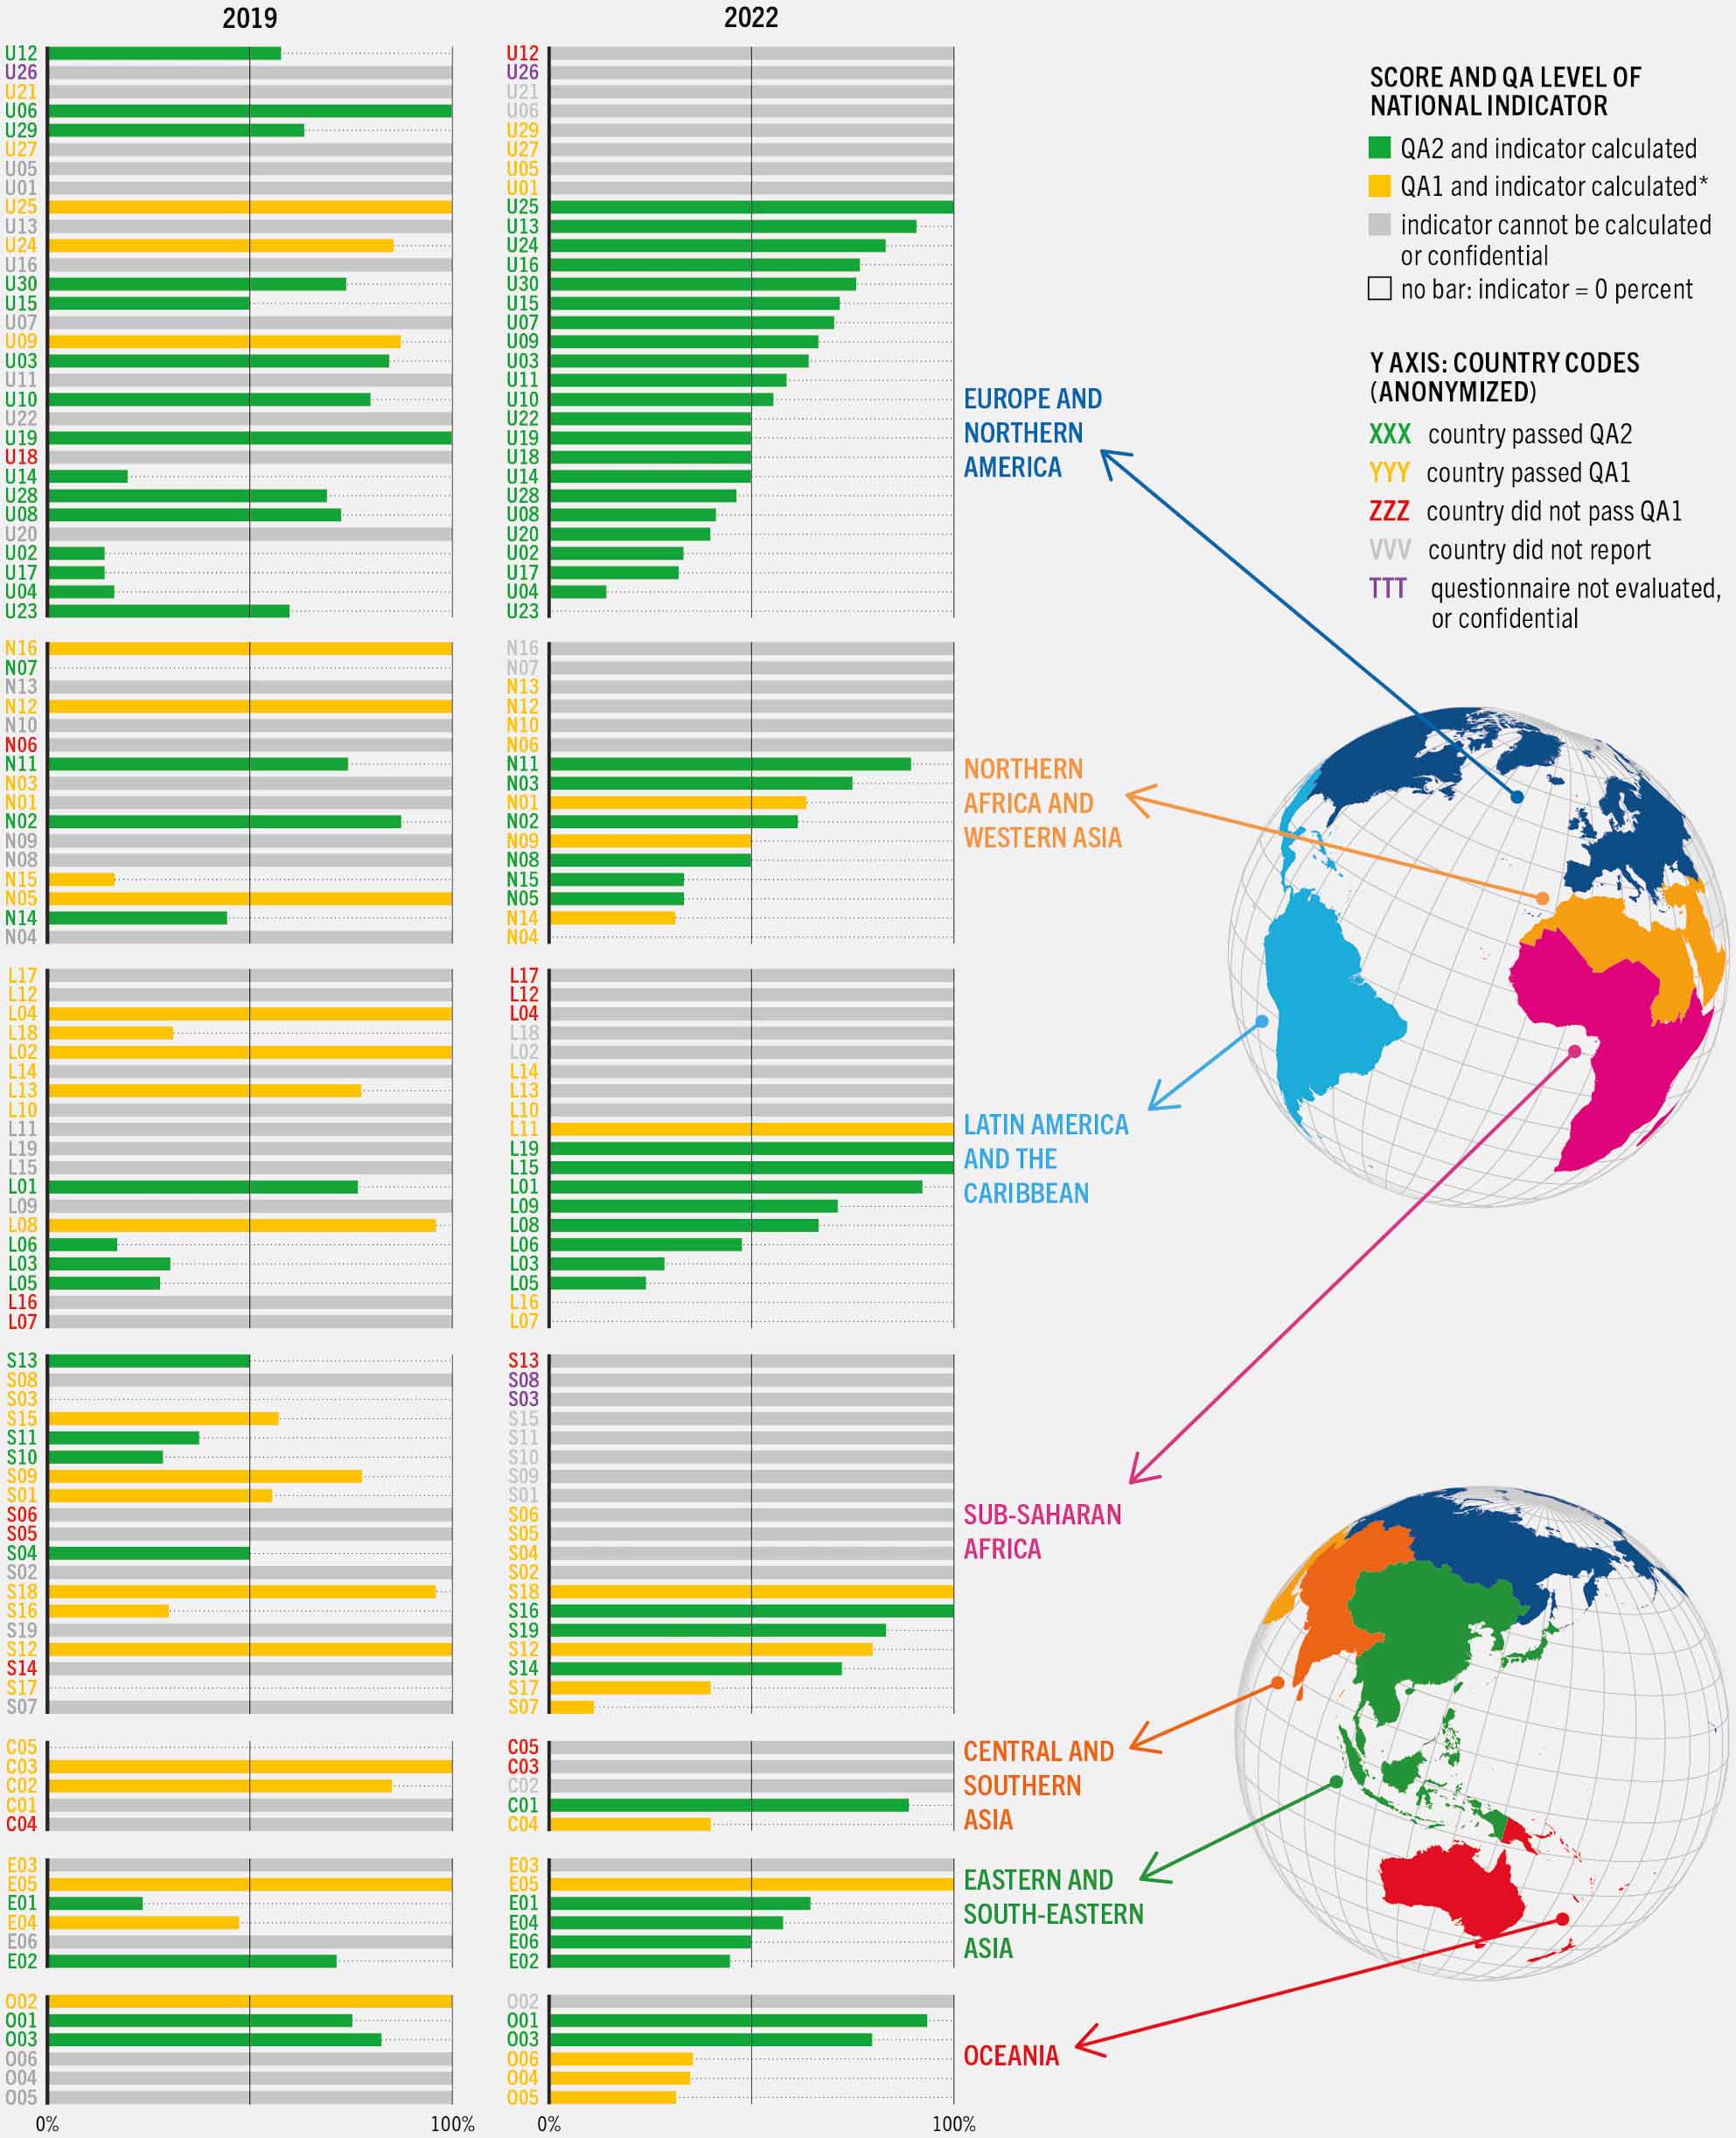
* For countries passing only QA1, an indicator can be calculated when a stock status is provided for at least one stock of the country reference list; indicators calculated for these countries are reported with low reliability. If less than five stocks are presented with status not covering the required portion of the landings, a low reliability index will however not be reported.
SOURCES: For the bar chart: UNSD. (forthcoming). SDG Indicators Database. https://unstats.un.org/sdgs/
For the map of the SDG regions: UNSD. 2024. SDG Indicators. Regional groupings used in Report and Statistical Annex. In: United Nations. New York. [Cited 19 April 2024]. https://unstats.un.org/sdgs/indicators/regional-groups/
The review also shows a slight improvement in the average national indicators in most regions between 2019 and 2022; the exceptions are Northern Africa and Western Asia, as well as Oceania.
These results clearly show the challenges faced by developing regions in reporting on Indicator 14.4.1. Despite these difficulties, countries’ improved responses testify to their interest in the indicator. The progress since 2019 also reflects the impact of FAO’s capacity building efforts (FAO, 2023; see Figure A). Between the end of 2019 and early 2022, eight regional workshops benefiting over 600 participants from 96 countries provided guidance on the process and tools for analysis and reporting on Indicator 14.4.1. These were complemented by support services and resources including the Virtual Research Environment tool for online community support, a specific e-learning course on Indicator 14.4.1,* data collection and stock monitoring training toolkits, and direct assistance to countries during the reporting exercises.
SOURCE: FAO. 2023. Evaluation of FAO’s Support to Life below Water (SDG 14). Hundred and Thirty-seventh Session of the Programme Committee, Rome, 6–10 November 2023. Rome. https://www.fao.org/3/nn072en/nn072en.pdf
FIGURE 51AFAO CAPACITY DEVELOPMENT ACTIVITIES AND MOST RECENT QUALITY ASSURANCE SCORES (SDG INDICATOR 14.4.1)
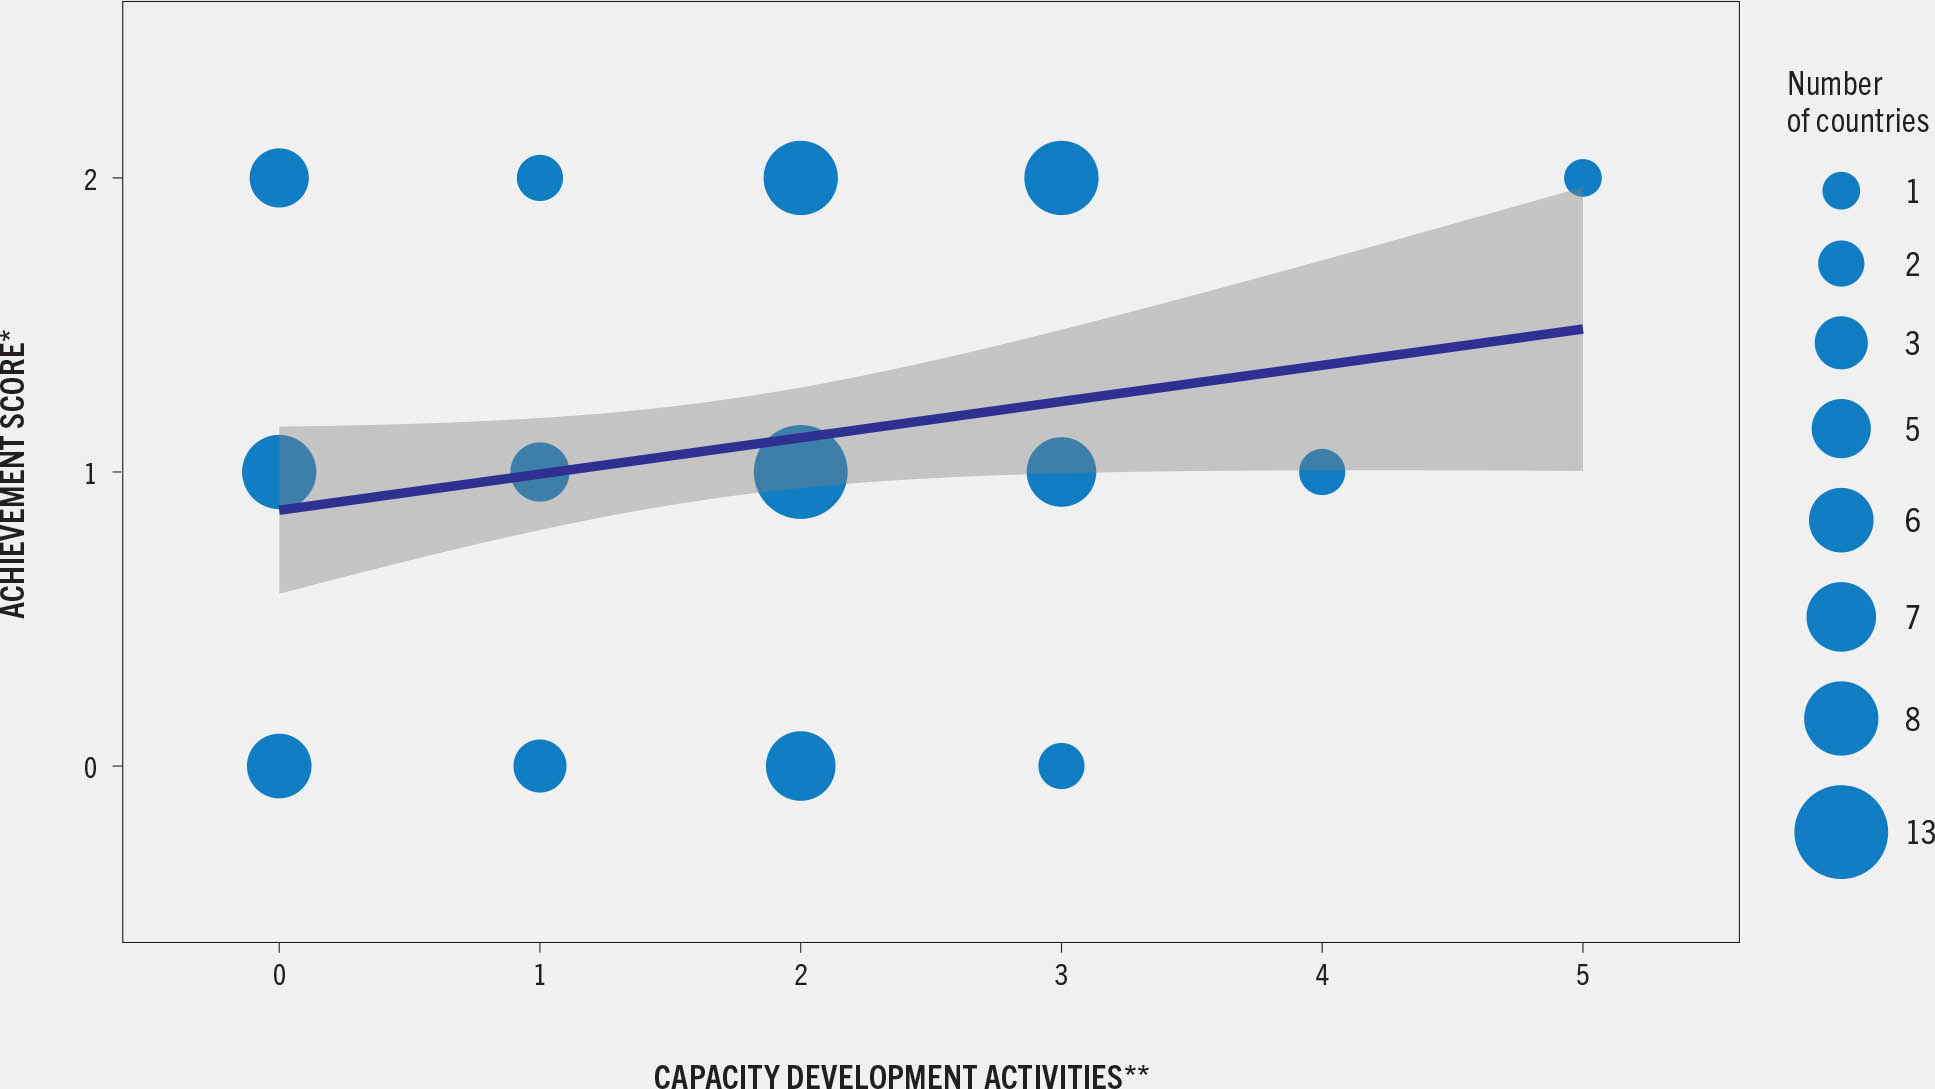
* The most recent QA level for the submitted 14.4.1 questionnaire during 2019–2022.
** Number of FAO capacity development activities on Indicator 14.4 1 received by a single country during 2019–2022.
SOURCES: For achievement scores: UNSD. (forthcoming). SDG Indicators Database. https://unstats.un.org/sdgs/
For number of capacity development activities: FAO calculations.
FIGURE 51BACTIVITIES CARRIED OUT WITHIN THE FAO GLOBAL CAPACITY BUILDING PROGRAMME IN SUPPORT OF THE PSMA AND COMPLEMENTARY INSTRUMENTS DURING 2018–2024
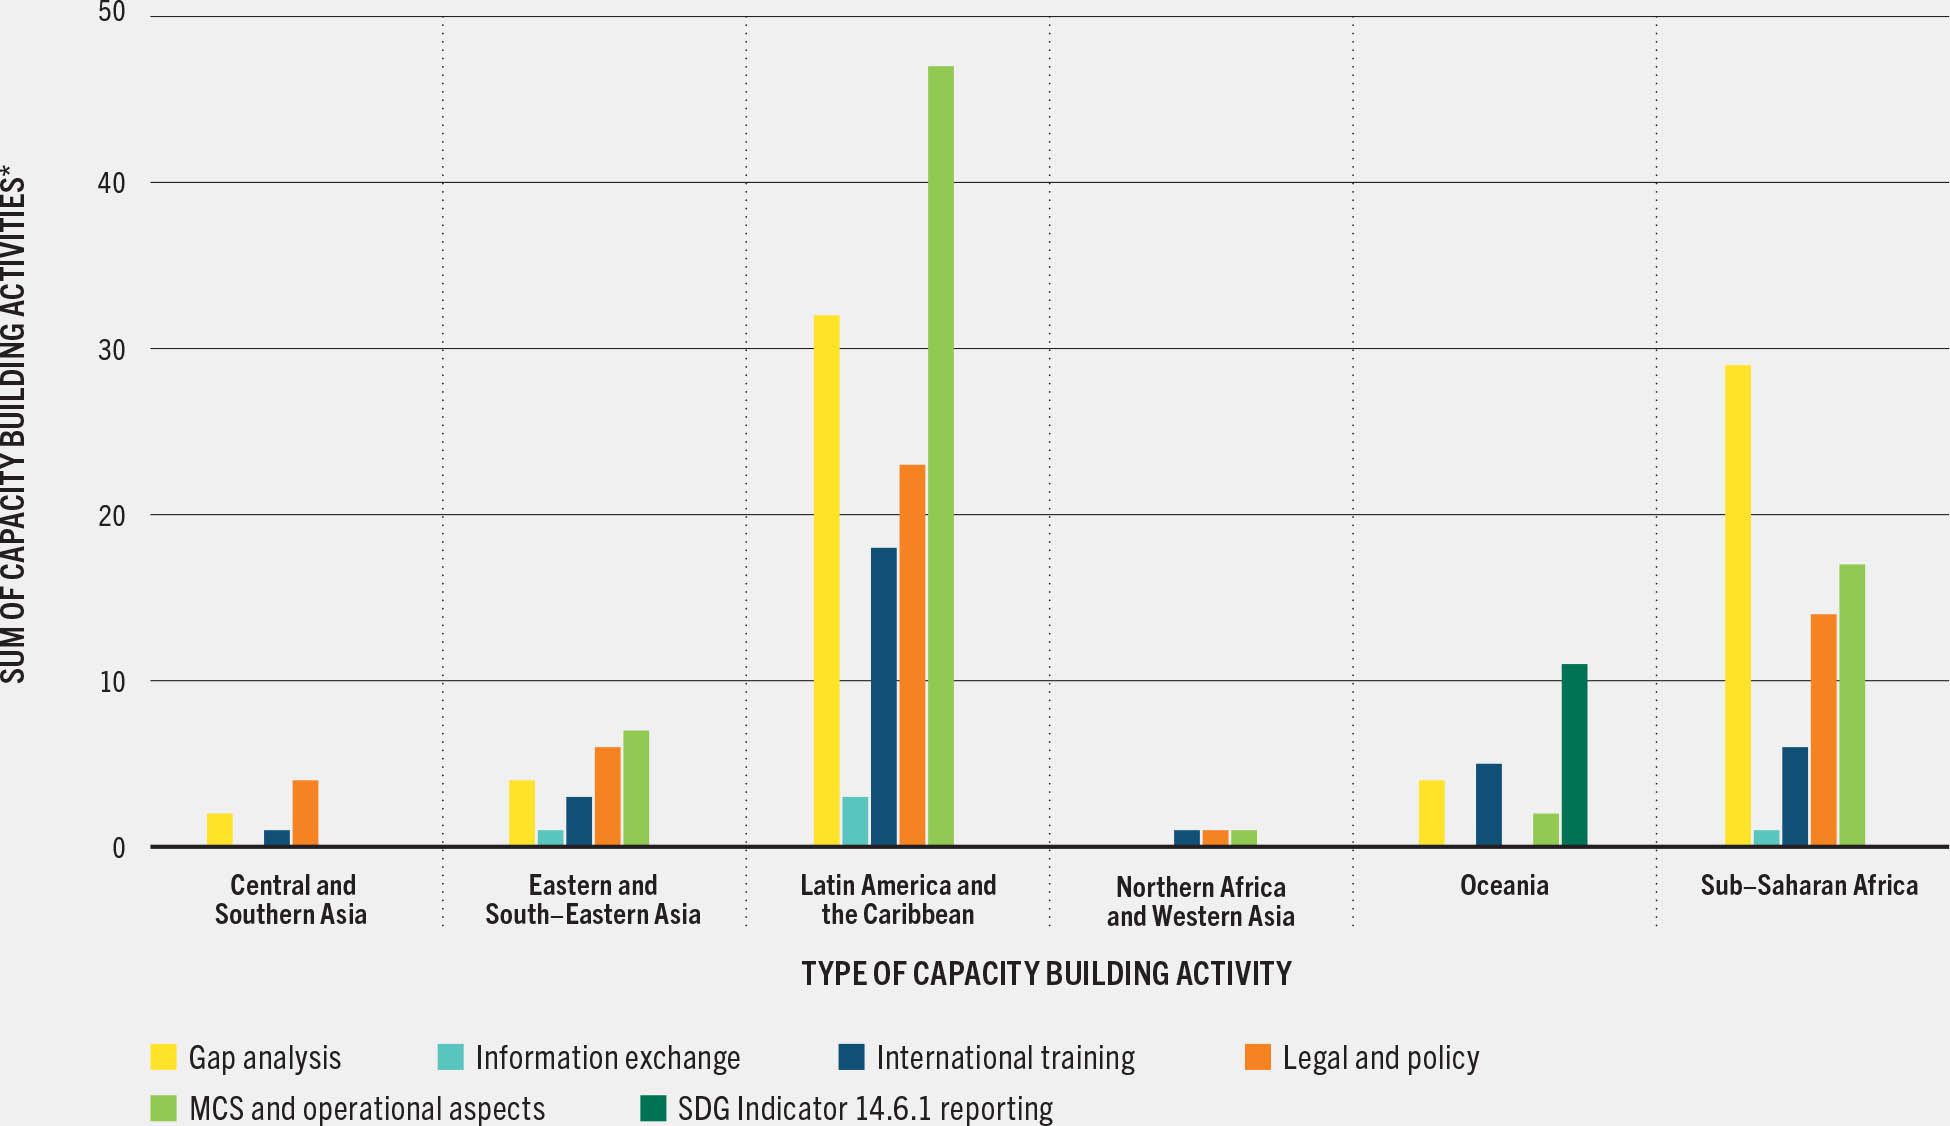
* Total of capacity building activities carried out in countries within each SDG region, by type.
SOURCE: FAO calculations.
Assessing the degree of implementation of international instruments to combat illegal, unreported and unregulated fishing: Indicator 14.6.1
Indicator 14.6.1 measures the degree of implementation by states of six international instruments to combat illegal, unreported and unregulated (IUU) fishing (UNSD, 2024b) by scoring their responses to the questionnaire for monitoring the implementation of the Code of Conduct for Responsible Fisheries and related instruments using a scale of 1 (lowest) to 5 (highest) (FAO, 2020). The average score for implementation of the six instruments by states increased from 3 in 2018 to 4 in 2022, kept throughout the 2024 reporting (see Figure 52, p. 106) with the percentage of states achieving a score of 5 increasing from 48 percent in 2018 to 56 percent in 2022 and 2024. Reporting rates for this indicator increased from 90 in 2022 to 101 states in 2024, enabling more representative figures globally and for certain regions (Table 12) (FAO, 2024d).
FIGURE 52PROGRESS IN THE DEGREE OF IMPLEMENTATION OF INTERNATIONAL INSTRUMENTS AIMED AT COMBATING IUU FISHING BY REGION, 2018–2024 (SDG INDICATOR 14.6.1)

* Insufficient number of reporting states to create an aggregated score for this regional grouping in 2022.
SOURCE: For the bar chart data: UNSD. (forthcoming). SDG Indicators Database. https://unstats.un.org/sdgs/
Key developments relevant to Indicator 14.6.1 have occurred with the adoption in 2022 of the FAO Voluntary Guidelines on Transshipment (see Box 22, p. 148) and the World Trade Organization (WTO) Agreement on Fisheries Subsidies (see The WTO Agreement on Fisheries Subsidies, the sustainability of fishery stocks and the role of FAO, p. 168), and the launch in 2023 of the Global Information Exchange System (GIES), allowing states to exchange compliance information on fishing vessels (see Progress in implementing the FAO Port State Measures Agreement, p. 146). These instruments have enhanced further the international efforts to combat IUU fishing. The FAO Global Capacity Building Programme (Figure 51b) has expanded its technical assistance to support states, including Small Island Developing States (SIDS), improve reporting on Indicator 14.6.1, and develop legal and policy, monitoring, control and surveillance operations, training, and electronic information exchange.
Monitoring sustainable fisheries as a driver of economic change: Indicator 14.7.1
Fisheries and aquaculture can be driving forces for economic development, food security and livelihoods. The sector has seen continuous growth over the past decade, with a 38 percent increase in value added between 2011 and 2021 (UNSD, 2024c).
During this period, Indicator 14.7.1, which measures the value of sustainable fisheries as a percentage of national GDP (UNSD, 2024d), has experienced a gradual decline. Figures for 2021 indicate that sustainable fisheries value accounted for 0.092 percent of global GDP, down from 0.097 percent in 2019 and 0.11 percent in 2011 (FAO, 2024e). Certain drivers of this change are exogenous to the indicator itself – for example, growth in other sectors of the economy causing a reduction in the relative importance of primary sectors in national economies, including fisheries. Other factors are endogenous, with a decline in stock sustainability in certain FAO Major Fishing Areas contributing to lower sustainability multipliers for a number of fisheries.
Global fisheries are distinctive in their specific context and intricately interconnected as trade, shared ecosystems and the transboundary nature of many stocks form a complex web. As such, it is important to consider not only the global trend of the indicator but also the national and regional contexts of these figures. Despite a marginal decline globally, fisheries and aquaculture remain essential to many economies throughout the world, especially in least developed countries (LDCs), where contributions to GDP are far above the global average (Figure 53). Sub-Saharan Africa has seen a growing contribution of sustainable fisheries to GDP, from 0.27 percent in 2011 to 0.42 percent in 2021. Similarly, in SIDS, the contribution rose from 0.46 percent in 2019 to 0.51 percent by 2021. Pacific SIDS – among the most reliant on fisheries worldwide – saw the percentage of GDP linked to sustainable fisheries climb from 1.54 percent in 2019 to 1.63 percent in 2021. This growth highlights the sector’s potential as a catalyst for economic development despite facing challenges of diminishing returns in other regions of the world, notably in LDCs.
FIGURE 53VALUE OF SUSTAINABLE FISHERIES AS A PERCENTAGE OF COUNTRIES’ GDP BY SDG REGION OR GROUPING (SDG INDICATOR 14.7.1)

SOURCE: For the bar chart data: UNSD. 2024. SDG Indicators Database. [Accessed on 1 June 2024]. https://unstats.un.org/sdgs/
The existing framework for evaluating Indicator 14.7.1 (FAO, 2020) establishes a global benchmark for analysing the sector while also aiming for progressive methodological improvement and developing parallel indicators, as appropriate. Box 8 explores one example of enhancing sustainability reporting and interlinkages between Indicator 14.4.1 and Indicator 14.7.1.
BOX 8ENHANCING SUSTAINABILITY REPORTING AND INTERLINKAGES BETWEEN SDGS: INTEGRATION OF INDICATOR 14.4.1 WITH INDICATOR 14.7.1
The interconnected nature of the Sustainable Development Goals (SDGs) makes them indivisible by nature, with progress in one area impacting advancements in others. It also strongly emphasizes integrated approaches, with results from related indicators being jointly evaluated whenever possible to allow a comprehensive analysis of the impacts and trade-offs between different development pathways.
In the context of SDG 14 (Life below Water), the mutual dependence of fisheries on the biological sustainability of stocks and the economic viability of the sector has long been acknowledged when formulating development frameworks. Progress in developing reporting capacity for sustainability indicators such as Indicator 14.4.1 gives rise to the opportunity for the further examination of their integration into other international measures, particularly indicators such as 14.7.1 which already seek to take an integrated approach considering economic and biological sustainability.
The current methodology for estimating Indicator 14.7.1 provides an international baseline for assessing the economic value of sustainable fisheries, adjusting dividends from the sector by the biological sustainability of fishery stocks using a sustainability multiplier. This adjustment is currently based on the regional stock status by FAO Major Fishing Area, which provides a representative assessment of fishery stocks. Current work under Indicator 14.4.1 provides a pathway for improving the periodic assessment of fishery stocks, not only by improving data quality but also by enabling harmonized international monitoring at the national level. This development, providing greater granularity of data on stock status, could potentially have positive implications for estimating the sustainability of marine capture fisheries and the multiplier for stock sustainability used in Indicator 14.7.1.
The integration of a high-quality national stock status indicator for the rationalization of the interplay between stock sustainability and economic dividends from fisheries should be pursued in order to enhance reporting of national contexts that differ within the same FAO area. To this end, pilot projects will be undertaken to integrate available figures for Indicator 14.4.1 into the sustainability multiplier for Indicator 14.7.1, allowing for a comparison of the two approaches and analysis of the resulting trends.
Assessing the degree of recognition and protection of access rights for small-scale fishers: Indicator 14.b.1
Indicator 14.b.1 measures the progress by countries in the degree of application of a legal/regulatory/policy/institutional framework that recognizes and protects access rights for small-scale fisheries (UNSD, 2024e). The indicator scores are provided by FAO Members when responding to three questions in the CCRF online questionnaire (FAO, 2020). The first feature of the indicator score explores legislation or policies in place that specifically target or address small-scale fisheries. The second feature assesses concrete action in support of small-scale fisheries, in line with the Voluntary Guidelines for Securing Sustainable Small-Scale Fisheries (SSF Guidelines). The third feature measures participation of small-scale fisheries actors in decision-making.
The global average of the indicator score generated from countries reporting in 2024 showed a decline in the level of implementation from 5 in 2022 to 4 in 2024, with 54 percent of reporting states scoring 5 in 2024 (FAO, 2024f). This decline may represent more the global average score given a slight increase in total reporting countries in 2024 from 2022 (Table 12). Regionally, reporting rates of sub-Saharan Africa, and of Northern Africa and Western Asia nearly doubled in 2024 from 2022. The lower indicator score of the Northern Africa and Western Asia region may have influenced the global score. Only Europe and Northern America reported full achievement in 2024 (Figure 54).
FIGURE 54PROGRESS IN THE DEGREE OF APPLICATION OF A LEGAL/REGULATORY/POLICY INSTITUTIONAL FRAMEWORK WHICH RECOGNIZES AND PROTECTS ACCESS RIGHTS FOR SMALL-SCALE FISHERIES BY REGION, 2018–2024 (SDG INDICATOR 14.B.1)

* Insufficient number of reporting states to create an aggregated score for this regional grouping in 2022.
SOURCE: For the bar chart data: UNSD. (forthcoming). SDG Indicators Database. https://unstats.un.org/sdgs/
As Indicator 14.b.1 moves close to its target, requests from countries for further support continue. A dedicated legislation and policy online database, SSF-LEX, provides country profiles with information on small-scale fisheries. Thirteen profiles are available,z and more are expected to be published throughout 2024.
Support to concretely implement at national level the SSF Guidelines is progressing as five countriesaa have already developed National Plans of Action for Small-Scale Fisheries (NPOAs-SSF) since 2021 and two countriesab are developing or finalizing their plans in 2024.
With the third feature of the indicator score determined by the measurement of the participation of small-scale fisheries actors in decision-making, co-management is one expression of such participation and some related evidence for this has been compiled and analysed for the Illuminating Hidden Harvests global study.ac It found that for every 10 tonnes of small-scale fisheries catch, 4 tonnes are formally governed through co-management, but co-management is actually implemented for only 2 of these tonnes. Countries with NPOAs-SSF have prioritized fishers’ empowerment and improving governance, including putting in place effective and applicable co-management frameworks. New national small-scale fisheries organizations such as national chapters of the regional African Women Network of Fish Processors and Traders and of the Ibero-American Small-Scale Artisanal Fishing Network illustrate the readiness of small-scale fisheries actors to engage.
To strengthen capacities to achieve Target 14.b more broadly, countries have been supported in relation to enhanced post-harvest practices for improved food safety, quality standards and marketability of products, as well as organizational development of small-scale fishers on governance,ad leadership skills, gender transformative approaches and business management. Mappings of women’s small-scale fisheries organizations on their capacities, including challenges and opportunities, are available for seven countries,ae and can inform future capacity development and action towards achieving Target 14.b and Indicator 14.b.1.
Conclusion
Overall, there has been good progress in the adoption of the SDG 14 monitoring and reporting framework by countries across the biological, social and economic sustainability dimensions covered by the four fisheries indicators under FAO custodianship. FAO has successfully supported the development of the indicators, their monitoring and reporting methodologies and related capacity development. The FAO Programme Committee’s evaluation of the Organization’s role in supporting SDG 14 is positive (FAO, 2023a).
Full implementation and reporting by Members are works in progress and challenges remain, especially for developing countries. Indicators 14.6.1 and 14.b.1, which are close to reaching their target, testify to a general uptake of international policies and guidelines by countries,
however, there remains much to do in terms of implementation on the ground. Moreover, good reporting by certain countries should not distract attention from those countries still unable to report, many being LDCs and SIDS. The improved 2024 reporting rate for these two groups may nonetheless send a positive signal (Figure 55). Regarding Indicator 14.4.1, while noticeable progress is generally observed on the rate and quality of reporting, several countries – particularly SIDS – struggle to meet the requirements for data collection and analysis due to insufficient technical capacity.
FIGURE 55REPORTING RATES RECORDED FOR SDG INDICATORS 14.4.1, 14.6.1 AND 14.B.1 BETWEEN 2018 AND 2024 ACCORDING TO UNSD GROUPINGS

SOURCES: For the donut chart data: UNSD. (forthcoming). SDG Indicators Database. https://unstats.un.org/sdgs/
For UNSD groupings: UNSD. 2024. SDG Indicators. Regional groupings used in Report and Statistical Annex. In: United Nations. New York. [Cited 19 April 2024]. https://unstats.un.org/sdgs/indicators/regional-groups/
Indicator 14.7.1 data show that SIDS are most reliant on sustainable fisheries, highlighting the sector’s role to catalyse economic development. Their lower reporting rate should be a major concern to the global community to ensure that no one is left behind.
This situation calls for urgent mobilization and support to upscale FAO’s programme on SDG Target 14.4 to build the capacity of countries most in need and adapt reliable methodologies for their specific contexts.
- x The full declaration of the High-Level Political Forum on Sustainable Development convened in 2023 under the auspices of the General Assembly is available at: https://hlpf.un.org/sites/default/files/2023-09/A%20HLPF%202023%20L1.pdf?_gl=1*krm5r*_ga*Mjc5NDQ5NDA4LjE2MDMxNDUzNDU.*_ga_TK9BQL5X7Z*MTY5NjM0NTIzNi4xMjEuMS4xNjk2MzQ3Nzk1LjAuMC4w
- y In 2022 (and 2019 respectively), an average of 61.6 (53.4) percent of stocks within biological sustainable levels was estimated from reports of 46 (31) countries which passed the second level of the quality assurance process; these estimates are preliminary awaiting the expansion of the number of countries and further adjustments to the quality assurance methodology.
- z As at April 2024, profiles are available for Albania, Cabo Verde, Gambia, Ghana, Morocco, Namibia, Oman, Senegal, Solomon Islands, South Africa, Togo, Tunisia and Turkiye at: https://ssflex.fao.org/
- aa United Republic of Tanzania (2021), Namibia (2022), Madagascar, Malawi and Uganda (2023).
- ab Indonesia and the Philippines.
- ac See: https://www.fao.org/voluntary-guidelines-small-scale-fisheries/ihh/en/
- ad See, for example, the FAO elearning Academy course on Governance in small-scale fisheries available at: https://elearning.fao.org/course/view.php?id=907
- ae Ghana, Indonesia, Madagascar, Malawi, Philippines, Sierra Leone and Uganda.


