


- ➔ A novel true cost accounting analysis of 154 countries provides preliminary estimates of the “quantified hidden costs” of agrifood systems. Referring to them as “quantified” acknowledges the data gaps in many countries that prevent the estimation of all hidden costs, such as those associated with pesticide exposure and land degradation.
- ➔ The analysis finds that the global (environmental, social and health) quantified hidden costs of agrifood systems were approximately 12.7 trillion dollars at purchasing power parity (PPP) in 2020, equivalent to almost 10 percent of world GDP in PPP terms.
- ➔ Even taking uncertainty into account, global quantified hidden costs have a 95 percent chance of being 10 trillion 2020 PPP dollars or more, highlighting the undeniably urgent need to factor these costs into decision-making to transform agrifood systems.
- ➔ Globally, 73 percent of the quantified hidden costs in 2020 were associated with dietary patterns that led to obesity and non-communicable diseases (NCDs), causing labour productivity losses.
- ➔ The quantified environmental hidden costs from agriculture, accounting for more than 20 percent of quantified hidden costs, are equivalent to almost one-third of agricultural value added.
- ➔ On the social side, it is estimated that the incomes of the moderately poor working in agrifood systems need to increase by, on average, 57 percent in low-income countries and 27 percent in lower-middle-income countries, to ensure they are above the moderate poverty line, thus reducing food insecurity and undernourishment.
- ➔ Finding that unhealthy dietary patterns are the main contributor to global hidden costs should not steer attention away from the environmental and social hidden costs. Rather, it emphasizes the importance of repurposing support to transform agrifood systems to deliver healthy and environmentally sustainable diets to all.
- ➔ The quantified hidden costs pose a greater burden relative to national income in low-income countries, where they are equivalent, on average, to 27 percent of GDP (in large part due to poverty and undernourishment), compared with 11 percent in middle-income countries and 8 percent in high-income countries. Addressing poverty and undernourishment remains a priority in low-income countries.
- ➔ These preliminary results suggest there is considerable variation from country to country in the relative importance of environmental, social and health hidden costs, underscoring the need to produce national estimates of hidden costs and improve them with country-specific information, so they can be a useful input in decision- and policymaking processes.
As mentioned in Chapter 1, underpinning the unsustainability of agrifood systems are costs that are hidden behind price tags and go unaccounted for by agrifood systems actors. These hidden costs – including water pollution, biodiversity loss and NCDs – are driven by negative externalities and other market failures (or their spillovers), as well as by policy and institutional failures. The key to transitioning agrifood systems towards sustainability is to measure and value these hidden costs across the environmental, social and health dimensions.
Economic costs pertaining to produced capital, in contrast, are commonly included in economic assessments, so are already visible. Accounting for hidden costs requires a comprehensive approach that captures the complexity and interdependence of agrifood systems actors, activities and impacts. Chapter 1 introduces true cost accounting (TCA) as a fitting approach to identify these hidden costs. However, such an approach is often hampered by data gaps, methodological limitations and institutional barriers. Moreover, there are insufficient common metrics and indicators to enable comparison and aggregation at different dimensions and geographical scales (local, national, regional and global).
To counter these challenges, Chapter 1 proposes a two-phase process for analysing and quantifying the hidden costs of agrifood systems across the different capitals (see Figure 3). This chapter serves as a starting point for the first phase of this two-phase process by conducting preliminary national-level quantification of the hidden costs of agrifood systems for 154 countries. It uses various national-level datasets – including FAO’s Corporate Database for Substantive Statistical Data (FAOSTAT), the World Bank’s World Development Indicators, the Global Burden of Disease database and the Ecosystem Services Valuation Database.c
Quantification involves combining impact modelling with monetary estimates to value (monetize) the hidden costs. This enables the results to be aggregated and compared at different dimensions and geographical scales and to be used as a foundation for dialogue with decision-makers. In this exercise, both hidden costs and benefits are factored in as much as possible. For simplicity, the term “hidden costs” refers to net hidden costs in a given dimension, with hidden benefits expressed as negative hidden costs. An example of a negative hidden cost in the climate change dimension would be a farmer’s conversion of pastureland or cropland to forestland: while this reduces GHG emissions, the farmer does not receive compensation for it.
It is important to note that, despite their importance in generating national dialogue, the estimates presented in this chapter are just a first step in facilitating the two-phase process. These preliminary estimates of the hidden costs of national agrifood systems are only one possible starting point for the first phase, which aims to create an understanding of the big picture of how agrifood systems function and the challenges they face. Such an understanding is advisable before moving to the second phase, which is dedicated to more in-depth national (and subnational) analysis. Depending on the context, phase two assessments may be conducted without an initial quantification of hidden costs across all capitals at national level. This quantification, however, creates an unprecedented opportunity to support decision-makers worldwide in pinpointing the broad (hidden) challenges faced by their systems and initiate a process to construct a joint vision for agrifood systems transformation.
Despite the value of monetization in revealing the relative magnitude of hidden costs across different agrifood systems outcomes and in expressing the (upper bound of the) benefits of improving those same outcomesd – for example, reducing hunger, malnutrition, obesity, food waste, GHG emissions and biodiversity loss – monetary valuation also poses multiple challenges and limitations. First, some aspects of human well-being or natural capital are intangible, priceless or irreplaceable, so it is impossible or undesirable to assign a monetary value to them. Examples include cultural identity, recreation and social relations. Furthermore, valuing the loss of an individual human life raises a moral dilemma. What seems more defensible is to value the loss of productivity and income arising from illness or decreased life expectancy, thus valuing the "economic component" – and the economic component alone – of health outcomes, for example.3
With regard to food's intangible value, such as cultural identity associated with agrifood systems, the report acknowledges that such benefits are important, even if not monetized. The value to society of agrifood systems is probably well beyond that measured as its value added to GDP. However, the focus here is on how to transform agrifood systems so that they deliver even greater value to society. The challenge, therefore, lies in how to transform agrifood systems so as to mitigate the hidden costs and enhance the benefits that can be quantified. Accounting for the hidden impacts of these systems is a first crucial step.
Against this backdrop, this chapter provides a first estimate of the (environmental, social and health) hidden costs of national agrifood systems for 154 countries. It further clarifies the ways in which the estimates presented here are an improvement on existing studies, while recognizing that current estimates are still preliminary and partial, in that they do not capture all the impacts and interdependencies of agrifood systems. Rather, they provide an indicative and illustrative picture of the magnitude and distribution of hidden costs at global, national and income levels and are, therefore, a potential starting point for dialogue with relevant decision-makers. For transparency, the hidden costs estimated herein are referred to as “quantified hidden costs” to acknowledge the data limitations involved.
An improved methodology for estimating the hidden costs of agrifood systems
The hidden costs of agrifood systems affect the well-being of current and future generations and are often borne by those who do not benefit from the economic activities responsible for those costs. By taking a TCA approach, it is possible to make these hidden costs visible and accelerate the transformation of agrifood systems for the better.
Previous studies have attempted to estimate hidden costs at a global level, using values from existing literature. However, combining estimates from different studies with very different underlying assumptions and methodologies – from different future trajectory assumptions to different discount rates, ecosystem service values, disease costs and measures of well-being – comes at the expense of economic rigour and consistency, and only provides estimates at the global level, thus preventing a comparison of national economies.
This year’s The State of Food and Agriculture proposes an improved methodology to value the hidden costs of agrifood systems, based on a model developed by Steven Lord at the University of Oxford Environmental Change Institute for the Food System Economics Commission (FSEC).e, 1 The model was paired with FAOSTAT and other global sources that contain data for multiple countries and time periods on, for example, GHG and nitrogen emissions, land use, the burden of disease from dietary patterns, and poverty. The model thus estimates the annual hidden costs of national agrifood systems across various dimensions for a total of 154 countries.
The estimates of the different hidden cost categories are based on a common set of national growth rates, costs of burden of disease, future economic and demographic conditions, and ecosystem service values; this improves consistency and the ability to perform a sensitivity analysis of costs at different discount rates and costs of disease. Hidden costs are presented as a monetary measure of losses attributable to declines in productivity or to environmental damages that are comparable with GDP PPP, which is based on market transactions. As the modelling is at national level, it allows the aggregation of results at global, regional and income levels.
However, valuing the hidden costs of agrifood systems involves making several assumptions and choices that can affect results and their interpretation. Before analysing the magnitude of the problem, it is necessary to lay out the key assumptions that need to be made for valuing hidden costs and ensuring comparability across cost categories and countries. This is done in the next section, followed by a discussion on how the estimates presented in this report differ – and expand on – previous efforts to estimate the hidden costs of agrifood systems.
Defining the scope of the analysis
The first assumption concerns what parts of agrifood systems and their impacts are included in the analysis and how different economic actors come into play, by either imposing costs on society or bearing them. Figure 5 illustrates the scope of agrifood systems covered by the analysis, as well as the hidden costs considered. The definition of agrifood systems follows that of FAO (2021)5 (see Glossary), with the exception of the inclusion here of (non-food) input supply chains, such as fertilizer. The latter are included to the extent that they produce environmental externalities.
FIGURE 5 Scope of the analysis: agrifood systems stages and pathways through which hidden costs manifest
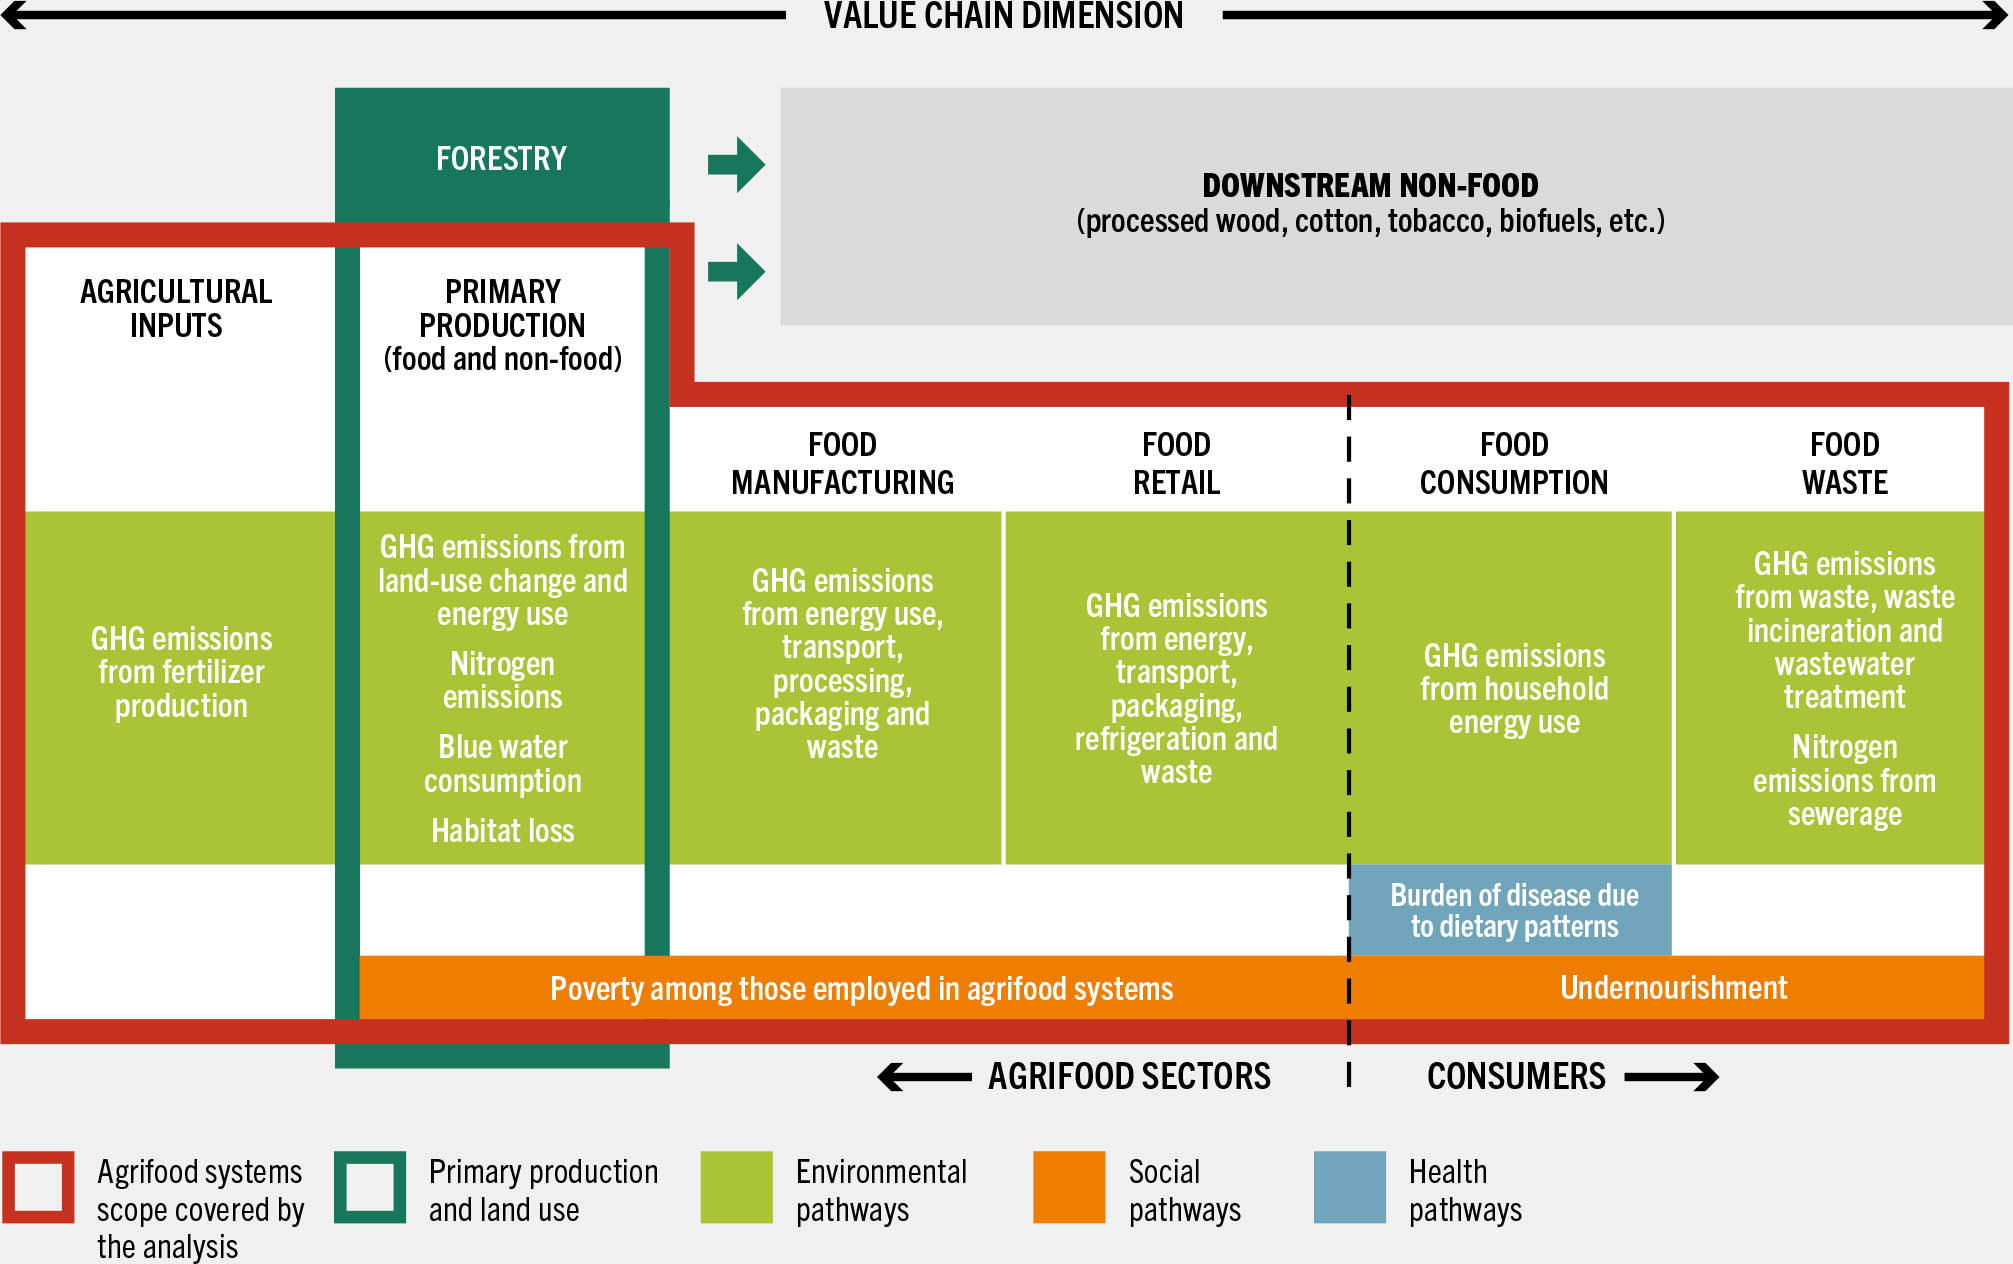
SOURCE: Lord, S. 2023. Hidden costs of agrifood systems and recent trends from 2016 to 2023 – Background paper for The State of Food and Agriculture 2023. FAO Agricultural Development Economics Technical Study, No. 31. Rome, FAO.
The scope of the study is defined in the figure by the solid red border. Beyond agricultural input supply chains, it further includes the stages of primary food production, manufacturing, retail, consumption and waste. Non-food supply chains downstream of primary production (grey box) are excluded from the definition of agrifood systems used herein and, thus, from the analysis. The processing of forestry and non-food products is accounted for in other sectors of the economy, as indicated by the green arrow.
Forestry (dark green box) is also a primary production sector within agrifood systems, which contributes both wood and non-wood forest products. However, it is outside the scope of the analysis, as estimates of the hidden costs associated with forestry-related economic activities, such as logging or the harvesting of non-wood products, were not available. Although this is a limitation, it is not a major one, as in most cases, the changes in the natural capital associated with forests are associated with land-use change, which is included in the analysis. Consequently, in the analysis, deforestation – that is, the conversion of forest to other land use,6 such as pasture – is accounted for as a hidden cost and afforestation as a hidden benefit. The transition between unmanaged and managed forest is not considered, as these are not identified separately in satellite data on land use. This implies, for example, that forest degradation – that is, the long-term reduction of the overall supply of benefits from forests – associated with human activities is not taken into account, even if it is probably increasing and a significant source of emissions (see Box 5).
Box 5Halting forest degradation is crucial to achieving the Sustainable Development Goals, but it is difficult to quantify
Forest degradation reduces the provision of forest goods and services, biodiversity values, productivity and health. It may also negatively affect other land uses (for example, by causing a loss of downstream water quality and affecting groundwater recharge) and be the source of greenhouse gas (GHG) emissions. Consequently, halting forest degradation is a crucial element in reversing the drivers of climate change, biodiversity loss, land degradation, desertification and threats to human health.6
A recent study estimated that, between 2003 and 2019, degradation accounted for 44 percent of forest carbon losses in the Brazilian Amazon, compared with 56 percent from deforestation.7 Human activities including logging, fire, mining and oil extraction – many of them occurring illegally – are increasingly significant drivers of forest degradation and, consequently, emissions in the region. These are being compounded by natural disturbances and the indirect impacts of deforestation. Another study looked at the drivers of forest degradation in developing countries and identified timber extraction and logging as the largest drivers of degradation in Asia and Latin America, responsible for more than 70 percent of all forest degradation. In Africa, in contrast, fuelwood collection and charcoal production are the main sources of degradation, while they are of small to moderate importance in Asia and Latin America.8
Preventing forest degradation is, therefore, important to reducing GHG emissions and preserving vital goods and ecosystem services. Despite its significance, however, it is undervalued in economic assessments, partly because a widely applied definition of forest degradation is unavailable and data are scarce.6 More data are needed to fully assess the costs and benefits of restoration policies and actions. The Global Forest Resources Assessment is a first step towards this goal, with countries asked to indicate the definition of forest degradation they use in assessing the extent and severity of forest degradation.9 Mainstreaming this accounting exercise and making the estimates publicly available will be the next step in ensuring that forest degradation is included in future comprehensive true cost accounting analysis, such as the one done for this report.
That being said, the analysis covers costs from GHG emissions, nitrogen emissions, blue water use, land-use transitions, and poverty, as well as productivity losses from dietary patterns, and undernourishment. Due to data gaps, pesticide exposure and land degradation are not considered. It is important to note that hidden costs differ from abatement costs; the latter refer to the costs incurred to avoid or reduce hidden costs, while hidden costs estimate the costs of inaction. Even though both hidden and abatement costs are needed for informed decision-making to transform agrifood systems, due to the difficulty of envisioning abatement actions for a large number of countries and costing them in a comparable and consistent manner, only the former are partially included in this analysis.
The quantified hidden costs presented in this report are generated by agrifood systems activities through three main pathways, identified using different colours in Figure 5:
- Environmental (green box) – as a result of (i) GHGs emitted along the entire food value chain from food and fertilizer production and energy use, which contribute to a changing climate and, consequently, agricultural losses; (ii) nitrogen emissions at primary production level and from sewerage; (iii) blue water use, causing water scarcity and, in turn, agricultural losses and labour productivity losses from resulting undernourishment; and (iv) land-use change at farm level, causing ecosystem degradation and destruction and, thus, loss of environmental services.
- Social (orange box) – associated with (i) distributional failures of available food supply, resulting in undernourishment in national populations (as defined by FAO et al. [2022]),10 leading to labour productivity losses as estimated by the World Health Organization (WHO);11 and (ii) moderate poverty among agrifood workers due to distributional failures in agrifood systems. Recalling Chapter 1, a distributional failure captures a situation where public policies fail to guarantee a minimum level of decent income despite the availability of resources to do so. It can be interpreted as the amount society would pay for the elimination of the economic damages of poverty, assuming such a payment were cost effective up to the international moderate poverty line.
- Health (blue box) – as a result of consuming unhealthy diets, which are typically low in fruits, vegetables, nuts, wholegrains, calcium and protective fats, and high in sodium, sugar-sweetened beverages, saturated fats and processed meat.f These diets are associated with obesity and NCDs, leading to productivity losses, negatively impacting the economy.1 Consumption of unhealthy diets may be due to constrained economic and/or physical access to a variety of nutritious foods. For example, estimates from 2019 find that healthy diets were out of reach for approximately 3 billion people and up to 1 billion people are at risk of losing access to healthy diets if a shock to real incomes occurs.12, 13 Consumption may also be influenced by a variety of individual (for example, preferences, knowledge, motivations), social (for example, traditions, social norms and pressures) and commercial (for example, food promotion, placement and advertising, cultural factors) considerations.10
It is important to distinguish pathways from impacts. A pathway captures the drivers of an impact and can therefore provide entry points for action to address said impact. To illustrate, a hidden cost may be generated through an environmental pathway but its negative consequences manifest beyond the environment. Water pollution is a case in point: it negatively impacts the environment through the loss of ecosystem services, but also health through burden of disease from intake of polluted water. These two negative impacts, however, are considered environmental hidden costs because both are generated through an environmental pathway, and therefore the entry point for addressing them remains within the environmental domain.g
For this reason, unhealthy dietary patterns and undernourishment are considered health and social hidden costs, respectively, despite both relating to diet and food consumption. For the purpose of this analysis, unhealthy dietary patterns indicate the combination of foods associated with increased obesity and NCDs.14 Diets that do not meet the minimum caloric intake and result in energy–protein malnutrition are instead captured through the hidden costs from undernourishment.h Both result in productivity losses affecting national economies, but the drivers differ significantly. Undernourishment is driven by extreme deprivation, limiting access to even a basic energy-sufficient diet due to distributional failures. The hidden costs generated by unhealthy dietary patterns, on the other hand, are due to the consumption of too many calories – or of calories in the wrong proportions – a behaviour that is driven by a combination of economic, social, cultural and individual factors. For this reason, hidden costs from unhealthy dietary patterns are linked to the health dimension, while those from undernourishment fall under the social dimension, alongside poverty, which is also a result of distributional failure. For example, a recent analysis of 136 countries shows that addressing undernourishment can be achieved through income distributional policies, as the cost of an energy-sufficient diet is far below the average per capita disposable income for food in almost all countries.13 However, addressing unhealthy dietary patterns requires a range of transformative actions in agrifood systems.
It is also important to note that direct costs, such as treatment costs, whether caused by unhealthy dietary patterns or undernourishment, are excluded. These are typically visible economic exchanges within the economy and, therefore, not considered a hidden cost.
In sum, agrifood systems activities lead to hidden costs that place a burden on national economies and that can be compared with GDP. These hidden costs are evaluated as agricultural losses, productivity losses and losses of ecosystem services through three different pathways. The hidden costs along the food value chain refer to both physical attribution and financial distribution failures. The former is exemplified by where the environmental impacts occur (Figure 5, in green) along a value chain, while an example of the latter is the income shortfall to the moderate poverty line for agrifood workers, despite substantial downstream profits for wholesalers, processors and retailers of food products. Along the same lines is the distributional failure leading to caloric deficiency of the undernourished, despite large surpluses in available global calories (Figure 5, in orange). As noted before, some important parts of these hidden costs are not captured in the analysis due to data constraints. This has implications for the interpretation of the results, as presented and discussed later in the chapter.
It needs to be stressed that the hidden costs quantified here are only part of the story, so overall hidden costs will tend to be underestimated. For example, the hidden costs generated by food consumption are captured by unhealthy dietary patterns only. In other words, the analysis covers only the burden of disease resulting from the consumption of unhealthy diets. Hidden costs generated by, for example, zoonotic diseases or the consumption of unsafe food (food containing microbiological, chemical or physical hazards that cause illness or even death) are not covered due to the lack of a globally harmonized set of figures with national data. However, such costs may be substantial. A recent study suggests that there could be as much as USD 95.2 billion of productivity losses due to unsafe food in low- and middle-income countries. This number is likely to be underestimated because it does not include losses triggered by disruptions to food supply chains due to food safety hazards, when discovered.15
Social hidden costs, or the costs experienced by social capital, are also likely to be underestimated in this report – as expressed by the income gap of the moderately poor plus the productivity losses resulting from the burden of disease caused by undernourishment. For example, the hidden costs generated by birth defects, infant mortality, low birth weight and infectious disease morbidity driven by undernutrition are not covered – despite representing a clear loss to society – as these are challenging to fit into an economic framework focused on economic flows. These unquantified hidden costs can be substantial, especially in low-income countries and some lower-middle-income countries, but only manifest themselves in economic flows once children are grown. Box 6 describes some of these important assumptions, such as those on measurements of well-being, discounting and other aspects of the analysis for this report. For a more comprehensive description of the model, data sources and assumptions undertaken in this analysis, see Annex 1.
Box 6What is behind the numbers in this report?
Estimating the global and national hidden costs of agrifood systems requires clear assumptions, particularly as regards scenarios; discounting to account for future generations; measuring well-being in monetary terms for a reference year to ensure comparability and aggregation; data; and valuation factors.
Discounting helps to account for hidden costs that future generations will bear. The model used to estimate the hidden costs for this report – known as the SPIQ-FS model16 – assumes a business-as-usual socioeconomic pathway (also known as SSP2 – second shared socioeconomic pathway).17 To compare different hidden costs, the data are converted to a common monetary measure of societal welfare loss due to productivity losses. Monetary values are measured in GDP based on PPP for the year 2020, enabling comparability and the aggregation of results across cost categories and economies. This improves the ability to examine trade-offs between cost categories, such as environmental and health costs.
Another central assumption concerns which valuation factors to use, such as how to monetize the impacts of agrifood systems activities. The difference between market prices and shadow prices is important. Market prices are based on visible economic activities and exchanges, while shadow prices reflect the change in the value of an economic activity associated with one more unit of a resource. In this report, shadow prices are used for the marginal valuation of hidden costs, such as water pollution, nitrogen emissions, obesity and malnutrition. These are then compared with national GDP.
Different studies will make different assumptions as to how to value a dimension such as social harm, which is connected to who bears the cost. Here, social hidden costs are expressed as a combination of the impact on productivity of lost labour days associated with undernourishment and the financial transfers that would be needed to avoid moderate poverty of people working in the agrifood sector. The rationale is that these are quantities that are relatable to the economic flows measured by GDP. An alternative used in Food and Land Use Coalition (FOLU) (2019)18 is to measure the impact of undernutrition as proxied by a loss in global disability-adjusted life years (DALYs) related to child growth failure and multiply it by the global average GDP per capita, which is an indirect way of imputing productivity losses.
The most important limitation of this analysis is that data may be incomplete or uncertain for some countries, regions and types of cost. This is especially true for ecosystem services valuations and nitrogen costing, involving large uncertainty, and for the economic consequence of reduced environmental flows, for which a lack of global data limits the estimation of costs of blue water use. In some cases, the modelling of issues such as soil erosion and antimicrobial resistance is not available, making the analysis less comprehensive in the costs considered.
Ultimately, the assumptions used in true cost accounting analyses, such as those on well-being, discount rates, and reference year, alongside the use of different data sources, will invariably result in a fundamental variation in estimates of hidden costs of agrifood systems. Yet, the model used for this report relies on shared assumptions about national growth rates, costs of burden of disease, future economic and demographic conditions, and ecosystem service values, allowing for better consistency and an ability to perform sensitivity analyses at different discount rates and disease costs. Furthermore, the historical cost data used in the model allow the expression of the inherent uncertainty in hidden costs as probability distributions and the reflection of the range of possible values and outcomes.
Overall, the work prepared for this report should be seen as part of a broader process, whereby the estimates presented should be considered preliminary and serve mostly to contribute to the first phase of the proposed two-phase assessment. Even if preliminary and incomplete, they should help spark a dialogue with decision-makers about the magnitude of the hidden costs of agrifood systems and how these relate to countries’ priorities.
Comparing the newer estimates with previous studies of the hidden costs of agrifood systems
There have been various attempts to estimate the hidden costs associated with global agrifood systems. A previously mentioned 2019 study by the World Bank estimated the hidden costs of foodborne diseases (from unsafe food) in low- and middle-income countries and found these to amount to USD 95.2 billion.15 Another prominent study by Springmann (2020),19 developed as a background paper for FAO et al. (2020),14 estimated health- and climate-related hidden costs by the year 2030 and 2050. The study used dietary patterns as a lens and considered four alternative healthy dietary patterns to measure by how much hidden costs would be reduced compared with current dietary patterns. Neither study, however, covers all hidden cost dimensions (environmental, social and health). Springmann (2020), for example, despite covering 157 countries, excluded the social dimension, as well as important environmental and health hidden costs.
To date, only two other studies have attempted to estimate the hidden costs of global agrifood systems in a more comprehensive way and are, thus, the focus of this section: FOLU (2019)18 and Hendriks et al. (2023).20 Table 1 compares the two relevant studies with the methodology used for this report. It details the different cost categories and how these were estimated, reports the total quantified hidden costs obtained and indicates whether a measure of well-being and future projection were specified. By highlighting which hidden costs are quantified in the studies, the table also allows for transparency with regard to which costs are excluded from the analyses.
TABLE 1 COMPARING EXISTING STUDIES ON THE GLOBAL HIDDEN COSTS OF AGRIFOOD SYSTEMS
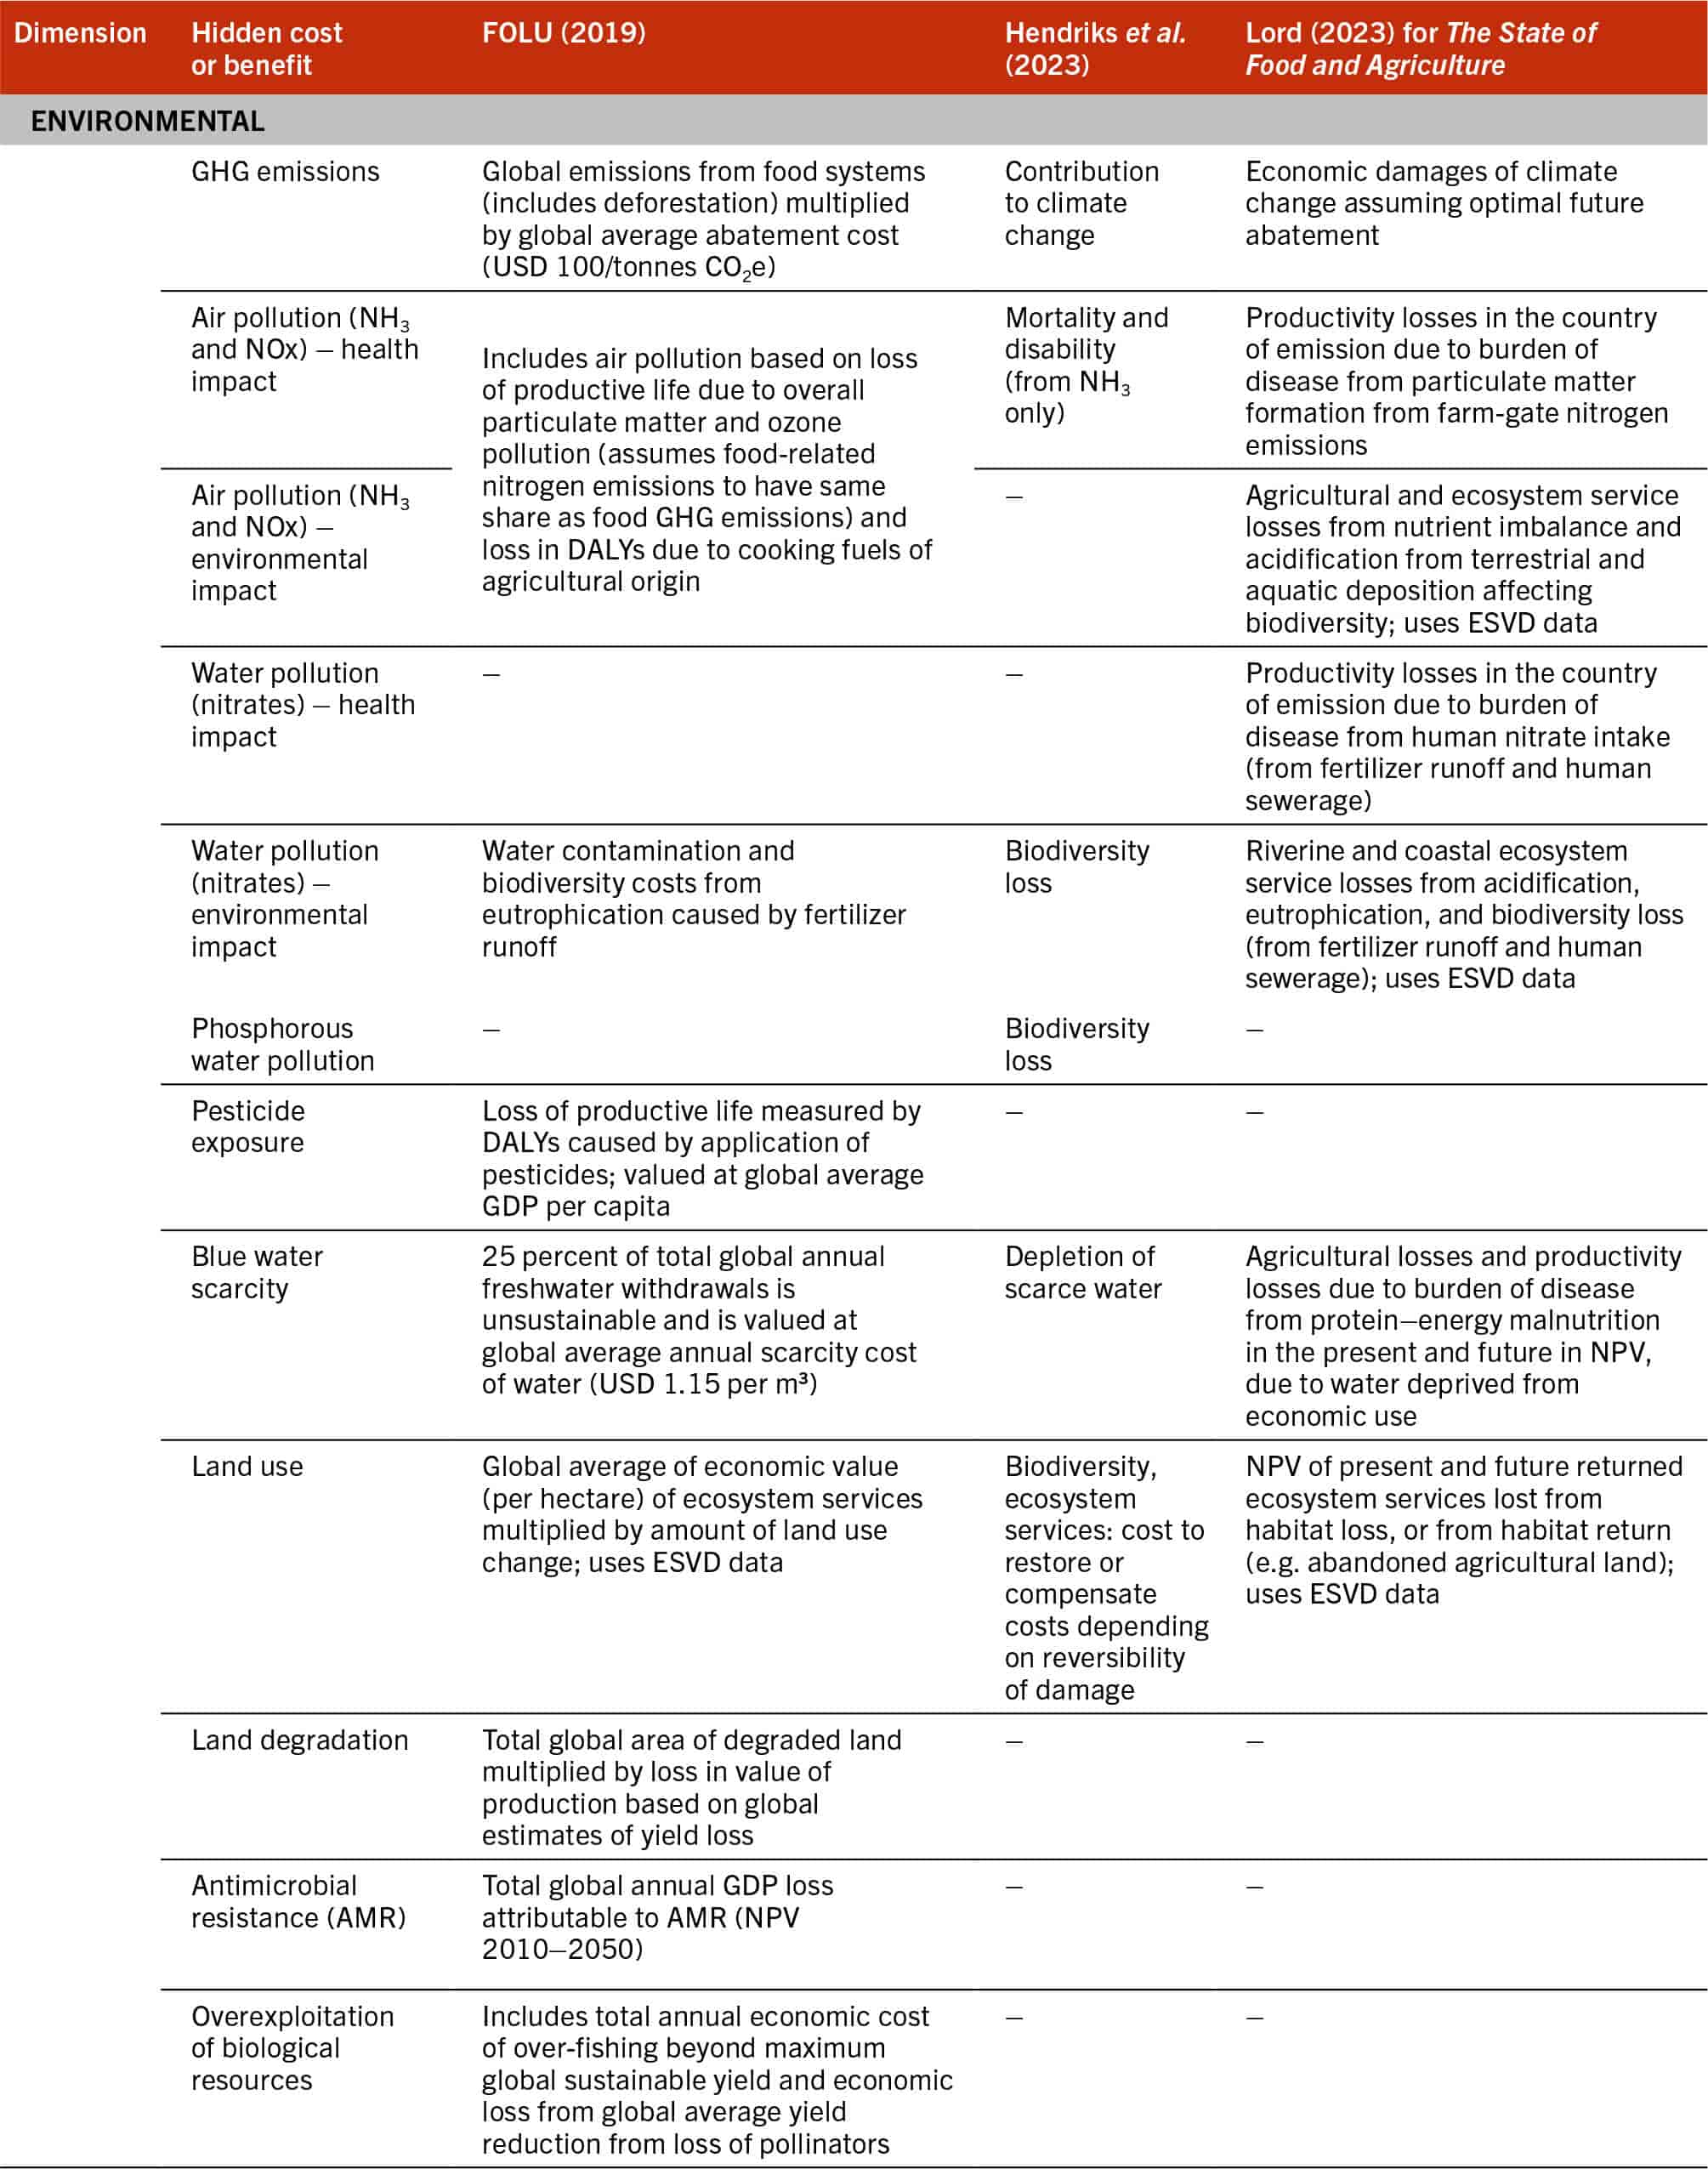
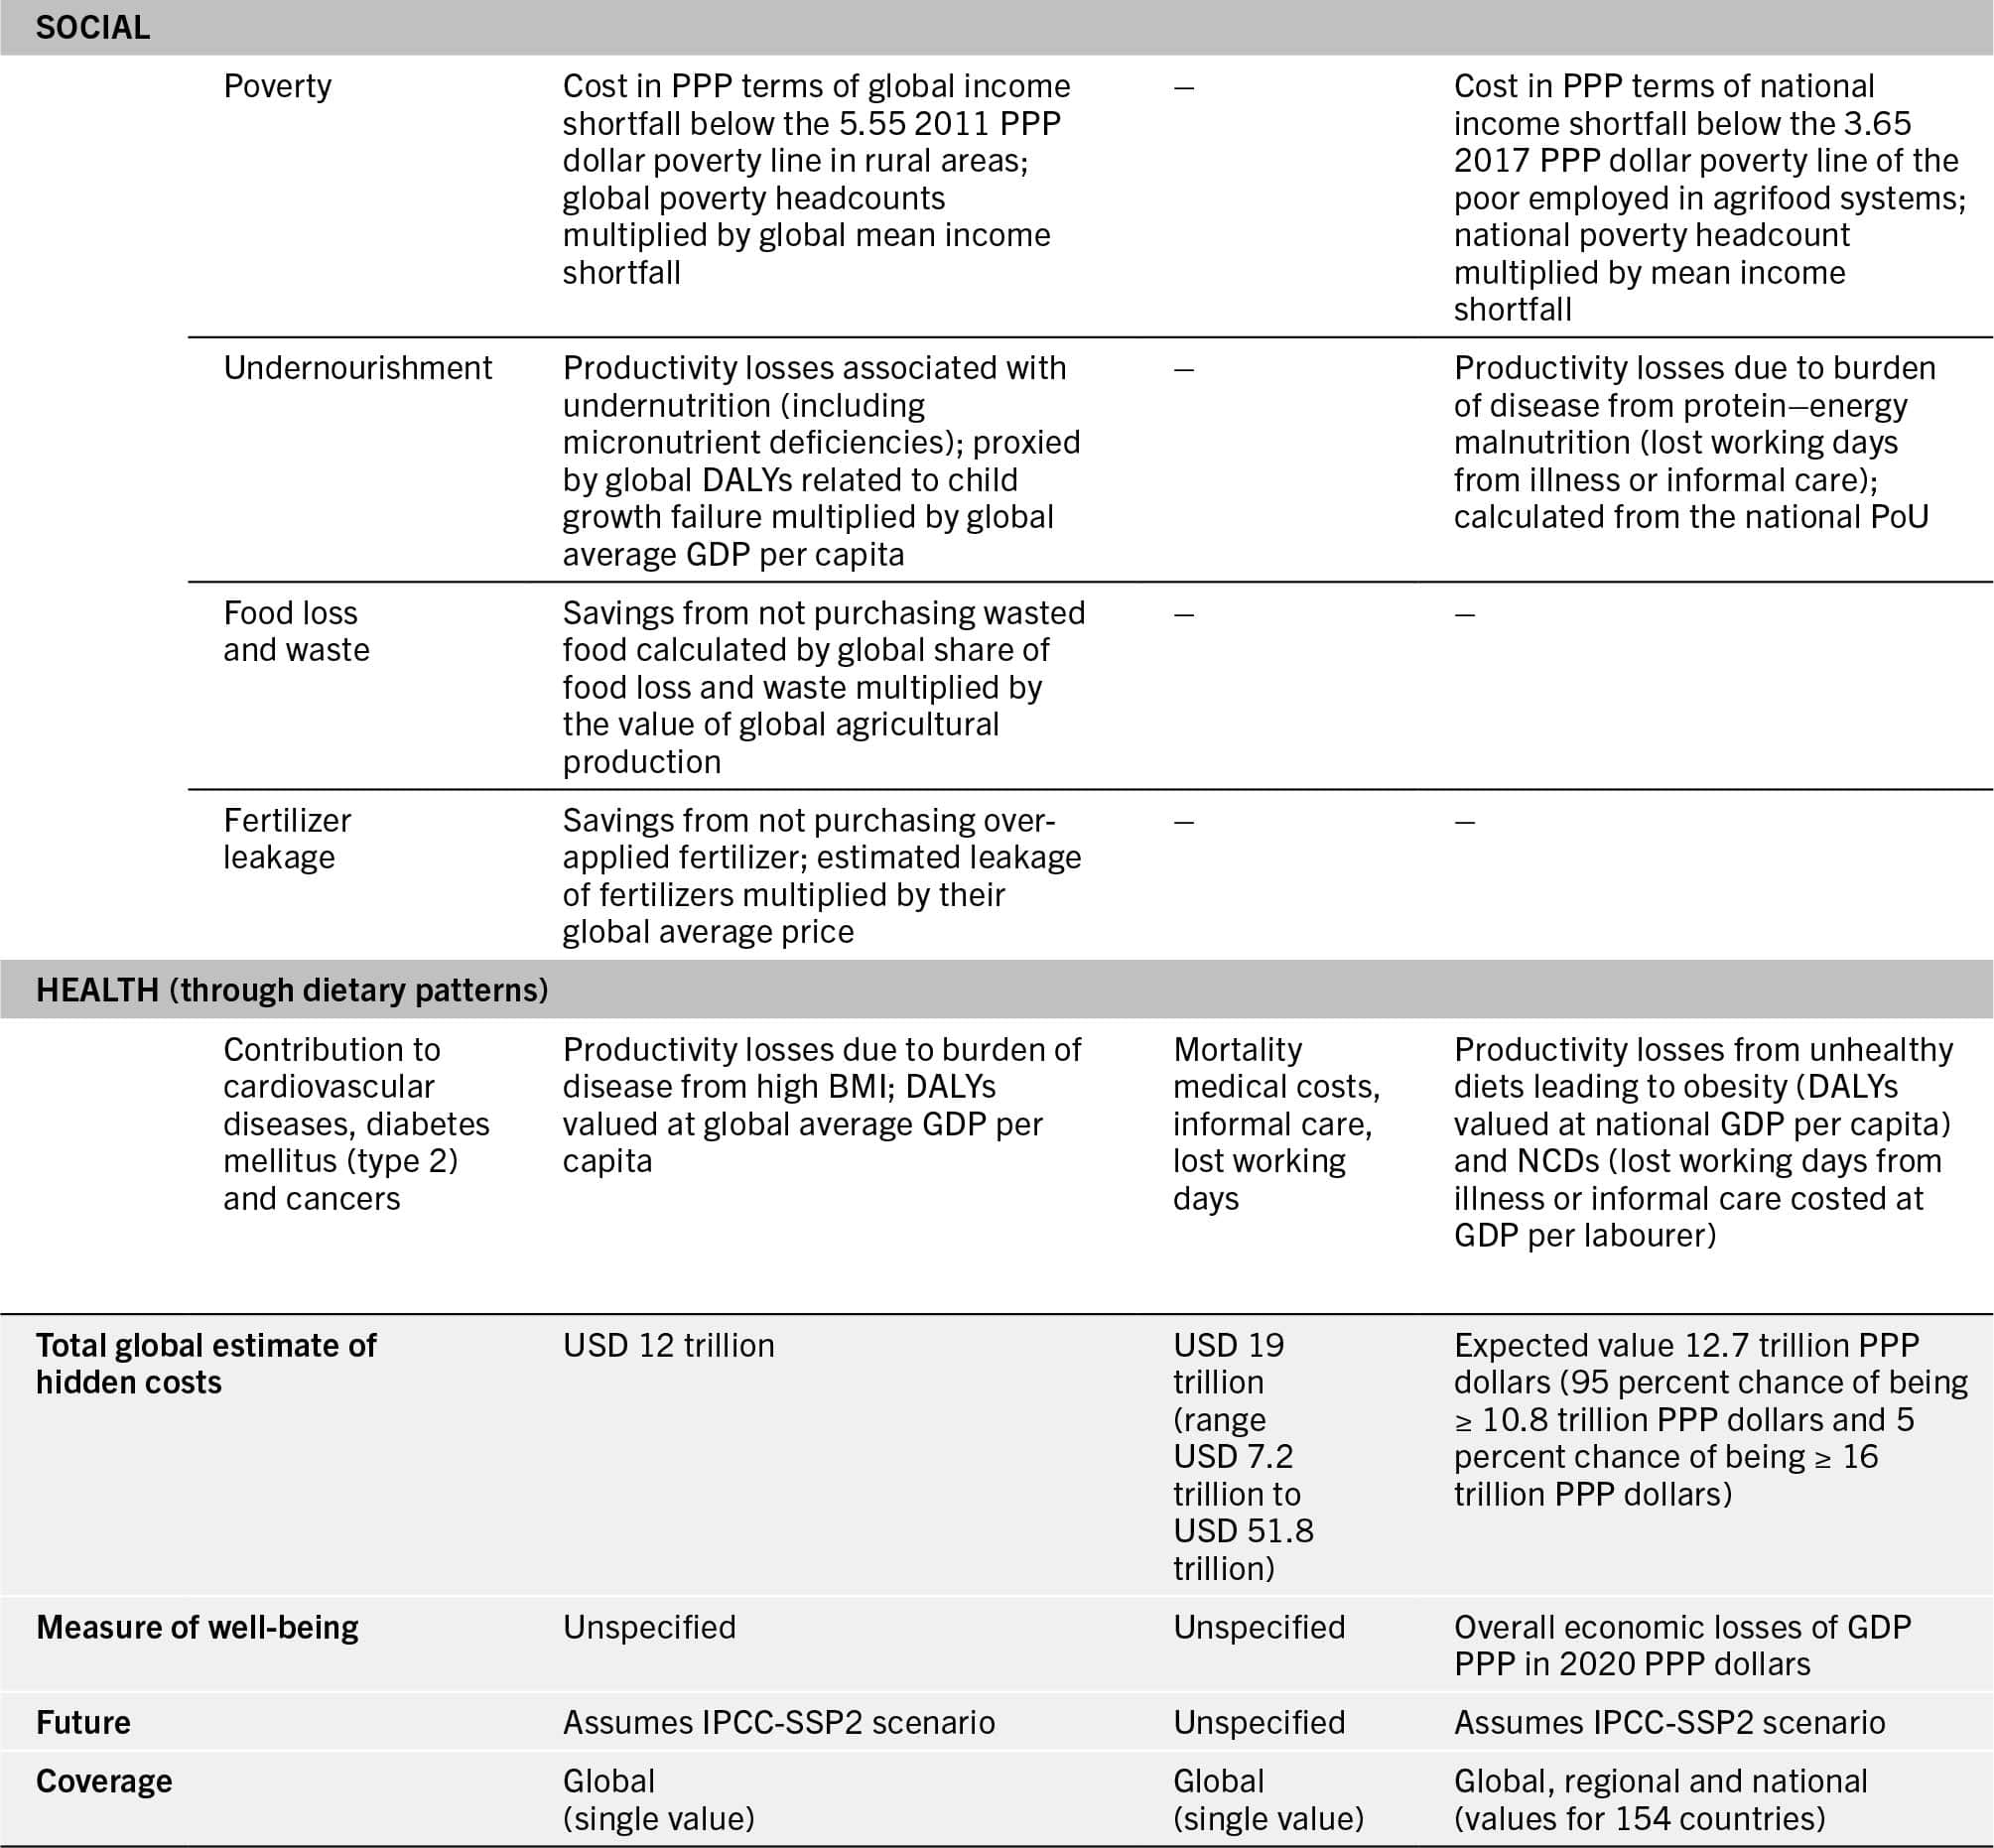
SOURCES: Adapted from Lord, S. 2023. Hidden costs of agrifood systems and recent trends from 2016 to 2023 – Background paper for The State of Food and Agriculture 2023. FAO Agricultural Development Economics Technical Study, No. 31. Rome, FAO; FOLU (Food and Land Use Coalition). 2019. Growing Better: Ten Critical Transitions to Transform Food and Land Use. Annex B: Technical Annex. London. https://www.foodandlandusecoalition.org/wp-content/uploads/2019/09/FOLU-GrowingBetter-TechnicalAnnex.pdf; Hendriks, S., de Groot Ruiz, A., Acosta, M.H., Baumers, H., Galgani, P., Mason-D’Croz, D., Godde, C. et al. 2023. The True Cost of Food: A Preliminary Assessment. In: J. von Braun, K. Afsana, L.O. Fresco & M.H.A. Hassan, eds. Science and Innovations for Food Systems Transformation, pp. 581–601. Springer, Cham. https://doi.org/10.1007/978-3-031-15703-5_32
Although a comparison across the three studies is not completely straightforward, Table 1 illustrates how the three studies differ in scope, methods, assumptions and, ultimately, results. Looking only at the final estimate of the total quantified hidden costs of agrifood systems, it might appear that this report and FOLU (2019) adopted a similar methodology, given their similar results of around USD 12 trillion, when, in reality, there are important differences.
To begin with, this report recognizes the great level of uncertainty in its estimates – that is, the possible variation of the estimated hidden costs – and provides a range for that uncertainty, which FOLU (2019) does not. Specifically, it models uncertainty in environmental external costs, poverty and productivity losses from dietary patterns, and undernourishment. FOLU (2019) is the most comprehensive assessment of the three in terms of dimensions covered. However, this broad coverage comes at the expense of economic rigour: the study relies on combining estimates from different studies with very different underlying assumptions and methodologies. It also relies on global averages for costs with significant regional variations or marginal effects. It further includes about USD 2 trillion in non-marginal damage estimates for pollinators and AMR, which are not suitable for the counterfactual (scenario) analysis needed for subsequent decision-making (discussed in Chapter 3).i Lastly, FOLU attributes all obesity costs and a substantial rural poverty gap valuation to agrifood systems without considering how these are affected by outside factors, such as socioeconomic status and metabolic factors in current obesity rates, or the role of other sectors of the economy in affecting poverty. In contrast, this report attributes only half of obesity costs to agrifood systems, uses a lower poverty threshold, and attributes poverty gaps that are borne by people employed in the agrifood sector (not necessarily rural).
Hendricks et al. (2023) report the highest estimate of hidden costs – about USD 19 trillion – and an even larger range of uncertainty. The study is more focused than the FOLU study, but its estimates remain at the global level and do not consider important hidden costs, such as those associated with poverty and undernourishment. The monetization of environmental hidden costs is based on valuation factors for restoration and compensation costs presented in Galgani et al. (2021),21 while the loss of human life and loss of health are valued using a single median and average global value, respectively. Unlike its counterpart, the study also considers mortality, which further explains its higher valuation of health costs relative to those estimated for this report. Indeed, this report only considers productivity losses associated with forgone labour and informal care and adjusts these to GDP PPP.j
The methodology used in this report is an improvement on the other two studies in various other aspects. One of the most important advantages is the fact that it provides a common monetary measure that can be compared with GDP PPP and, therefore, with market transactions. Another key advantage is its use of a discount rate that assumes a continuation of “business as usual” in a future broadly equivalent to the second shared socioeconomic pathway (SSP2),17 as a way to account for hidden costs affecting future generations. It also provides more recent estimates, and at national level rather than global, while being transparent about the uncertainty of the estimated hidden costs. It uses a marginal damage approach to value productivity losses and environmental damages, adjusting for national variations in price and income.
In terms of consumers, the analysis undertaken for this report accounts for these through productivity losses from dietary patterns that contribute to obesity and NDCs. Direct costs, such as treatment costs, are hereby excluded: either they are visible economic exchanges within the economy and, therefore, not considered a hidden cost, or estimates of the inefficiency in GDP terms associated with these direct costs are not available. Other impacts, such as the release of GHG and nitrogen emissions, also generate productivity losses through a changing climate and human exposure to air pollution, respectively. The analysis excludes consumers’ economic losses from food that goes to waste, however, as well as producers’ economic losses from nitrogen overuse.k
In brief, all three studies provide different perspectives on the hidden costs of agrifood systems. Each has its strengths and weaknesses and none captures all the nuances and uncertainties involved in estimating hidden costs; furthermore, none of them account for all hidden costs. However, they all support the hypothesis that the magnitude of hidden costs is sizeable relative to the value of food products transacted in markets. This is an important conclusion that can be used to raise awareness about the damages associated with our agrifood systems at a global level; however, it falls short of providing guidance on what actions need to be taken at the regional, national and subnational levels.
In this regard, this report is an improvement, in that it assesses hidden costs of agrifood systems at the national level using marginal hidden costs that are consistent in terms of the economic measures used, the use of a common social discount rate, and the separation of hidden costs from abatement costs. Next, this chapter describes in more detail the scope of the results presented here and what the assumed boundaries of agrifood systems are.

