
The hidden costs described in the previous sections can be combined with other relevant metrics – such as GDP, agricultural value added and agricultural land use – to develop indicators that help identify entry points for the prioritization of interventions and investments. Different indicators may be created for different contexts, depending on the issues faced, the size of the economy and the relative importance of the agrifood sector. The first step should be to identify where in a given agrifood system hidden costs are more significant and due to what activities. Following this first step, and using estimated hidden costs and other national metrics, this report proposes three indicators relevant to the environmental, social and health dimensions, targeting specific entry points: primary producers, the poor and consumers.
Starting with the environmental dimension, estimates suggest that these costs occur mostly in primary production, with pre- and post-production costs comprising less than 2 percent of total quantified hidden costs. In other words, the primary sector should be seen as the main entry point for effecting change in environmental pathways. Consequently, it is fitting to propose an indicator that considers the intensity of hidden costs related directly to primary production, all of them being environmental, per unit of value added to GDP (in 2020 PPP dollars). This indicator, called the agricultural externalities impact ratio (AEIR), expresses the relative importance and, thus, priority of the primary production sector in agrifood systems transformation. It is the ratio between a country’s hidden costs from agricultural production – that is, the costs from GHG and nitrogen emissions, water and land use, and land-use change – and national gross valued added (GVA) of agriculture, forestry and fisheries in PPP terms. This indicator, therefore, excludes from the numerator all quantified hidden costs outside primary production – that is, agricultural inputs, manufacturing, retail consumption and waste (see Figure 5). Because forestry is outside the scope of the analysis, it is also not included in the numerator, despite being included in the denominator through GVA. Consequently, the AEIR is expected to be a conservative estimate. Globally, the AEIR is estimated to have a value of 0.31, meaning that each dollar of agricultural value added generates 31 cents of hidden costs. In other words, hidden costs from agriculture are equivalent to almost one-third of agricultural value added in 2020 PPP dollar terms.
Moving on to the social dimension, the second indicator proposed is called the social distribution impact ratio (SDIR). This indicator focuses on the vulnerable actors and expresses the contribution of agrifood systems to moderate poverty – that is, the overall distributional failure of sufficient revenues and calories needed to ensure productive lives. Mathematically, it is defined as the ratio of the total income shortfall of agrifood workers below the moderate poverty line of 3.65 2017 PPP dollars per day over the annual total income of the moderately poor. This expresses the required magnitude of potential future transfers from governments to avoid these productivity losses and compensate for income shortfalls relative to the moderately poor’s overall income. The moderately poor are mostly in low- and lower-middle-income countries, for which the indicator values are 0.57 and 0.27, respectively. This suggests that to avoid distributional failure costs in agrifood systems, the incomes of the moderately poor working in agrifood systems need to increase, on average, by 57 percent in low-income countries and 27 percent in lower-middle-income countries.
The third and final indicator focuses on the health dimension and is named the dietary patterns impact ratio (DPIR). It relates to consumers and captures the intensity of hidden costs from dietary patterns leading to obesity and NCDs and, as a consequence, productivity losses. It is measured as a ratio of the average productivity losses per person from dietary intake in 2020 PPP dollars to GDP PPP per capita. As before, direct costs, such as health care costs, are excluded, as these are already incorporated into the economy. Globally, the value for this indicator is equivalent to 7 percent of GDP PPP in 2020; low-income countries report the lowest value (4 percent), while other income categories report 7 percent or higher.
Figure 10 is a global spatial representation of the three indicators: AEIR (top), SDIR (middle) and DPIR (bottom).
FIGURE 10 Spatial distribution of indicators of hidden costs in global agrifood systems, 2020
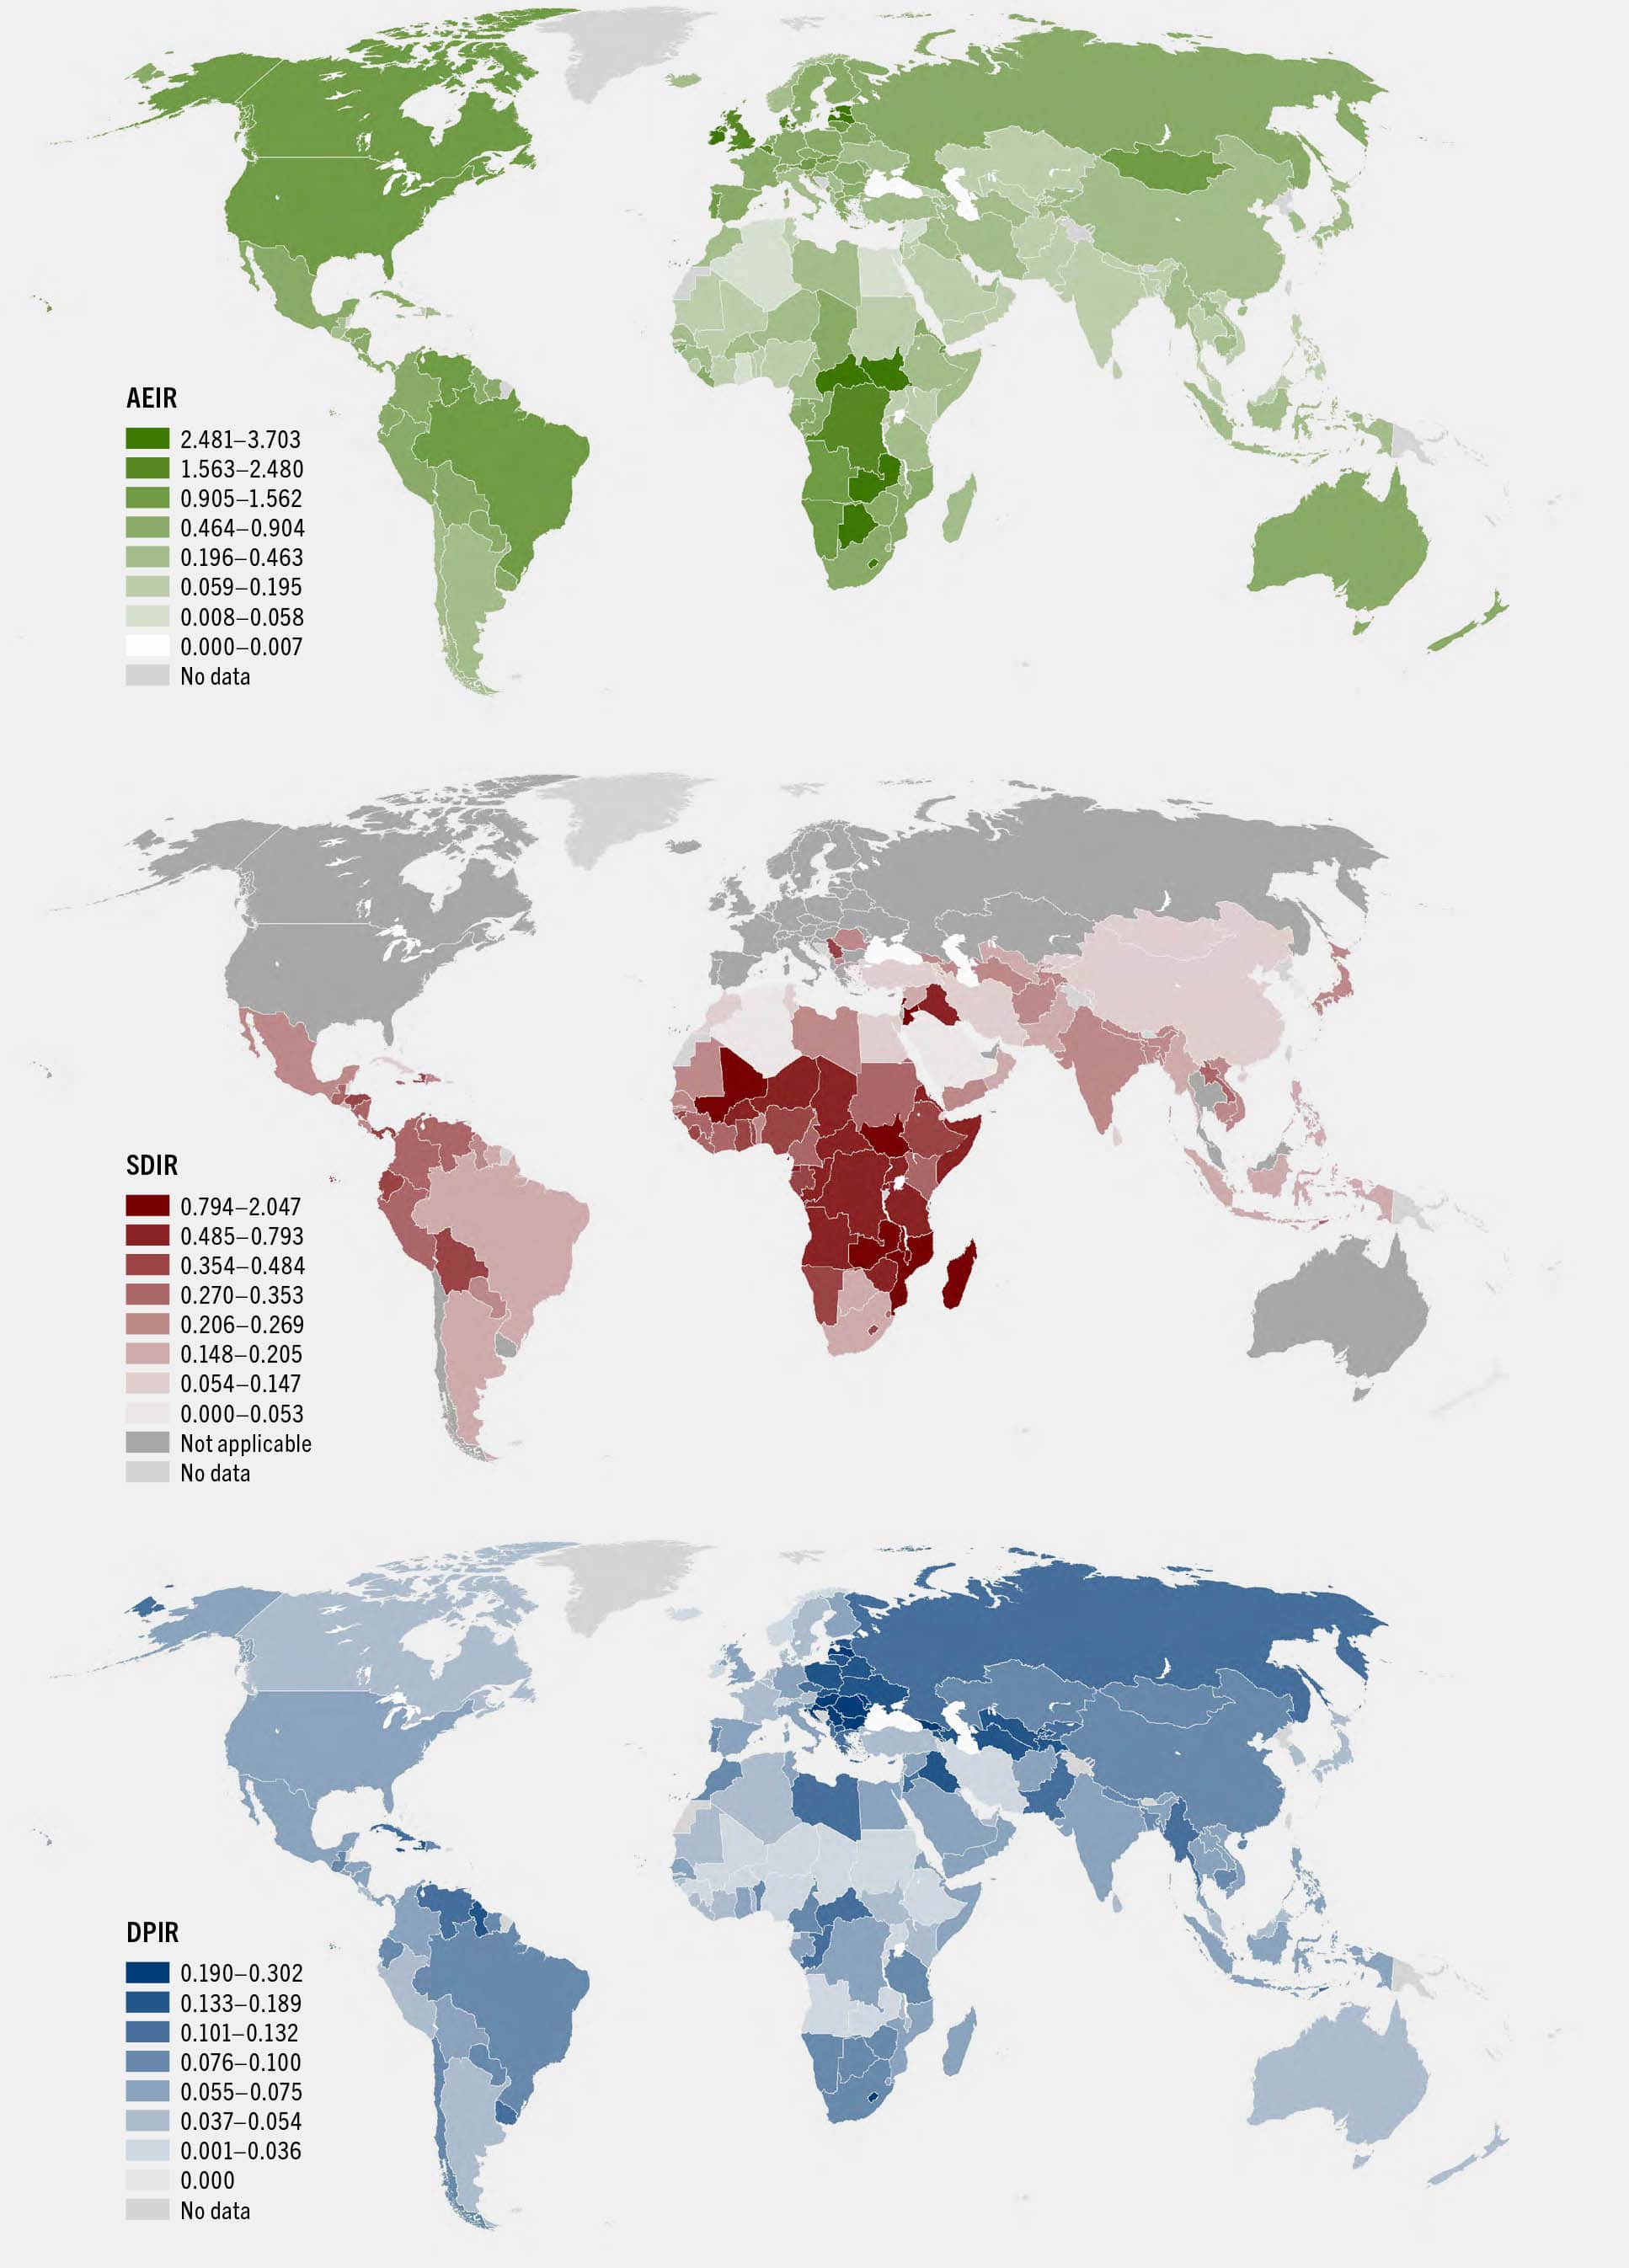
SOURCE: Lord, S. 2023. Hidden costs of agrifood systems and recent trends from 2016 to 2023 – Background paper for The State of Food and Agriculture 2023. FAO Agricultural Development Economics Technical Study, No. 31. Rome, FAO.
Table 2 compares the three indicators for a selected group of countries by income category, as there can be significant variations, and suggests a sense of urgency ranging from low (green) to very high (red). This gives an indication of priority areas where further investigation is needed to examine options and understand abatement costs. For example, in low-income countries such as Burkina Faso, the Democratic Republic of the Congo, Madagascar, Mozambique, the Niger and Uganda, priority should be given to distributional failures in agrifood systems, although the Democratic Republic of the Congo also shows significant costs at farm level related to GHG emissions from deforestation.
TABLE 2 A TRAFFIC-LIGHT REPRESENTATION OF THE THREE INTENSITY INDICATORS TO SIGNAL POTENTIAL PRIORITIES FOR A TARGETED ASSESSMENT
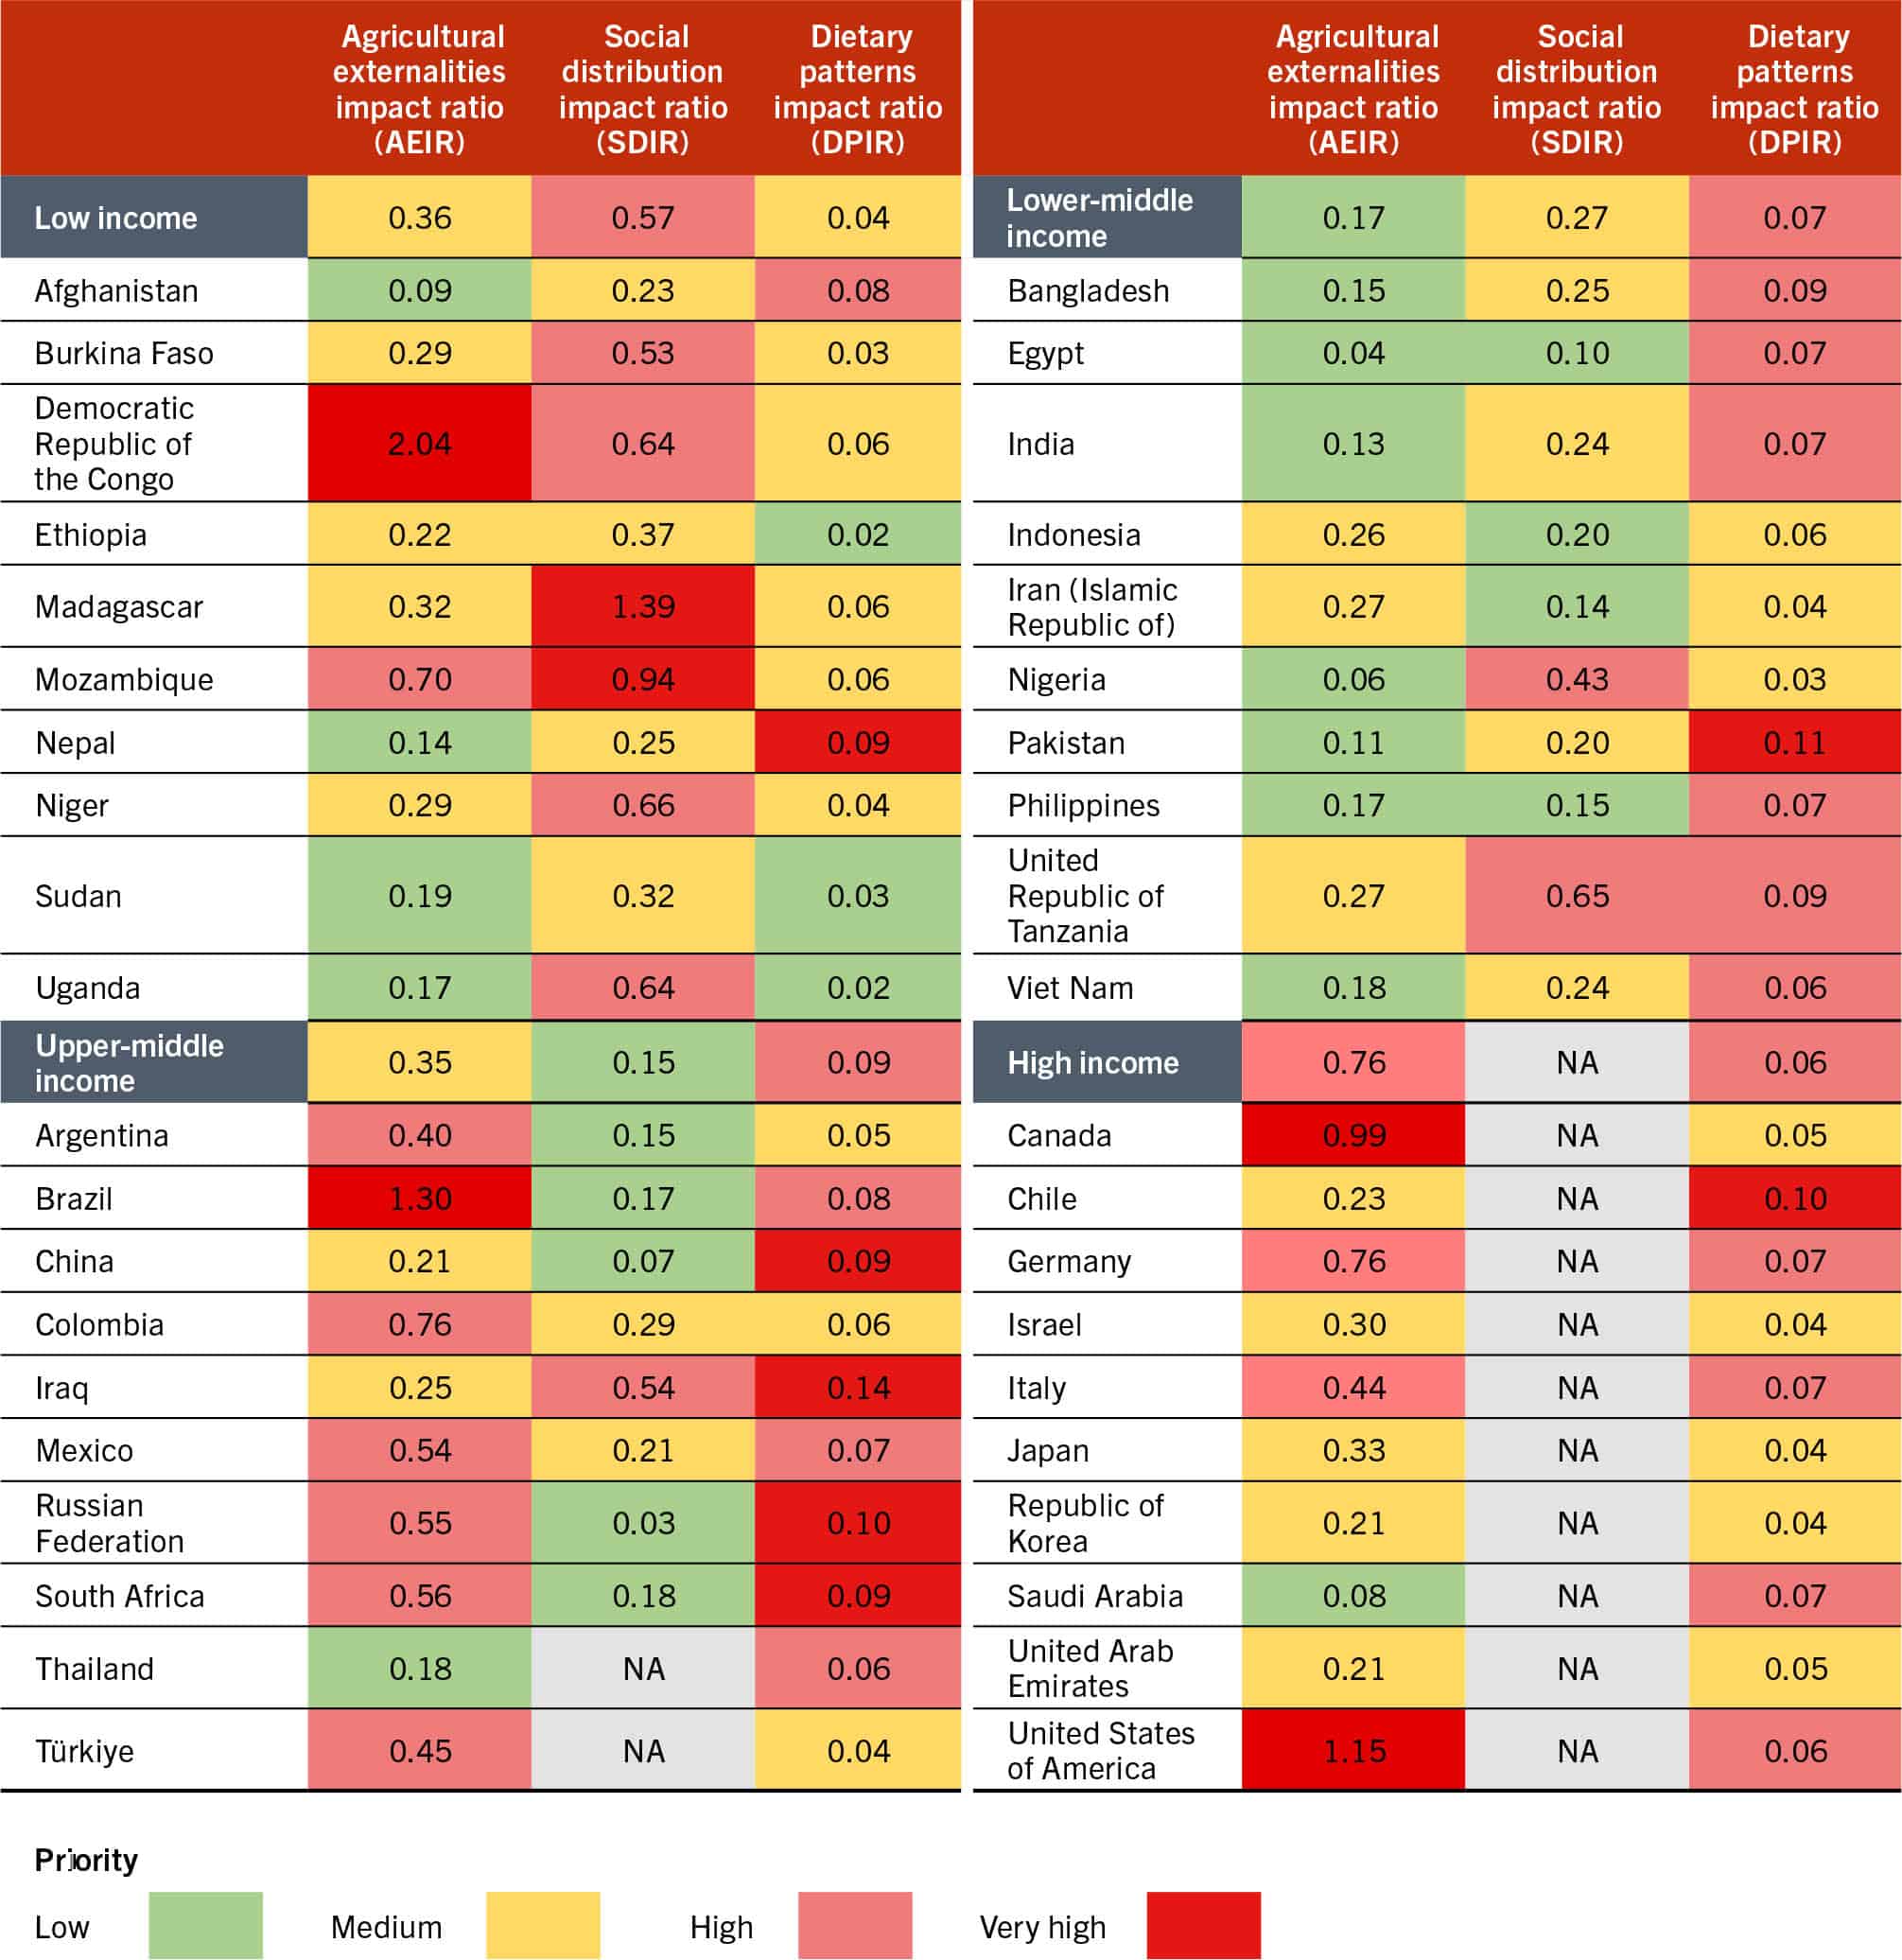
SOURCE: Lord, S. 2023. Hidden costs of agrifood systems and recent trends from 2016 to 2023 – Background paper for The State of Food and Agriculture 2023. FAO Agricultural Development Economics Technical Study, No. 31. Rome, FAO.
For lower-middle-income countries, such as Nigeria and the United Republic of Tanzania, income shortfalls among the moderately poor population are also a major concern. In the United Republic of Tanzania, the focus should also be on dietary-induced productivity losses, as in Bangladesh and Pakistan. The situation is quite different for upper-middle-income countries, where China, Iraq, the Russian Federation and South Africa, for example, face alarming productivity losses from dietary choices, along with environmental challenges from primary production externalities.
High-income countries, in contrast, are mostly challenged by both environmental externalities from primary production activities and unhealthy dietary patterns, although substantial variation exists. Canada and the United States, for example, are confronted with serious challenges from nitrogen emissions and the loss of ecosystem services due to land-use change, whereas in Chile, the focus should probably be on promoting healthier diets. It is interesting to note that, despite the high incidence of NDCs and obesity from unhealthy dietary patterns in high-income countries such as the United States, values for the DPIR indicator are relatively low. Indeed, some middle-income countries, which report lower hidden costs associated with dietary patterns (see Figure 9), indicate relatively higher DPIR values due to the lower value of GDP per capita, the denominator of the indicator.
In sum, these indicators express the intensity of hidden costs across the different dimensions and for different countries. They aim to provide a more nuanced understanding of agrifood systems challenges to guide policymakers in making effective interventions and investments to mitigate their hidden costs. Due to the multisectoral nature of the hidden costs, however, it is important to acknowledge that these cannot be reduced by action on agrifood systems alone. It will further require leveraging and coordinating policies that go beyond agrifood systems (for example, environmental, energy, health and other systems).

