
Aggregating the quantified hidden costs of agrifood systems at the global level hides significant variation across the income levels of countries that are key decision-makers in reducing these costs. In reality, the relative importance of hidden costs across different categories – environmental, social and health – will vary depending on a number of factors, such as average income level, geography and level of urbanization. Among these, the average income level of a country is particularly informative, because it correlates to how agrifood systems are organized, the role of these systems in the overall economy, and the level of urbanization. Understanding these variations is a first step towards identifying areas of intervention that need to be prioritized in each country.
Figure 7 breaks down total quantified hidden costs by main category and country income group. Hidden costs differ not only in their magnitude, but also in their composition by income level. The majority of hidden costs are generated in upper-middle-income countries (5 trillion 2020 PPP dollars, or 39 percent of total quantified hidden costs) and high-income countries (4.6 trillion 2020 PPP dollars, or 36 percent of total costs). Lower-middle-income countries account for 22 percent, while low-income countries make up 3 percent. In all country groups apart from low-income nations, productivity losses from dietary patterns that lead to NCDs are the most significant contributor to agrifood systems damages, followed by environmental costs. In lower-middle-income countries, social hidden costs from poverty and undernourishment are relatively more significant, accounting for an average of 12 percent of all quantified hidden costs. Unsurprisingly, these social hidden costs are the main issue in low-income countries (more than 50 percent of all quantified hidden costs).
FIGURE 7 Total quantified hidden costs of agrifood systems by income group
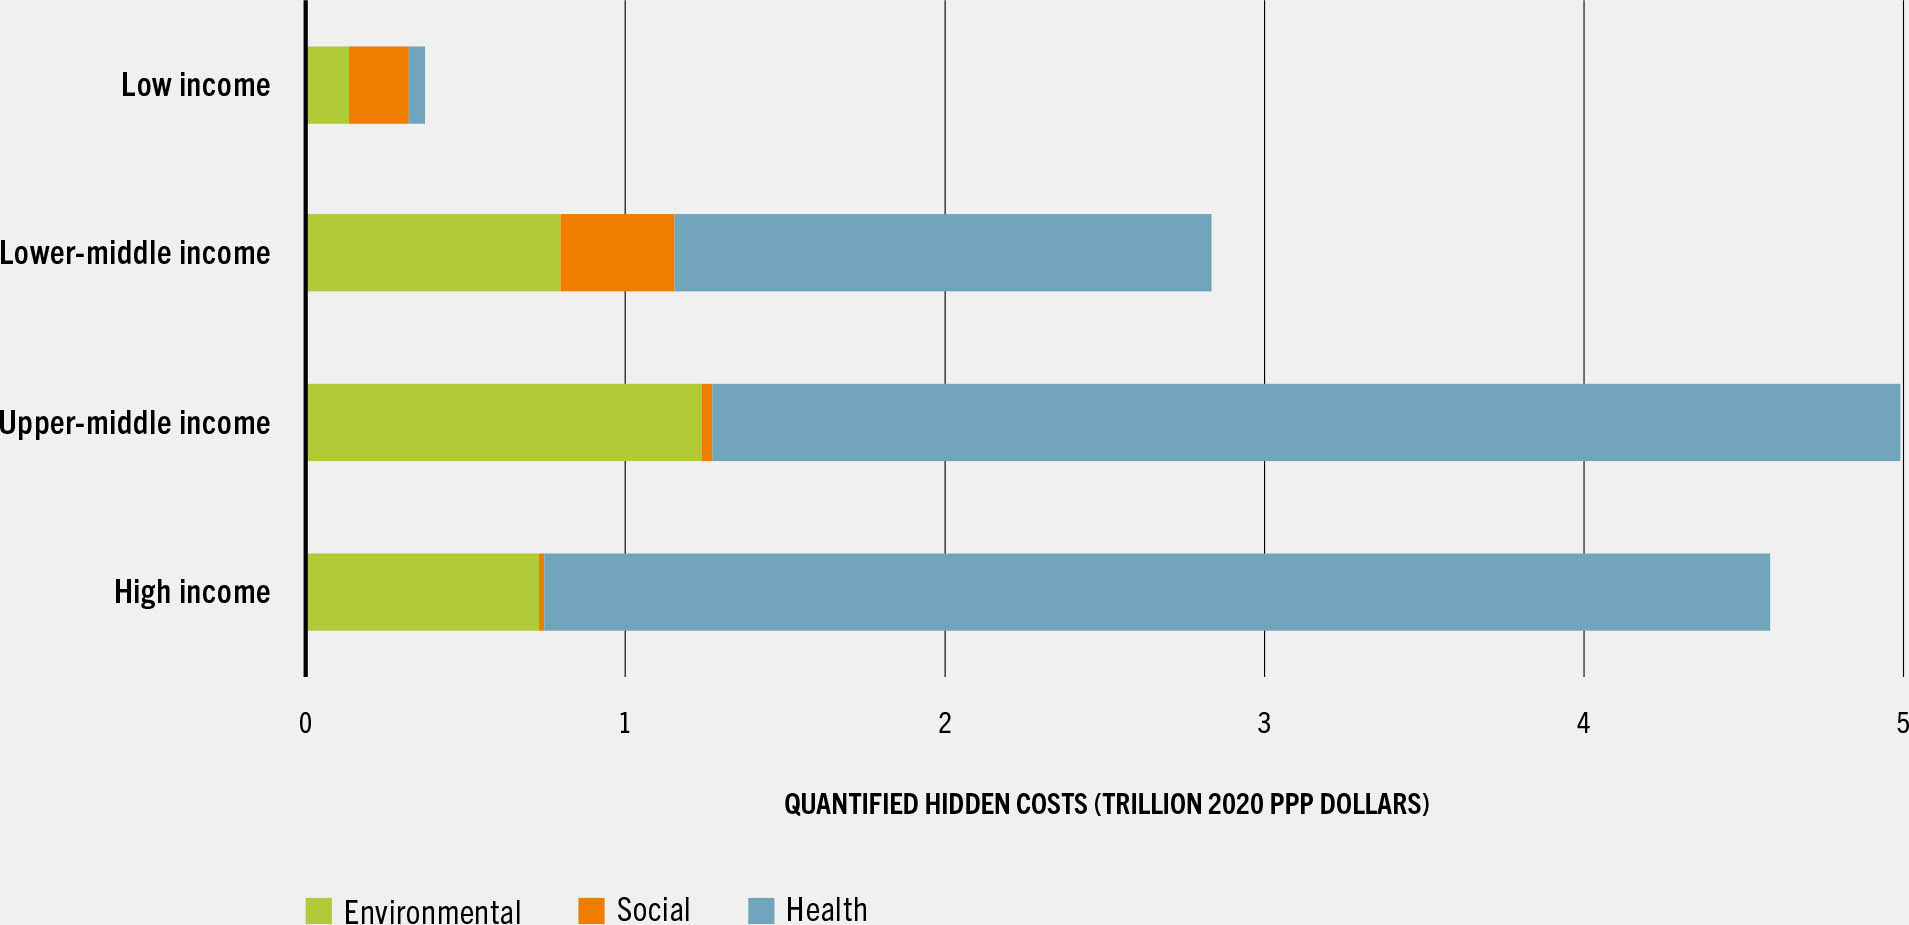
SOURCE: Adapted from Lord, S. 2023. Hidden costs of agrifood systems and recent trends from 2016 to 2023 – Background paper for The State of Food and Agriculture 2023. FAO Agricultural Development Economics Technical Study, No. 31. Rome, FAO.
Presenting hidden costs in total monetary terms gives a general sense of the magnitude of the problem; however, these country groups vary substantially in their economic size and development. It is, therefore, useful to anchor the monetary estimates to the size of transaction that takes place in the economy, expressed as a share of GDP PPP in Figure 8. This gives a sense of the burden these hidden costs place on national economies and provides an indication as to where to prioritize international resources to address these costs. Globally, the quantified hidden costs are equivalent, on average, to almost 10 percent of 2020 GDP in PPP terms. However, this share is far higher in low-income countries, at an average of 27 percent. This signals that improving agrifood systems in low-income countries will be instrumental in addressing these hidden costs, especially those related to poverty and undernourishment, which alone are equivalent to 14 percent of GDP. The ratio of hidden costs to GDP is, on average, 11 percent in middle-income countries (or 12 percent and 11 percent in lower- and upper-middle-income countries, respectively). However, social hidden costs are of notable relevance only in lower-middle-income countries. In high-income countries, the ratio of all quantified hidden costs is, on average, only 8 percent, the majority of which come from unhealthy dietary patterns.
FIGURE 8 Share of quantified hidden costs of agrifood systems to GDP by income group (hidden costs per capita on the right-hand side)
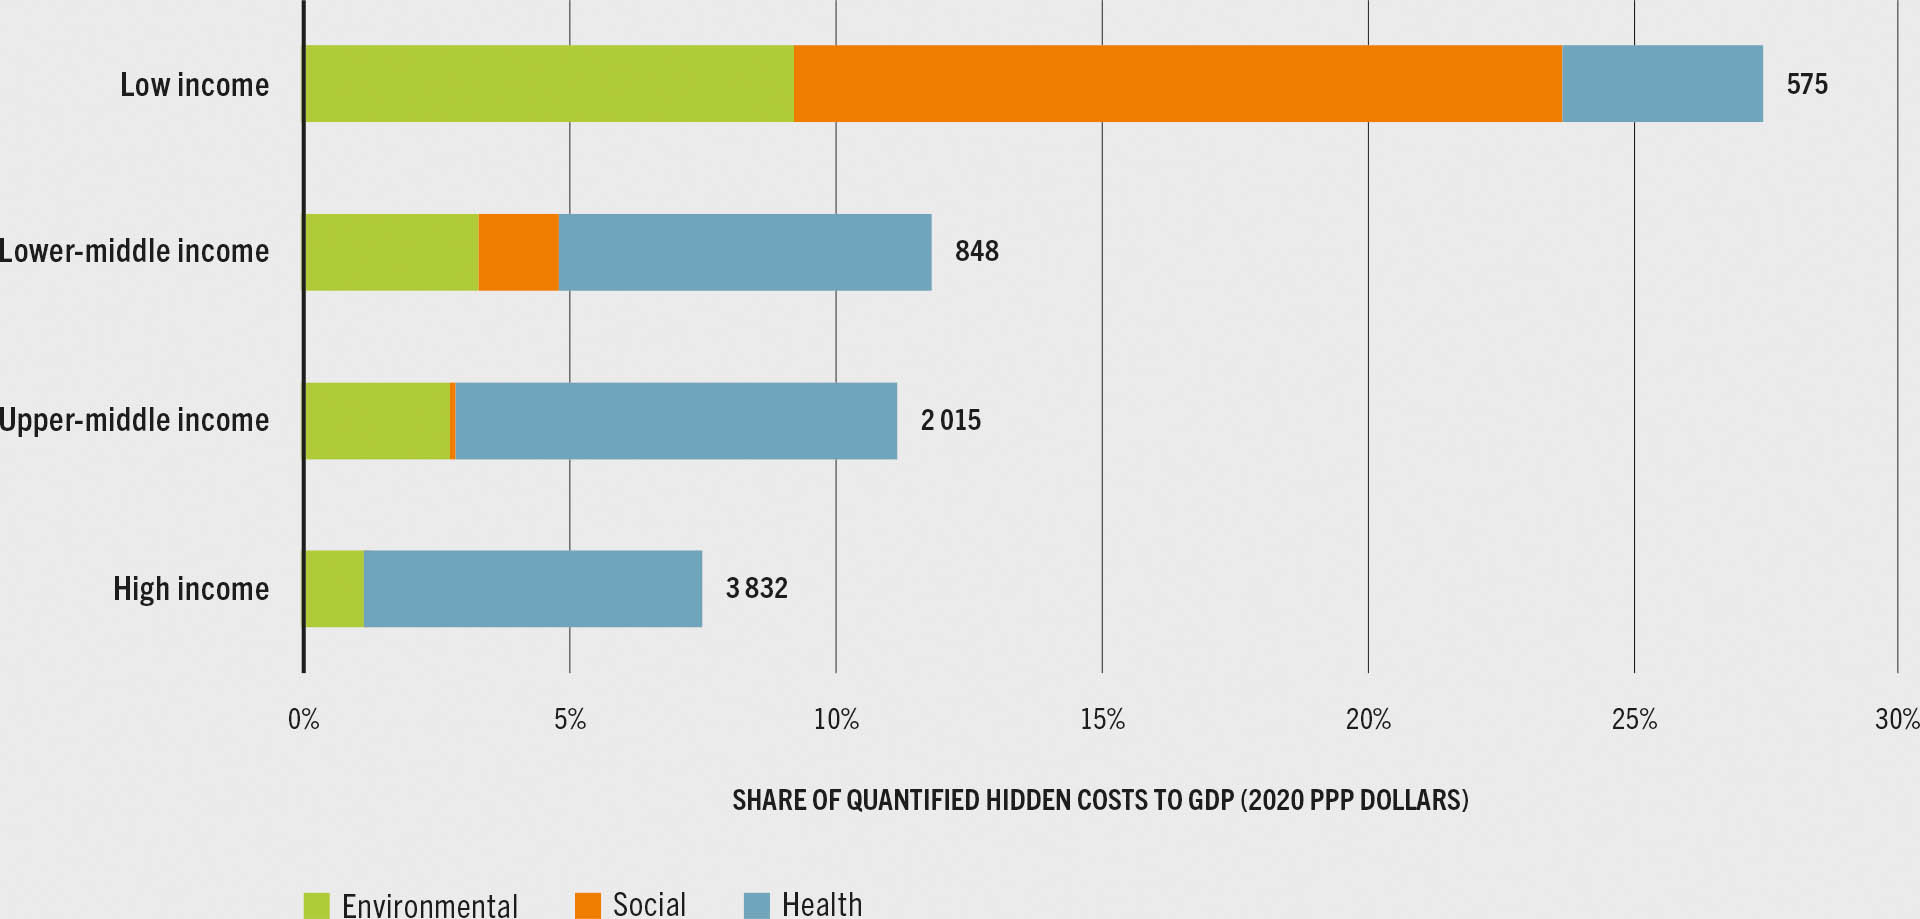
SOURCE: Adapted from Lord, S. 2023. Hidden costs of agrifood systems and recent trends from 2016 to 2023 – Background paper for The State of Food and Agriculture 2023. FAO Agricultural Development Economics Technical Study, No. 31. Rome, FAO.
Country income groups can also deviate substantially in terms of population size. It is, therefore, useful to compare hidden costs with the size of the population. Hidden costs per capita are shown to the right of the bars in Figure 8 and can be interpreted as the amount of hidden costs generated by an average individual. Important differences across income categories emerge – not least that hidden costs increase as countries develop. Consequently, populations in high-income countries generate the highest indirect costs, at an average of 3 800 2020 PPP dollars per person, followed by upper-middle-income countries, where each person generates, on average, 2 000 2020 PPP dollars in hidden costs. This number is noticeably lower in lower-middle-income countries (around 850 2020 PPP dollars) and even lower in low-income countries (575 2020 PPP dollars). The main reason the average person in a high-income country generates almost double the costs of a person in an upper-middle-income country is that the productivity losses from unhealthy dietary patterns are also double, due to higher labour productivity per capita. In other words, a given number of workdays lost in high-income countries can create hidden costs higher than the same number of workdays in upper-middle-income countries. In contrast, environmental costs per capita are relatively similar across the two income categories.
In conclusion, the analysis presented in Figure 7 and Figure 8 suggests that the majority of the quantified hidden costs are generated in high- and upper-middle-income countries. If these costs are distributed evenly throughout the population, it becomes clear that an average individual generates higher hidden costs as their income level increases. However, a note of caution is needed, as this can be in part explained by higher labour productivity as country income level increases. Consequently, this trend does not suggest a relatively higher burden on countries with higher per capita hidden costs. This is evident when looking at the shares of quantified hidden costs to GDP, which clearly show that the highest burden placed on the economy is in low-income countries.
Projecting values up to 2023 and looking at the evolution of hidden costs since 2016 can also provide important insights, including in relation to the role played by dietary patterns. Box 8 breaks down this trend and looks at the evolution of hidden costs by category and country income group. According to the box, these are estimated to have increased 9 percent and trended upwards, with productivity losses from unhealthy dietary patterns the main culprit – estimated to have increased 14 percent in the same period.
Box 8Quantified hidden costs of agrifood systems over time – an overview of recent trends
The quantified hidden costs of agrifood systems can be projected for 2021–2023 by extrapolating data from 2016–2020. Figure A illustrates the evolution of hidden costs over 2016–2023 at the global level. Overall, quantified hidden costs show an upward trend, moving from approximately 12.1 trillion 2020 PPP dollars to more than 13 trillion 2020 PPP dollars in 2023 (Figure A, left panel). The upward trend is mostly driven by increasing health-related hidden costs from unhealthy dietary patterns, which increase 14 percent between 2016 and 2023 (Figure A, right panel). Environmental hidden costs remain more stable, as the increase in nitrogen and GHG emissions is cancelled out by the downward trend in land-use changes due to a decrease in deforestation and an increase in agricultural land abandonment. Social hidden costs have also remained stable, despite an increase due to the COVID-19 pandemic in 2020, as costs resumed a long-term downward trend after 2021.
FIGURE A Quantified hidden costs of global agrifood systems, 2016–2023: total (left) and by category (right)
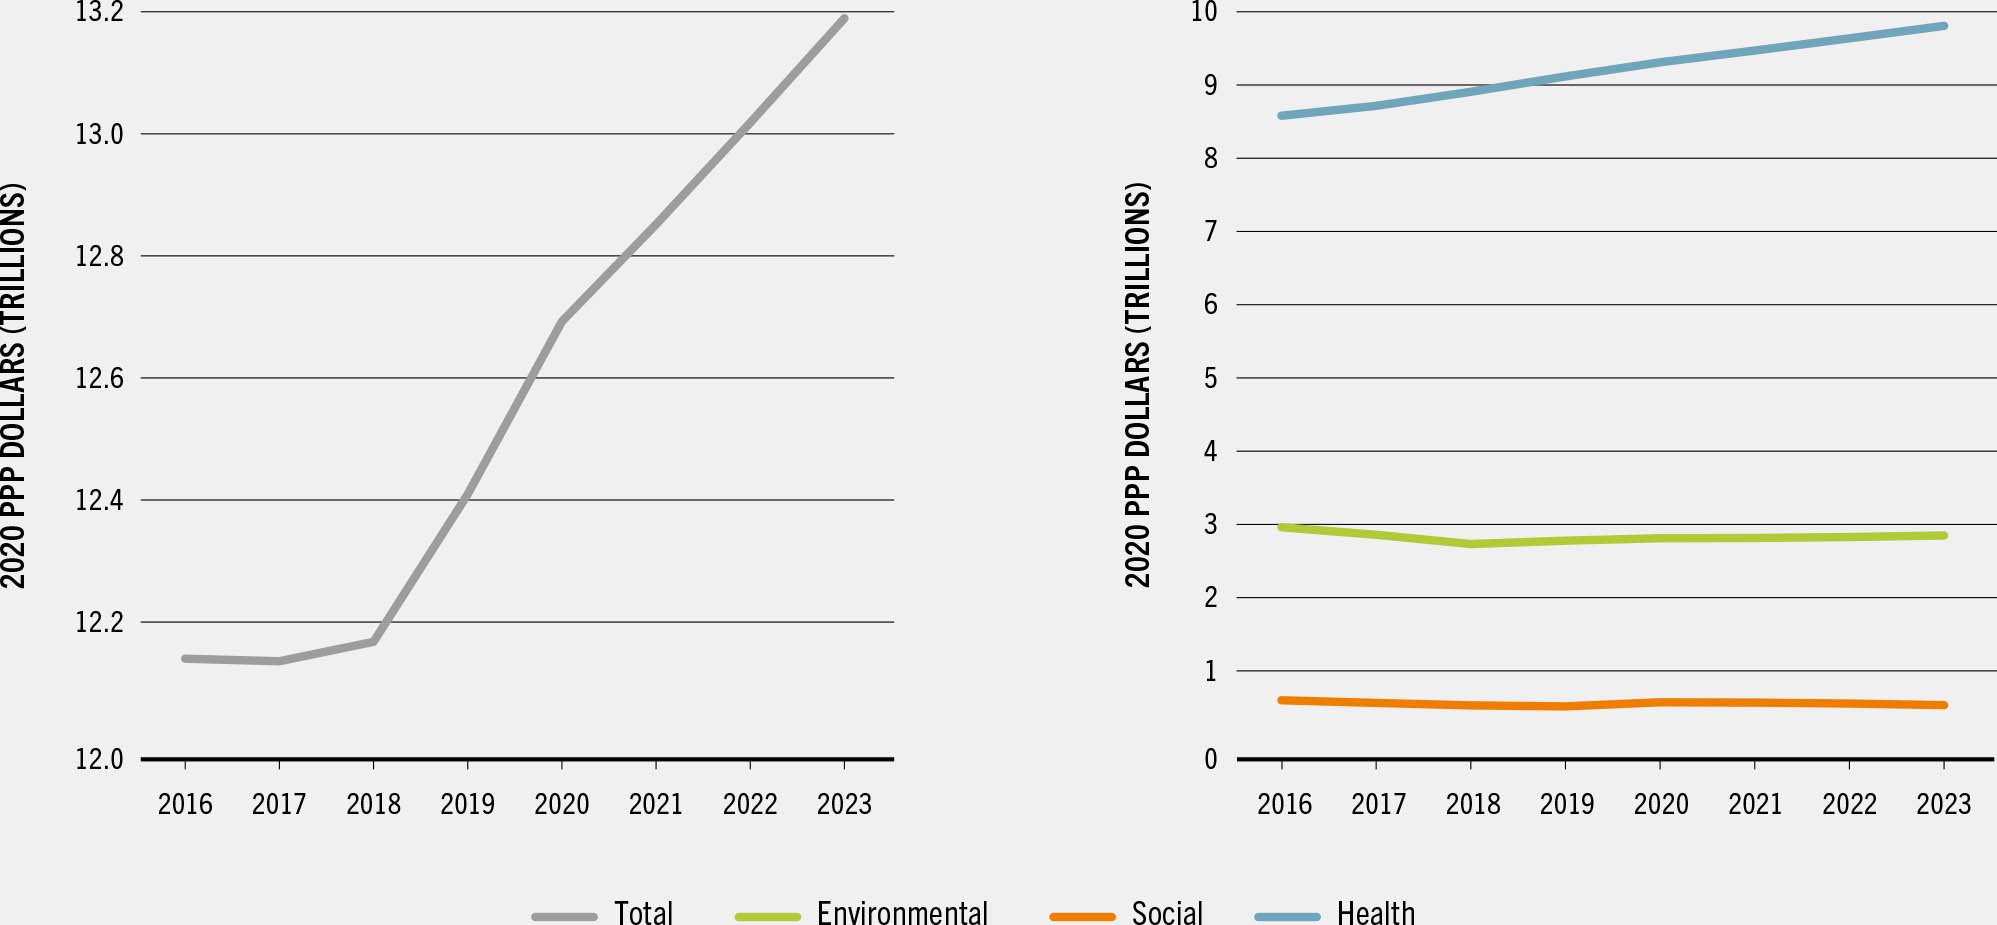
SOURCE: Lord, S. 2023. Hidden costs of agrifood systems and recent trends from 2016 to 2023 – Background paper for The State of Food and Agriculture 2023. FAO Agricultural Development Economics Technical Study, No. 31. Rome, FAO.
Figure B shows this breakdown by country income group. Hidden costs driven by dietary patterns are the only cost category that is on the rise across all income groups. It is also the most costly category, except for in low-income countries, accounting for 62 percent of all quantified hidden costs in lower-middle-income countries and for 75 percent in high- and upper-middle-income countries in 2023.
FIGURE B Quantified hidden costs of agrifood systems by country income group, 2016–2023: total (top left) and by category
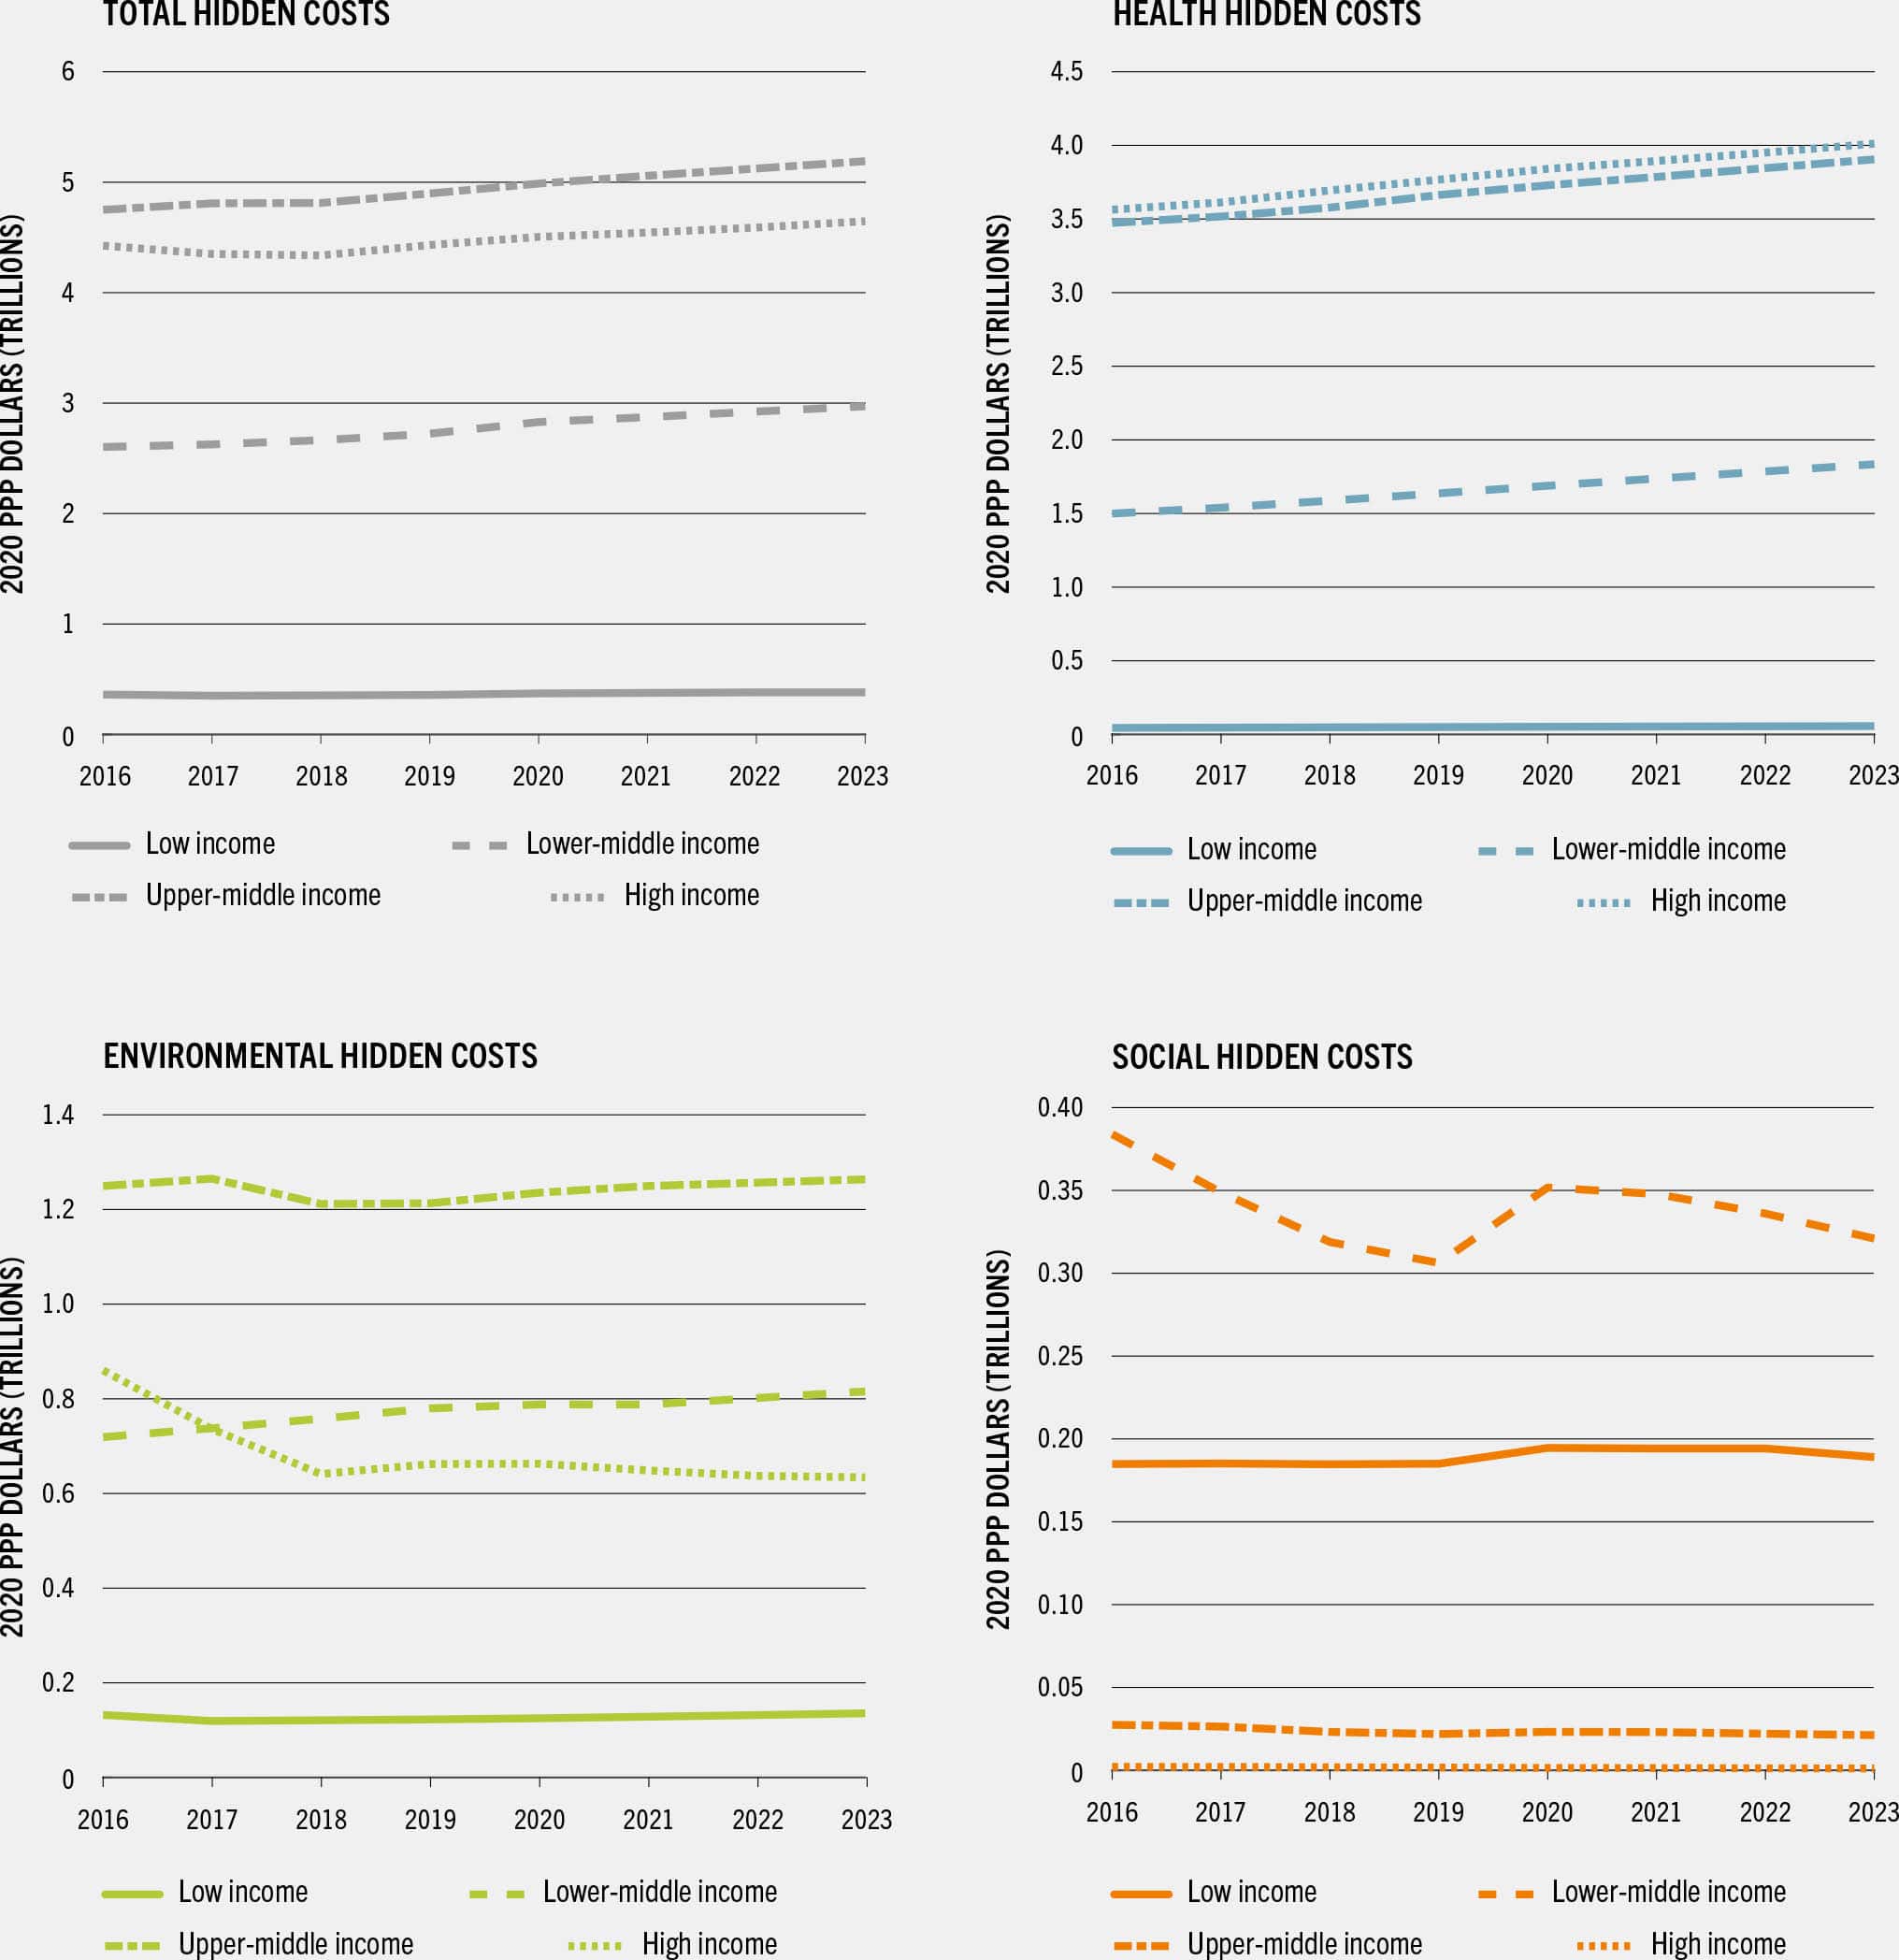
SOURCE: Lord, S. 2023. Hidden costs of agrifood systems and recent trends from 2016 to 2023 – Background paper for The State of Food and Agriculture 2023. FAO Agricultural Development Economics Technical Study, No. 31. Rome, FAO.
Total quantified hidden costs from environmental sources in lower-middle-income countries surpassed those for high-income countries in 2018, and this difference is expected to become even more pronounced in 2023, as costs in the latter start to decrease. Upper-middle-income countries, in contrast, account for almost twice the environmental costs of lower-middle-income and high-income countries, but seem to be stabilizing.
Social hidden costs, driven by moderate poverty and undernourishment, saw an increase in all income groups in 2020, especially in lower-middle-income countries, but are likely to have resumed their previous downward trend from 2021. The exception is low-income countries, for which social hidden costs remain the major challenge and which report a fairly static trend due to the concentration of extreme poverty.

