
There can be considerable variation within an income group. Examining this variation is necessary to devise agrifood systems interventions towards sustainability that are suited to country-specific contexts. This is true even for countries with similar hidden costs in relation to GDP, where the drivers – environmental, social or health – of hidden costs can differ by country. Figure 9 shows this breakdown of hidden costs by subcategory for selected countries within each income category, with the bars and total quantified hidden costs as a share of GDP reported on the right-hand side. Variation between cost subcategories is particularly visible in middle-income countries, where, as average income increases, the social dimension of hidden costs decreases, while that of health increases, though not to the level of high-income countries. One should, however, be mindful that the relative importance of social, environmental and dietary pathways may vary if omitted hidden costs are included – for example, child stunting, pesticide exposure, AMR or illness from unsafe food – amid a lack of global databases reporting these dimensions at country level.
FIGURE 9 Quantified hidden costs of agrifood systems by subcategory for selected countries by income level (share of hidden costs to GDP [2020 PPP dollars] on the right-hand side)
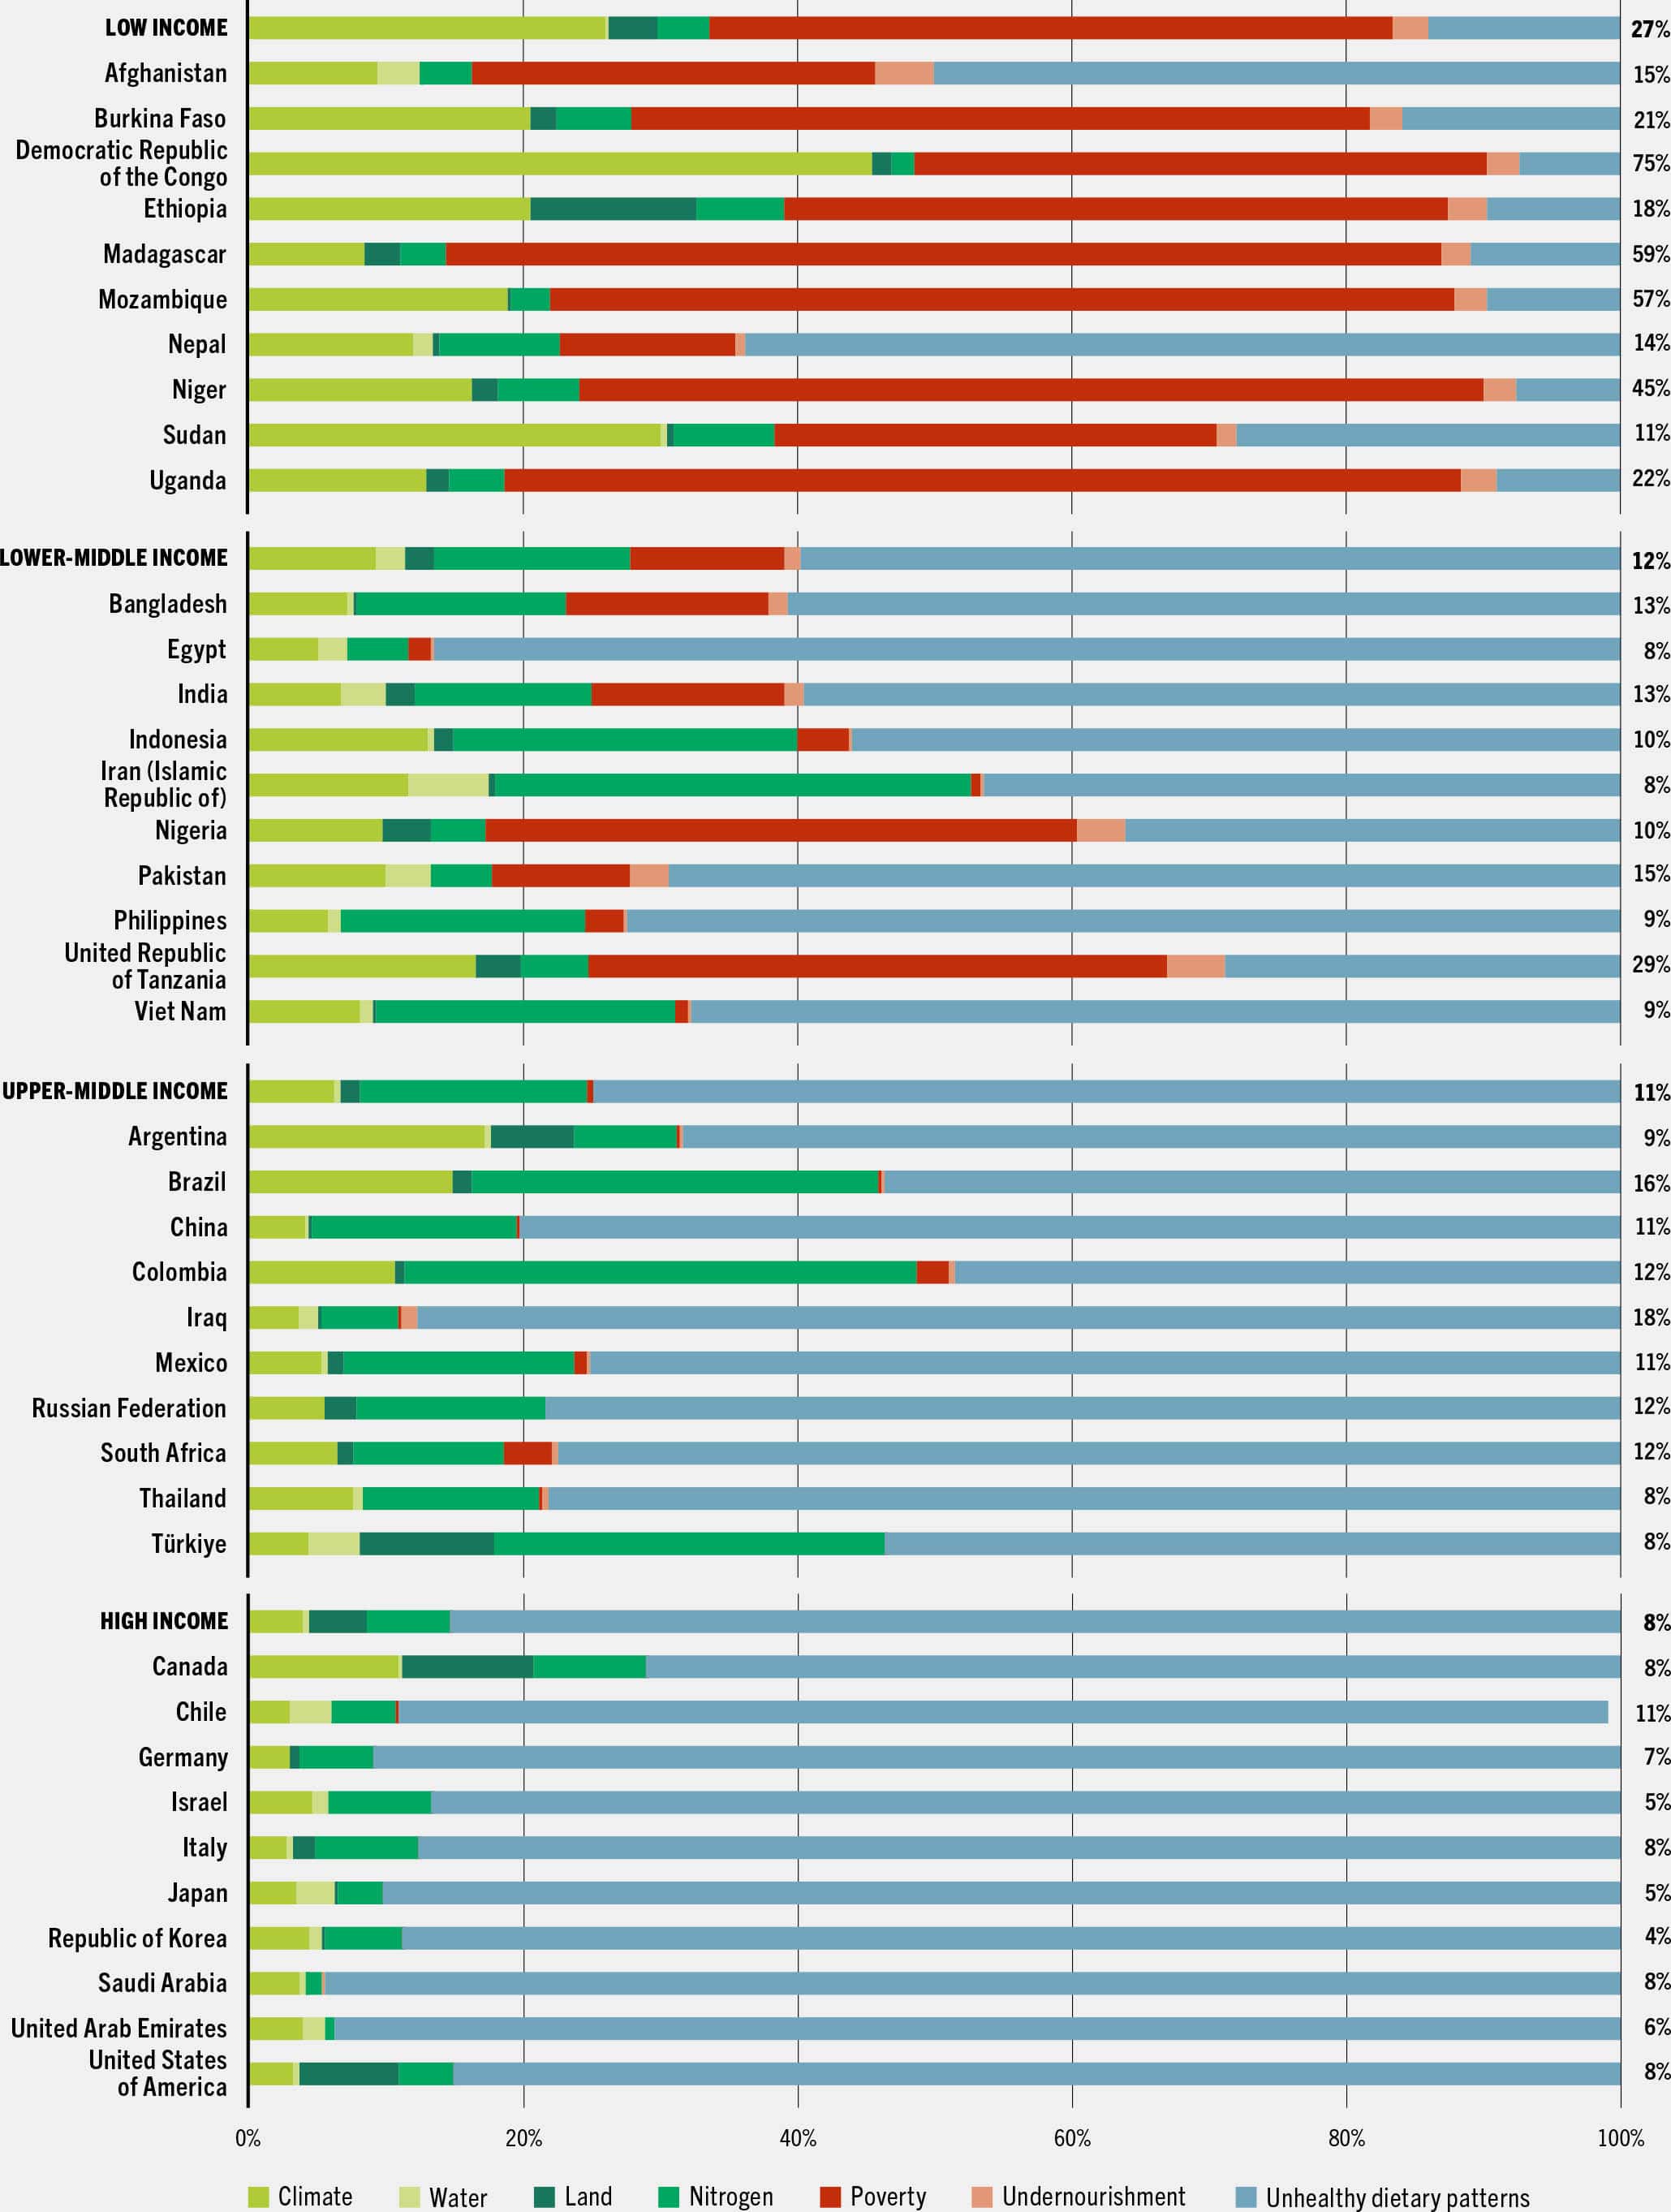
SOURCE: Adapted from Lord, S. 2023. Hidden costs of agrifood systems and recent trends from 2016 to 2023 – Background paper for The State of Food and Agriculture 2023. FAO Agricultural Development Economics Technical Study, No. 31. Rome, FAO.
Lower-middle-income countries show the highest variation in the distribution of quantified hidden costs. For instance, in Nigeria and the United Republic of Tanzania, social hidden costs associated with poverty and undernourishment dominate, while in Pakistan, Viet Nam and particularly Egypt, it is those from unhealthy dietary patterns causing obesity and NDCs, as more commonly seen in high-income countries. Pakistan also faces major challenges associated with poverty and undernourishment, whereas in Viet Nam, nitrogen emissions are a greater concern.
Upper-middle-income countries present differences in cost distribution, despite some apparent similarities. For example, Colombia and Mexico are found to have similar total quantified hidden costs as a share of GDP, but there is variation in the drivers: while both nitrogen and diet-related factors are significant issues in Colombia, followed by climate change, those associated with dietary patterns are more dominant in Mexico. This is seen in other upper-middle-income countries. Brazil and Iraq have relatively high total quantified hidden costs as a share of GDP, with Brazil having higher costs associated with nitrogen and climate change – the latter driven by GHG emissions linked to deforestation – and Iraq bearing hidden costs mostly related to unhealthy dietary patterns.
High-income countries, in contrast, do not show much variation, as health costs driven by productivity losses due to dietary patterns dominate in every country, followed by different environmental issues. This points to the need to promote healthier diets and environmental stewardship in high-income countries. In many of these countries, policies and investments already target environmental issues, but there is much less focus on diets, as these often come down to personal choice and preference, which are more difficult to regulate or shift.
Low-income countries present mainly social hidden costs (see Figure 7 and Figure 8) in the form of poverty and productivity losses from undernourishment. This is especially true for countries such as Madagascar, the Niger and Uganda. However, other hidden costs can emerge in these countries, such as climate change-related costs in the Democratic Republic of the Congo (likely due to deforestation) and diet-related costs in Afghanistan and Nepal. In Ethiopia, multiple environmental concerns, such as climate change, land-related ecosystem service costs and nitrogen emissions, collectively contribute to hidden costs. In low-income countries, the priority might be for policies and investments that improve livelihoods, while acknowledging that, as these countries develop, productivity losses from changing diets are likely to increase, as seen in higher-income country groups.
It is also important to note that, should currently excluded hidden costs be included in the analysis, the relative contribution of each dimension to total hidden costs would probably change by income group. For instance, should hidden costs associated with infant mortality and low birth weight be included, the social dimension of the hidden costs would probably become bigger, relatively speaking, especially in low-income countries, where these problems prevail.23
Unsurprisingly, the countries with the highest net hidden costs are the world’s largest food producers and consumers, with the United States of America accounting for 13 percent of total quantified hidden costs, the European Union 14 percent, and Brazil, the Russian Federation, India and China (the BRIC countries) accounting for 39 percent. With the exception of Brazil, more than 75 percent of hidden costs are associated with dietary patterns. In the case of Brazil, almost half are associated with environmental sources, of which 31 percent are from GHG emissions and 67 percent from nitrogen emissions. However, when considering the share of quantified hidden costs to GDP, low-income countries face higher burdens. In the Democratic Republic of the Congo, for example, the ratio reaches an alarming 75 percent.
Figure 9 underscores the importance of adopting a nuanced TCA approach that considers country specificities when examining the hidden costs of agrifood systems, as these can vary considerably in their composition across and within income groups. By expressing the magnitude of hidden costs in monetary terms, TCA further enables the prioritization of targeted interventions. However, as highlighted in the two-phase process introduced in Chapter 1, identifying these potential priorities is just the very first step in a process that will lead to action. Identifying options further requires understanding abatement costs, which refer to the costs incurred in avoiding or reducing hidden costs and which are excluded from the analysis in this report, while hidden costs estimate the costs of inaction (see Glossary). It is important to consider the latter, as a specific subcategory may be causing significant costs to an economy, but abating these costs may be just as costly, or even costlier, making it difficult to reduce their negative impact. Take the case of Argentina and Colombia. Figure 9 suggests a focus on healthy diets in both countries, followed by climate change considerations in Argentina and nitrogen emissions in Colombia. However, redirecting consumer preferences and choices towards healthy and sustainable diets can be extremely challenging and potentially costly. It is necessary to understand how much such an intervention would cost and by how much it would reduce hidden costs (that is, the benefits of the action).
Another important element to consider is the entry point for action. The scope of the agrifood systems presented in Figure 5 highlights the numerous points along the food value chain involving multiple actors that can negatively impact society. For example, GHGs and nitrogen can be released into the environment during fertilizer production at farm level, but also downstream in the value chain, all the way to consumers via waste and sewerage. Narrowing down which hidden costs to focus on and mapping them to specific actors in agrifood systems is the next step in the process of identifying targeted actions.

