


Prevalence of Undernourishment
Definition: Undernourishment is defined as the condition of an individual whose habitual food consumption is insufficient to provide, on average, the amount of dietary energy required to maintain a normal, active and healthy life.
How it is reported: The indicator (denominated “prevalence of undernourishment” [PoU]) is an estimate of the percentage of individuals in the population that are in a condition of undernourishment. National estimates are reported as three-year moving averages, to control for the low reliability of the estimates of some of the underlying parameters due to elements for which complete, reliable information is very scarce. This includes, for example, the year-to-year variation in food commodity stocks, one of the components of the annual FAO Food Balance Sheets (FBS). Regional and global aggregates, on the other hand, are reported as annual estimates, as possible estimation errors are expected not to be correlated and therefore expected to be reduced to acceptable levels when aggregating across countries.
The entire series of PoU values is revised with each new edition of this report to reflect new data and information that FAO has obtained since the release of the previous edition. As this process usually implies backward revisions of the entire PoU series, readers are advised to refrain from comparing series across different editions of this report and should always refer to the current edition of the report, including for values in past years.
Methodology: To compute an estimate of the prevalence of undernourishment in a population, the probability distribution of habitual dietary energy intake levels (expressed in kcal per person per day) for the average individual is modelled as a parametric probability density function, f(x).1, 2 The indicator is obtained as the cumulative probability that the habitual dietary energy intake (x) is below the minimum dietary energy requirement (MDER) (i.e. the lowest limit of the range of energy requirements that is appropriate for the population’s representative average individual) as in the formula below:
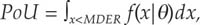
where θ is a vector of parameters that characterizes the probability density function. In the actual computations, the distribution is assumed to be lognormal and thus fully characterized by only two parameters: the mean dietary energy consumption (DEC) and its coefficient of variation (CV).
Data source: Different data sources are used to estimate the different parameters of the model.
Minimum dietary energy requirement (MDER): Human energy requirements for an individual in a given sex/age class are determined on the basis of normative requirements for basic metabolic rate per kilogram of body mass, multiplied by the ideal weights that a healthy person of that sex/age class may have, given their height, and then multiplied by a coefficient of physical activity level (PAL) to take into account physical activity.bl Given that both healthy body mass indices (BMIs) and normal PALs vary among active and healthy individuals of the same sex and age, a range of energy requirements apply to each sex and age group of the population. The MDER for the average individual in the population, which is the parameter used in the PoU formula, is obtained as the weighted average of the lower bounds of the energy requirement ranges for each sex and age group, using the shares of the population in each sex and age group as weights. Similar to the MDER, the average dietary energy requirement (ADER) (used to estimate the one component of the CV as described below) is estimated using the average values of the PAL category “Active or moderately active lifestyle”.4
Information on the population structure by sex and age needed to compute the MDER is available for most countries in the world and for each year from the United Nations Department of Economic and Social Affairs World Population Prospects, revised every two years. This edition of The State of Food Security and Nutrition in the World uses the 2022 revision of the World Population Prospects.5
Information on the median height in each sex and age group for a given country is derived from a recent Demographic and Health Survey (DHS) or from other surveys that collect anthropometry data on children and adults. Even if such surveys do not refer to the same year for which the PoU is estimated, the impact of possible small intervening changes in median heights over the years on the MDER, and therefore on the PoU estimates, is expected to be negligible.
Dietary energy consumption (DEC): Ideally, DEC could be estimated from data on food consumption coming from nationally representative household surveys (such as Living Standards Measurement Study [LSMS] surveys or Household Consumption and Expenditure Surveys). However, only very few countries conduct such surveys on an annual basis. Thus, in FAO’s PoU estimates for global monitoring, DEC values are estimated from the dietary energy supply (DES) reported in the FBS, compiled by FAO for most countries in the world.6
Since the last edition of this report, the FBS domain on FAOSTAT has been updated with new values of the series up to 2021 for all countries. In addition, at the time of closing this report, the FBS series were updated to 2022 for the following 68 countries, selected as a priority due to the high contribution they make to the total number of undernourished people in the world: Afghanistan, Angola, Argentina, Bangladesh, Benin, Bolivia (Plurinational State of), Brazil, Burkina Faso, Cameroon, Central African Republic, Chad, Colombia, Congo, Côte d’Ivoire, Democratic People’s Republic of Korea, Democratic Republic of the Congo, Ecuador, Egypt, Ethiopia, Ghana, Guatemala, Guinea, Haiti, Honduras, India, Indonesia, Iran (Islamic Republic of), Iraq, Japan, Jordan, Kenya, Lesotho, Liberia, Madagascar, Malawi, Malaysia, Mali, Morocco, Mozambique, Myanmar, Nepal, Nicaragua, Niger, Nigeria, Pakistan, Papua New Guinea, Peru, Philippines, Rwanda, Saudi Arabia, Senegal, Sierra Leone, Somalia, South Africa, South Sudan, Sri Lanka, Sudan, Syrian Arab Republic, Thailand, Togo, Uganda, Ukraine, United Republic of Tanzania, Venezuela (Bolivarian Republic of), Viet Nam, Yemen, Zambia and Zimbabwe. In addition, FBS DES series were updated up to 2022 for another group of 27 countries that contribute less to the total number of undernourished people: Albania, Armenia, Bahamas, Bosnia and Herzegovina, Cabo Verde, Chile, China (mainland), Costa Rica, Djibouti, Dominican Republic, El Salvador, Eswatini, Jamaica, Kuwait, Lebanon, Libya, Mauritania, Mongolia, Montenegro, Oman, Panama, Paraguay, Sao Tome and Principe, Slovakia, Timor-Leste, Tunisia and United States of America.
Per capita average DES in 2022 (for countries other than the ones listed above) and in 2023 (for all countries) are nowcast on the basis of the short-run market outlook exercises conducted by FAO to inform the World Food Situation Portal7 and used to calculate the 2022 and 2023 values of DEC for each country.
Waste factors
This edition of the report involved updating the waste factors that are used to calculate the DEC by subtracting the percentage of waste from the DES for all countries. The percentages of food waste at distribution level have been estimated using the FBS data available on FAOSTAT.
Using the percentages given in FAO’s document Global food losses and food waste,8 calorie waste for each food group is calculated and summed up, with the exception that the waste factors used for cereals is 2 percent for all the regions. Finally, the total calorie waste is taken as a percentage of total calories for each year and country. The data are available up to the year 2021. For the years 2022 and 2023, the same value of the year 2021 is used.
For Somalia and Palestine, fish consumption data were missing, so waste factors have been estimated for all other food groups except fish. Guatemala and the Dominican Republic have not been updated.
Coefficient of variation (CV): The CV of habitual DEC in the population is obtained as the geometric mean of two components, labelled respectively CV|y and CV|r:
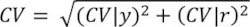
The first component (CV|y) refers to variability in the per capita consumption across households belonging to different sociodemographic strata, and therefore is referred to as the CV “due to income”, while the second component (CV|r) captures variability across individuals, due to differences in sex, age, body mass and PAL that can be found among members of the same household. As these are the same elements that determine energy requirements, the second component is referred to as CV “due to energy requirements”.
CV|y
When reliable data on food consumption are available from nationally representative household surveys, the CV due to income (CV|y) can be estimated directly. Since the last edition of this report, 14 new surveys from the following 13 countries have been processed to update the CV|y: Armenia (2022), Costa Rica (2019), Côte d’Ivoire (2022), India (2011/12 and 2022/23), Jordan (2017), Kazakhstan (2022), Maldives (2016), Mali (2022), Mexico (2022), Niger (2022), Republic of Moldova (2022), Senegal (2022) and Timor-Leste (2015). That makes for a total of 143 surveys from 69 countries for which the estimate of the CV|y is based on data from national surveys.
When no suitable survey data are available, Food Insecurity Experience Scale (FIES) data collected by FAO since 2014 are used to project the changes in the CV|y from 2015 (or from the year of the last food consumption survey, if more recent) up to 2023, based on the observed trend in severe food insecurity. The projections are based on the assumption that observed changes in the extent of severe food insecurity measured with the FIES might be indicative of equivalent changes in the PoU. To the extent that such implied changes in the PoU cannot be fully explained by the “supply-side” effects of changes in average food supplies, they can be confidently attributed to unobserved changes in the CV|y that might have occurred at the same time. Analysis of historical PoU estimates reveals that, on average, and once differences in DEC, MDER and CV|r have been controlled for, differences in the CV|y explain about one-third of the differences in PoU across time and space. Based on all this, for each country for which FIES data are available, the change in the CV|y that may have occurred from 2015, or from the date of the last available survey, is therefore estimated as the change that would generate one-third of a percentage-point change in the PoU for each observed percentage-point change in the prevalence of severe food insecurity. For all other countries, lacking any supporting evidence, the CV|y is kept constant at the last available estimate. As in the last two reports, the nowcast of the CV|y for 2020, 2021, 2022 and 2023 required special treatment to account for the effects of the COVID-19 pandemic (see Supplementary material to Chapter 2).
CV|r
The CV due to energy requirements (CV|r) represents the variability of the distribution of dietary energy requirements of a hypothetical average individual representative of a healthy population, which is also equal to the CV of the distribution of dietary energy intakes of a hypothetical average individual if everyone in the population were perfectly nourished. For estimation purposes, the distribution of dietary energy requirements of such a hypothetical average individual is assumed to be normal and its standard deviation (SD) can be estimated from any two known percentiles. We use the MDER and the ADER mentioned above to approximate the 1st and the 50th percentiles.9, 10 The value of CV|r is then derived as the inverse cumulative standard normal distribution of the difference between the MDER and the ADER.
Challenges and limitations: While formally the state of being undernourished or not is a condition that applies to individuals, given the data usually available on a large scale, it is impossible to reliably identify which individuals in a certain group are actually undernourished. Through the statistical model described above, the indicator can only be computed with reference to a population or a group of individuals for which a sufficiently representative sample is available. The prevalence of undernourishment is thus an estimate of the percentage of individuals in that group that are in such a condition, but it cannot be further disaggregated.
Due to the probabilistic nature of the inference and the margins of uncertainty associated with estimates of each of the parameters in the model, the precision of the PoU estimates is generally low. While it is not possible to formally compute margins of error around PoU estimates, they are expected to exceed 5 percent in most cases. For this reason, FAO does not consider PoU estimates that result lower than 2.5 percent as sufficiently reliable to be reported.
It is important to note that the ranges presented for the values of the PoU in 2020, 2021, 2022 and 2023 should not be interpreted as statistical confidence intervals. Rather, they represent different scenarios used to nowcast the values of CV|y from 2020 to 2023.
Recommended readings:
FAO. 1996. Methodology for assessing food inadequacy in developing countries. In: The Sixth World Food Survey, pp. 114–143. Rome. https://www.fao.org/4/w0931e/w0931e16.pdf
FAO. 2003. Proceedings: Measurement and Assessment of Food Deprivation and Undernutrition: International Scientific Symposium. Rome.
FAO. 2014. Advances in hunger measurement: traditional FAO methods and recent innovations. FAO Statistics Division Working Paper, No. 14–04. Rome.
Naiken, L. 2002. Keynote paper: FAO methodology for estimating the prevalence of undernourishment. Paper presented at the Measurement and Assessment of Food Deprivation and Undernutrition International Scientific Symposium, Rome, 26–28 June 2002. Rome, FAO.
Wanner, N., Cafiero, C., Troubat, N. & Conforti, P. 2014. Refinements to the FAO methodology for estimating the prevalence of undernourishment indicator. Rome, FAO.
Prevalence of food insecurity as measured by the Food Insecurity Experience Scale
Definition: Food insecurity as measured by this indicator refers to limited access to food, at the level of individuals or households, due to lack of money or other resources. The severity of food insecurity is measured using data collected with the Food Insecurity Experience Scale Survey Module (FIES-SM), a set of eight questions asking respondents to self-report conditions and experiences typically associated with limited access to food. For purposes of annual SDG monitoring, the questions are asked with reference to the 12 months preceding the survey.
Using sophisticated statistical techniques based on the Rasch model, the information obtained in an FIES-SM survey is validated for internal consistency and converted into a quantitative measure along a scale of severity, ranging from low to high. Based on their responses to the survey items, the individuals or households interviewed in a nationally representative survey of the population are assigned a probability of being in one of three classes: i) food secure or only marginally insecure; ii) moderately food insecure; and iii) severely food insecure, as defined by two globally set thresholds. Based on FIES data collected over three years from 2014 to 2016, FAO has established the FIES reference scale, which is used as the global standard for experience-based food-insecurity measures, and to set the two reference thresholds of severity.
SDG Indicator 2.1.2 is obtained as the cumulated probability of being in the two classes of moderate and severe food insecurity. A separate indicator (FIsev) is computed by considering only the severe food insecurity class.
How it is reported: In this report, FAO provides estimates of food insecurity at two different levels of severity: moderate or severe food insecurity (FImod+sev), and severe food insecurity (FIsev). For each of these two levels, two estimates are reported:
- the prevalence (percent) of individuals in the population living in households where at least one adult was found to be food insecure; and
- the estimated number of individuals in the population living in households where at least one adult was found to be food insecure.
Data source: Since 2014, the eight-question FIES-SM has been applied in nationally representative samples of the adult population (defined as aged 15 or older) in more than 140 countries included in the Gallup© World Poll (GWP), covering more than 90 percent of the world population. In 2023, interviews were conducted in both telephone and face-to-face modality. Telephone interviews were maintained in some countries already covered with this modality in 2020 given the high risk of community transmission from conducting face-to-face data collection during the COVID-19 pandemic.
Gallup© traditionally uses telephone surveys in Northern America, Western Europe, some parts of Asia, and Cooperation Council for the Arab States of the Gulf countries. In Central and Eastern Europe, much of Latin America, and nearly all of Asia, the Near East and Africa, an area frame design is used for face-to-face interviewing.
In most countries, samples include about 1 000 individuals, with larger samples of 3 000 individuals in India, 3 500 in China (mainland) and 2 000 in the Russian Federation. No data were collected in China (mainland) in 2023.
National government survey data were used to calculate the food insecurity prevalence estimates for at least one year for 70 countries, covering more than a quarter of the world population, by applying FAO’s statistical methods to internally validate and adjust national results to the same global reference standard. Once validated, the data are used to inform or update the national series (see description below). When the population of a country accounts for a large proportion of the regional population, this may result in revision or back revision of the regional and subregional series. For this reason, comparisons of assessments across different versions of this report should be avoided, and the current version should be considered as the reference.
In this edition of the report, national government survey data from the following 70 countries were used: Afghanistan, Angola, Armenia, Belize, Benin, Botswana, Brazil, Burkina Faso, Burundi, Cabo Verde, Canada, Chad, Chile, Colombia, Congo, Costa Rica, Côte d’Ivoire, Dominican Republic, Ecuador, Fiji, Ghana, Greece, Grenada, Guinea-Bissau, Guyana, Honduras, Indonesia, Israel, Kazakhstan, Kenya, Kiribati, Kyrgyzstan, Lesotho, Malawi, Mali, Mexico, Mozambique, Namibia, Niger, Nigeria, Pakistan, Palestine, Papua New Guinea, Paraguay, Philippines, Republic of Korea, Russian Federation, Saint Kitts and Nevis, Saint Lucia, Saint Vincent and the Grenadines, Samoa, Senegal, Seychelles, Sierra Leone, South Africa, South Sudan, Sri Lanka, Sudan, Timor Leste, Togo, Tonga, Uganda, United Arab Emirates, United Republic of Tanzania, United States of America, Uruguay, Vanuatu, Viet Nam, Yemen and Zambia. National data for these countries are considered for the year or years when they are available. For the remaining years, the following strategy was followed:
- When more than one year of national data is available, the missing years are linearly interpolated.
- If only one year of data is available, missing years are informed as follows:
- –using FAO data if considered compatible with the national surveys;
- –imputed using the trend suggested by FAO data if national data are not compatible;
- –imputed using the trend of the subregion if no other reliable and timely information is available; or
- –considered constant to the level of the national survey if the subregion cannot be computed or the trend of other surveys or the subregion is not applicable to the country-specific situation considering evidence found in support of the trend (e.g. evolution of poverty, extreme poverty, employment and food inflation, among others); this applies also to countries where the prevalence of food insecurity is very low (below 3 percent at the severe level) or very high (above 85 percent at the moderate or severe level).
Given the heterogeneity of the survey sources and the small sample size of some of the FAO surveys, new data can occasionally cause a notably large increase or decrease from one year to the next. In such situations, the protocol is to look for external information for the country (data and/or reports, possibly in consultation with country experts like FAO country or regional officers) to explore whether big shocks or interventions have occurred. If the trend can be justified by supporting evidence, but seems excessive, the trend is kept but smoothed (e.g. using the three-year average). Otherwise, the same protocol used for missing years is applied (i.e. keeping the level constant or applying the subregional trend). In 2023, no FIES data were collected in China (mainland), therefore the trend was kept constant.
Methodology: The data were validated and used to construct a scale of food-insecurity severity using the Rasch model, which postulates that the probability of observing an affirmative answer by respondent i to question j is a logistic function of the distance, on an underlying scale of severity, between the position of the respondent, ai, and that of the item, bj.
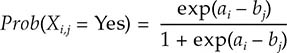
By applying the Rasch model to the FIES data, it is possible to estimate the cross-country comparable probability of being food insecure (pi,L) at each level of severity of food insecurity L (moderate or severe, or severe only), for each respondent i, with 0 < pi,L < 1.
The prevalence of food insecurity at each level of severity (FIL) in the population is computed as the weighted sum of the probability of being food insecure for all respondents (i) in a sample:
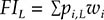
where wi are post-stratification sampling weights that indicate the proportion of individuals or households in the national population represented by each record in the sample.
As only individuals aged 15 years or more are sampled in the GWP, the prevalence estimates directly produced from these data refer to the population aged 15 years and older. To arrive at the prevalence and number of individuals (of all ages) in the population, an estimate is required of the number of people living in households where at least one adult is estimated to be food insecure. This involves a multistep procedure detailed in Annex II of Methods for estimating comparable rates of food insecurity experienced by adults throughout the world (see link in the “Recommended readings” section, below).
Regional and global aggregates of food insecurity at moderate or severe, and severe levels, FIL,r, are computed as:
where r indicates the region, FIL,c is the value of FI at level L estimated for country c in the region, and Nc is the corresponding population size. When no estimate of FIL is available for a country, it is assumed to be equal to the population-weighted average of the estimated values of the remaining countries in the same subregion. A regional aggregate is produced only if the countries for which an estimate is available cover at least 50 percent of the region’s population.
Universal thresholds are defined on the FIES global standard scale (a set of item parameter values based on results from all countries covered by the GWP in 2014–2016) and converted into corresponding values on local scales. The process of calibrating each country’s scale against the FIES global standard can be referred to as equating and permits the production of internationally comparable measures of food insecurity severity for individual respondents, as well as comparable national prevalence rates.
The problem stems from the fact that, when defined as a latent trait, the severity of food insecurity has no absolute reference against which it could be evaluated. The Rasch model enables identification of the relative position that the various items occupy on a scale that is denominated in logit units but whose “zero” is arbitrarily set, usually to correspond to the mean estimated severity. This implies that the zero of the scale changes in each application. To produce comparable measures over time and across different populations requires establishing a common scale to use as a reference and finding the formula needed to convert measures across different scales. As is the case for converting measures of temperature across difference measuring scales (such as Celsius and Fahrenheit), this requires the identification of a number of “anchoring” points. In the FIES methodology, these anchoring points are the severity levels associated with the items whose relative position on the scale of severity can be considered equal to that of the corresponding items on the global reference scale. The “mapping” of the measures from one scale to the other is then obtained by finding the formula that equates the mean and the standard deviation of the common items’ severity levels.
Challenges and limitations: When food-insecurity prevalence estimates are based on FIES data collected in the GWP, with national sample sizes of about 1 000 individuals in most countries, confidence intervals rarely exceed 20 percent of the measured prevalence (that is, prevalence rates of 50 percent would have margins of error of up to plus or minus 5 percent). Confidence intervals are much smaller, however, when national prevalence rates are estimated using larger samples and for estimates referring to aggregates of several countries. To reduce the impact of year-to-year sampling variability, country-level estimates are presented as three-year averages, computed as averages of all available years in the considered triennia.
National government surveys are the preferred source to inform food insecurity prevalence estimates based on the FIES. However, they may not be available on a yearly basis and data may become available to FAO with some years of delay. In the absence of annual national surveys, the time series is informed using the strategy described above (see “Data source”). This may result in a back revision of the series.
Recommended readings:
FAO. 2016. Methods for estimating comparable rates of food insecurity experienced by adults throughout the world. Rome. https://openknowledge.fao.org/handle/20.500.14283/i4830e
FAO. 2018. Voices of the Hungry. In: FAO. [Cited 28 April 2020]. https://www.fao.org/in-action/voices-of-the-hungry
Cafiero, C., Viviani, S. & Nord, M. 2018. Food security measurement in a global context: The food insecurity experience scale. Measurement, 116: 146–152. [Cited 25 June 2024].
https://www.sciencedirect.com/science/article/pii/S0263224117307005
Cost of a healthy diet
Definition: The cost of a healthy diet is defined as the cost of purchasing the least expensive, locally available foods that may compose a diet that meets requirements for energy and food-based dietary guidelines (FBDGs) for a reference person within energy balance set at 2 330 kcal per day.
How it is reported: The indicator (denominated “cost of a healthy diet” [CoHD]) is an estimate of the average minimum cost that people must spend in a country to buy the least expensive, locally available foods needed to compose a healthy diet. For cross-country comparability, the cost of a healthy diet is converted from local currency units (LCU) to international dollars using purchasing power parity (PPP) exchange rates for private consumption. The CoHD indicator is thus reported as average PPP dollars per person per day.
Data source: The prices of items in each food group needed for a healthy diet are obtained using retail food price data from the International Comparison Program (ICP), coordinated by the World Bank, which estimates PPPs based on a range of internationally standardized items expressed in LCU.11 For international comparisons, prices in LCU are converted into international dollars using PPP conversion factors for private consumption computed by the ICP and reported in the World Development Indicators (WDI) database.12 To update the cost of a healthy diet in gap years where ICP rounds are not available, food consumer price index (CPI) data published by FAO are used.13
Methodology:
Method for defining a healthy diet basket
Given that the foods selected for a healthy diet vary by local context, countries have developed national FBDGs to recommend healthy dietary habits that reflect their specific cultural context and locally available foods. However, not all countries have FBDGs, and those that do often lack quantifiable recommendations in terms of food quantities and kilocalories. To address this data limitation and create a global standard of a healthy diet that reflects the commonalities in dietary guidelines worldwide, ten quantified FBDGs, representative of different world regions and compiled in recent years, have been selected. The Healthy Diet Basket (HDB) has been created to set this global standard. It is based on the average food group proportions across national FBDGs, using the median food group amounts recommended in the ten quantified FBDGs. The HDB is identified to meet a dietary energy intake of 2 330 kcal per day and consists of locally available items from six food groups: starchy staples; vegetables; fruits; animal source foods; legumes, nuts and seeds; oils and fats. Specifically, it is designed to provide 1 160 kcal from starchy staples, 110 kcal from vegetables, 160 kcal from fruits, 300 kcal from animal source foods, 300 kcal from legumes, nuts and seeds, and 300 kcal from oils and fats. The cost of a healthy diet is estimated for 169 countries from year 2017 to year 2022.
Methods for cost calculation when ICP data are available
To calculate the least-cost healthy diet, at each time and place, each ICP food item is classified into its food group, and the cheapest items that reach HDB requirements are identified. For each country, a total of 11 least-cost food items are selected in the HDB: two for starchy staples, three for vegetables, two for fruits, two for animal source foods, one for legumes, nuts and seeds, and one for oils and fats. The cost per day of each food group is calculated as the price of acquiring the selected items in that group multiplied by the quantity containing the energy content required by the HDB for that group. Finally, by summing the cost of the six food groups, the cost of a healthy diet is determined in each country.
Methods for cost update when ICP data are unavailable
The ICP is currently the only source of retail food price data for internationally standardized items, and these data are only made available once every three to four years, which does not allow for an annual updating of healthy diet costs. The last series of ICP data was released in 2024, and it refers to 2021 prices. For updating the cost indicator with reference to the years between the ICP publication cycles, food CPIs published by FAO are applied to the cost of a healthy diet in 2021 to estimate the cost in the years when ICP rounds are not available. This dataset tracks changes in monthly general and food CPIs at the national level with reference to a base year of 2015. The annual CPIs are computed as simple averages of the 12 monthly CPIs within a year. The cost of a healthy diet, c(PPP)t, is estimated for missing years by multiplying each country’s 2021 actual cost, expressed in LCU, by the food consumer price index (FCPI) ratio, and finally dividing by PPPs:
Where:

and
For countries with missing PPP data, PPP imputations are applied using an Autoregressive Integrated Moving Average with External Explanatory Variable (ARIMAX) model. In line with the World Bank’s WDI methodology for PPP extrapolations, the ratio between a country’s general CPI and the CPI for the base country (in this case, the United States of America) is included in the model specification as a key predictor of PPP values. Furthermore, per capita gross domestic product (GDP) and per capita household consumption expenditure are also added as external covariates, and the Holt-Winter smoothing methodology is applied to both series to fill the gaps, if needed. The ARIMAX approach allows to estimate, for each country, several model specifications that include an autoregressive component, an integration component, a moving average, and a combination of the three. The best specification is selected when at least the estimated coefficient of the CPI ratio is statistically significant, followed by the statistical significance of the ARIMAX parameters. For countries and territories showing abnormal PPP series over time, the CPI ratio is found to be the only statistically significant coefficient to affect the variability of the PPP values. On the contrary, for countries and territories with a less volatile PPP series, the historical PPP trend also plays a role in predicting PPP values, as well as the coefficient estimates of per capita GDP and/or per capita expenditure. The ARIMAX computes the predicted values on the best specification selected for each country/territory.
Challenges and limitations: Data on internationally standardized food prices are not available every year to allow annual monitoring. A limitation of the method used to update the cost of a healthy diet is that changes in the cost depend on food CPIs and do not reflect item-specific changes in food prices, nor any differential changes in the price of different food groups.bm FAO, in collaboration with the World Bank, is exploring how to expand reporting of item-level prices to allow more frequent and robust monitoring of the cost of a healthy diet.
Regional and global aggregates of the cost of a healthy diet are computed using an arithmetic mean across the countries falling into each group.
Recommended readings:
Herforth, A., Bai, Y., Venkat, A., Mahrt, K., Ebel, A. & Masters, W.A. 2020. Cost and affordability of healthy diets across and within countries. Background paper for The State of Food Security and Nutrition in the World 2020. FAO Agricultural Development Economics Technical Study, No. 9. Rome, FAO. https://doi.org/10.4060/cb2431en
Herforth, A., Venkat, A., Bai, Y., Costlow, L., Holleman, C. & Masters, W.A. 2022. Methods and options to monitor the cost and affordability of a healthy diet globally. Background paper to The State of Food Security and Nutrition in the World 2022. FAO Agricultural Development Economics Working Paper, 22-03. Rome, FAO. https://doi.org/10.4060/cc1169en
Bai, Y., Conti, V., Ebel, A., Cafiero, C., Herforth, A., Rissanen, M.O., Rosero Moncayo, J. & Masters, W.A. (forthcoming). Methods for monitoring the cost of a healthy diet based on price data from the International Comparison Program. FAO Statistics Division Working Paper. Rome, FAO.
Unaffordability of a healthy diet
Definition: The unaffordability of a healthy diet is defined as the inability of a household or of an individual to pay the amount of money needed to acquire the least-cost combination of locally available foods that meets the requirement for a healthy diet, after having accounted for the portion of their income they have to reserve for acquiring all basic needs other than food.
How it is reported: The main indicator (denominated “prevalence of unaffordability” [PUA]) is an estimate of the percentage of individuals in a population whose disposable income, net of the amount needed to acquire all basic non-food goods and services, is lower than the minimum cost of a healthy diet. National estimates are obtained by contrasting the country-specific income distributions against a threshold (r) obtained by summing the cost of a healthy diet with the relevant cost of basic non-food needs (n). Along with the PUA, the number of people unable to afford a healthy diet (NUA) is also computed by multiplying PUA by the reference population size.
The entire series (2017–2022) of PUA and NUA estimates are revised with each new edition of this report to reflect new cost data, new population data, and updated income distributions. As this process usually implies backward revisions of the entire PUA and NUA series, readers are advised to refrain from comparing series across different editions of this report and should always refer to the current edition of the report, including for values in past years.
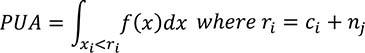
Methodology: To estimate the PUA in a population, a daily per capita cost threshold is computed for each country. Due to the lack of information to determine the country-specific cost of basic non-food goods and services, differences in the non-food spending are based on the four World Bank country income classification groups. Therefore, the daily per capita cost threshold combines the cost of a healthy diet in a country i and the basic cost of non-food needs for the income group j to which country i belongs. The resulting cost threshold ri is determined as follows:
where ci is the cost of a healthy diet in a country, and nj is the cost of basic non-foods for income group j. The final ni is expressed in 2017 PPP dollars, and is calculated by multiplying World Bank international poverty lines by a share of total expenditure to be reserved for non-food basic goods and services that is specific to each income group, as follows:
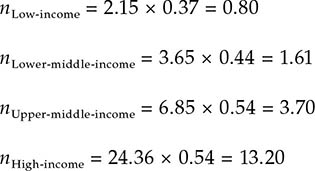
The shares of income to be reserved for non-food goods and services are determined with reference to those reported by households that belong to the second quintile of the income distribution for low- and lower-middle-income countries, and by those in the first quintile for upper-middle- and high-income countries. These shares are derived from recent household surveys compiled by the World Bank, including real consumption information by income quintile for 71 countries from different income groups. (see Supplementary material to Chapter 2).
Finally, the cost threshold ri is compared with the country-specific income distributions xi that reflect a household’s disposable income to estimate the percentage of the population whose income falls below that threshold, as in the formula below:
Data source: Income distributions are sourced by the World Bank Poverty and Inequality Platform and are available for around 150 countries up to 2022.14
Regional and global aggregates of the prevalence of unaffordability are computed as the population-weighted averages of the PUA estimated for the countries for which data are available, as follows:
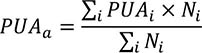
where a indicates the region or other aggregate, PUAi is the value of PUA estimated for country i in the aggregate, and Ni is the corresponding population size. A regional aggregate is produced only if the countries for which an estimate is available cover at least 50 percent of the aggregate’s population.
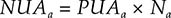
The number of people unable to afford a healthy diet (NUAa) is then obtained by multiplying the average PUAa – calculated from countries with available data – by the total population size Na of all countries belonging to that aggregate.
For Comoros and Taiwan Province of China, data on unaffordability are available only in 2017 and 2021. Therefore, a linear interpolation is used to estimate the values for 2018, 2019 and 2020, and the 2021 value is applied for 2022. For South Sudan and the Syrian Arab Republic, data are available only for 2021, so the 2021 value is used for all other years to calculate the aggregate statistics. In Lebanon, the 2020 value is applied to years 2017, 2018 and 2019, where information is missing. The global NUA estimate is obtained by multiplying the PUA for each of the five world regions by the total population size in each region. Calculating the global NUA estimate as the sum of the NUA estimates of other country groupings, such as those based on income levels, should be avoided. Population data are taken from the 2022 revision of the World Population Prospects.5
Challenges and limitations: In this edition of the report, method refinements are made to recognize that the cost of non-food needs varies across countries. However, due to the lack of country-specific information, the difference in non-food spending is incorporated across income groups, not yet across countries. Furthermore, besides the need to apply a correction to account for differences across countries, another important aspect is to recognize that the cost of a minimally dignified standard of living (r = c + n) also varies within each country. Especially for large, and diverse countries, the failure to account for such differences, and the use of a cost threshold r set at the national average, may result in biased estimates of unaffordability. The direction and extent of the bias will depend on the direction and the magnitude of the possible correlation that exists between income levels and the correct, location-specific threshold.
Recommended readings:
Bai, Y., Herforth, A., Cafiero C., Conti V., Rissanen, M.O., Masters, W.A & Rosero Moncayo, J. (forthcoming). Methods for monitoring the affordability of a healthy diet. FAO Statistics Division Working Paper. Rome, FAO.
Herforth, A., Bai, Y., Venkat, A., Mahrt, K., Ebel, A. & Masters, W.A. 2020. Cost and affordability of healthy diets across and within countries. Background paper for The State of Food Security and Nutrition in the World 2020. FAO Agricultural Development Economics Technical Study, No. 9. Rome, FAO. https://doi.org/10.4060/cb2431en
Wasting in children under five years of age
Definition: Weight (kg) for height/length (cm) <−2 SD of the WHO Child Growth Standards median.
How it is reported: This is the percentage of children aged 0 to 59 months who are <−2 SD from the median weight-for-height of the WHO Child Growth Standards. The regional and global aggregates presented are based on the report Levels and trends in child malnutrition: UNICEF/WHO/World Bank Joint Child Malnutrition Estimates – Key findings of the 2023 edition. The entire series of aggregates is revised with every new edition of the key findings report. Readers are advised to refrain from comparing regional and global series with prior editions of the report. Country level estimates are based on the UNICEF/WHO/World Bank Joint Child Malnutrition Estimates November 2023 dataset.
Methodology:
Country level
The Joint Child Malnutrition Estimates (JME) dataset contains the point estimate, and where available, the standard error, the 95 percent confidence bounds and the unweighted sample size. Where microdata are available, the JME dataset uses estimates that have been recalculated to adhere to the global standard definition. Where microdata are not available, reported estimates are used, except in cases where adjustments are required to standardize for:
- use of an alternate growth reference from the 2006 WHO Child Growth Standards;
- age ranges that do not include the full 0–59-month age group; and
- data sources that were only nationally representative for populations residing in rural areas.
Regional and global aggregates
The wasting prevalence data derived from national data sources in the JME March 2023 dataset were used to generate regional and global estimates from 1990 to 2022, using the JME subregional multilevel model and applying population weights for children under five years of age from the 2022 revision of the World Population Prospects.5
Data sources: Nationally representative household surveys, e.g. DHS, Multiple Indicator Cluster Surveys (MICS), Standardized Monitoring and Assessment of Relief and Transition (SMART) surveys, and LSMS surveys are the most common nationally representative data sources that specifically collect child nutrition data on height, weight and age of children under five years of age, and which can be used to generate national-level prevalence estimates for wasting. Some administrative data sources (e.g. from surveillance systems) are also included where population coverage is high.
Given that country surveys can be collected during any season, the prevalence estimate from any survey may be at a high or a low, or it may fall somewhere in between if data collection spans several seasons. Thus, the prevalence of wasting captures the situation of wasting at a specific point in time and not over an entire year. Variations in seasons across surveys make it difficult to draw inferences on trends.
Challenges and limitations: The recommended periodicity for countries to report on wasting is every three to five years; however, for some countries, data are available less frequently. While every effort has been made to maximize the comparability of statistics across countries and over time, country data may differ in terms of data collection methods, population coverage and estimation methods. Survey estimates come with levels of uncertainty due to both sampling errors and non-sampling errors (technical measurement errors, recording errors, and so on). Neither of the two sources of error has been fully taken into account for deriving estimates at the country or regional and global levels.
Recommended readings:
de Onis, M., Blössner, M., Borghi, E., Morris, R. & Frongillo, E.A. 2004. Methodology for estimating regional and global trends of child malnutrition. International Journal of Epidemiology, 33(6): 1260–1270. https://doi.org/10.1093/ije/dyh202
UNICEF, WHO & World Bank. 2021. Technical notes from the background document for country consultations on the 2021 edition of the UNICEF-WHO-World Bank Joint Malnutrition Estimates. SDG Indicators 2.2.1 on stunting, 2.2.2a on wasting and 2.2.2b on overweight. New York, USA, UNICEF. data.unicef.org/resources/jme-2021-country-consultations
UNICEF, WHO & World Bank. 2023. Levels and trends in child malnutrition. UNICEF / WHO / World Bank Group Joint Child Malnutrition Estimates – Key findings of the 2023 edition. New York, USA, UNICEF, Geneva, Switzerland, WHO and Washington, DC, World Bank. https://data.unicef.org/resources/jme-report-2023, http://www.who.int/teams/nutrition-and-food-safety/monitoring-nutritional-status-and-food-safety-and-events/joint-child-malnutrition-estimates, https://datatopics.worldbank.org/child-malnutrition
WHO. 2014. Comprehensive Implementation Plan on maternal, infant and young child nutrition. Geneva, Switzerland. https://www.who.int/publications/i/item/WHO-NMH-NHD-14.1
WHO. 2024. Nutrition Landscape Information System (NLIS) country profile indicators: interpretation guide. Second edition. Geneva, Switzerland. https://www.who.int/publications/i/item/9789241516952
Stunting in children under five years of age
Definition: Stunting is defined as height/length (cm) for age (days) <−2 SD of the WHO Child Growth Standards median.
How it is reported: This is the percentage of children aged 0 to 59 months who are <−2 SD from the median height-for-age of the WHO Child Growth Standards. The estimates presented are based on the report Levels and trends in child malnutrition: UNICEF/WHO/World Bank Joint Child Malnutrition Estimates – Key findings of the 2023 edition. The entire series of estimates is revised with every new edition of the key findings report. Readers are advised to refrain from comparing series with prior editions of the report.
Methodology:
Country level
The JME dataset contains the point estimate, and where available, the standard error, the 95 percent confidence bounds and the unweighted sample size. Where microdata are available, the JME dataset contains estimates that have been recalculated to adhere to the global standard definition. Where microdata are not available, reported estimates are presented, except in cases where adjustments are required to standardize for:
- use of an alternate growth reference from the 2006 WHO Child Growth Standards;
- age ranges that do not include the full 0–59-month age-group; and
- data sources that were only nationally representative for populations residing in rural areas.
Based on the JME March 2023 dataset, the prevalence of stunting was modelled at logit (log-odds) scale using a penalized longitudinal mixed model with a heterogeneous error term. The quality of the models was quantified with model-fit criteria that balance the complexity of the model with the closeness of the fit to the observed data. The proposed method has important characteristics, including non-linear time trends, regional trends, country-specific trends, covariate data and a heterogeneous error term. All countries with data contribute to estimates of the overall time trend and the impact of covariate data on the prevalence. The covariate data consisted of linear and quadratic sociodemographic index (SDI),bn average health system access over the previous five years, and data source type.
Annual country-level modelled estimates from 2000 to 2022 for stunting were disseminated by the JME in 2023 for 159 countries with at least one data point in the JME country dataset (e.g. from a household survey). Modelled country estimates were also produced for an additional 46 countries, used solely for the generation of regional and global aggregates. Modelled estimates for these 46 countries are not shown because they did not have any household surveys in the JME dataset. The uncertainty intervals are important in monitoring trends, especially for countries with sparse data and where primary data sources present large sampling errors. When only sparse data are available in the most recent period, the inclusion of a survey can induce a substantial change in the predicted trajectory. For this reason, uncertainty intervals are needed to enhance trend interpretability in terms of the caution level employed. The uncertainty intervals for the estimates have been tested and validated.
Regional and global aggregates
Global and regional aggregates for all years from 2000 to 2022 were derived as the respective country averages weighted by the countries’ under-five population from the 2022 revision of the World Population Prospects,5 using model-based estimates for 205 countries and areas. This includes 159 countries with national data sources (e.g. household surveys) included in the JME country dataset. It also includes 46 countries with modelled estimates generated for development of regional and global aggregates but for which country-modelled estimates are not shown because they did not have any household surveys in the JME country dataset. Confidence intervals were generated based on bootstrapping methodology.
Data sources: Nationally representative household surveys (e.g. DHS, MICS, SMART surveys and LSMS surveys) are the most common nationally representative data sources that specifically collect child nutrition data on height and age of children under five, and which can be used to generate national-level prevalence estimates for stunting. Some administrative data sources (e.g. from surveillance systems) are also included where population coverage is high.
Challenges and limitations: The recommended periodicity for countries to report on stunting is every three to five years; however, for some countries, data are available less frequently. While every effort has been made to maximize the comparability of statistics across countries and over time, country data may differ in terms of data collection methods, population coverage and estimation methods. Survey estimates come with levels of uncertainty due to both sampling errors and non-sampling errors (technical measurement errors, recording errors, and so on). Neither of the two sources of error has been fully taken into account for deriving estimates at the country or regional and global levels.
Recommended readings:
GBD 2019 Risk Factors Collaborators. 2020. Global burden of 87 risk factors in 204 countries and territories, 1990–2019: a systematic analysis for the Global Burden of Disease Study 2019. The Lancet, 396(10258): 1223–1249. https://doi.org/10.1016/s0140-6736(20)30752-2
McLain, A.C., Frongillo, E.A., Feng, J. & Borghi, E. 2019. Prediction intervals for penalized longitudinal models with multisource summary measures: An application to childhood malnutrition. Statistics in Medicine, 38(6): 1002–1012. https://doi.org/10.1002/sim.8024
UNICEF, WHO & World Bank. 2021. Technical notes from the background document for country consultations on the 2021 edition of the UNICEF-WHO-World Bank Joint Malnutrition Estimates. SDG Indicators 2.2.1 on stunting, 2.2.2a on wasting and 2.2.2b on overweight. New York, USA, UNICEF. data.unicef.org/resources/jme-2021-country-consultations
UNICEF, WHO & World Bank. 2023. Levels and trends in child malnutrition. UNICEF / WHO / World Bank Group Joint Child Malnutrition Estimates – Key findings of the 2023 edition. New York, USA, UNICEF, Geneva, Switzerland, WHO and Washington, DC, World Bank. https://data.unicef.org/resources/jme-report-2023, http://www.who.int/teams/nutrition-and-food-safety/monitoring-nutritional-status-and-food-safety-and-events/joint-child-malnutrition-estimates, https://datatopics.worldbank.org/child-malnutrition
WHO. 2014. Comprehensive Implementation Plan on maternal, infant and young child nutrition. Geneva, Switzerland. https://www.who.int/publications/i/item/WHO-NMH-NHD-14.1
WHO. 2024. Nutrition Landscape Information System (NLIS) country profile indicators: interpretation guide. Second edition. Geneva, Switzerland. https://www.who.int/publications/i/item/9789241516952
WHO & UNICEF. 2019. Recommendations for data collection, analysis and reporting on anthropometric indicators in children under 5 years old. Geneva, Switzerland and New York, USA. https://www.who.int/publications/i/item/9789241515559
Overweight in children under five years of age
Definition: Weight (kg) for height/length (cm) >+2 SD of the WHO Child Growth Standards median.
How it is reported: This is the percentage of children aged 0 to 59 months who are >+2 SD from the median weight-for-height of the WHO Child Growth Standards. The estimates presented are based on the report Levels and trends in child malnutrition: UNICEF/WHO/World Bank Joint Child Malnutrition Estimates – Key findings of the 2023 edition. The entire series of estimates is revised with every new edition of the key findings report. Readers are advised to refrain from comparing series with prior editions of the report.
Methodology:
Country level
The JME dataset contains the point estimate, and where available, the standard error, the 95 percent confidence bounds and the unweighted sample size. Where microdata are available, the JME dataset contains estimates that have been recalculated to adhere to the global standard definition. Where microdata are not available, reported estimates are presented, except in cases where adjustments are required to standardize for:
- use of an alternate growth reference from the 2006 WHO Child Growth Standards;
- age ranges that do not include the full 0–59-month age group; and
- data sources that were only nationally representative for populations residing in rural areas.
Based on the JME March 2023 dataset, the prevalence of overweight was modelled at logit (log-odds) scale using a penalized longitudinal mixed model with a heterogeneous error term. The quality of the models was quantified with model-fit criteria that balance the complexity of the model with the closeness of the fit to the observed data. The proposed method has important characteristics, including non-linear time trends, regional trends, country-specific trends, covariate data and a heterogeneous error term. All countries with data contribute to estimates of the overall time trend and the impact of covariate data on the prevalence. The covariate data consisted of linear and quadratic SDI and data source type.
Annual country-level modelled estimates from 2000 to 2022 of overweight were disseminated by the JME in 2023 for 160 countries with at least one data point included in the JME country dataset (e.g. from a household survey). Modelled country estimates were also produced for an additional 45 countries, used solely for the generation of regional and global aggregates. Modelled estimates for these 45 countries are not shown because they did not have any household surveys in the JME dataset. The uncertainty intervals are important in monitoring trends, especially for countries with sparse data and where primary data sources present large sampling errors. When only sparse data are available in the most recent period, the inclusion of a survey can induce a substantial change in the predicted trajectory. For this reason, uncertainty intervals are needed to enhance trend interpretability in terms of the caution level employed. The uncertainty intervals for the estimates have been tested and validated.
Regional and global aggregates
Global and regional aggregates for all years from 1990 to 2022 were derived as the respective country averages weighted by the countries’ under-five population from the 2022 revision of the World Population Prospects,5 using model-based estimates for 205 countries. This includes 160 countries with national data sources (e.g. household surveys) included in the JME country dataset. It also includes 45 countries with modelled estimates generated for development of regional and global aggregates but for which country-modelled estimates are not shown because they did not have any household surveys in the JME country dataset. Confidence intervals were generated based on bootstrapping methodology.
Data sources: Nationally representative household surveys (e.g. DHS, MICS, SMART surveys and LSMS surveys) are the most common nationally representative data sources that specifically collect child nutrition data on height, weight and age of children under five years of age, and which can be used to generate national-level prevalence estimates for overweight. Some administrative data sources (e.g. from surveillance systems) are also included where population coverage is high.
Challenges and limitations: The recommended periodicity for countries to report on overweight is every three to five years; however, for some countries, data are available less frequently. While every effort has been made to maximize the comparability of statistics across countries and over time, country data may differ in terms of data collection methods, population coverage and estimation methods. Survey estimates come with levels of uncertainty due to both sampling errors and non-sampling errors (technical measurement errors, recording errors, and so on). Neither of the two sources of error has been fully considered for deriving estimates at the country or regional and global levels.
Recommended readings:
GBD 2019 Risk Factors Collaborators. 2020. Global burden of 87 risk factors in 204 countries and territories, 1990–2019: a systematic analysis for the Global Burden of Disease Study 2019. The Lancet, 396(10258): 1223–1249. https://doi.org/10.1016/s0140-6736(20)30752-2
McLain, A.C., Frongillo, E.A., Feng, J. & Borghi, E. 2019. Prediction intervals for penalized longitudinal models with multisource summary measures: An application to childhood malnutrition. Statistics in Medicine, 38(6): 1002–1012. https://doi.org/10.1002/sim.8024
UNICEF, WHO & World Bank. 2021. Technical notes from the background document for country consultations on the 2021 edition of the UNICEF-WHO-World Bank Joint Malnutrition Estimates. SDG Indicators 2.2.1 on stunting, 2.2.2a on wasting and 2.2.2b on overweight. New York, USA, UNICEF. data.unicef.org/resources/jme-2021-country-consultations
UNICEF, WHO & World Bank. 2023. Levels and trends in child malnutrition. UNICEF / WHO / World Bank Group Joint Child Malnutrition Estimates – Key findings of the 2023 edition. New York, USA, UNICEF, Geneva, Switzerland, WHO and Washington, DC, World Bank. https://data.unicef.org/resources/jme-report-2023, http://www.who.int/teams/nutrition-and-food-safety/monitoring-nutritional-status-and-food-safety-and-events/joint-child-malnutrition-estimates, https://datatopics.worldbank.org/child-malnutrition
WHO. 2014. Comprehensive Implementation Plan on maternal, infant and young child nutrition. Geneva, Switzerland. https://www.who.int/publications/i/item/WHO-NMH-NHD-14.1
WHO. 2024. Nutrition Landscape Information System (NLIS) country profile indicators: interpretation guide. Second edition. Geneva, Switzerland. https://www.who.int/publications/i/item/9789241516952
WHO & UNICEF. 2019. Recommendations for data collection, analysis and reporting on anthropometric indicators in children under 5 years old. Geneva, Switzerland and New York, USA. https://www.who.int/publications/i/item/9789241515559
Exclusive breastfeeding
Definition: Exclusive breastfeeding for infants under six months of age is defined as receiving only breastmilk and no additional food or drink, not even water.
How it is reported: This is the percentage of infants aged 0 to 5 months who are fed exclusively on breastmilk with no additional food or drink, not even water, in the 24 hours preceding the survey.
The estimates presented are from UNICEF. 2024. Infant and young child feeding. In: UNICEF. [Cited 24 July 2024]. https://data.unicef.org/topic/nutrition/infant-and-young-child-feeding
Methodology:
Country level
This indicator is defined as breastfeeding with no other food or drink, not even water. Estimates are based on a recall of the previous day’s feeding to a cross-section of infants 0 to 5 months of age.
Breastfeeding by a wet nurse, feeding of expressed breastmilk and feeding of donor human milk all count as being fed breastmilk. Prescribed medicines, oral rehydration solution, vitamins and minerals are not counted as fluids or foods. However, herbal fluids and similar traditional medicines are counted as fluids, and infants who consume these are not exclusively breastfed.
Regional and global aggregates
For 2012, the regional and global exclusive breastfeeding estimates were generated using the most recent estimate available for each country between 2005 and 2012. Similarly, 2022 estimates were developed using the most recent estimate available for each country between 2016 and 2022. Global and regional estimates are calculated as weighted averages of the prevalence of exclusive breastfeeding in each country, using the total number of infants aged 0 to 5 months (defined as half of the population aged zero) from the 2022 revision of the World Population Prospects (2012 for the baseline and 2022 for the current) as weights.5 Estimates are presented in the cases where the available data represent at least 50 percent of corresponding regions’ total number of infants aged 0 to 5 months, unless otherwise noted.
Data sources: Data are collected through nationally representative household surveys such as DHS and MICS. The estimates are based on questions about liquid and food intake of children aged 0–23 months in the 24 hours preceding the survey.
Challenges and limitations: While a high proportion of countries collect data for exclusive breastfeeding, data are particularly lacking from high-income countries. The recommended periodicity of reporting on exclusive breastfeeding is every three to five years. However, for some countries, data are reported less frequently, meaning changes in feeding patterns are often not detected for several years after the change occurs.
Regional and global averages may be affected depending on which countries had data available for the periods considered in this report.
Using the previous day’s feeding as a basis may cause the proportion of exclusively breastfed infants to be overestimated, as some infants who may have been given other liquids or foods irregularly may not have received these on the day before the survey.
Recommended readings:
UNICEF. 2024. Infant and young child feeding. In: UNICEF. [Cited 24 July 2024]. https://data.unicef.org/topic/nutrition/infant-and-young-child-feeding
WHO. 2014. Comprehensive implementation plan on maternal, infant and young child nutrition. Geneva, Switzerland. https://www.who.int/publications/i/item/WHO-NMH-NHD-14.1
WHO. 2024. Nutrition Landscape Information System (NLIS) country profile indicators: interpretation guide. Second edition. Geneva, Switzerland. https://www.who.int/publications/i/item/9789241516952
WHO & UNICEF. 2021. Indicators for assessing infant and young child feeding practices: definitions and measurement methods. Geneva, Switzerland, and New York, USA. https://www.who.int/publications/i/item/9789240018389
Low birthweight
Definition: Low birthweight is defined as a weight at birth of less than 2 500 g.
How it is reported: This is the percentage of newborns weighing less than 2 500 g (less than 5.51 lbs) at birth. The estimates presented are from the 2023 edition of the UNICEF and WHO Joint low birthweight estimates. As the entire series of estimates is revised with every new edition, readers are advised to refrain from comparing series with prior editions.
Methodology:
Country level
Nationally representative low birthweight data, including survey and administrative data sources, were collated from 2000 to 2020 from 158 countries. Data quality criteria and adjustment methods were applied to develop the final set of country data to be included in the modelling exercise. Country data are reviewed prior to entry into the dataset for coverage and quality and adjusted to account for biases due to birthweight missingness and heaping. To be included, birthweights available from administrative data needed to cover at least 80 percent of the 2022 revision of the World Population Prospects5 estimated live births for that year. For national household surveys to be included in the dataset, they must have:
- a birthweight in the dataset for a minimum of 30 percent of the sample;
- a minimum of 200 birthweights in the dataset;
- no indication of severe data heaping or implausible distribution – this means that: i) ≤55 percent of all birthweights can fall on the three most frequent birthweights (i.e. if 3 000 g, 3 500 g and 2 500 g were the three most frequent birthweights, when added together, they would have to make up ≤55 percent of all birthweights in the dataset); ii) ≤10 percent of all birthweights are ≥4 500 g; and iii) ≤5 percent of birthweights fall on tail ends of <500 g or >5 000 g; and
- undergone an adjustment for missing birthweights and heaping.
Estimates of low birthweight prevalence at the national level were predicted from a Bayesian multilevel regression model. The model is fit on the logit (log-odds) scale to ensure that proportions are bounded between zero and one, and then back-transformed and multiplied by 100 to obtain prevalence estimates.
Hierarchical random country-specific intercepts (countries within regions within global) accounted for the correlation within and between regions. Penalized splines were used as temporal smoothing across the time series, meaning that country-level non-linear time trends were captured without random variation affecting the trend. The final covariates included in the model were: gross national income PPP per person,bo the prevalence of underweight among female adults, the adult female literacy rate, the modern contraception prevalence rate and the percentage of urban population.
Data quality categories were used to apply bias shifts and additional variance terms. These bias shifts were applied to administrative data from lower quality categories, which approximated the expected bias from heaping that was already accounted for in the survey adjustment. The additional variance was based on the data quality category of the administrative data, and the weighting between administrative and survey data if the country had both.
Standard diagnostic checks were done to assess for convergence and sampling efficiency. Cross-validation was implemented, averaging over 200 random splits of 20 percent test data, 80 percent training data. Sensitivity analyses were undertaken including checks on covariates, bias method, temporal smoothing, and non-informative priors. All models were fitted in R statistical software and the R packages “rjags” and “R2jags”.15, 16
The model included all 2040 country-years of data meeting the inclusion criteria and generated annual estimates from 2000 to 2020 with 95 percent credible intervals for the 195 countries and areas with either low birthweight input data or covariate data. Only estimates for countries and areas with data are reported. For the 37 (out of 195) countries with no data or data not meeting inclusion criteria, the final model was used to predict estimates of the prevalence of low birthweight based on country intercepts and time trends estimated from the region- and country-level covariates for all country years.
Regional and global aggregates
Regional and global aggregates are produced using all estimates from all 195 countries and areas weighted by estimated live births for that year from the 2022 revision of the World Population Prospects.5
Data sources: Nationally representative estimates of low birthweight prevalence can be derived from a range of sources, broadly defined as national administrative data or representative household surveys. National administrative data are those coming from national systems including civil registration and vital statistics systems, national health management information systems and birth registries. National household surveys such as DHS and MICS which contain information about birthweight as well as key related indicators including maternal perception of size at birth are also an important source of data on low birthweight, especially in contexts where birthweights are not recorded and/or data heaping is a problem.
Challenges and limitations: A major limitation of monitoring low birthweight globally is the lack of birthweight data for many of the world’s children. There is a notable bias, with children born to poorer, less educated, rural mothers and families being less likely to have a recorded birthweight when compared with their richer, urban counterparts with more highly educated mothers. Close to one out of three surveys containing birthweight data were not included, primarily due to missingness or poor data quality, and mostly from low-income countries in regions with a high risk of low birthweight.
As newborns with missing birthweights have risk factors for low birthweight, estimates that do not represent these children may be lower than the true value. Furthermore, poor data quality regarding excessive heaping on multiples of 500 g or 100 g exists in data from low- and middle-income countries which can further underestimate low birthweight. The methods applied in the current database to adjust for missing birthweights and heaping in survey estimates are meant to address this problem. A limitation of current methods is that individual-level data are not available for administrative data, and these data cannot be directly adjusted to remove bias from heaping and missingness.
The geographical groupings used in the modelling may not be appropriate for epidemiological or economic regional outliers. In all, the estimates for 37 (out of 195) countries without input data may have been affected. In addition, the confidence limits of the regional and global estimates may be artificially small given that about half of the modelled countries had a country-specific effect generated at random for each bootstrap prediction, some of which were positive and others negative, making the relative uncertainty at the regional and global levels less than that at the country level.
Recommended readings:
Blanc, A. & Wardlaw, T. 2005. Monitoring low birth weight: An evaluation of international estimates and an updated estimation procedure. Bulletin World Health Organization, 83(3): 178–185. https://www.ncbi.nlm.nih.gov/pmc/articles/PMC2624216
Chang, K.T., Carter, E.D., Mullany, L.C., Khatry, S.K., Cousens, S., An, X., Krasevec, J. et al. 2022. Validation of MINORMIX approach for estimation of low birthweight prevalence using a rural Nepal dataset. The Journal of Nutrition, 152(3): 872–879. https://doi.org/10.1093/jn/nxab417
Okwaraji, Y.B., Krasevec, J., Bradley, E., Conkle, J., Stevens, G.A., Gatica-Domínguez, G., Ohuma, E.O. et al. 2024. National, regional, and global estimates of low birthweight in 2020, with trends from 2000: a systematic analysis. The Lancet, 403(10431): 1071–1080. https://doi.org/10.1016/S0140-6736(23)01198-4
UNICEF & WHO. 2023. Low birthweight. In: UNICEF. [Cited 24 July 2024]. https://data.unicef.org/topic/nutrition/low-birthweight
UNICEF & WHO. 2023. Joint low birthweight estimates. In: WHO. [Cited 24 July 2024]. https://www.who.int/teams/nutrition-and-food-safety/monitoring-nutritional-status-and-food-safety-and-events/joint-low-birthweight-estimates
Adult obesity
Definition: Body mass index ≥30.0 kg/m2. The BMI is the weight-to-height ratio commonly used to classify the nutritional status of adults. It is calculated as the body weight in kilograms divided by the square of the body height in metres (kg/m2). Obesity includes individuals with BMI equal to or higher than 30 kg/m2.
How it is reported: Percentage of the population over 18 years of age with BMI ≥30.0 kg/m2 weighted by sex and standardized by age. The estimates presented are based on WHO. 2024. Global Health Observatory (GHO) data repository: Prevalence of obesity among adults, BMI ≥ 30, age-standardized. Estimates by country. [Accessed on 24 July 2024]. https://www.who.int/data/gho/data/indicators/indicator-details/GHO/prevalence-of-obesity-among-adults-bmi--30-(age-standardized-estimate)-(-). Licence: CC-BY-4.0.
The entire series of estimates is revised with every new update. Readers are advised to refrain from comparing the current series with prior updates.
Methodology:
Country level
A Bayesian hierarchical regression model, fitted using a Markov Chain Monte Carlo (MCMC) sample, with inference made using posterior MCMC samples, was applied to estimate the trends in the prevalence of different BMI categories by sex, age, country and year from 1990 to 2022. Countries were organized into 20 regions and 8 super regions, primarily based on geography and national income. The model had a hierarchical structure in which estimates for each country and year were informed by its own data, if available, and by data from other years within the same country and from other countries, especially those in the same region and super-region with data for similar time periods. The model included non-linear time trends through a combination of linear and second-order random walk terms, all modelled hierarchically. The age association of BMI was modelled using a cubic spline to allow for non-linear age patterns, which might vary across countries. The coefficients of the splines were modelled hierarchically and were allowed to vary over time to reflect the changing age associations. Age standardization was performed by taking the weighted means of age-sex-specific estimates, using age weights from the WHO standard population.17
Regional and global aggregates
Global and regional prevalence estimates are calculated as population-weighted averages of the constituent countries.
Data sources: Population-based studies with measurements of height and weight such as nationally representative household surveys constitute most of the data sources for monitoring adult obesity.
Challenges and limitations: Body mass index is an imperfect measure of the extent and distribution of body fat, but is widely available in population-based surveys, and is used in clinical practice; it is also correlated with the more complex and costly dual-energy x-ray absorptiometry.
Some countries had few data sources and three countries had no data source. Estimates for these countries were informed to a larger degree by data from other countries through geographical hierarchy.
There were also differences in data availability by age group, with fewer data available for older adults (≥65 years), which increased the uncertainty of estimates for that age group.
Recommended readings:
Ahmad, O.B., Boschi-Pinto, C., Lopez, A.D., Murray, C.J., Lozano, R. & Inoue, M. 2001. Age standardization of rates: A new WHO standard. GPE Discussion Paper Series 31. Geneva, Switzerland, WHO. https://cdn.who.int/media/docs/default-source/gho-documents/global-health-estimates/gpe_discussion_paper_series_paper31_2001_age_standardization_rates.pdf
NCD-RisC (NCD Risk Factor Collaboration). 2024. Worldwide trends in underweight and obesity from 1990 to 2022: a pooled analysis of 3663 population-representative studies with 222 million children, adolescents, and adults. The Lancet, 403(10431): 1027–1050. https://doi.org/10.1016/S0140-6736(23)02750-2
Sixty-Sixth World Health Assembly. 2013. Follow-up to the Political Declaration of the High-level Meeting of the General Assembly on the Prevention and Control of Non-communicable Diseases. https://apps.who.int/gb/ebwha/pdf_files/WHA66/A66_R10-en.pdf?ua=1
WHO. 2022. Updated Appendix 3 of the WHO Global NCD Action Plan 2013-2030. Technical Annex (version dated 26 December 2022). Geneva, Switzerland. https://cdn.who.int/media/docs/default-source/ncds/mnd/2022-app3-technical-annex-v26jan2023.pdf?sfvrsn=62581aa3_5
WHO. 2024. Noncommunicable Diseases Data Portal. In: WHO. [Cited 8 April 2024]. https://ncdportal.org
WHO. 2024. Nutrition Landscape Information System (NLIS) country profile indicators: interpretation guide. Second edition. Geneva, Switzerland. https://www.who.int/publications/i/item/9789241516952
WHO. 2024. Global Health Observatory (GHO) data repository: Prevalence of obesity among adults, BMI ≥ 30, age-standardized. Estimates by country. [Accessed on 24 July 2024]. https://www.who.int/data/gho/data/indicators/indicator-details/GHO/prevalence-of-obesity-among-adults-bmi--30-(age-standardized-estimate)-(-). Licence: CC-BY-4.0.
Anaemia in women aged 15 to 49 years
Definition: Percentage of women aged 15 to 49 years with a haemoglobin concentration of less than 120 g/L for non-pregnant women and lactating women, and less than 110 g/L for pregnant women, adjusted for altitude and smoking.
How it is reported: Percentage of women aged 15 to 49 years with a haemoglobin concentration below 110 g/L for pregnant women and below 120 g/L for non-pregnant women. The estimates presented are based on WHO. 2021. WHO global anaemia estimates, 2021 edition. In: WHO. [Cited 24 July 2024]. https://www.who.int/data/gho/data/themes/topics/anaemia_in_women_and_children. The entire series of estimates is revised with every new edition. Readers are advised to refrain from comparing the current series with prior editions.
Methodology:
Country level
The 2021 edition of anaemia estimates in women aged 15 to 49 years, by pregnancy status, included data sources from the Micronutrients Database, part of the WHO Vitamin and Mineral Nutrition Information System (VMNIS) and from anonymized individual-level data which span from 1995 to 2019. Adjustments of data on blood haemoglobin concentrations for altitude were carried out when relevant (i.e. the country has a high-altitude population) and adjustments for smoking done when feasible. Biologically implausible haemoglobin values (<25 g/L or >200 g/L) were excluded.
A Bayesian hierarchical mixture model was used to estimate haemoglobin distributions and systematically address missing data, non-linear time trends, and representativeness of data sources. Briefly, the model calculated estimates for each country and year, informed by data derived from that same country and year where available, data from other years within the same country, and data from other countries during similar time periods, especially countries in the same region. The model borrows data, to a greater extent, when data are non-existent or weakly informative, and to a lesser extent for data-rich countries and regions. The resulting estimates are also informed by covariates that help predict blood haemoglobin concentrations (e.g. sociodemographic index, meat supply [kcal/capita], mean BMI for women, and log of under-five mortality for children). The uncertainty ranges (credibility intervals) reflect the major sources of uncertainty, including sampling error, non-sampling error due to issues in sample design/measurement, and uncertainty from making estimates for countries and years without data.
Regional and global aggregates
Global and regional prevalence estimates are calculated as population-weighted averages of the constituent countries.
Data sources: The preferable data source is population-based surveys. Data from surveillance systems may be used under some circumstances, but recorded diagnoses are typically underestimated. The Micronutrients Database of the WHO VMNIS compiles and summarizes data on the micronutrient status of populations from various other sources, including data collected from the scientific literature and through collaborators, including WHO regional and country offices, United Nations organizations, ministries of health, research and academic institutions, and non-governmental organizations. In addition, anonymized individual-level data are obtained from multicountry surveys, including DHS, Malaria Indicator Surveys and Reproductive Health Surveys.
Challenges and limitations: Despite a high proportion of countries having nationally representative survey data for anaemia, there is still a lack of reporting on this indicator, especially in high-income countries. As a result, the estimates may not fully capture the variation across countries and regions, thus tending to “shrink” towards global means when data are sparse.
Recommended readings:
Stevens, G.A., Paciorek, C.J., Flores-Urrutia, M.C., Borghi, E., Namaste, S., Wirth, J.P., Suchdev, P.S., Ezzati, M., Rohner, F., Flaxman, S.R. & Rogers, L.M. 2022. National, regional, and global estimates of anaemia by severity in women and children for 2000–19: a pooled analysis of population-representative data. The Lancet Global Health, 10(5): e627–e639. https://doi.org/10.1016/S2214-109X(22)00084-5
WHO. 2011. Haemoglobin concentrations for the diagnosis of anaemia and assessment of severity. Vitamin and Mineral Nutrition Information System. Geneva, Switzerland. https://apps.who.int/iris/bitstream/handle/10665/85839/WHO_NMH_NHD_MNM_11.1_eng.pdf
WHO. 2014. Comprehensive Implementation Plan on Maternal, Infant and Young Child Nutrition. Geneva, Switzerland. https://www.who.int/publications/i/item/WHO-NMH-NHD-14.1
WHO. 2021. WHO global anaemia estimates, 2021 edition. In: WHO. [Cited 24 July 2024]. https://www.who.int/data/gho/data/themes/topics/anaemia_in_women_and_children
WHO. 2021. Vitamin and Mineral Nutrition Information System (VMNIS). In: WHO. [Cited 20 April 2023]. https://www.who.int/teams/nutrition-and-food-safety/databases/vitamin-and-mineral-nutrition-information-system
WHO. 2024. Nutrition Landscape Information System (NLIS) Country Profile. In: WHO. [Cited 20 April 2023]. https://www.who.int/data/nutrition/nlis/country-profile
WHO. 2024. Nutrition Data Portal. In: WHO. [Cited 6 April 2024]. https://platform.who.int/nutrition/nutrition-portals


